shale gas opportunities and challenges
TRANSCRIPT

Shale Gas Opportunities and Challenges*
R. Marc Bustin1, A. Bustin1, D. Ross, G. Chalmers, V. Murthy, C. Laxmi, and X. Cui
Search and Discovery Articles #40382 (2009)
Posted February 20, 2009 *Adapted from oral presentation at AAPG Annual Convention, San Antonio, Texas, April 20-23, 2008
1University of British Columbia
Synopsis Shale gas is defined as a fine-grained reservoir in which gas is self-sourced, and some of the gas is stored in the sorbed state. Sorbed gas is predominantly stored in the organic fraction– so organics are present. Shale gas is not just ‘shale’. Productive gas shales range from organic-rich, fine-grained rocks, such as the Antrim or Ohio Shale, to variable facies rocks, such as Lewis Shale. Pore size in fine-grained rocks is really small; pore size distribution is variable; porosity, which is variable (order of magnitude variation), reflects mineralogy and fabric. Maturity and TOC effect Thermal maturation structurally transforms organic fraction, creating more microporosity, hence potential adsorption sites Slope of line showing absorbed gas capacity vs. TOC is proportional to maturity/kerogen type. General Observations
• porosity decreases with diagenesis and effective stress
• quartz maybe positive (biogenic) or negatively (detrital) correlated with TOC - more siliceous and silicified shales are more brittle than clay, organic or carbonate rich shales and have greater propensity to be fractured and to be fraced - (greater Young’s modulus and lower Poisson’s Ratio) - BUT TOO SILICOUS = NO K or Porosity
Copyright © AAPG. Serial rights given by author. For all other rights contact author directly.

CRITICAL TO DEFINE MECHANICAL STRATIGRAPHY Background—learnings to date thick sequences of shale with variable amounts of gas exist in many/most basins shales are extremely heterogeneous in their properties but at a scale not generally considered early views that organic geochemistry is “the” screen for prospectively is proving incorrect evaluating gas in place and testing productivity by drilling and fracing is expensive- clear need for exploration/development model main risk is reservoir access- and mechanical stratigraphy Challenges
• screening exploration targets • determining intervals to frac or drill horizontals • predicting production rates • predicting decline rates • predicting EURs • determining drainage areas (spacing units) in thick intervals of shale
Unknowns after 7500 wells
• what is the OGIP • what is optimum interval to perf? • what is the optimum frac design and number of stages and/or horizontal length? • what is the drainage area/volume of our wells? • what is the recovery factor? • and what is the optimum spacing unit?
We do not understand these very complex rocks

• gas shale producers have no confidence in their OGIP calculations or do not believe them at all -some numbers are ridiculously high or low -desorption numbers commonly exceed adsorption numbers -production data does not match OGIP -micro seismic shows what fracs not what produces Pore Structure Analyses
• Microporosity: – CO2 low pressure isotherm analysis (D-R method)
• Meso-macroporosity:
– N2 low pressure isotherm analysis (BET theory) – Hg porosimetry
• Open Porosity
– He pycnometry – Hg immersion
Implications of Pore Size Distribution- Sorbed Gas
• GIP- many companies measure using canister desorption as for CBM • Desorbed gas is considered to be gas that was in the adsorbed state in the reservoir– but is it?
Remember OGIP = Free Gas + Adsorbed Gas+ Solution Gas What does it mean
• if it’s assumed that desorbed gas = adsorbed gas • free gas obtained from Sw and Porosity
total gas = desorbed + ø×(1-Sw) + solution

total gas is over estimated (i.e. double dipping the free gas) Quantifying porosity and Sw
• well logs yield poor data in argillaceous strata- need lab measurements to calibrate logs • commercial lab measures grain and/or skeletal density with He and Hg bulk density with Hg- after drying the sample • sorbed gas occupies space • what about pore compressibility
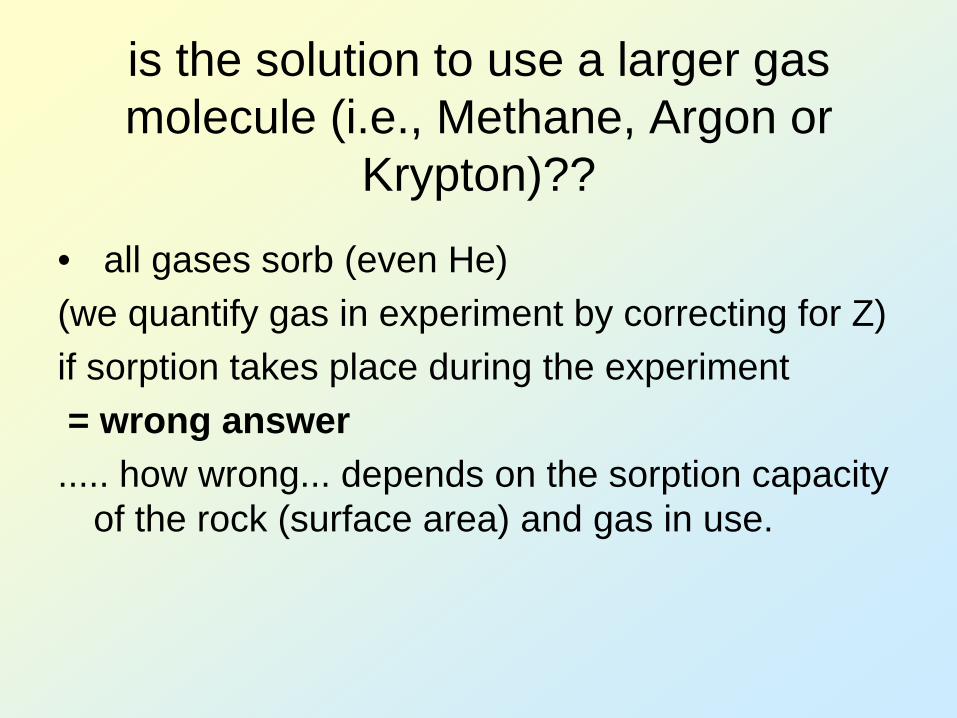
is the solution to use a larger gas molecule (i.e. Methane, Argon or Krypton)??
• all gases sorb (even He) (we quantifying gas in experiment by correcting for Z) if sorption takes place during the experiment = wrong answer ..... how wrong... depends on the sorption capacity of the rock (surface area) and gas in use. And Hence
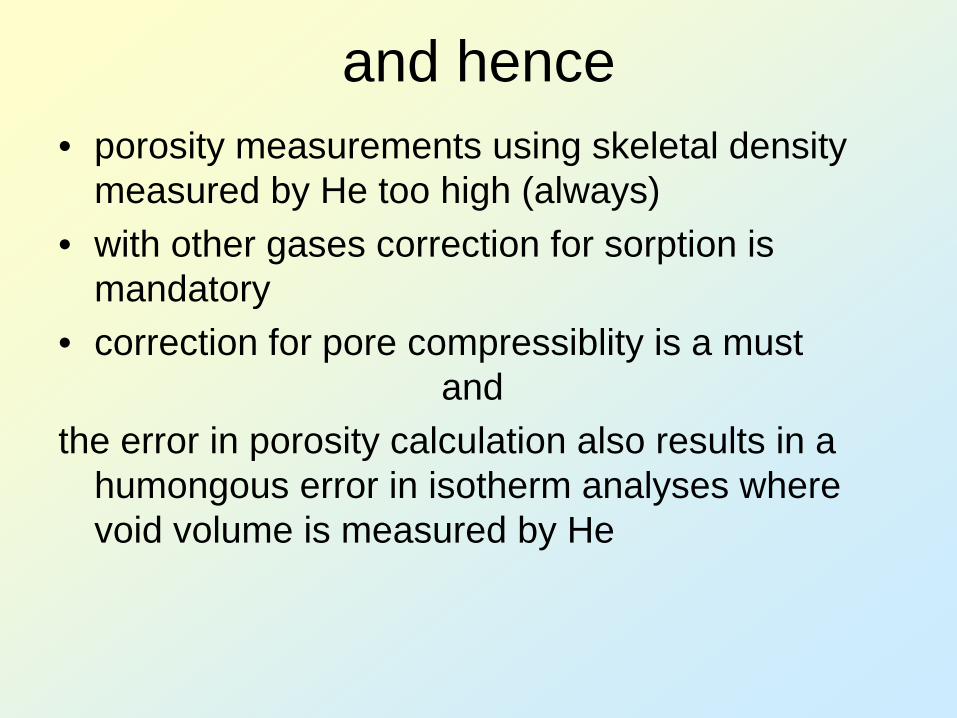
• porosity measurements using skeletal density measured by He too high (always) • with other gases correction for sorption is mandatory • correction for pore compressibility is a must and the error in porosity calculation also results in a humongous error in isotherm
analyses where void volume is measured by He The ability of gas to be produced from shales decreases markedly with increase in effective stress and hence depth (Kvert <<< Khorz). Based on a series of diffusion/flow experiments under triaxial (reservoir) conditions, we show that gas released from the matrix is strongly stress dependent and occurs at rates that in many shale reservoirs with wide fracture spacing is production-limiting.

CBM Solut ons
Shale Gas Opportunities and Challenges
R. Marc BustinA. Bustin, D. Ross, G.Chalmers,
V. Murthy, Laxmi, C., Cui. X.

Definition: Gas Shale• Shale gas is defined as a fine-grained reservoir
in which gas is self sourced and some of the gas is stored in the sorbed state
• Sorbed gas is predominantly stored in the organic fraction– so organics present
• Not just ‘shale’ Bustin, 2005, AAPG
BackgroundProduced
HighQuality
Medium Quality
Low Quality
Tight Gas SandsCBM Gas Shale
Low Btu Gas Hydrates / Other
1000 md
100 md
1 md
0.00001 md
technology price

outline
• what’s happening• what we think we know • what we don’t know some of which we
may think we know• what we need to know

Background

Background
7500 prod. Wells
≈ 1 TCF/year

Background

Background
750 Fayetteville wells
400 Woodford wells

Background
Sedimentary Basins and Major Shale Sequences of Canada
modified form Hamblin, 2006

Background
Sedimentary Basins and Major Shale Sequences of Canada
modified form Hamblin, 2006
EOG (6 TCF)Apache (9-16 TCF)
FOREST- UTICA SHALE- 4.1 TCF

what we know- gas shales
• productive gas shales range from organic-rich, fine-grained rocks ,such as the Antrim or Ohio Shale to variable facies rocks, such as Lewis Shale
Background

Ohio
SOME EXAMPLES
Lewis
Antrim
Barnett
Background
New Albany

CBM Solut ons0 20 40 60 80 1400
1500
3000
4500
Temperature ºC
Pressure and Temperature Space of Some Producing Gas Shales
Barnett
LewisOhio
New AlbanyAntrim
Pre
ssur
e (P
SIA
)
Background
WoodfordCaneyFayettevilleUtica
Marcellus
Muskwa

1.6Lewis
Background
Maturity and Organic Matter Content
Antrim
New Albany
Ohio
Barnett
BIOGENIC GAS
OIL WINDOWR om
ax(%
)
0
0.4
0.8
1.2
TOC (%)0 4 8 12 16 20 24
THERMOGENIC GASWoodfordCaneyFayetteville
Muskwa
Utica
Marcellus

Carbonate-Rich
SiO2 = 60.7 %Al2O3 = 16.9 %CaO = 1.69 %
Porosity = 6.4 %
SiO2 = 7.9 %Al2O3 = 1.7 %CaO = 47.9 %
Porosity = 0.7 %
SiO2 = 5.5 %Al2O3 = 1.7 %CaO = 44.5 %
Porosity = 1.42 %
SiO2 = 30 %Al2O3 = 3.0 %CaO = 20 %
Porosity = 0.35 %

Clays and Total Porosity
Devonian

SiO2 = 80 %Al2O3 = 7 %TOC = 2.2 wt%Av Ø = 1.07 %
SiO2 = 73 %Al2O3 = 11.2 %TOC = 2.8 wt%Av Ø = 2.61 %
SiO2 = 57.1 %Al2O3 = 19.5 %TOC = 3.32 wt%Av Ø = 6.55 %
Decreasing SiO2and
increasing Al2O3
Biogenic Silica and Porosity

SiO2 = 80 %Al2O3 = 7 %TOC = 2.2 wt%Av Ø = 1.07 %
SiO2 = 73 %Al2O3 = 11.2 %TOC = 2.8 wt%Av Ø = 2.61 %
SiO2 = 57.1 %Al2O3 = 19.5 %TOC = 3.32 wt%Av Ø = 6.55 %
Decreasing SiO2and
increasing Al2O3
Silica and Porosity
conclusion- pore size in fine-grained rocks is really small,Pore-size distribution is variable
porosity is variable (order of magnitude variation)reflects mineralogy and fabric

0
4
8
12
16
10 20 30 40 50 60 700Quartz %
TOC
%
• Biogenic Si source from radiolarians
Barnett
• Detrital Si source
0
1
2
3
4
5
6
7
8
0 20 40 60 80 100
Quartz (wt%)
TOC
(%)
MUSKWA
0
2
4
6
8
10
12
0 20 40 60 80 100
Quartz (Wt.%)
TO
C %
Moosebar
DETRITAL VS BIOGENIC QUARTZ

Maturity and TOC Effect
Thermal maturation structurally transforms
organic fraction, creating more microporosity, hence potential adsorption sites
slope is proportional to maturity/kerogen type
Gas in Place- adsorption

complexities and predictions
ANTRIM SHALE LEWIS SHALEOHIO SHALE
Tight SSTrue Shale

Failure mode- E and ν vary with mineralogy and fabric f(sedimentology,
provenance, diagenesis, tectonics)
RESERVOIR ACCESS: Ability to Fracor potential to be naturally fractured
Stress-Strain Curves
0
3000
6000
9000
12000
15000
-0.02 -0.01 0.00 0.01 0.02 0.03
Diffe
rent
ial S
tress
(psi
)
Axial StrainRadial Strain
stress-strain curve
radial strain axial strain
diffe
rent
ial s
tres
s ν
E
deliverability
E

Stress-Strain Curves
0
3000
6000
9000
12000
15000
-0.02 -0.01 0.00 0.01 0.02 0.03
Diffe
rent
ial S
tress
(psi
)
Axial StrainRadial Strain
stress-strain curve
radial strain axial strain
diffe
rent
ial s
tres
s ν
E
deliverability
Ability to Fracor to be naturally fractured
Failure mode- E and ν vary with mineralogy and fabric f(sedimentology,
provenance, diagenesis, tectonics)
E

Fabric ImplicationsWoodford Shale – gas does not bleedout of the matrix uniformly despite the macroscopic homogeneity
1 cm
deliverability
SEM

Transmission Electron Microscope
50 000 nm
200 000 nm
SEM
Light
CBM Solut ons
Shales are heterogeneous rocks
HandSpec.
Background
outcrop

porosity %
clay
%
porosity %
carb
onat
e %
porosity %bi
ogen
ic q
tz.%
porosity %
detri
tal q
tz.%
general observations
• porosity decreases with diagenesis and effective stress
• quartz may be positively (biogenic) or negatively (detrital) correlated with TOC

Poisson’s Ratio
Young’s Modulus
%
degr
ee
more siliceous and silicified shales are more brittlethan clay, organic- or carbonate-rich shales and have greater propensity
to be fractured and to be fraced(greater Young’s modulus and lower Poisson’s Ratio)
BUT TOO SILICOUS = NO K or Porosity
CRITICAL TO DEFINE MECHANICAL STRATIGRAPHY
contrast in fabric ofbiogenic vsdetrital qtz-rich shales
Poisson’s Ratio
Young’s Modulusdeliverability

Matrixporosity
MatrixPerm.
Maturity In Situ Stress Pressure E ν
PROSPECT WINDOW
Dep
th\D
iage
nesi
sRock Mechanics
summary

Matrixporosity
MatrixPerm.
Maturity In Situ Stress Pressure E ν
PROSPECT WINDOW
Dep
th\D
iage
nesi
sRock Mechanics
summary
Matrixporosity
MatrixPerm.
TotalGas
Dep
th\D
iage
nesi
s
optimum zonetrade off betweenmany variables and will be shale specific
FreeSorbed
Res. Access/Deliverability
GIP

background- learnings to datethick sequences of shale with variable amounts of gas exist in
many/most basins
shales are extremely heterogeneous in their properties but at a scale not generally considered
early views that organic geochemistry is “the” screen for prospectively is proving incorrect
evaluating gas in place and testing productivity by drilling and fracing is expensive- clear need for exploration/development model
main risk is reservoir access- and mechanical stratigraphy
CBM Solut onsBackground

the challenges
• screening exploration targets• determining intervals to frac or drill horizontals• predicting production rates• predicting decline rates• predicting EURs• determining drainage areas (spacing units)
challenges

BEND
BEND
Barnett
CaneyWoodford
challenges

in thick intervals of shale...
Unknowns after 7500 wells• what is the OGIP• what is optimum interval to perf? • what is the optimum frac design and
number of stages and/or horizontal length?
• what is the drainage area/volume of our wells?
• what is the recovery factor?• and what is the optimum spacing unit?
6400
6500
6600
6700
BA
RN
ETT
SH
ALE
challenges

Shale
Mapping TOC
ThicknessTOC
Geochemistry
Gas CapacitiesAdsorbed Gas
Free Gas Solution Gas
Producibility
Moisture
Maturity
Al2O3 fraction
Fracturing
Temperature
Pressure
Area
PorositySedimentology
Diagenesis Silica contentsCoarser horizons
Gas Shale Model
CaO
Permeability
Wireline logs
rosschallenges
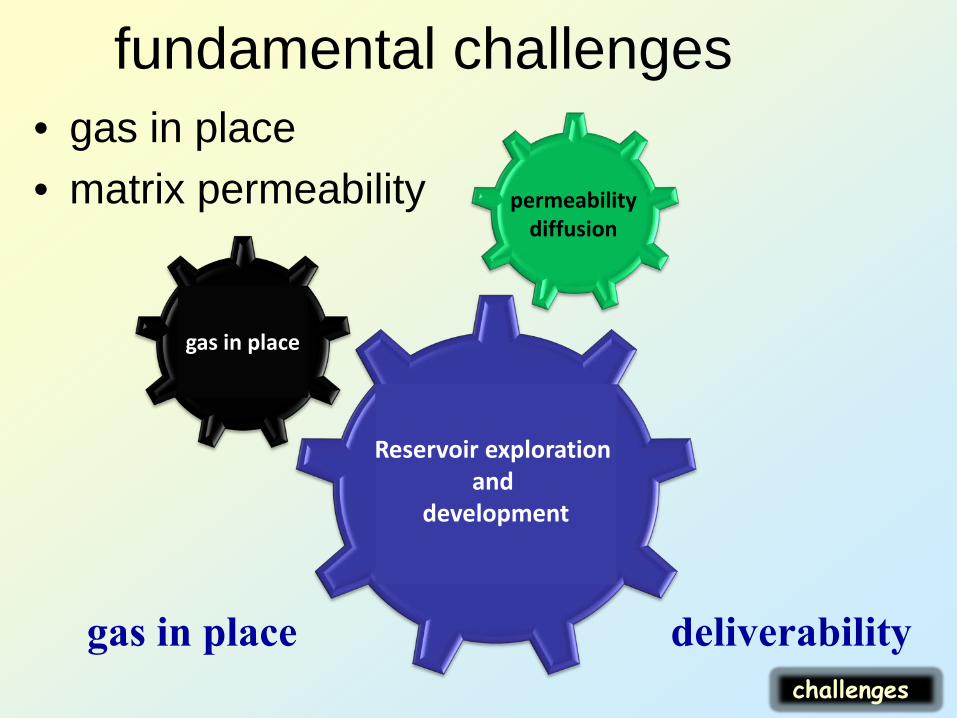
permeabilitydiffusion
Reservoir exploration and
development
gas in place
gas in place deliverabilitychallenges
fundamental challenges• gas in place• matrix permeability

the emperor has no clothes!
• gas shale producers have no confidence in their OGIP calculations, or they do not believe them at all
-some numbers are ridiculously high or low-desorption numbers commonly exceed adsorption
numbers-production data does not match OGIP-micro seismic shows what fracs notwhat produces
we do not understand these very complex rocks


Sandstone averagepore diameter ~ 1 mm
Organic Matter pore diameter ~ .5 to 100 nm
300 mhow small are pores gas shales– real small
Gas in Place- adsorption
CBM Solut ons
CBM Solut ons0.38 nm

sorption
05
1015202530354045505560657075
0 250 500 750 1000 1250Sample Cell Equilibrium Pressure (PSIA)
Met
hane
Ads
orbe
d (S
CF/
TON
)
PPPVPV
L
L
+=)(
Free Gas
Adsorbed Gas
Monolayer?
surface area increasesexponentially with decrease
in pore size
FESEM
pore
sorbedfree
Gas in Place- adsorptionReservoir Press. PSIA

Modified from Beliveau, 1993
“Normal” porosity
Methane molecule 0.38 nm
1 µm1 nm
pore
sorbedfree
The pore/organic system in fine-grained rocks
FESEM
pore diametre (m)
ratio
of f
ree/
adso
rbed
1
0.00001
0.0001
0.001
0.01
0.1
10
100
1000
10000
100000
1.0E-11
1.0E-10
1.0E-08
1.0E-07
1.0E-05
1.0E-04
1.0E-03
1.0E-02
Gas in Place- Porosity

Radiation PenetrationFluids
Micr
opor
osity Mes
opor
osity
Mac
ropo
rosit
yµm nm
0.1
1.0
2
10
50100
1000
10 000
100 000100
10
1.0op
tical
mic
ro,
scan
ning
ele
ctro
n m
icro
.
tran
smis
sion
ele
ctro
n m
icro
.
SA
XS/S
AN
S
mer
cury
por
osim
etry
Nitr
ogen
Car
bon
Dio
x.
Heliu
m p
ycno
men
try/m
ercu
ry d
ensi
ty
How you investigate microporosity determines the results
Gas in Place- Porosity

• Microporosity:– CO2 low pressure
isotherm analysis (D-R method)
• Meso-macroporosity:– N2 low pressure isotherm
analysis (BET theory) – Hg porosimetry
• Open Porosity– He pycnometry – Hg immersion
Pore Structure Analyses?

• Microporosity:– CO2 low pressure
isotherm analysis (D-R method)
• Meso-macroporosity:– N2 low pressure isotherm
analysis (BET theory) – Hg porosimetry
• Open Porosity– He pycnometry – Hg immersion
Pore Structure Analyses?

Pore size Radius (nm)
110 100 1,000 10,0000.0000
0.0000
0.0005
0.0010
0.0015
0.0020
Incremental Intrusion vs Pore size
Pore Width (Å)100 500 1,000
0 x 10-6
0 x 10
-6
5 x 10⁻⁶
1.0 x 10 -5
BJH Adsorption dV/dw Pore VolumeFaas Correction
Equivalent Pore Width (Å)00 12 13 14 15 16
Pore
Volum
e(cm
³/g·Å
)
0.00000.0000
0.0005
0.0010
Dubinin-Astakhov Differential Pore Volume Plot (Exponent = 1.7078)
Woodford Shale4.92%
CBM Solut ons

Implications of Pore Size Distribution- Sorbed Gas
• GIP- many companies measure using canister desorption as for CBM
• Desorbed gas is considered to be gas that was in the adsorbed state in the reservoir–but is it?
OGIP = Free Gas + Adsorbed Gas+ Solution Gas
remember:

BARNETT EXAMPLE
Desorbed Gas Content from canisters> Sorbed Gas Capacity
0
20
40
60
80100
120
140
160
180
0 20 40 60 80 100 120 140 160 180
Sorption Capacity
Gas
Con
tent
the problemDesorption test indicates more gasthan sorpton capacity
Barnett- one of many examples

problem can be investigated in two ways• numerically• experimentally
numerical considerations: diffusion plus darcy flow of gas out of core
diffusion
mass flow
p+s
relative contribution of diffusion and darcy flow depends on K, P and other factorscu
m g
astime
pore gas sorbed gas
Desorption test indicate more gas

Barnett Composite
0
20
40
60
80
100
0 500 1000 1500 2000 2500 3000 3500
Sample Cell Equilibrium Pressure (PSIA)
Met
hane
ads
orbe
d (S
CF/to
n)
95ºC
50ºC
At high temperatures sorbed gas is not a major component of any gas shale

what does it mean• if is assumed that desorbed gas =
adsorbed gas• free gas obtained from Sw and Porosity
total gas = desorbed + ø×(1-Sw) + solution
total gas is overestimated (i.e., doubledipping the free gas)

Quantifying porosity and Sw • well logs yield poor data in argillaceous strata-
need lab measurements to calibrate logs• commercial lab measures grain and/or skeletal
density with He and Hg bulk density with Hg- afterdrying the sample
• sorbed gas occupies space• what about pore compressibility!
Φ= 1- (Vb/Vp)
HeHg
v= -
Hg

MoleculeCrtical
Diameter (nanometres)
Helium 0.2Carbon dioxide 0.28
Nitrogen 0.3Water 0.32
Methane 0.4
Ethane 0.44
HeCH4C2H4
He
CH4
pore access varies with kineticdiameter
Bustin and Ross, 2006

Variation in Density with Gas
2.20
2.30
2.40
2.50
2.60
2.70
2.80
Helium Argon Krypton Methane
GAS
Dens
ity c
c/g
Porosity of Devonian Shale toDifferent Gases
porosity varies with gas used to measure itand pore size distribution of shale
CH4
is the solution to use a larger gas molecule (i.e., Methane, Argon or
Krypton)??
• all gases sorb (even He)(we quantify gas in experiment by correcting for Z)if sorption takes place during the experiment= wrong answer..... how wrong... depends on the sorption capacity
of the rock (surface area) and gas in use.

change in effective porosity due to adsorption
2
3
)()1(101/
pppq
VxcRt
L
LL
std
ca +
−×=
βρφρφ
.
effective porosity due to gas sorpton
(modified from Cui and Bustin, in prep.)
if some gasis sorbed duringexperiment the = >∆P
and hence• porosity measurements using skeletal density
measured by He too high (always)• with other gases correction for sorption is
mandatory• correction for pore compressiblity is a must
andthe error in porosity calculation also results in a
humongous error in isotherm analyses where void volume is measured by He

Laboratory Permeability
-pulse decay on cores confined under reservoir conditionsBrace et al. (1968); Dicker, A.I., and R.M. Smits, 1988: Jones, S.C., 1997
-pulse decay on crushed samples (GRI, 1996; Egmann et al., 2005 )
-from ‘desorption rates’ (Cui and Bustin, in prep)
-from intrusion curves in Hg porosimetry (Swanson, 1981)

oil
jacketshale
experimental setup
deliverability
P
TimeTime
P

sm
maa KKKR
ρµφ
ακ ρ][
21
2 +=
saa KKRD
φφ
α][
21
2 +=
ρρ K
pppq
VK
L
LL
std
ca 2
3
)(101
+×
=(Cui and Bustin, in prep)

Cui and Bustin, in prep.
φ = porosityφa = effective porosity contributed by adsorption

Variation of k/Diffusion with Effective Stress
The ability of gas to be producedfrom shales decreases markedlywith increase in effective stressand hence depth. Kvert <<<Khorz
deliverability
Effective Confining Pressure (MPa)
Perm
eabi
lity
(md)
0 5 10 15 200.0x100
5.0x10⁻⁴
1.0x10⁻³
Effective Confining Pressure (MPa)
Perm
eabi
lity
(md)
0 5 10 15 200.0x100
2.0x10⁻¹
4.0x10⁻¹
Effective Confining Pressure (MPa)
Perm
eabi
lity
(md)
10 15 20 25 300.0x100
5.0x10⁻⁴
1.0x10⁻³

Laboratory Permeability-pulse decay on crushed samples (GRI, 1996; Egmann et al., 2005 )
-same issues as using core- must correct for sorption of gases-analyses performed under hydrostatic conditions (i.e., no consideration of pore compressibility)- pore compressibility is rock specific (fabric and mineralogy)
problems
advantages
easy/cheapreproduciblebut not the answer you want to put in your simulator
P
Time

CBM Solut ons
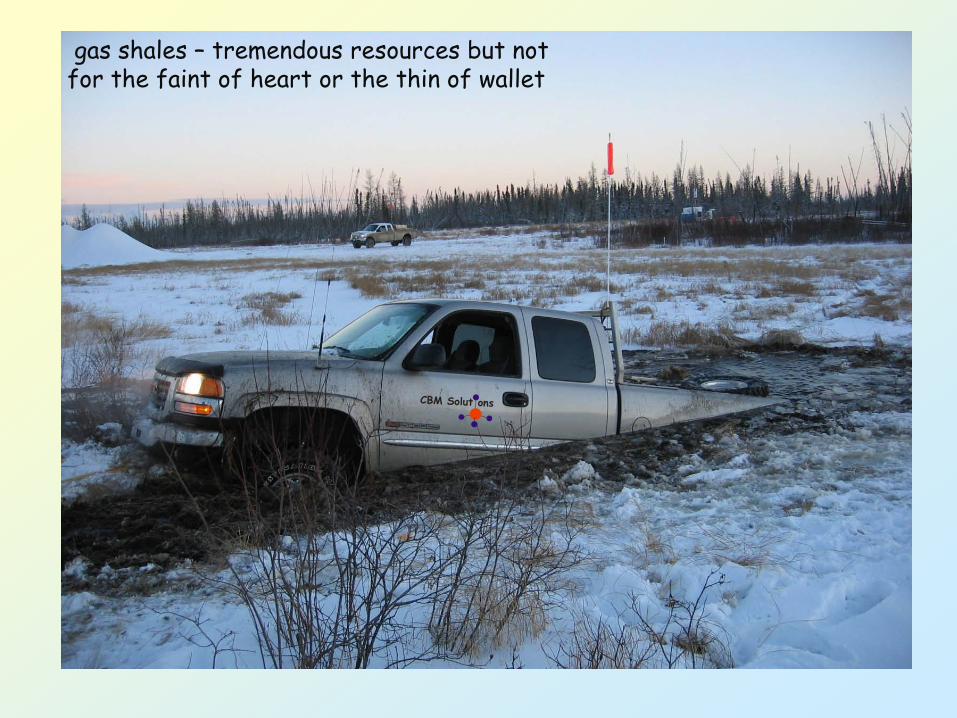
gas shales – tremendous resources but not for the faint of heart or the thin of wallet

Selected References
Beliveau, D., 1993, Honey, I shrunk the pores!, Journal of Canadian Petroleum Technology, v. 32/8, p. 15-17. Brace, W.F., J.B. Walsh, and W.T. Frangos, 1968, Permeability of granite under high pressure: Journal of Geophysical Research, v. 73/6, p. 2225-2236. Bustin, R.M., 2005, Comparative analyses of producing gas shales; rethinking methodologies of characterizing gas in place in gas shales: Bulletin West Texas Geological Society, v. 45/2, p. 9-10. Dicker, A.I., and R.M. Smits, 1988, A practical approach for determining permeability from laboratory pressure-pulse decay measurements: SPE International Meeting on Petroleum Engineering, 1-4 November 1988, Tianjin, China, SPE Paper 17578. Hamblin, A.P., 2006, The "shale gas" concept in Canada: a preliminary inventory of possibilities: Geological Survey of Canada, Open File Report 5384, 108 p. Ross, D.J., and R.M. Bustin, 2006, Sediment geochemistry of the lower Jurassic Gordondale member, Northeastern British Columbia: Bulletin of Canadian Petroleum Geology, v. 54/4, p. 337-365. Swanson, P.L., 2001, Subcritical crack propagation in westerly granite; an investigation into the double torsion method: International Journal of Rock Mechanics and Mining Sciences, v. 18/5, p. 445-449.