sgb functionality survey report 2015 · 2016-06-13 · mgcawu , francis baard 4 74 north west...
TRANSCRIPT
SGB FUNCTIONALITY
SURVEY
REPORT
2015

2
Table of Contents
1. BACKGROUND ............................................................................................................................ 3
2. AIM OF THE SURVEY ................................................................................................................ 3
3. LEGISLATIVE FRAMEWORK.................................................................................................... 4
3.2 South African Schools Act ........................................................................................................ 4
3.3 The National Education Policy ................................................................................................. 4
3.4 Sector plan .................................................................................................................................. 4
3.5 The National Strategy for Learner Attainment ...................................................................... 5
4. THE SGB FUNCTIONALITY TOOL .......................................................................................... 5
5. THE PROCESS OF ADMINISTERING THE SURVEY TOOL .............................................. 6
6. NUMBER OF SCHOOLS SURVEYED ..................................................................................... 7
7. ANALYSIS ..................................................................................................................................... 7
8. ANALYSIS PER AREA OF FOCUS .......................................................................................... 9
8.1 Policies Required by Schools ........................................................................................... 10
8.2 Meetings of the SGB .......................................................................................................... 11
8.3 Managing the Assets of the School ................................................................................. 12
8.4 Financial Management ...................................................................................................... 12
8.5 Curriculum Support and Planning .................................................................................... 14
9. COMPARISON BETWEEN THE 2014 AND 2015 SGB FUNCTIONALITY ...................... 15
10. GENERAL FINDINGS ........................................................................................................... 16
11. RECOMMENDATIONS ......................................................................................................... 17
12. CONCLUSION ........................................................................................................................ 17

3
A REPORT ON THE SCHOOL GOVERNING BODY FUNCTIONALITY TOOL
SURVEY
1. BACKGROUND
The Department conducted a survey in 2000 schools to assess the functionality
their school governance. The exercise was conducted through the use of an SGB
Functionality Tool that was administered at the selected schools and verified by
Circuit Managers. Each province was given quota of schools to survey.
The DBE, Provincial Education Departments and School Governing Body
Associations agreed on the contents and purpose of the SGB Functionality Tool.
The Tool was amended to include rating descriptors in each category in order to
guide the principals/SGBs and Circuit Managers in determining the extent of the
effectiveness of the governing body per pre-determined category.
2. AIM OF THE SURVEY
The DBE designed an SGB Functionality Tool that would assist in indicating the
effectiveness of school governance in the sector. In 2011 HEDCOM approved the
use of SGB Functionality Tool as a survey and support tool to collect data to
assess key processes in school governance. The tool was further intended to:
a) Assist governing bodies to collect data that would inform the fulfilling of
their roles and responsibilities of supporting teaching and learning in
schools;
b) Be used as a self-assessment tool to determine the functionality and
assess the capabilities of SGBs;
c) Assist District and Circuit Managers to determine the level at which
SGBs operated in order to support them effectively;
d) Determine training needs of SGBs; and
e) Evaluate the impact of the training provided by provinces and SGB
associations.

4
3. LEGISLATIVE FRAMEWORK
3.1 Annual Performance Plan
The Sector is expected to improve monitoring of school effectiveness and
accountability through individual performance and school governance. The
performance indicator for the 2015/16 financial year was for the Sector to
obtain at least 70% of SGBs that meet minimum criteria in terms of
effectiveness in 2000 sampled schools.
3.2 South African Schools Act
The South African Schools’ Act 84 of 1996 (the act) as amended, stipulates that
the governance of a school is vested in its School Governing Body (SGB).
Some of the key statutory obligations of the SGB as stipulated by the Act are
summarised as follows:
a) To determine that school policies are in place;
b) To ensure that official SGB meetings and regular communication with
stakeholders take place;
c) To maintain and improve the school buildings and the purchase of
resources and management assets of the school;
d) To ensure sound school financial management; and
e) To strategically plan and evaluate the school’s curriculum progress.
3.3 The National Education Policy
The National Education Policy Act 27 of 1996 requires the Department of Basic
Education to play an oversight role in monitoring and supporting Provincial
Education Departments’ activities.
3.4 Sector plan
Action Plan to 2019 requires of the sector to determine the percentage of
schools where the school governing body meets the minimum criteria in terms
of effectiveness. This is also reported on the Annual Performance Plan of the
DBE.
5
3.5 The National Strategy for Learner Attainment
The National Strategy for Learner Attainment (NSLA) requires provinces to
monitor the functionality of SGBs and give quarterly reports. The outcome of
the monitoring informs strategies to support SGBs and develop training
programmes that would meet the identified needs of SGBs.
4. THE SGB FUNCTIONALITY TOOL
The SGB Functionality Tool was designed for each school to rate itself and
comment on how it fulfils its roles and responsibilities in terms of the South
African Schools Act. In 2014 the tool was revised such that it could enable
Circuit Managers and the provincial officials to rate the functionality of a
school’s governance.
The SGB Functionality Tool was designed to cover the following five areas of
school governance:
a) Policies of the School;
b) Meetings of the SGB;
c) Assets of the School;
d) Financial Management; and
e) Planning and Reporting on Curriculum Matters.
Each area of focus has sub-questions totalling 44, rated between 0 (lowest
score score) to 3 (highest score). The number of sub-questions per area of
focus are summarised below as follows:
Table 1: Areas and the number of questions of the SGB Functionality Tool
AREA OF FOCUS NO. OF QUESTIONS
Policies of the School 11
Meetings of the SGB 6
Assets of the School 3
Financial Management 13
Planning and Reporting on Curriculum Matters 11
Total number of questions 44
Rating descriptors are provided for each question in order to guide the
surveyor to determine the actual rating based on available evidence and to
bring about uniformity in scoring across all provinces.

6
The maximum score obtainable is 132. The scores are categorised into groups
of 5 (five) to rate the performance of the SGB as indicated below:
Table 2: The overall scores of the SGB Functionality Tool
Name of the School: …………………. Rating by the
Principal/SGB
Rating by the
Circuit Manager
5 (100-132)..100% Works very well
4 (67-99)…75% Works
3 (53-66)…50% Almost works
2 (27-52)…40% Does not work
1 (0-26)….20% Needs Intervention
5. THE PROCESS OF ADMINISTERING THE SURVEY TOOL
Tools were administered in 49 of the 81 national education districts. Schools that
were sampled came from a wide range of districts covering urban, township and
rural schools. In total 2000 schools were sampled.
Only Limpopo failed to meet the required target of schools to be surveyed.
Officials were required, before administering the Tool to inform schools of the visit
in good time and its purpose. Officials were also expected to send the Tools to
schools in advance so that the school could make the required evidence available.
During the visit, the District/Provincial Official were expected to interview the
principal and the SGB chairperson (if available). For verification purposes, all
documents required by the Tool were expected to be made available to the
verifying official. The evidence presented was be scrutinised by the official and
feedback given to the school so that recommendations and remedial action could
be implemented.
If no evidence was available or procedures were not in place, principals were
requested to set targets in order to have the outstanding policy, procedures and
plans in place. These policies, procedures and plans were to be reflected in the
school’s improvement plans. Officials were lastly expected to schedule follow-up
monitoring and support visits based on data received through the Tool.

7
6. NUMBER OF SCHOOLS SURVEYED
The table below indicates the number of schools surveyed per province and
per the names of districts they come from.
Table 3: The number of surveyed schools per province
Province Districts Surveyed No of Districts
Tools received
Eastern Cape
Qumbu, Sterkspruit and Queenstown 4 179
Free Sate Fezile, Xhariep, Lejweleputswa, Motheo, Thabo Mofutsanyana
5
264
Gauteng Johannesburg East, Tshwane South, Johannesburg Central
5
370
KwaZulu-Natal
Uthungulu, Sisonke, Zululand, Ugu, Amajuba, Ilembe, Umzinyathi, Umlazi. Umkhanyakde, Umgungundlovu, Umkhanyakude, Pinetown.
12
408
Limpopo Riba Cross, Greater Sekhukhune, Vhembe, Tshipise-Sagole. 4 65
Mpumalanga Gert Sibande, Ehlanzeni, Bohlabela, Nkangala
4 199
Northern Cape
John Taolo Gaetsewe, Pixley-Ka-Seme, ZF Mgcawu , Francis Baard
4 74
North West Bojanala, Dr Ruth Mompati, N M Molema, Dr Kenneth Kaunda
4 304
Western Cape
Metro North, Metro South, Central, Eden Central Karoo, Winelands, Overberg, West Coast,
7 137
Total 49
2000
7. ANALYSIS
The performance of SGBs were categorised into 5 (Five) main areas on the basis
of obtained scores ranging from SGBs which were found not to be functional to
highly effective SGBs. Of the 2000 surveyed schools, the results indicated that:
15 SGBs (0.75%) were of grave concern;
81 SGBs (4.05%) did not work;
221SGBs (11.05%) almost worked;
806 SGBs (40.3%) worked;
877 SGBs (43.85%) worked well.

8
Table 4: The rating of schools according to scores
The Break-down of the ratings according to scores
Levels Rating Number of
schools/2000
Percentage Description
1 0-26 15 0.75% Need Intervention
2 26-52 81 4.05% Does not work
3 53-66 221 11.05% Almost Work
4 67-99 806 40.3% Work
5 100-132 877 43.85% Works very well
4 + 5 1683 84.15
Functional SGBs
The analysis shows that of the 2000 surveyed schools, 84.15% of the SGBs are
functioning well. This exceeds the set annual target of 70% for the 2015/16 by
14.10%. Non-effective SGBs represent about 4.80% of the surveyed schools
which indicates that the majority of SGBs are beginning to understand their roles
and responsibilities and are performing them as expected. The findings can be
graphically represented as follows:
Graph 1: The rating of schools according to scores
The following graph represents the combined performance of SGBs who are non-
functional (level 1 and 2), SGBs performing at an average level (level) 3 and the
combined level 4 and 5 of effective SGBs showing the different levels of
performance.

9
Graph 2: Different levels of performance
8. ANALYSIS PER AREA OF FOCUS
The survey covered 5 areas of SGB functionality with 44 sub-questions in total. The
number of questions per category is as follows:
Policies of the School (11)
Meetings of the SGB (6)
Assets of the School (3)
Financial Management (13)
Curriculum Planning and Reporting (11)
The general performance of SGBs in each category has been analysed showing
SGBs performing at an average level of 73%. The management of assets is the least
area of performance by SGBs as represented in the graphs below.
Graph 3: Areas of focus

10
Each area of focus is further analysed with its sub-questions as described below:
8.1 Policies Required by Schools
The policies which SGBs are expected to develop are:
The Constitution of the SGB;
Mission and Vision statements of the school;
Admission policy;
Language policy;
Religious policy;
Code of Conduct;
Finance policy;
Maintenance policy;
HIV and Aids policy;
Health and Safety policy; and
Recruitment policy.
The findings of the availability of the above mentioned policies and their utilisations
are represented in the graph below as follows:
Graph 4: Policies required by the SGBs
Generally SGBs have all the nine required school policies at 73% average. The least
available policy is the policy on recruitment and 42% availability. There are teachers
who are appointed and paid by SGBs together with state paid teachers who have to
be recommended by SGBs for appointment. This necessitates the development of
clear policies to ensure that the SGBs paid attention to the appointment of quality
teachers who can contribute to the successes of the school.

11
Religious policy scored the second lowest result at 72%. This indicates that about
28% of the schools do not have Religious policies. This may affect the attempts of
the sector to foster religious tolerance in our multi-cultural schools as it may limit the
freedom of religion for some learners.
8.2 Meetings of the SGB
SGBs are expected to hold various meetings in the performance of their
responsibilities. Some of the meetings are legislated while others are necessary for
the improvement of service delivery. Some of the important meetings to be convened
by the SGB are:
Executive Committee Meetings;
SGB Quarterly Meetings;
Parents Meetings;
Annual General meeting; Finance Committee Meetings; and
Disciplinary Committee Meetings.
The analysis of the convening of meetings by the SGBs is represented in the graph
below:
Graph 5: SGB Meetings
SGBs scored an average of 75% for meetings. The graph indicates that SGBs do
hold the required quarterly meetings together with parents meetings. Of major
concern is the 72% of Annual General Meetings (AGM). These are mandatory
meetings held around September of each year for SGBs to consult parents of school
fees matters. It is in AGM where SGBs seek budget approval by the majority of the
12
parents attending the meeting as prescribed by the South African schools Act. The
low rating for AGMs is an indication that parents are not consulted to approve the
budget and the raising of schools fees which is a violation of the Act.
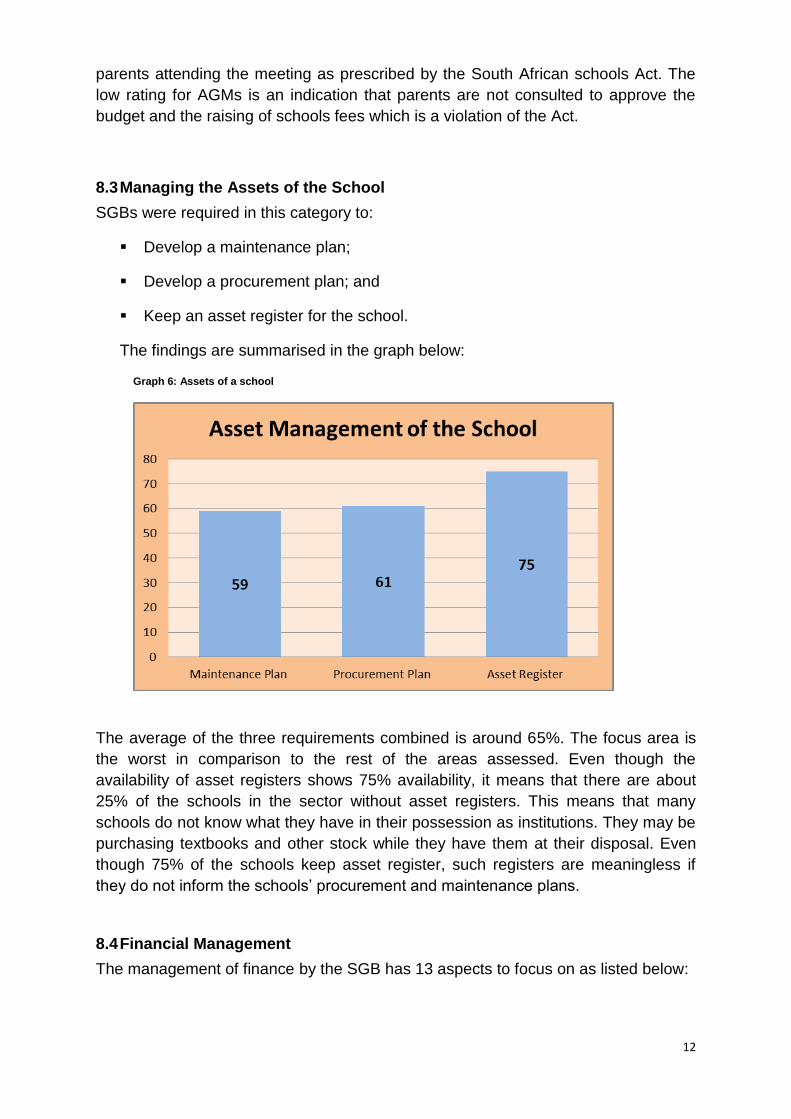
8.3 Managing the Assets of the School
SGBs were required in this category to:
Develop a maintenance plan;
Develop a procurement plan; and
Keep an asset register for the school.
The findings are summarised in the graph below:
Graph 6: Assets of a school
The average of the three requirements combined is around 65%. The focus area is
the worst in comparison to the rest of the areas assessed. Even though the
availability of asset registers shows 75% availability, it means that there are about
25% of the schools in the sector without asset registers. This means that many
schools do not know what they have in their possession as institutions. They may be
purchasing textbooks and other stock while they have them at their disposal. Even
though 75% of the schools keep asset register, such registers are meaningless if
they do not inform the schools’ procurement and maintenance plans.
8.4 Financial Management
The management of finance by the SGB has 13 aspects to focus on as listed below:

13
Exemption of school fees Cheque book
Signatories Bank statement
Monthly reconciliation Bank account
Petty cash Bank deposits
Invoices Audited financial statement
Receipt book Annual budget
Requisition form
The findings of each of the items in the 2000 surveyed schools are shown in the
graph below:
Graph 7: Financial Management

14
Most schools scored extremely well in this category. The majority of the expected
items were found to be available in school. Eight of the 13 items scored above 80%
while four were above 70%. Only 34% of the 2000 schools were found to have
records on the exemption of schools fees. It still has to be confirmed if the category
is not influenced by the high number of no fees schools where school fees
exemption is not necessary.
8.5 Curriculum Support and Planning
SGBs play an important role in the support of the principal and the teachers in the
provision of curriculum delivery. They participate in the development and approval of
strategies and provide funding for the achievement of such. To determine the
effectiveness of SGBs on curriculum development, SGBs were assessed on the
extent to which they participate and support the following key areas of curriculum
delivery:
Development of Annual Academic Report;
School Improvement Plan;
Key Subject Strategy;
Target Setting;
Textbook Procurement; and
Attracting good teachers.
Graph 8: Supportive role of SGBs in Curriculum delivery

15
SGBs are performing at the just above average level in the key areas of curriculum
delivery support. None of the 2000 schools had SGBs participating and supporting at
the level of 80% in any of the six identified areas. The average performance in
curriculum support is 72%. SGBs are particle involved in the procurement of
textbooks as they have to approve the payment therefore but are mainly excluded in
the finalisation and approval of the rest of the strategies to improve curriculum
delivery. This tends to impact negatively on the monitoring and oversight role that
SGBs have to play towards their schools. The notion that curriculum delivery is a
professional matter should be dispelled as SGBs have specific roles to play in the
support of curriculum delivery.
9. COMPARISON BETWEEN THE 2014 AND 2015 SGB FUNCTIONALITY
The performance of SGB per focus area as a block is the same in each year. The
2015 results showed a slight decline in four of the areas when compared with the
2014 performance. The decline was recorded in the area of policies (76 & 73%),
meetings (76 & 75), assets (66 & 65) and finance (80 & 81). There was no difference
recorded in curriculum delivery at 72%.
Graph 9: Comparing the Average rating of 2014 and 2015

16
There was a slight drop in the average scores from 74 to 73% average between the
2014 and 2015 survey. The slight drop may be ascribed to the fact that new SGBs
were elected in 2015. They had to undergo training before settling into their new
position and assumed responsibilities.
10. GENERAL FINDINGS
a) Out of the 2000 sampled schools, at least 1467 or 73.3% of schools were
visited by a circuit manager to administer the tool. This is an increase of
989 schools compared to the 2014/15 financial year where only 478
schools out of 2000 were verified by Circuit Managers. It is an increase of
206%.
b) The introduction of new SGBs in 2015 has affected the effectiveness of
SGBs as the ratings drop as compared to the 2014 ratings.
c) The increase in the verification process by Circuit Managers led to
improved quality of data received by the DBE. The comments by Circuit
Managers and the clear instructions given to schools have given an
assurance that the Tool is utilised correctly as the quality and monitoring by
Circuit Managers produces quality and credible assessment of the SGB
functionality.
d) The survey highlighted that there is a correlation between the functionality
of the SGB and the performance of learners in a school. The insignificant

17
drop in the overall NSC results for the class of 2015 as compared to that of
2014 was also reflected in the functionality of SGB.
e) Provinces will low NSC performance tend to inflate their SGB effectiveness
as compared to high performing provinces.
11. RECOMMENDATIONS
a) Provinces and districts should use the Tool to support more schools that
the allocated quota from the DBE;
b) Circuit Managers must play an effective role in assessing, monitoring and
supporting schools through the use of the functionality tool to determine
gabs and training needs;
c) The training of the SGBs should be based on the findings of the conducted
survey to avoid a one size fits all approach to training;
d) The total use of technology to enhance the functionality of SGBs must be
introduced.
12. CONCLUSION
It is pleasing to note the improved implementation of the SGB Functionality
Tool across all provinces. Many SGBs are becoming more compliant with
education legislation and are themselves developing policies that guide the
functioning of the schools they govern.
The 1% drop in the effectiveness of SGBs from the previous year and the drop
in the NSC results indicate a correlation between SGB functionality and school
performance. The fact that new SGBs were elected in 2015 can be a
contributing factor among other curriculum related factors.
The DBE together with all Provincial Education Departments will enhance the
use of the SGB effectiveness through:
a) The establishment of Provincial Consultative Forum where association
will meet regularly with provincial senior management to discuss
governance related matters as per HEDCOM decision;
b) The release of the HEDCOM approved Guidelines on how parents can
support their school going children;
18
c) The training of SGBs on the King iii principles;
d) The training of SGB on financial management in collaboration with
ABSA; and
e) The use of SASAMS to collect and interpret data on the functionality of
SGBs.