sex and science: how professor gender perpetuates … · sex and science: how professor gender...
TRANSCRIPT
SEX AND SCIENCE: HOW PROFESSOR GENDER
PERPETUATES THE GENDER GAP∗
Scott E. Carrell
Marianne E. Page
James E. West
October 22, 2009
Abstract
Why aren’t there more women in science? This paper begins to shed light on this question
by exploiting data from the U.S. Air Force Academy, where students are randomly assigned
to professors over a wide variety of mandatory standardized courses. We focus on the role of
professor gender. Our results suggest that while professor gender has little impact on male
students, it has a powerful effect on female students’ performance in math and science classes,
their likelihood of taking future math and science courses, and their likelihood of graduating
with a STEM degree. The estimates are largest for students whose SAT math scores are in
the top five percent of the national distribution. The gender gap in course grades and STEM
majors is eradicated when high performing female students are assigned to female professors in
mandatory introductory math and science coursework.
∗JEL Classifications: I20; Key Words: Gender Gap, Postsecondary Education, STEM
Thanks go to USAFA personnel: J. Putnam, D. Stockburger, R. Schreiner, K. Carson and P. Egleston for assistance
in obtaining the data for this project, and to Deb West for data entry. Thanks also go to Charlie Brown, Caroline
Hoxby, Deborah Niemeier, Kim Shauman, Douglas Staiger, Catherine Weinberger and seminar participants at the
NBER Higher Education Working Group, PPIC, SDSU, UC Davis, UC Irvine, UC Santa Barbara, UC Santa Cruz,
and University of Washington for their helpful comments and suggestions. The views expressed in this article are
those of the authors and do not necessarily reflect the official policy or position of the USAF, DoD, or the U.S.
Government.
1
“The inferior sex has got a new exterior. We got doctors, lawyers, politicians too...”
Lennox and Stewart (1985), Sisters are doing it for Themselves
1 Introduction
Why aren’t there more women in science? During the past forty years, women have successfully
entered many prestigious careers that were formerly dominated by men, and today the number
of graduate degrees in medicine, business and law are almost equally divided across the sexes. In
contrast, female college students are currently 37 percent less likely than males to obtain science
and engineering BA’s and females comprise only 25 percent of the science, technology, engineer-
ing and math (STEM) workforce(National Bureau of Economic Research, 2005; National Science
Foundation, 2006).1
What is the source of this discrepancy and why does it continue to exist when womens’ expansion
into other, traditionally male fields, has been so much more rapid? This question has spurred
hundreds of academic studies, widely publicized conferences, and government reports, but the
exact manner in which cognitive and behavioral differences intertwine with social forces to produce
differences in career outcomes remains a subject of spirited debate. Understanding how these
possible mechanisms work is important: social scientists have shown that gender differences in
entry into science careers explain a substantial portion of the gender pay differential among college
graduates (Brown and Corcoran, 1997; Weinberger, 1999) and that the low representation of women
in such careers may reduce aggregate productivity (Weinberger, 1998).
What we do know is that through 12th grade, the gender gap in math and science achievement
tests is very small.2 We also know that it has been declining over the past 20 years(Xie and
Shauman, 2003). The small differences in high school math and science achievement tests that do
exist are not predictive of men’s higher likelihood of choosing a STEM career or major in college
(Xie and Shauman, 2003). Conditional on proxies for ability, the gender gap in the probability
1Among young workers in STEM careers, the fraction who are women is higher. For example, among STEM
workers ages 30 − 39, 40 percent are female. This statistic, however, includes women in the biological sciences, who
comprise the majority of female STEM workers. Statistics from the National Science Foundation suggest that the
gender gap in many STEM careers will continue to persist among young cohorts. For example, in 2002, women
received only 21 percent of bachelor’s degrees awarded in engineering, 27 percent in computer science, and 43 percent
in physical science.2Some recent work by Ellison and Swanson (2009) and Pope and Sydnor (2009) suggests that there may be gender
differences at the very upper tail of the ability distribution.
2
of completing a STEM degree is between 50 and 70 percent (Weinberger, 2001). Nor are the
nearly non-existent differences in college preparatory math and science courses predictive of gender
differences in college major (Xie and Shauman, 2003; Goldin, Katz and Kuziemko, 2006). Since
aptitude and preparedness of the two sexes seem roughly equal upon entering college, it seems that
an important key to understanding the broader question of why men and women’s representation
in STEM careers is so different is understanding what happens to them during college.
This paper begins to shed light on this issue by exploiting data from the U.S. Air Force Academy
(USAFA) where students are randomly assigned to professors over a wide variety of mandatory
standardized courses. We focus on the role of professor gender. Why might professor gender
affect female students’ propensity to persist in STEM? Role model effects are frequently cited as
potentially important factors affecting educational outcomes. Other factors might include gender
differences in the academic expectations of teachers, differences in teaching styles, or differences
in the extent to which teachers provide advice and encouragement. Experimental studies have
documented that equally skilled men and women exhibit differences that might affect their career
choices (including differences in self-perceptions of ability, preferences for taking on difficult tasks,
levels of risk aversion, and expectations about future performance (Beyer and Bowden, 1997; Elliot
and Harackiewicz, 1994; Eckel and Grossman, 2008) but there is also a wide body of evidence
suggesting that gender gaps in these characteristics are mutable (e.g., Spencer, Steele and Quinn,
1999). Teachers may be able to create an environment where this can occur.
Only a handful of studies have investigated the role of professor gender at the postsecondary level
(Canes and Rosen, 1995; Neumark and Gardecki, 1998; Rothstein, 1995; Bettinger and Long, 2005;
Hoffmann and Oreopoulos, 2007), and all of these studies face identification challenges stemming
from university students’ ability to choose their courses and professors. Random placement of
students into classrooms at USAFA, together with mandatory math and science courses, allow us
to investigate how professor gender influences student outcomes free of self-selection and attrition
problems that plague existing research. Since students are required to take specific math and
science courses beyond the first year of study, we are also able to identify the long-term effects
of professor gender. A further advantage of our dataset is that course grades are not determined
by an individual student’s professor. Instead, all faculty members teaching the same course use
an identical syllabus and give the same exams during a common testing period.3 Our rich data
combined with the random assignment of students to professors in core math and science courses
3While the students in Hoffman and Oreopoulos’s dataset are not randomly assigned and do not take mandatory
STEM courses, their dataset has one similarity to ours: course grades are determined by a general exam that is given
to all students enrolled in the course, regardless of which professor they have taken the course from.
3
at the USAFA allow us to overcome the self-selection and attrition problems that have limited the
inferences that can be drawn from previous work in this area.
It is important to point out that if professor gender impacts female students, then these in-
fluences occur at a critical juncture in the life-cycle. Decisions about choosing a STEM major
are likely to have a substantial effect on future labor market opportunities. Furthermore, Xie and
Shauman (2003) show that most women with a STEM bachelor’s degree had initially planned on
majoring in a non-STEM field. This suggests that the path towards a career in science is not
primarily determined by the influence of social forces prior to college entry.
Our results suggest that while professor gender has only limited impact on male students, it
has a powerful effect on female students’ performance in math and science classes, their likelihood
of taking future math and science courses, and their likelihood of graduating with a STEM degree.
The estimates are robust to the inclusion of controls for students’ initial ability, and they are
substantively largest for students with high SAT math scores. Indeed, among these students, the
gender gap in course grades and college major is eradicated when female students are assigned
to introductory math and science professors who are female. The fact that we find the largest
effects among high ability women with a predisposition towards math and science is important
because this group of women are, arguably, the set of women most suited for entering science and
engineering careers. In contrast, the gender of professors teaching humanities courses has, at best,
a limited impact on students’ outcomes.
We also attempt to distinguish the role of professor gender itself from the role of other (un-
observable) professor characteristics that are correlated with gender. We do this by estimating
each professor’s average “value-added” separately for male and female students. We find that some
male professors are very effective at teaching female students — even more effective than they are
at teaching male students. However, we find that the gender of introductory math and science
professors continues to exert a positive influence on female students’ long run outcomes, even after
controlling for professors’ average value-added.
The remainder of the paper unfolds as follows: Section 2 describes our dataset, and Section 3
discusses the statistical methods we will employ. In Section 4 we present our main results. Section
5 investigates mechanisms, and Section 6 concludes.
4
2 Data
Our data come from the United States Air Force Academy (USAFA). The Air Force Academy
is a fully accredited undergraduate institution of higher education with an approximate annual
enrollment of 4, 500 students. All students attending the USAFA receive 100 percent scholarship
to cover their tuition, room, and board. Additionally, each student receives a monthly stipend of
$845 to cover books, uniforms, computer, and other living expenses. All students are required to
graduate within four years and typically serve a minimum five-year commitment as a commissioned
officer in the United States Air Force following graduation.4
Despite the military setting, in many ways the USAFA is comparable to other selective post-
secondary institutions in the United States. Similar to most selective universities and liberal arts
colleges, USAFA faculty have earned their graduate degrees from a broad sample of high qual-
ity programs in their respective fields. Approximately 40 percent of classroom instructors have
terminal degrees, as one might find at a university where introductory coursework is taught by
graduate student teaching assistants. On the other hand, the number of students per section in
any given course rarely exceeds 25, and student interaction with faculty members in and outside
of the classroom is encouraged. In this respect, students’ learning experiences at USAFA more
closely resemble those of students who attend small liberal arts colleges. There are approximately
32 academic majors offered at USAFA across the humanities, social sciences, basic sciences, and
engineering.
Students at USAFA are high achievers, with average math and verbal SAT scores at the 88th and
85th percentiles of the nationwide SAT distribution.5 Students are drawn from each Congressional
district in the US by a highly competitive process, insuring geographic diversity. Fourteen-percent
of applicants were admitted to USAFA in 2007.6 Approximately 17 percent of the students are
female, five percent are black, seven percent are Hispanic and six percent are Asian. Seven percent
of students at USAFA have a parent who graduated from a service academy and 17 percent have
a parent who previously served in the military.
Table I presents statistics for USAFA and a set of comparison schools. We show the 25th and
75th percentiles of each school’s verbal and SAT math scores, undergraduate enrollment, acceptance
4Special exceptions are given for religious missions, medical “set-backs”, and other instances beyond the control
of the individual.5See http://professionals.collegeboard.com/profdownload/sat percentile ranks 2008.pdf for SAT score distribu-
tions.6See the National Center for Education Statistics: http://nces.ed.gov/globallocator/
5

rates, and percent female for selected universities. SAT scores at USAFA are comparable to the
SAT scores of students at top ranked public universities such as UCLA and UNC Chapel Hill, but,
unlike these schools, only seventeen percent of USAFA students are female. This characteristic
makes USAFA most comparable to selective universities that have strong traditions in science and
technology, such as the Georgia Institute of Technology, or Renssaleur Polytechnical Institute. Our
results are thus most salient for women who enter college with a pre-disposition towards STEM.
While this group is not representative of all female college students, it is a group of particular
relevance to the question under study. If professor gender has important effects among high ability
women who are already interested in science, and who have selected into an environment that is
predominantly male, then the results have strong implications for the type of women who are most
likely to choose to major in STEM out of high school. Put differently, our estimates probably
speak most directly to retaining women with an interest in STEM, rather than the question of
what causes women to enter STEM majors.
2.1 The Dataset
Our dataset includes 9, 481 students who comprise the USAFA graduating classes of 2000 through
2008. Data for each student’s high school (pre-treatment) characteristics and their achievement
while at the USAFA were provided by USAFA Institutional Research and Assessment and were
stripped of individual identifiers by the USAFA Institutional Review Board. Student-level pre-
treatment data includes whether students were recruited as athletes, whether they attended a
military preparatory school, and measures of their academic, athletic and leadership aptitude.
Academic aptitude is measured through SAT verbal and SAT math scores and an academic com-
posite computed by the USAFA admissions office, which is a weighted average of an individual’s
high school GPA, class rank, and the quality of the high school attended. The measure of pre-
treatment athletic aptitude is a score on a fitness test required by all applicants prior to entrance.7
The measure of pre-treatment leadership aptitude is a leadership composite computed by the US-
AFA admissions office, which is a weighted average of high school and community activities (e.g.,
student council offices, Eagle Scout participation, captain of a sports team).
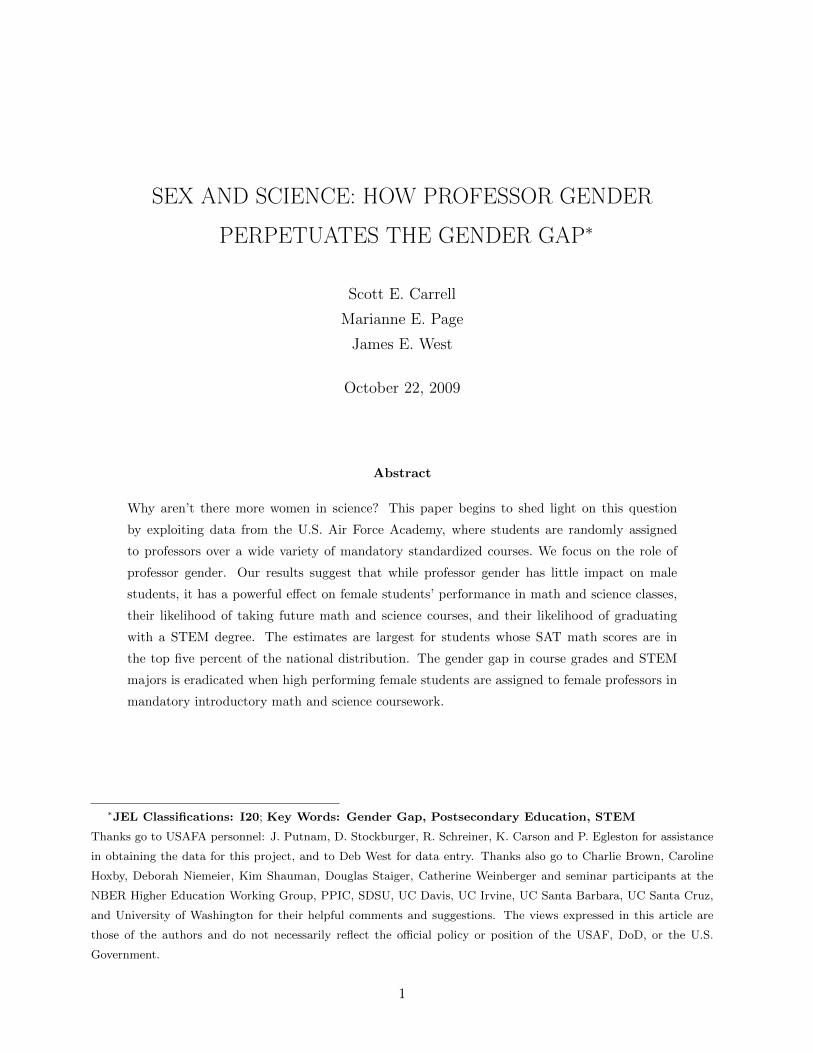
Table II provides summary statistics and Figure I plots the distribution of pre-treatment aca-
demic variables by gender. As in nationally representative samples, the upper tail of the math score
7Barron, Ewing and Waddell (2000) find a positive correlation between athletic participation and educational
attainment and Carrell, Fullerton and West (2009) find a positive correlation between fitness scores and academic
achievement.
6

distribution is somewhat thicker for male than it is for female students. Since our estimation strat-
egy is based on random assignment and includes pre-treatment characteristics as controls, small
differences in distributions will not affect our analysis.
Our academic performance measures consist of final grades in core courses for each individual
student by course and section-semester-year. Students at USAFA are required to take a core
set of approximately 30 courses in mathematics, basic sciences, social sciences, humanities, and
engineering, but we focus only on mandatory introductory and follow-on courses in mathematics,
physics, chemistry, engineering, history, and English.8 A distinct advantage of our dataset is that
all students are required to take a follow-on related curriculum. Grades are determined on an A,
A-, B+, B · · · C-, D, F scale where an A is worth 4 grade points, an A- is 3.7 grade points, a B+
is 3.3 grade points, etc. The sample grade point average in core STEM coursework is 2.72 among
females and 2.85 among males. The grade point average in core humanities courses is 2.81 among
females and 2.73 among males. We standardize these course grades to have a mean of zero and a
variance of one within each course, semester and year.
We also examine students’ decisions to enroll in optional follow-on math and science classes,
whether they graduate with a bachelor’s degree, and their choice of academic major. In our sample,
female students are less likely than males to take higher level elective math courses (34 percent of
females vs. 50 percent of males) and less likely to major in STEM (24 vs. 40 percent but are more
likely to graduate (84 vs. 81 percent).9
Individual professor-level data were obtained from USAFA historical archives and the USAFA
Center for Education Excellence and were matched to the student achievement data for each course
taught, by section-semester-year.10 We have information on each professor’s academic rank, gender,
education level (M.A. or Ph.D.), and years of teaching experience at USAFA. During the period we
study, there were 249 different faculty members who taught introductory mathematics, chemistry,
or physics courses. Nineteen-percent (47 of 249) of these faculty were female and taught 23-percent
(286 of 1, 221) of the introductory math and science course-sections. 112 different faculty members
8Course descriptions for Math 130, 141, 142; Physics 110, 221; Chemistry 141, 142; History 101, 202; English
111, 211; and the required engineering courses (aeronautical, astronautical, electrical, mechanical, civil, and thermo
dynamics) can be found at: http://www.usafa.edu/df/dfr/curriculum/CHB.pdf. Additionally, Carrell and West
(2008), Table II, provides a list of the required STEM courses at USAFA.9Figures for STEM major exclude the biological sciences, which require less mathematics and have historically
higher rates of female participation. When including biological sciences the gender difference is smaller (40 vs. 45
percent).10We were only able to obtain the professor observable data for the mathematics, chemistry, physics, English, and
history departments. Hence, we focus our analysis on these courses.
7

taught humanities courses, and 21-percent of them were female.
2.2 Student Assignment to Courses and Professors
Prior to the beginning of the freshman year, students take placement exams in mathematics, chem-
istry, and select foreign languages, and the scores on these exams are used to place students into the
appropriate beginning core courses (i.e., remedial math, Calculus I, Calculus II, etc.). Conditional
on course placement, the USAFA Registrar randomly assigns students to core course sections.11
Thus, throughout their four years of study, students have no ability to choose their required core
course professors. Since faculty members teaching the same course use an identical syllabus and
give the same exams during a common testing period, grades in core courses are a consistent mea-
sure of relative achievement across all students.12 These institutional characteristics assure there
is no self-selection of students into (or out of) courses or towards certain professors.
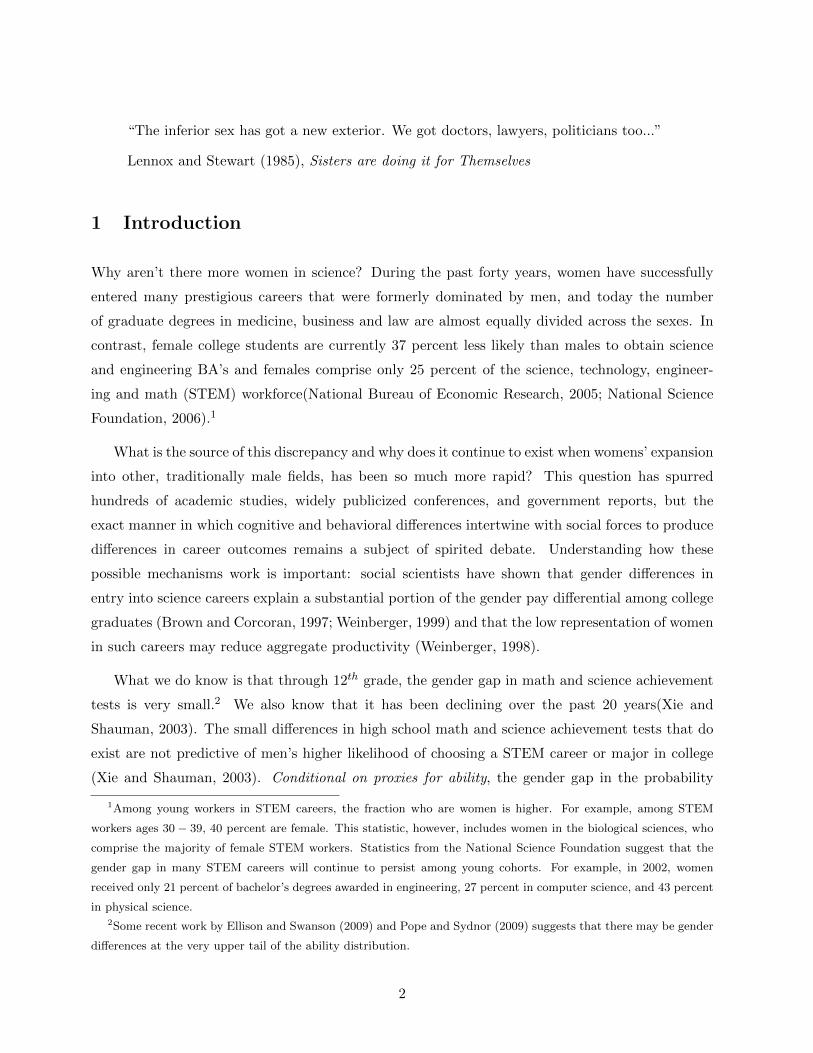
Table II indicates that the types of students assigned to female faculty are nearly indistinguish-
able from those assigned to male faculty. In math and science courses, the average class size for
female faculty is 19.2 compared to 19.0 for males. In addition, male and female professors have
a similar numbers of female students per section, and similar average scores on SAT verbal, SAT
math, academic composite, and algebra/trigonometry tests.
To formally test whether course assignment is random with respect to faculty gender we re-
gressed faculty gender on individual student characteristics. The results of this analysis are shown
in Table III. Panel A shows results for math and science courses and Panel B shows results for
humanities courses. Across all subgroups we see that the correlation between faculty gender and
student characteristics is generally small and statistically insignificant. For each specification, we
11 The USAFA Registrar employs a stratified random assignment algorithm to place students into sections within
each course and semester. The algorithm first assigns all female students evenly throughout all offered sections,
then places male-recruited athletes, and then assigns all remaining students. Within each group (i.e., female, male-
athlete, and all remaining males), assignments are random. The one exception is introductory chemistry, where the
92 lowest ability freshman students each year are ability grouped into four separate sections and are taught by the
most experienced professors. Our results are not sensitive to the exclusion of these sections.12The one exception is that in some core courses at USAFA, 5 to 10-percent of the overall course grade is earned
by professor/section specific quizzes and/or class participation. Among the introductory courses we examine in this
study, grades in calculus were not based on any professor specific assignments between 2000 and 2007. Introductory
physics professors were allowed to establish 5−percent of the course grade and introductory chemistry professors were
allowed to establish 4-percent of the course grade. The introductory course effects we find do not vary significantly
across math, chemistry, and physics courses; hence, we believe that the subjective portion of course grades has very
little influence on our estimates.
8

calculated the joint significance of all individual covariates and found these to be insignificant in 15
of the 16 estimates. Additionally, in Carrell and West (2008), we show that student assignment to
core courses at USAFA is random with respect to peer characteristics and faculty academic rank,
experience, and terminal degree status. In that paper, we used resampling methods to construct
10, 000 sections drawn from the relevant course and semester and found that the distribution of
academic ability by assigned section is indistinguishable from the distribution observed in the re-
sampled sections. Results from these analyses indicate that the algorithm that assigns students to
course sections is consistent with random assignment.
3 Statistical Methods
We begin by estimating the following linear regression model:
(1) Yicjst = φ1 + β1Fi + β2Fj + β3FiFj + φ2Xicst + φ3Pj + γct + εicjst
where Yicjst is the outcome measure for student i in course c with professor j in section s in semester-
year t. Fi is an indicator for whether student i is female and Fj is an indicator for whether professor
j is female. The β coefficients are the primary coefficients of interest in our study. β1 represents
the difference in mean performance between female and male students. β2 is the value added
from having a female professor, and, β3 indicates the extent to which having a female professor
differentially affects female vs. male students. Because students are randomly assigned, estimates
of the β coefficients are unbiased.
The vector Xicst includes the following student characteristics: SAT math and SAT verbal
test scores, academic and leadership composites, algebra/trigonometry placement test score, fitness
score, race, whether the student was recruited as an athlete, and whether he/she attended a military
preparatory school. We also include cohort dummies. Pj is a vector of professor characteristics
including indicators of the professor’s academic rank, teaching experience and terminal degree
status. γct are course by semester-year fixed effects, which control for unobserved mean differences
in academic achievement or grading standards across courses and time. The inclusion of these fixed
effects ensures that the model identifies professor quality using only the within course by semester-
year variation in student achievement. We also include course and time of day fixed effects. εicjst
is the error term. Standard error estimates are clustered by professor.
We implement a slightly modified version of equation (1) to estimate the effect of professor
9

gender in initial courses on performance in follow-on related courses:
(2) Yic′s′t′ = φ1 + β1Fi + (β2 + β3Fi)
∑j|iFjt
nit+ φ2Xicst + γc′s′t′ + εic′s′t′
where Yic′ks′t′ is performance in the follow-on course, c′ in section s′ and semester-year t′.
∑j|i
Fjt′
nit′is
the proportion of introductory course faculty j who were female for student i at time t′. Including
this variable allows us to measure the average impact of having more female professors in introduc-
tory math and science courses. We have also estimated regressions in which we include separate
variables indicating each introductory course professor’s gender. In principle, this specification
should allow us to separately identify the effects of introductory math vs. chemistry vs. physics
professors, but in practice the estimated coefficients on the separate indicator variables are too noisy
to identify differential effects. The proportion of female professors teaching the students’ introduc-
tory courses efficiently summarizes the interesting variation. To adjust for any possible professor,
section, or year effects in the follow-on course, we include a section by course by semester-year
fixed effect, γc′s′t′ . As in equation (1), we are primarily interested in the β’s, which measure the
average differences across male and female students, the effect of having more female professors in
the introductory STEM courses, and the differential effect across male and female students of being
assigned more female professors in introductory courses. Because students are re-randomized into
the mandatory follow-on course sections, estimates of the β coefficients are again unbiased.
To estimate the effect of professor gender on longer term outcomes, such as choosing to take
higher level math or graduating with a technical degree, we estimate a variation of equation (2):
(3) Dit′ = φ1 + β1Fi + (β2 + β3Fi)
∑j|iFjt
nit+ φ2Xit + εit′
where Dit′ is a dummy variable that indicates whether student i at time t′ chose to take a higher
level math course or chose a STEM major. As before, the β coefficients are the coefficients of
interest.
4 Estimated Effects of Introductory Course Professor Gender in
Science and Math Classes
4.1 Estimated Effects on Course Performance in the Professor’s Own Course
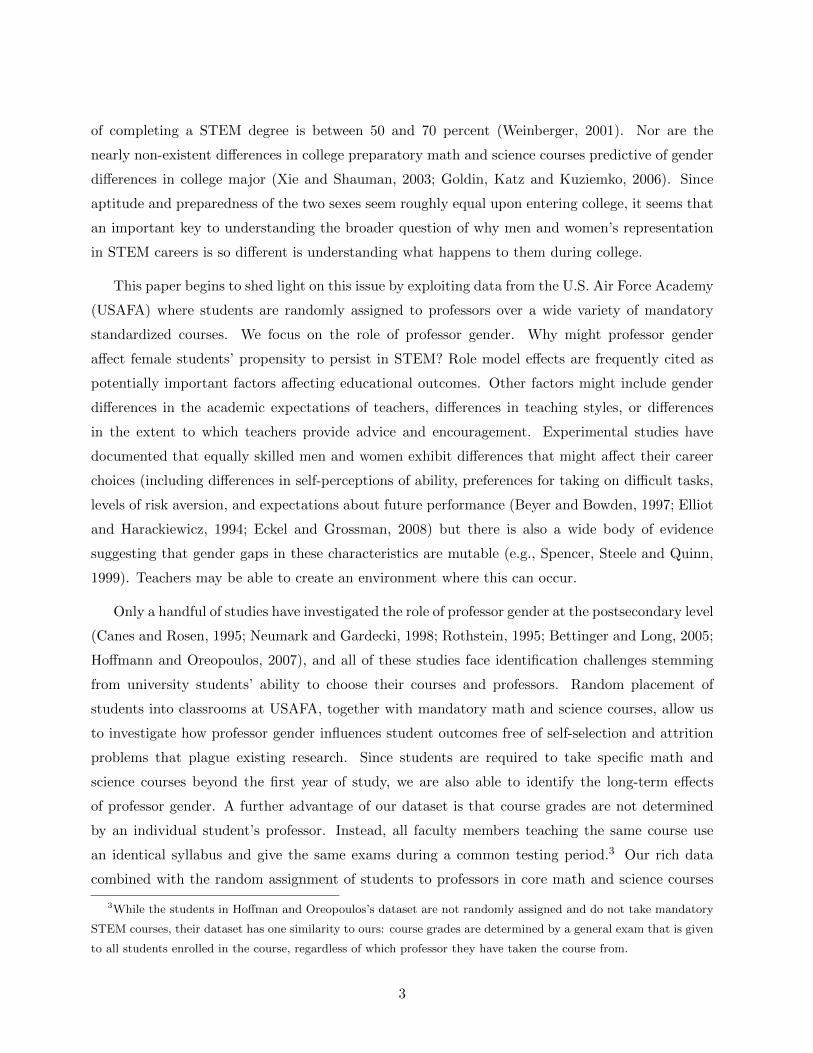
Figure III provides unconditional mean estimates by student and professor gender. The pattern
of estimates shown in the figure are quantitatively and qualitatively similar to those produced by
10
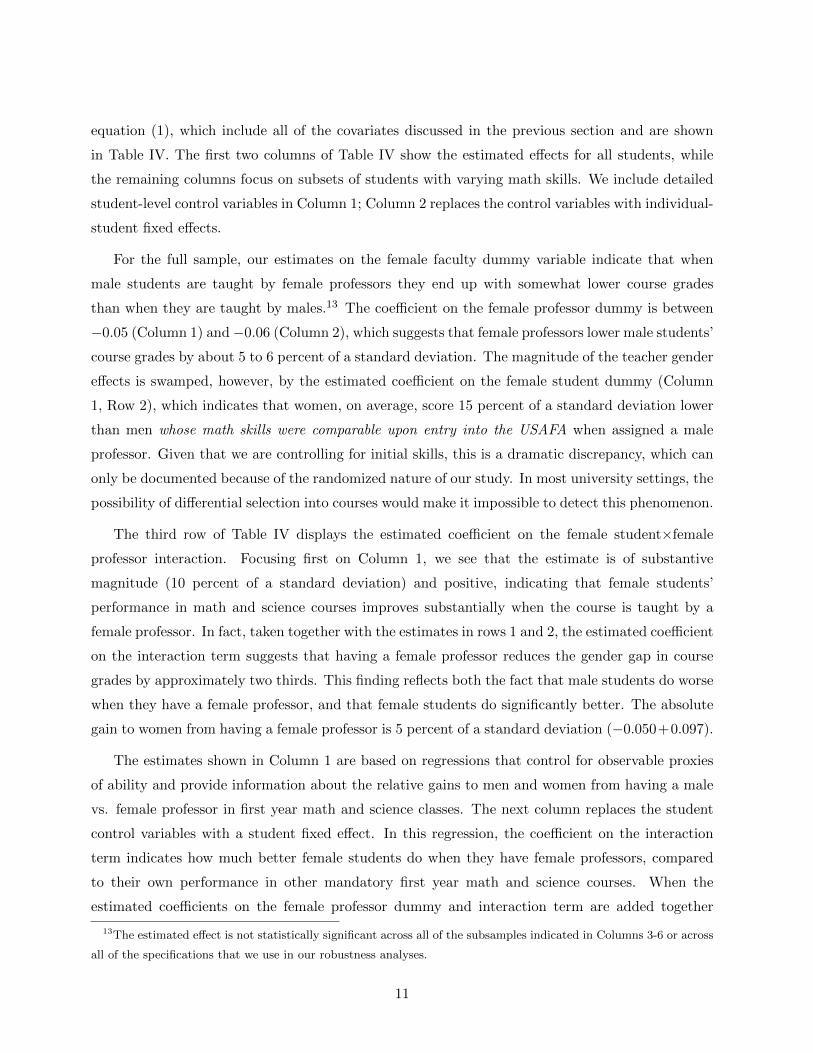
equation (1), which include all of the covariates discussed in the previous section and are shown
in Table IV. The first two columns of Table IV show the estimated effects for all students, while
the remaining columns focus on subsets of students with varying math skills. We include detailed
student-level control variables in Column 1; Column 2 replaces the control variables with individual-
student fixed effects.
For the full sample, our estimates on the female faculty dummy variable indicate that when
male students are taught by female professors they end up with somewhat lower course grades
than when they are taught by males.13 The coefficient on the female professor dummy is between
−0.05 (Column 1) and −0.06 (Column 2), which suggests that female professors lower male students’
course grades by about 5 to 6 percent of a standard deviation. The magnitude of the teacher gender
effects is swamped, however, by the estimated coefficient on the female student dummy (Column
1, Row 2), which indicates that women, on average, score 15 percent of a standard deviation lower
than men whose math skills were comparable upon entry into the USAFA when assigned a male
professor. Given that we are controlling for initial skills, this is a dramatic discrepancy, which can
only be documented because of the randomized nature of our study. In most university settings, the
possibility of differential selection into courses would make it impossible to detect this phenomenon.
The third row of Table IV displays the estimated coefficient on the female student×female
professor interaction. Focusing first on Column 1, we see that the estimate is of substantive
magnitude (10 percent of a standard deviation) and positive, indicating that female students’
performance in math and science courses improves substantially when the course is taught by a
female professor. In fact, taken together with the estimates in rows 1 and 2, the estimated coefficient
on the interaction term suggests that having a female professor reduces the gender gap in course
grades by approximately two thirds. This finding reflects both the fact that male students do worse
when they have a female professor, and that female students do significantly better. The absolute
gain to women from having a female professor is 5 percent of a standard deviation (−0.050+0.097).
The estimates shown in Column 1 are based on regressions that control for observable proxies
of ability and provide information about the relative gains to men and women from having a male
vs. female professor in first year math and science classes. The next column replaces the student
control variables with a student fixed effect. In this regression, the coefficient on the interaction
term indicates how much better female students do when they have female professors, compared
to their own performance in other mandatory first year math and science courses. When the
estimated coefficients on the female professor dummy and interaction term are added together
13The estimated effect is not statistically significant across all of the subsamples indicated in Columns 3-6 or across
all of the specifications that we use in our robustness analyses.
11

(−.043 + 0.139) the resulting estimate indicates that, conditional on proxies of own ability, female
students’ performance improves by nearly 10 percent of a standard deviation.
Columns 3 - 8 focus on subgroups of women defined according to their observed math skills at
the time they entered college. Columns 3 and 4 show the regression estimates for students whose
SAT math score was below 660, Columns 5 and 6 show the regression estimates for students whose
math SAT was above 660, and Columns 7 and 8 show the same results for students who scored
above 700. These scores correspond to the median and 75th percentile of the distribution at USAFA,
and to the 90th and 95th percentiles of the national SAT Math distribution. Since we control for
initial SAT math scores and math placement test scores in our regressions, this is unlikely to reflect
men’s higher likelihood of scoring at the very top of the distribution prior to college. Rather, it
suggests that either 1) there are gender differences in math/science ability that are not captured
by the initial controls, or 2) something about the college experience has a particularly detrimental
effect on the math and science performance of highly skilled women.
The most striking pattern in Table IV is that as female students’ initial math skills increase,
the relative importance of professor gender also increases. In fact, at the top of the distribution
(Column 7), having a female professor completely closes the gender gap (−0.162 + 0.172). Notably,
at higher skill levels, the evidence that professor gender matters to male students also weakens.
We speculate that something about the classroom environment created by female math and science
professors has a powerful effect on the performance of women with very strong math skills — with
virtually no expense incurred by their comparable male peers. This result is particularly relevant
as men and women with high math ability are precisely those needed in the STEM labor market.14
Our estimates are robust to changes in specification that allow the correlation between student
characteristics and course grades to vary with student gender. They are also insensitive to the
inclusion of interactions between the professor gender dummy and professor characteristics, and
to the inclusion of interactions between the student gender dummy and the professor level control
variables. The results will be discussed further in Section 6.
We have also extended our analyses to include a full set of professor gender indicators, one for
14 The improvements in initial course grade are unlikely to result from female instructors engaging in preferential
treatment. In the math courses that we study, all exams are graded by a team of faculty and these grades form the
basis of their course grade. In all courses, the final grade-cut lines are not determined by the faculty member. To
formally test this, we were able to obtain the percentage of points earned in the course for a two-thirds subset of
our data. We found nearly identical results when using this continuous data compared to the categorical data. For
example, the magnitude of the female student×female professor interaction variable for the highest ability students
(Table 4, Column 7) is 0.172 for the categorical data and 0.192 for the continuous data.
12

each of the three introductory math and science courses, plus interactions between these indicators
and the student gender dummy. The magnitudes of the effects are larger for mathematics, but
not significantly different than those for chemistry and physics. We also examined and found no
evidence of spillover effects across the introductory courses. For example, students’ introductory
math course grades are affected by the gender of their math professor but not by the gender of
their introductory physics or chemistry professors. Similarly, introductory chemistry and physics
grades are only affected by the gender of the chemistry or physics professors and not the gender
of the professor teaching the other introductory math/science subjects. Results from this analysis
are available in Appendix Table 1 in the on-line appendix.
4.2 Longer-term Effects of Professor Gender
Our main finding is that female students perform substantively better in their math and science
courses when they are taught by a woman. Since we are interested in understanding why the
prevalence of women in science careers is lower than that of men, our next task is to examine whether
these effects persist to longer-term outcomes; course performance itself is only interesting to the
extent that it affects pathways into STEM careers. Table V provides the results from estimating
the effect of professor gender, measured by the proportion of introductory courses taught by female
faculty, on longer-term outcomes. We look at four outcomes: whether the student withdraws from
the USAFA, the student’s performance in all required follow-on STEM coursework, whether the
student chooses to take higher level math courses beyond those that are required for graduation
with a non-STEM degree, and whether she graduates with a STEM degree.15 All four of these
outcomes are correlated with future career choices. Beginning with the top panel, Column 2 shows
that, conditional on entering math skills, women and men are equally likely to withdraw from the
USAFA. However, female students perform significantly worse in follow-on STEM coursework, are
less likely to take higher level math courses, and are less likely to graduate with a STEM degree
compared to male students. It is also clear that gender differences in college major are much larger
when we exclude biological sciences (Columns 5 vs. 4), which typically require less math, and have
higher rates of female participation.16
The estimated effect of professor gender on these long-term outcomes varies across the sub-
samples, with the biggest effects, by far, accruing to women with high entering math ability. Across
15The attrition results we present in Table V show attrition after the second year; however, results are qualitatively
similar for 1-year and 4-year attrition. See footnote 12 for a list of the required follow-on coursework.16We find qualitatively similar results when we also exclude environmental engineering, a field with a relatively
higher rate of female participation.
13

the full sample, there is no statistically significant evidence that having a higher proportion of female
professors affects a woman’s likelihood of withdrawing, her performance in follow-on coursework,
her probability of taking higher level math courses, or her probability of graduating with a STEM
major. Similar results are shown in Panel B, where we focus on the subgroup of women whose
math SAT scores were below the median. However, as the sample narrows to include increasingly
high skilled women (as approximated by their SAT math score), the estimated effects of professor
gender become much larger and statistically significant. Among the top quartile of female students,
and for each long-term outcome, higher proportions of female professors in introductory math and
science courses are associated with reductions in the gender gap. In fact, the estimates suggest that
increasing the fraction of female professors from 0 to 100 percent would completely eliminate the
gender gap in math and science majors. For example, Column 5 of Panel C indicates that among
the highest ability women, those whose introductory math and science professors are exclusively
female are 26 percentage points more likely to major in STEM than those who are exclusively
assigned to male faculty. For this high ability group, the male/female gap in the probability of
completing a STEM major is 27-percent.
At the same time, there is no evidence that having a female professor affects a female student’s
likelihood of dropping out, regardless of her ability level. This suggests that whatever it is about
female professors that affects women in their first year math and science courses, it is not something
that changes retention rates, but rather something that changes their preferences for math and
science. This interpretation is consistent with Zafar (2009) who finds evidence at Northwestern
University that the gender gap in academic major is “due to differences in beliefs about enjoying
coursework and differences in preferences.” Hence, our findings suggest that female professors
may be changing female student’s beliefs and preferences toward STEM coursework and careers.
We have also estimated regressions in which we include three separate dummy variables indicating
each introductory course professor’s gender. This allows us to investigate the possibility that our
estimated long-run effects are driven by professor gender in a particular course.17 We find little
evidence that our long-run estimates are driven by professor gender in a particular subject or that
professor gender in the same previous subject is more important than professor gender in “cross”
subjects.18
Our findings are robust to changes in model specification that exclude individual controls or that
17The results from this analysis can be found in Appendix Table 1, Panel B in the on-line appendix.18We find one exception. Among women with SAT Math scores greater than 700, we find that the effects of professor
gender on graduating with a STEM degree and taking higher-level math are significantly greater for calculus professors
compared to chemistry or physics professors.
14
increase model flexibility by including interactions between individual characteristics and student
gender. They are not generated by a few outliers: when we estimate teacher value-added for each
professor and plot the effects by professor and student gender we find that among female professors
over 2/3 of the value-added shrinkage estimates are positive for their high ability female students.19
4.3 Estimated Effects of Professor Gender in English and History Classes
Next, we consider the role of professor gender in humanities courses. Table VI shows the estimated
effects of professor gender when we estimate equation (1) for introductory English and history
courses. The estimates are strikingly different. There is no observable gender gap in course per-
formance, and there is no evidence that female students’ course grades are improved when they
have a female professor. As in Tables IV and V, we find weak evidence that both men and women
have lower humanities grades when the course is taught by a female professor, but most of the
coefficient estimates on the female professor dummy are barely significant at the 10 percent level.20
Specifications 3-6 carry forward our analyses for longer-term outcomes. We look at the effect of
professor gender in initial humanities courses on later course selection and choice of major. All of
the estimated female professor coefficients are small, and none are statistically significant. This
indicates that the gender of professors in initial humanities courses has no effect on male students’
longer-term choices. Similarly, most of the estimated coefficients on the interaction term are small,
and only one is statistically different from zero, suggesting that female students’ long run choices
are also unrelated to the sex of the professor who teaches their humanities courses.
These results stand in direct contrast to our estimated professor effects in math and science,
where it appears that female students with strong math skills are powerfully affected by the gender
of their introductory course professors. These results also indicate the effects we find are not likely
driven by the general (military) culture of the institution we study. In the next section, we explore
mechanisms that might be behind this effect.
19See Section 5.1 for details of how we calculated the value-added estimates. Figure IV shows plots of the value-
added shrinkage estimates by student and professor gender.20 We have also estimated individual student fixed effects model analogous to the specification that is employed in
Columns 2, 4, 6 and 8 of Table IV. The results from this specification suggest that when male students are taught by
women introductory humanities courses, their grades are about 20 percent of a standard deviation lower. Because we
only observe this effect for male students with one of each gender professor (19 percent of sample) indicates than any
sort of grade discrimination on the part of professors is not driving the effect. Rather, the result is consistent with a
story of effort/response on the part of male students who have this very specific treatment. Among female students,
course performance seems to be unrelated to professor gender. Results are available upon request from the authors.
15
4.4 Contemporaneous Effects of Professor Gender in Follow-on Courses
We have seen evidence that female students’ paths into math and science careers are influenced
significantly by the gender of the professor who teach their introductory math and science courses.
Next, we examine how the gender of professors in more advanced follow-on math and science courses
affect contemporaneous student STEM outcomes.21 Results in Table VII show negligible effects of
professor gender in mandatory follow-on math and science courses on (contemporaneous) course
grades, whether the student takes higher-level math, and whether the student graduates with a
degree in STEM. We find that none of the estimated interaction terms are statistically different
from zero, most are small in magnitude, and a few are in the opposite direction from our earlier
estimates. Because these courses are taken later in students’ educational path, the effect of professor
gender may be different due to either a mechanical effect (i.e., academic majors may already be
chosen) or due to the fact that preferences and self-perceptions of student ability may already be
formed at this juncture. Nevertheless, these results suggest that classroom environment has its
strongest influence on female students early in the college career.
5 Mechanisms
5.1 Is it All About Professor Gender?
Table IV suggests that female students’ initial math and science grades are substantively higher
when they are taught by female professors. The estimated effects are particularly large among
female students in the upper quartile of the SAT math distribution. In this section, we investigate
whether gender differences in student performance are driven by professor gender per se, or whether
they might be driven by some other professor characteristic that is correlated with professor gender.
For example, male and female students may respond in different ways to younger versus older
professors or they may have different responses to alternative teaching styles that are correlated
with, but not exclusive to, professor gender.
To investigate possible mechanisms further, we conduct three additional analyses. First, we
interact all of our professor level variables with the professor and student gender dummies to see
whether the importance of particular professor characteristics varies with student and/or professor
21Specifically, we examine how the gender of the professor teaching mandatory second-semester courses in calculus,
chemistry, and physics affects course grades.
16

gender. The results of these regressions, which are shown in Table VIII, indicate that it is not dif-
ferences in observables, or differences in student-gender specific responsiveness to those observables,
that are driving our results.
Second, we examined the role of voluntary interaction between students and professors outside
of formal classroom instruction. To do so, the Mathematics Department at USAFA collected office
hour data for each student by professor during the fall of 2008. These data showed that female
students were no more likely to attend office hours with female vs. male professors.22 Although
the data were from a single course in a single semester, the results suggest that the mechanisms
that are driving our estimated effects are not likely driven by gender differences in willingness to
approach professors for addition instruction.
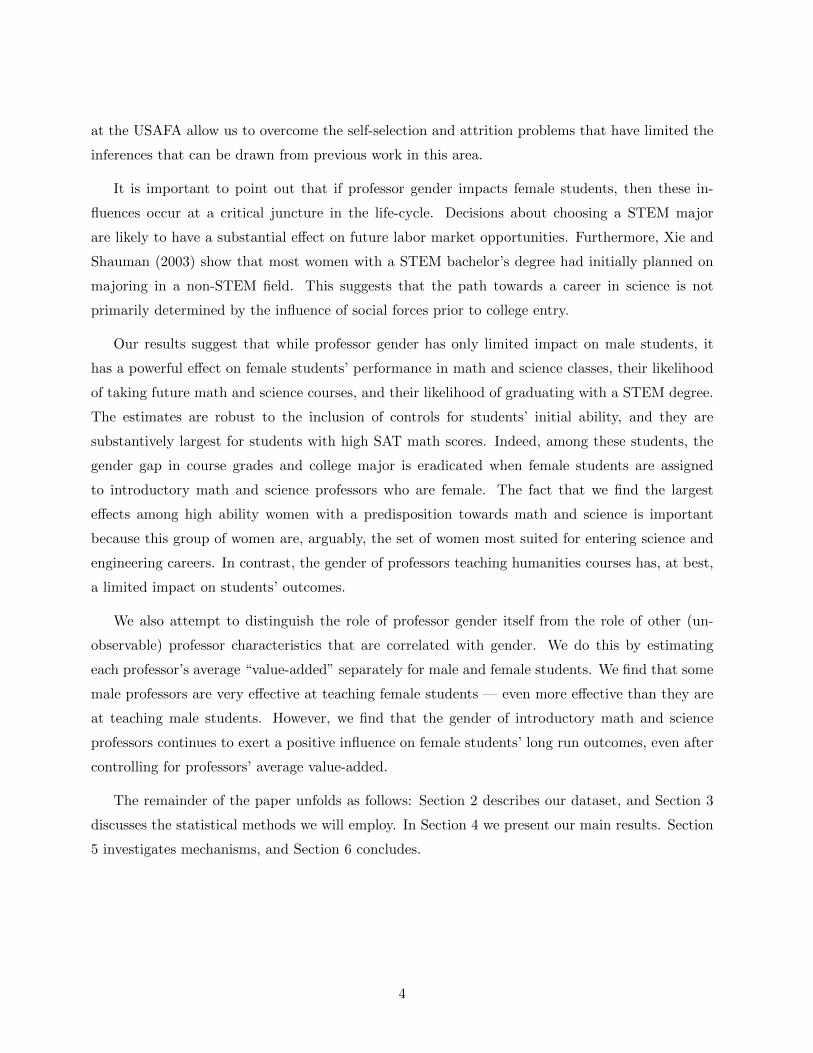
Finally, we examine the role of unobservables through a professor “value-added” analysis. This is
implemented through a two-step process: first, for each professor and course, we estimate a student
gender-specific random effect, which summarizes the professors average value-added separately for
female and for male students.23 This provides us with estimates of each professor’s “value added”
for both female and male students. Figure IV shows the distribution of the gender-specific estimated
value-added, ξ̂. As expected, the distribution of the female-student-female-teacher effects (middle
column) is to the right of the distribution of female-student-male-teacher effects. These results
reconfirm our previous finding that, on average, female students perform better when their math
and science courses are taught by female faculty, but also make clear that many male professors are
very effective at teaching female students. In other words, student performance in the introductory
course is correlated with professor gender, but not exclusively.
Our next step is to re-estimate the follow-on equations, (2) and (3), while including the average
22Female students were much more likely to attend office hours compared to male students across all professors.23 We estimate a Bayesian shrinkage estimate for each professor’s value-added by student gender in a random
effects framework as in Rabe-Hesketh and Skrondal (2008). The shrinkage estimates take into account the variance
(signal to noise) and the number of observations for each professor. Because we have random assignment, both
random effects and fixed effects models will produce consistent estimates, but random effects models are efficient.
To eliminate classroom-specific common shocks we estimated professor j’s value-added in section s using professor
j’s students not in section s (i.e. we use sections other than the students own section). The value added estimates
are based on regressions that control for all variables in equation (1), except for professor gender. In addition we
include interactions between student gender and professor academic rank, experience, and terminal degree status and
interactions between student gender and individual-level covariates. The raw correlation between the within-professor
male and female student value-added is 0.19. For recent work estimating teacher value-added models see Rivkin,
Hanushek and Kain (2005), Kane, Rockoff and Staiger (2008), Kane and Staiger (2008), Hoffmann and Oreopoulos
(2009), and Carrell and West (2008).
17

of the estimated professor value-added, ξ̂, as explanatory variables.
Yic′s′t′ = φ1 + β1Fi + φ2Xicst + (β2 + β3Fi)
∑j|iFjt
nit+ β4Fi
∑j|iξ̂fj
nit+ β5Fi
∑j|iξ̂mj
nit
+β6Mi
∑j|iξ̂fj
nit+ β7Mi
∑j|iξ̂mj
nit+ γc′s′t′ + εic′s′t′
(4)
Mi is an indicator variable of whether student i is male. This equation allows us to investigate
whether students’ outcomes are affected by professors who have high “male/female value-added,”
conditional on professor gender. In other words, we can separately estimate the impact of professor
“quality” from the impact of professor gender itself. We present results for this analysis in Table
IX. Column 1 shows that both the professor gender and professor “value-added” variables are
strong predictors of student performance in the introductory STEM courses. However, results
in Columns 2 - 4 show that while professor gender continues to exert a positive effect on female
student outcomes, the introductory course professor value-added has no predictive power on the
longer-term outcomes. As in Carrell and West (2008), we find no persistence of introductory course
value-added into follow-on course performance at USAFA. Thus, it appears that the influence of
female professors on their female students’ future math and science performance operates largely
through factors other than value-added in the introductory course grades.
6 Conclusion
Why aren’t there more women in science careers? If we want to know the answer to this question
we need to make sense of what happens to women in college. College is a critical juncture in the
life-cycle, and in spite of the fact that men and women enter college with similar levels of math
preparation, substantially fewer women leave college with a science or engineering degree. This, in
turn, closes the door to many careers in science and technology.
The goal of this paper is to shed light on how women’s paths towards science are affected by
the college environment, focusing on the role of professor gender. Unlike previous research on this
topic, we are blessed with experimental conditions that ensure our estimates are uncontaminated
by self-selection and attrition bias. This is possible because USAFA randomly assigns students to
professors over a wide variety of mandatory standardized courses. A further advantage of studying
this campus is that course grades are not determined by an individual student’s professor.
The nature of our data allows us to document a number of interesting patterns. First, we find
that compared to men with the same entering math ability, female students perform substantially
18
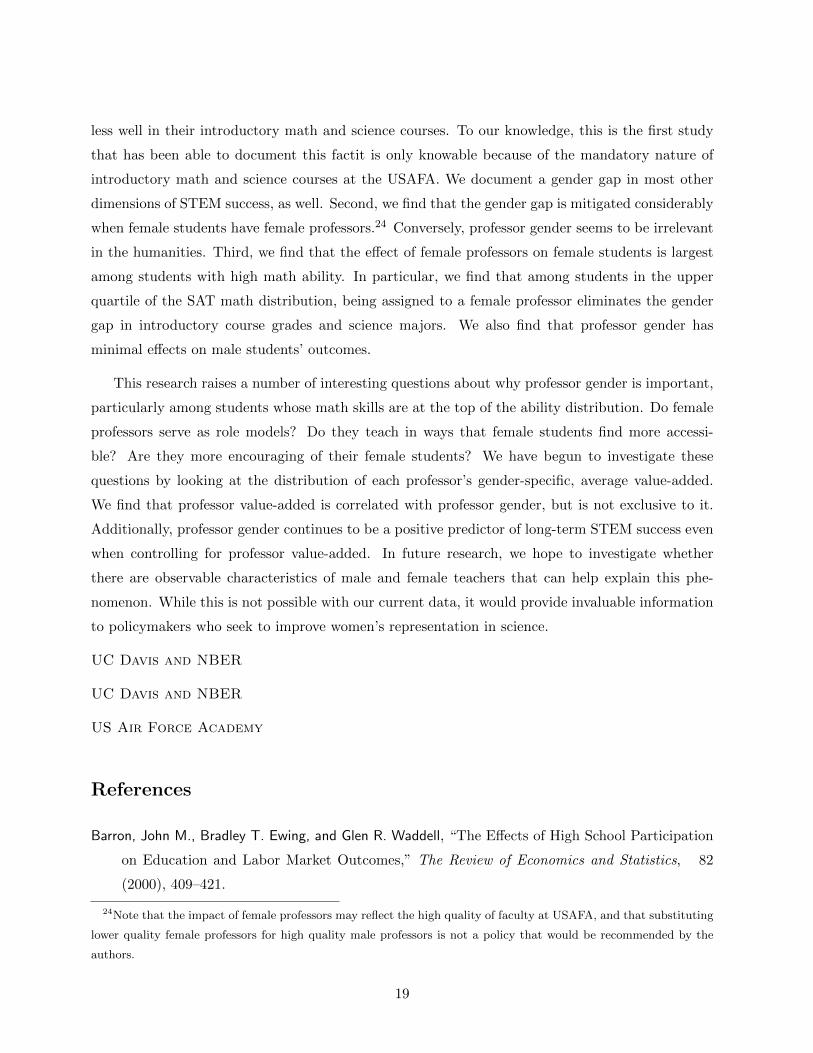
less well in their introductory math and science courses. To our knowledge, this is the first study
that has been able to document this factit is only knowable because of the mandatory nature of
introductory math and science courses at the USAFA. We document a gender gap in most other
dimensions of STEM success, as well. Second, we find that the gender gap is mitigated considerably
when female students have female professors.24 Conversely, professor gender seems to be irrelevant
in the humanities. Third, we find that the effect of female professors on female students is largest
among students with high math ability. In particular, we find that among students in the upper
quartile of the SAT math distribution, being assigned to a female professor eliminates the gender
gap in introductory course grades and science majors. We also find that professor gender has
minimal effects on male students’ outcomes.
This research raises a number of interesting questions about why professor gender is important,
particularly among students whose math skills are at the top of the ability distribution. Do female
professors serve as role models? Do they teach in ways that female students find more accessi-
ble? Are they more encouraging of their female students? We have begun to investigate these
questions by looking at the distribution of each professor’s gender-specific, average value-added.
We find that professor value-added is correlated with professor gender, but is not exclusive to it.
Additionally, professor gender continues to be a positive predictor of long-term STEM success even
when controlling for professor value-added. In future research, we hope to investigate whether
there are observable characteristics of male and female teachers that can help explain this phe-
nomenon. While this is not possible with our current data, it would provide invaluable information
to policymakers who seek to improve women’s representation in science.
UC Davis and NBER
UC Davis and NBER
US Air Force Academy
References
Barron, John M., Bradley T. Ewing, and Glen R. Waddell, “The Effects of High School Participation
on Education and Labor Market Outcomes,” The Review of Economics and Statistics, 82
(2000), 409–421.
24Note that the impact of female professors may reflect the high quality of faculty at USAFA, and that substituting
lower quality female professors for high quality male professors is not a policy that would be recommended by the
authors.
19
Bettinger, Eric and Bridget Terry Long, “Do Faculty Serve as Role Models? The Impact of Instructor
Gender on Female Students,” American Economic Review, 95 (2005), 152–157.
Beyer, Sylvia and Edward M. Bowden, “Gender Differences in Self-Perceptions: Convergent Evidence
from Three Measures of Accuracy and Bias,” Personality and Social Psychology Bulletin, 23
(1997), 157–172.
Brown, Charles and Mary Corcoran, “Sex-Based Differences in School Content and the Male-Female
Wage Gap,” Journal of Labor Economics, 15 (1997), 431–465.
Canes, Brandice and Harvey Rosen, “Following in Her Footsteps? Faculty Gender Composition and
Womens Choices of College Majors,” Industrial and Labor Relations Review, 48 (1995),
486–504.
Carrell, Scott E. and James E. West, “Does Professor Quality Matter? Evidence from Random
Assignment of Students to Professors,” Working Paper 14081, National Bureau of Economic
Research, 2008.
, Richard L. Fullerton, and James E. West, “Does Your Cohort Matter? Estimating Peer Effects
in College Achievement,” Journal of Labor Economics, 27 (2009), 439–464.
Eckel, Catherine C. and Philip J. Grossman, “The Difference in the Economic Decisions of Men and
Women: Experimental Evidence,” in Handbook of Experimental Economics Results, Charles
Plott and Vernon Smith, ed., Vol. 1 (Elsevier, 2008).
Elliot, Andrew J. and Judith M. Harackiewicz, “Goal Setting, Achievement Orientation, and Intrinsic
Motivation: A Mediational Analysis,” Journal of Personality and Social Psychology, 66
(1994), 968–980.
Ellison, Glenn and Ashley Swanson, “The Gender Gap in Secondary School Mathematics at High
Achievement Levels: Evidence from the American Mathematics Competitions,” Working Pa-
per 15238, National Bureau of Economic Research, 2009.
Goldin, Claudia, Lawrence Katz, and Ilyana Kuziemko, “The Homecoming of American College
Women: The Reversal of the College Gender Gap,” Journal of Economic Perspectives, 20
(2006), 133–156.
Hoffmann, Florian and Philip Oreopoulos, “A Professor Like Me: The Influence of Instructor Gender
on College Achievement,” Working Paper 13182, National Bureau of Economic Research, 2007.
20
and , “Professor Qualities and Student Achievement,” Review of Economics and Statis-
tics, 91 (2009), 83–92.
Kane, Thomas J. and Douglas O. Staiger, “Estimating Teacher Impacts on Student Achievement:
An Experimental Evaluation,” Working Paper 14607, National Bureau of Economic Research,
2008.
, Jonah E. Rockoff, and Douglas O. Staiger, “What does certification tell us about teacher
effectiveness? Evidence from New York City,” Economics of Education Review, 27 (2008),
615 631.
Lennox, Annie and Dave Stewart, “Sisters Are Doin’ It for Themselves,” in Eurythmics: Be Yourself
Tonight, Dave Stewart, ed. (RCA Records, 1985).
National Bureau of Economic Research, “Diversifying the Science and Engineering Work-
force: Women, Underrepresented Minorities, and Their Science and Engineering Careers,”
http://www.nber.org/sewp/events/2005.01.14/Agenda-1-14-05-WEB.htm (2005).
National Science Foundation, “Science and Engineering Degrees: 1966-2004,” Manuscript NSF 07-
307, National Science Foundation, Division of Science Resources Statistics, 2006.
Neumark, David and Rosella Gardecki, “Women Helping Women? Role Model and Mentoring Effects
on Female Ph.D. Students in Economics,” Journal of Human Resources, 33 (1998), 220–46.
Pope, Devin G. and Justin R. Sydnor, “A New Perspective on Stereotypical Gender Differences in
Test Scores,” The Journal of Economic Perspectives, 23 (2009). Forthcoming.
Rabe-Hesketh, Sophia and Anders Skrondal, Multilevel and Longitudinal Modeling Using Stata,
second ed. (College Station, TX: Stata Press, 2008).
Rivkin, Steven G., Eric A. Hanushek, and John F. Kain, “Teachers, Schools and Academic Achieve-
ment,” Econometrica, 73 (2005), 417–58.
Rothstein, Donna S, “Do Female Faculty Influence Female Students Educational and Labor Market
Attainments?,” Industrial and Labor Relations Review, 48 (1995), 515–30.
Spencer, Steven J., Claude M. Steele, and Diane M. Quinn, “Stereotype Threat and Womens Math
Performance,” Journal of Experimental Social Psychology, 35 (1999), 4–28.
Weinberger, Catherine J., “Race and Gender Wage Gaps in the Market for Recent College Gradu-
ates,” Industrial Relations, 37 (1998), 67–84.
21

, “Mathematical College Majors and the Gender Gap in Wages,” Industrial Relations, 38
(1999), 407–413.
, “Is Teaching More Girls More Math the Key to Higher Wages?,” in Squaring Up: Pol-
icy Strategies to Raise Womens Incomes in the U.S., Mary C. King, ed. (The University of
Michigan Press, 2001).
Xie, Yu and Kimberlee A. Shauman, Women in Science: Career Processes and Outcomes (Cam-
bridge, MA: Harvard University Press, 2003).
Zafar, Basit, “College Major Choice and the Gender Gap,” Working Paper 364, Federal Reserve
Bank of New York, 2009.
22

Figure I: Distribution of Academic Pre-treatment Measures by Gender
Notes: Figures represent the distribution of pre-Academy characteristics by student gender for the USAFA graduating classes of 2001-2008.
23

Figure II: Math and Science Courses: Distribution of Female Student Pre-treatment Characteristics
by Professor Gender
Notes: Figures represent the distribution of pre-Academy characteristics for female students by professor gender for the USAFA graduating classes of 2001-2008.
24
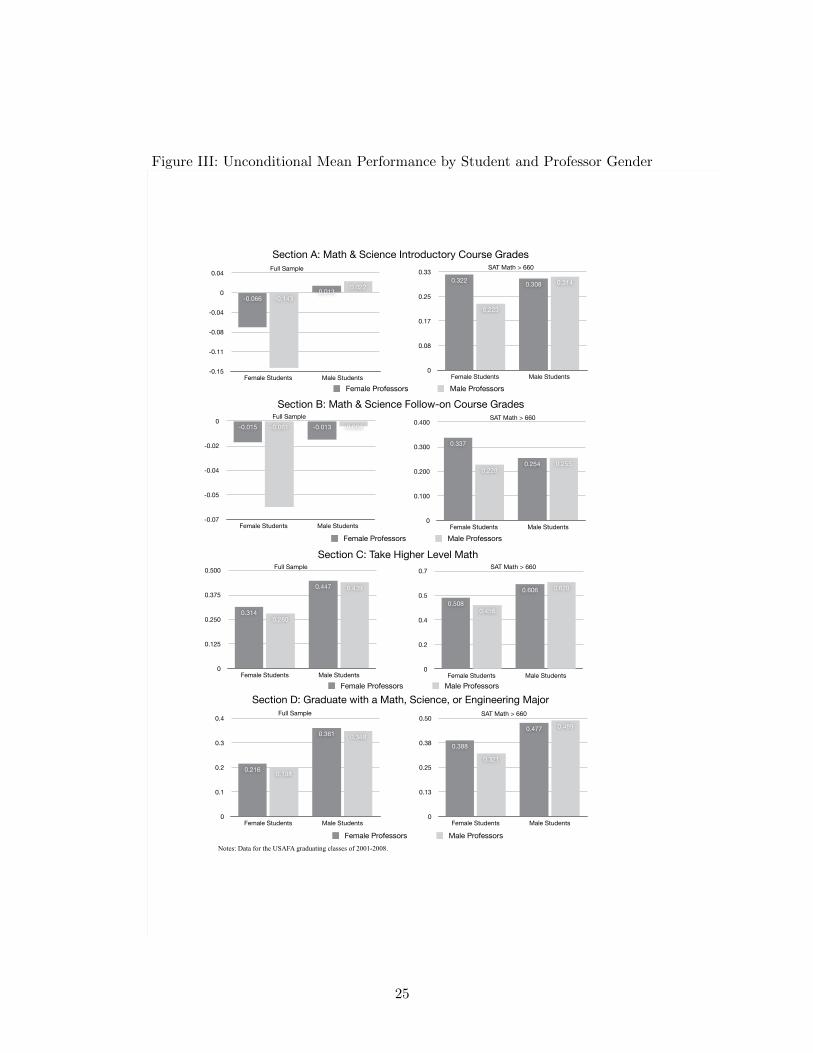
Figure III: Unconditional Mean Performance by Student and Professor Gender
!
Section A: Math & Science Introductory Course GradesSAT Math > 660Full Sample
Section B: Math & Science Follow-on Course Grades
Section C: Take Higher Level MathSAT Math > 660Full Sample
Section D: Graduate with a Math, Science, or Engineering Major
SAT Math > 660Full Sample
0
0.08
0.17
0.25
0.33
Female Students Male Students
0.314
0.223
0.3080.322
Female Professors Male Professors
-0.15
-0.11
-0.08
-0.04
0
0.04
Female Students Male Students
0.022
-0.1430.013
-0.066
SAT Math > 660Full Sample
0
0.100
0.200
0.300
0.400
Female Students Male Students
0.2550.228
0.254
0.337
-0.07
-0.05
-0.04
-0.02
0
Female Students Male Students
-0.004-0.061 -0.013-0.015
Female Professors Male Professors
0
0.13
0.25
0.38
0.50
Female Students Male Students
0.489
0.321
0.477
0.388
0
0.1
0.2
0.3
0.4
Female Students Male Students
0.348
0.198
0.361
0.216
Female Professors Male Professors
0
0.2
0.4
0.5
0.7
Female Students Male Students
0.620
0.456
0.606
0.508
Female Professors Male Professors
0
0.125
0.250
0.375
0.500
Female Students Male Students
0.439
0.280
0.447
0.314
Notes: Data for the USAFA graduating classes of 2001-2008.
25

Figure IV: Distribution of Professor Value-Added by Student and Professor Gender
Notes: Figures represent the distribution of professor value-added estimates (Bayes shrinkage) by student and professor gender in introductory math and science courses for the USAFA graduating classes of 2001-2008. .
26
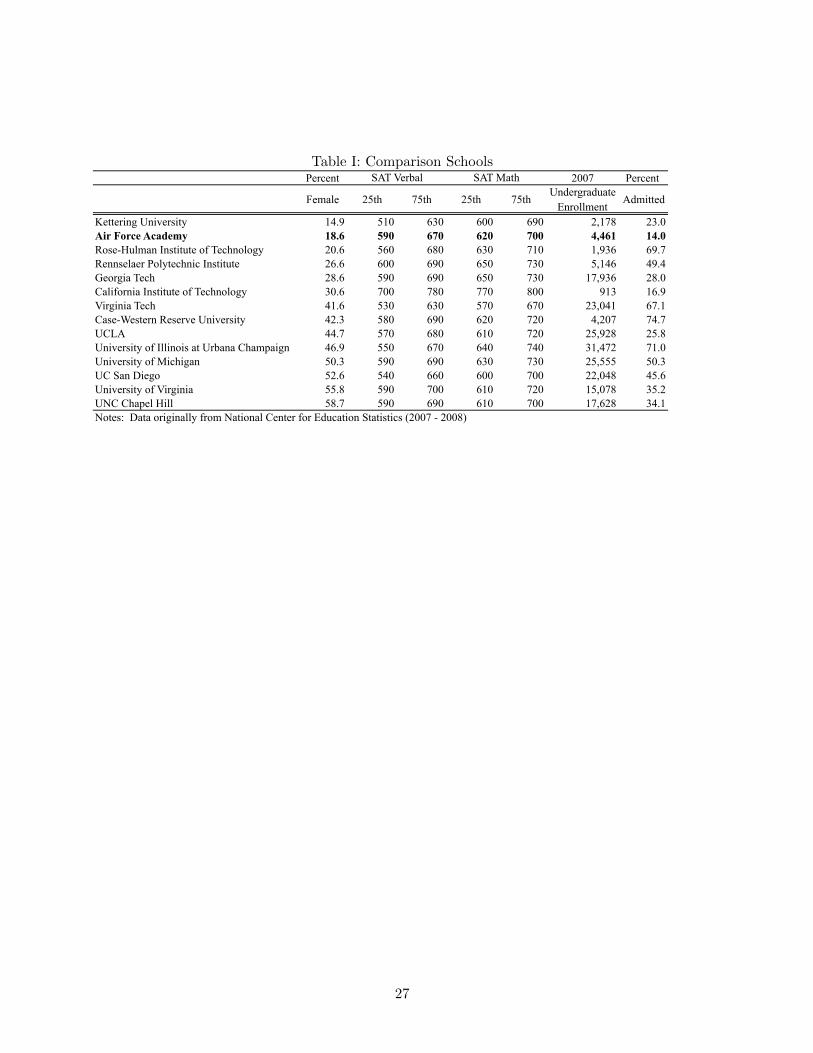
Table I: Comparison SchoolsPercent 2007 Percent
Female 25th 75th 25th 75thUndergraduate
EnrollmentAdmitted
Kettering University 14.9 510 630 600 690 2,178 23.0Air Force Academy 18.6 590 670 620 700 4,461 14.0Rose-Hulman Institute of Technology 20.6 560 680 630 710 1,936 69.7Rennselaer Polytechnic Institute 26.6 600 690 650 730 5,146 49.4Georgia Tech 28.6 590 690 650 730 17,936 28.0California Institute of Technology 30.6 700 780 770 800 913 16.9Virginia Tech 41.6 530 630 570 670 23,041 67.1Case-Western Reserve University 42.3 580 690 620 720 4,207 74.7UCLA 44.7 570 680 610 720 25,928 25.8University of Illinois at Urbana Champaign 46.9 550 670 640 740 31,472 71.0University of Michigan 50.3 590 690 630 730 25,555 50.3UC San Diego 52.6 540 660 600 700 22,048 45.6University of Virginia 55.8 590 700 610 720 15,078 35.2UNC Chapel Hill 58.7 590 690 610 700 17,628 34.1Notes: Data originally from National Center for Education Statistics (2007 - 2008)
SAT Verbal SAT Math
27
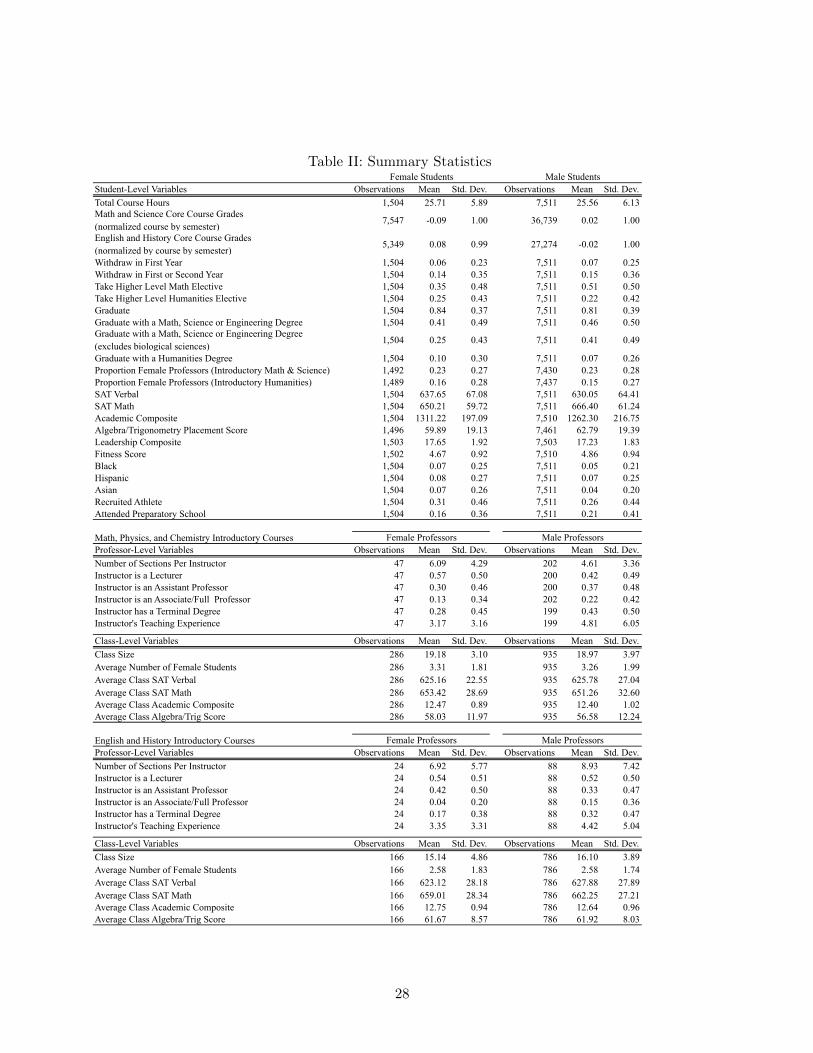
Table II: Summary Statistics
Student-Level Variables Observations Mean Std. Dev. Observations Mean Std. Dev.Total Course Hours 1,504 25.71 5.89 7,511 25.56 6.13Math and Science Core Course Grades (normalized course by semester)
7,547 -0.09 1.00 36,739 0.02 1.00
English and History Core Course Grades (normalized by course by semester)
5,349 0.08 0.99 27,274 -0.02 1.00
Withdraw in First Year 1,504 0.06 0.23 7,511 0.07 0.25Withdraw in First or Second Year 1,504 0.14 0.35 7,511 0.15 0.36Take Higher Level Math Elective 1,504 0.35 0.48 7,511 0.51 0.50Take Higher Level Humanities Elective 1,504 0.25 0.43 7,511 0.22 0.42Graduate 1,504 0.84 0.37 7,511 0.81 0.39Graduate with a Math, Science or Engineering Degree 1,504 0.41 0.49 7,511 0.46 0.50Graduate with a Math, Science or Engineering Degree (excludes biological sciences)
1,504 0.25 0.43 7,511 0.41 0.49
Graduate with a Humanities Degree 1,504 0.10 0.30 7,511 0.07 0.26Proportion Female Professors (Introductory Math & Science) 1,492 0.23 0.27 7,430 0.23 0.28Proportion Female Professors (Introductory Humanities) 1,489 0.16 0.28 7,437 0.15 0.27SAT Verbal 1,504 637.65 67.08 7,511 630.05 64.41SAT Math 1,504 650.21 59.72 7,511 666.40 61.24Academic Composite 1,504 1311.22 197.09 7,510 1262.30 216.75Algebra/Trigonometry Placement Score 1,496 59.89 19.13 7,461 62.79 19.39Leadership Composite 1,503 17.65 1.92 7,503 17.23 1.83Fitness Score 1,502 4.67 0.92 7,510 4.86 0.94Black 1,504 0.07 0.25 7,511 0.05 0.21Hispanic 1,504 0.08 0.27 7,511 0.07 0.25Asian 1,504 0.07 0.26 7,511 0.04 0.20Recruited Athlete 1,504 0.31 0.46 7,511 0.26 0.44Attended Preparatory School 1,504 0.16 0.36 7,511 0.21 0.41
Math, Physics, and Chemistry Introductory CoursesProfessor-Level Variables Observations Mean Std. Dev. Observations Mean Std. Dev.Number of Sections Per Instructor 47 6.09 4.29 202 4.61 3.36Instructor is a Lecturer 47 0.57 0.50 200 0.42 0.49Instructor is an Assistant Professor 47 0.30 0.46 200 0.37 0.48Instructor is an Associate/Full Professor 47 0.13 0.34 202 0.22 0.42Instructor has a Terminal Degree 47 0.28 0.45 199 0.43 0.50Instructor's Teaching Experience 47 3.17 3.16 199 4.81 6.05
Class-Level Variables Observations Mean Std. Dev. Observations Mean Std. Dev.Class Size 286 19.18 3.10 935 18.97 3.97Average Number of Female Students 286 3.31 1.81 935 3.26 1.99Average Class SAT Verbal 286 625.16 22.55 935 625.78 27.04Average Class SAT Math 286 653.42 28.69 935 651.26 32.60Average Class Academic Composite 286 12.47 0.89 935 12.40 1.02Average Class Algebra/Trig Score 286 58.03 11.97 935 56.58 12.24
English and History Introductory CoursesProfessor-Level Variables Observations Mean Std. Dev. Observations Mean Std. Dev.Number of Sections Per Instructor 24 6.92 5.77 88 8.93 7.42Instructor is a Lecturer 24 0.54 0.51 88 0.52 0.50Instructor is an Assistant Professor 24 0.42 0.50 88 0.33 0.47Instructor is an Associate/Full Professor 24 0.04 0.20 88 0.15 0.36Instructor has a Terminal Degree 24 0.17 0.38 88 0.32 0.47Instructor's Teaching Experience 24 3.35 3.31 88 4.42 5.04
Class-Level Variables Observations Mean Std. Dev. Observations Mean Std. Dev.Class Size 166 15.14 4.86 786 16.10 3.89Average Number of Female Students 166 2.58 1.83 786 2.58 1.74Average Class SAT Verbal 166 623.12 28.18 786 627.88 27.89Average Class SAT Math 166 659.01 28.34 786 662.25 27.21Average Class Academic Composite 166 12.75 0.94 786 12.64 0.96Average Class Algebra/Trig Score 166 61.67 8.57 786 61.92 8.03
Female Students
Female Professors
Male Students
Male Professors
Female Professors Male Professors
28

Table III: Randomness Check Regressions of Faculty Gender on Student Characteristics
Male & Female Female Male & Female Female Male & Female Female Male & Female FemaleSpecification 1 2 3 4 5 6 7 8
0.003 0.005 -0.001 0.022(0.008) (0.008) (0.012) (0.023)-0.005 -0.019 0.002 -0.003 -0.01 -0.046** -0.019 -0.038(0.006) (0.014) (0.008) (0.018) (0.008) (0.020) (0.011) (0.026)-0.001 -0.008 -0.003 -0.026 -0.009 0.059 -0.041 -0.038(0.009) (0.016) (0.014) (0.030) (0.016) (0.042) (0.030) (0.090)0.231 0.321 0.512 0.743 -0.256 -0.514 -0.253 -1.921*
(0.262) (0.450) (0.356) (0.579) (0.303) (0.648) (0.413) (1.055)0.068 0.083 0.06 0.061 0.07 0.103 0.063 -0.016
(0.064) (0.074) (0.063) (0.073) (0.075) (0.102) (0.087) (0.175)Observations 23,056 3,963 13,861 2,721 9,195 1,242 4,046 489P-Value: Joint significance of all individual covariates
0.626 0.210 0.714 0.676 0.419 0.135 0.684 0.021
Male & Female Female Male & Female Female Male & Female Female Male & Female FemaleSpecification 1 2 3 4 5 6 7 8
0.011 0.019* -0.002 0.002(0.009) (0.010) (0.014) (0.021)-0.008 -0.051** -0.016 -0.044** -0.002 -0.057** -0.02 -0.007(0.009) (0.019) (0.011) (0.021) (0.009) (0.025) (0.014) (0.031)0.007 -0.003 -0.004 0.008 0.003 0 -0.02 -0.032
(0.007) (0.018) (0.013) (0.023) (0.012) (0.036) (0.019) (0.073)0.372 0.710* 0.292 0.85 0.525 0.678 0.613 0.55
(0.289) (0.388) (0.319) (0.532) (0.390) (0.889) (0.535) (1.155)0.007 0.081 0.02 0.037 -0.008 0.158 0.041 -0.016
(0.024) (0.068) (0.031) (0.071) (0.029) (0.103) (0.048) (0.171)Observations 15,044 2,438 8,071 1,560 6,973 878 3,396 380P-Value: Joint significance of all individual covariates
0.362 0.145 0.116 0.245 0.731 0.441 0.797 0.223
SAT Math > 700 (75th pctile)
Academic Composite
Algebra/Trig Placement
Notes: Each specification represents results for a regression where the dependent variable is an indicator variable for female faculty. The SAT Verbal, SAT Math, Academic Composite, and Algebra/Trig Placement variables were divided by 100 prior to running the regression. For brevity, coefficients for indicators for black, Hispanic, Asian, recruited athlete, and attended a preparatory school are not shown. Standard errors are clustered at the professor level. * Significant at the 0.10 level, ** Significant at the 0.05 level, *** Significant at the 0.01 level.
Female Student
SAT Verbal
SAT Math
Academic Composite
Algebra/Trig Placement
NA
NA
All StudentsSAT Math <= 660
(median)SAT Math > 660
(median)SAT Math > 700
(75th pctile)
NA NA
All StudentsSAT Math <= 660
(median)SAT Math > 660
(median)
SAT Verbal
SAT Math
Female Student NA NA NA
NA
Panel A. Math and Science Courses
Panel B. Humanities Courses
29

Tab
leIV
:M
ath
an
dS
cien
ceIn
trod
uct
ory
Cou
rse
Pro
fess
orG
end
erE
ffec
tson
Init
ial
Cou
rse
Per
form
ance
Sam
ple
Spec
ific
atio
n1
23
45
67
8
Fem
ale
Pro
fess
or
-0.0
50*
(0.0
28)
-0.0
43
**
(0.0
20)
-0.0
50*
(0.0
29)
-0.0
51**
(0.0
22)
-0.0
52
(0.0
33)
-0.0
55
(0.0
47)
-0.0
28
(0.0
36)
-0.0
29
(0.0
57)
Fem
ale
Stu
den
t-0
.149***
(0.0
21)
NA
-0.1
47***
(0.0
26)
NA
-0.1
53***
(0.0
32)
NA
-0.1
62*
**
(0.0
43)
NA
Fem
ale
Stu
den
t * F
emal
e P
rofe
sso
r0.0
97**
(0.0
44)
0.1
39***
(0.0
34)
0.0
86*
(0.0
46)
0.1
56***
(0.0
36
)
0.1
15
(0.0
74)
0.0
80
(0.0
58)
0.1
72**
(0.0
79
)
0.1
70**
(0.0
68)
Indiv
idual
Fix
ed E
ffec
tsN
oY
esN
oY
esN
oY
esN
oY
es
Ob
serv
atio
ns
22,9
56
23,1
27
13,7
78
13,8
89
9,1
78
9,2
38
4,0
43
4,0
77
Dep
enden
t V
aria
ble
Mea
n/S
td D
ev
(Fem
ale
Stu
den
ts)
Dep
enden
t V
aria
ble
Mea
n/S
td D
ev
(Mal
e S
tuden
ts)
0.2
47
(0.9
25)
All
Stu
den
tsS
AT
Mat
h >
660
(med
ian)
SA
T M
ath >
700
(75th
pct
ile)
No
tes:
The
dep
enden
t var
iable
in
all
spec
ific
atio
ns
is t
he
norm
aliz
ed g
rade
in t
he
cours
e. * S
ignif
ican
t at
the
0.1
0 l
evel
, **
Sig
nif
ican
t at
the
0.0
5 l
evel
,
*** S
ign
ific
ant
at t
he
0.0
1 l
evel
. R
obust
sta
nd
ard e
rrors
in p
aren
thes
es a
re c
lust
ered
by i
nst
ruct
or.
Contr
ol
Var
iable
s: C
ours
e by s
emes
ter
fixed
eff
ects
, gra
duat
ion c
lass
fix
ed e
ffec
ts,
and c
ours
e ti
me
of
day
fix
ed f
ixed
eff
ects
. I
ndiv
idual
-lev
el S
AT
ver
bal
,
SA
T m
ath, ac
adem
ic c
om
po
site
, le
ader
ship
com
posi
te, fi
tnes
s sc
ore
, al
geb
ra/t
rig p
lace
men
t sc
ore
and i
ndic
ator
var
iable
s fo
r st
uden
ts w
ho
are
bla
ck,
His
pan
ic, A
sian
, fe
mal
e, r
ecru
ited
ath
lete
, an
d a
tten
ded
a p
rep
arat
ory
sch
ool.
In
troduct
ory
cours
e pro
fess
or-
level
aca
dem
ic r
ank d
um
mie
s, t
each
ing
exp
erie
nce
, an
d t
erm
inal
deg
ree
stat
us
dum
my.
0.5
02
(0.8
46)
SA
T M
ath <
= 6
60
(med
ian)
-0.2
91
(1.0
14)
-0.1
86
(0.9
84)
-0.1
22
(1.0
18)
0.0
26
(0.9
94)
0.3
21
(0.9
29)
0.4
20
(0.8
91)
30
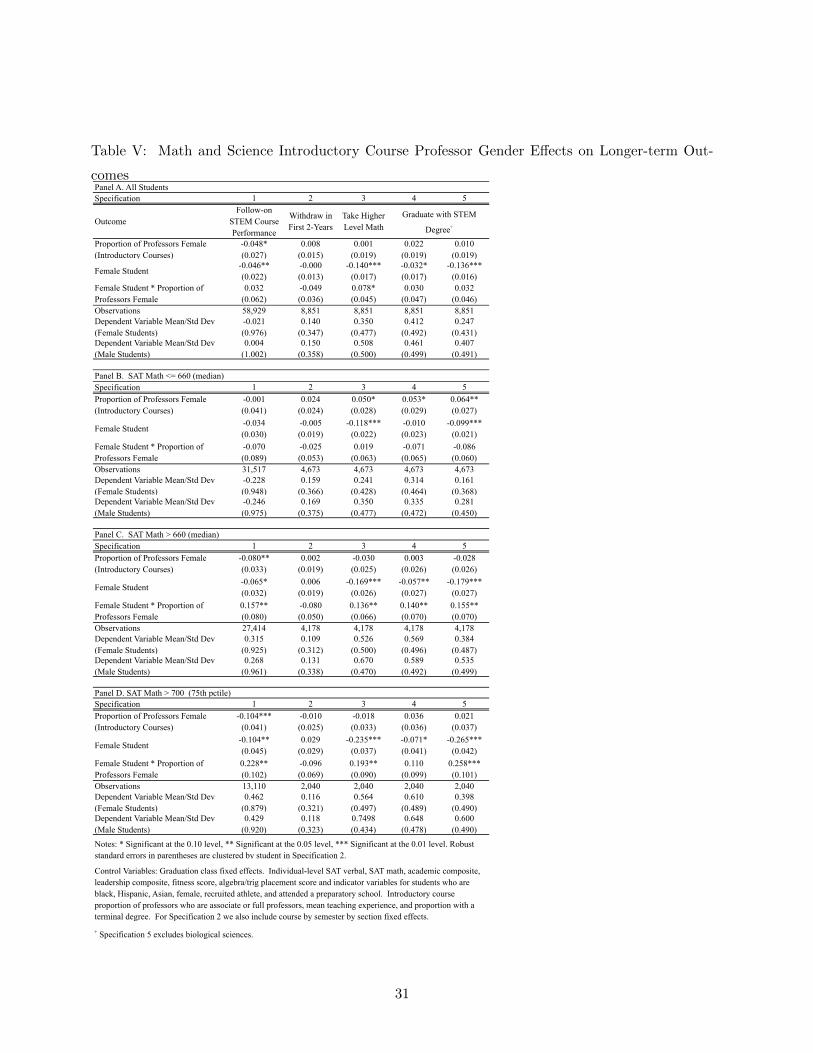
Table V: Math and Science Introductory Course Professor Gender Effects on Longer-term Out-
comes
Specification 1 2 3 4 5
OutcomeFollow-on
STEM Course Performance
Withdraw in First 2-Years
Take Higher Level Math
Proportion of Professors Female (Introductory Courses)
-0.048* (0.027)
0.008 (0.015)
0.001 (0.019)
0.022 (0.019)
0.010 (0.019)
Female Student-0.046** (0.022)
-0.000 (0.013)
-0.140*** (0.017)
-0.032* (0.017)
-0.136*** (0.016)
Female Student * Proportion of Professors Female
0.032 (0.062)
-0.049 (0.036)
0.078* (0.045)
0.030 (0.047)
0.032 (0.046)
Observations 58,929 8,851 8,851 8,851 8,851Dependent Variable Mean/Std Dev (Female Students)
-0.021 (0.976)
0.140 (0.347)
0.350 (0.477)
0.412 (0.492)
0.247 (0.431)
Dependent Variable Mean/Std Dev (Male Students)
0.004 (1.002)
0.150 (0.358)
0.508 (0.500)
0.461 (0.499)
0.407 (0.491)
Specification 1 2 3 4 5Proportion of Professors Female (Introductory Courses)
-0.001 (0.041)
0.024 (0.024)
0.050* (0.028)
0.053* (0.029)
0.064** (0.027)
Female Student-0.034 (0.030)
-0.005 (0.019)
-0.118*** (0.022)
-0.010 (0.023)
-0.099*** (0.021)
Female Student * Proportion of Professors Female
-0.070 (0.089)
-0.025 (0.053)
0.019 (0.063)
-0.071 (0.065)
-0.086 (0.060)
Observations 31,517 4,673 4,673 4,673 4,673Dependent Variable Mean/Std Dev (Female Students)
-0.228 (0.948)
0.159 (0.366)
0.241 (0.428)
0.314 (0.464)
0.161 (0.368)
Dependent Variable Mean/Std Dev (Male Students)
-0.246 (0.975)
0.169 (0.375)
0.350 (0.477)
0.335 (0.472)
0.281 (0.450)
Specification 1 2 3 4 5Proportion of Professors Female (Introductory Courses)
-0.080** (0.033)
0.002 (0.019)
-0.030 (0.025)
0.003 (0.026)
-0.028 (0.026)
Female Student-0.065* (0.032)
0.006 (0.019)
-0.169*** (0.026)
-0.057** (0.027)
-0.179*** (0.027)
Female Student * Proportion of Professors Female
0.157** (0.080)
-0.080 (0.050)
0.136** (0.066)
0.140** (0.070)
0.155** (0.070)
Observations 27,414 4,178 4,178 4,178 4,178Dependent Variable Mean/Std Dev (Female Students)
0.315 (0.925)
0.109 (0.312)
0.526 (0.500)
0.569 (0.496)
0.384 (0.487)
Dependent Variable Mean/Std Dev (Male Students)
0.268 (0.961)
0.131 (0.338)
0.670 (0.470)
0.589 (0.492)
0.535 (0.499)
Specification 1 2 3 4 5Proportion of Professors Female (Introductory Courses)
-0.104*** (0.041)
-0.010 (0.025)
-0.018 (0.033)
0.036 (0.036)
0.021 (0.037)
Female Student-0.104** (0.045)
0.029 (0.029)
-0.235*** (0.037)
-0.071* (0.041)
-0.265*** (0.042)
Female Student * Proportion of Professors Female
0.228** (0.102)
-0.096 (0.069)
0.193** (0.090)
0.110 (0.099)
0.258*** (0.101)
Observations 13,110 2,040 2,040 2,040 2,040Dependent Variable Mean/Std Dev (Female Students)
0.462 (0.879)
0.116 (0.321)
0.564 (0.497)
0.610 (0.489)
0.398 (0.490)
Dependent Variable Mean/Std Dev (Male Students)
0.429 (0.920)
0.118 (0.323)
0.7498 (0.434)
0.648 (0.478)
0.600 (0.490)
+ Specification 5 excludes biological sciences.
Panel C. SAT Math > 660 (median)
Panel D. SAT Math > 700 (75th pctile)
Graduate with STEM
Degree+
Notes: * Significant at the 0.10 level, ** Significant at the 0.05 level, *** Significant at the 0.01 level. Robust standard errors in parentheses are clustered by student in Specification 2.
Panel A. All Students
Control Variables: Graduation class fixed effects. Individual-level SAT verbal, SAT math, academic composite, leadership composite, fitness score, algebra/trig placement score and indicator variables for students who are black, Hispanic, Asian, female, recruited athlete, and attended a preparatory school. Introductory course proportion of professors who are associate or full professors, mean teaching experience, and proportion with a terminal degree. For Specification 2 we also include course by semester by section fixed effects.
Panel B. SAT Math <= 660 (median)
31

Table VI: English and History Introductory Course Professor Gender Effects
OutcomeInitial Course Performance
Follow-on Course
Performance
Take Higher Level
Humanities
Graduate with Humanities
Degree
Take Higher Level Math
Graduate with STEM
Degree+
Panel A. All Students 1 2 3 4 5 6Proportion of Professors Female (Introductory Courses)
-0.113* (0.064)
-0.008 (0.038)
-0.016 (0.018)
-0.002 (0.012)
0.008 (0.019)
-0.007 (0.020)
Female Student-0.018 (0.036)
0.037 (0.025)
0.020 (0.014)
0.019** (0.009)
-0.110*** (0.015)
-0.123*** (0.015)
Female Student * Proportion of Professors Female
0.028 (0.074)
-0.098 (0.078)
0.019 (0.042)
-0.009 (0.027)
-0.087* (0.045)
-0.043 (0.045)
Observations 15,044 13,661 8,720 8,720 8,720 8,720
Panel B. SAT Math <= 660 (Median) 1 2 3 4 5 6Proportion of Professors Female (Introductory Courses)
-0.107 (0.065)
-0.014 (0.050)
-0.041 (0.028)
0.004 (0.018)
0.028 (0.027)
-0.076 (0.055)
Female Student-0.064 (0.040)
-0.018 (0.032)
0.026 (0.019)
0.019 (0.012)
-0.094*** (0.019)
-0.109*** (0.018)
Female Student * Proportion of Professors Female
-0.009 (0.008)
-0.027 (0.102)
0.015 (0.059)
-0.0004 (0.038)
-0.122** (0.058)
0.076 (0.055)
Observations 8,071 7,244 4,619 4,619 4,619 4,619
Panel C. SAT Math > 660 (Median) 1 2 3 4 5 6Proportion of Professors Female (Introductory Courses)
-0.115* (0.068)
-0.028 (0.054)
0.001 (0.023)
-0.009 (0.015)
-0.016 (0.028)
-0.024 (0.030)
Female Student0.050
(0.045)0.077* (0.041)
0.011 (0.019)
0.019 (0.013)
-0.135*** (0.023)
-0.145*** (0.025)
Female Student * Proportion of Professors Female
0.086 (0.083)
-0.102 (0.122)
0.047 (0.058)
-0.024 (0.038)
-0.048 (0.070)
-0.005 (0.075)
Observations 6,973 6,417 4,101 4,101 4,101 4,101
Panel D. SAT Math > 700 (75th pctile) 1 2 3 4 5 6Proportion of Professors Female (Introductory Courses)
-0.101 (0.073)
-0.087 (0.073)
0.005 (0.030)
-0.007 (0.019)
-0.017 (0.037)
-0.026 (0.042)
Female Student0.021
(0.052)0.110* (0.061)
0.007 (0.027)
-0.0003 (0.017)
-0.187*** (0.034)
-0.209*** (0.038)
Female Student * Proportion of Professors Female
0.083 (0.104)
-0.137 (0.177)
0.101 (0.079)
0.048 (0.048)
-0.026 (0.097)
0.038 (0.109)
Observations 3,396 3,155 1,997 1,997 1,997 1,997
+ Excludes biological sciences.
Notes: * Significant at the 0.10 level, ** Significant at the 0.05 level, *** Significant at the 0.01 level. For Specification 1standard errors are clustered by professor. For Specification 2 standard errors are clustered by student.
Control Variables: Graduation class fixed effects. Individual-level SAT verbal, SAT math, academic composite, leadership composite, fitness score, algebra/trig placement score and indicator variables for students who are black, Hispanic, Asian, female, recruited athlete, and attended a preparatory school. For Specifications 1 and 2 we control for the academic rank, teaching experience, and terminal degree status of the professor. For Specifications 3-5 we control for the introductory course proportion of professors who are associate or full professors, mean teaching experience, and proportion with a terminal degree. For Specification 1 we include a course by semester fixed effect. For Specification 2 we include course by semester by section fixed effects.
32
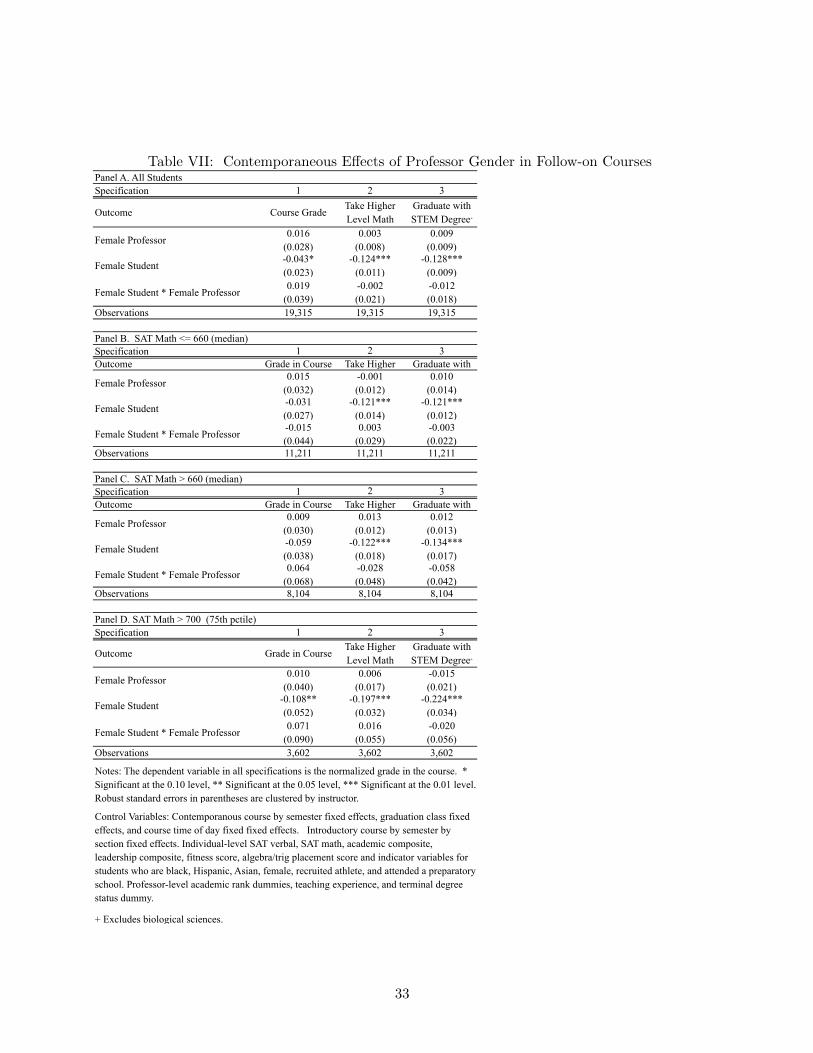
Table VII: Contemporaneous Effects of Professor Gender in Follow-on CoursesPanel A. All StudentsSpecification 1 2 3
Outcome Course GradeTake Higher Level Math
Graduate with STEM Degree+
Female Professor0.016
(0.028)0.003
(0.008)0.009
(0.009)
Female Student-0.043* (0.023)
-0.124*** (0.011)
-0.128*** (0.009)
Female Student * Female Professor0.019
(0.039)-0.002 (0.021)
-0.012 (0.018)
Observations 19,315 19,315 19,315
Panel B. SAT Math <= 660 (median)Specification 1 2 3Outcome Grade in Course Take Higher Graduate with
Female Professor0.015
(0.032)-0.001 (0.012)
0.010 (0.014)
Female Student-0.031 (0.027)
-0.121*** (0.014)
-0.121*** (0.012)
Female Student * Female Professor-0.015 (0.044)
0.003 (0.029)
-0.003 (0.022)
Observations 11,211 11,211 11,211
Panel C. SAT Math > 660 (median)Specification 1 2 3Outcome Grade in Course Take Higher Graduate with
Female Professor0.009
(0.030)0.013
(0.012)0.012
(0.013)
Female Student-0.059 (0.038)
-0.122*** (0.018)
-0.134*** (0.017)
Female Student * Female Professor0.064
(0.068)-0.028 (0.048)
-0.058 (0.042)
Observations 8,104 8,104 8,104
Specification 1 2 3
Outcome Grade in CourseTake Higher Level Math
Graduate with STEM Degree+
Female Professor0.010
(0.040)0.006
(0.017)-0.015 (0.021)
Female Student-0.108** (0.052)
-0.197*** (0.032)
-0.224*** (0.034)
Female Student * Female Professor0.071
(0.090)0.016
(0.055)-0.020 (0.056)
Observations 3,602 3,602 3,602
+ Excludes biological sciences.
Control Variables: Contemporanous course by semester fixed effects, graduation class fixed effects, and course time of day fixed fixed effects. Introductory course by semester by section fixed effects. Individual-level SAT verbal, SAT math, academic composite, leadership composite, fitness score, algebra/trig placement score and indicator variables for students who are black, Hispanic, Asian, female, recruited athlete, and attended a preparatory school. Professor-level academic rank dummies, teaching experience, and terminal degree status dummy.
Panel D. SAT Math > 700 (75th pctile)
Notes: The dependent variable in all specifications is the normalized grade in the course. * Significant at the 0.10 level, ** Significant at the 0.05 level, *** Significant at the 0.01 level. Robust standard errors in parentheses are clustered by instructor.
33
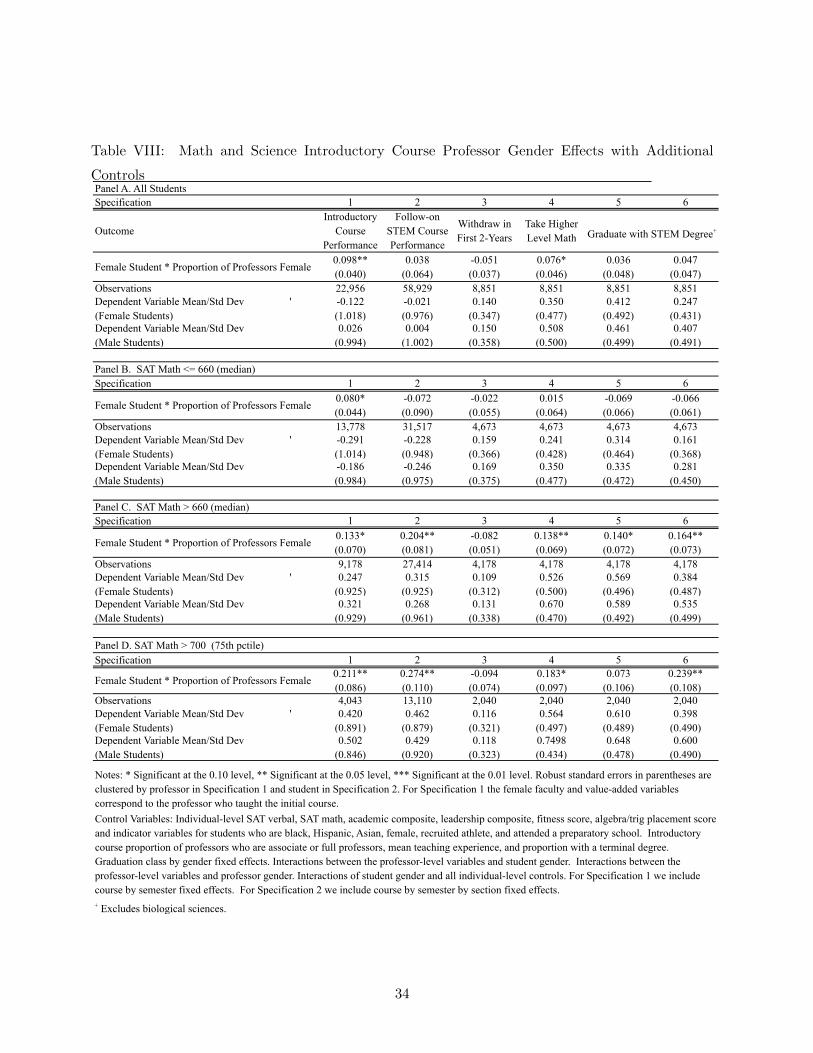
Table VIII: Math and Science Introductory Course Professor Gender Effects with Additional
Controls
Specification 1 2 3 4 5 6
OutcomeIntroductory
Course Performance
Follow-on STEM Course Performance
Withdraw in First 2-Years
Take Higher Level Math
Female Student * Proportion of Professors Female0.098** (0.040)
0.038 (0.064)
-0.051 (0.037)
0.076* (0.046)
0.036 (0.048)
0.047 (0.047)
Observations 22,956 58,929 8,851 8,851 8,851 8,851Dependent Variable Mean/Std Dev ' (Female Students)
-0.122 (1.018)
-0.021 (0.976)
0.140 (0.347)
0.350 (0.477)
0.412 (0.492)
0.247 (0.431)
Dependent Variable Mean/Std Dev (Male Students)
0.026 (0.994)
0.004 (1.002)
0.150 (0.358)
0.508 (0.500)
0.461 (0.499)
0.407 (0.491)
Specification 1 2 3 4 5 6
Female Student * Proportion of Professors Female0.080* (0.044)
-0.072 (0.090)
-0.022 (0.055)
0.015 (0.064)
-0.069 (0.066)
-0.066 (0.061)
Observations 13,778 31,517 4,673 4,673 4,673 4,673Dependent Variable Mean/Std Dev ' (Female Students)
-0.291 (1.014)
-0.228 (0.948)
0.159 (0.366)
0.241 (0.428)
0.314 (0.464)
0.161 (0.368)
Dependent Variable Mean/Std Dev (Male Students)
-0.186 (0.984)
-0.246 (0.975)
0.169 (0.375)
0.350 (0.477)
0.335 (0.472)
0.281 (0.450)
Specification 1 2 3 4 5 6
Female Student * Proportion of Professors Female0.133* (0.070)
0.204** (0.081)
-0.082 (0.051)
0.138** (0.069)
0.140* (0.072)
0.164** (0.073)
Observations 9,178 27,414 4,178 4,178 4,178 4,178Dependent Variable Mean/Std Dev ' (Female Students)
0.247 (0.925)
0.315 (0.925)
0.109 (0.312)
0.526 (0.500)
0.569 (0.496)
0.384 (0.487)
Dependent Variable Mean/Std Dev (Male Students)
0.321 (0.929)
0.268 (0.961)
0.131 (0.338)
0.670 (0.470)
0.589 (0.492)
0.535 (0.499)
Specification 1 2 3 4 5 6
Female Student * Proportion of Professors Female0.211** (0.086)
0.274** (0.110)
-0.094 (0.074)
0.183* (0.097)
0.073 (0.106)
0.239** (0.108)
Observations 4,043 13,110 2,040 2,040 2,040 2,040Dependent Variable Mean/Std Dev ' (Female Students)
0.420 (0.891)
0.462 (0.879)
0.116 (0.321)
0.564 (0.497)
0.610 (0.489)
0.398 (0.490)
Dependent Variable Mean/Std Dev (Male Students)
0.502 (0.846)
0.429 (0.920)
0.118 (0.323)
0.7498 (0.434)
0.648 (0.478)
0.600 (0.490)
Control Variables: Individual-level SAT verbal, SAT math, academic composite, leadership composite, fitness score, algebra/trig placement score and indicator variables for students who are black, Hispanic, Asian, female, recruited athlete, and attended a preparatory school. Introductory course proportion of professors who are associate or full professors, mean teaching experience, and proportion with a terminal degree. Graduation class by gender fixed effects. Interactions between the professor-level variables and student gender. Interactions between the professor-level variables and professor gender. Interactions of student gender and all individual-level controls. For Specification 1 we include course by semester fixed effects. For Specification 2 we include course by semester by section fixed effects.
Panel D. SAT Math > 700 (75th pctile)
+ Excludes biological sciences.
Panel A. All Students
Graduate with STEM Degree+
Panel B. SAT Math <= 660 (median)
Panel C. SAT Math > 660 (median)
Notes: * Significant at the 0.10 level, ** Significant at the 0.05 level, *** Significant at the 0.01 level. Robust standard errors in parentheses are clustered by professor in Specification 1 and student in Specification 2. For Specification 1 the female faculty and value-added variables correspond to the professor who taught the initial course.
34

Tab
leIX
:M
ath
an
dS
cien
ceIn
trod
uct
ory
Cou
rse
Pro
fess
orV
alu
e-A
dd
edE
ffec
tsby
Stu
den
tG
end
erSa
mpl
e
Out
com
eIn
trodu
ctor
y C
ours
e Pe
rfor
man
ce
Fol
low
-on
STEM
C
ours
e Pe
rfor
man
ce
Take
Hig
her
Leve
l Mat
h
Gra
duat
e w
ith S
TEM
D
egre
e
Intro
duct
ory
Cou
rse
Perf
orm
ance
Fol
low
-on
STEM
C
ours
e Pe
rfor
man
ce
Take
Hig
her
Leve
l Mat
h
Gra
duat
e w
ith S
TEM
D
egre
e
Spec
ifica
tion
12
34
12
34
Fem
ale
Stud
ent C
oeffi
cien
ts
Fe
mal
e St
uden
t * P
ropo
rtion
of P
rofe
ssor
s Fem
ale
0.07
9**
(0.0
38)
0.02
9
(0
.063
)0.
084*
(0
.046
)0.
041
(0.0
46)
0.06
7
(0
.043
)-0
.060
(0
.089
)0.
027
(0.0
63)
-0.0
82
(0.0
60)
M
ean
Initi
al C
ours
e Pr
ofes
sor V
alue
-Add
ed fo
r Fem
ale
Stud
ents
0.04
0**
(0.0
19)
-0.0
13
(0
.025
)-0
.045
**
(0
.020
)-0
.013
(0.0
20)
0.02
8
(0
.022
)-0
.021
(0.0
34)
-0.0
47*
(0
.026
)-0
.015
(0.0
25)
M
ean
Initi
al C
ours
e Pr
ofes
sor V
alue
-Add
ed fo
r Mal
e St
uden
ts0.
044*
**
(0
.015
)0.
009
(0.2
5)0.
014
(0.0
18)
0.02
4
(0
.018
)0.
043*
**
(0
.016
)0.
032
(0.0
33)
0.01
9
(0
.023
)0.
016
(0.0
22)
Mal
e St
uden
t Coe
ffici
ents
M
ean
Prop
ortio
n of
Pro
fess
ors F
emal
e-0
.030
**
(0
.014
)-0
.049
*
(0
.027
)0.
003
(0.0
19)
0.01
2
(0
.019
)-0
.029
(0.0
19)
-0.0
06
(0.0
41)
0.04
8*
(0
.028
)0.
063*
*
(0
.027
)
M
ean
Initi
al C
ours
e Pr
ofes
sor V
alue
-Add
ed fo
r Fem
ale
Stud
ents
0.01
3*
(0
.007
)0.
010
(0.0
12)
0.00
4
(0.0
08)
-0.0
06
(0
.008
)0.
011
(0.0
10)
0.02
5
(0
.018
)0.
002
(0
.013
)-0
.002
(0.0
11)
M
ean
Initi
al C
ours
e Pr
ofes
sor V
alue
-Add
ed fo
r Mal
e St
uden
ts0.
080*
**
(0.0
08)
-0.0
16
(0.0
11)
0.00
04
(0.0
08)
0.00
1
(0
.008
)0.
078*
**
(0.0
10)
-0.0
20
(0
.017
)-0
.006
(0
.012
)-0
.002
(0
.011
)O
bser
vatio
ns22
,342
58,4
938,
770
8,77
013
,433
31,4
904,
668
4,66
8
Sam
ple
Spec
ifica
tion
12
34
12
34
Fem
ale
Stud
ent C
oeffi
cien
ts
Fe
mal
e St
uden
t * P
ropo
rtion
of P
rofe
ssor
s Fem
ale
0.10
6
(0
.069
)0.
137*
(0.0
81)
0.14
4**
(0.0
68)
0.17
9**
(0.0
72)
0.15
7**
(0.0
76)
0.21
5**
(0.1
06)
0.21
6**
(0.0
93)
0.29
4***
(0
.103
)
M
ean
Initi
al C
ours
e Pr
ofes
sor V
alue
-Add
ed fo
r Fem
ale
Stud
ents
0.06
2**
(0.0
29)
-0.0
17
(0
.033
)-0
.045
(0.0
30)
-0.0
10
(0.0
32)
0.03
4
(0
.035
)0.
020
(0
.047
)-0
.071
*
(0.0
41)
-0.0
08
(0.0
45)
M
ean
Initi
al C
ours
e Pr
ofes
sor V
alue
-Add
ed fo
r Mal
e St
uden
ts0.
052*
(0.0
29)
-0.0
14
(0
.033
)0.
011
(0.0
28)
0.03
8
(0.0
29)
0.04
9
(0
.040
)-0
.023
(0
.046
)0.
019
(0.0
39)
0.07
6
(0.0
43)
Mal
e St
uden
t Coe
ffici
ents
M
ean
Prop
ortio
n of
Pro
fess
ors F
emal
e-0
.032
(0.0
21)
-0.0
77**
(0.0
33)
-0.0
28
(0.0
25)
-0.0
26
(0.0
27)
-0.0
08
(0
.028
)-0
.099
**
(0
.041
)-0
.018
(0
.033
)0.
024
(0.0
37)
M
ean
Initi
al C
ours
e Pr
ofes
sor V
alue
-Add
ed fo
r Fem
ale
Stud
ents
0.01
5*
(0
.011
)0.
001
(0.0
15)
0.00
3
(0.0
12)
-0.0
13
(0
.012
)-0
.014
(0.0
16)
-0.0
13
(0
.019
)0.
011
(0.0
15)
-0.0
15
(0
.017
)
M
ean
Initi
al C
ours
e Pr
ofes
sor V
alue
-Add
ed fo
r Mal
e St
uden
ts0.
081*
**
(0.0
12)
-0.0
10
(0.0
14)
0.01
0
(0
.011
)0.
006
(0.0
12)
0.09
0***
(0
.016
)0.
008
(0.0
18)
0.00
9
(0
.014
)0.
010
(0.0
16)
Obs
erva
tions
8,90
927
,003
4,10
24,
102
3,91
212
,806
1,98
41,
984
Pane
l A.
All
Stud
ents
Pane
l C. S
AT M
ath
> 66
0 (m
edia
n)
Pane
l B. S
AT M
ath
<= 6
60 (m
edia
n)
Pane
l D. S
AT M
ath
> 70
0 (7
5th
pctil
e)
Not
es: *
Sig
nific
ant a
t the
0.1
0 le
vel,
** S
igni
fican
t at t
he 0
.05
leve
l, **
* Si
gnifi
cant
at t
he 0
.01
leve
l.
Spec
ifica
tions
2-4
: Sta
ndar
d er
rors
are
clu
ster
ed b
y st
uden
t. C
ontro
l Var
iabl
es: G
radu
atio
n cl
ass f
ixed
effe
cts.
Indi
vidu
al-le
vel S
AT v
erba
l, SA
T m
ath,
aca
dem
ic c
ompo
site
, le
ader
ship
com
posi
te, f
itnes
s sco
re, a
lgeb
ra/tr
ig p
lace
men
t sco
re a
nd in
dica
tor v
aria
bles
for s
tude
nts w
ho a
re b
lack
, His
pani
c, A
sian
, fem
ale,
recr
uite
d at
hlet
e, a
nd a
ttend
ed a
pr
epar
ator
y sc
hool
. In
trodu
ctor
y co
urse
pro
porti
on o
f pro
fess
ors w
ho a
re a
ssoc
iate
or f
ull p
rofe
ssor
s, m
ean
teac
hing
exp
erie
nce,
and
pro
porti
on w
ith a
term
inal
deg
ree.
For
Sp
ecifi
catio
n 2
we
als
o in
clud
e co
urse
by
sem
este
r by
sect
ion
fixed
effe
cts.
Spec
ifica
tion
1: T
he fe
mal
e fa
culty
and
val
ue-a
dded
var
iabl
es c
orre
spon
d to
the
prof
esso
r who
taug
ht th
e in
itial
cou
rse.
Sta
ndar
d er
rors
are
clu
ster
ed b
y pr
ofes
sor.
Con
trol
varia
bles
: Cou
rse
by se
mes
ter f
ixed
effe
cts,
grad
uatio
n cl
ass f
ixed
effe
cts,
and
cour
se ti
me
of d
ay fi
xed
effe
cts.
Indi
vidu
al-le
vel S
AT v
erba
l, SA
T m
ath,
aca
dem
ic c
ompo
site
, le
ader
ship
com
posi
te, f
itnes
s sco
re, a
lgeb
ra/tr
ig p
lace
men
t sco
re a
nd in
dica
tor v
aria
bles
for s
tude
nts w
ho a
re b
lack
, His
pani
c, A
sian
, fem
ale,
recr
uite
d at
hlet
e, a
nd a
ttend
ed a
pr
epar
ator
y sc
hool
. In
trodu
ctor
y co
urse
pro
fess
or-le
vel a
cade
mic
rank
, tea
chin
g ex
perie
nce,
and
term
inal
deg
ree
stat
us.
35