condensed interim financial statements for the half year
TRANSCRIPT
for the half year ended 30 June 2021
CONDENSED INTERIM FINANCIAL STATEMENTS
01

Table of contents
Condensed interim consolidated statement of profit or loss and other comprehensive income 3
Condensed interim statements of financial position 4
Condensed interim consolidated statement of cash flows 5
Condensed interim statements of changes in equity 6
Notes to the condensed interim financial statements 7
Other Information Required by Listing Rule Appendix 7.2 14
01
Consolidated Income Statement
Note 30/6/2021 30/6/2020 Change
SGD'000 SGD'000 %
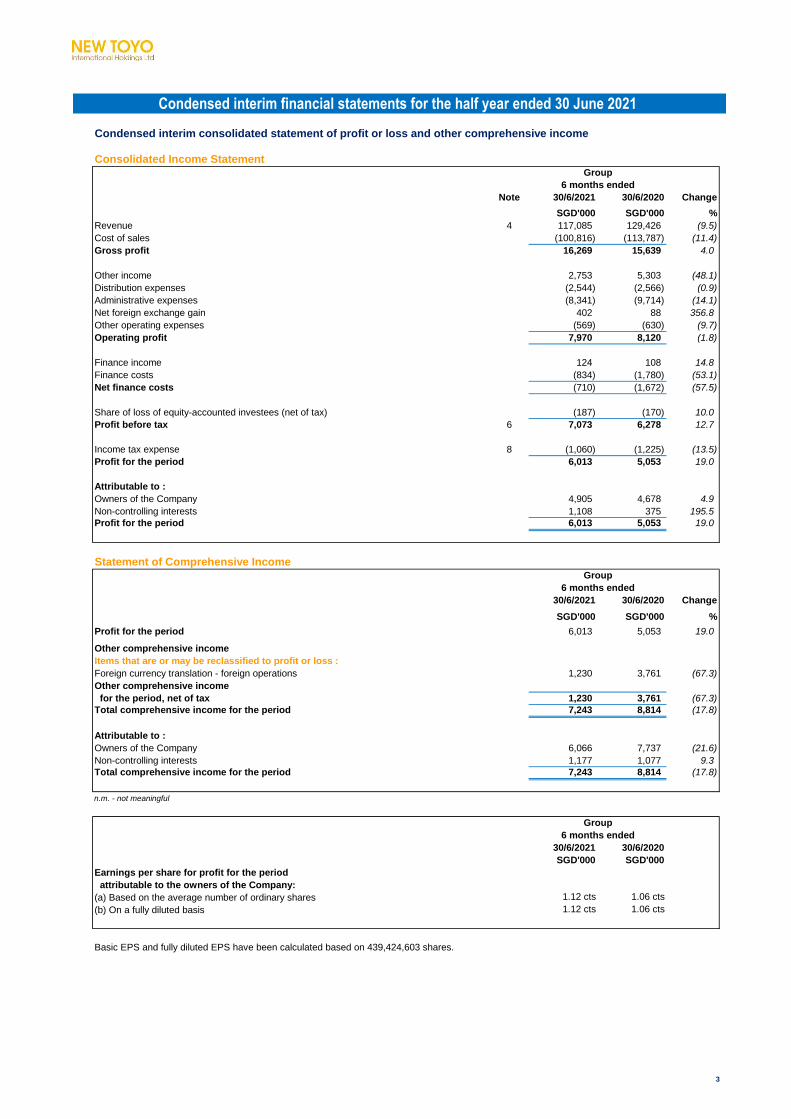
1 Revenue 4 117,085 129,426 (9.5)
Cost of sales (100,816) (113,787) (11.4)
2 Gross profit 16,269 15,639 4.0
3 Other income 2,753 5,303 (48.1)
4 Distribution expenses (2,544) (2,566) (0.9)
5 Administrative expenses (8,341) (9,714) (14.1)
6 Net foreign exchange gain 402 88 356.8
7 Other operating expenses (569) (630) (9.7)
Operating profit 7,970 8,120 (1.8)
8 Finance income 124 108 14.8
9 Finance costs (834) (1,780) (53.1)
Net finance costs (710) (1,672) (57.5)
10 Share of loss of equity-accounted investees (net of tax) (187) (170) 10.0
Profit before tax 6 7,073 6,278 12.7
11 Income tax expense 8 (1,060) (1,225) (13.5)
Profit for the period 6,013 5,053 19.0
Attributable to :
Owners of the Company 4,905 4,678 4.9
Non-controlling interests 1,108 375 195.5
Profit for the period 6,013 5,053 19.0
Statement of Comprehensive Income
30/6/2021 30/6/2020 Change
SGD'000 SGD'000 %
Profit for the period 6,013 5,053 19.0
Other comprehensive income
Items that are or may be reclassified to profit or loss :
Foreign currency translation - foreign operations 1,230 3,761 (67.3)
Other comprehensive income
for the period, net of tax 1,230 3,761 (67.3)
Total comprehensive income for the period 7,243 8,814 (17.8)
Attributable to :
Owners of the Company 6,066 7,737 (21.6)
Non-controlling interests 1,177 1,077 9.3
Total comprehensive income for the period 7,243 8,814 (17.8)
n.m. - not meaningful
30/6/2021 30/6/2020
SGD'000 SGD'000
Earnings per share for profit for the period
attributable to the owners of the Company:
(a) Based on the average number of ordinary shares 1.12 cts 1.06 cts
(b) On a fully diluted basis 1.12 cts 1.06 cts
Basic EPS and fully diluted EPS have been calculated based on 439,424,603 shares.
Condensed interim financial statements for the half year ended 30 June 2021
Condensed interim consolidated statement of profit or loss and other comprehensive income
Group
Group
6 months ended
6 months ended
Group
6 months ended
3

Condensed interim statements of financial position
Group Company
Note 30/6/2021 31/12/2020 30/6/2021 31/12/2020
SGD'000 SGD'000 SGD'000 SGD'000
Non-current assets
1 Property, plant and equipment 12 76,549 80,142 244 249
Right-of-use assets 12 10,011 11,425 69 13
3 Intangible assets and goodwill 23,978 24,370 - -
Investment properties 5,272 5,377 - -
Subsidiaries - - 142,870 142,635
2 Joint ventures 10,408 10,693 - -
Investment securities 11 981 979 878 878
Other investments 1,326 1,314 693 693
4 Deferred tax assets 1,652 1,615 - -
Trade and other receivables 316 647 452 452
130,493 136,562 145,206 144,920
Current assets
5 Inventories 36,297 35,847 - -
6 Trade and other receivables 65,606 55,889 13,566 14,170
7 Cash and cash equivalents 34,816 33,958 5,484 7,961
Contract assets 2,934 2,710 - -
139,653 128,404 19,050 22,131
Total assets 270,146 264,966 164,256 167,051
Current liabilities
8 Trade and other payables 50,306 38,660 37,430 35,715
9 Loans and borrowings 13 15,891 21,802 4,655 6,010
Contract liabilities 42 66 - -
10 Current tax liabilities 951 672 68 50
67,190 61,200 42,153 41,775
Non-current liabilities
Trade and other payables 976 908 - -
9 Loans and borrowings 13 12,529 16,717 95 59
Contract liabilities - - - -
Deferred tax liabilities 1,366 1,344 11 11
14,871 18,969 106 70
Total liabilities 82,061 80,169 42,259 41,845
Net assets 188,085 184,797 121,997 125,206
Equity attributable to owners
of the Company
Share capital 14 132,102 132,102 132,102 132,102
Reserves (8,094) (9,255) 77 77
Retained earnings 21,573 20,623 (10,182) (6,973)
145,581 143,470 121,997 125,206
Non-controlling interests 42,504 41,327 - -
Total Equity 188,085 184,797 121,997 125,206
Total equity and liabilities 270,146 264,966 164,256 167,051
4

30/6/2021 30/6/2020
SGD'000 SGD'000
Operating activities
7,073 6,278
Adjustments for :
Amortisation of other investments 3 3
Depreciation and amortisation 8,337 9,620
Net change in fair value of equity securities - 38
Dividend income from quoted securities (2) (2)
Gain on disposal of other investments - (1)
(Gain)/Loss on disposal of property, plant and equipment (118) 6
Gain on disposal of right-of-use assets (80) (12)
Finance income (124) (108)
Finance costs 834 1,780
Share of loss of equity-accounted investees (net of tax) 187 170
Unrealised loss on foreign exchange differences (924) (151)
Operating profit before working capital changes 15,186 17,621
Changes in working capital :
Inventories (452) 421
Contract assets (199) (918)
Trade and other receivables (12,158) (1,264)
Trade and other payables 11,553 3,329
Employee benefits 242 229
Cash flows from operations 14,172 19,418
Income taxes paid (893) (433)
Cash flows from operating activities 13,279 18,985
Investing activities
Dividends received from quoted securities 2 2
Interest received 124 108
Acquisition of property, plant and equipment (2,613) (2,362)
Refund of deposit upon the termination of proposed acquisition of shares in a company 2,673 -
201 13
Cash flows from/(used in) investing activities 387 (2,239)
Financing activities
Dividends paid to shareholders (3,955) -
Interest paid (834) (1,780)
Payment of lease liabilities (756) (660)
Proceeds from bank borrowings 4,061 4,934
Repayments of bank borrowings (12,884) (13,858)
Cash flows used in financing activities (14,368) (11,364)
(702) 5,382
33,958 34,688
Effect of exchange rate fluctuations on cash held 1,560 2,284
Cash and cash equivalents at end of period 34,816 42,354
Short-term deposits 10,764 9,431
Cash and bank balances 24,052 32,923
34,816 42,354
Condensed interim consolidated statement of cash flows
6 months ended
Proceeds from disposal of property, plant and equipment
Net (decrease)/increase in cash and cash equivalents
Cash and cash equivalents at beginning of period
Profit before tax
5

Non-
Share Capital Other Translation Retained controlling Total
Note capital reserve reserve reserve earnings Total interests Equity
SGD'000 SGD'000 SGD'000 SGD'000 SGD'000 SGD'000 SGD'000 SGD'000
Group
1At 1 January 2020 132,102 822 77 (8,396) 19,623 144,228 43,044 187,272
1c Total comprehensive income for the period - - - 3,059 4,678 7,737 1,077 8,814
At 30 June 2020 132,102 822 77 (5,337) 24,301 151,965 44,121 196,086
1 At 1 January 2021 132,102 822 215 (10,292) 20,623 143,470 41,327 184,797
1a Dividends paid 13 - - - - (3,955) (3,955) - (3,955)
1e Total comprehensive income for the period - - - 1,161 4,905 6,066 1,177 7,243
At 30 June 2021 132,102 822 215 (9,131) 21,573 145,581 42,504 188,085
Company
1At 1 January 2020 132,102 - 77 - (11,000) 121,179 - 121,179
1b - - - - 3,400 3,400 - 3,400
At 30 June 2020 132,102 - 77 - (7,600) 124,579 - 124,579
1At 1 January 2021 132,102 - 77 - (6,973) 125,206 - 125,206
2a Dividends paid 13 - - - - (3,955) (3,955) - (3,955)
1b Total comprehensive income for the period - - - - 746 746 - 746
At 30 June 2021 132,102 - 77 - (10,182) 121,997 - 121,997
Total comprehensive income for the period
Condensed interim statements of changes in equity
Other reserves
6

Notes to the condensed consolidated interim financial statements
1
2
2.1
2.2
2.3
3
These condensed interim consolidated financial statements as at and for the six months ended 30 June 2021 comprise the Company
and its subsidaries (collectively, the Group).
Seasonal operations
The Group’s businesses are not affected significantly by seasonal or cyclical factors during the financial period.
Corporate information
New Toyo International Holdings Ltd (the "Company") is a limited liability company incorporated and domiciled in Singapore and is
listed on the Singapore Exchange Securities Trading Limited (“SGX – ST”).
Summary of significant accounting policies
The principal activity of the Company is that of an investment holding company. The principal activities of the Group are (i) the
production and supply of specialty packaging materials including coated and laminated papers and boards for packaging industries;
(ii) the production and supply of gravure and offset printed materials for fast moving consumer goods and (iii) the trading business
including the sale and purchase of tissue paper materials and products.
Basis of preparation
The adoption of the above new or amended SFRS(I)s, SFRS (I) Interpretations and amendments to SFRS(I)s did not have any
significant impact on the condensed interim consolidated financial statements of the Group.
The condensed interim consolidated financial statements for the six months ended 30 June 2021 have been prepared in accordance
with Singapore Financial Reporting Standards (International) ("SFRS(I)") 1-34 Interim Financial Reporting issued by the Accounting
Standards Council Singapore. The condensed interim consolidated financial statements do not include all the information required for
a complete set of financial statements. However, selected explanatory notes are included to explain events and transactions that are
significant to an understanding of the changes in the Group’s financial position and performance of the Group since the annual
financial statements for the year ended 31 December 2020.
The accounting policies adopted by the Group in the preparation of the condensed interim consolidated financial statements are
consistent with those followed in the preparation of the Group's Annual Report for the financial year ended 31 December 2020, except
for the adoption of new and revised standards effective as of 1 January 2021.
Use of judgements and estimates
The preparation of the condensed interim consolidated financial statements in conformity with SFRS(I) requires management to
made judgements, estimates and assumptions that affect the application of accounting policies and the reported amounts of assets,
liabilities, income and expense. Actual results may differ from these estimates.
Estimates and underlying assumptions are reviewed on an ongoing basis. Revisions to accounting estimates are recognised in the
period in which the estimates are revised and in any future periods affected.
In the process of applying the Group's accounting policies, management is of the opinion that there is no significant judgement made
in applying accounting policies. The key sources of estimation uncertainty were the same as those that applied to the consolidated
financial statements as at and for the year ended 31 December 2020.
The accounting policies adopted are consistent with those of the previous financial year which were prepared in accordance with
SFRS(I)s, except for the adoption of new and amended standards as set out in Note 2.2.
The condensed interim consolidated financial statements are presented in Singapore dollar ("SGD" or "$") which is the Company's
functional currency and all values are rounded to the nearest thousand (SGD'000) except when otherwise indicated.
- Amendments to SFRS(I) 9, SFRS(I) 1-39, SFRS(I) 7, SFRS(I) 4, and SFRS(I) 16: Interest Rate Benchmark Reform - Phase 2
- Amendments to SFRS(I) 16 Leases - Covid-19-Related Rent Concessions beyond 30 June 2021
The following are the new or amended SFRS(I)s, SFRS (I) Interpretations and amendments to SFRS(I)s, that are relevant to the
Group:
7
4
4.1
6 months ended 30 June 2021
Printed
Specialty Cartons Tissue Investment
Papers and Labels Trading Paper holding Total
SGD'000 SGD'000 SGD'000 SGD'000 SGD'000 SGD'000
Revenue and Expenses
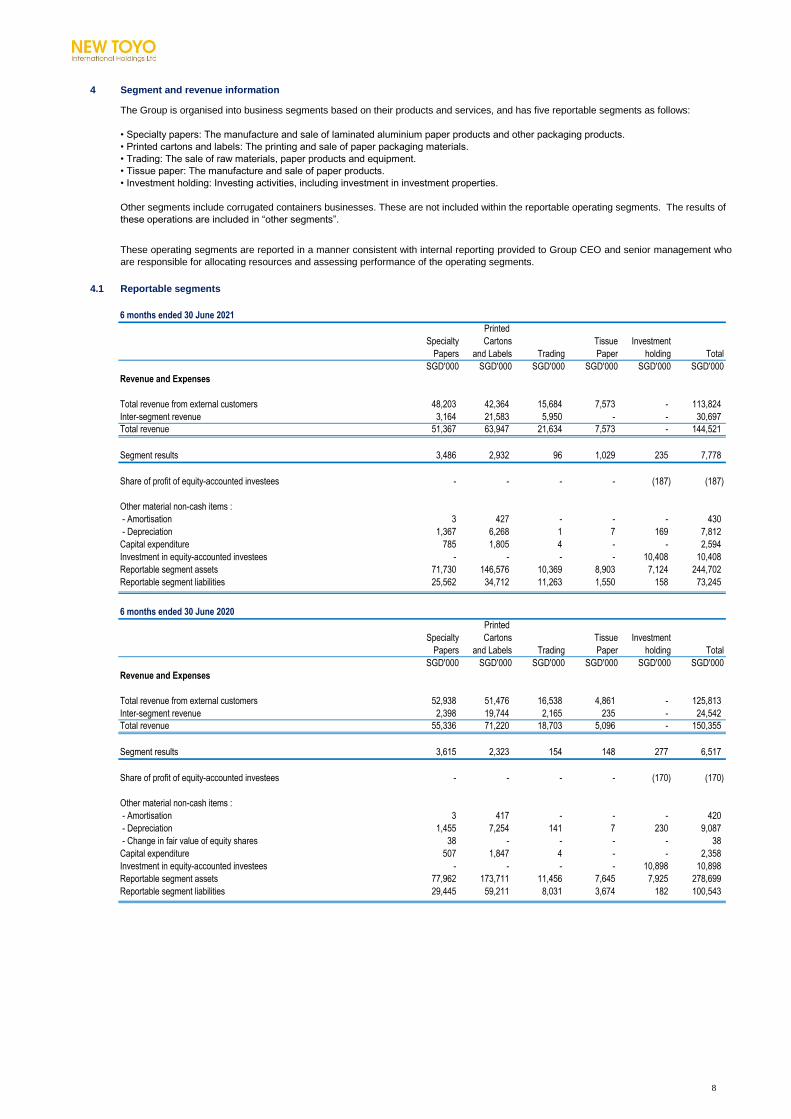
48,203 42,364 15,684 7,573 - 113,824
Inter-segment revenue 3,164 21,583 5,950 - - 30,697
Total revenue 51,367 63,947 21,634 7,573 - 144,521
Segment results 3,486 2,932 96 1,029 235 7,778
Share of profit of equity-accounted investees - - - - (187) (187)
Other material non-cash items :
- Amortisation 3 427 - - - 430
- Depreciation 1,367 6,268 1 7 169 7,812
Capital expenditure 785 1,805 4 - - 2,594
Investment in equity-accounted investees - - - - 10,408 10,408
Reportable segment assets 71,730 146,576 10,369 8,903 7,124 244,702
Reportable segment liabilities 25,562 34,712 11,263 1,550 158 73,245
6 months ended 30 June 2020
Printed
Specialty Cartons Tissue Investment
Papers and Labels Trading Paper holding Total
SGD'000 SGD'000 SGD'000 SGD'000 SGD'000 SGD'000
Revenue and Expenses
52,938 51,476 16,538 4,861 - 125,813
Inter-segment revenue 2,398 19,744 2,165 235 - 24,542
Total revenue 55,336 71,220 18,703 5,096 - 150,355
Segment results 3,615 2,323 154 148 277 6,517
Share of profit of equity-accounted investees - - - - (170) (170)
Other material non-cash items :
- Amortisation 3 417 - - - 420
- Depreciation 1,455 7,254 141 7 230 9,087
- Change in fair value of equity shares 38 - - - - 38
Capital expenditure 507 1,847 4 - - 2,358
Investment in equity-accounted investees - - - - 10,898 10,898
Reportable segment assets 77,962 173,711 11,456 7,645 7,925 278,699
Reportable segment liabilities 29,445 59,211 8,031 3,674 182 100,543
Reportable segments
Total revenue from external customers
Total revenue from external customers
Segment and revenue information
The Group is organised into business segments based on their products and services, and has five reportable segments as follows:
• Specialty papers: The manufacture and sale of laminated aluminium paper products and other packaging products.
• Printed cartons and labels: The printing and sale of paper packaging materials.
• Trading: The sale of raw materials, paper products and equipment.
• Tissue paper: The manufacture and sale of paper products.
• Investment holding: Investing activities, including investment in investment properties.
Other segments include corrugated containers businesses. These are not included within the reportable operating segments. The results of
these operations are included in “other segments”.
These operating segments are reported in a manner consistent with internal reporting provided to Group CEO and senior management who
are responsible for allocating resources and assessing performance of the operating segments.
8
4.1
Reconciliations of reportable segment revenues, profit or loss
6 months
ended
6 months
ended
30/6/2021 30/6/2020
SGD'000 SGD'000
Revenue
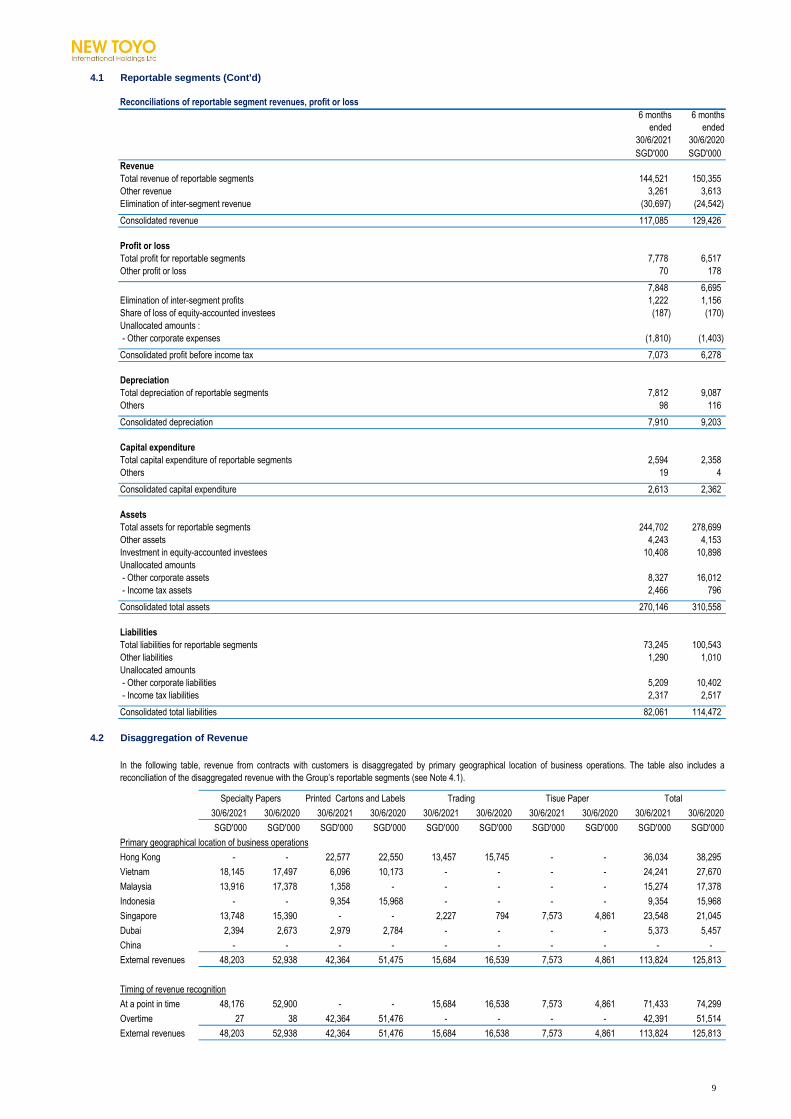
Total revenue of reportable segments 144,521 150,355
Other revenue 3,261 3,613
Elimination of inter-segment revenue (30,697) (24,542)
Consolidated revenue 117,085 129,426
Profit or loss
Total profit for reportable segments 7,778 6,517
Other profit or loss 70 178
7,848 6,695
Elimination of inter-segment profits 1,222 1,156
Share of loss of equity-accounted investees (187) (170)
Unallocated amounts :
- Other corporate expenses (1,810) (1,403)
Consolidated profit before income tax 7,073 6,278
Depreciation
Total depreciation of reportable segments 7,812 9,087
Others 98 116
Consolidated depreciation 7,910 9,203
Capital expenditure
Total capital expenditure of reportable segments 2,594 2,358
Others 19 4
Consolidated capital expenditure 2,613 2,362
Assets
Total assets for reportable segments 244,702 278,699
Other assets 4,243 4,153
Investment in equity-accounted investees 10,408 10,898
Unallocated amounts
- Other corporate assets 8,327 16,012
- Income tax assets 2,466 796
Consolidated total assets 270,146 310,558
Liabilities
Total liabilities for reportable segments 73,245 100,543
Other liabilities 1,290 1,010
Unallocated amounts
- Other corporate liabilities 5,209 10,402
- Income tax liabilities 2,317 2,517
Consolidated total liabilities 82,061 114,472
4.2
30/6/2021 30/6/2020 30/6/2021 30/6/2020 30/6/2021 30/6/2020 30/6/2021 30/6/2020 30/6/2021 30/6/2020
SGD'000 SGD'000 SGD'000 SGD'000 SGD'000 SGD'000 SGD'000 SGD'000 SGD'000 SGD'000
Primary geographical location of business operations
Hong Kong - - 22,577 22,550 13,457 15,745 - - 36,034 38,295
Vietnam 18,145 17,497 6,096 10,173 - - - - 24,241 27,670
Malaysia 13,916 17,378 1,358 - - - - - 15,274 17,378
Indonesia - - 9,354 15,968 - - - - 9,354 15,968
Singapore 13,748 15,390 - - 2,227 794 7,573 4,861 23,548 21,045
Dubai 2,394 2,673 2,979 2,784 - - - - 5,373 5,457
China - - - - - - - - - -
External revenues 48,203 52,938 42,364 51,475 15,684 16,539 7,573 4,861 113,824 125,813
Timing of revenue recognition
At a point in time 48,176 52,900 - - 15,684 16,538 7,573 4,861 71,433 74,299
Overtime 27 38 42,364 51,476 - - - - 42,391 51,514
External revenues 48,203 52,938 42,364 51,476 15,684 16,538 7,573 4,861 113,824 125,813
Disaggregation of Revenue
Specialty Papers Trading Tisue Paper TotalPrinted Cartons and Labels
Reportable segments (Cont'd)
In the following table, revenue from contracts with customers is disaggregated by primary geographical location of business operations. The table also includes a
reconciliation of the disaggregated revenue with the Group’s reportable segments (see Note 4.1).
9
5
Note 30/6/2021 31/12/2020 30/6/2021 31/12/2020
SGD'000 SGD'000 SGD'000 SGD'000
Financial assets
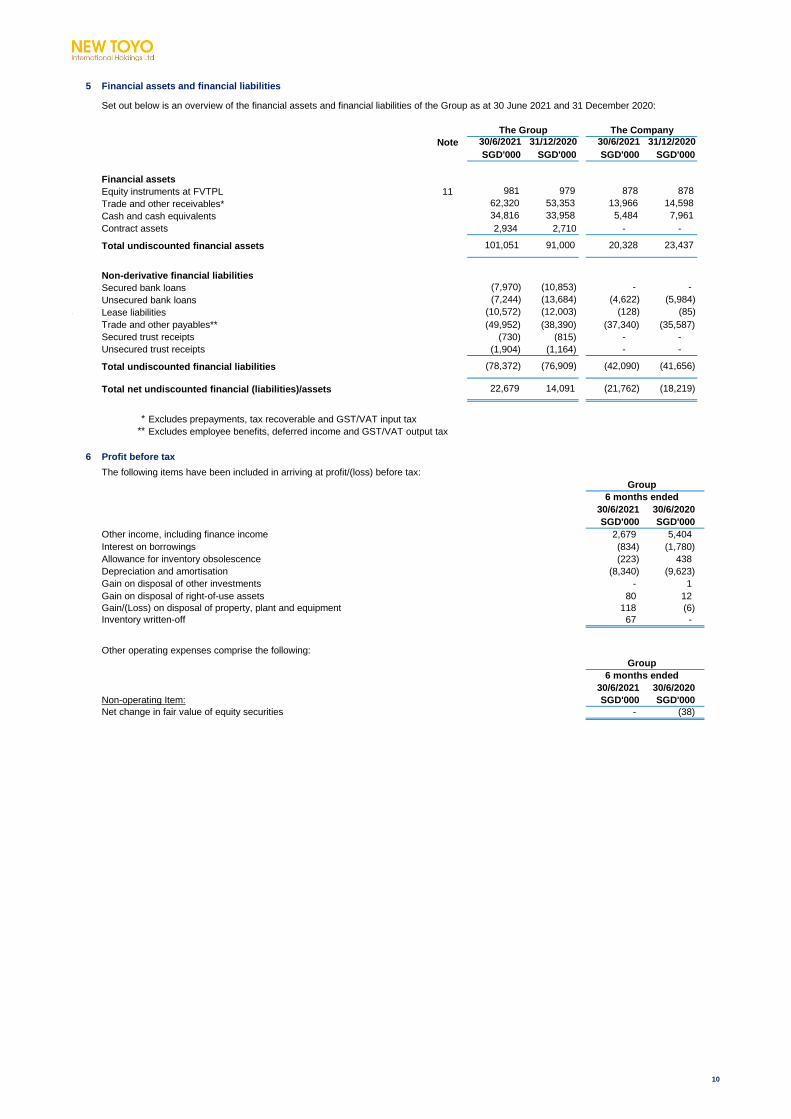
Equity instruments at FVTPL 11 981 979 878 878
Trade and other receivables* 62,320 53,353 13,966 14,598
Cash and cash equivalents 34,816 33,958 5,484 7,961
Contract assets 2,934 2,710 - -
Total undiscounted financial assets 101,051 91,000 20,328 23,437
Non-derivative financial liabilities
Secured bank loans (7,970) (10,853) - -
Unsecured bank loans (7,244) (13,684) (4,622) (5,984)
Lease liabilities (10,572) (12,003) (128) (85)
Trade and other payables** (49,952) (38,390) (37,340) (35,587)
Secured trust receipts (730) (815) - -
Unsecured trust receipts (1,904) (1,164) - -
Total undiscounted financial liabilities (78,372) (76,909) (42,090) (41,656)
Total net undiscounted financial (liabilities)/assets 22,679 14,091 (21,762) (18,219)
* Excludes prepayments, tax recoverable and GST/VAT input tax
** Excludes employee benefits, deferred income and GST/VAT output tax
6
The following items have been included in arriving at profit/(loss) before tax:
Note 30/6/2021 30/6/2020 30/6/2021 30/6/2020
SGD'000 SGD'000 SGD'000 SGD'000
Other income, including finance income (i) 2,679 5,398 2,679 5,404
Interest on borrowings (ii) (834) (1,780) (834) (1,780)
Allowance for inventory obsolescence (223) 438 (223) 438
Depreciation and amortisation (iii) (8,340) (9,623) (8,340) (9,623)
Gain on disposal of other investments - 1 - 1
Gain on disposal of right-of-use assets 80 12 80 12
Gain/(Loss) on disposal of property, plant and equipment 118 (6) 118 (6)
Inventory written-off 67 - 67 -
Other operating expenses comprise the following:
30/6/2021 30/6/2020 30/6/2021 30/6/2020
Non-operating Item: SGD'000 SGD'000 SGD'000 SGD'000
Net change in fair value of equity securities - (38) - (38)
Group Group
6 months ended 6 months ended
6 months ended
Group Group
6 months ended
Set out below is an overview of the financial assets and financial liabilities of the Group as at 30 June 2021 and 31 December 2020:
Financial assets and financial liabilities
The CompanyThe Group
Profit before tax
10

7
The following significant transactions took place between the Group and related parties at terms agreed between the parties:
30/6/2021 30/6/2020 30/6/2021 30/6/2020
SGD'000 SGD'000 SGD'000 SGD'000
Sale of raw materials/finished goods 5,444 1,444 5,444 1,444
Purchase of finished goods - (1,138) - (1,138)
Sale of scrap 408 777 408 777
Purchase of plant and equipment (2) - (2) -
Rental received/receivable - 48 - 48
Purchase of tissue papers (2) (3) (2) (3)
Professional fees paid/payable (3) (2) (3) (2)
Sale of raw materials/finished goods 446 43 446 43
Purchase of finished goods (264) -
Processing fee received/receivable 4 - 4 -
Rental received/receivable 12 - 12 -
Sales of plant and equipment 144 - 144 -
With a director of a subsidiary
Service fees paid/payable - (81) - (81)
With joint ventures
Sale of raw materials/finished goods 173 49 173 49
Purchase of raw materials (2) - (2) -
Conversion fees paid/payable - (266) - (266)
Management fee received/receivables 16 - 16 -
Rental paid/payable (25) (69) (25) (69)
Interest received/receivables - 4 - 4
8 Taxation
30/6/2021 30/6/2020 30/6/2021 30/6/2020
SGD'000 SGD'000 SGD'000 SGD'000
Current income tax
- Current year - - 1,060 1,099
- (Over)/Under provision in respect of previous years - - (3) 5
Deferred tax
- origination and reversal of temporary differences - - 13 124
- Recognition of tax effect of previously unrecognised tax losses (10) (3) (10) (3)
(10) (3) 1,060 1,225
9 Dividend
s
30/6/2021 30/6/2020 30/6/2021 30/6/2020
SGD'000 SGD'000 SGD'000 SGD'000
Ordinary dividends paid:
3,955 -
- - 3,955 -
Dividend per share (net of tax) in cents - 0.90 -
For the purposes of these interim financial statements, parties are considered to be related to the Group, if the Group has the ability, directly or
indirectly, to control the party or exercise significant influence over the party in making financial and operating decisions, or vice versa, or
where the Group and the party are subject to common control or common significant influence. Related parties may be individuals or other
entities.
Related party transactions
With companies in which certain directors and
substantial shareholders have significant influence
6 months ended 6 months ended
Group
6 months ended
Group
6 months ended
The Group calculates the period income tax expense using the tax rate that would be applicable to the expected total annual earnings. The
major components of income tax expense in the condensed interim consolidated statement of profit or loss are:
Group
6 months ended
Group
6 months ended
Tax-exempt (one-tier) final dividend of 0.90 cents per
ordinary share for the year 2020 (2019: nil cents)
With companies in which certain directors have
significant influence
With companies in which certain directors of
subsidiaries have significant influence
Group Group
11
10
As at As at As at As at
30/6/2021 31/12/2020 30/6/2021 31/12/2020
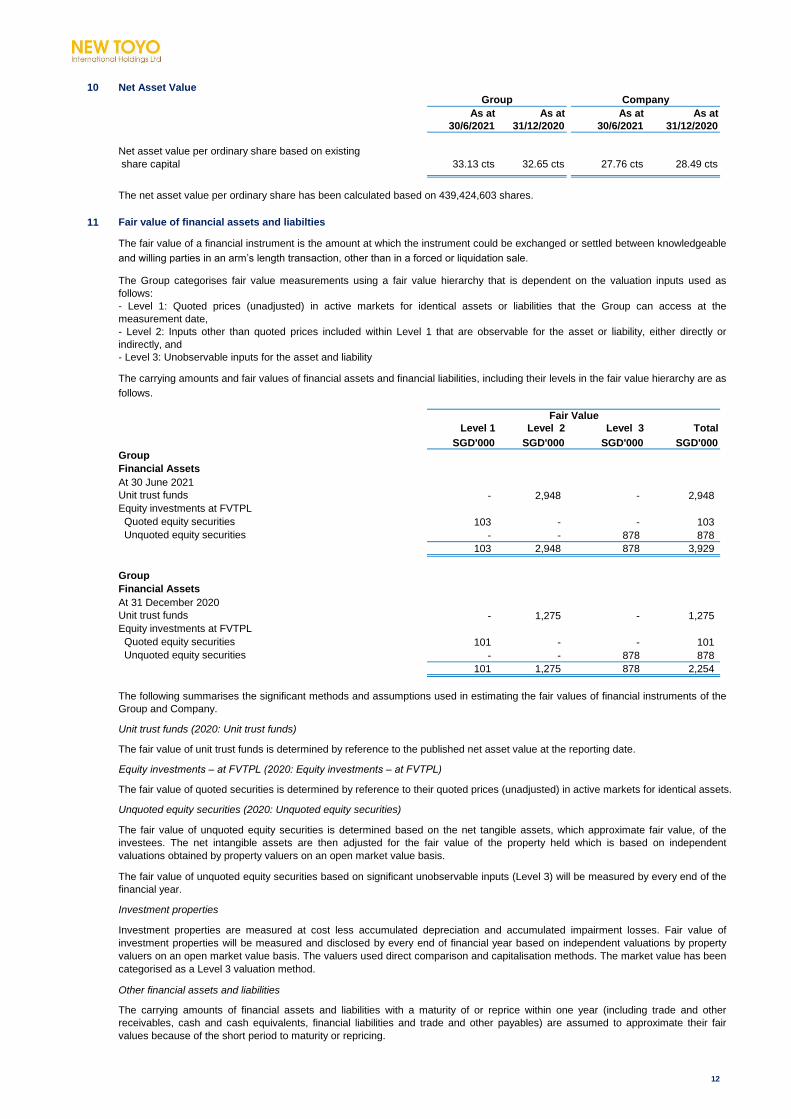
Net asset value per ordinary share based on existing
share capital 33.13 cts 32.65 cts 27.76 cts 28.49 cts
The net asset value per ordinary share has been calculated based on 439,424,603 shares.
11
Level 1 Level 2 Level 3 Total
SGD'000 SGD'000 SGD'000 SGD'000
Group
Financial Assets
At 30 June 2021
Unit trust funds - 2,948 - 2,948
Equity investments at FVTPL
Quoted equity securities 103 - - 103
Unquoted equity securities - - 878 878
103 2,948 878 3,929
Group
Financial Assets
At 31 December 2020
Unit trust funds - 1,275 - 1,275
Equity investments at FVTPL
Quoted equity securities 101 - - 101
Unquoted equity securities - - 878 878
101 1,275 878 2,254
Unit trust funds (2020: Unit trust funds)
The fair value of unit trust funds is determined by reference to the published net asset value at the reporting date.
Equity investments – at FVTPL (2020: Equity investments – at FVTPL)
The fair value of quoted securities is determined by reference to their quoted prices (unadjusted) in active markets for identical assets.
Unquoted equity securities (2020: Unquoted equity securities)
Investment properties
The Group categorises fair value measurements using a fair value hierarchy that is dependent on the valuation inputs used as
follows:
- Level 1: Quoted prices (unadjusted) in active markets for identical assets or liabilities that the Group can access at the
measurement date,
- Level 2: Inputs other than quoted prices included within Level 1 that are observable for the asset or liability, either directly or
indirectly, and
- Level 3: Unobservable inputs for the asset and liability
The carrying amounts and fair values of financial assets and financial liabilities, including their levels in the fair value hierarchy are as
follows.
Fair Value
The following summarises the significant methods and assumptions used in estimating the fair values of financial instruments of the
Group and Company.
The fair value of unquoted equity securities is determined based on the net tangible assets, which approximate fair value, of the
investees. The net intangible assets are then adjusted for the fair value of the property held which is based on independent
valuations obtained by property valuers on an open market value basis.
The fair value of unquoted equity securities based on significant unobservable inputs (Level 3) will be measured by every end of the
financial year.
Investment properties are measured at cost less accumulated depreciation and accumulated impairment losses. Fair value of
investment properties will be measured and disclosed by every end of financial year based on independent valuations by property
valuers on an open market value basis. The valuers used direct comparison and capitalisation methods. The market value has been
categorised as a Level 3 valuation method.
Other financial assets and liabilities
The carrying amounts of financial assets and liabilities with a maturity of or reprice within one year (including trade and other
receivables, cash and cash equivalents, financial liabilities and trade and other payables) are assumed to approximate their fair
values because of the short period to maturity or repricing.
Net Asset Value
Group Company
Fair value of financial assets and liabilties
The fair value of a financial instrument is the amount at which the instrument could be exchanged or settled between knowledgeable
and willing parties in an arm’s length transaction, other than in a forced or liquidation sale.
12

12
13
30/6/2021 31/12/2020 30/6/2021 31/12/2020
SGD'000 SGD'000 SGD'000 SGD'000
Amount repayable in one year or less, or on demand
Secured 5,184 6,339 19 18
Unsecured 10,707 15,463 4,636 5,992
Amount repayable after one year
Secured 3,615 5,452 40 50
Unsecured 8,914 11,265 55 9
Details of any collateral
14
30/6/2021 31/12/2020
SGD'000 SGD'000
132,102 132,102
15
30/6/2021 30/6/2020
SGD'000 SGD'000
Property, plant and equipment
Contracted but not provided for 376 332
16
17
18
Loans and borrowings
Property, plant and equipment
During the six months ended 30 June 2021, the Group acquired property, plant and equipment with an aggregate cost of
$2,687,000 (30 June 2020: $2,885,000), of which $74,000 (30 June 2020: $523,000) relates to right-of-use assets. Cash payment
of $2,613,000 (30 June 2020: $2,362,000) were made to purchase property, plant and equipment. Property, plant and equipment
disposed during the six month ended 30 June 2021 amounting to $758,000 (30 June 2020: $705,000), of which $675,000 (30 June
2020: $686,000) relates to right-of-use assets.
The Company did not hold any treasury shares as at 30 June 2021 and 31 December 2020.
Group and Company
Issued and fully paid ordinary shares
At 31 December 2020 and 30 June 2021
439,424,603 shares
The CompanyThe Group
Secured borrowings are bank loans secured on inventories and by a charge over the assets and shares in a subsidiary, and
finance lease liabilities secured by rights to the leased assets.
Share capital
On 1 July 2021, the Company has announced the entering into a share sale agreement with Nupro Investment Pty Ltd to sell all
the shares in its wholly-owned subsidiary in Australia, New Toyo Adelaide Pty Ltd.
On 14 July 2021, Tien Wah Press Holdings Berhad ("TWPH''), a subsidiary of the Group had announced that Toyo (Viet) -
DOFICO Print Packaging Co. Ltd., a joint venture of TWPH had ceased its operation since 14 July 2021 and will be automatically
liquidated as its Investment and Business License expired on 14 July 2021 in accordance with the Vietnam Law.
6 months ended
Capital commitments
Group
Changes in contingent liabilities
There were no material changes to contingent liabilities disclosed in the last audited financial statements as at 31 December 2020.
Items of unusual nature
There were no unusual items affecting assets, liabilities, equity, net income or cash flows during the financial period.
Subsequent events
13
Other Information Required by Listing Rule Appendix 7.2
1
2
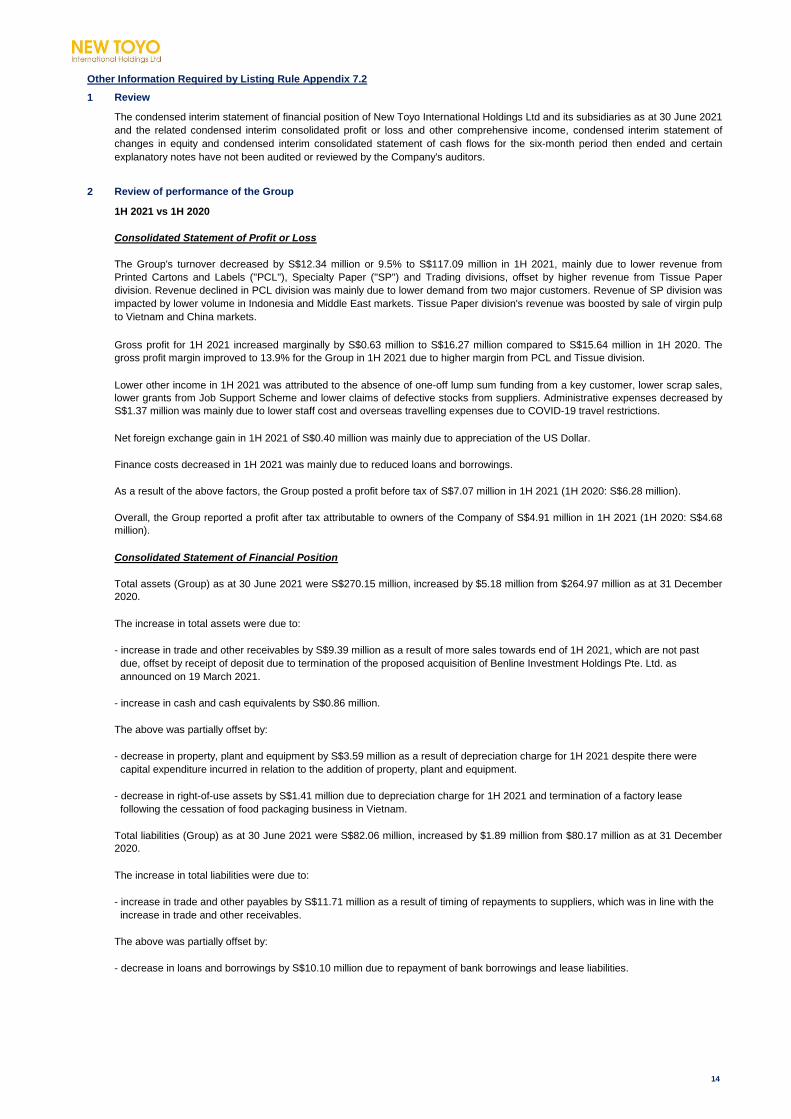
Finance costs decreased in 1H 2021 was mainly due to reduced loans and borrowings.
Total assets (Group) as at 30 June 2021 were S$270.15 million, increased by $5.18 million from $264.97 million as at 31 December
2020.
The increase in total assets were due to:
- decrease in property, plant and equipment by S$3.59 million as a result of depreciation charge for 1H 2021 despite there were
capital expenditure incurred in relation to the addition of property, plant and equipment.
- decrease in right-of-use assets by S$1.41 million due to depreciation charge for 1H 2021 and termination of a factory lease
following the cessation of food packaging business in Vietnam.
The above was partially offset by:
- increase in trade and other receivables by S$9.39 million as a result of more sales towards end of 1H 2021, which are not past
Total liabilities (Group) as at 30 June 2021 were S$82.06 million, increased by $1.89 million from $80.17 million as at 31 December
2020.
The increase in total liabilities were due to:
Review
The condensed interim statement of financial position of New Toyo International Holdings Ltd and its subsidiaries as at 30 June 2021
and the related condensed interim consolidated profit or loss and other comprehensive income, condensed interim statement of
changes in equity and condensed interim consolidated statement of cash flows for the six-month period then ended and certain
explanatory notes have not been audited or reviewed by the Company's auditors.
Review of performance of the Group
1H 2021 vs 1H 2020
The Group's turnover decreased by S$12.34 million or 9.5% to S$117.09 million in 1H 2021, mainly due to lower revenue from
Printed Cartons and Labels (''PCL''), Specialty Paper (''SP'') and Trading divisions, offset by higher revenue from Tissue Paper
division. Revenue declined in PCL division was mainly due to lower demand from two major customers. Revenue of SP division was
impacted by lower volume in Indonesia and Middle East markets. Tissue Paper division's revenue was boosted by sale of virgin pulp
to Vietnam and China markets.
Gross profit for 1H 2021 increased marginally by S$0.63 million to S$16.27 million compared to S$15.64 million in 1H 2020. The
gross profit margin improved to 13.9% for the Group in 1H 2021 due to higher margin from PCL and Tissue division.
Lower other income in 1H 2021 was attributed to the absence of one-off lump sum funding from a key customer, lower scrap sales,
lower grants from Job Support Scheme and lower claims of defective stocks from suppliers. Administrative expenses decreased by
S$1.37 million was mainly due to lower staff cost and overseas travelling expenses due to COVID-19 travel restrictions.
As a result of the above factors, the Group posted a profit before tax of S$7.07 million in 1H 2021 (1H 2020: S$6.28 million).
Overall, the Group reported a profit after tax attributable to owners of the Company of S$4.91 million in 1H 2021 (1H 2020: S$4.68
million).
Net foreign exchange gain in 1H 2021 of S$0.40 million was mainly due to appreciation of the US Dollar.
- increase in cash and cash equivalents by S$0.86 million.
announced on 19 March 2021.
due, offset by receipt of deposit due to termination of the proposed acquisition of Benline Investment Holdings Pte. Ltd. as
Consolidated Statement of Profit or Loss
Consolidated Statement of Financial Position
- increase in trade and other payables by S$11.71 million as a result of timing of repayments to suppliers, which was in line with the
increase in trade and other receivables.
- decrease in loans and borrowings by S$10.10 million due to repayment of bank borrowings and lease liabilities.
The above was partially offset by:
14

2
3
Not applicable. The Group did not make any forecast previously.
4
5
0.60 cts per ordinary share
0.60 cts per ordinary share
6
Not applicable
If no dividend has been declared/recommended, a statement to that effect and the reason(s) for the decision.
Moving into the 2nd half of 2021, the Group remains vigilant and agile on managing its operation costs and cost optimisation
initiatives to strengthen the performance of its existing portfolio, amidst the challenging environment.
Dividend
(a) Current Financial Period Reported On
Name of Dividend : Interim
Lower cash flows from operating activities in the 1H 2021 as compared to the corresponding period in 2020 was mainly due to lower
operating profits before working capital changes and trade receivables yet to be realised into cash.
Positive cash flows from investing activities in 1H 2021 was mainly receipt of deposit due to the termination of the proposed
acquisition of Benline Investment Holdings Pte. Ltd. and proceeds from disposal of plant and equipment, offset by capital
expenditure incurred for property, plant and equipment.
Higher cash flows used in financing activities in 1H 2021 was mainly due to final dividend payment to shareholders, mitigated by
lower interest paid as a result of reduced loans and borrowings.
(c) Date payable
To be advised
(d) Books closure date
To be advised
2021
Ordinary
Where a forecast, or a prospect statement, has been previously disclosed to shareholders, any variance between it and the
actual results.
Consolidated Statement of Cash Flows
Review of performance of the Group (Cont'd)
Dividend per share :
Tax Rate :
2020
Ordinary
Name of Dividend : Interim
Tax exempt (one-tier)
A commentary at the date of the announcement of the significant trend and competitive conditions of the industry in which
the Group operates and any known factors or events that may affect the Group in the next reporting period and the next 12
months.
In view of COVID-19 pandemic, the global economy will still be challenging in 2021 despite the progressive rollout of vaccines. The
Group will continue to focus on and preserve its core businesses.
Dividend Type : Cash
1H 2021 vs 1H 2020 (Cont'd)
Dividend per share :
Tax Rate : Tax exempt (one-tier)
(b) Corresponding Period of the Immediately Preceding Financial Year
Dividend Type : Cash
15

7
4
I
II
III
IV
V
Total
8
9
Lee Wei Hsiung
13 August 2021
The Company has procured undertakings from all its directors and executive officers under Rule 720(1) of the Listing Manual.
Negative confirmation pursuant to Rule 705(5).
The Directors of New Toyo International Holdings Ltd (the “Company”), do hereby confirm that, to the best of our knowledge, nothing
has come to the attention of the Board of Directors of the Company which may render the unaudited financial results of the second
quarter and period ended 30 June 2021 to be false or misleading in any material aspect.
Confirmation pursuant to Rule 720(1).
Aggregate value of all
interested person
transactions during the financial
period under review
(excluding transactions
less than $100,000 and
transactions conducted
under shareholders'
mandate pursuant to Rule
920)
SGD'000
Note: NPTVN is an associate of Mr Yen Wen Hwa, the Executive Chairman and controlling shareholder of the Company.
5,549
487
New Toyo Pulppy (Vietnam) Co., Ltd. ("NTPVN'')
Sale of jumbo reels by a Group entity to NTPVN
SGD'000
Name of interested person and description of interested person
transactions
Company Secretary
BY ORDER OF THE BOARD
Sale of virgin pulp by a Group entity to NTPVN
Sale of tissue finished goods by a Group entity to NTPVN
Sale of chipboard, duplex board and core by a Group entity to
NTPVN
Sale of corrugated boxes by a Group entity to NTPVN
194
239
4,482
147
N/A
N/A
N/A
N/A
N/A
The Group has adopted a general mandate for interested person transactions ("IPT Mandate'') on 22 July 2021. Transactions which
are covered by the IPT Mandate and effected after the adoption of the IPT Mandate by the Company are not included in the
aggregation below. The disclosures of the IPTs conducted for the half year ended 30 June 2021 are presented as follows:
Aggregate value of all
interested person
transactions conducted
under shareholders'
mandate pursuant
to Rule 920 (excluding
transactions less than
$100,000)
If the Group has obtained a general mandate from shareholders for IPTs, the aggregate value of such transactions are
required under Rule 920(1)(a)(ii). If no IPT mandate has been obtained, a statement to that effect.
16