sequential linear programming and particle swarm ... · may 12, 2017 engineering optimization...
TRANSCRIPT

May 12, 2017 Engineering Optimization engopt˙revised
To appear in Engineering OptimizationVol. 00, No. 00, Month 20XX, 1–23
Sequential Linear Programming and Particle Swarm Optimization for
the Optimization of Energy Districts
E. Riccietti a∗ and S. Bellaviab and S. Selloc
aDipartimento di Matematica e Informatica “Ulisse Dini”, Universita di Firenze, viale G.B.
Morgagni 67a, 50134 Firenze, Italia.; bDipartimento di Ingegneria Industriale, Universita di
Firenze, viale G.B. Morgagni 40, 50134 Firenze, Italia, [email protected]; cEnel
Ingegneria e Ricerca, Via Andrea Pisano 120, 56122 Pisa, Italia, [email protected]
(Received 00 Month 20XX; final version received 00 Month 20XX)
This article deals with the optimization of energy resources management of industrial dis-tricts, with the aim of minimizing the customer energy expenses. In a district the numberof possible energy system combinations is really large, and a manual design approach mightlead to a suboptimal solution. A modelling of the district is employed, whose optimizationgives rise to a nonlinear constrained optimization problem, here the focus is on its numericalsolution. Two different methods are considered for its solution: a Sequential Linear Program-ming (SLP) and a Particle Swarm Optimization (PSO) method. Efficient implementationsof both approaches are devised and the results of the tests performed on several energeticdistricts are reported.
Keywords: Nonlinear Optimization Problems; Sequential Linear Programming; ParticleSwarm Optimization; Energy Districts; Penalty Functions
1. Introduction
In this article the numerical solution of optimization problems arising in energy districts isinvestigated. The considered energy districts comprise machines able to generate, absorbor accumulate energy, like generators, accumulators, thermal loads.
The electric system has been experiencing a dramatic evolution in the last years, dueto the spread of unpredictable renewable energy source use and of distributed generation.On top of that, customers are increasing their attention towards a smarter approach toenergy consumption, and paying more and more attention to convenient energy tariffschemes, choosing among different retailers. In a district the number of possible energysystem combinations is too large to be handled by a manual design approach, that mightlead to a suboptimal solution. This kind of problems have been addressed for examplein (Ascione et al. 2016; Schiefelbein et al. 2015; Wang, Martinac, and Magny 2015). Theresearch centre ’Enel Ingegneria e Ricerca’ in Pisa in collaboration with the Departmentof Civil and Industrial Engineering of the University of Pisa developed a software packageaimed at the optimized management of energy resources for energy districts, (Pannocchiaand Mancuso 2014). This software provides a model of the energy district and taking intoaccount all the available information (energy market prices, weather actual informationand forecast) it builds the objective function measuring the costs related to the district
∗Corresponding author. Email: [email protected]
1

May 12, 2017 Engineering Optimization engopt˙revised
management and functions modelling the physical constraints on the machines. Theproblem under consideration is then that of providing the optimal dispatching of localenergy resources on day ahead in order to minimize the cost of energy at customer site,(Ferrara, Riccardi, and Sello 2014). The modelling gives rise to a nonlinear minimizationproblem with nonlinear constraints and here the focus is on its solution.
A wide range of methods have been developed for the solution of such problems,both exact optimization algorithms, (Newton, Quasi-Newton, Gauss-Newton, (Nocedaland Wright 2006; Bertsekas 1999)) and metaheuristic optimization algorithms (Parti-cle Swarm Optimization, Cultural Algorithms, Musical Composition, Differential Evolu-tion (Hu and Eberhart 2002; Lu and Chen 2008; Mezura-Montes, Miranda-Varela, anddel Carmen Gomez-Ramon 2010; Aragon, Esquivel, and Coello 2010; Tessema and Yen2009)). Over the last years this least category has been widened by employing hybridmethods that do not purely follow the concepts of one single traditional metaheuristic,but they combine various algorithmic ideas, borrowing strategies from different fields ofoptimization, sometimes also from outside of the traditional metaheuristics field, (de-losCobos-Silva et al. 2016; Raidl 2006; Robles et al. 2006; Zhang and Xie 2003). Thesemethods have over time also come to include any procedure for problem solving that em-ploys a strategy for overcoming the trap of local optimality in complex solution spaces,(Glover and Kochenberger 2006).
The use of a method belonging to the first class does not guarantee convergence to aglobal minimum, actually the generated sequence usually converges to a local minimumclose to the starting guess. Metaheuristic procedures on the other hand are specificallydesigned to find a global minimum. In solving the problem under consideration a compro-mise between two needs should be found. On one hand one aims at finding the machineasset corresponding to the lowest possible value of the objective function. On the otherhand the optimization process should be quick, as it needs to be performed several timesin a day, when the needs of the district or the weather conditions affecting the renew-able resources change. Moreover the objective function does not have a simple analyticalexpression, it is expensive to evaluate, and the analytical form of just some componentsof the gradient is available. The remaining components have to be approximated, forexample via finite differences. Thus, it is possible to rely only on derivative free methodsor methods using just first order derivatives, as approximating the second derivativeswith finite differences would be computationally heavy. Two methods belonging to theaforementioned categories were selected: a Sequential Linear Programming (SLP) anda Particle Swarm Optimization (PSO) method. SLP is an iterative procedure that ap-proaches a solution of the original nonlinear problem by generating a sequence of solutionsof linear subproblems approximating it, (Fletcher and de la Maza 1989; Byrd et al. 2003).PSO is an heuristic research procedure, (Hu and Eberhart 2002), it is derivative free andrequires just function values. For this reason it usually shows a slower convergence ratethan SLP, that is a first order method. PSO solver is then expected to find a better so-lution than SLP, but the optimization process is expected to be longer. To the authors’knowledge the performance of methods belonging to the above mentioned classes on thiskind of problem has never been investigated and compared. Then, the aim of this work isto analyze and compare SLP and PSO performance when applied to optimization prob-lems arising in energy districts, to understand if it is worth the use of a slower method,but able to find an approximation of the global minimum. Efficient and reliable imple-mentations of the two procedures are also provided, specifically designed for the problemat hand. The adopted SLP method is close to the one presented in (Robinson 1972), butis equipped with a trust-region approach to promote the global convergence, (Nocedaland Wright 2006). The literature amount on PSO methods is huge, and many variants ofthe original approach have been proposed, see (Liu, Cai, and Wang 2010; Mazhoud et al.2013; Mezura-Montes, Miranda-Varela, and del Carmen Gomez-Ramon 2010; Cagnina,
2

May 12, 2017 Engineering Optimization engopt˙revised
Esquivel, and Coello 2011) just for few examples. The implemented method is based onthe constraint handling strategy introduced in (Michalewicz and Attia 1994) and on anew strategy to prevent stagnation in local minima, proposed here.
The two solvers were inserted in the software package developed by Enel centre andUniversity of Pisa, and tested on many different realistic examples of energy districts, andon a real energy district provided by ’Enel Ingegneria e Ricerca’. Preliminary analysison this topic has been conducted by the authors in (Riccietti, Bellavia, and Sello 2017),where the problem under study is introduced and preliminary numerical results are given.In this article the numerical solution of the arising optimization problem is deeply anal-ysed. Particularly, the new variant of PSO method is introduced, a convergence analysisfor the proposed SLP is provided and a wide numerical experimentation is performed. Acomparison of the proposed methods with the state-of-the-art of metaheuristic methodsis also provided.
The article is organized as follows: in Section 2 the district modelling is introduced, themachines that are part of the district are presented, focusing on the description of theoptimization variables. In Section 3 the arising optimization problem is stated. In Section4 the SLP procedure that was implemented for the specific problem is described, theconvergence analysis is reported in Appendix A. In Section 5 PSO method is described,with focus on the implemented version. The new strategy to prevent stagnation in localminima is introduced. Finally, in Section 6 numerical results are presented. First thetwo methods are applied to a famous set of benchmark functions, usually employed totest performance of metaheuristic methods (Liang et al. 2006), to provide a comparisonof the implemented methods with the state-of-the-art of metaheuristic methods. Thenthe two solvers are applied to examples of energetic districts and the results of the testsperformed are shown.
2. The District Model
The optimization problem to be solved arises form the district modelling described below,that has been designed in (Pannocchia and Mancuso 2014). Specifically, the user has tospecify which devices the model is compound of, how they are connected to each other,choosing among different predefined thermal configurations for the heat/cold manage-ment, and specifying the characteristic parameters of the devices to simulate their realbehaviour. The variables that need to be optimized are the physical parameters of themachine that affect their functioning. These parameters are scaled so that the quanti-ties actually under control are dimensionless variables, called set-points. The aim of theoptimization process is to individuate the optimal generation, load and energy storageprofiles for each device. A plan of each machine set-points for the following day is builtto minimize the expenses related to the district management, taking into account realtime informations such as the price of the electricity (to sell or to buy), wind speed,solar radiation and ambient temperature. The time unit is set to be τ = 15 minutes, sothe day is divided into N = 24×60
15 = 96 quarters of an hour and the solver has to findthe optimal set-points for each device and for each time unit. Let i be the time index,i = 1 . . . N = 96.
Particularly there are four different types of machines that can be included as part ofan energy district: electrical generators, accumulators, electrical loads, thermal configu-rations, (Ferrara, Riccardi, and Sello 2014).
3
May 12, 2017 Engineering Optimization engopt˙revised
2.1 Electrical generators and thermal configurations
Thermal configurations are predefined configurations that can be found in an energydistrict for the heat/cold management, that might include CHPs (Combined Heat andPower), boilers, chillers. Let denote with Ngen the total number of generators and thermalconfigurations. For the k-th device αk ∈ RN denotes the set-points vector, k = 1 . . . , Ngen.Its components αk(i) are the fraction of power at i-th time unit Pk(i), with respect tothe rated output PNk:
αk(i) =Pk(i)
PNk, 0 ≤ αk(i) ≤ 1, i = 1, . . . , N, (1)
where αk(i) = 0 means that the device is off, αk(i) = 1 means that it works on maximumpower. For fuel burning generators there is also an upper bound on the number of ignitionsNI, that is a nonlinear function of αk, so that the following nonlinear constraint arises:
NI(αk) ≤ NImax. (2)
2.2 Electrical accumulators
Let βb ∈ RN be the set-points vector for the b-th accumulator, b = 1, . . . , Nacc with Nacc
the total number of accumulators in the district. Its components βb(i) are the set-pointsat the i-th time unit, i = 1, . . . , N :
βb(i) =
Ndev∑k=1
δ(k, b, i)PNk
PBb, −1 ≤ βb(i) ≤ 1, i = 1, . . . , N, (3)
where δ(k, b, i) is a function of k, b, i, PNk is the rated output of the k-th device, Ndev isthe total number of devices, PBb is the rated output of the b-th battery, (Ferrara, Ric-cardi, and Sello 2014). Negative values of βb(i) means that the accumulator is providingpower, positive values of βb(i) means that the accumulator is gaining power. For eachaccumulator and for each time unit there are also two physical restrictions on the stateof charge SOCb, that is a nonlinear function of βk:
SOCbmin ≤ SOCb(i) ≤ SOCbmax, i = 1, . . . , N. (4)
2.3 Electrical loads
Three different types of electrical loads are considered: L1 loads, that are mandatoryelectrical consumptions, L2 loads, that are electrical cycles that need to be completedone or more times at no specific time in the day, L3 loads, that are normally on, and canbe shut down for a limited amount of time without compromising the related processoperation. L1 loads are given parameters for each time unit, so these loads do not haveset-points associated and are not included in the count of total number of loads that isNloads = NL2+NL3 where NL2 and NL3 are total numbers of L2 and L3 loads respectively.Let denote with γm the vector of set-points form-th (L2 or L3) load. In this case set-pointsare not time dependent. What has to be under control is, for L2 loads, the starting timesof cycles and, for L3 loads, switch-off and switch-on times, that are all integer variables.This would give rise to a mixed-integer nonlinear programming problem (MINLP). Inorder to avoid working with a MINLP, what is usually done in these applications, and
4

May 12, 2017 Engineering Optimization engopt˙revised
also in Enel package (Pannocchia and Mancuso 2014), is to consider as set-points scalarcontinuous variables in (0, 1] and then relate them to the integer quantities one actuallywants to control. For L2 loads γm ∈ RNm , where Nm is the number of cycles that needto be completed by m-th L2 load, and those set-points are then used to compute thestarting time of l-th cycle il = dγm(l)Ne, l = 1, . . . , Nm, so that il ∈ 1, 2, . . . , N.For m-th L3 load the vector of set-points γm ∈ R2NIm , with NIm maximum number ofignitions. The odd components of γm are related to switch-off times sl and the even onesto switch-on times al, for l = 1, 2, . . . , NIm:
sl = dγm(2l − 1)Ne, al = dγm(2l)Ne.
On the loads set-points there are the following bound constraints:
1
N≤ γm(l) ≤ 1, l = 1, . . . , Nm,
1
N≤ γm(j) ≤ 1, j = 1, . . . , 2NIm, (5)
and also some physical nonlinear constraints. For L2 loads they ensure that the timebetween the starting points of two successive cycles is enough to complete the first ofthem and that the time between the beginning of the last cycle and the end of the dayis enough to complete the cycle. For L3 loads they guarantee that the shut down of theload precedes the turn on, that the load is not off for more than a given amount of time,and that if a load is shut down and then turned on, a suitable amount of time passesuntil it is turned down again, (Ferrara, Riccardi, and Sello 2014).
3. Arising Optimization Problem
The objective function f represents the overall daily cost of energy obtained as a result ofthe difference between purchase costs (fuel and electric energy) and incomings (incentivesand sales revenues), (Pannocchia and Mancuso 2014). It is calculated as the sum of theoverall district cost of each time instant i = 1, . . . , N :
f(x) =N∑i=1
fi(x)
where fi(x) is the sum of all the partial cost functions of district devices for the i-th timeunit:
fi(x) =
Ngen∑k=1
fi,k(x) +
Nacc∑b=1
fi,b(x) +
Nloads∑m=1
fi,m(x).
If n is the problem dimension, with
n = N [Ngen +Nacc] +
NL2∑m=1
Nm +
NL3∑m=1
NIm,
then f : Rn → R is a nonlinear, non-convex function. As discussed in the previous section,a number of devices have physical constraints on their set-points (see equations (2),(4)). These process constraint can be stacked together obtaining a vector of constraints
5

May 12, 2017 Engineering Optimization engopt˙revised
g : Rn → Rp, with p total number of constraints:
g(x) =[g1(x), . . . , gNgen
(x), . . . , gNgen+Nacc(x), , . . . , gNgen+Nacc+Nloads
(x)]T,
where gj(x) for j = 1, . . . , Ngen +Nacc +Nloads is a vector containing the constraints onthe j-th device. The resulting optimization problem is the following nonlinear constrainedproblem:
minx
f(x), (6a)
xmin ≤ x ≤ xmax, (6b)
g(x) ≤ 0, (6c)
where x ∈ Rn is the stacked vector of all devices set-points, xmin ∈ Rn and xmax ∈ Rn
denote the bound constraints from (1), (3), (5), i.e.
x =[α1, . . . , αNgen
, β1, . . . , βNacc, γ1, . . . , γNloads
]T,
xmin =[0, . . . , 0,−1 · · · − 1, 1
N , . . . ,1N
]T,
xmax =[1, . . . , 1, . . . 1,
]T.
4. Sequential Linear Programming
Sequential Linear Programming (SLP) is an iterative method to find local minima ofnonlinear constrained optimization problems, by solving a sequence of linear program-ming problems, (Robinson 1972; Byrd et al. 2003). At each iteration k, f and g areapproximated in a neighbourhood of the current solution approximation xk with firstorder Taylor series:
mk(d) = f(xk) +∇f(xk)Td (7)
gi(xk) +∇gi(xk)Td ≤ 0 i = 1, . . . , p, (8)
where d = x − xk. Moreover, to obtain a globally convergent method, a trust regionstrategy is employed (Conn, Gould, and Toint 2000). Then, a new constraint is added,that consists of a bound on the step-length of this form: ‖d‖∞ ≤ ∆k, where ∆k is calledthe trust-region radius. The new constraint is added to the bound constraints, so thatat each iteration the following problem is solved:
mind
mk(d), (9a)
gi(xk) +∇gi(xk)Td ≤ 0; i = 1, . . . , p, (9b)
max((xmin − xk)j ,−∆k) ≤ dj ≤ min((xmax − xk)j ,∆k), j = 1, . . . , n. (9c)
At each iteration the computed solution dk of (9) is used as a step to define the newsolution approximation: xk+1 = xk + dk. Anyway, it is not possible to work directly withproblem (9), as the linearized constraints could be inconsistent, i.e. it could be impossibleto find a d for which (9b) holds, or the solution found dk could be such that the new
6

May 12, 2017 Engineering Optimization engopt˙revised
approximation xk + dk does not satisfy the nonlinear constraints:
xk + dk /∈ Ω = x : xmin ≤ x ≤ xmax, g(x) ≤ 0.
To deal with this, the constraints are usually added in the objective function as a penaltyparameter, i.e. a new term is added to function f that is positive if the constraints are notsatisfied, and is zero otherwise. The resulting new objective function is called a penaltyfunction. This term can be chosen in many different ways, so that different penaltyfunctions are obtained. Following (Fletcher and de la Maza 1989; Byrd et al. 2003) the l1penalty function was chosen and the following penalized objective function is obtained:
Φ(x; ν) = f(x) + ν
p∑i=1
max(0,−gi(x)) (10)
where ν > 0 is the penalty parameter. If ν is sufficiently large, i.e.
ν ≥ ν∗ = maxλ∗i , i = 1, . . . , p, (11)
where λ∗i , i = 1, . . . , p are the Lagrange multiplier of the inequality constraintsg(x) ≤ 0, it is possible to show that l1 is an exact penalty function, (Nocedal and Wright2006):
Definition 4.1 Exact Penalty Function A penalty function Φ(x, ν) is said to be exactif there exists a positive scalar ν∗ such that for any ν ≥ ν∗, any local solution of thenonlinear programming problem (6) is a local minimizer of Φ(x, ν).
Since it is necessary to take into account the bound constraints, the following problemis actually to be dealt with:
minx
Φ(x; ν) = f(x) + ν
p∑i=1
max(0,−gi(x)) (12a)
xmin ≤ x ≤ xmax. (12b)
If (11) holds, local minimizers of (12) are equivalent to local solutions of (6), to a largeextent (see (Fletcher 1987; Han and Mangasarian 1979; Janesch and Santos 1997) fordetails). The general scheme of the algorithm is the same as before, with the differencethat instead of linearising both f and the constraints, function Φ is linearised and ateach iteration a problem with just bound constraints is solved, that surely has a solution.As choosing the right value of ν a priori is difficult, a sequence of linearized penalizedproblems is actually solved, adjusting the penalty parameter during the course of thecomputation. Then, at iteration k given the current iterate xk and the current penaltyparameter νk, the following linear programming problem has to be solved:
mindlk(d) := f(xk) +∇f(xk)T d+ νk
p∑i=1
max(0,−gi(xk)−∇gi(xk)T d); (13a)
max((xmin − xk)j ,−∆k) ≤ dj ≤ min((xmax − xk)j ,∆k), j = 1, . . . , n. (13b)
After the solution dk is found, it is necessary to decide whether to accept the step ornot. The step acceptance is based on the agreement between the model function lk andthe objective function Φ, which is measured by the ratio between the actual reduction
7

May 12, 2017 Engineering Optimization engopt˙revised
and the predicted reduction (Conn, Gould, and Toint 2000):
ρk =Φ(xk; νk)− Φ(xk + dk; νk)
lk(0)− lk(dk)=
∆Φk
∆lk. (14)
If ρk > ρbad, where ρbad is a tolerance to be fixed, typically ρbad ∈(0, 1
4
), the step is
accepted. In this case the trust-region radius is left unchanged or it is possibly enlarged.Otherwise the step is rejected, the trust-region is shrink and (13) is solved again.
In Algorithm 1 it is sketched the k-th iteration of SLP method described above.
Algorithm 1 k-th iteration of SLP algorithm
(1) Given xk, ∆k, ∆max, νk, 0 < ρbad < ρgood < 1.(2) Evaluate ∇f(xk) and ∇gi(xk) for i = 1, . . . , p.(3) Solve the linear programming problem (13) obtaining a candidate step dk.
(4) Let Φ(x; ν) = f(x)+νp∑
i=1max(0,−gi(x)), compute the step evaluation parameter ρk
in (14).(a) If ρk ≤ ρbad, reduce the trust-region radius: ∆k+1 = 1
2∆k, and go to step (5).(b) ElseIf ρk ≥ ρgood, and in addition ‖dk‖∞ ≥ 0.8∆k, increase the trust-region
radius∆k+1 = min(2∆k,∆max). Go to step (5).
(c) Else set ∆k+1 = ∆k and go to step (5).(5) If ρk > ρbad accept the step, set: xk+1 = xk + dk and choose νk+1 > 0.
Otherwise reject the step: xk+1 = xk. Set νk+1 = νk.
It is possible to prove the global convergence of the sequence xk generated by Al-gorithm 1 to a stationary point of problem (12), as stated in the following theorem. SeeAppendix A for the proof.
Theorem 4.2 Global convergence of Algorithm 1Let f and g be C1 functions and let xk be the sequence generated by Algorithm 1. Then,
either there exists an iteration index k such that xk is a stationary point for problem (12),or there exists a subsequence S of indexes such that xkk∈S has an accumulation pointx∗ which is a stationary point for problem (12).
Theorem 4.2 states the existence of an accumulation point x∗ of the sequence xkgenerated by Algorithm 1 that is a stationary point of problem (12), regardless of thestarting point. In Section 4.1 it will be described the chosen penalty parameter updatestrategy, which ensures that the penalty parameter ν is large enough to let x∗ be asolution of the original problem.
4.1 Implementation issues
In this section three important features of the algorithm are discussed: the solutionof subproblems (13), the stopping criterion and the updating strategy for the penaltyparameter. Function lk in (13a) is non-differentiable, but problem (13) can be written asthe following equivalent smooth linear programming problem, introducing the vector of
8

May 12, 2017 Engineering Optimization engopt˙revised
slack variables t, (Byrd et al. 2003):
mind,t∇f(xk)Td+ νk
∑i∈I
ti (15a)
gi(xk) +∇gi(xk)Td ≤ ti, i = 1, . . . , p (15b)
max((xmin − xk)j ,−∆k) ≤ d ≤ min((xmax − xk)j ,∆k)j , j = 1, . . . , n, (15c)
t ≥ 0. (15d)
Then, the solution dk of the above problem is sought, along with the Lagrange multipliersvectors λk, πk and λk of constraints (15b), (15c) and (15d) respectively. These multipliersare employed to implement a reliable stopping criterion for Algorithm 1. Algorithm 1 isstopped whenever a pair (xk, λk) satisfies the following conditions:
max‖∇f(xk) +∇g(xk)Tλk‖∞, ‖g(xk)Tλk‖∞ < ε(1 + ‖λk‖2), (16)
maxmaxi∈I
(0, gi(xk)),max(0, xmin − xk),max(0, xk − xmax) < ε(1 + ‖xk‖2), (17)
with ε a tolerance to be fixed. This stopping criterion provides us a measure of thecloseness of the computed solution to a point satisfying first order optimality condi-tions for problem (6). See Theorem A.5 in Appendix A for a theoretical support for theemployment of such criterion.
As far as the penalty parameter is concerned, it is desirable to have penalty function(10) to be exact, according to equation (11) and Definition 4.1. Then, at Step 5 ofAlgorithm 1, in case of successful iteration, the following updating strategy is adopted:
If νk < max‖λk‖∞, ‖λk‖∞ then νk+1 = max‖λk‖∞, ‖λk‖∞ (18)
is set. Both in (16) and (18) current Lagrange multiplier estimates of the LP subproblems(15), provided by the function used to solve the LPs, are used as an approximation tothose of the original problem.
5. Particle Swarm Optimization
Particle Swarm Optimization (PSO) is a stochastic evolutionary method designed toconverge to a global minimum of a function f , (Kennedy 2011). It is inspired to thebehaviour of bird swarms. Following the natural metaphor, PSO evolves a population ofindividuals, referred to as particles, within the search space, that behave according tosimple rules and interact to produce a collective behaviour to pursuit a common aim, inthis case the localization of a global minimum. The swarm is composed of s particles,each of them represents an approximation of the global minimum of the optimizationproblem and it is represented by a vector x ∈ Rn. To each particle it is associated avelocity vector v too. The method is an iterative procedure where at each iteration kvectors xk and vk are updated as follows:
vik+1 = wvik + c1r1(pibest,k − xik) + c2r2(pgbest,k − xik) (19)
xik+1 = xik + vik+1 (20)
where xik and vik are the position and velocity vector of the i-th particle, i = 1, . . . , s,at the k-th iteration, pibest,k and pgbest,k are respectively the best position reached by the
i-th particle so far and the best position reached by the whole swarm (the best position
9
May 12, 2017 Engineering Optimization engopt˙revised
is the one that corresponds to the lowest value of the objective function), c1, c2 and ware positive weights, r1 and r2 are random variables with uniform distribution in [0, 1],r1, r2 ∼ U(0, 1). At each iteration vectors pibest,k and pgbest,k are updated too:
pibest,k+1 =
xik if f(xik) < f(pibest,k)
pibest,k otherwisepgbest,k+1 =
p if f(p) < f(pgbest,k)
pgbest,k otherwise(21)
where p = arg mini=1...s f(pibest,k+1).
The solution approximation provided by the procedure is pgbest,k∗ where k∗ is the lastiteration index. Bound constraints are handled bringing back on the nearest boundary aparticle x that has left the search space. It is also necessary to change the particle velocity,otherwise at the next iteration it is likely to have a new violation: (vik)j = −r(vik)j ,where (vik)j is the j-th component of vector vik and r is a random variable uniformlydistributed in (0, 1). Originally PSO methods were developed to deal with problemswith just bound constraints, and later they were employed to solve also constrainedproblems (Aziz et al. 2011; Parsopoulos, Vrahatis et al. 2002). See also (Mezura-Montesand Coello 2011; Jordehi 2015) for a more recent review on constraints handling strategiesfor PSO methods. Penalty function approaches are widely employed to make the methodsuitable to the solution of that kind of problems. Following (Michalewicz and Attia 1994;Michalewicz and Schoenauer 1996), the following quadratic penalty function is employed:
Ψ(x; τ) = f(x) +1
2τ
p∑i=1
gi(x)2, (22)
with τ penalty parameter that is decreased at each iteration to penalize with increasingseverity constraints violations. Then, given a penalty parameter τk, function Ψ(x; τk) isused in (21) in place of the objective function f(x). The k-th iteration of PSO procedureis sketched in Algorithm 2.
Algorithm 2 k-th iteration of PSO algorithm
(1) Given c1, c2, wmin, wmax, kmax, τk, xmax, xmin, xik, vik, pibest,k, pgbest,k for i = 1, . . . , s,perform the following steps.
(2) Compute wk in (24), r1, r2 ∼ U(0, 1) and evolve the swarm according to (19), (20).(3) Handle the bound constraints: for i = 1, . . . , s and j = 1, . . . , n• If (xik+1)j < (xmin)j compute r ∼ U(0, 1) and set
(xik+1)j = (xmin)j ,
(vik+1)j = −r(vik+1)j ,
• Elseif (xik+1)j > (xmax)j compute r ∼ U(0, 1) and set
(xik+1)j = (xmax)j ,
(vik+1)j = −r(vik+1)j .
10
May 12, 2017 Engineering Optimization engopt˙revised
(4) Evaluate the objective function (22) of each particle of the swarm and update vectors
pibest,k+1 =
xik if Ψ(xik; τk) < Ψ(pibest,k; τk)
pibest,k otherwise
pgbest,k+1 =
p if Ψ(p; τk) < Ψ(pgbest,k; τk)
pgbest,k otherwise
where p = arg mini=1...s Ψ(pibest,k+1; τk) and choose τk+1 < τk.
In the implemented PSO method a new strategy to help the swarm escape from localminima is proposed. When the swarm appears to be stuck, i.e. when after a certainnumber of iterations the value of the objective function is not decreased, the velocityupdating scheme (19) is modified adding a new term in the equation, that is proportionalto the distance of the particle best position from the global best position:
vik+1 = wvik + c1r1(pibest,k − xik) + c2r2(pgbest,k − xik) + c3r3(pgbest − p
ibest), (23)
where c3 is a weighting parameter to be set, and r3 ∼ U(0, 1). When a new improvementin the objective function is obtained, coefficient c3 is set back to zero and the standardupdate is employed. Numerical experiments have shown that in some tests the additionof this term helps the swarm escape from a stalemate, allowing it to find a better solution.In the following we will address this PSO variant as PSOc3.
The main advantage of PSO methods is that they do not require neither regularityassumptions on the objective function nor to compute the first derivatives and are sosuitable when few information on the objective function are available. Clearly the factthat few information on f are used, leads to a slow method that requires many itera-tions to converge. However, the method could be efficiently implemented on a parallelarchitecture.
These methods are heuristic and standard convergence results, like those proved forexact optimization methods, are not usually provided. However, a different kind on anal-ysis of the algorithm can be performed. Using results from the dynamic system theory,it is possible to provide an understanding about how the swarm searches the problemspace through the analysis of a single particle trajectory or of the the swarm seen as astochastic system, (Trelea 2003; Clerc and Kennedy 2002). The analysis provides use-ful guidelines for the choice of the free parameters, to control the system’s convergencetendencies.
5.1 Implementation issues
The choices regarding the method implementation are made taking into account thatthe problems under consideration have hundreds of variables, an objective function thathas not a simple analytic form and that is expensive to evaluate, and that the algorithmmust return results quickly to be useful in practise.
Regarding the number of particles, it is impossible to use wide swarms because eachparticle of the swarm requires two function evaluations, the objective and the constraintsfunctions, at each iteration. On the other hand using few particles means low explorationcapability. After several numerical tests, it was found that a swarm of 20 particles repre-sents a good compromise between solution quality and execution time. For parameter win (19), instead of using a fixed value, a linearly decreasing scheme for is adopted, (Shi
11

May 12, 2017 Engineering Optimization engopt˙revised
and Eberhart 1998):
wk = wmax − (wmax − wmin)k
kmax, (24)
where kmax is the maximum number of allowed iterations. With this choice convergencevelocity is slowed down ensuring a more accurate exploration of the search space. Theprocess is stopped when a maximum number of iterations kmax is performed or when thereare no improvements over a fixed number of iterations κ. An improvement is measuredin terms of a decrease in the objective function, and it is judged not to be sufficient whenthe following condition is satisfied for κ consecutive iterations and for ε a tolerance to befixed:
|f(xk−2)− f(xk)||f(xk−2)|
< ε (25)
6. Numerical Tests
Both solvers were implemented in MATLAB and in this section results of numerical testsare shown.
First in Section 6.1 a set of benchmark functions commonly used to test performanceof metaheuristic methods is considered. Then in Section 6.2 13 different problems arisingfrom the described industrial application and corresponding to models of synthetic energydistricts are taken into account, plus one arising from the modelling of an existing districtin Pisa, provided by Enel centre. To solve these problems, the two solvers were insertedin the software tool previously developed by Enel centre and University of Pisa.
The numerical experimentation in Section 6.1 is performed on an Intel(R) Core(TM)i7-4510U 2.00GHz, 16 GB RAM; the one in Section 6.2 on an Intel(R)Xeon(R) CPUE5430, 2.66 GHz, 8.00 GB RAM. In both cases MATLAB R2016a is used, the machineprecision is εm ∼ 2 · 10−16.
Here the values of the free coefficients used in the procedures are specified. For PSOc3
in (19) c1 = 1.3 and c2 = 2.8, in (23) c3 = 1, in (24) wmax = 0.6, wmin = 0.1, thetolerance for the stopping criterion (25) is ε = 10−3, κ = 20 and kmax = 1700. Theswarm size is 100 in Section 6.1 and 20 in Section 6.2. This choice is motivated by thefact that in energy districts test cases the objective function is expensive to evaluate andthe use of wider swarms would lead to prohibitive computational costs. On the otherhand in test problems taken from the literature this is not the case, so a higher numberof particle is employed to allow a better exploration of the search space. Moreover forthe test problems in Section 6.1 it was found harder to satisfy the constraints than in thetests of energy districts. Then for both PSO and SLP algorithm constraints violationsare penalized with higher severity in Section 6.1 than in Section 6.2. Then, in the PSOconstraints handling strategy (22) τk+1 = (1 − 0.01)τk and τ0 = 0, 0000001 in Section6.1 while τ0 = 0.1 in Section 6.2. For SLP in (10) it was set ν0 = 5 in Section 6.1 andν0 = 1 in Section 6.2. In Algorithm 1 ρbad = 0.10 and ρgood = 0.75, and the linearsubproblems were solved using the Matlab function linprog(Interior Point Algorithm)with default choice parameters. Notice that the structure of the subproblems is not takeninto consideration and a special purpose code could lead to a more efficient solution ofthe subproblems, but this is out of the scope of this article.
Results shown in the following tables are the average of those obtained over 25 runsin Section 6.1 and 100 runs in Section 6.2, varying the starting point for SLP solver. Inthe tables for each one of the test cases the following statistics are reported: f and k
12

May 12, 2017 Engineering Optimization engopt˙revised
arithmetic mean of the function values and the number of iterations, σf the standarddeviation on function values, min f and max f minimum and maximum function valuesobtained, time(·) total time in seconds or minutes.
6.1 Comparison with the state-of-the-art
In this section the performance of the proposed methods is evaluated on the set of CNOP(constrained nonlinear optimization problems) called G-suite, proposed in (Liang et al.2006) for the competition on constrained optimization of the Congress on EvolutionaryComputation in 2006 (CEC’2006). This set was chosen since it provides a challenging setof functions and it makes possible to compare the proposed methods to the state-of-the-art. Indeed, a large part of papers dealing with evolutionary methods refers to this setof functions, see for example (Das and Suganthan 2011; de-los Cobos-Silva et al. 2016;Liu et al. 2016; Mezura-Montes and Lopez-Ramirez 2007). The G-suite is composed of24 CNOP. Among them, those subject just to inequality constraints were selected, asthe proposed methods are not designed to handle equality constraints. Table 1 sums upthe relevant features of each test function. In the heading, n is the number of variables,ρ = |F |/|S| is the estimated ratio between the feasible region and the search space, LI isthe number of linear inequality constraints and NI is the number of nonlinear inequalityconstraints.
Table 1.: Details of the test problems.
Prob. n Type ρ LI NIg01 13 quadratic 0.0111% 9 0g02 20 nonlinear 99.9971% 0 2g04 5 quadratic 52.1230% 0 6g06 2 cubic 0.0066% 0 2g07 10 quadratic 0.0003% 3 5g08 2 nonlinear 0.8560% 0 2g09 7 polynomial 0.5121% 0 4g10 8 linear 0.0010% 3 3g12 3 quadratic 4.7713% 0 1g16 5 nonlinear 0.0204% 4 34g18 9 quadratic 0.0000% 0 13g19 15 nonlinear 33.4761% 0 5g24 2 linear 76.6556% 0 2
For each test function 25 runs were performed, as required by the CEC’2006 SpecialSession. The results are reported in Table 2, in the last column feas is the percentageof runs in which a feasible solution is found. Noticeably, PSOc3 always finds feasiblesolutions in all runs, while SLP method is not so robust from this point of view, in 4 outof 13 tests (g07, g08, g09, g10) a feasible solution is found in 75%-90% of the runs andespecially in instance g06 a feasible solution is never found. The results reported refersjust to the feasible runs. In 9 out of 13 instances PSOc3 manages to find the best knownsolution (g01, g04, g06, g07, g08, g09, g12, g16, g24). In two instances (g18, g19) it findsthe best values reported in (Liang et al. 2006), but recently even better values have beenfound in (de-los Cobos-Silva et al. 2016). In the remaining two instances values close tothe minimum are found, but the global minimum is not reached. Regarding SLP method,
13

May 12, 2017 Engineering Optimization engopt˙revised
in 6 instances it finds the global minimum (g01, g04, g06, g07, g09, g24). In instances g08and g12 the best value found is close to it. In instances g02 and g10 its performance isworst than that of PSOc3 and as PSOc3 in instances g18, g19 SLP finds the best valuesreported in (Liang et al. 2006), but not the ones found in (de-los Cobos-Silva et al. 2016).Noticeably, in many runs the standard deviation is really low.
Table 2.: Tests on 13 test functions taken from the G-suit of CEC’2006. Comparison ofPSOc3 and SLP solvers.
Test Solver f σf max f min f k time(s) feas
g01 PSOc3 -14.54 0.94 -12.00 -15.00 130 3.31 100%SLP -14.28 0.76 -12.66 -15.00 68.75 1.62 100%
g02 PSOc3 -0.60 0.05 -0.49 -0.69 130 3.36 100%SLP -0.19 0.06 -0.076 -0.27 17.65 2.10 100%
g04 PSOc3 -30665 0.10 -30665 -30666 130 2.80 100%SLP -30666 1.18e-08 -30666 -30666 300 6.67 100%
g06 PSOc3 -6951.6 7.32 -6935 -6961.1 130 2.72 100%SLP -6961.8 1.70e-05 -6961.8 -6961.8 200 3.90 100%
g07 PSOc3 25.20 0.70 26.56 24.35 1322.9 33.50 100%SLP 24.55 0.9784 28.22 24.31 47.75 1.40 80%
g08 PSOc3 -0.0958 3.18e-17 -0.0958 -0.0958 180 5.08 100%SLP -0.0120 0.03 0.0460 -0.0860 28.20 0.68 90%
g09 PSOc3 681.28 0.39 682.63 681.03 636.30 17.26 100%SLP 680.63 8.86e-09 680.63 680.63 62.11 1.80 90%
g10 PSOc3 7760.8 775.93 10607 7241.6 1520.6 33.53 100%SLP 14237 40400 22300 8617 15.6 1.34 75%
g12 PSOc3 -1 0 -1 -1 180 7.32 100%SLP -0.799 0.11 -0.5540 -0.9864 20.65 0.62 100%
g16 PSOc3 -1.90 1.5e-3 -1.8997 -1.9041 239.95 8.82 100%SLP - - - - - - 0%
g18 PSOc3 -0.73 0.13 -0.49 -0.8577 180 4.52 100%SLP -0.84 0.07 -0.6750 -0.8660 43.45 1.25 100%
g19 PSOc3 40.71 5.89 57.64 34.44 1229.1 35.08 100%SLP 32.66 3.42e-09 32.66 32.66 52.35 1.46 100%
g24 PSOc3 -5.5080 5.24e-09 -5.5080 -5.5080 180 4.81 100%SLP -4.28 1.08 -2.23 -5.5080 4.35 0.07 100%
As suggested for example in (Derrac et al. 2011; Garcıa et al. 2009) a nonparametricanalysis of the results was performed. First, the Wilcoxon test was used to compare themethods performance, based on the mean values found, through the Matlab functionsignrank. Wilcoxon test is a nonparametric test that is used to determine whethertwo independent samples were selected from populations having the same distribution,therefore it can be employed to detect significant differences between the behaviour oftwo algorithms. The null hypothesis is that the difference between two sample meansis zero. It emerged that the null hypothesis of equivalence of the two algorithm cannotbe rejected at significance level α = 0.05. Denoting with R+ the sum of ranks for theproblems in which SLP outperforms PSOc3, and R− the sum of ranks for the opposite,R+ = 33 and R− = 58 are obtained. Anyway it is worth remembering that the test isperformed without taking into account that SLP solver doesn’t find a feasible solutionin all runs.
We can conclude that both solvers find good results, both in terms of mean values and
14

May 12, 2017 Engineering Optimization engopt˙revised
in terms of runtime. PSO method manages to find a solution approximation requiringa really low number of function evaluations, that is about 150000 for three test cases(g07, g10, g19) but is much lower for the others: less than 50000 for g09 and g16 andless than 20000 for all the others test cases. SLP requires considerably less functionevaluations despite n extra function evaluations for iteration are needed to approximatethe gradient. Indeed, the maximum number of f -evaluations required is 1800 for g04. Asproblems dimensions are really small and a quite large number of particles is used forPSO method, the execution time for SLP is lower than for PSO.
We compared the proposed methods with seven hybrid procedures introduced in de-losCobos-Silva et al. (2016). These procedures, namely MMC-DE, MMC-DE-SC, MMC-DE-interleaved, MMC-DE-SC-interleaved, MMC-DE-batch, MMC-DE-SC-batch and PSO-3P-SC, are based on metaheuristic approaches. The comparison was carried out throughpairwise comparison by the Wilcoxon test, using the statistics provided in (de-los Cobos-Silva et al. 2016). It emerges that the null hypothesis of equivalence should be rejectedfor the comparisons of PSOc3 with MMC-DE-SC-interleaved, PSO-3P-SC at significancelevel α = 0.01, and with MMC-DE at significance level α = 0.03. PSOc3 indeed showsan improvement over these methods, getting respectively R+ = 91, 78, 67, where in thiscase R+ is the sum of ranks for the problems in which PSOc3 outperforms the methodit is compared with. On the other hand SLP method results to be equivalent to all thehybrids, except for MMC-DE-SC-interleaved for which SLP shows an improvement atsignificance level α = 0.01 and R+ = 77, with R+ the sum of ranks for the problems inwhich SLP outperforms MMC-DE-SC-interleaved. Then a Friedman test was performedto compare PSOc3, PSO-3P-SC, MMC-DE, MMC-DE-SC-interleaved and SLP, followedby a post-hoc analysis through the Matlab function multcompare. This function, usingthe statistics provided by the Friedman test, performs N×N multiple comparisons, whereN is the number of algorithms to be tested, and estimates the difference of average ranks(MathWorks 2017; King and Mody 2010). The result of the test is a matrix of multiplecomparison results, returned as an p-by-6 matrix of scalar values, where p is the numberof pairs. Each row of the matrix contains the result of one paired comparison test. Thematrix obtained in the test is shown in Table 3. Method 1 and Method 2 denotethe methods being compared, lb, diff and ub denotes respectively the lower confidenceinterval, the estimate, and the upper confidence interval, p-value is the p-value forthe hypothesis test that the corresponding mean difference is not equal to 0. Then, ineach row the numbers indicate that the mean of Method 1 minus the mean of Method2 is estimated to be diff, and a 95% confidence interval for the true difference of themeans is [lb, ub]. If the confidence interval contains 0, the difference is significant atthe 5% significance level, otherwise it is not. The post-hoc analysis confirms all thedifferences detected by the Wilcoxon test, except the one between PSOc3 and MMC-DE.It emerged indeed that PSOc3 and PSO-3P-SC (p=0.0178), PSOc3 and MMC-DE-SC-interleaved (p=0.001) and MMC-DE-SC-interleaved and SLP (p=0.0221) have meanranks significantly different, as it is shown in Figure 1. In the figure, estimates andcomparison intervals are shown for each method. Each method mean is represented bythe symbol ”o”, and the interval is represented by a line extending out from the symbol.Two methods means are significantly different if their intervals are disjoint, while theyare not significantly different if their intervals overlap, (MathWorks 2017; King and Mody2010).
15

May 12, 2017 Engineering Optimization engopt˙revised
Table 3.: Matrix of multiple comparisons from Matlab function multcompare.
Method 1 Method 2 lb diff ub p-valuePSOc3 PSO-3P-SC -3.5301 -1.8846 -0.2391 0.0154PSOc3 MMC-DE -2.8378 -1.1923 0.4532 0.2775PSOc3 MMC-DE-SC-inter -4.2994 -2.6538 -1.0083 0.0001PSOc3 SLP -2.4532 -0.8077 0.8378 0.6668PSO-3P-SC MMC-DE -0.9532 0.6923 2.3378 0.7810PSO-3P-SC MMC-DE-SC-inter -2.4147 -0.7692 0.8763 0.7066PSO-3P-SC 5.0000 -0.5686 1.0769 2.7224 0.3822MMC-DE MMC-DE-SC-inter -3.1071 -1.4615 0.1840 0.1092MMC-DE 5.0000 -1.2609 0.3846 2.0301 0.9689MMC-DE-SC-inter 5.0000 0.2006 1.8462 3.4917 0.0188
mean column ranks
0.5 1 1.5 2 2.5 3 3.5 4 4.5 5 5.5
Multiple comparison of mean column ranks
PSO-3P-SC
MMC-DE
MMC-DE-INTERLEAVED
PSOc3
SLP
Figure 1.: Post-hoc analysis through Matlab function multcompare.
6.2 Examples of synthetic energy districts
In this section the results gained by the two methods when applied to 13 synthetictest examples of energy districts are presented. The arising optimization problems havedifferent dimensions, the number of variables is comprised between 294 and 494, thenumber of bound constraints between 588 and 796 and the number of process constraintsis 10 for the first test and 213 for the others. The results of the tests performed arereported in Table 4.
At first glance, from these results it is possible to deduce the following remarks. Asa consequence of the fact that SLP solver is a first order method, its convergence rateis much higher then that of PSO method, that requires an high number of iteration toallow the swarm to carefully explore the search space. In term of computational timean iteration of PSO method is cheaper than one of SLP, that requires the solutionof a Linear Programming problem and the computation of some derivatives by finitedifferences, which is computationally expensive. Despite this, the total time requiredby SLP is really lower than that required by PSO method, as SLP performs far lessiterations. As expected SLP is more suitable for real time optimization.
Regarding function values it can be observed that on many tests PSO presents highermeans compared to SLP, but generally the values on different runs are close to the meanvalue, as the standard deviation is really low. On the other hand SLP provides lowermeans but high standard deviation, which means both higher worst values and lowerbest values. Then, the probability of finding a worst result on a single run using SLP
16

May 12, 2017 Engineering Optimization engopt˙revised
Table 4.: Tests on 13 synthetic examples of energy districts and on Pisa district (lastrow), comparison of PSOc3 and SLP solvers.
Problem Solver f σf max f min f k time(m)
Test 1 PSOc3 16.6 0.6 18.3 15.4 1207 1.8SLP 16.1 1.9 25.8 15.4 25.4 0.06
Test 2 PSOc3 27.1 0.3 27.7 26.4 1585 13SLP 26.9 0.7 29.3 25.8 78.9 1.0
Test 3 PSOc3 27.8 0.3 28.5 27.1 1554 14SLP 27.9 0.7 30.7 26.8 84 1.3
Test 4 PSOc3 27.1 0.3 27.8 26.5 1583 11SLP 26.9 0.7 29.2 26.1 82.5 0.5
Test 5 PSOc3 32.5 1.5 36.6 29.2 1493 14SLP 29.7 4.4 48.7 26.7 78.8 1.0
Test 6 PSOc3 27.3 0.4 28.6 26.7 1588 11SLP 27.4 1.1 31.2 26.2 83.8 0.5
Test 7 PSOc3 49.7 0.7 52.2 48.2 1509 10SLP 48.9 0.9 53.1 46.9 76.3 0.4
Test 8 PSOc3 46.2 0.8 49.2 44.3 1531 10SLP 44.7 1.8 51.9 42.9 78.9 0.4
Test 9 PSOc3 46.2 0.8 48.6 44.5 1543 15SLP 44.4 1.6 51.3 42.9 79.6 0.4
Test 10 PSOc3 25.3 0.3 26.1 24.7 1484 14SLP 25.6 0.5 28.2 24.9 73.0 1.0
Test 11 PSOc3 25.1 0.3 26.3 24.5 1406 14SLP 25.6 0.6 28.4 24.8 70.3 1.0
Test 12 PSOc3 31.3 0.9 34.7 29.3 1379 12SLP 30.5 3.0 45.4 29.0 64.4 0.6
Test 13 PSOc3 32.1 0.8 35.1 30.4 1385 11SLP 31.9 4.0 53.5 30.0 64.8 0.7
Pisa PSOc3 73.4 0.03 73.6 73.4 377 2.7SLP 74.0 0.7 80.6 73.4 23 0.08
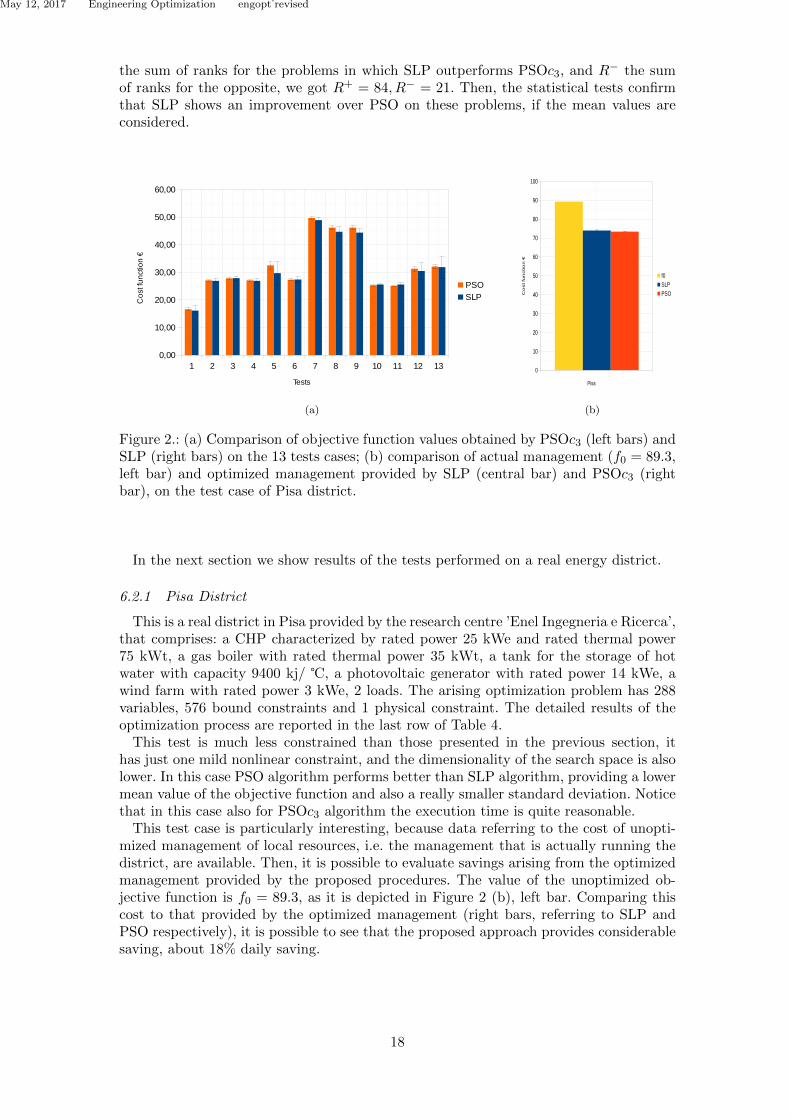
is high, while for PSO is more likely to have a result close to the mean value. This ishighlighted in Figure 2 (a), where for each test case the mean values together with thestandard deviation for the two solvers are compared. The left bars refer to PSOc3 methodand the right ones to SLP method, the standard deviation is highlighted by black verticallines. Note that overall PSO provides good results, even if a small number of particles isemployed. Its performance could be improved increasing the swarm size, to better explorethe search space. The difference between PSO and SLP is indeed especially evident inTest 5, which is the one in which the search space has highest dimension. However, fromthe numerical experience it emerged that increasing the number of particles would beprohibitive from a computational point of view.
Then, a deeper statistical analysis of the results was performed. First it was checkedif the results obtained in the tests satisfy the conditions for the use of a parametrictest, (Garcıa et al. 2009; Derrac et al. 2011). They were tested with the Kolmogorov-Smirnov test, through the Matlab function kstest, and it emerged that the data are notnormally distributed, meaning that a non-parametric analysis would be more meaningful.Therefore the data were analysed trough the Wilcoxon signed ranks test (Derrac et al.2011). From the test it emerges that the data produce an evidence that is sufficient toreject the null hypothesis, according to significance level α = 0.05. If we denote with R+
17
May 12, 2017 Engineering Optimization engopt˙revised
the sum of ranks for the problems in which SLP outperforms PSOc3, and R− the sumof ranks for the opposite, we got R+ = 84, R− = 21. Then, the statistical tests confirmthat SLP shows an improvement over PSO on these problems, if the mean values areconsidered.
(a) (b)
Figure 2.: (a) Comparison of objective function values obtained by PSOc3 (left bars) andSLP (right bars) on the 13 tests cases; (b) comparison of actual management (f0 = 89.3,left bar) and optimized management provided by SLP (central bar) and PSOc3 (rightbar), on the test case of Pisa district.
In the next section we show results of the tests performed on a real energy district.
6.2.1 Pisa District
This is a real district in Pisa provided by the research centre ’Enel Ingegneria e Ricerca’,that comprises: a CHP characterized by rated power 25 kWe and rated thermal power75 kWt, a gas boiler with rated thermal power 35 kWt, a tank for the storage of hotwater with capacity 9400 kj/ , a photovoltaic generator with rated power 14 kWe, awind farm with rated power 3 kWe, 2 loads. The arising optimization problem has 288variables, 576 bound constraints and 1 physical constraint. The detailed results of theoptimization process are reported in the last row of Table 4.
This test is much less constrained than those presented in the previous section, ithas just one mild nonlinear constraint, and the dimensionality of the search space is alsolower. In this case PSO algorithm performs better than SLP algorithm, providing a lowermean value of the objective function and also a really smaller standard deviation. Noticethat in this case also for PSOc3 algorithm the execution time is quite reasonable.
This test case is particularly interesting, because data referring to the cost of unopti-mized management of local resources, i.e. the management that is actually running thedistrict, are available. Then, it is possible to evaluate savings arising from the optimizedmanagement provided by the proposed procedures. The value of the unoptimized ob-jective function is f0 = 89.3, as it is depicted in Figure 2 (b), left bar. Comparing thiscost to that provided by the optimized management (right bars, referring to SLP andPSO respectively), it is possible to see that the proposed approach provides considerablesaving, about 18% daily saving.
18

May 12, 2017 Engineering Optimization engopt˙revised
7. Conclusions
This article deals with the numerical solution of optimization problems arising in energydistricts. A Particle Swarm Optimization solver and a Sequential Linear Programmingsolver were implemented, to investigate if the gain in the objective function given by theevolutionary method is worth the longer computational time. The solvers were testedboth on constrained tests taken from the literature, and on many different examples ofsynthetic energy districts and on a real one. From this study it emerges that the twosolvers can compare with other methods proposed in the literature, and that in districtstest cases the use of PSO gains values less distributed around the mean, but lower meansare generally provided by SLP method. Noticeably, from the test performed on a realenergetic district it arises that the optimized management of resources gained by theoptimization package provides considerable savings in the energy bill.
Acknowledgements
We thank G. Pannocchia and G.M. Mancuso, Dipartimento di Ingegneria Civile e Indus-triale dell’ Universita di Pisa, for providing us the MATLAB code of the software toolfor the test problems.Work partially supported by INdAM-GNCS.
References
Aragon, V.S., S.C. Esquivel, and C.A.C. Coello. 2010. “A Modified Version of a T-Cell Algo-rithm for Constrained Optimization Problems.” International Journal for Numerical Methodsin Engineering 84 (3): 351–378.
Ascione, F., N. Bianco, C. De Stasio, G. M. Mauro, and G.P. Vanoli. 2016. “Simulation-BasedModel Predictive Control by the Multi-Objective Optimization of Building Energy Performanceand Thermal Comfort.” Energy and Buildings 111: 131–144.
Aziz, N.A.A., M.Y. Alias, A.W. Mohemmed, and K.A. Aziz. 2011. “Particle Swarm Optimizationfor Constrained and Multiobjective Problems: a Brief Review.” In Proc IPEDR: Int ConfManage Artif Intell, Vol. 6146–2.
Bertsekas, D.P. 1999. Nonlinear Programming. Athena scientific Belmont.Byrd, R.H., N.I.M. Gould, J. Nocedal, and R.A. Waltz. 2003. “An Algorithm for Nonlinear Op-
timization Using Linear Programming and Equality Constrained Subproblems.” MathematicalProgramming 100 (1): 27–48.
Cagnina, L.C., S.C. Esquivel, and C.A.C. Coello. 2011. “Solving Constrained Optimization Prob-lems with a Hybrid Particle Swarm Optimization Algorithm.” Engineering Optimization 43(8): 843–866.
Clerc, M., and J. Kennedy. 2002. “The Particle Swarm - Explosion, Stability, and Convergencein a Multidimensional Complex Space.” IEEE Transactions on Evolutionary Computation 6(1): 58–73.
Conn, A.R., N.I.M. Gould, and Ph.L. Toint. 2000. Trust Region Methods. Vol. 1. Siam.Das, S., and P.N. Suganthan. 2011. “Differential Evolution: A Survey of the State-of-the-Art.”
IEEE Transactions on Evolutionary Computation 15 (1): 4–31.de-los Cobos-Silva, Sergio Gerardo, Roman Anselmo Mora-Gutierrez, Miguel Angel Gutierrez-
Andrade, Eric Alfredo Rincon-Garcıa, Antonin Ponsich, and Pedro Lara-Velazquez. 2016. “De-velopment of Seven Hybrid Methods Based on Collective Intelligence for Solving NonlinearConstrained Optimization Problems.” Artificial Intelligence Review 1–35.
Derrac, J., S. Garcıa, D. Molina, and F. Herrera. 2011. “A Practical Tutorial on the Use ofNonparametric Statistical Tests as a Methodology for Comparing Evolutionary and SwarmIntelligence Algorithms.” Swarm and Evolutionary Computation 1 (1): 3–18.
19
May 12, 2017 Engineering Optimization engopt˙revised
Ferrara, W., J. Riccardi, and S. Sello. 2014. “Enel Customer Optimization Service Expert SystemDevelopment.” In Technical Report, Enel Ingegneria e Ricerca, Pisa.
Fletcher, R. 1987. “Practical Methods of Optimization.” Wiley-Interscience .Fletcher, R., and E.S. de la Maza. 1989. “Nonlinear Programming and Nonsmooth Optimization
by Successive Linear Programming.” Mathematical Programming 43 (1-3): 235–256.Garcıa, S., D. Molina, M. Lozano, and F. Herrera. 2009. “A Study on the Use of Non-Parametric
Tests for Analyzing the Evolutionary Algorithms Behaviour: a Case Study on the CEC2005Special Session on Real Parameter Optimization.” Journal of Heuristics 15 (6): 617–644.
Glover, F.W., and G.A. Kochenberger. 2006. Handbook of Metaheuristics. Vol. 57. InternationalSeries in Operations Research and Management Science.
Han, S.P., and O. . Mangasarian. 1979. “Exact Penalty Functions in Nonlinear Programming.”Mathematical programming 17 (1): 251–269.
Hu, X., and R. Eberhart. 2002. “Solving Constrained Nonlinear Optimization Problems withParticle Swarm Optimization.” In 6th world multiconference on systemics, cybernetics andinformatics, 203–206.
Janesch, S.M.H., and L.T. Santos. 1997. “Exact Penalty Methods with Constrained Subprob-lems.” Investigacion Operativa 7 (1-2): 55–65.
Jordehi, A.R. 2015. “A Review on Constraint Handling Strategies in Particle Swarm Optimisa-tion.” Neural Computing and Applications 26 (6): 1265–1275.
Kennedy, J. 2011. “Particle Swarm Optimization.” In Encyclopedia of Machine Learning, 760–766. Springer.
King, Michael R, and Nipa A Mody. 2010. Numerical and statistical methods for bioengineering:applications in MATLAB. Cambridge University Press.
Liang, J.J., T. P. Runarsson, E. Mezura-Montes, M. Clerc, P.N. Suganthan, C.A. Coello, andK. Deb. 2006. “Problem Definitions and Evaluation Criteria for the CEC 2006 Special Sessionon Constrained Real-Parameter Optimization.” Journal of Applied Mechanics 41 (8).
Liu, H., Z. Cai, and Y. Wang. 2010. “Hybridizing Particle Swarm Optimization with DifferentialEvolution for Constrained Numerical and Engineering Optimization.” Applied Soft Computing10 (2): 629–640.
Liu, J., K. L. Teo, X. Wang, and C. Wu. 2016. “An Exact Penalty Function-Based DifferentialSearch Algorithm for Constrained Global Optimization.” Soft Computing 20 (4): 1305–1313.
Lu, H., and W. Chen. 2008. “Self-Adaptive Velocity Particle Swarm Optimization for SolvingConstrained Optimization Problems.” Journal of Global Optimization 41 (3): 427–445.
MathWorks. 2017. “Multiple Comparison Test.” https://it.mathworks.com/help/stats/multcompare.html.Mazhoud, I., K. Hadj-Hamou, J. Bigeon, and P. Joyeux. 2013. “Particle Swarm Optimization for
Solving Engineering Problems: A New Constraint-Handling Mechanism.” Engineering Appli-cations of Artificial Intelligence 26 (4): 1263 – 1273.
Mezura-Montes, E., and C.A.C. Coello. 2011. “Constraint-Handling in Nature-Inspired NumericalOptimization: Past, Present and Future.” Swarm and Evolutionary Computation 1 (4): 173–194.
Mezura-Montes, E., and B.C. Lopez-Ramirez. 2007. “Comparing Bio-Inspired Algorithms in Con-strained Optimization Problems.” In 2007 IEEE Congress on Evolutionary Computation, 662–669. Sept.
Mezura-Montes, Efren, Mariana Edith Miranda-Varela, and Rubı del Carmen Gomez-Ramon.2010. “Differential Evolution in Constrained Numerical Optimization: An Empirical Study.”Inf. Sci. 180 (22): 4223–4262.
Michalewicz, Z., and N. Attia. 1994. “Evolutionary Optimization of Constrained Problems.” InProceedings of the 3rd annual conference on evolutionary programming, 98–108.
Michalewicz, Z., and M. Schoenauer. 1996. “Evolutionary Algorithms for Constrained ParameterOptimization Problems.” Evolutionary Computation 4 (1): 1–32.
Nocedal, J., and S. Wright. 2006. Numerical Optimization. Springer Science & Business Media.Pannocchia, G., and G.M. Mancuso. 2014. “Steady State Optimizer of Energy Districts.” In
Technical Report, Dipartimento di Ingegneria Civile e Industriale, Pisa.Parsopoulos, K.E., M.N. Vrahatis, et al. 2002. “Particle Swarm Optimization Method for
Constrained Optimization Problems.” Intelligent Technologies–Theory and Application: NewTrends in Intelligent Technologies 76 (1): 214–220.
20

May 12, 2017 Engineering Optimization engopt˙revised
Raidl, G.R. 2006. A Unified View on Hybrid Metaheuristics. 1–12. Hybrid Metaheuristics: ThirdInternational Workshop, HM 2006 Gran Canaria, Spain, October 13-14, 2006 Proceedings:Springer Berlin Heidelberg.
Riccietti, E., S. Bellavia, and S. Sello. 2017. “Numerical Methods for Optimization ProblemsArising in Energetic Districts.” In Proceedings of ECMI 2016, Mathematics in Industry, editedby Springer.
Robinson, S.M. 1972. “A Quadratically-Convergent Algorithm for General Nonlinear Program-ming Problems.” Mathematical Programming 3 (1): 145–156.
Robles, V., J.M. Pena, P. Larranaga, M.S. Perez, and V. Herves. 2006. GA-EDA: A New HybridCooperative Search Evolutionary Algorithm. 187–219. Towards a New Evolutionary Computa-tion: Advances in the Estimation of Distribution Algorithms: Springer Berlin Heidelberg.
Schiefelbein, J., J. Tesfaegzi, R. Streblow, and D. Muller. 2015. “Design of an OptimizationAlgorithm for the Distribution of Thermal Energy Systems and Local Heating Networks withina City District.” In Proceedings of ECOS 2015, 28th International Conference on Efficiency,Cost, Optimization, Simulation and Environmental Impact of Energy Systems.
Shi, Y., and R. Eberhart. 1998. “A Modified Particle Swarm Optimizer.” In Evolutionary Compu-tation Proceedings, 1998. IEEE World Congress on Computational Intelligence, 69–73. IEEE.
Tessema, B., and G.G. Yen. 2009. “An Adaptive Penalty Formulation for Constrained Evolution-ary Optimization.” IEEE Transactions on Systems, Man, and Cybernetics-Part A: Systemsand Humans 39 (3): 565–578.
Trelea, Ioan Cristian. 2003. “The Particle Swarm Optimization Algorithm: ConvergenceAnalysis and Parameter Selection.” Information Processing Letters 85 (6): 317 – 325.http://www.sciencedirect.com/science/article/pii/S0020019002004477.
Wang, C., I. Martinac, and A. Magny. 2015. “Multi-Objective Robust Optimization of EnergySystems for a Sustainable District in Stockholm.” In Proceedings of BS2015, 14th Conferenceof the International Building Performance Simulation Association.
Zhang, Wen-Jun, and Xiao-Feng Xie. 2003. “DEPSO: hybrid particle swarm with differentialevolution operator.” In Systems, Man and Cybernetics, 2003. IEEE International Conferenceon, Vol. 43816–3821. IEEE.
Appendix A. Convergence analysis
In this Appendix Theorem 4.2 is proved, which states the global convergence of thesequence xk generated by Algorithm 1 to a stationary point of problem (12). Hereit is restated in a more general form, as it is valid not only when l1 penalty functionis chosen, but also for all polyhedral penalty convex functions H (Fletcher and de laMaza 1989). Then, Φ is going to be expressed in the following general compact form:Φ(x; ν) = f(x) + H(g(x; ν)), where H(g(x; ν)) is the penalty term and g : Rn → Rp
and, for sake of simplicity, in the following analysis g(x; ν) and Φ(x; ν) will be denoted asg(x) and Φ(x) respectively. Moreover for the step a generic norm ‖dk‖ can be considered,while, for seek of simplicity, bound constraints are not considered.
So, as a consequence of the above assumptions, theoretical results are referred to thefollowing unconstrained problem:
minx
Φ(x) = f(x) +H(g(x)), (A1)
and subproblem (13) becomes:
mindlk(d) = f(xk) +∇f(xk)Td+H(g(xk) +∇g(xk)Td) (A2a)
‖d‖ ≤ ∆k, (A2b)
21
May 12, 2017 Engineering Optimization engopt˙revised
where ∇g(x) ∈ Rp×n is the Jacobian matrix of g(x).To prove the theorem it is necessary to take into account that objective functions of
problems (A1) and (A2) are non differentiable, so to characterize their stationary pointsit is necessary to introduce KKT conditions for problems with non-smooth objectivefunction, (Fletcher 1987).
Definition A.1 Let f be a convex function defined in D ⊆ Rn. A vector v is asubgradient of f at x ∈ D, if f(y) ≥ f(x) + vT (y − x) for all y ∈ D.
Definition A.2 Let f be a convex function defined in D ⊆ Rn. The subdifferential∂f(x) of f at x is the set of all subgradients:
∂f(x) = v : vT (y − x) ≤ f(y)− f(x) for all y ∈ D.
First order necessary KKT conditions for x∗ to solve (A1) are that there exists vectorsof multipliers λ∗ ∈ ∂H(g∗) such that, (see Theorem 14.2.1 in (Fletcher 1987)): ∇f(x∗) +∇g(x∗)λ∗ = 0. First order conditions for subproblem (A2) are that there exist multipliersλk ∈ ∂H(g(xk) +∇g(xk)Tdk), wk ∈ ∂‖dk‖ and πk ≥ 0, ( see Theorem 14.6.1 in (Fletcher1987)), such that:
∇f(xk) +∇g(xk)Tλk + πkwk = 0, (A3)
πk(‖dk‖ −∆k) = 0. (A4)
The following Lemma is proved in (Fletcher 1987) and is useful for the convergencetheorems.
Lemma A.3 [Lemma 14.2.1 of (Fletcher 1987)] Let f : K → R be a convex function,K ⊂ Rn a convex set. Then ∂f(x) is a closed convex set and it is bounded for all x ∈B ⊂
oK where B is compact and
oK denotes the interior of K.
The following theorem is the reformulation of Theorem 4.2 in a slightly more generalform. It is proved following the lines of the proof of Theorem 2.1 in (Fletcher and de laMaza 1989). Note that in (Fletcher and de la Maza 1989) it is assumed to have at disposalan approximation of the Hessian matrix of the Lagrangian function, while the methodconsidered in this article exploits just first order informations.
Theorem A.4 [Global convergence of Algorithm 1]Let f and g be C1 functions and let H(g) be a convex function. Let xk be the sequencegenerated by Algorithm 1. Either there exists an iteration index k such that xk is a KKTpoint for Φ(x), or Φ(xk) → −∞ k → ∞, or if the sequence xk is bounded, then thereexists a subsequence S of indexes such that xkk∈S has an accumulation point x∗ whichsatisfies the KKT conditions for Φ(x), that is it exists a vector of multipliers λ∗ suchthat:
∇f(x∗) +∇g(x∗)λ∗ = 0. (A5)
Proof. To prove the theorem it is sufficient to consider the case in which Φk isbounded below and xk is bounded. Because xk is bounded, there exists a subsequenceS of iterations such that xkk∈S → x∗. Suppose that:a) dk does not satisfy ρk > ρbad for any k ∈ S and ∆kk∈S → 0 and hence ‖dk‖k∈S →0.Let define ∆Φk = Φ(xk) − Φ(xk + dk) and ∆lk = lk(0) − lk(dk) = Φ(xk) − lk(dk). Aconsequence of C1 continuity of f and g, convexity of H(g) and boundedness of ∂H(g),which follows from Lemma A.3, and of the use of the first order Taylor expansion, is
22
May 12, 2017 Engineering Optimization engopt˙revised
that: ∆Φk = ∆lk + o(‖dk‖) and hence ∆Φk/∆lk → 1 as k → ∞, which contradicts thefact that ρk = ∆Φk
∆lk> ρbad fails for all k ∈ S. Therefore this case is inconsistent and it
certainly exists a subsequence of indexes S such that:b) dk satisfies ρk > ρbad and lim inf
k∈S∆k > 0.
In fact, let S′ be a sequence of indexes of unsuccessful iterations. If S′ is finite, thenclearly ρk > ρbad for k sufficiently large. Otherwise suppose k0 ∈ S′. Since ∆kk∈S′ 9 0,otherwise case (a) is obtained again, for each k0 ∈ S′ it exists i such that k0 + i isa successful iteration with k0 + i /∈ S′. Therefore xk0+i = xk0
and the subsequencexk0+ik0∈S′ → x∗. Let S = k0 + i, k0 ∈ S′, then xkk∈S is the subsequence of case(b). In case (b) it can be assumed that lim infk∈S ∆k > ∆ > 0, as if lim infk∈S ∆k = 0thus imply lim inf ∆k = 0 and this yields case (a) that has be proved to be inconsistent.Because Φ1−Φ∗ ≥
∑k∈S ∆Φk, it follows that
∑k∈S ∆Φk converges. Then, ρk ≥ ρbad, i.e.
∆Φk ≥ ∆lkρbad, yields the convergence of the series∑
k∈S ∆lk, and hence ∆lk → 0.
Define l∗(d) = f(x∗) +∇f(x∗)d+H(g(x∗) +∇g(x∗)Td). Let
d = arg min l∗(d), s.t. ‖d‖ ≤ ∆
and denote x = x∗ + d. Then
‖x− xk‖ ≤ ‖x− x∗‖+ ‖x∗ − xk‖ = ‖d‖+ ‖x∗ − xk‖ ≤ ∆ + ‖x∗ − xk‖ ≤ ∆k
for all k sufficiently large, k ∈ S. Thus x is feasible for problem (A2), solk(x− xk) ≥ lk(dk) = Φ(xk)−∆lk. In the limit, for k ∈ S, ∇f(xk)→ ∇f(x∗),g(xk) → g(x∗),∇g(xk) → ∇g(x∗), x − xk → d, and ∆lk → 0, so it follows that l∗(d) ≥Φ(x∗) = l∗(0). Thus d = 0 also minimizes l∗(d) subject to ‖d‖ ≤ ∆, and since the latterconstraint is not active it follows from (A4) that π∗ = 0 and from (A3) that it exists λ∗
such that ∇f(x∗) +∇g(x∗)λ∗ = 0, then x∗ is a KKT point.
Theorem A.4 states that in case the objective function is not unbounded, which isensured in the particular case considered in Section 4, due to the presence of the boundconstraints, it exists an accumulation point x∗ of the sequence xk generated by Algo-rithm 1 that satisfies KKT conditions (A5) for Φ(x), regardless of the starting point.
It is also possible to prove the convergence of multipliers, i.e. if the subsequence S ofTheorem A.4 exists, than the subsequence of multipliers of subproblems (A2) approxi-mates multipliers of problem (A1). In fact, the following theorem holds:
Theorem A.5 Convergence of multipliers, Theorem 2.2 in (Fletcher and de la Maza1989) Let f, g ∈ C1, H(g) a convex function, πk and λk multipliers of subproblems(A2), defined in (A3) and (A4). If the subsequence S in the statement of Theorem 4.2exists, then πkk∈S →0. Moreover any accumulation point λ∗ of the multiplier vectorsλk, k ∈ S, satisfies λ∗ ∈ Λ∗, where Λ∗ = λ : λ satisfies KKT conditions (A5) at x∗,and such an accumulation point exists.
The stopping criterion employed for Algorithm 1, that is described in Section 4.1, relieson this important theoretical result, that allows to use the multipliers of subproblems(A2), provided by the function used to solve the LPs, as an approximation of those ofproblem (A1) .
23