september 2017 franklin & marshall college poll · pdf filethe september 2017 franklin...
TRANSCRIPT
For immediate release September 21, 2017
September 2017
Franklin & Marshall
College Poll
SUMMARY OF FINDINGS
Prepared by:
Center for Opinion Research
Floyd Institute for Public Policy
Franklin & Marshall College

2
Table of Contents
TABLE OF CONTENTS .................................................................................................. 2
KEY FINDINGS ............................................................................................................... 3
PRESIDENT TRUMP: JOB PERFORMANCE ......................................................................... 4
SENATOR CASEY: JOB PERFORMANCE............................................................................ 8
GOVERNOR WOLF: JOB PERFORMANCE AND STATE ISSUES ............................................. 8
METHODOLOGY .......................................................................................................... 10
ATTACHMENT A-1 ....................................................................................................... 11
ATTACHMENT A-2 ....................................................................................................... 12
ATTACHMENT A-3 ....................................................................................................... 13
MARGINAL FREQUENCY REPORT ............................................................................ 14

3
Key Findings
The September 2017 Franklin & Marshall College Poll finds that while President Trump’s
strong support among Republicans and Conservatives in Pennsylvania has slipped a bit since May,
his core support remains relatively stable. President Trump’s job performance ratings have declined
since the May Poll, falling from 37% to 29%. Pennsylvania voters believe the President is doing
best at dealing with terrorism (49% rate his performance as an “A” or a “B”), while his
administration receives its lowest ratings for improving the health care system (50% rate his
performance an “F”), dealing with climate change (47% rate his performance an “F”), and
protecting the environment (47% rate his performance an “F”). Notably, Republicans’ ratings of the
President’s handling of terrorism, foreign policy, and health care have declined since May.
Governor Wolf’s positive job approval ratings (38%) are similar to the ratings he received in May.
The Governor’s ratings are comparable to Ed Rendell’s ratings at this point in his administration.

4
President Trump: Job Performance
Not quite one in three (29%) registered voters in Pennsylvania believe President Trump is
doing an “excellent” or “good” job as president. Figure 1 compares President Trump’s job rating to
President Obama’s job ratings; President Trump’s current rating is below President Obama’s rating
in Pennsylvania at a similar point in his Presidency. A majority of Republicans (53%, down from
67% in May) rate the President’s performance positively, while fewer Democrats (11%) or
Independents (21%) do so. Conservatives (55%, down from 76% in May) are more likely than
moderates (23%) or liberals (4%) to give the President positive job approval ratings.
Figure 1:

5
Pennsylvania voters believe the President is doing best at dealing with terrorism (49% rate
his performance as an “A” or a “B”), while his administration receives its lowest ratings for
improving the health care system (50% rate his performance an “F”), dealing with climate change
(47% rate his performance an “F”), and protecting the environment (47% rate his performance an
“F”). Not surprisingly, there are partisan differences in how voters rate the administration’s
performance with Republicans tending to be more supportive than Democrats (see Figure 2). It is
notable that Republicans’ ratings of the President’s handling of terrorism, foreign policy, and health
care have declined since May.
Figure 2

6
Three in ten (30%) respondents currently describe themselves as “Trump supporters” while
two in five (43%) describe themselves as “Trump opponents.” Most of these acknowledged
supporters and opponents say their feelings about the President have not changed over the past few
months: 51% say they have always been Trump opponents, 34% say they have always been Trump
supporters, 6% who currently identify as supporters say they were previously not supporters and 8%
who currently identify as opponents say they were previously not opponents. This measure suggests
that Trump’s strongest pool of supporters has changed little in Pennsylvania.
Demographically, self-described Trump supporters are more likely to live in Southwest and
Northeast Pennsylvania, to live in a rural county, to have no college degree, to be white, retired, and
to believe that the needs of people where they live have been mostly ignored by politicians. Table 1
presents the characteristics of Trump supporters and opponents in Pennsylvania.

7
Table 1

8
Senator Casey: Job Performance
Two in five (37%) registered voters in Pennsylvania believe Senator Casey is doing an
“excellent” or “good” job as the state’s US Senator. Half (53%) of registered Democrats, one in ten
(12%) independents, and one in four (26%) Republicans provide positive ratings of the Senator’s
job performance. Interestingly, a sizable group of Independents (39%), Democrats (21%), and
Republicans (15%) say they “do not know” how they would rate the Senator’s performance.
Governor Wolf: Job Performance and State Issues
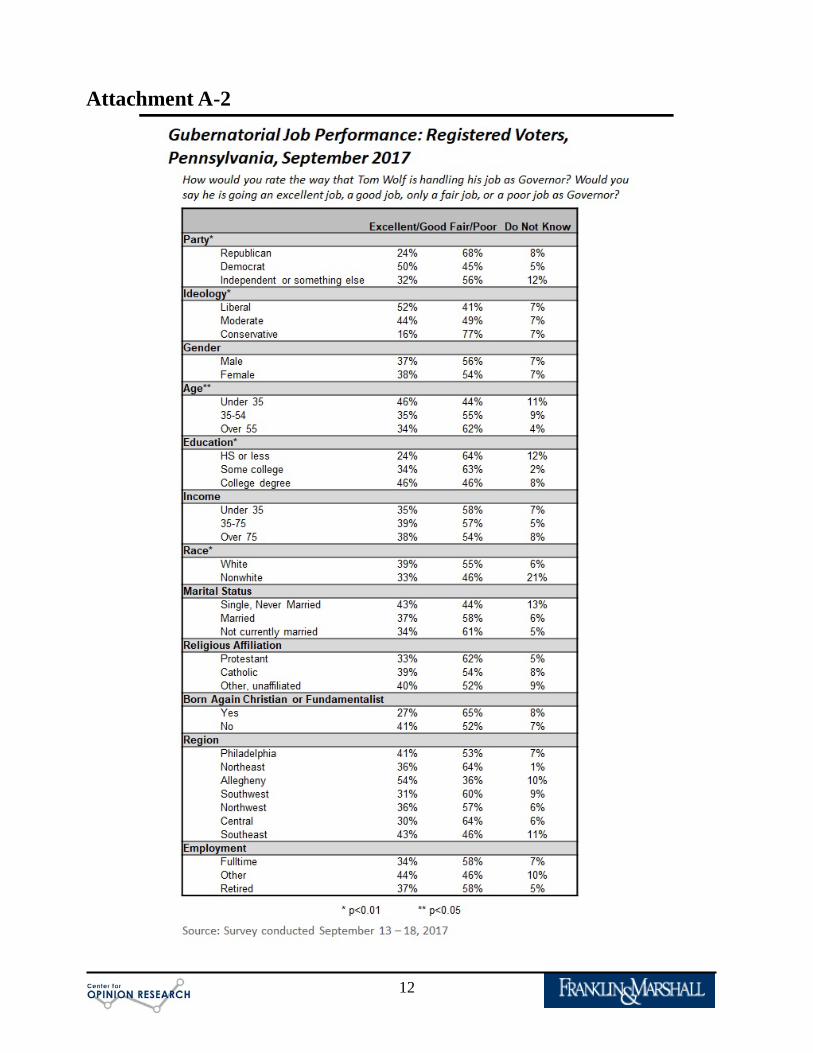
Two in five (38%) registered voters in Pennsylvania believe Governor Wolf is doing an
“excellent” or “good” job as governor. Half (50%) of registered Democrats, one in three (32%)
independents, and one in four (24%) Republicans provide positive ratings of the Governor’s job
performance, which is relatively consistent with his standing in the May survey. Figure 3 compares
Governor Wolf’s job approval ratings to his recent predecessors. Wolf’s job performance rating is
similar to Governor Rendell’s and better than Governor Corbett’s at similar points during their
terms in office.

9
Figure 3:
Half (48%) of the state’s registered voters believe the state is “on the wrong track,” but there
is no single issue or problem besides government that stands out as being most important.
Registered voters mention government and politicians (30%), unemployment/economy (16%),
education (11%), taxes (11%) and an assortment of other issues as being the most important
problems facing the state.

10
Methodology
The survey findings presented in this release are based on the results of interviews
conducted September 13 - 18, 2017. The interviews were conducted at the Center for Opinion
Research at Franklin & Marshall College on behalf of the Center for Politics and Public Affairs.
The poll was designed and administered by the staff of the Center for Opinion Research. The data
included in this release represent the responses of 398 Pennsylvania registered voters, including 191
Democrats, 152 Republicans, and 55 Independents. The sample of registered voters was obtained
from Labels & Lists. All sampled respondents were notified by letter about the survey. Interviews
were completed over the phone and on-line depending on each respondent’s preference. Survey
results were weighted (age, gender, education, ideology, and party registration) using an iterative
weighting algorithm to reflect the known distribution of those characteristics as reported by the
Pennsylvania Department of State and Pennsylvania exit polls.
The sample error for this survey is +/- 6.2 percentage points when the design effects from
weighting are considered. In addition to sampling error, this poll is also subject to other sources of
non-sampling error. Generally speaking, two sources of error concern researchers most. Non-
response bias is created when selected participants either choose not to participate in the survey or
are unavailable for interviewing. Response errors are the product of the question and answer
process. Surveys that rely on self-reported behaviors and attitudes are susceptible to biases related
to the way respondents process and respond to survey questions.

11
Attachment A-1
12
Attachment A-2

13
Attachment A-3

14
Marginal Frequency Report Responses may not total 100% due to rounding. REG. Some people are registered to vote, and many others are not. Are you CURRENTLY REGISTERED to vote at your present address?
100% Yes 0% No
RegPARTY. Are you currently registered as a Republican, a Democrat, an Independent, or as something else?
Vot16. Did you vote in the last presidential election in 2016, or not?
Yes No Sep 2017 96% 4% May 2017 97% 3%
ChgVote16 As of today, do you feel comfortable with your choice for President or do you wish you could change how you voted?
September 2017 Clinton Trump Other (Respondents who voted in last presidential election) n=193 n=138 n=29 Comfortable with your choice 92% 93% 86% Wish you could change 4% 3% 10% Do not know 3% 4% 4%
May 2017 Clinton Trump Other
(Respondents who voted in last presidential election) n=313 n=247 n=49 Comfortable with your choice 96% 94% 76% Wish you could change 2% 3% 21% Do not know 2% 2% 3%
38% Republican 48% Democrat 9% Independent 5% Something else

15
Please let me know your opinion of some people involved in politics today. Is your opinion of [FILL name] favorable, unfavorable, undecided, or haven’t you heard enough about [FILL name] to have an opinion? (rotated)
Strongly favorable
Somewhat favorable
Somewhat unfavorable
Strongly unfavorable Undecided Don’t
know TOM WOLF
Sep 2017 16% 20% 8% 34% 12% 10% Feb 2017 12% 29% 15% 19% 13% 11% Feb 2016 14% 25% 16% 27% 9% 9% Oct 2015 15% 23% 13% 20% 16% 13% Aug 2015 22% 21% 9% 17% 18% 13% Jun 2015 21% 23% 10% 17% 19% 11% Mar 2015 22% 18% 11% 16% 22% 11% Oct 2014 20% 20% 7% 18% 18% 16%
Sept 2014 19% 21% 9% 13% 18% 21% Aug 2014 18% 19% 7% 10% 22% 24% Jun 2014 15% 20% 5% 7% 20% 32%
BOB CASEY Sep 2017 17% 28% 10% 14% 11% 20% Feb 2017 16% 25% 13% 12% 14% 21% Oct 2013 12% 23% 10% 13% 16% 27% Aug 2013 12% 22% 11% 13% 17% 26% May 2013 17% 26% 9% 13% 17% 18% Feb 2013 13% 27% 11% 13% 16% 21% Oct 2012 16% 20% 12% 19% 14% 19% Sep 2012 14% 23% 13% 16% 13% 22% Aug 2012 11% 25% 12% 10% 16% 27%
June 2012 14% 24% 10% 8% 14% 29% Jan 2012 9% 20% 9% 8% 18% 35% Mar 2011 6% 19% 11% 8% 19% 37% May 2010 10% 23% 9% 11% 16% 31% Mar 2010 9% 24% 10% 11% 17% 29% Feb 2010 13% 20% 9% 9% 15% 34% Jan 2010 9% 23% 11% 9% 17% 31% Oct 2009 11% 21% 9% 12% 15% 32% Aug 2009 17% 24% 10% 8% 17% 24% Jun 2009 11% 21% 12% 5% 17% 34% Feb 2009 11% 19% 9% 8% 21% 32% Sep 2017 % % % % % %
SCOTT WAGNER Sep 2017 3% 5% 3% 6% 8% 77%
LOU BARLETTA Sep 2017 6% 9% 3% 6% 8% 68%
DONALD TRUMP Sep 2017 21% 22% 9% 36% 6% 6% Feb 2017 23% 14% 6% 51% 6% 1% Oct 2016 23% 12% 6% 56% 3% 1% Sep 2016 20% 12% 6% 54% 6% 1% Aug 2016 23% 14% 7% 51% 5% 1% Jul 2016 20% 13% 5% 57% 5% 0%
Mar 2016 13% 14% 9% 56% 7% 1% Feb 2016 12% 15% 11% 51% 10% 1%
16
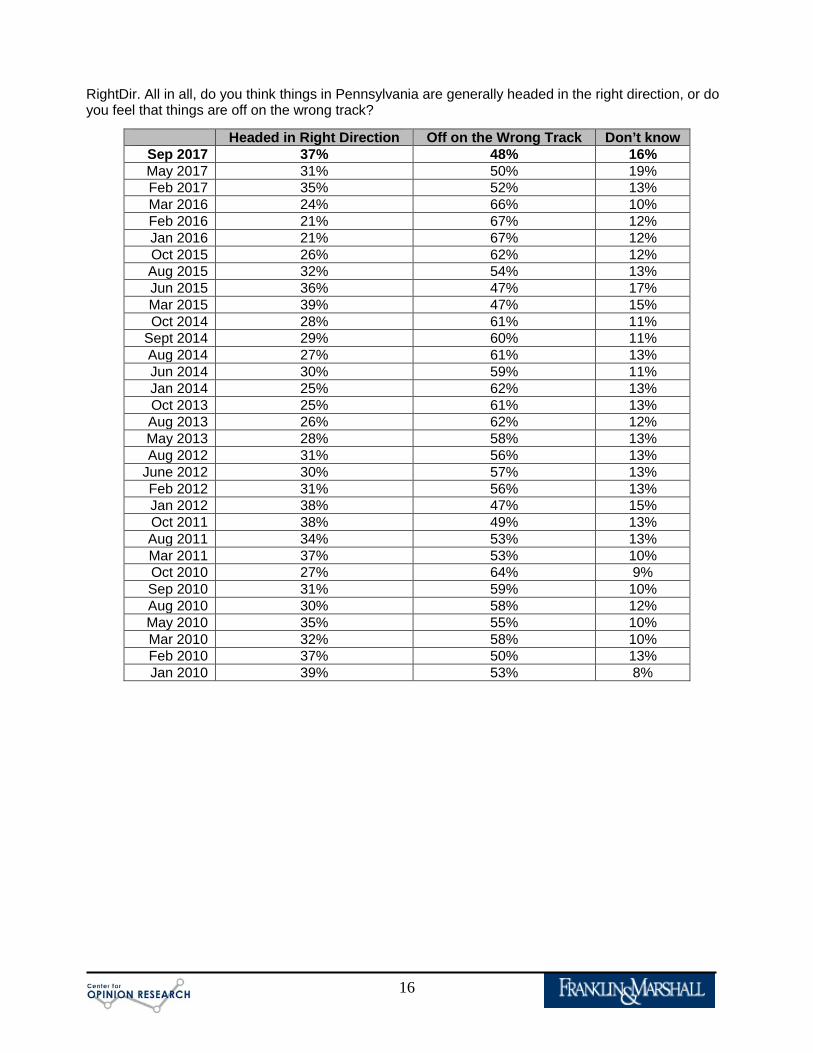
RightDir. All in all, do you think things in Pennsylvania are generally headed in the right direction, or do you feel that things are off on the wrong track?
Headed in Right Direction Off on the Wrong Track Don’t know Sep 2017 37% 48% 16% May 2017 31% 50% 19% Feb 2017 35% 52% 13% Mar 2016 24% 66% 10% Feb 2016 21% 67% 12% Jan 2016 21% 67% 12% Oct 2015 26% 62% 12% Aug 2015 32% 54% 13% Jun 2015 36% 47% 17% Mar 2015 39% 47% 15% Oct 2014 28% 61% 11%
Sept 2014 29% 60% 11% Aug 2014 27% 61% 13% Jun 2014 30% 59% 11% Jan 2014 25% 62% 13% Oct 2013 25% 61% 13% Aug 2013 26% 62% 12% May 2013 28% 58% 13% Aug 2012 31% 56% 13%
June 2012 30% 57% 13% Feb 2012 31% 56% 13% Jan 2012 38% 47% 15% Oct 2011 38% 49% 13% Aug 2011 34% 53% 13% Mar 2011 37% 53% 10% Oct 2010 27% 64% 9% Sep 2010 31% 59% 10% Aug 2010 30% 58% 12% May 2010 35% 55% 10% Mar 2010 32% 58% 10% Feb 2010 37% 50% 13% Jan 2010 39% 53% 8%

17
MIP_PA. What do you think is the MOST IMPORTANT problem facing PENNSYLVANIA TODAY?
Aug Sept Oct Mar Jun Aug Oct Jan Feb Mar Feb May Sep 2014 2014 2014 2015 2015 2015 2015 2016 2016 2016 2017 2017 2017 14% 13% 14% 16% 17% 22% 39% 38% 47% 45% 24% 22% 30% Government, politicians 29% 30% 25% 19% 18% 21% 16% 18% 12% 13% 16% 17% 11% Education, school 10% 11% 9% 17% 12% 12% 9% 9% 10% 7% 11% 12% 11% Taxes 16% 16% 20% 15% 18% 15% 12% 8% 9% 13% 12% 8% 9% Unemployment, personal finances 3% 4% 5% 6% 7% 4% 4% 4% 4% 5% 3% 3% 7% Economy, finances 2% 1% 2% 3% 2% 3% 2% 3% 2% 1% 5% 5% 6% Crime, drugs, violence, guns 2% 2% 2% 4% 1% 1% 2% 2% 1% 2% 4% 8% 4% Healthcare, insurance 5% 3% 5% 3% 6% 5% 2% 2% 2% 2% 3% 1% 3% Energy issues, gas prices 0% 0% 0% 0% 0% 0% 0% 0% 0% 0% 0% 0% 2% Bipartisanship 3% 2% 2% 4% 5% 3% 2% 2% 1% 2% 4% 4% 2% Roads, infrastructure, transportation 1% 0% 1% 1% 1% 1% 1% 1% 1% 1% 2% 3% 1% Environment 0% 0% 1% 1% 1% 1% 1% 1% 0% 1% 2% 2% 1% Social issues 1% 0% 1% 1% 1% 0% 0% 0% 1% 0% 1% 1% 1% Immigration 1% 1% 1% 2% 1% 2% 0% 1% 1% 1% 1% 0% 1% Values, morals 1% 2% 1% 1% 0% 1% 1% 0% 0% 1% 1% 0% 1% Welfare 0% 1% 0% 1% 0% 0% 0% 0% 0% 0% 1% 0% 1% Civil liberties 0% 0% 0% 0% 0% 0% 0% 0% 0% 0% 1% 0% 1% Racism 0% 0% 0% 0% 0% 0% 0% 0% 0% 0% 0% 0% 1% Population, urban sprawl 0% 1% 0% 0% 1% 1% 1% 0% 1% 1% 2% 1% 0% Retaining, attracting businesses 1% 4% 1% 1% 6% 1% 1% 1% 0% 0% 0% 1% 0% Senior issues, social security 1% 0% 0% 0% 0% 0% 0% 0% 0% 0% 1% 0% 0% Justice system, Lawyers 0% 1% 0% 0% 0% 0% 0% 0% 0% 0% 0% 0% 0% Foreign policy, terrorism, war
1% 0% 0% 0% 0% 0% 0% 0% 0% 0% 0% 0% 0% Personal illness, health problems, family issues
4% 3% 2% 2% 3% 2% 3% 4% 4% 3% 4% 5% 2% Other 8% 6% 8% 5% 0% 6% 6% 8% 5% 3% 6% 7% 5% Don't know
Legal_MJ. Do you think the use of marijuana should be made legal, or not?
Yes No Don’t know Sep 2017 59% 31% 9% May 2017 56% 37% 7% Jun 2015 40% 54% 6% Jun 2014 35% 57% 7% Jan 2014 36% 58% 6% May 2013 38% 54% 8% Feb 2013 36% 55% 9% May 2010 33% 60% 7% May 2006 22% 72% 6%

18
Rate_Gov. How would you rate the way that Tom Wolf is handling his job as Governor? Would you say he is doing an…
Excellent job Good job Only a fair job Poor job Don’t know Sep 2017 4% 34% 36% 19% 7% May 2017 5% 36% 35% 17% 8% Feb 2017 4% 34% 35% 19% 8% Feb 2016 4% 27% 32% 29% 7% Jan 2016 5% 28% 36% 26% 6% Oct 2015 6% 30% 37% 21% 6% Aug 2015 7% 32% 34% 17% 10% Jun 2015 8% 31% 34% 16% 13% Mar 2015 7% 31% 29% 14% 19%
RateSenC. How would you rate the way that Bob Casey, JR. is handling his job as U.S. SENATOR? Would you say he is doing… an excellent job, a good job, only a fair job, or a poor job as U.S. Senator?
Excellent Job Good Job Only a Fair Job Poor Job Don’t Know Sep 2017 8% 29% 27% 15% 22%
May 2017 10% 28% 33% 17% 13% Feb 2017 10% 27% 31% 14% 18% Oct 2013 5% 25% 34% 17% 20% Aug 2013 5% 23% 39% 15% 19% Oct 2012 6% 31% 33% 18% 12% Sep 2012 7% 31% 32% 15% 16% Aug 2012 4% 32% 37% 11% 16%
June 2012 5% 33% 32% 8% 21% Feb 2012 4% 26% 43% 12% 15% Jan 2012 4% 31% 36% 11% 19% Oct 2011 5% 33% 38% 9% 16% Aug 2011 5% 27% 43% 9% 16% Mar 2011 3% 26% 39% 9% 23% Feb 2009 7% 31% 32% 10% 20% Aug 2007 5% 37% 36% 7% 15%
RatePres. How would you rate the way that Donald Trump is handling his job as president? Would you say he is doing… an excellent job, a good job, only a fair job, or a poor job as President?
Excellent Job Good Job Only a Fair Job Poor Job Don’t Know Sep 2017 13% 16% 18% 53% 1% May 2017 13% 24% 14% 49% 2% Feb 2017 13% 19% 13% 54% 1%

19
I am going to read a list of problems and issues. For each one, please tell me how well President Trump’s administration has performed, using an A for excellent, B for very good, C for average, D for below average or F for failing.
September 2017 A Excellent
B Very Good
C Average
D Below Average
F Failing
Don’t know
Dealing with terrorism 22% 17% 21% 15% 24% 2% Helping to create new jobs 17% 21% 17% 17% 25% 4%
Handling immigration 14% 18% 11% 12% 46% 0% Handling foreign policy 12% 17% 14% 18% 38% 1%
Making government operate more efficiently 12% 14% 17% 16% 37% 4% Dealing with climate change 9% 11% 13% 13% 47% 6%
Improving the healthcare system 7% 12% 15% 15% 50% 1% Improving the condition of the country’s
roads, bridges, and transit systems 7% 13% 27% 12% 26% 14%
Protecting the environment 7% 12% 19% 12% 47% 4% Improving public education 4% 14% 20% 15% 40% 8%
May 2017 A Excellent
B Very Good
C Average
D Below Average
F Failing
Don’t know
Dealing with terrorism 26% 21% 13% 14% 24% 3% Helping to create new jobs 21% 21% 16% 19% 21% 2%
Handling immigration 20% 16% 11% 11% 41% 1% Handling foreign policy 17% 19% 14% 13% 36% 1%
Making government operate more efficiently 12% 20% 16% 14% 34% 4% Improving the healthcare system 10% 16% 15% 11% 45% 4%
Dealing with climate change 8% 10% 16% 7% 52% 7% Improving the condition of the country’s
roads, bridges, and transit systems 7% 14% 22% 14% 27% 16%
Improving public education 6% 13% 20% 11% 41% 9% Protecting the environment 6% 12% 17% 9% 51% 5%
TR1. Would you describe yourself as a Trump supporter, a Trump opponent, or as neither?
30% Supporter 43% Opponent 26% Neither 1% Do not know
TR2. Have you always been a Trump [supporter/opponent], or have your feelings about President Trump changed over the past few months?
Supporter n=119
Opponent n=172
Always Trump [Fill TR1 Response] 84% 86% Feelings have changed 14% 13%
Do not know 1% 1%
20
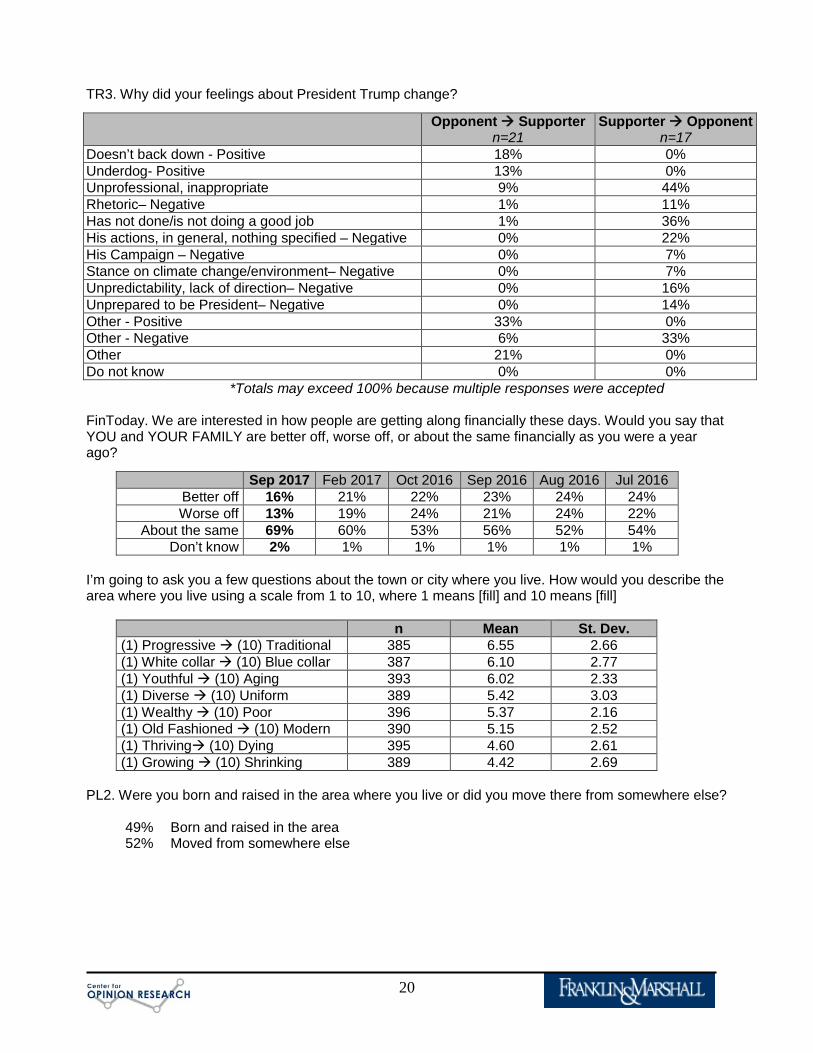
TR3. Why did your feelings about President Trump change?
Opponent Supporter n=21
Supporter Opponent n=17
Doesn’t back down - Positive 18% 0% Underdog- Positive 13% 0% Unprofessional, inappropriate 9% 44% Rhetoric– Negative 1% 11% Has not done/is not doing a good job 1% 36% His actions, in general, nothing specified – Negative 0% 22% His Campaign – Negative 0% 7% Stance on climate change/environment– Negative 0% 7% Unpredictability, lack of direction– Negative 0% 16% Unprepared to be President– Negative 0% 14% Other - Positive 33% 0% Other - Negative 6% 33% Other 21% 0% Do not know 0% 0%
*Totals may exceed 100% because multiple responses were accepted FinToday. We are interested in how people are getting along financially these days. Would you say that YOU and YOUR FAMILY are better off, worse off, or about the same financially as you were a year ago?
Sep 2017 Feb 2017 Oct 2016 Sep 2016 Aug 2016 Jul 2016 Better off 16% 21% 22% 23% 24% 24% Worse off 13% 19% 24% 21% 24% 22%
About the same 69% 60% 53% 56% 52% 54% Don’t know 2% 1% 1% 1% 1% 1%
I’m going to ask you a few questions about the town or city where you live. How would you describe the area where you live using a scale from 1 to 10, where 1 means [fill] and 10 means [fill]
n Mean St. Dev. (1) Progressive (10) Traditional 385 6.55 2.66 (1) White collar (10) Blue collar 387 6.10 2.77 (1) Youthful (10) Aging 393 6.02 2.33 (1) Diverse (10) Uniform 389 5.42 3.03 (1) Wealthy (10) Poor 396 5.37 2.16 (1) Old Fashioned (10) Modern 390 5.15 2.52 (1) Thriving (10) Dying 395 4.60 2.61 (1) Growing (10) Shrinking 389 4.42 2.69
PL2. Were you born and raised in the area where you live or did you move there from somewhere else?
49% Born and raised in the area 52% Moved from somewhere else
21
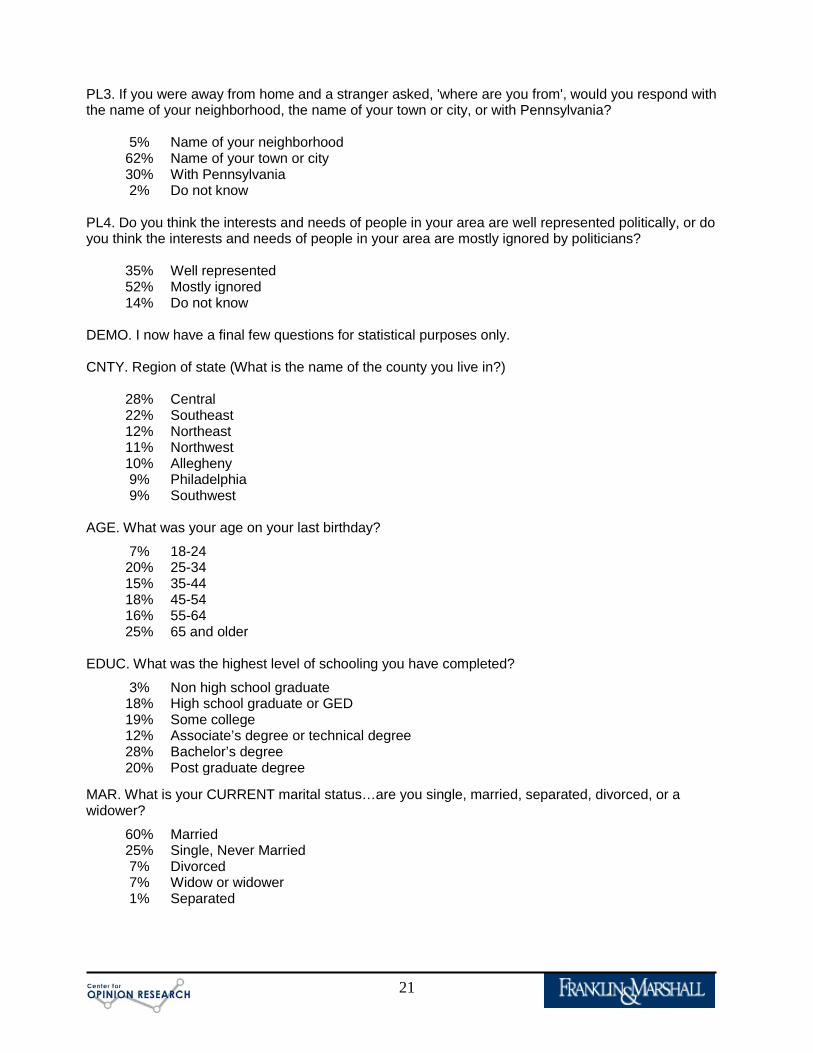
PL3. If you were away from home and a stranger asked, 'where are you from', would you respond with the name of your neighborhood, the name of your town or city, or with Pennsylvania?
5% Name of your neighborhood 62% Name of your town or city 30% With Pennsylvania 2% Do not know
PL4. Do you think the interests and needs of people in your area are well represented politically, or do you think the interests and needs of people in your area are mostly ignored by politicians?
35% Well represented 52% Mostly ignored 14% Do not know
DEMO. I now have a final few questions for statistical purposes only. CNTY. Region of state (What is the name of the county you live in?)
28% Central 22% Southeast 12% Northeast 11% Northwest 10% Allegheny 9% Philadelphia 9% Southwest
AGE. What was your age on your last birthday?
7% 18-24 20% 25-34 15% 35-44 18% 45-54 16% 55-64 25% 65 and older
EDUC. What was the highest level of schooling you have completed?
3% Non high school graduate 18% High school graduate or GED 19% Some college 12% Associate’s degree or technical degree 28% Bachelor’s degree 20% Post graduate degree
MAR. What is your CURRENT marital status…are you single, married, separated, divorced, or a widower?
60% Married 25% Single, Never Married 7% Divorced 7% Widow or widower 1% Separated

22
IDEO. Politically speaking, do you consider yourself to be a liberal, a moderate, or a conservative?
Liberal Moderate Conservative Don’t know May 2017 26% 41% 30% 2% Feb 2017 27% 42% 31% 0% Oct 2016 33% 29% 34% 4% Sep 2016 31% 28% 38% 4% Aug 2016 31% 32% 33% 4% Jul 2016 33% 30% 33% 4%
Mar 2016 24% 35% 37% 3% Feb 2016 27% 33% 37% 3% Jan 2016 22% 39% 36% 4% Oct 2015 22% 38% 37% 4% Aug 2015 21% 36% 40% 3% Jun 2015 23% 35% 39% 4% Oct 2014 23% 37% 36% 3%
Sept 2014 22% 36% 38% 5% Aug 2014 20% 39% 36% 5% Jun 2014 26% 36% 34% 5% Jan 2014 24% 43% 28% 5% Oct 2013 24% 39% 31% 6% Aug 2013 22% 42% 33% 3% May 2013 24% 39% 31% 6% Feb 2013 26% 36% 35% 3% Oct 2012 22% 39% 35% 5% Sep 2012 26% 34% 35% 5% Aug 2012 21% 40% 36% 4%
June 2012 25% 34% 36% 5% Feb 2012 17% 39% 40% 4% Jan 2011 21% 39% 36% 4% Oct 2011 20% 39% 33% 8% Aug 2011 24% 32% 37% 7% Mar 2011 16% 33% 41% 10% Oct 2010 16% 37% 39% 8% Sep 2010 15% 34% 40% 10% Aug 2010 19% 32% 40% 9% May 2010 19% 32% 40% 9% Mar 2010 17% 35% 40% 8% Feb 2010 21% 33% 37% 9% Jan 2010 19% 30% 42% 9%
PARTY. Regardless of how you are registered… in politics, as of today, do you think of yourself as a Republican, a Democrat, or an Independent?
19% Strong Republican 12% Republican 9% Lean Republican 5% Independent
13% Lean Democrat 15% Democrat 25% Strong Democrat 3% Don’t know

23
GUN. Are you a gun owner?
29% Yes 71% No
GUN2. Generally speaking, do you favor or oppose creating more laws that regulate gun ownership?
Strongly favor Somewhat favor Somewhat oppose Strongly oppose Don’t know Sep 2017 38% 23% 11% 24% 4% Feb 2017 42% 19% 14% 23% 2% Oct 2016 38% 27% 12% 21% 4% Sep 2016 44% 21% 10% 23% 3% Aug 2016 38% 16% 16% 26% 3% Jul 2016 43% 18% 10% 25% 4%
Mar 2016 42% 17% 10% 28% 3% Feb 2016 40% 16% 13% 29% 3% Jan 2016 40% 15% 13% 29% 3% Oct 2015 43% 13% 10% 31% 4% Aug 2015 40% 14% 10% 32% 5% Jun 2015 38% 13% 12% 33% 5% Oct 2014 42% 12% 8% 37% 2%
Sept 2014 39% 14% 10% 32% 5% Aug 2014 39% 14% 10% 31% 6% Jun 2014 43% 12% 9% 31% 5% Jan 2014 42% 12% 9% 32% 6% Oct 2013 46% 16% 9% 24% 5% Aug 2013 39% 12% 13% 33% 4% May 2013 43% 14% 11% 30% 3% Feb 2013* 43% 15% 10% 28% 4% Aug 2007 40% 20% 14% 23% 3% Jun 2007 39% 15% 12% 31% 3% Feb 2007 39% 17% 15% 26% 3%
LABR. Are you or is any member of your household a member of a LABOR UNION?
21% Yes 78% No 1% Do not know
VET. Are you a military veteran?
10% Yes 90% No
Hisp. Are you Hispanic or Latino, or not?
2% Yes 98% No
RACE. Which of the following categories best describes your racial background?
90% White 10% Non-white

24
REL. Do you consider yourself to be Protestant, Catholic, some other religion, or not affiliated with any religion?
30% Protestant 29% Catholic 15% Some other religion 27% Not affiliated with any religion
BAC. Do you consider yourself to be a born-again Christian or fundamentalist, or not?
23% Yes 75% No 2% Don’t know
WORK. Are you currently working fulltime, part-time, going to school, keeping house or something else?
54% Full-time 23% Retired 10% Part-time 4% Something else 4% Going to school 3% Disabled 3% Unemployed
INCOME. And, just for statistical purposes, we need to know if your total family income is above or below $50,000 per year?
9% Under $25,000 10% $25-$35,000 9% $35-50,000
20% $50-75,000 16% $75-100,000 30% Over $100,000 6% Don’t know
DONE. Sex of respondent:
48% Male 52% Female