febr uary 2017 franklinn & marshall college poll key findings the february 2017 franklin &...
TRANSCRIPT

Fr
S
Ce
Floy
Fra
For i
Febr
ranklin
Col
SUMMAR
Pre
nter for
yd Institu
anklin &
immediate r
ruary
n & M
lege P
RY OF F
epared b
Opinion
ute for P
& Marsha
release Feb
2017
Marsh
Poll
FINDING
by:
n Resea
Public P
all Colle
bruary 23, 2
all
S
rch
olicy
ege
2017

2
Table of Contents
TABLE OF CONTENTS .................................................................................................. 2
KEY FINDINGS ............................................................................................................... 3
GOVERNOR WOLF: STATE ISSUES, JOB PERFORMANCE AND THE STATE BUDGET ............... 4
PRESIDENT TRUMP: JOB PERFORMANCE AND NATIONAL ISSUES ........................................ 6
METHODOLOGY ............................................................................................................ 9
ATTACHMENT A-1 ....................................................................................................... 10
ATTACHMENT A-2 ....................................................................................................... 11
ATTACHMENT A-3 ....................................................................................................... 12
MARGINAL FREQUENCY REPORT ............................................................................ 13

3
Key Findings
The February 2017 Franklin & Marshall College Poll finds that Pennsylvania voters
continue to be dissatisfied with the direction of the state, the country, and with politics in general.
Most registered voters believe the state (52%) and country (66%) are “on the wrong track.” Many
registered voters also believe that “government” and “politicians” are the most important problems
facing both the state and the nation at the moment. Consequently, registered voters’ job approval
ratings for Governor Wolf (38%), Senator Casey (37%), and President Trump (32%) are relatively
low, although Governor Wolf’s ratings are better than they were one year ago during the latter
stages of the state budget impasse. President Trump’s ratings are strong among Republicans and
even stronger among self-described conservatives and, despite his relatively low ratings, a majority
(51%) of all registered voters is confident in his ability to improve the economy. An equal share of
registered voters in the state believes the media treats President Trump “very unfairly” (32%) as
believe it treats him “very fairly” (32%).
4
Governor Wolf: State Issues, Job Performance and the State Budget
One in two (52%) registered voters believes the state is “on the wrong track” and nearly
equal numbers of respondents say their families are economically “worse off” (19%) as say their
families are economically “better off” (21%) compared to one year ago. These patterns did not
differ by political party affiliation or political ideology. Pennsylvania’s registered voters continue to
believe that government and politicians (24%) are the state’s most important problem, although
more than twice as many Pennsylvania registered voters provided this response in March, 2016
(45%).
Two in five (38%) registered voters in Pennsylvania believe Governor Wolf is doing an
“excellent” or “good” job as governor. Half (52%) of registered Democrats, two in five (37%)
independents, and one in five (20%) Republicans provides positive ratings of the Governor’s job
performance. Figure 1 compares Governor Wolf’s job approval ratings to his recent predecessors.
Wolf’s job performance ratings fall between Governor Rendell’s and Governor Corbett’s at similar
points during their terms in office.

5
Figure 1:
A majority (54%) of registered voters believes the financial condition of state government is
“bad” or “very bad,” although about one in five (23%) aren’t sure. A majority (52%) of respondents
are confident in the Governor’s ability to handle the state’s budget problems. Three in five (61%)
registered voters favor the governor’s proposal to raise the state minimum wage to $12 per hour.
Support for a minimum wage increase is highest among Democrats (83%) and independents (61%)
and lowest among Republicans (33%).

6
President Trump: Job Performance and National Issues
Two in three (66%) registered voters believe that the United States is “on the wrong track”
and two in five (41%) believe that “government” and “politicians” are the most important problem
facing the country—included in this number is the one in three (33%) Democrats and one in five
(17%) independents who specifically mentions President Trump as the problem.
One in three (32%) registered voters in Pennsylvania believes President Trump is doing an
“excellent” or “good” job as president. Figure 2 compares President Trump’s job rating to President
Obama’s job ratings; President Trump’s current rating is below President Obama’s initial rating in
Pennsylvania in early 2009. A majority of Republicans (61%) rate the President’s performance
positively, while fewer Democrats (9%) or Independents (35%) do so. Conservatives (73%) are
more likely than moderates (20%) or liberals (4%) to give the President positive approval ratings.
Despite low relative job performance ratings, a majority of Pennsylvania registered voters are
confident in the President’s ability to handle the economy (51%). Pennsylvania voters are less
confident in his ability to handle immigration issues (41%) and foreign affairs (38%).

7
Figure 2:
Pennsylvania’s registered voters do not believe that President Trump is particularly honest;
respondents give him an average honesty rating of 4.5 using a one to ten scale where one means
dishonest and ten means honest. Conservatives (mean = 7.6) rate him as more honest than
moderates (mean = 3.8) or liberals (mean = 1.9). On the other hand, equal proportions of registered
voters say that the media treats the President “very unfairly” (32%) as say the media treats him
“very fairly” (32%). Perceptions of the media’s treatment of President Trump differ by a
respondent’s primary source of news: cable news viewers (57%), social media users (60%), and
radio listeners (52%) are more likely than network news viewers (41%) or internet users (35%) to
believe the media treats him “unfairly.”

8
More respondents believe that the passage of the Affordable Care Act in 2010 made the
health care system better (49%) than made it worse (41%) for most Americans. On the other hand,
more respondents say they are “worse off” personally (28%) than say they are “better off”
personally (19%) as a result of the law’s passage. Only one in four (29%) registered Pennsylvania
voters believes that the law should be repealed entirely; most (60%) believe the law should have a
few changes made to improve it. Responses to these questions are strongly associated with political
party affiliation and political ideology, as one might expect. For instance, half (54%) of Republicans
believe the law should be repealed in its entirety, but only one third (34%) of independents and less
than one in ten (7%) Democrats believe that. Similarly, two thirds (64%) of conservatives believe
the law should be repealed entirely, while few liberals (3%) or moderates (19%) feel this way.

9
Methodology
The survey findings presented in this release are based on the results of interviews
conducted February 15 – 19, 2017. The interviews were conducted at the Center for Opinion
Research at Franklin & Marshall College on behalf of the Center for Politics and Public Affairs.
The poll was designed and administered by the staff of the Center for Opinion Research. The data
included in this release represent the responses of 816 Pennsylvania registered voters, including 391
Democrats, 310 Republicans, and 114 Independents. The sample of registered voters was obtained
from Labels & Lists. All sampled respondents were notified by letter about the survey. Interviews
were completed over the phone and on-line depending on each respondent’s preference. Survey
results were weighted (age, gender, region, education, ideology, and party registration) using an
iterative weighting algorithm to reflect the known distribution of those characteristics as reported by
the Pennsylvania Department of State and Pennsylvania exit polls.
The sample error for this survey is +/- 5.0 percentage points when the design effects from
weighting are considered. In addition to sampling error, this poll is also subject to other sources of
non-sampling error. Generally speaking, two sources of error concern researchers most. Non-
response bias is created when selected participants either choose not to participate in the survey or
are unavailable for interviewing. Response errors are the product of the question and answer
process. Surveys that rely on self-reported behaviors and attitudes are susceptible to biases related
to the way respondents process and respond to survey questions.

10
Attachment A-1 Presidential Job Performance: Registered Voters, Pennsylvania, February 2017
Excellent/Good Fair/Poor Do Not Know Party* Republican 61% 38% 1% Democrat 9% 90% 1% Independent or something else 35% 64% 1% Ideology* Liberal 4% 96% 0% Moderate 20% 79% 1% Conservative 73% 25% 3% Gender* Male 38% 62% 0% Female 27% 71% 2% Age* Under 35 22% 76% 1% 35-54 36% 63% 0% Over 55 35% 63% 2% Education* HS or less 51% 47% 1% Some college 33% 65% 2% College degree 23% 76% 0% Income Under 35 30% 68% 1% 35-75 33% 65% 2% Over 75 29% 71% 0% Race* White 34% 65% 1% Nonwhite 5% 92% 3% Marital Status** Single, Never Married 24% 74% 2% Married 36% 63% 1% Not currently married 32% 67% 1% Religious Affiliation* Protestant 38% 60% 2% Catholic 39% 61% 0% Other, unaffiliated 23% 75% 1% Born Again Christian or Fundamentalist* Yes 46% 51% 2% No 27% 72% 1% Gun Owner* Yes 51% 48% 1% No 21% 77% 1% Region* Philadelphia 10% 88% 2% Northeast 38% 59% 3% Allegheny 25% 75% 0% Southwest 40% 60% 0% Northwest 37% 61% 2% Central 37% 61% 2% Southeast 31% 69% 0% Employment Fulltime 33% 66% 1% Other 28% 69% 3% Retired 36% 64% 1%
How would you rate the way that Donald Trump is handling his job as President? Would you say he is going an excellent job, a good job, only a fair job, or a poor job as President?
* p<0.01 ** p<0.05

11
Attachment A-2 Gubernatorial Job Performance: Registered Voters, Pennsylvania, February 2017
Excellent/Good Fair/Poor Do Not Know Party* Republican 20% 71% 10% Democrat 53% 39% 8% Independent or something else 38% 57% 6% Ideology* Liberal 60% 33% 7% Moderate 40% 53% 7% Conservative 16% 72% 12% Gender** Male 35% 58% 7% Female 41% 49% 10% Age* Under 35 42% 42% 15% 35-54 32% 59% 9% Over 55 40% 57% 3% Education* HS or less 29% 67% 4% Some college 32% 57% 11% College degree 46% 46% 8% Income* Under 35 36% 54% 10% 35-75 42% 55% 2% Over 75 39% 50% 11% Race White 39% 53% 8% Nonwhite 36% 55% 9% Marital Status Single, Never Married 39% 49% 12% Married 37% 55% 8% Not currently married 41% 55% 4% Religious Affiliation* Protestant 32% 61% 7% Catholic 38% 57% 5% Other, unaffiliated 43% 46% 11% Born Again Christian or Fundamentalist** Yes 29% 59% 12% No 41% 52% 7% Gun Owner* Yes 25% 65% 9% No 45% 47% 8% Region** Philadelphia 42% 48% 10% Northeast 44% 47% 8% Allegheny 41% 55% 4% Southwest 27% 60% 13% Northwest 45% 46% 8% Central 29% 63% 8% Southeast 44% 48% 8% Employment* Fulltime 37% 55% 8% Other 37% 48% 14% Retired 40% 57% 3%
How would you rate the way that Tom Wolf is handling his job as Governor? Would you say he is going an excellent job, a good job, only a fair job, or a poor job as Governor?
12
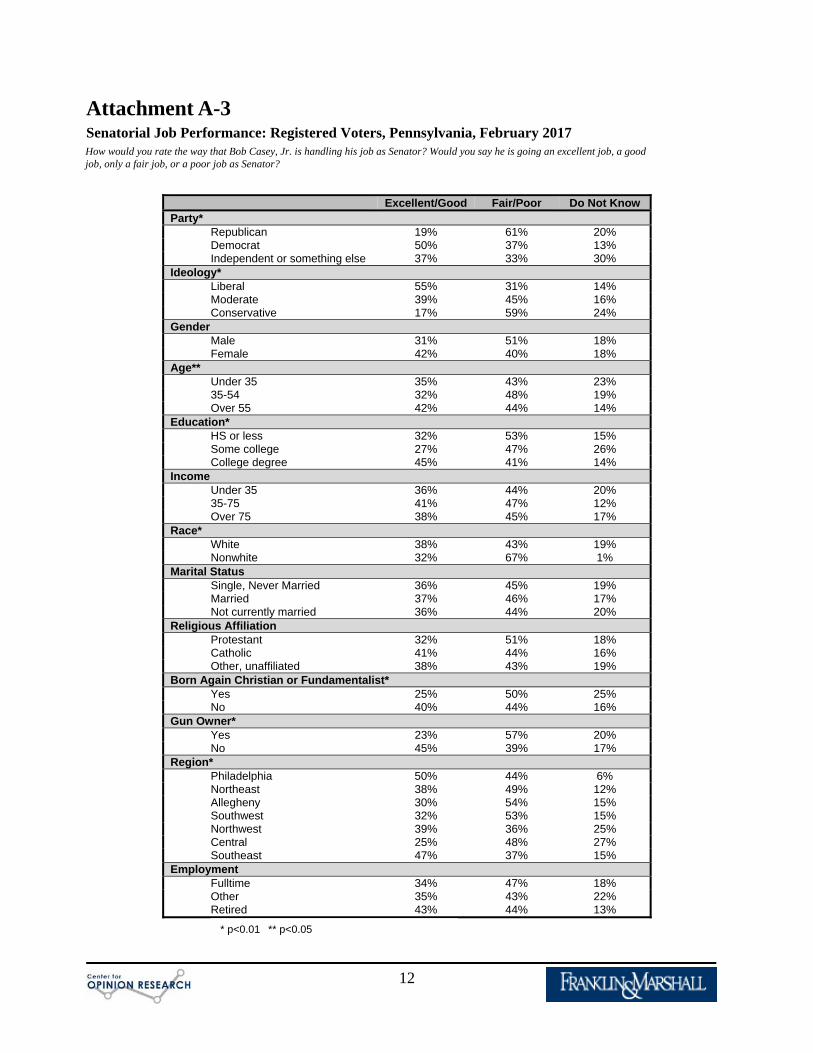
Attachment A-3 Senatorial Job Performance: Registered Voters, Pennsylvania, February 2017
Excellent/Good Fair/Poor Do Not Know Party* Republican 19% 61% 20% Democrat 50% 37% 13% Independent or something else 37% 33% 30% Ideology* Liberal 55% 31% 14% Moderate 39% 45% 16% Conservative 17% 59% 24% Gender Male 31% 51% 18% Female 42% 40% 18% Age** Under 35 35% 43% 23% 35-54 32% 48% 19% Over 55 42% 44% 14% Education* HS or less 32% 53% 15% Some college 27% 47% 26% College degree 45% 41% 14% Income Under 35 36% 44% 20% 35-75 41% 47% 12% Over 75 38% 45% 17% Race* White 38% 43% 19% Nonwhite 32% 67% 1% Marital Status Single, Never Married 36% 45% 19% Married 37% 46% 17% Not currently married 36% 44% 20% Religious Affiliation Protestant 32% 51% 18% Catholic 41% 44% 16% Other, unaffiliated 38% 43% 19% Born Again Christian or Fundamentalist* Yes 25% 50% 25% No 40% 44% 16% Gun Owner* Yes 23% 57% 20% No 45% 39% 17% Region* Philadelphia 50% 44% 6% Northeast 38% 49% 12% Allegheny 30% 54% 15% Southwest 32% 53% 15% Northwest 39% 36% 25% Central 25% 48% 27% Southeast 47% 37% 15% Employment Fulltime 34% 47% 18% Other 35% 43% 22% Retired 43% 44% 13%
How would you rate the way that Bob Casey, Jr. is handling his job as Senator? Would you say he is going an excellent job, a good job, only a fair job, or a poor job as Senator?
* p<0.01 ** p<0.05
13
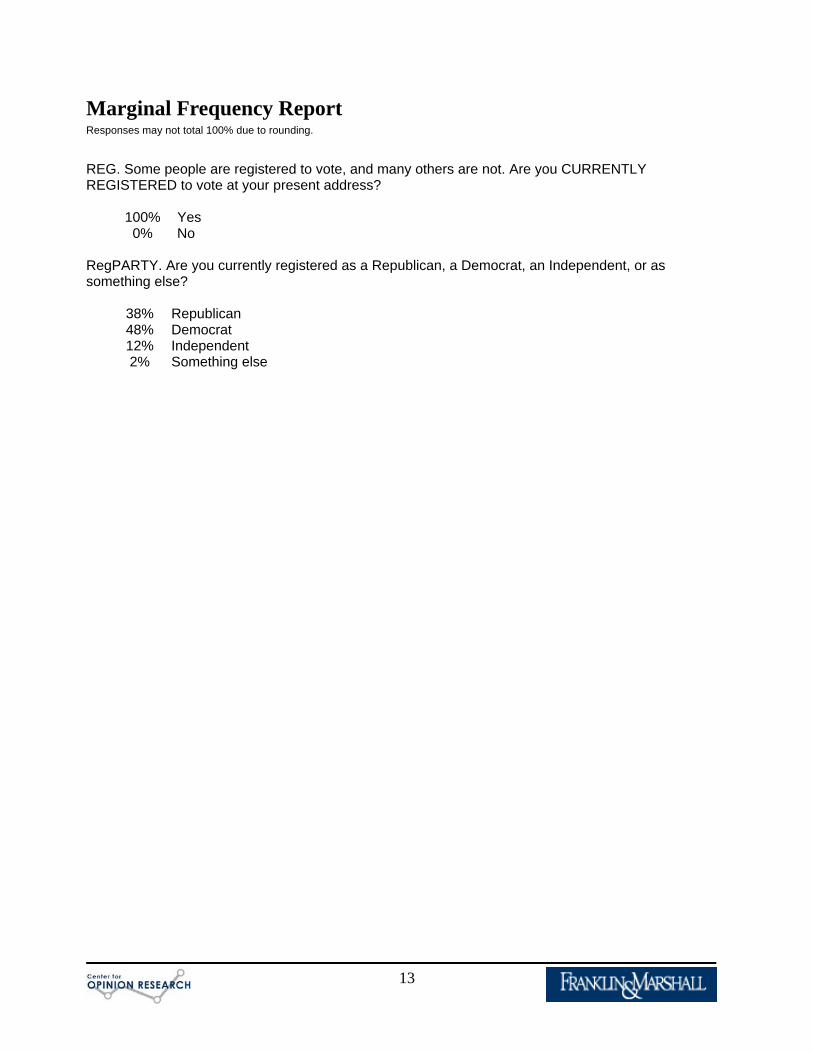
Marginal Frequency Report Responses may not total 100% due to rounding.
REG. Some people are registered to vote, and many others are not. Are you CURRENTLY REGISTERED to vote at your present address?
100% Yes 0% No
RegPARTY. Are you currently registered as a Republican, a Democrat, an Independent, or as something else?
38% Republican 48% Democrat 12% Independent 2% Something else
14
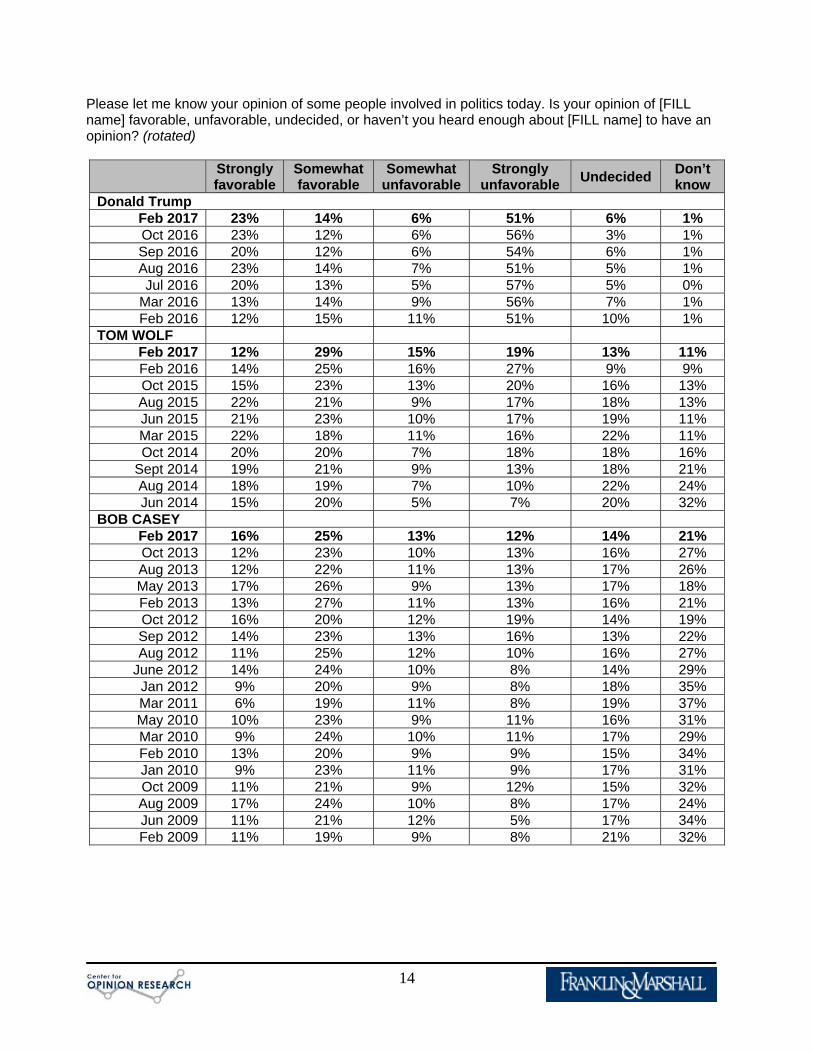
Please let me know your opinion of some people involved in politics today. Is your opinion of [FILL name] favorable, unfavorable, undecided, or haven’t you heard enough about [FILL name] to have an opinion? (rotated)
Strongly favorable
Somewhat favorable
Somewhat unfavorable
Strongly unfavorable
Undecided Don’t know
Donald Trump Feb 2017 23% 14% 6% 51% 6% 1% Oct 2016 23% 12% 6% 56% 3% 1% Sep 2016 20% 12% 6% 54% 6% 1% Aug 2016 23% 14% 7% 51% 5% 1% Jul 2016 20% 13% 5% 57% 5% 0%
Mar 2016 13% 14% 9% 56% 7% 1% Feb 2016 12% 15% 11% 51% 10% 1%
TOM WOLF Feb 2017 12% 29% 15% 19% 13% 11% Feb 2016 14% 25% 16% 27% 9% 9% Oct 2015 15% 23% 13% 20% 16% 13% Aug 2015 22% 21% 9% 17% 18% 13% Jun 2015 21% 23% 10% 17% 19% 11% Mar 2015 22% 18% 11% 16% 22% 11% Oct 2014 20% 20% 7% 18% 18% 16%
Sept 2014 19% 21% 9% 13% 18% 21% Aug 2014 18% 19% 7% 10% 22% 24% Jun 2014 15% 20% 5% 7% 20% 32%
BOB CASEY Feb 2017 16% 25% 13% 12% 14% 21% Oct 2013 12% 23% 10% 13% 16% 27% Aug 2013 12% 22% 11% 13% 17% 26% May 2013 17% 26% 9% 13% 17% 18% Feb 2013 13% 27% 11% 13% 16% 21% Oct 2012 16% 20% 12% 19% 14% 19% Sep 2012 14% 23% 13% 16% 13% 22% Aug 2012 11% 25% 12% 10% 16% 27%
June 2012 14% 24% 10% 8% 14% 29% Jan 2012 9% 20% 9% 8% 18% 35% Mar 2011 6% 19% 11% 8% 19% 37% May 2010 10% 23% 9% 11% 16% 31% Mar 2010 9% 24% 10% 11% 17% 29% Feb 2010 13% 20% 9% 9% 15% 34% Jan 2010 9% 23% 11% 9% 17% 31% Oct 2009 11% 21% 9% 12% 15% 32% Aug 2009 17% 24% 10% 8% 17% 24% Jun 2009 11% 21% 12% 5% 17% 34% Feb 2009 11% 19% 9% 8% 21% 32%

15
RightDir. All in all, do you think things in Pennsylvania are generally headed in the right direction, or do you feel that things are off on the wrong track?
Headed in Right Direction Off on the Wrong Track Don’t know Feb 2017 35% 52% 13% Mar 2016 24% 66% 10% Feb 2016 21% 67% 12% Jan 2016 21% 67% 12% Oct 2015 26% 62% 12% Aug 2015 32% 54% 13% Jun 2015 36% 47% 17% Mar 2015 39% 47% 15% Oct 2014 28% 61% 11%
Sept 2014 29% 60% 11% Aug 2014 27% 61% 13% Jun 2014 30% 59% 11% Jan 2014 25% 62% 13% Oct 2013 25% 61% 13% Aug 2013 26% 62% 12% May 2013 28% 58% 13% Aug 2012 31% 56% 13%
June 2012 30% 57% 13% Feb 2012 31% 56% 13% Jan 2012 38% 47% 15% Oct 2011 38% 49% 13% Aug 2011 34% 53% 13% Mar 2011 37% 53% 10% Oct 2010 27% 64% 9% Sep 2010 31% 59% 10% Aug 2010 30% 58% 12% May 2010 35% 55% 10% Mar 2010 32% 58% 10% Feb 2010 37% 50% 13% Jan 2010 39% 53% 8%
FinToday. We are interested in how people are getting along financially these days. Would you say that YOU and YOUR FAMILY are better off, worse off, or about the same financially as you were a year ago?
Feb 2017 Oct 2016 Sep 2016 Aug 2016 Jul 2016 Better off 21% 22% 23% 24% 24% Worse off 19% 24% 21% 24% 22%
About the same 60% 53% 56% 52% 54% Don’t know 1% 1% 1% 1% 1%

16
FinFut. Now looking AHEAD, do you think that A YEAR FROM NOW, YOU and YOUR FAMILY will be better off financially than you are now, worse off, or about the same as you are now?
Feb 2017 Oct 2016 Sep 2016 Aug 2016 Jul 2016 Better off 28% 25% 25% 25% 24% Worse off 15% 7% 7% 8% 7%
About the same 49% 49% 52% 53% 55% Don’t know 8% 19% 16% 14% 14%
MIP_PA. What do you think is the MOST IMPORTANT problem facing PENNSYLVANIA TODAY?
Oct Jan Jun Aug Sept Oct Mar Jun Aug Oct Jan Feb Mar Feb 2013 2014 2014 2014 2014 2014 2015 2015 2015 2015 2016 2016 2016 2017 17% 11% 15% 14% 13% 14% 16% 17% 22% 39% 38% 47% 45% 24% Government, politicians 21% 19% 23% 29% 30% 25% 19% 18% 21% 16% 18% 12% 13% 16% Education, school
17% 26% 21% 16% 16% 20% 15% 18% 15% 12% 8% 9% 13% 12% Unemployment, personal finances
8% 11% 9% 10% 11% 9% 17% 12% 12% 9% 9% 10% 7% 11% Taxes 2% 1% 1% 2% 1% 2% 3% 2% 3% 2% 3% 2% 1% 5% Crime, drugs, violence, guns
4% 3% 5% 3% 2% 2% 4% 5% 3% 2% 2% 1% 2% 4% Roads, infrastructure, transportation
8% 4% 3% 2% 2% 2% 4% 1% 1% 2% 2% 1% 2% 4% Healthcare, insurance 5% 5% 5% 3% 4% 5% 6% 7% 4% 4% 4% 4% 5% 3% Economy, finances 4% 2% 5% 5% 3% 5% 3% 6% 5% 2% 2% 2% 2% 3% Energy issues, gas prices 1% 1% 1% 0% 1% 0% 0% 1% 1% 1% 0% 1% 1% 2% Retaining, attracting businesses 1% 1% 1% 1% 0% 1% 1% 1% 1% 1% 1% 1% 1% 2% Environment 1% 1% 1% 0% 0% 1% 1% 1% 1% 1% 1% 0% 1% 2% Social issues 0% 2% 1% 1% 1% 1% 2% 1% 2% 0% 1% 1% 1% 1% Values, morals 2% 1% 1% 1% 2% 1% 1% 0% 1% 1% 0% 0% 1% 1% Welfare 0% 0% 0% 1% 0% 1% 1% 1% 0% 0% 0% 1% 0% 1% Immigration 2% 1% 1% 0% 1% 0% 1% 0% 0% 0% 0% 0% 0% 1% Civil liberties 0% 0% 0% 1% 0% 0% 0% 0% 0% 0% 0% 0% 0% 1% Justice system, Lawyers 0% 0% 0% 0% 0% 0% 0% 0% 0% 0% 0% 0% 0% 1% Racism 1% 1% 1% 1% 4% 1% 1% 6% 1% 1% 1% 0% 0% 0% Senior issues, social security 0% 0% 0% 0% 1% 0% 0% 0% 0% 0% 0% 0% 0% 0% Foreign policy, terrorism, war
0% 0% 0% 1% 0% 0% 0% 0% 0% 0% 0% 0% 0% 0% Personal illness, health problems, family issues
3% 2% 2% 4% 3% 2% 2% 3% 2% 3% 4% 4% 3% 4% Other 7% 8% 7% 8% 6% 8% 5% 0% 6% 6% 8% 5% 3% 6% Don't know
Rate_Gov. How would you rate the way that Tom Wolf is handling his job as Governor? Would you say he is doing an…
Excellent job Good job Only a fair job Poor job Don’t knowFeb 2017 4% 34% 35% 19% 8% Feb 2016 4% 27% 32% 29% 7% Jan 2016 5% 28% 36% 26% 6% Oct 2015 6% 30% 37% 21% 6% Aug 2015 7% 32% 34% 17% 10% Jun 2015 8% 31% 34% 16% 13% Mar 2015 7% 31% 29% 14% 19%

17
FinPA. The governor recently announced his proposed state budget for the coming fiscal year. How would you describe the financial condition of state government today?
Very Good
Good Bad Very Bad Don’t know
Feb 2017 1% 23% 42% 12% 23% Feb 2012 1% 23% 44% 24% 9% Mar 2011 1% 14% 47% 31% 7% Feb 2009 0% 23% 46% 20% 11%
ComPA. Do you think Pennsylvania’s financial condition is better than, worse than, or about the same as other states?
Better off Worse off About the same Don’t know
Feb 2017 14% 30% 38% 18% Feb 2012 19% 13% 54% 14% Mar 2011 17% 20% 51% 12% Feb 2009 24% 15% 48% 13%
ConGov. How confident are you in Governor Wolf’s ability to handle the state’s budget problems? Are you…very confident, somewhat confident, not very confident, or not at all confident?
MinWage. During his budget address, Governor Wolf proposed raising the state's minimum wage. Do you favor or oppose raising the state’s minimum wage from $7.25 to $12.00 per hour?
6% Very confident 46% Somewhat Confident 27% Not Very Confident 14% Nat at all Confident 7% Do not know
39% Strongly Favor 22% Somewhat Favor 15% Somewhat Oppose 22% Strongly Oppose 2% Do not know

18
RateSenC. How would you rate the way that Bob Casey, JR. is handling his job as U.S. SENATOR? Would you say he is doing… an excellent job, a good job, only a fair job, or a poor job as U.S. Senator?
Excellent Job Good Job Only a Fair Job Poor Job Don’t Know Feb 2017 10% 27% 31% 14% 18% Oct 2013 5% 25% 34% 17% 20% Aug 2013 5% 23% 39% 15% 19% Oct 2012 6% 31% 33% 18% 12% Sep 2012 7% 31% 32% 15% 16% Aug 2012 4% 32% 37% 11% 16%
June 2012 5% 33% 32% 8% 21% Feb 2012 4% 26% 43% 12% 15% Jan 2012 4% 31% 36% 11% 19% Oct 2011 5% 33% 38% 9% 16% Aug 2011 5% 27% 43% 9% 16% Mar 2011 3% 26% 39% 9% 23% Feb 2009 7% 31% 32% 10% 20% Aug 2007 5% 37% 36% 7% 15%
UStrk. All in all, do you think things in the UNITED STATES are generally headed in the RIGHT DIRECTION, or do you feel that things are off on the WRONG TRACK?
Feb 2017 Oct 2016 Sep 2016 Aug 2016 Jul 2016 Right direction 29% 35% 36% 32% 38%
Wrong track 66% 58% 57% 61% 57% Don’t know 6% 7% 7% 7% 5%
MIP_US. What do you think is the MOST IMPORTANT problem facing the UNITED STATES TODAY?
41% Government, politicians 10% Immigration 7% Foreign policy, terrorism, war 6% Unemployment, personal finances 5% Economy, finances 4% Healthcare, insurance 4% Global events 3% Racism 2% Education, school 2% Environment 2% Civil liberties 1% Taxes 1% Crime, drugs, violence, guns 1% Social issues 1% Welfare 8% Other 3% Don't know

19
RatePres. How would you rate the way that Donald Trump is handling his job as president? Would you say he is doing… an excellent job, a good job, only a fair job, or a poor job as President?
Excellent
Job Good Job
Only a Fair Job
Poor Job
Don’t Know
Feb 2017 13% 19% 13% 54% 1% ConfPres. How confident are you in President Trump’s ability to handle the economy? Are you… very confident, somewhat confident, not very confident, or not at all confident?
Feb 2017 Feb 2009 (Obama)
Very confident 28% 27% Somewhat confident 23% 43% Not very confident 12% 14% Not at all confident 36% 15% Don’t know 1% 1%
ConfPresFA. How confident are you in President Trump’s ability to handle America’s relationships with other countries? Are you… very confident, somewhat confident, not very confident, or not at all confident?
ConfPresIm. How confident are you in President Trump’s ability to handle immigration? Are you… very confident, somewhat confident, not very confident, or not at all confident?
PresHon On a scale from one to ten where one means dishonest and ten means honest, where would you place President Trump’s honesty?
15% Very confident 23% Somewhat Confident 13% Not Very Confident 47% Nat at all Confident 1% Do not know
24% Very confident 17% Somewhat Confident 11% Not Very Confident 46% Nat at all Confident 2% Do not know
n Mean St.Dev. 807 4.45 3.39

20
PrimNews What is your PRIMARY source for news?
*updated to exclude social media in February 2017
CabNet Which cable network do you rely on the most?
MedFairPres Do you think that the media treats President Trump fairly or unfairly? Is that very or somewhat?
HC_USA Do you think the country’s healthcare system works pretty well and needs only minor changes to work better, or do you think the country’s healthcare system has so many problems that it should be completely rebuilt?
43% Works pretty well and needs only minor changes 53% Has so many problems that it should be completely rebuilt 3% Do not know
HCRL1 Do you think that the passage of the healthcare reform law in 2010, known as the Affordable Care Act or Obamacare, has made the healthcare system better or worse for most Americans?
49% Better 41% Worse 6% About the same 4% Do not know
Feb 2017 Oct 2016 Sep 2016 Aug 2016 Jul 2016 Cable television, such as Fox, CNN, or MSNBC 31% 29% 30% 28% 27% Internet (other than social media)* 28% 33% 32% 28% 35% Network television, such as ABC, CBS, or NBC 18% 19% 20% 21% 20% Daily newspaper (such as the Inquirer or Daily News) 8% 7% 8% 11% 10% Radio 8% 7% 7% 6% 6% Social media (Twitter, Facebook, SnapChat, Instagram) 3% -- -- -- -- Neighborhood newspaper 1% 2% 2% 2% 2% Other 3% 4% 2% 3% 1% Do not know 1% 0% 1% 1% 0%
n=252 44% Fox News Channel 29% CNN 15% MSNBC 1% None, nothing 1% Fox Business Network 10% Other 2% Do not know
32% Very fairly 21% Somewhat fairly 13% Somewhat unfairly 32% Very unfairly 3% Do not know

21
HCRL4 What effect did the passage of the Affordable Care Act have on you personally? Would you say you and your family are better off, worse off, or about the same as a result of health care reform?
19% Better off 28% Worse off 51% About the same 2% Do not know
HCRL7 Which comes closest to how you feel about the Affordable Care Act? The law should… (rotated)
9% Be kept in place mostly as is 60% Have a few changes to make it work better 29% Be repealed entirely. 3% Do not know
DEMO I now have a final few questions for statistical purposes only. CNTY. Region of state (What is the name of the county you live in?)
26% Central 24% Southeast 12% Northeast 10% Allegheny 9% Southwest 9% Philadelphia 8% Northwest
AGE. What was your age on your last birthday?
8% 18-24 18% 25-34 14% 35-44 18% 45-54 15% 55-64 26% 65 and older
EDUC. What was the highest grade level of schooling you have completed?
1% Non high school graduate 20% High school graduate or GED 18% Some college 13% Associate’s degree or technical degree 26% Bachelor’s degree 22% Post graduate degree
22
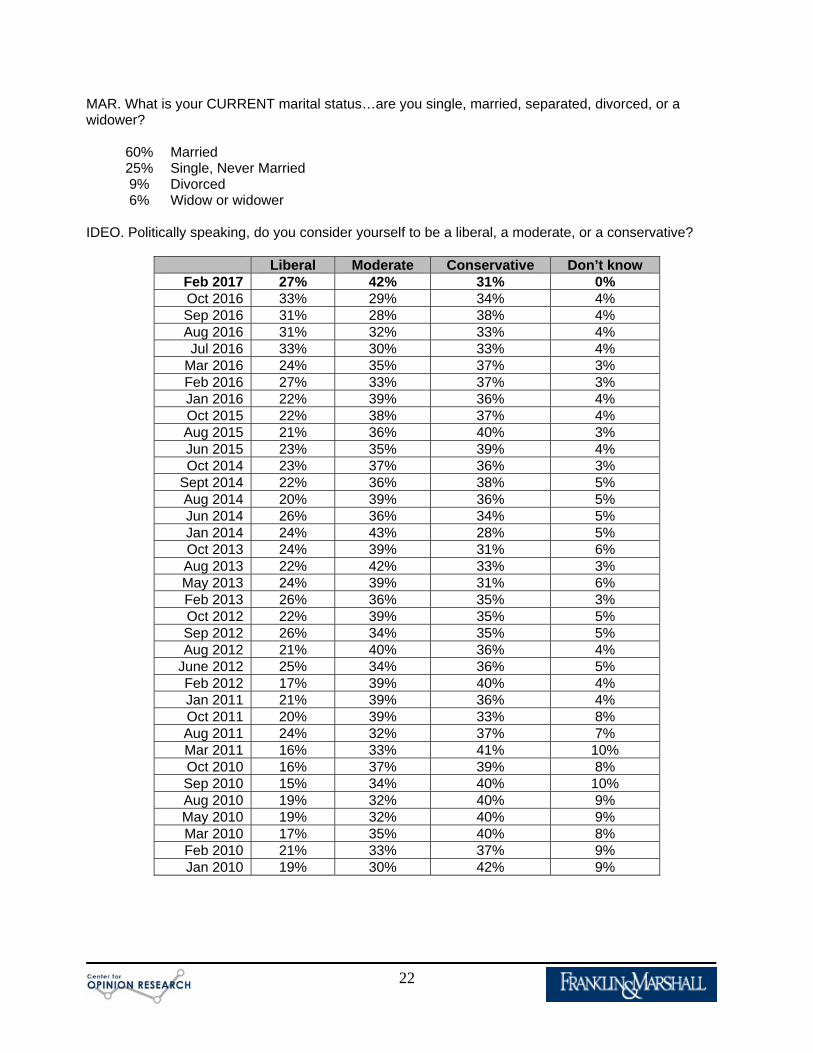
MAR. What is your CURRENT marital status…are you single, married, separated, divorced, or a widower?
60% Married 25% Single, Never Married 9% Divorced 6% Widow or widower
IDEO. Politically speaking, do you consider yourself to be a liberal, a moderate, or a conservative?
Liberal Moderate Conservative Don’t know Feb 2017 27% 42% 31% 0% Oct 2016 33% 29% 34% 4% Sep 2016 31% 28% 38% 4% Aug 2016 31% 32% 33% 4% Jul 2016 33% 30% 33% 4%
Mar 2016 24% 35% 37% 3% Feb 2016 27% 33% 37% 3% Jan 2016 22% 39% 36% 4% Oct 2015 22% 38% 37% 4% Aug 2015 21% 36% 40% 3% Jun 2015 23% 35% 39% 4% Oct 2014 23% 37% 36% 3%
Sept 2014 22% 36% 38% 5% Aug 2014 20% 39% 36% 5% Jun 2014 26% 36% 34% 5% Jan 2014 24% 43% 28% 5% Oct 2013 24% 39% 31% 6% Aug 2013 22% 42% 33% 3% May 2013 24% 39% 31% 6% Feb 2013 26% 36% 35% 3% Oct 2012 22% 39% 35% 5% Sep 2012 26% 34% 35% 5% Aug 2012 21% 40% 36% 4%
June 2012 25% 34% 36% 5% Feb 2012 17% 39% 40% 4% Jan 2011 21% 39% 36% 4% Oct 2011 20% 39% 33% 8% Aug 2011 24% 32% 37% 7% Mar 2011 16% 33% 41% 10% Oct 2010 16% 37% 39% 8% Sep 2010 15% 34% 40% 10% Aug 2010 19% 32% 40% 9% May 2010 19% 32% 40% 9% Mar 2010 17% 35% 40% 8% Feb 2010 21% 33% 37% 9% Jan 2010 19% 30% 42% 9%
23
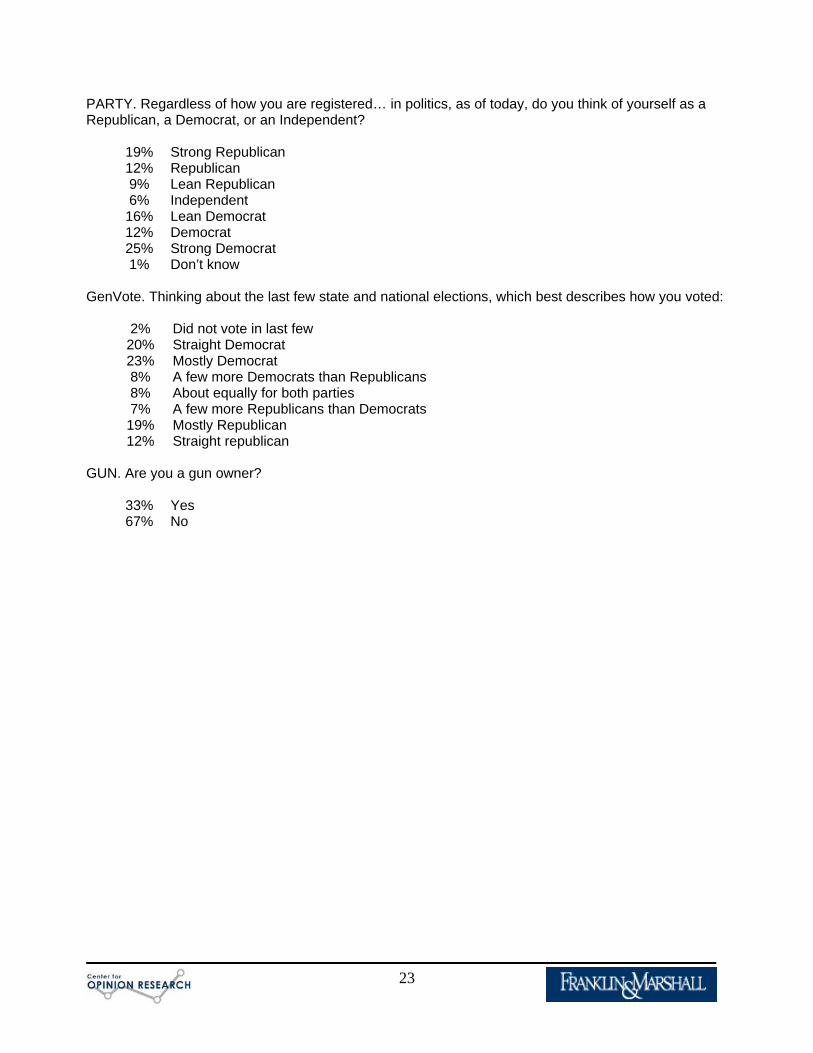
PARTY. Regardless of how you are registered… in politics, as of today, do you think of yourself as a Republican, a Democrat, or an Independent?
19% Strong Republican 12% Republican 9% Lean Republican 6% Independent 16% Lean Democrat 12% Democrat 25% Strong Democrat 1% Don’t know
GenVote. Thinking about the last few state and national elections, which best describes how you voted:
2% Did not vote in last few 20% Straight Democrat 23% Mostly Democrat 8% A few more Democrats than Republicans 8% About equally for both parties 7% A few more Republicans than Democrats 19% Mostly Republican 12% Straight republican
GUN. Are you a gun owner?
33% Yes 67% No
24
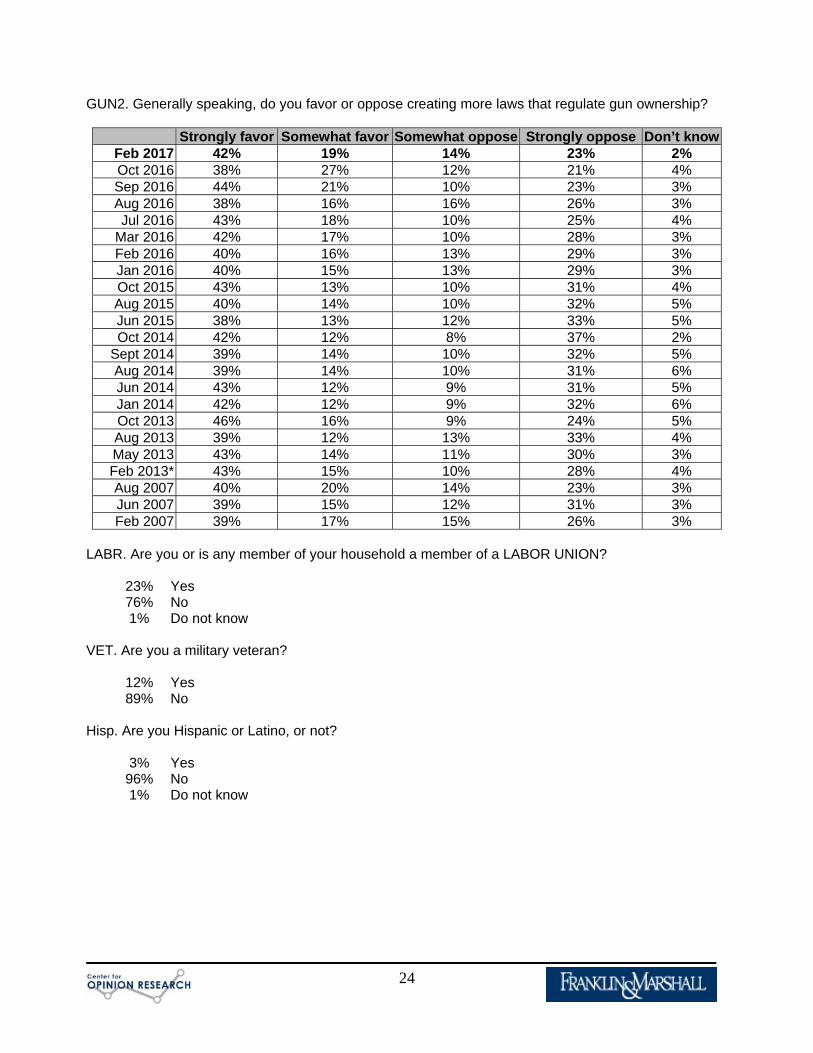
GUN2. Generally speaking, do you favor or oppose creating more laws that regulate gun ownership?
Strongly favor Somewhat favor Somewhat oppose Strongly oppose Don’t knowFeb 2017 42% 19% 14% 23% 2% Oct 2016 38% 27% 12% 21% 4% Sep 2016 44% 21% 10% 23% 3% Aug 2016 38% 16% 16% 26% 3% Jul 2016 43% 18% 10% 25% 4%
Mar 2016 42% 17% 10% 28% 3% Feb 2016 40% 16% 13% 29% 3% Jan 2016 40% 15% 13% 29% 3% Oct 2015 43% 13% 10% 31% 4% Aug 2015 40% 14% 10% 32% 5% Jun 2015 38% 13% 12% 33% 5% Oct 2014 42% 12% 8% 37% 2%
Sept 2014 39% 14% 10% 32% 5% Aug 2014 39% 14% 10% 31% 6% Jun 2014 43% 12% 9% 31% 5% Jan 2014 42% 12% 9% 32% 6% Oct 2013 46% 16% 9% 24% 5% Aug 2013 39% 12% 13% 33% 4% May 2013 43% 14% 11% 30% 3% Feb 2013* 43% 15% 10% 28% 4% Aug 2007 40% 20% 14% 23% 3% Jun 2007 39% 15% 12% 31% 3% Feb 2007 39% 17% 15% 26% 3%
LABR. Are you or is any member of your household a member of a LABOR UNION?
23% Yes 76% No 1% Do not know
VET. Are you a military veteran?
12% Yes 89% No
Hisp. Are you Hispanic or Latino, or not?
3% Yes 96% No 1% Do not know

25
RACE. Which of the following categories best describes your racial background?
93% White 8% Non-white
REL. Do you consider yourself to be Protestant, Catholic, some other religion, or not affiliated with any religion?
31% Protestant 26% Catholic 15% Some other religion 28% Not affiliated with any religion
BAC. Do you consider yourself to be a born-again Christian or fundamentalist, or not?
20% Yes 77% No 3% Don’t know
WORK. Are you currently working fulltime, part-time, going to school, keeping house or something else?
54% Full-time 22% Retired 12% Part-time 3% Something else 4% Disabled 2% Unemployed 2% Going to school
INCOME. And, just for statistical purposes, we need to know if your total family income is above or below $50,000 per year?
10% Under $25,000 10% $25-$35,000 11% $35-50,000 18% $50-75,000 18% $75-100,000 28% Over $100,000 5% Don’t know
DONE. Sex of respondent:
48% Male 52% Female