september 2015 realtors® confidence index
DESCRIPTION
This report is a key indicator of housing market strength based on a monthly survey sent to over 50,000 real estate practitioners.TRANSCRIPT


REALTORS® CONFIDENCE INDEX SURVEY Report on the September 2015 Survey
The REALTORS® Confidence Index (RCI) report provides monthly information about real estate market conditions and expectations, buyer/seller traffic, price trends, buyers’ characteristics, and issues affecting real estate based on a monthly survey of REALTORS®.
The September 2015 report is based on the responses of 3,068 REALTORS® about local market conditions experienced in September and the characteristics of their most recent sale for the month. The data collected from a random sample of REALTORS® is viewed to be representative of the sales for the month.1 The online survey was conducted from October 1-11, 2015. All real estate is local: conditions in specific markets may vary from the overall national trends presented in this report. REALTORS® may be interested in comparing their markets against the national summary.
The RCI report is an output of the Research Division of the NATIONAL ASSOCIATION of REALTORS®.2 For questions or information about this report, please email [email protected].
Lawrence Yun, Senior Vice President and Chief Economist Danielle Hale, Managing Director, Housing Research Gay Cororaton, Research Economist Meredith Dunn, Research Communications Manager
Research Division NATIONAL ASSOCIATION of REALTORS® 500 New Jersey Avenue, NW Washington, DC 20001 202.383.1000
1 The survey is sent to 50,000 REALTORS® who are selected through simple random sampling. To increase the response rate, the survey is also sent to respondents in the previous three surveys who provided their email addresses. The number of responses to a specific question varies because the question may not be applicable to the respondent or because of non-response. To encourage survey participation, eight REALTORS® are randomly selected to receive a gift card. 2 Thanks to Jessica Lautz, Director, Survey Research and Communications, and Amanda Riggs, Research Survey Analyst, for their comments in improving the survey and in editing the report.
1

Table of Contents
Summary .................................................................................................................................................... 3
I. Market Conditions .................................................................................................................................. 4
REALTORS® Broadly Reported an Improving Market Compared to a Year Ago .................................. 4
REALTORS® Still Broadly Optimistic Over the Next Six Months .......................................................... 4
REALTORS® Reported Stronger Buyer and Seller Traffic Compared to a Year Ago ............................. 7
REALTORS® Expect Prices to Increase Modestly in Next 12 Months .................................................. 10
Properties On the Market at 49 Days ...................................................................................................... 11
II. Buyer and Seller Characteristics ......................................................................................................... 14
Sales to First-time Buyers: 29 Percent of Sales ...................................................................................... 14
Sales for Investment Purposes: 13 Percent of Sales ............................................................................... 14
Distressed Sales: Seven Percent of Sales ................................................................................................ 15
Cash Sales: 24 Percent of Sales .............................................................................................................. 17
International Transactions: Less than Two Percent of Residential Market ............................................ 19
Age, Previous Residence, and Type of Property Purchased ................................................................... 20
III. Current Issues .................................................................................................................................... 21
Demand for Rentals Remain Strong ....................................................................................................... 21
Credit Conditions Still Generally Tight .................................................................................................. 23
Contract Settlement Issues: Financing and Appraisals are Major Issues ................................................ 25
2

Summary
The information provided by REALTORS® based on their client interactions indicates that market activity broadly improved in September 2015 compared to a year ago. Compared to August 2015, market activity slowed, in part due to the seasonal downturn after the spring and summer months. On one hand, sustained job growth and low interest rates, with the 30-year fixed mortgage rate back to less than four percent in September, appeared to be boosting demand. On the other hand, the lack of inventory and high home prices were reported to be moderating demand, although some REALTORS® reported declining prices in their areas.
The confidence indices for current conditions and the six-month outlook for single-family, townhome, and condominium properties all increased compared to a year ago but decreased compared to last month, partly due to the seasonal drop in demand.The buyer traffic index also increased compared to a year ago, while the seller traffic index stayed below 50, an indication of tight supply across many local markets. First-time home buyers accounted for 29 percent of sales, the same as last year. Approximately 11 percent of respondents worked with a potential buyer who was previously involved in a foreclosure or short sale. Cash sales made up 24 percent of sales, purchases for investment purposes accounted for 13 percent of sales, and distressed properties dropped to seven percent of sales. Compared to a year ago, properties sold faster, typically at 49 days nationally. It typically took another 35 days to close the sale.
Tight inventories, decreasing affordability, continued tight mortgage availability, and slow/excessively conservative appraisals were the main issues reported by respondents. Approximately 92 percent of respondents reported taking measures to be ready for the implementation of the new disclosure regulations (that took effect on October 3, 2015) such as attending seminars, coordinating with lenders, advising clients, and revising model contracts in line with the new TILA-RESPA guidelines.
September 2015 REALTORS® Confidence Index Survey Highlights Sept 2015 Aug 2015 Sept 2014 RCI Current Conditions: Single-Family Sales 61 66 51 RCI Six-Month Outlook: Single-Family Sales 62 66 53 RCI Buyer Traffic Index 53 60 44 RCI Seller Traffic Index 41 45 39 First-Time Buyers, as Percent of Sales1 29 32 29 Sales to Investors, as Percent of Sales 13 12 14 Cash Sales, as Percent of Sales 24 22 24 Distressed Sales, as Percent of Sales 7 7 10 Second/ vacation homes, as Percent of Sales 9 9 10 Relocation Buyers, as Percent of Sales 14 14 13 Median Days on Market 49 47 56 Median Expected Price Growth in Next 12 Months (%) 3.2 3.5 3.1 1 - NAR’s 2014 Profile of Home Buyer and Sellers (HBS) reports that among primary residence home buyers, 33 percent were first-time home buyers. The HBS surveys primary residence home buyers, while the monthly RCI Survey surveys REALTORS® and also captures purchases for investment purposes and vacation/second homes.
3

I. Market Conditions
REALTORS® Broadly Reported an Improving Market Compared to a Year Ago
Market conditions vary across local markets and states, but REALTORS® generally reported improving market activity in September 2015 compared to a year ago.3 Compared to August 2015, REALTORS® reported a seasonal slowdown which is normal at this time of the year. The REALTORS® Confidence Index - Current Conditions chart below shows that single-family homes stood at 61 on the index (66 in August 2015; 51 in September 2014). The indices for townhomes and condominiums increased compared to their levels a year ago, but were below 50, indicating more respondents viewed their markets as “weak” than “strong.” REALTORS® continued to report on the difficulty of obtaining financing for condominium unit purchases because many condominiums are not FHA or GSE eligible.4 Sustained job growth and low interest rates, with the 30-year fixed mortgage rate back to less than four percent in September, were reported to be sustaining demand.
REALTORS® Still Broadly Optimistic Over the Next Six Months
In September 2015, REALTORS® were by and large “strongly” confident about the outlook over the next six months for single-family homes compared to a year ago although less so than in August 2015.5 The REALTORS® Confidence Index - Six-Month Outlook registered at 62 (66 in
3 This is a diffusion index which measures the direction of and broadness of the respondents’ market conditios or confidence. An index of 50 indicates a balance of respondents having “weak” (index=0) and “strong” (index=100) expectations or all respondents having moderate (=50) expectations. The index is not adjusted for seasonality effects. 4 FHA and the GSEs have financing eligibility criteria relating to ownership occupancy requirements, delinquent dues, project approval process, and use for commercial space. See the Statement of NAR Submitted for the Record to the Senate Committee Housing and Banking Affairs on December 9, 2014 at http://www.ksefocus.com/billdatabase/clientfiles/172/1/2180.pdf 5 Respondents were asked “What are your expectations for the housing market over the next six months compared to the current state of the market in the neighborhood(s) or area(s) where you make most of your sales?”
61
43
40
0
20
40
60
80
2008
0120
0805
2008
0920
0901
2009
0520
0909
2010
0120
1005
2010
0920
1101
2011
0520
1109
2012
0120
1205
2012
0920
1301
2013
0520
1309
2014
0120
1405
2014
0920
1501
2015
0520
1509
REALTORS® Confidence Index: Current Conditions as of Sept 2015
(50 = "Moderate" Conditions)
Single-family Townhome Condominium
4

August 2015; 53 in September 2014). Confidence indices for townhomes and condominiums also rose, but stayed at below 50, indicating that more respondents viewed their markets as “weak” than “strong.” The respondents expressed concern that the TILA-RESPA Integrated Disclosure (TRID) regulations may lead to delayed closings. The TRID regulations will apply to mortgages for which the application was submitted on or after October 3, 2015.6 To prepare for the change, approximately 92 percent of respondents reported taking steps such as attending education seminars, meeting with lenders, advising clients, and revising model contract forms that include extending the number of days to close to allow for unexpected circumstances.
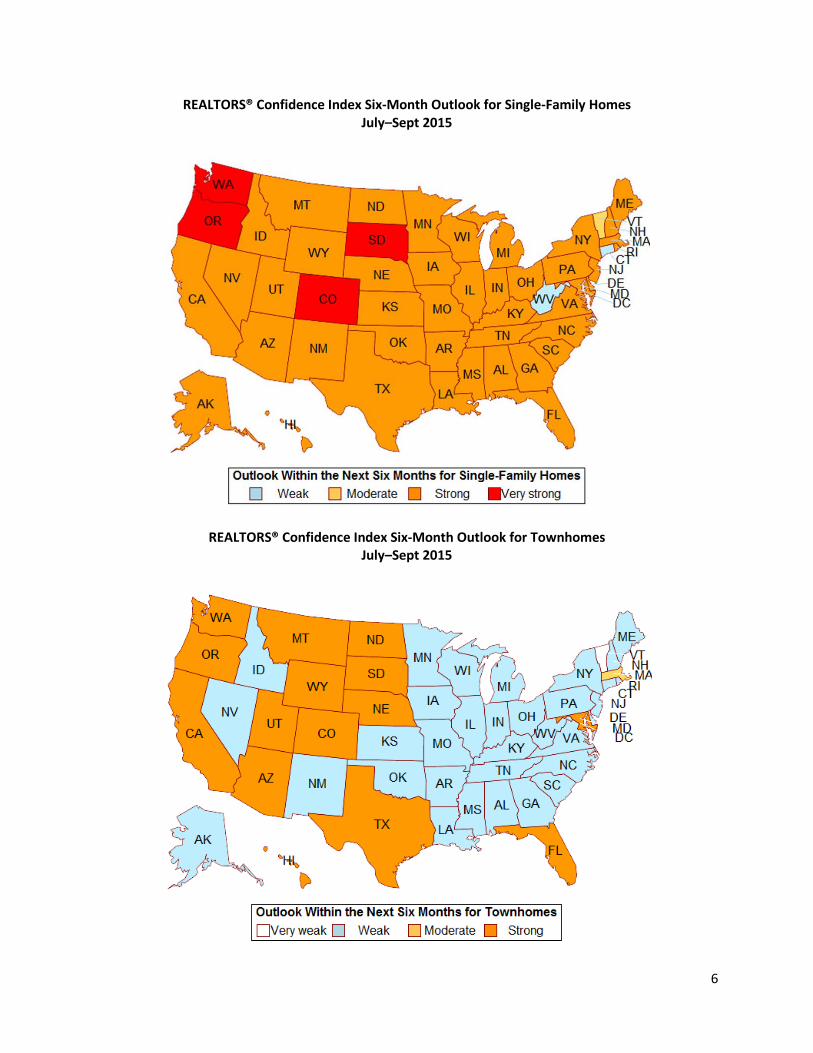
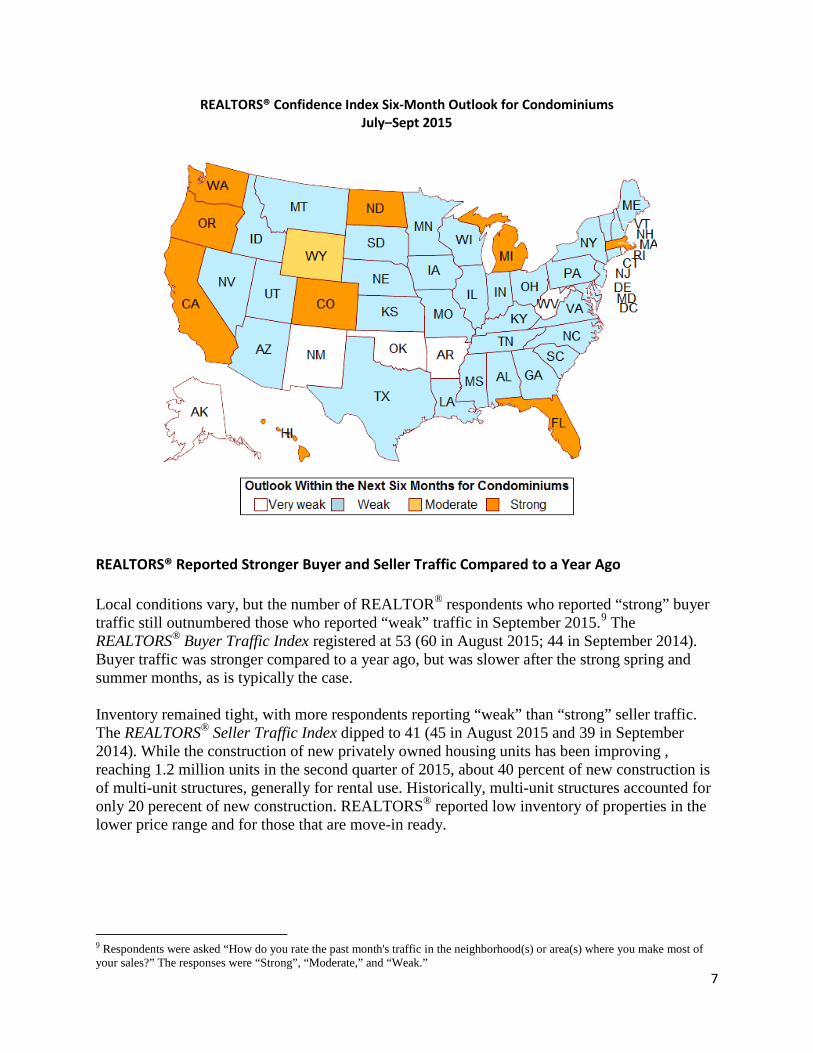
The following maps show the REALTORS® Confidence Index - Six-Month Outlook across property types by state.7 The outlook for single-family homes was broadly “strong” across most states and was most upbeat in Washington, Oregon, Colorado, and South Dakota. In the townhomes market, markets were broadly “strong” in the West region and in Florida, Maryland, and the District of Columbia. The condominium market remains broadly “weak” in many states, but was strong in California, Oregon, Washington, North Dakota, Colorado, Wyoming, Michigan, Massachusetts, and Florida. California, Oregon, Washington, Colorado are experiencing strong job growth and population migration, while Texas and North Dakota appear to be resilient amid the fall in oil prices. REALTORS® have reported difficulty in accessing condominium unit purchase financing for both FHA-insured and the GSE-backed loans. Only 20 percent of condominiums are eligible for FHA condominium unit financing because of strict eligibility criteria such as those pertaining to occupancy requirements and delinquency dues.8
6 TRID prescribes simplified disclosure forms that the lender needs to deliver to the loan applicant after a loan application is received (Loan Estimate) and before a loan is consummated (Disclosure Form) within prescribed business days and waiting periods. The objective is to help consumers understand the key features, costs, and risks of the mortgage loan for which they are applying. See the Consumer Financial Protection Bureau’s guidelines at http://www.consumerfinance.gov/regulatory-implementation/tila-respa/ 7 The market outlook for each state is based on data for the last three months to increase the observations for each state. Small states such as AK, ND, SD, MT, VT, WY, WV, DE, and D.C., may have less than 30 observations. 8 http://www.realtor.org/topics/condominiums/condominium-resource-book
62
45
42
0
20
40
60
80
2008
0120
0805
2008
0920
0901
2009
0520
0909
2010
0120
1005
2010
0920
1101
2011
0520
1109
2012
0120
1205
2012
0920
1301
2013
0520
1309
2014
0120
1405
2014
0920
1501
2015
0520
1509
REALTORS® Confidence Index: Six-Month Outlook as of Sept 2015
(50 = "Moderate" Outlook)
Single-family Townhome Condominium
5
REALTORS® Confidence Index Six-Month Outlook for Single-Family Homes July–Sept 2015
REALTORS® Confidence Index Six-Month Outlook for Townhomes July–Sept 2015
6
REALTORS® Confidence Index Six-Month Outlook for Condominiums July–Sept 2015
REALTORS® Reported Stronger Buyer and Seller Traffic Compared to a Year Ago Local conditions vary, but the number of REALTOR® respondents who reported “strong” buyer traffic still outnumbered those who reported “weak” traffic in September 2015.9 The REALTORS® Buyer Traffic Index registered at 53 (60 in August 2015; 44 in September 2014). Buyer traffic was stronger compared to a year ago, but was slower after the strong spring and summer months, as is typically the case. Inventory remained tight, with more respondents reporting “weak” than “strong” seller traffic. The REALTORS® Seller Traffic Index dipped to 41 (45 in August 2015 and 39 in September 2014). While the construction of new privately owned housing units has been improving , reaching 1.2 million units in the second quarter of 2015, about 40 percent of new construction is of multi-unit structures, generally for rental use. Historically, multi-unit structures accounted for only 20 perecent of new construction. REALTORS® reported low inventory of properties in the lower price range and for those that are move-in ready.
9 Respondents were asked “How do you rate the past month's traffic in the neighborhood(s) or area(s) where you make most of your sales?” The responses were “Strong”, “Moderate,” and “Weak.”
7

In most states, the number of respondents who reported “strong” buyer traffic outnumbered those who reported “weak” buyer, measured by the REALTORS® Buyer Traffic Index. States with the strongest buyer traffic were Washington, Oregon, and Wyoming. Supply conditions, measured by the REALTORS® Seller Traffic Index, remained broadly “weak” in many states, except in Montana, Wyoming, North Dakota, South Dakota , Texas, Alabama, and Maine.
REALTORS® Buyer Traffic Index
July–Sept 2015
53
41
20304050607080
2008
0120
0805
2008
0920
0901
2009
0520
0909
2010
0120
1005
2010
0920
1101
2011
0520
1109
2012
0120
1205
2012
0920
1301
2013
0520
1309
2014
0120
1405
2014
0920
1501
2015
0520
1509
REALTORS® Buyer and Seller Traffic Indices as of Sept 2015
(50 = "Moderate" Conditions)
Buyer Traffic Index Seller Traffic Index
8

REALTORS® Seller Traffic Index July–Sept 2015
NAR also tracks the number of properties shown by REALTORS® based on data available from Sentrilock, LLC data. Foot traffic, as measured by openings of SentriLock LLC’s lock boxes, cooled in September 2015, relative to a year earlier. The index fell from 72.3 to 53.7, but remained above the neutral 50 mark suggesting a modest expansionary trend. The diffusion index measures the share of areas changing relative to a year ago, so the trend suggests plateauing at a high level.This month’s drop in the index in part reflects last year’s strength as the index peaked at 65.3 in September of 2014.10 Foot traffic is an indicator of buyer interest, but a showing may not result in a sale.
10 For more information on the Foot Traffic Index based on Sentrilock, LLC data, please contact Ken Fears or visit: http://www.realtor.org/infographics/foot-traffic
9

REALTORS® Expect Prices to Increase Modestly in Next 12 Months REALTORS® who responded to the September 2015 survey expected prices to increase by 3.2 percent over the next 12 months (3.5 percent in August 2015; 3.1 percent in September 2014).9 REALTORS® expect the recent strong price growth to moderate as rising prices have made homes “unaffordable” for many, with home prices almost at par their levels prior to the housing downturn. The median price of all existing homes sold in the U.S. as of August 2015 was $230,200, almost at par with the peak price of all existing homes at $230,900 in July 2006. The map shows the median expected price change in the next 12 months for each state based on the July-September 2015 RCI surveys.10 REALTOR® respondents from Florida were the most upbeat, with a median expected price growth in the range of five to six percent. In Washington, Oregon, and Colorado, the median expected price growth among respondents was four to five percent.
9 A comparison of the expected price growth for the next 12 months compared to the actual price growth shows the expected price growth to be more conservative than the actual price growth, but both are generally headed in the same direction. 10 In generating the median price expectation at the state level, we use data for the last three surveys to have close to 30 observations. Small states such as AK,ND, SD, MT, VT, WY, WV, DE, and D.C., may have less than 30 observations.
10

Median Expected Price Change of REALTORS® in Next 12 Months, By State July–Sept 2015
Properties On the Market at 49 Days
Properties that closed in September 2015 were typically on the market for a shorter time compared to a year ago, typically at 49 days (47 days in August 2015; 56 days in September 2014).11 Days on market usually increase after the spring and summer months due to the seasonal slowing down in demand. Respondents reported that it typically took another 41 days to close the sale.
Short sales were on the market for the longest time at 135 days, while foreclosed properties generally stayed on the market at 57 days. Non-distressed properties were on the market at 48 days.
11 Respondents were asked “For the last house that you closed in the past month, how long was it on the market from listing time to the time the seller accepted the buyer’s offer?” The median is the number of days at which half of the properties stayed on the market.
11

Approximately 38 percent of properties were on the market for less than a month when sold. About 10 percent were on the market for longer than six months, a decrease from 30 percent in January 2012. Properties that stay on the market for longer are more likely to sell at a discount.
0
50
100
150
200
2011
05
2011
08
2011
11
2012
02
2012
05
2012
08
2012
11
2013
02
2013
05
2013
08
2013
11
2014
02
2014
05
2014
08
2014
11
2015
02
2015
05
2015
08
Median Days on Market of Sales Reported By REALTOR® Respondents as of Sept 2015
All Foreclosed Short sale Not distressed
All: 49 Foreclosed: 57 Short sale: 135 Not distressed: 48
38%
19% 14%
10%
5% 3% 3% 2% 5%
0%5%
10%15%20%25%30%35%40%45%
Less than1 month
1 to lessthan 2months
2 to lessthan 3
months
3 to lessthan 4months
4 to lessthan 5
months
5 to lessthan 6
months
6 to lessthan 9
months
9 to lessthan 12months
12months or
more
Percentage Distribution of Time on Market of Sales Reported by REALTOR® Respondents as of Sept 2015
201409 201508 201509
12

Properties typically sold within a month in California, Utah, Colorado, South Dakota, Nebraska, Texas, and the District of Columbia. In Vermont, properties were typically on the market for longer than 90 days when sold. All real estate is local. State-level data is provided for REALTORS® who may want to compare local markets against the state and national summary.
Median Days on Market for Sales Reported by REALTORS®, By State July–Sept 2015
0%
20%
40%
60%
80%
100%
Less than 3months
3 to less than 6months
6 to less than 9months
9 to less than 12months
12 months ormore
Perc
ent o
f sal
es, b
y da
ys o
n m
arke
t
Days on Market
Properties That Stay Longer on the Market are More Likely to Be Sold at a Discount
Net discount of 12% or higher Net discount of 4% to 11%Net discount of less than 4% No discount or premiumNet premium of up to 4% Net premium of 4% to 11%Net premium of 12% or higher
13
II. Buyer and Seller Characteristics
Sales to First-Time Buyers: 29 Percent of Sales
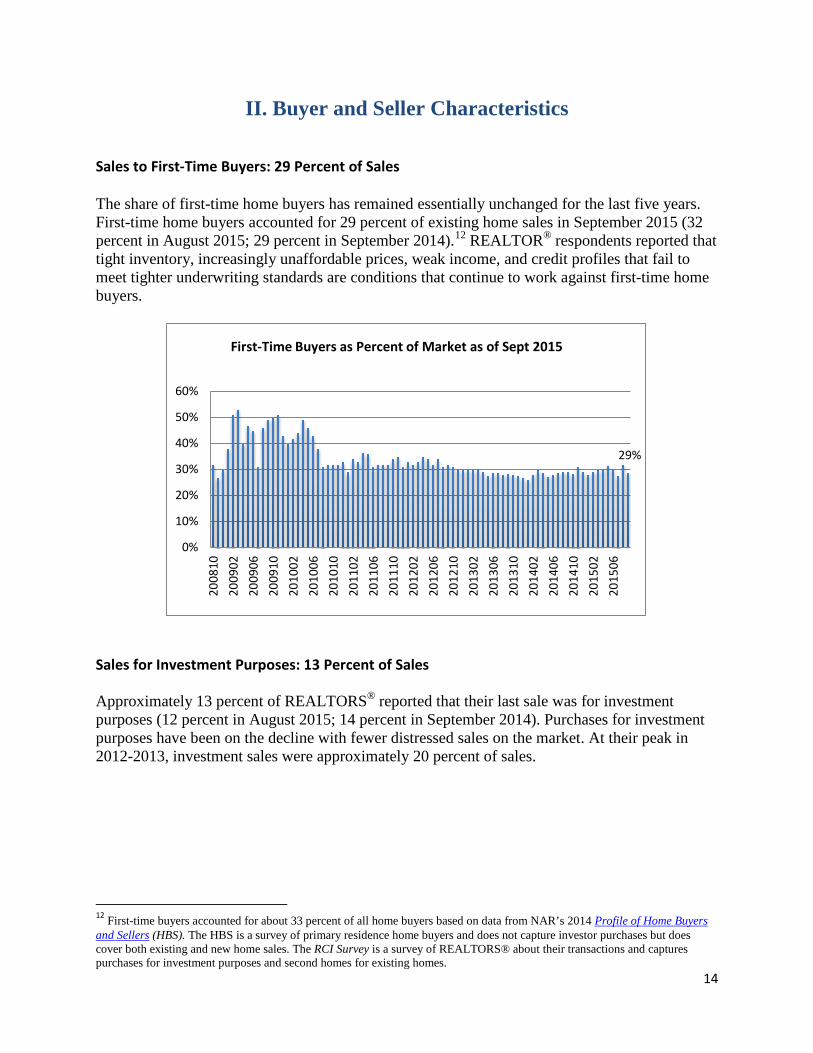
The share of first-time home buyers has remained essentially unchanged for the last five years. First-time home buyers accounted for 29 percent of existing home sales in September 2015 (32 percent in August 2015; 29 percent in September 2014).12 REALTOR® respondents reported that tight inventory, increasingly unaffordable prices, weak income, and credit profiles that fail to meet tighter underwriting standards are conditions that continue to work against first-time home buyers.
Sales for Investment Purposes: 13 Percent of Sales Approximately 13 percent of REALTORS® reported that their last sale was for investment purposes (12 percent in August 2015; 14 percent in September 2014). Purchases for investment purposes have been on the decline with fewer distressed sales on the market. At their peak in 2012-2013, investment sales were approximately 20 percent of sales.
12 First-time buyers accounted for about 33 percent of all home buyers based on data from NAR’s 2014 Profile of Home Buyers and Sellers (HBS). The HBS is a survey of primary residence home buyers and does not capture investor purchases but does cover both existing and new home sales. The RCI Survey is a survey of REALTORS® about their transactions and captures purchases for investment purposes and second homes for existing homes.
29%
0%
10%
20%
30%
40%
50%
60%
2008
1020
0902
2009
0620
0910
2010
0220
1006
2010
1020
1102
2011
0620
1110
2012
0220
1206
2012
1020
1302
2013
0620
1310
2014
0220
1406
2014
1020
1502
2015
06
First-Time Buyers as Percent of Market as of Sept 2015
14

Distressed Sales: Seven Percent of Sales With rising home values and fewer foreclosures, the share of sales of distressed properties continued to decline. In September 2015, distressed sales accounted for seven percent of sales (seven percent in August 2015; ten percent in September 2014). About six percent of reported sales were foreclosed properties, and about one percent were short sales.13 Distressed sales accounted for about a third to a half of sales until 2011. Foreclosed properties sold at an average discount of 17 percent in August 2015. Properties sold as short sales sold at an average discount of 19 percent.
13 The survey asks respondents to report on the characteristics of the most recent sale for the month.
13%
0%
5%
10%
15%
20%
25%
30%
2008
1020
0902
2009
0620
0910
2010
0220
1006
2010
1020
1102
2011
0620
1110
2012
0220
1206
2012
1020
1302
2013
0620
1310
2014
0220
1406
2014
1020
1502
2015
06
Sales to Investors as Percent of Market as of Sept 2015
0%
10%
20%
30%
40%
50%
60%
2008
1020
0902
2009
0620
0910
2010
0220
1006
2010
1020
1102
2011
0620
1110
2012
0220
1206
2012
1020
1302
2013
0620
1310
2014
0220
1406
2014
1020
1502
2015
06Distressed Sales, as Percent of Sales Reported by REALTOR®
Respondents as of Sept 2015
Foreclosed Short sale
Foreclosed: 6% Short sale: 1%
15

Distressed sales have fallen with fewer properties in foreclosure (840,217 properties in the foreclosure inventory as of the second quarter of 2015 from a peak of two million properties in 2009-2010).14 Fewer distressed sales and foreclosures improves home values, creating more home equity for the homeowner. As of the second quarter of 2015, the equity of all households in real estate was valued at $12.2 trillion, or 56 percent of the value of households’ real estate assets. Household equity peaked at $13.3 trillion in the first quarter of 2006.
14 Mortgage Bankers Association, seasonally adjusted data.
17% 19%
0%
5%
10%
15%
20%
25%
2009
0220
0905
2009
0820
0911
2010
0220
1005
2010
0820
1011
2011
0220
1105
2011
0820
1111
2012
0220
1205
2012
0820
1211
2013
0220
1305
2013
0820
1311
2014
0220
1405
2014
0820
1411
2015
0220
1505
2015
08
Mean Percentage Price Discount of Distressed Sales Reported by REALTOR® Respondents as of Sept 2015
Foreclosed Short sale
-
0.50
1.00
1.50
2.00
2.50
0.000.501.001.502.002.503.003.504.004.505.00
Q1/
1980
Q1/
1982
Q1/
1984
Q1/
1986
Q1/
1988
Q1/
1990
Q1/
1992
Q1/
1994
Q1/
1996
Q1/
1998
Q1/
2000
Q1/
2002
Q1/
2004
Q1/
2006
Q1/
2008
Q1/
2010
Q1/
2012
Q1/
2014
inve
ntor
y in
mill
ions
% o
f mor
tgag
es
Mortgage Foreclosure Inventory
Foreclosure Inventory (in millions) As percent of all mortgagesSource: Mortgage Bankers Association downloaded from Haver Analytics.
16

Cash Sales: 24 Percent of Sales The share of cash sales to the market has declined compared to the levels in 2010-2014, but the share remains elevated compared to levels before the housing downturn. Approximately 24 percent of sales were all-cash (22 percent in August 2015; 24 percent in September 2014). Buyers of homes for investment purposes, second homes, and foreign clients are more likely to pay cash than first-time home buyers. As sales to investors and distressed properties have fallen, the share of cash sales has declined as well.
0.0010.0020.0030.0040.0050.0060.0070.0080.00
0.000
2000.000
4000.000
6000.000
8000.000
10000.000
12000.000
14000.000
Q1/
1980
Q1/
1982
Q1/
1984
Q1/
1986
Q1/
1988
Q1/
1990
Q1/
1992
Q1/
1994
Q1/
1996
Q1/
1998
Q1/
2000
Q1/
2002
Q1/
2004
Q1/
2006
Q1/
2008
Q1/
2010
Q1/
2012
Q1/
2014
Owner's Equity, as % of RE assets
Owner's Equity, $bn
Household's Owner's Equity in Real Estate
Households: Owners' Equity in Real Estate (NSA, Bil $)Households: Owners' Equity in Real Estate as a % of Household Real…
Source: FRB, Flow of Funds , Table B.101, from Haver Analytics
24%
0%5%
10%15%20%25%30%35%40%
2008
1020
0902
2009
0620
0910
2010
0220
1006
2010
1020
1102
2011
0620
1110
2012
0220
1206
2012
1020
1302
2013
0620
1310
2014
0220
1406
2014
1020
1502
2015
06
Cash Sales as Percent of Market as of Sept 2015
17

Among mortgage sales reported by the respondents, 36 percent made a downpayment of at least 20 percent, about the same since 2011 when NAR started collecting this data. Among mortgage sales for first-time home buyers, 69 percent had downpayment terms of zero to six percent, a decrease from 77 percent of in 2009. The decreased share of low downpayment loans is one indicator that access to credit has become more difficult for borrowers who cannot afford higher downpayments.
71% 67%
52% 49%
14% 6%
0%
10%
20%
30%
40%
50%
60%
70%
80%
International Investor Distressedsale
Secondhome
Relocation First-timebuyer
Percent of Sales That are All-Cash By Type of Buyer in Sept 2015
36%
0%5%
10%15%20%25%30%35%40%45%50%
2011
0420
1106
2011
0820
1110
2011
1220
1202
2012
0420
1206
2012
0820
1210
2012
1220
1302
2013
0420
1306
2013
0820
1310
2013
1220
1402
2014
0420
1406
2014
0820
1410
2014
1220
1502
2015
0420
1506
2015
08
Percent of Mortgage Sales With Downpayment of At Least 20 Percent as of Sept 2015
18

International Transactions: Less than Two Percent of Residential Market Less than two percent percent of respondents reported their last sale was a purchase by a foreigner not residing in the U.S. International buyers frequently pay cash and have typically purchased properties above the median market price. Based on NAR’s 2015 Profile of Homebuying Activity of International Clients, Florida, California, Texas, and Arizona are the major destinations.
77%
69%
0.50.55
0.60.65
0.70.75
0.80.85
0.9
2009
0620
0909
2010
0220
1005
2010
0820
1011
2011
0220
1105
2011
0820
1111
2012
0220
1205
2012
0820
1211
2013
0220
1305
2013
0820
1311
2014
0220
1405
2014
0820
1411
2015
0220
1505
2015
08
Percent of First-Time Buyers Obtaining a Mortgage Who Had a Down Payment of 0% to 6% as of Sept 2015*
*The data reported for the month is a rolling three-month figure.
1.3%
0.0%0.5%1.0%1.5%2.0%2.5%3.0%3.5%4.0%
2010
0320
1006
2010
0920
1012
2011
0320
1106
2011
0920
1112
2012
0320
1206
2012
0920
1212
2013
0320
1306
2013
0920
1312
2014
0320
1406
2014
0920
1412
2015
0320
1506
2015
09Sales to International Clients as Percent of Market
as of Sept 2015
19

Age, Previous Residence, and Type of Property Purchased Buyers age 34 and under accounted for 28 percent of sales reported by the respondents. Nearly half of buyers were in the age group 35 to 55 years.
Slightly more than half of all reported buyers lived in their own homes, and these include trade-up or trade-down buyers and those who are purchasing a second home or one for investment purpose. Renters accounted for 35 percent of sales, essentially unchanged compared to past months.
0%10%20%30%40%50%60%70%80%90%
100%
2013
07
2013
09
2013
11
2014
04
2014
07
2014
08
2014
09
2014
10
2014
11
2014
12
2015
01
2015
02
2015
03
2015
04
2015
05
2015
06
2015
07
2015
08
2015
09
Age Distribution of Buyers for Sales Reported by REALTOR® Respondents as of Sept 2015
Age 34 and under Age 35 to 55 Age 56 and over
0%
20%
40%
60%
80%
100%
2014
08
2014
09
2014
10
2014
11
2014
12
2015
01
2015
02
2015
03
2015
04
2015
05
2015
06
2015
07
2015
08
2015
09Living Status of Home Buyers at Time of Home Purchase of
Sales Reported by REALTORS® as of Sept 2015
Lives with parents, relatives, or friendsLives in own homeRents an apartment or house
20

Sales data compiled for the January-September 2015 timeframe showed that among buyers 34 years and under, 86 percent purchased single-family homes, compared to the 77 percent rate for buyers 56 years and older. Buyers age 56 and over are about twice as likely to purchase a condominium than other buyers. REALTORS® have also reported a demand for 55 and older community housing as the large baby boomer population continues to move into retirement.
III. Current Issues
Demand for Rentals Remain Strong About 68 percent of REALTORS® reported rising residential rent (71 percent in August 2015; 65 percent in September 2014). Rising rents indicate continued strong demand for rental properties. As of the second quarter of 2015, the CPI-Shelter Index, a measure of rent payments, was up 45 percent compared to the level in the first quarter of 2000. On the other hand, mortgage payments were only six percent higher on account of low mortgage rates. Although rents are rising faster than mortgage payments, the rentership rate has remained elevated, likely due to a mix of factors such as lifestyle choice, financial constraints for younger households, tight underwriting standards, and increasing unaffordability as tight inventory continues to push up prices. As of August 2015, the median home price of all existing homes is 47 percent higher than in Febuary 2012 when prices hit a low of $156,100. Meanwhile, over this same period, the median family income rose by seven percent.
86% 86% 77% 84%
7% 6% 7%
6% 7% 8% 17% 10%
0%
20%
40%
60%
80%
100%
Age 34 and under Age 35 to 55 Age 56 and over All
Type of Residential Property Purchased by Age Group as of Sept 2015
Single-family Townhome Condominium
21

68%
0%10%20%30%40%50%60%70%80%90%
100%
2010
1220
1103
2011
0620
1109
2011
1220
1203
2012
0620
1209
2012
1220
1303
2013
0620
1309
2013
1220
1403
2014
0620
1409
2014
1220
1503
2015
0620
1509
Percent of REALTOR® Respondents Reporting Rising Residential Rents Compared to 12 Months Ago
as of Sept 2015
106
145
507090
110130150170
2000
Q1
2000
Q4
2001
Q3
2002
Q2
2003
Q1
2003
Q4
2004
Q3
2005
Q2
2006
Q1
2006
Q4
2007
Q3
2008
Q2
2009
Q1
2009
Q4
2010
Q3
2011
Q2
2012
Q1
2012
Q4
2013
Q3
2014
Q2
2015
Q1
Index of Mortgage Payments and Rent Payments as of 2015 Q2 (2000 Q1=100)
Mortgage Payment (2000Q1=100) CPI-Shelter Index (2000Q1=100)Source: NAR, BLS downloaded on Haver Analytics
22

Credit Conditions Still Generally Tight
REALTORS® continued to report that credit conditions remain generally tight, with significant loan processing delays. One indicator of credit tightness is the distribution of FICO scores on approved loans. About 48 percent of REALTORS® providing transaction credit score information reported FICO credit scores in the range of 740+. For comparison, in the period 1999-2004, only 37 percent of Fannie Mae’s and 33 percent of Freddie Mac’s 30-year, fixed rate, fully amortizing acquistions had FICO scores greater than 750. As of 2015 Q2, Fannie Mae reported that 63.6 percent of its single-family acquisitions had a FICO credit score of 740 or higher.16
16 Source: Fannie Mae 2015 Second Quarter Credit Supplement downloaded at http://www.fanniemae.com/resources/file/ir/pdf/quarterly-annual-results/2015/q22015_credit_summary.pdf
147
107
80
100
120
140
160
Feb/
2012
Apr/
2012
Jun/
2012
Aug/
2012
Oct
/201
2De
c/20
12Fe
b/20
13Ap
r/20
13Ju
n/20
13Au
g/20
13O
ct/2
013
Dec/
2013
Feb/
2014
Apr/
2014
Jun/
2014
Aug/
2014
Oct
/201
4De
c/20
14Fe
b/20
15Ap
r/20
15Ju
n/20
15Au
g/20
15
Index of Median Existing Home Prices and Median Family Income as of 2015 Q2 (Feb 2012=100)
NAR Median Home Price (Feb 2012=100)
Median Family Income (Feb 2012=100)
3%
50%
48%
0%10%20%30%40%50%60%70%
2012
0220
1204
2012
0620
1208
2012
1020
1212
2013
0220
1304
2013
0620
1308
2013
1020
1312
2014
0220
1404
2014
0620
1408
2014
1020
1412
2015
0220
1504
2015
0620
1508
Percentage Distribution of FICO Scores Reported by REALTOR® Respondents as of Sept 2015
Less than 620 620 to 739 740 or more
23

Among first-time home buyers, 32 percent of buyers were reported to have FICO scores of 740 or higher. Among buyers age 34 years and under, 37 percent had FICO scores of 700 or over. A majority of borrowers with FICO scores of less than 740 availed of “low” downpayment loans (zero to six percent). For example, 76 percent of borrowers with FICO scores of below 620 made a down payment of zero to six percent.
3%
17% 23% 25%
32%
1% 7%
13% 22%
56%
0%10%20%30%40%50%60%
Less than 620 620 to 659 660 to 699 700 to 739 740 or more
Percentage Distribution of FICO Credit Scores for First-time and Non-first- time Buyers Reported by REALTORS®
in Jan-Sept 2015
Yes No
2% 2% 1%
14% 11% 5%
20% 17% 9%
27% 23%
18%
37%
47%
67%
0%
10%
20%
30%
40%
50%
60%
70%
Age 34 and under Age 35 to 55 Age 56 and over
Percentage Distribution of FICO Scores , By Age Group, Based on Mortgage Sales Reported by REALTORS® in Jan-Sept 2015
Less than 620 620 to 659 660 to 699 700 to 739 740 or more
24

Contract Settlement Issues: Financing and Appraisals are Major Issues
In reporting on their last contract that went into settlement or was terminated over the period July-September 2015, REALTORS® reported that 64 percent of contracts were settled on time, 30 percent had delayed settlement, and six percent were terminated.
Of all contracts settled/terminated, financing, appraisal, and home inspection issues were the major problems: 18 percent had financing issues, 11 percent had appraisal issues, and 11 percent had home inspection issues.
Among contracts that had a delayed settlement (30 percent), 42 percent of contracts that were delayed had financing issues.
0%
20%
40%
60%
80%
100%
Less than 620 620 to 659 660 to 699 700 to 739 740 or morePerc
ent o
f rep
orte
d sa
les
Credit score range
Downpayment Terms, by Credit Score Range as Reported by REALTORS®
0 to 6% Downpayment 7 to 10% Downpayment
11 to 19% Downpayment 20 % or more Downpayment
65% 67% 65% 64% 63% 63% 65% 65% 64%
26% 27% 26% 26% 28% 29% 29% 29% 30% 8% 7% 9% 10% 9% 7% 6% 7% 6%
0%20%40%60%80%
100%How Sales Contracts Were Settled in July - Sept 2015*
Contract was terminatedContract was delayed but eventually went into settlementContract was settled on time
* Based on the most recent contract that went into settlement or was terminated during this period.
25

Among contracts that were terminated (six percent), home inspection and financing issues were the major causes, with 28 percent of contracts experiencing both these issues.
49%
18%
11%
11%
5%
4%
2%
1%
1%
10%
No problems encounteredIssues related to obtaining financing
Home inspection/environmental issuesAppraisal issues
Titling/deed issuesContingencies stated in the contract
Issues in buy/sell distressed propertyHome/hazard/flood insurance issues
Buyer lost jobOther
Problems Encountered for Contracts That Went Into Settlement or Were Terminated in July-Sept 2015 *
* Will not sum to 100 percent because multiple responses are allowed. "Other" includes buyer or seller backing out, builder delays, HOA issues, pricing issues, etc.
42% 21%
14%
12%
8%
5%
2%
1%
20%
Issues related to obtaining financingAppraisal issues
Home inspection/environmental issuesTitling/deed issues
Contingencies stated in the contractIssues in buy/sell distressed propertyHome/hazard/flood insurance issues
Buyer lost jobOther
Problems Encountered for Contracts That Were Delayed But Eventually Went Into Settlement in July-Sept 2015
(Delayed Contracts Represent 30 Percent of Closed or Terminated Contracts)
* Will not sum to 100 percent because multiple responses are allowed. "Other" includes buyer or seller backing out, builder delays, HOA issues, pricing issues, documentation issues, etc.
26

28%
28%
13%
11%
4%
2%
1%
1%
Home inspection/environmental issues
Issues related to obtaining financing
Contingencies stated in the contract
Appraisal issues
Issues in buy/sell distressed property
Buyer lost job
Titling/deed issues
Home/hazard/flood insurance issues
Problems Encountered for Contracts That Were Terminated in July-Sept 2015
(Terminated Contracts Represent Six Percent of Closed or Terminated Contracts)
*Will not sum to 100 percent because multiple responses are allowed. "Other" includes buyer or seller backing out, builder delays, HOA issues, pricing issues, documentation issues, etc.
27

The NATIONAL ASSOCIATION of REALTORS®, “The Voice for Real Estate,” is America’s largest trade association, representing over 1 million members, including NAR’s institutes, societies, and councils, involved in all aspects of the real estate industry. NAR membership includes brokers, salespeople, property managers, appraisers, counselors and others engaged in both residential and commercial real estate. The term REALTOR® is a registered collective membership mark that identifies a real estate professional who is a member of the National Association of REALTORS® and subscribes to its strict Code of Ethics. Working for America's property owners, the National Association provides a facility for professional development, research, and exchange of information among its members, and to the public and government for the purpose of preserving the free enterprise system and the right to own real property. The Mission of the NATIONAL ASSOCIATION of REALTORS® Research Division is to collect and disseminate timely, accurate, and comprehensive real estate data and to conduct economic analysis in order to inform and engage members, consumers, policy makers, and the media in a professional and accessible manner. To find out about other products from NAR’s Research Division, visit www.REALTOR.org/research-and-statistics Also follow NAR Research on
https://twitter.com/nar_research
https://www.facebook.com/narresearchgroup
https://www.pinterest.com/narresearch/
https://instagram.com/narresearch/
NATIONAL ASSOCIATION of REALTORS® Research Division 500 New Jersey Avenue, NW Washington, DC 20001 202.383.1000
28