sent home and put off-track: the antecedents ......1 sent home and put off-track: the antecedents,...
TRANSCRIPT

1
Sent Home and Put Off-Track: The Antecedents, Disproportionalities, and
Consequences of Being Suspended in the Ninth Grade
Prepared for the Center for Civil Rights Remedies and the Research-to-Practice
Collaborative, National Conference on Race and Gender Disparities in Discipline
Robert Balfanz, Vaughan Byrnes, and Joanna Fox
Everyone Graduates Center, School of Education, Johns Hopkins University
12/21/12
Abstract:
This study is based upon a longitudinal analysis of data for a cohort of 181,897 Florida state
students who were first time 9th
graders in the 2000-01 school year and follows them trough to
high school and post-secondary outcomes. Analysis of 9th
grade suspension data finds that black
students, students who are economically disadvantaged, and special education students are three
demographics subgroups that are disproportionately suspended, both in the frequency of
suspensions and the duration in number of school days lost. While poverty and ethnicity are
themselves highly correlated, poverty alone does not explain the disproportionate suspension
rates amongst black students. Further analyses show that out-of-school suspensions in the 9th
grade year are also significantly and negatively correlated to later high school graduation as well
as post-secondary enrolment and persistence. Thus demographic disparities in disciplinary
incidents serve to further widen any academic achievement gaps. Closer analysis though shows
though that disciplinary incidents are interrelated with other of indicators of student
disengagement from school, such as course failures and absenteeism. Therefore, policies seeking
to address these issues cannot focus on reducing suspensions alone, but must also address student
attendance and course passing in a comprehensive and systematic manner.

2
Over the past several years, research from several states (Arkansas, Colorado, Florida,
Tennessee) and several large city school districts (Indianapolis, Nashville, Philadelphia,) across
the country have identified out-of-school suspensions as one of the primary indicators of high
school dropout (Balfanz, et. al., 2007; CSOS, 2007; EGC, 2010a; 2010b; 2010c; 2011; MacIver,
et. al., 2009). The exclusion of students from school for disciplinary reasons are directly related
to lower attendance rates, increased course failures, and can set a student on a path of
disengagement from school that will keep them from receiving a high school diploma and further
affect their chances of enrolling in post-secondary schooling and realizing many life-long career
opportunities. Aside from the obvious consequences for individual students, and their
contributions to their larger communities, any policies that serve to increase student exclusion
from the schooling environment are also likely to be detrimental to the many efforts and
resources that district and school administrators invest towards increasing their graduation rates
and raising achievement levels.
Recent research has also suggested that there are clear and evident demographic disparities in the
use of out-of-school suspensions as a disciplinary measure and that certain subgroups of
students, particularly those from minority and high poverty backgrounds, are more likely to be
suspended, as well as more often, for longer durations of time, and for more minor offenses
(Fabelo, et. al., 2011; Georgia Appleseed, 2011; Losen & Gillespie, 2012; NAACP, 2006;
Sullivan & Morgan, 2010; Texas Appleseed, 2007). Given the impact of suspensions on student
academic outcomes, any racial disparities in the application of such disciplinary practices will
also serve to further increase the achievement gap that exists between white and non-white
students in the US (Blank & Langesen, 1999; Harris & Harrington, 2006) and to institutionalize
such inequality.
This paper seeks to further our understanding of these issue by analyzing data from a cohort of
students from the state of Florida to examine the connection between out-of-school suspensions
in the 9th
grade and high school and post-secondary outcomes, as well as the interplay between
school suspensions and the other primary indicators that students are off-track-poor attendance
and course failures. The analyses will also examine demographic disparities in school
suspensions, their relationship to poverty, and the extent to which demographic disparities in
school suspensions contribute to high school graduation and post-secondary attainment gaps.
Design & Sample Data
The following analyses are based on a longitudinal cohort study of data for a cohort of 181,897
Florida state students who were first time 9th
graders in the 2000-01 school year. The full cohort
included 205,337 students, but longitudinal analyses exclude those students who transferred out
of state system in following years as their final high school and post-secondary outcomes cannot
be known. The data follows these students forward to 2005-06 for high school outcomes (two

3
years past the expected time of graduation, 2003-04) and follows them through 2007-08 for post-
secondary outcomes (four years past the expected time of graduation). Outcomes focus on high
school graduation and dropout events and post-secondary enrollment at two and four-year degree
granting institutions.
Available as control measures and correlates of high school and post-secondary outcomes are
several student measures such as demographic characteristics (ethnicity, special education status,
limited-English proficiency, overage for grade), academic behaviours (attendance, disciplinary
incidents, course marks and failures), student mobility (enrollment, withdrawal, and transfer
data), and achievement test scores. (In order to examine the subgroups of primary interest such
as the different ethnic groups and students who were economically disadvantaged or special
education status, gender was not made available for the study in order to ensure student
anonymity given the other details provided). This sample of data was made available by the
Florida K-20 Education Data Warehouse to examine the early warning indicators of high school
dropout and post-secondary enrollment. In this paper, we examine more deeply, the role played
by school suspensions in students falling off the path to high school graduation and post-
secondary attainment.
Further examination of such a data sample also allows us to advance our understanding of
disparities in school discipline and their impacts on student outcomes. Analyses of these data
enable us to determine which students get suspended in 9th
grade disproportionately by
demographic group, which other academic factors are correlated to and mediated by suspensions,
and what the long term consequences of suspensions are on students’ High-School and Post-
Secondary outcomes. Specifically, we use the data to address the following research questions:
To what extent are suspensions connected to lower academic outcomes, both immediate
(attendance, course failures) and long term (high school graduation and post-secondary
persistence)?
Are different demographic subgroups of students suspended at higher rates and/or for
longer periods than others? And if so, do these differences remain even after controlling
for poverty levels? Do these disparities contribute to high school graduation and post-
secondary attainment gaps.
We then conclude by addressing the policy and practice implications of our findings.
Table 1, shows the demographic descriptives for our sample of 181,897 Florida 9th
grade
students from the 2000-01 school year. While the majority, just over half of students, were of a

4
white ethnic background, there were sizeable minorities with one quarter of students black and
one fifth Hispanic. The majority of students were also eligible for the federal Free/Reduced
Lunch program during their 9th
grade yaer, and one quarter was special education status.
Table 1 – Sample Descriptive Statistics
9th
Grade Cohort
N = 181,897
(2000-01)
Transfers out
N = 23,440
(2000-01)
Florida K-12
Student Population
N = 2,667,830
(20011-12)
New to Florida PS 7% 19% 4%*
White 54% 55% 42%
Asian 2% 2% 3%
Black 24% 21% 23%
Hispanic 19% 21% 29%
Native <1% <1% <1%
Multi-Racial 1% 1% 3%
F/RL 59% 61% 58%
Spec. Ed. 26% 23% 19%
LEP 16% 17% 9%
Overage 26% 40% N/A
* - excludes students who were new to Florida as first time prekindergarten/kindergarten entrants
The 23,440 students who transferred out of the cohort were disproportionately overage and new
to the Florida public school system, suggesting a more mobile group that had already repeated a
grade. Similarly, the 2,472 students from our analytic sample who were missing attendance data
and the 19,515 who were missing course data were also disproportionately overage and new to
Florida public schools. However, overage and new students remained a minority for these
groups, and as a whole, those students who transferred out of the cohort and those missing data
largely resemble those that remain in our analyses. Analyses were based on complete case data
of 181,897 students for most analyses with reduced samples for those analyses including
attendance or course marks data. Students who are more mobile and overage, and/or have
missing data are likely to have lower academic outcomes such as attendance and achievement on
average. Thus, our sample data is likely be representative of students with somewhat higher
outcomes levels than those of the true Florida state student population. However, those
differences that do exist between our sample of students and the true Florida student population
are not ones that we would expect, for any theoretical reasons, to alter the relationships or
significantly impact our results. .

5
Who Gets Suspended in the 9th Grade?
Overall for our cohort of 181,897 students, 27% were suspended out-of-school at least once in
the 9th
grade. This tells us that suspending students in the 9th
grade is common practice and was
experienced by more than one in four students. Students who were suspended in the 9th
grade
were suspended on average twice during the year, and missed on average a total of seven school
days due to suspension. While the average number of days lost due to suspension is pushed up by
outlying incidents of students being suspended for lengthy amounts of time, 50% of all students
suspended missed up to 3 days of school, another 25% missed from 4 to 7 days, and another 15%
missed from 8 to 13 days of school. 40% of all students who were suspended during the 9th
grade
missed at least 5 days, or one week of school, due to suspension.
Looking at the nominal rates of 9th
grade suspension by demographic background in Table 2, we
are able to see who gets suspended in the 9th
grade and the variation between subgroups.
Compared to the cohort average, black students, those eligible for the Free/Reduced Lunch
program, special education students, and those students overage for their grade were suspended
more often on aggregate than any other demographic subgroup. Black students received twice as
many suspensions as white students. These four groups also lost the most school days on average
due to suspension. Looking only at those students who were suspended at least once, students
from those groups were also more likely to be suspended more than once and to lose more days
due to suspension than other groups on average.
Table 2 – 9th
Grade Suspensions Rates for Cohort Examined by Demographic Background
%
Suspend
at least
once
Average #
of
Suspensions
Average # of
Days
Suspended
Average # of
Suspensions
(for those
suspended)
Average # of
Days Suspended
(for those
suspended)
New to
Florida PS 15% 0.3 1.1 1.7 6.5
White 22% 0.4 1.5 1.8 6.6
Asian 10% 0.2 0.7 1.6 6.8
Black 39% 0.8 2.9 1.9 7.4
Hispanic 26% 0.5 1.7 1.8 6.2
Native 22% 0.5 1.5 2.0 6.3
Multi-
Racial 25% 0.4 2.0 1.8 8.0
F/RL 34% 0.7 2.5 2.0 7.1
Spec. Ed. 31% 0.7 2.4 2.1 7.4
LEP 27% 0.5 1.7 1.8 6.1
Overage 40% 0.8 3.0 2.1 7.6
ALL 27% 0.5 1.9 1.9 6.8
6
The results from our cohort analysis are similar to those found at the national level in a study
conducted by the Center for Civil Rights Remedies based upon K-12 data from the 2009-10
school year. That study, based on a sample of nearly half the nation’s school districts and
roughly 85% of all public school students in the country, found that black students and special
education students were more likely to be suspended at least once and more likely to be
suspended multiple times (Loesen & Gillespie, 2012). While this national study was forced to
exclude data from Florida due to enrollment errors related to the number of students with
disabilities, another study of Florida data (NAACP, 2006) also found similar results as have
several other studies based upon the individual states of Georgia, Louisiana, Texas, and Virginia
which consistently found that black, economically disadvantaged, and disabled students are the
most likely to be suspended (Ciolfi, et. al, 2011; Fabelo, et. al., 2011; Georgia Appleseed, 2011;
Sullivan & Morgan, 2010; Texas Appleseed, 2007). A survey of school administrators in
California found that more than two-thirds were concerned that their school discipline policies
were having a differential impact on students from different racial and ethnic backgrounds
(Freedberg & Chavez, 2012). These studies also found that students from these subgroups are
often disproportionately suspended for what are minor and non-violent offences, ones which do
not require out-of-school suspensions by any state mandates but rather are applied in a
discretionary manner by school or district administrators, meaning that alternatives to out-of-
school suspension could be employed.
Overall in our cohort of Florida students, 39% of black students were suspended one or more
times and compared to 22% of white students. While suspension rates in our study are high as
they focus on the 9th
grade alone, the difference between black and white rates of 17 percentage
points stands slightly higher than the national average from the Loesen study (12 percentage
points), and would place Florida as having the 4th
highest disparity out of 48 states (Loesen &
Gillespie, 2012). While the several individual state studies are based upon different metrics,
results consistently found that black students were anywhere from two to four times as likely to
be suspended as whites, while students with disabilities were typically twice as likely to be
suspended as those without (Ciolfi, et. al, 2011; Georgia Appleseed, 2011; NAACP, 2006;
Sullivan & Morgan, 2010; Texas Appleseed, 2007). In our cohort, 31% of special education
students were suspended at least once as compared to 25% of 9th
grade students without
disabilities, and 34% of Free-Reduced Lunch program eligible students were suspended at least
once versus 16% of non-eligible students. Again, while the nominal suspension rates in our
samples are higher due to the focus on 9th
grade students as opposed to K-12, the differential
rates and odds between subgroups are similar to those of the aforementioned studies in
magnitude. The most recent data available from the Florida Department of Education website
shows similar outcomes. In the 2011-12 school year, black students received 42% of all out-of-
school suspensions despite making up only 23% of the K-12 student population, while white
students comprised 42% of the student population but received only 32% of all out-of-school
suspensions.
7
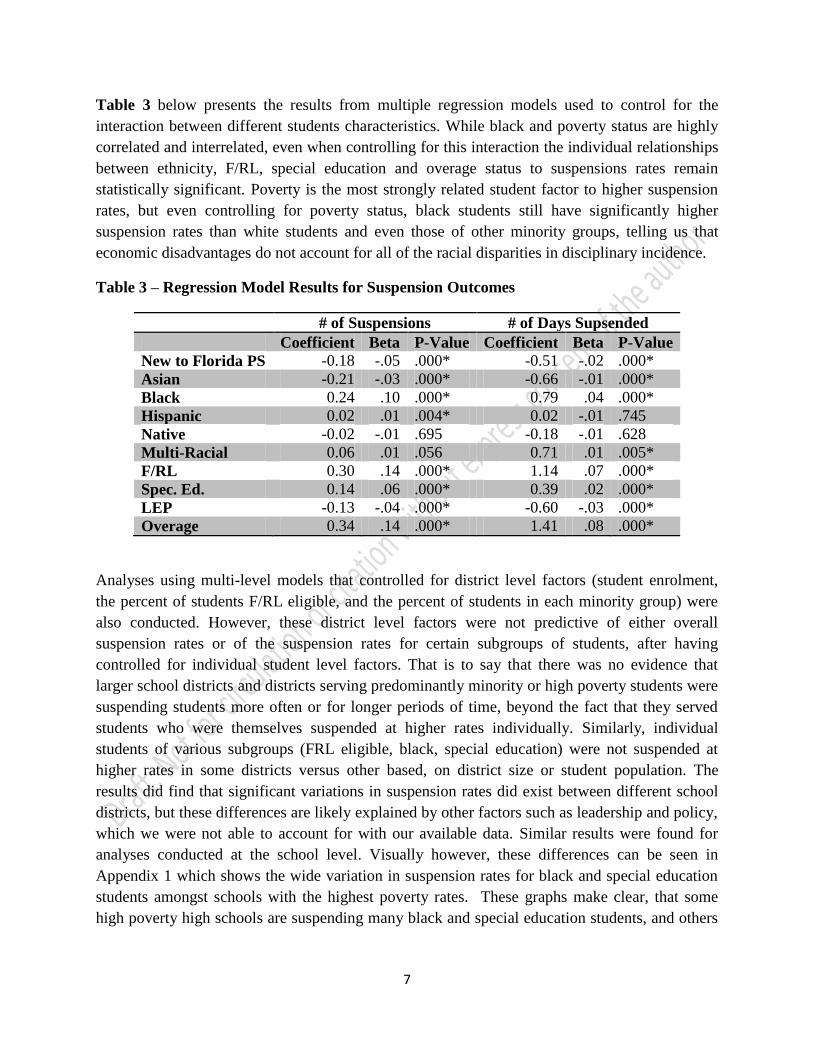
Table 3 below presents the results from multiple regression models used to control for the
interaction between different students characteristics. While black and poverty status are highly
correlated and interrelated, even when controlling for this interaction the individual relationships
between ethnicity, F/RL, special education and overage status to suspensions rates remain
statistically significant. Poverty is the most strongly related student factor to higher suspension
rates, but even controlling for poverty status, black students still have significantly higher
suspension rates than white students and even those of other minority groups, telling us that
economic disadvantages do not account for all of the racial disparities in disciplinary incidence.
Table 3 – Regression Model Results for Suspension Outcomes
# of Suspensions # of Days Supsended
Coefficient Beta P-Value Coefficient Beta P-Value
New to Florida PS -0.18 -.05 .000* -0.51 -.02 .000*
Asian -0.21 -.03 .000* -0.66 -.01 .000*
Black 0.24 .10 .000* 0.79 .04 .000*
Hispanic 0.02 .01 .004* 0.02 -.01 .745
Native -0.02 -.01 .695 -0.18 -.01 .628
Multi-Racial 0.06 .01 .056 0.71 .01 .005*
F/RL 0.30 .14 .000* 1.14 .07 .000*
Spec. Ed. 0.14 .06 .000* 0.39 .02 .000*
LEP -0.13 -.04 .000* -0.60 -.03 .000*
Overage 0.34 .14 .000* 1.41 .08 .000*
Analyses using multi-level models that controlled for district level factors (student enrolment,
the percent of students F/RL eligible, and the percent of students in each minority group) were
also conducted. However, these district level factors were not predictive of either overall
suspension rates or of the suspension rates for certain subgroups of students, after having
controlled for individual student level factors. That is to say that there was no evidence that
larger school districts and districts serving predominantly minority or high poverty students were
suspending students more often or for longer periods of time, beyond the fact that they served
students who were themselves suspended at higher rates individually. Similarly, individual
students of various subgroups (FRL eligible, black, special education) were not suspended at
higher rates in some districts versus other based, on district size or student population. The
results did find that significant variations in suspension rates did exist between different school
districts, but these differences are likely explained by other factors such as leadership and policy,
which we were not able to account for with our available data. Similar results were found for
analyses conducted at the school level. Visually however, these differences can be seen in
Appendix 1 which shows the wide variation in suspension rates for black and special education
students amongst schools with the highest poverty rates. These graphs make clear, that some
high poverty high schools are suspending many black and special education students, and others

8
are suspending only a few, suggesting that how schools are organized and operate plays a
significant role in determining suspension rates.
The Impact of Suspensions on High School and Post-Secondary Outcomes
The consequences, and the implications of any demographic disparities, are made clear in Table
4 and Figure 1 which show the high school and post-secondary outcomes for students by the
number of 9th
grade suspensions they received. With each increasing suspension in 9th
grade, the
odds of dropping out of high school increase while conversely the chances of graduating
decrease as do the chances of enrolling and persisting in post-secondary schooling. The chances
of succeeding academically for each student are quite sensitive to even the first suspension as the
greatest change in a student’s odds of success occur with the first suspension where the
associated chances of graduating drop from 3 in 4 to only half, and their chances of enrolling in
post-secondary go from over 50% to under. Conversely, students’ associated chances of
dropping out double with their first suspension. This point has important implications for the use
of out-of-school suspensions as a disciplinary policy – the risk they impose on students’ chances
of high school and post-secondary success are not a threat only for those students who are repeat
or habitual offenders, but also for those students who are otherwise well behaved but receive
even one isolated suspension.
Table 4 – High School and Post-Secondary Outcomes by 9th
Grade Behavioral Indicators
Characteristic
# of Students
With
Characteristic
% Who
Dropped
Out
% Who
Graduated
% Who
Enrolled in
PS
Average PS
Terms
Completed
Beh
avio
r
0 Suspensions 133,044 16% 75% 58% 4.0
1 Suspension 25,821 32% 52% 39% 1.9
2 Suspensions 11,693 42% 38% 31% 1.2
3 Suspensions 5, 833 49% 30% 26% 0.9
4 or more
Suspensions 5,506 53% 23% 23% 0.7
Att
end
an
ce
Attendance >=
95% 101,296 11% 81% 62% 4.3
Attendance 90-
94% 34,601 25% 63% 47% 2.7
Attendance 85-
89% 16,210 39% 44% 35% 1.6
Attendance 80-
84% 7,307 47% 31% 26% 1.1
Attendance <80% 14,386 57% 15% 19% 0.6
Co
urs e M ar
ks 0 Failures 93,626 8% 85% 67% 4.9
1 Failure 18,500 23% 66% 44% 2.3

9
2 Failures 14,909 29% 56% 40% 2.0
3 Failures 7,482 38% 45% 31% 1.2
4 or more
Failures 27,865 51% 26% 25% 0.9
ENTIRE COHORT 181,897 22% 66% 51% 3.3 * - Attendance data was missing for 2,472 students and course marks for 19,515. For these categories,
percents are calculated for those students with data. Students with missing data were somewhat more
likely to be new to the Florida public school system and overage for grade; however this was not the case
for the majority of students with missing data who otherwise resembled the sample as a whole.
Figure 1 – High School and Post-Secondary Outcomes by Number of 9th
Grade
Suspensions
When regression modeling is used to examine the impact of suspensions in conjunctions with
demographics, and other off-track indicators the number of 9th
grade suspensions remain
significantly related to high school outcomes and post-secondary outcomes as well. After
controlling for demographics, attendance, and course performance in a logistic regression model
(Table 5), each additional suspension further decreases a student’s odds of graduating high
school by 20%, and decreases their odds of enrolling in post-secondary schooling by 12%. It
should be noted that the apparent lesser impact on post-secondary schooling does not account for
the additional indirect effect that suspensions have on post-secondary enrolment by decreasing a
student’s chances of first graduating from high school.
16%
32%
42% 49%
53%
75%
52%
38% 30%
23%
58%
39% 31%
26% 23%
0%
10%
20%
30%
40%
50%
60%
70%
80%
0 Suspensions 1 Suspension 2 Suspensions 3 Suspensions 4 or moreSuspensions
High School & Post-Secondary Outcomes by 9th Grade Suspensions
Dropped Out Graduated Enrolled in PS

10
Table 5 – Regression Model Results for High School and Post-Secondary Outcomes
HS Graduation PS Enrollment PS Terms Completed
Odds-Ratio P-Value Odds-Ratio P-Value Coef. Beta P-Value
New to Florida PS 0.56 .000* 0.56 .000* -0.8 -.05 .000*
Asian 1.48 .000* 1.77 .000* 1.6 .05 .000*
Black 1.11 .000* 1.11 .000* 0.2 .02 .000*
Hispanic 1.01 .836 1.15 .000* 0.3 .03 .000*
Native 0.88 .339 0.95 .651 0.2 .01 .365
Multi-Racial 1.01 .948 1.00 .957 0.1 .01 .735
Over-age 0.39 .000* 0.44 .000* -1.5 -.15 .000*
F/RL 0.62 .000* 0.46 .000* -1.9 -.22 .000*
Spec. Ed. 1.09 .000* 0.66 .000* -0.5 -.05 .000*
LEP Status 0.93 .001* 1.07 .001* 0.4 .03 .000*
# Suspensions 0.80 .000* 0.88 .000* -0.3 -.07 .000*
Attendance Rate 2.04 .000* 1.32 .000* 0.3 .07 .000*
Course Failures 0.75 .000* 0.86 .000* -0.3 -.17 .000*
The model for HS graduation correctly predicted the outcome for 79.6% of students while roughly
explaining 29-40% of variation between students, and the model for PS enrollment correctly predicted the
outcome for 69.1% of students, while roughly explaining 17-23% of variation between students for HS
graduation. For PS terms completed, the model explained roughly 20% of the variation between students.
The Interaction between Suspensions and Other Academic Factors
As seen above in Table 4, students’ 9th
grade course marks and attendance are also key factors
determining their odds of graduating from high school and enrolling in post-secondary
schooling. Both attendance and course passing are in turn intermediate academic outcomes,
themselves mediated by students’ suspensions. Studies conducted in five Massachusetts schools
districts as well as in Austin, Texas (Everyone Graduates Center, 2010d & 2010e), tracked high
school dropouts back through the school years prior to their dropout events and found that on
average, behavioral warning signs of disengagement from school were the first to emerge, before
attendance or course issues.
In our sample of Florida data, it is not possible to know the extent to which being suspended in
the 9th
grade preceded or followed poor attendance and course performance in the 9th
grade. We
can establish, however, that suspensions contributed to students missing more school. Among
students who were suspended at least once in the 9th
grade, the number of days lost due to
suspension was on average equivalent to 40% of their days absent from school that year. Though
the average is skewed by extreme cases where students received long suspensions for large

11
numbers of days, the number of days lost to suspension was still equivalent to at least 30% or
more of their days absent for half of those students to receive a suspension, and equivalent to
60% or more of their days absent for one quarter of those students suspended. That behavioral
and discipline issues affect students in several complex and interconnected ways is an important
point for policy and intervention. More detailed analysis of the interrelationships between
suspensions, attendance, and course performance shows two clear groups of students. In Table 6,
we see how frequent is the co-occurrence of suspension with attendance and course failure as
almost half of those students suspended in the 9th
grade were also chronically absent (attendance
under 90%) and nearly three-quarters failed a course, rates much higher than for those students
who were not suspended in the 9th
grade year. Hence, for these students efforts need to focus on
more than just decreasing their suspension rates alone, as their 9th
grade performance indicates a
broad disengagement from and lack of success in school.
Table 6 – 9th
Grade Attendance and Course Indicators by Suspension
Attendance < 90% in
9th
Course Failure in
9th
Suspended in 9th
(N=48,853) 42% 73%
Not-Suspended in
9th
(N=133,044)
13% 36%
There is a second set of suspended students in the 9th
grade (about 1 in 5 in our sample) for
whom their only 9th
grade off-track indicator was a behavioral one. Here there is clear evidence
that for students who are otherwise regularly attending school and passing their courses in the 9th
grade, being suspended can lead to more suspensions, lowered attendance and course failure in
later years, and as such act as the trigger mechanism which puts them on the path to ultimately
dropping out. As evidenced in Table 7, most of the students who’s only off track indicator in 9th
grade was being suspended, exhibited other academic or behavioral issues throughout their later
high school years, primarily in further suspensions, but also in course failures and chronic
absenteeism. Over the course of 10th
to 12th
grade, 42% of the students whose only off-track
indicator in 9th
grade was being suspended became chronically absent, and 59% experienced
course failure. This suggests that for about 20% of the students suspended in 9th
grade, efforts to
find alternatives to suspensions, alone could have a significant pay-off in terms of reducing
dropout and increasing post-secondary attainment rates.

12
Table 7 – Later Academic Warning Signs by 9th
Grade Suspension
Suspended in
10th
Suspended in
11th
Suspended in
12th
Suspended in
Upper Grades
Students who
were Suspended
in 9th
With no other
Indicators
(N=10,604)
46% 41% 30% 66%
Attendance <
90% in 10th
Attendance <
90% in 11th
Attendance <
90% in 12th
Attendance <
90% in Upper
Grades
Students who
were Suspended
in 9th
With no other
Indicators
(N=10,604)
16% 23% 25% 42%
Course Failure
in 10th
Course Failure
in 11th
Course Failure
in 12th
Course Failure in
Upper Grades
Students who
were Suspended
in 9th
With no other
Indicators
(N=10,604)
32% 37% 38% 59%
A final key factor in terms of policy and practice is that for many of the students suspended in 9th
grade, this is the continuation of an experience which goes back to middle school and for some
all the way back to 6th
grade and beyond. Table 8 shows that for many students who are
suspended in 9th
grade, it is not their first behavioral incident in school. Over one-third were
suspended as early as three years prior (in what would have been 6th
grade for most), while
roughly half were suspended in either 7th
or 8th
grades. Over two-thirds were suspended at least
once in the middle grades. Moreover, nearly half of the students who were suspended in 9th
grade, where also chronically absent during at least one of their middle grade years, indicating
that they entered high school already significantly disengaged from schooling. While those
students who had several different off-track indicators in 9th
grade were most likely to exhibit an
indicator in the middle grades, even the majority of those students who received only a
suspension in 9th
grade had previously exhibited some kind of indicator in the middle grades.
Finally, among all ninth graders who had an off-track indicator (suspension, poor attendance, or
course failure) and also were either suspended or chronically absent in the middle grades roughly
half were suspended before they were chronically absent in the middle grades. In other words

13
had some indication that being suspended was among their first off-track indicators. Course
marks were not available for the middle grades data of our sample.
Table 8 – Earlier Academic Warning Signs by 9th
Grade Suspension
Suspended in
6th
Suspended in
7th
Suspended in
8th
Suspended in
Middle Grades
Students who
were Suspended
in 9th
(N=48,853)
39% 47% 51% 69%
Attendance <
90% in 6th
Attendance <
90% in 7th
Attendance <
90% in 8th
Attendance < 90%
in Middle Grades
Students who
were Suspended
in 9th
(N=48,853)
25% 30% 32% 48%
Thus, the Florida data suggests that for half to two-thirds of students, 9th
grade suspensions is the
continuation of multi-year experience with behavioral sanctions and/or attendance issues. For
others, 9th
grade might be the first time they are suspended but that this also co-occurs with other
off track academic indicators. For others still (perhaps about 1 in 5 of suspended students), 9th
grade suspension may be their first time and only indicator, but then for many leads to other
indicators in upper grades. These relationships between disciplinary incidents and other
academic and behavioral measures such as attendance and course failures are similar and
consistent for the demographic subgroups of black students, economically disadvantaged
students, and special education students, whom as we have seen are suspended at more frequent
rates. Tables 6-8 above could only be calculated for those students without missing data. Those
students with missing data are typically more disengaged on average and thus exhibit more
frequently the academic indicators examined above. Thus we expect these to be conservative
estimates of both the frequency with which these indicators occur, and the frequency with which
they appear in tandem. For all groups of students experiencing 9th
grade suspension, the
interaction of behavioral issues to other academic indicators, as well as to past, present and
future patterns, emphasizes that keeping all students on track to high school and post-secondary
success will be more complex than just finding disciplinary alternatives to suspension. On the
other hand, the data does also suggest, the for significant number of students, being suspended
from school is a triggering event which ultimately leads to poor attendance and course failure
and through them dropping out. As a result efforts to reduce the number of suspensions in the
middle grades and high school may well help keep more students on track to high school
graduation and post-secondary attainment. Some policy alternatives such as early warning
indicator systems, improved classroom management training, social emotional learning, and

14
SWPBIS, target reductions in suspensions but are also part of broader efforts to improve student
engagement and achievement.
Policy and Practice Implications
The Florida cohort data indicates, that being suspended in the 9th
grade is common experience
impacting more than one in four students. The data further shows that suspension rates and
number of days suspended are disproportionately higher amongst poor, black, and special
education students. The data analysis, moreover, demonstrates that not only are suspensions
common but that they have significant negative consequences for student’s educational success.
Suspension in 9th
grade is directly related to students’ high school and post-secondary outcomes,
putting these subgroups of students at an even greater disadvantage. Suspensions are also
indirectly related to other key influencers of the odds that students will graduate and enroll in
post-secondary schooling through their relationships to student attendance and course passing.
Consequently, even a single suspension in the 9th
grade considerably lowers the odds that a
student will graduate from high school or enroll in college. Being suspended even once in 9th
grade is associated with a two-fold increase in the risk for dropping out.
Most students that were suspended in the 9th
grade were also suspended and/or experienced at
least one year of chronic absenteeism in the middle grades. Most also were either chronically
absent in the 9th
grade or experience course failure, and will continue to do so in the upper high
school grades. This means for many students who are suspended in the 9th
grade, the suspension
is part of a broader array of indicators that the student has fallen off the path to high school
graduation and post-secondary success, indicating that improvement efforts will need to be more
comprehensive than just attempting to limit suspensions during in high school. For a significant
minority of students, however, that data does indicate that being suspended in middle or high
school is the triggering event which then leads to broader disengagement with schooling and
eventually dropping out. Policies seeking to reduce these disciplinary disparities between groups
of students and to close racial gaps amongst other academic outcomes, thus likely need to follow
both a strategy of working to reduce suspensions, while also working in a more comprehensive
and systematic manner to also address student attendance and course passing as interrelated and
key indicators of student high school and post-secondary outcomes. Conversely, interventions
that seek to improve student engagement or course passing but fail to address or ignore
disciplinary exclusion are failing to address a major contributing factor.
The swell of predictor research has led directly to recent policy changes and the systematic
application of this knowledge by states and districts in efforts to stem their dropout crises and
increase their local graduation rates. The knowledge that suspensions, attendance, and course
passing are highly interrelated, and that students’ behaviors in 9th
grade can identify their future
outcomes, has led to the development and implementation of Early Warning Systems that

15
identify those students most at risk of dropping out based upon their 9th
grade records and data.
Support from the Federal Department of Education for its High School Graduation Initiative
(HSGI) projects, and from the National Governors Association Center for Best Practices
Association has allowed many states and districts to establish Early Warning Systems by
determining which indicators are best for their schools and generating reports from their data
base systems for school staff that identify those students most at risk in order to intervene with
them prior to their total disengagement from the school system and to keep them on track to
graduation.
This work needs to be taken a step further by integrating early warning systems, including data
on school discipline, into the nation’s on-going efforts to turnaround its lowest performing
schools. In particular, states beginning to implement their waivers from NCLB, should provide
technical assistance to districts with low performing schools to increase their capacity to
implement and monitor the effectiveness of comprehensive reforms which not only provide
better instruction to students, but also enable students to attend school regularly, not be
suspended, and succeed in their courses.
Bipartisan awareness of the importance of raising graduation rates, and increasingly combating
chronic absenteeism, have broadened and deepened understanding of the multiple elements
which need to be addressed to increase educational achievement in the United States. To this we
need to add a deeper understanding of the role school discipline and its disproportionalities plays
in the nation’s educational success. States and districts need to undertake reviews of the
discipline policies to insure that they hold students accountable for good behavior but do not
explicitly or implicitly sanction students in manners which increase the odds that they will not
graduate. For example, it is counter- productive to suspend students for being chronically
absent.
Finally, given that being suspended in the 9th
grade greatly diminishes a student’s odds of
graduating and enrolling in post-secondary schooling, and that clear evidence exists not only in
Florida, but across the nation, that minority and special education students are suspended
disproportionately (even after controlling for poverty), real urgency needs to be applied to ending
this disproportionality. The fact that high poverty high schools with low suspension rates for
black and special education students exist in Florida and other states, indicates that not only must
we act but that we can act. This is why on-going efforts like the Consensus Project on School
Discipline are so essential. Otherwise, given the centrality of a high school diploma and post-
secondary schooling to adult success in the 21st century, we are knowingly creating an unequal
and less successful society.

16
References
Balfanz, R., Herzog, L., & MacIver, D. 2007. Preventing Student Disengagement and Keeping
Students on the Graduation Track in High-Poverty Middle-Grades Schools: Early Identification
and Effective Interventions. EDUCATIONAL PSYCHOLOGIST, 42(4), 223–235.
Blank, R., & Langesen, D. (1999). State Indicators of Science and Mathematics Education 1999.
Washington, DC: Council of Chief State School Officers.
Center for Social Organization of Schools. 2007. Falling Off the Path to Graduation: Middle
Grade Indicators in Indianapolis. Baltimore, MD: Johns Hopkins University.
Ciolfi, A., Shin, C., & Harris, J. 2011. Educate Every Child: Promoting Positive Solutions to
School Discipline in Virginia. Charlottesville, VA: JustChildren.Program, Legal Aid Justice
Center.
Everyone Graduates Center. 2010a. Early Indicator Analysis: Arkansas. Baltimore, MD: Johns
Hopkins University.
Everyone Graduates Center. 2010b. Early Warning Indicator Analysis: Tennessee. Baltimore,
MD: Johns Hopkins University.
Everyone Graduates Center. 2010c. Early Indicator Analysis for Metro Nashville Public Schools.
Baltimore, MD: Johns Hopkins University.
Everyone Graduates Center. 2010d. Massachusettes Segmentation Study. Baltimore, MD: Johns
Hopkins University.
Everyone Graduates Center. 2010e. Multiple Pathways Segmentation Study: Austin Independent
School District. Baltimore, MD: Johns Hopkins University.
Everyone Graduates Center. 2011. Early Indicator Analysis of High School and Post-Secondary
Outcomes: Florida. Baltimore, MD: Johns Hopkins University.
Fabelo, T., Thompson, D., Plotkin, M., Carmichael, D., Marchbanks, M. P., & Booth, E. A..
2011. Breaking Schools’ Rules: A Statewide Study of How School Discipline Relates to
Students’ Success and Juvenile Justice Involvement. NY: Council of State Governments Justice
Center.

17
Freedberg, L. & Chavez, L. 2012. Understanding School Discipline in California: Perceptions
and Practice. Oakland, CA: EdSource.
Georgia Appleseed Center for Law & Justice. 2011. Effective Student Discipline: Keeping Kids
In Class. Atlanta, GA. Available at www.GaAppleseed.org/keepingkidsinclass.
Harris, D., & Herrington, C. 2006. Accountability, Standards, and the Growing Achievement,
Gap: Lessons from the Past Half-Century. American Journal of Education, Vol. 112, No. 2, pp.
209-238.
Losen, D. J., & J. Gillespie. 2012. Opportunities Suspended: The Disparate Impact of
Disciplinary Exclusion from School. Los Angeles, CA: The Civil Rights Project, UCLA.
MacIver, M., Balfanz, R., & Byrnes, V. 2009. Advancing the “Colorado Graduates” Agenda:
Understanding the Dropout Problem and Mobilizing to Meet the Graduation Challenge.
Baltimore, MD: Center for Social Organization of Schools, Johns Hopkins University.
NAACP Legal Defense & Educational Fund. 2006. Arresting Development: Addressing the
School Discipline Crisis in Florida. available at
http://www.naacpldf.org/content/pdf/pipeline/arresting_development_full_report.
Sullivan, E. & Morgan, D. 2010. Pushed Out: Harsh Discipline in Louisiana Schools Denies the
Right to Education. available at http://www.nesri.org/fact_sheets_pubs/Pushed_Out_Report.pdf.
Texas Appleseed. 2007. Texas’ School to Prison Pipeline: Dropout to Incarceration.

18
Appendix 1