antecedents of chronic homelessness
TRANSCRIPT
All Alone ANTECEDENTS OF CHRONIC HOMELESSNESS
Daniel Flaming and Patrick Burns
ECONOMIC ROUNDTABLE
Knowledge for the Greater Good
Underwritten by the Conrad N. Hilton Foundation

When, in disgrace with fortune and men’s eyes,
I all alone beweep my outcast state,
And trouble deaf heaven with my bootless cries,
And look upon myself, and curse my fate,
Wishing me like to one more rich in hope
William Shakespeare
Sonnet 29
All Alone Antecedents of Chronic Homelessness
2015
Daniel Flaming
Patrick Burns
Underwritten by the Conrad N. Hilton Foundation
This report has been prepared by the Economic Roundtable, which assumes all responsibility for its contents. Data, interpretations and conclusions contained in this report are not necessarily
those of any other organization that supported or assisted this project.
This report can be downloaded from the Economic Roundtable web site:
http://www.economicrt.org
Contents
1 Executive Summary ......................................................................................................1
2 Opening a Window ........................................................................................................................... 7
Overview .......................................................................................................................................... 7
Preventing Homelessness .......................................................................................................... 7
Study Background ..................................................................................................................... 11
Public Assistance Records and Homelessness ........................................................................... 11
Public Assistance Programs ...................................................................................................... 14
3 Paths into Chronic Homelessness ................................................................................. 16
Overview of Findings ................................................................................................................ 16
Three Study Groups .................................................................................................................. 16
Three Comparison Groups: Selection Criteria and Demographics ............................................. 17
Public Assistance Benefits ........................................................................................................ 19
Earned Income ......................................................................................................................... 21
Disabilities ................................................................................................................................ 24
Problems .................................................................................................................................. 25
Homelessness .......................................................................................................................... 27
Disabilities among New Entrants into Homelessness ............................................................... 24
Summary of Study Group Findings ........................................................................................... 30
4 Homelessness within Public Assistance Programs ................................................................. 31
Overview of Findings...................................................................................................................... 31
Homelessness among Recipient Groups ........................................................................................ 32
Duration of General Assistance Benefits ....................................................................................... 23
Homelessness among Age Groups ........................................................................................... 34
Homelessness among Women and Men ................................................................................... 36
Homelessness among Ethnic Groups ......................................................................................... 37
Marital Status of Homeless Public Assistance Recipients ......................................................... 40
Summary of Demographic Findings ......................................................................................... 42
5 Homeless Public Assistance Recipients with Disabilities ................................................. 44
Overview of Findings ................................................................................................................ 44
Under-reported Disabilities ...................................................................................................... 44
Disabilities in Public Assistance Records ................................................................................... 45
Disability Rates among Public Assistance Recipients in Census Records .................................. 47
Summary of Findings about Disabilities ................................................................................... 51
6 Work History and Homelessness .................................................................................. 52
Overview of Findings ................................................................................................................ 52
Employment ............................................................................................................................. 52
Earned Income ......................................................................................................................... 53
Profile of Employed Recipients ................................................................................................. 55
Summary of Employment Findings .......................................................................................... 56
7 Recommendations ...................................................................................................... 57
8 Department of Public Social Services Comments ........................................................... 61
Comparison of Methods for Identifying Homeless Recipients ................................................... 71
Information about DPSS Programs to Assist Homeless Recipients ............................................ 75
Chapter 1
Executive Summary
THE ROLE OF PUBLIC ASSISTANCE PROGRAMS IN PREVENTING CHRONIC HOMELESSNESS
The number of Los Angeles residents experiencing chronic homelessness continues to grow even after
housing over 10,000 individuals in the past three years. This tells us that the flow of individuals into
chronic homelessness is unabated—the pathways have not been closed. Multiple failures create these
paths into homelessness and chronic homelessness: families, schools, social services, health and mental
health care, the criminal justice system, lack of affordable housing, and a stagnant labor market.
Public assistance programs are Los Angeles’s primary interface with individuals experiencing homeless-
ness, touching most of this population on a continuing basis. All of the combined human service re-
sources of health, mental health, justice system, housing, social service, and educational agencies are
required to close paths into homelessness and restore a place in the community for individuals who
have experienced homelessness.
Public assistance programs can be a catalyst for connecting at-risk and homeless recipients with crucial
services and reducing the massive public costs associated with chronic homelessness. The vital role is to
identify tripwire events among all recipients, particularly children and transition-age youth, and quickly
connect at-risk individuals with needed behavioral health and housing services provided by other organi-
zations.
PREVENTING HOMELESSNESS
The purpose of this report is to provide tools for preventing homelessness. Prevention is critical for re-
ducing the number of people who experience homelessness as well as the number who become chroni-
cally homeless. Housing alone will not provide a solution until the pathways into homelessness are nar-
rowed. Given the size of Los Angeles’ homeless population, needs now overwhelm available solutions.
Employment and prevention are the foundation for an effective response to homelessness. This in-
cludes readily available and effective mental health and employment services. Most people, but not
enough, escape homelessness with the help of family and friends or by finding a job, as evidenced by
the fact that nearly nine out of ten people who experienced homelessness over a six-year period do not
become chronically homeless. However, many of these individuals remain precariously housed with
marginal incomes and continue to be vulnerable to homelessness.
We estimate that employment and prevention services are an adequate response for roughly 70 percent
of individuals who experience homelessness, but that 20 percent of individuals have an acute need for
these services and are unable to obtain them. For many individuals, employment is a genuine possibility
as well as the only realistic option for escaping acute poverty, but many need help to move past the
wreckage caused by homelessness and find a job.
2 Antecedents of Chronic Homelessness
Deeply subsidized housing is needed to enable jobless individuals to avoid homelessness. However, HUD
funding for the Section 8 Housing Choice Voucher Program, the primary resource for making rental
housing affordable to low and very-low income households, has declined since 2010. The wait for
vouchers is now longer than ten years. Chronically homeless individuals with acute disabilities are given
priority access to Section 8 vouchers, but this still leaves the majority of currently and formerly homeless
individuals with very long waits for affordable housing. We estimate that only one in ten individuals in
this segment of the population touched by homelessness is able to obtain a Section 8 voucher.
Supplemental Security Insurance (SSI) and low-cost market rate housing enable low income individuals
with disabilities to avoid homelessness. SSI benefits provide up to $889 a month in cash aid, which ena-
bles individuals to pay for basic necessities, including low cost housing, for example, at board and care
facilities. We estimate that 49 percent of indigent adults with disabilities in Los Angeles County who are
eligible for SSI are not receiving it. This represents 24,000 individuals. We estimate that homeless indi-
viduals in this gap population make up roughly 5 percent of Los Angeles adults who experience home-
lessness.
Permanent supportive housing is housing that is permanently affordable to an individual and has on-site
services such as case management. This wrap around housing is costly because it requires both deep
rent subsidies, often through Section 8, and funding to pay for ongoing supportive services. Chronically
homeless individuals with acute needs are now being given higher priority for access to permanent sup-
portive housing, but because of the scarcity of housing units with supportive services, most do not re-
ceive this type of housing. We estimate that this gap population makes up roughly 8 percent of Los An-
geles adults who experience homelessness.
In summary, based on our rough estimates of needed and available solutions to homelessness, 42 per-
cent of people who experience homelessness do not receive the help that they need to exit homelessness,
as opposed to being aided while they remain homeless. The primary reason is that there is not money
to pay for the solutions. The shortfall in the types of help needed by different groups experiencing
homelessness shows that Los Angeles will need to spend far more than it has been willing to spend in
order to end homelessness. The problem will be more solvable if fewer people become homeless. This
requires more effective efforts to prevent homelessness, beginning with children who are vulnerable to
becoming homeless as adults. This report focuses on addressing that challenge.
STUDY BACKGROUND
Our understanding of the pathways into chronic homelessness is sparse. We know that on any given
day, a large population of people are at risk of becoming homeless, a smaller population that is actually
homeless, and a still smaller population that is chronically homeless.
The pathways into homelessness have been described through anecdotal stories but are seldom ex-
plored using public agency data for a large population over an extended time. This study aims to help
overcome that deficit and provide a more definitive portrait of such pathways. This window on home-
lessness is drawn from nine years of public assistance records for 8,969,289 residents of Los Angeles
Economic Roundtable 3
County who received some form of public assistance from 2002 through 2010, including 942,562 recipi-
ents who experienced episodes of homelessness.
The Los Angeles County Board of Supervisors, together with the California Employment Development
and Social Services departments, authorized release to the Economic Roundtable of all public assistance
recipient records from 2002 through 2010, quarterly wage records, and health, mental health, child wel-
fare, justice system, and education records for individuals who received any type of public assistance.
This report provides the first results from this project, analyzing homeless dynamics in public assistance
records. The larger project, once funded, will link records to integrate data across agencies and identify
opportunities to prevent and avoid public costs for chronic homelessness. This comprehensive analysis
includes health, mental health, justice system, education, child welfare, and labor market outcomes.
DEMOGRAPHIC FINDINGS
Over 13,000 public assistance recipients were newly identified as homeless each month from 2002
through 2010. A quarter of these individuals entering homelessness, 3,700 in the average month, were
chronically homeless as a result of experiencing four or more stints of homelessness within three years.
Over 100,000 children did not have a home in the average month.
Recipients of cash aid have far higher reported monthly rates of homelessness (General Relief 59 per-cent, CalWORKs 22 percent) than recipients of other types of public assistance (food stamps 6 percent, Medi-Cal 3 percent).
Half of all homeless public assistance recipients are children.
African Americans make up a share of homeless public assistance recipients that is almost six times as
great as their share of the overall county population. Thirty-seven percent of African American recipients
are identified as homeless each month.
Married couples have a clear advantage in retaining shelter; only 2 percent are identified as homeless
each month compared with 12 percent of single adults.
FINDINGS ABOUT DISABILITIES
Fewer than one in ten children with disabilities are identified. More complete recognition of vulnerabili-ties among children who are at risk of homelessness as they enter adulthood will make it more feasible to reduce the feeder pipeline from childhood poverty and homeless episodes into adult homelessness and chronic homelessness.
Disabilities are under-reported by half in public assistance records for the overall population of cash aid recipients. Disabilities are associated with higher rates of homelessness and chronic homelessness. Disa-bilities are six times more prevalent among General Relief recipients—who typically are destitute single men—than in any other assistance program. Thirty-one percent of recipients have disabilities.
Census data indicate that the most frequent disabilities among cash aid recipients are ambulatory and cognitive limitations.
4 Antecedents of Chronic Homelessness
EMPLOYMENT FINDINGS
Employment rates and earnings are too low to provide a path out of poverty for most recipients. The
monthly employment rate in 2010 was 9 percent for nonhomeless General Relief recipients and 32 per-
cent in 2010 for nonhomeless CalWORKs recipients. For recipients who do find employment, earnings
are too low to move them out of poverty. The median monthly earnings in 2010 for employed non-
homeless General Relief recipients was $501 and for employed nonhomeless CalWORKs recipients was
$806.
Even more challenged were recipients with disabilities, who found jobs only one third as often as the
overall population of CalWORKs and General Relief recipients (8 versus 24 percent).
Lower employment rates and earnings levels do not by themselves account for homelessness, since
most nonhomeless recipients of General Relief or CalWORKs are not employed, and earnings for em-
ployed recipients are only about a third of the poverty threshold. However, disabilities greatly com-
pound the risk of homelessness.
VULNERABLE YOUTH TRANSITIONING INTO ADULTHOOD
The long-lasting and destabilizing effects of homelessness on young women may create elevated risks of
homelessness for their children as they transition into adulthood. Although the highest rates of disabili-
ties are found among men, this difficult life path is more likely to originate in childhood experiences in
homeless families, creating vulnerabilities that have cascading effects throughout their lives.
Extended participation in cash benefit public assistance programs is more frequent among recipients
with childhood experiences of homelessness. Experiences of homelessness while transitioning from child-
hood to adulthood are associated with reduced employment rates and highly elevated rates of disabili-
ties for both women and men.
Mental health and substance abuse screening and services are scarce for the population of single adult
males with extended dependence on public assistance, which is at highest risk of chronic homelessness.
Participation in General Relief is particularly prominent among young adult men who have experienced
homelessness. Having a history of homelessness, being male, and being dependent on General Relief for
income maintenance is associated with greatly increased likelihood of recurrent homelessness. This risk
is an order of magnitude greater for African American men.
Individuals with homeless experiences in their backgrounds and repeated episodes of homelessness are
increasingly vulnerable to disabilities as they age if they have continuing dependence on General Relief
as their source of income. General Relief recipients who experience homelessness are 415 percent more
likely to have long-term dependence on public assistance than those who do not experience homeless-
ness. This is a seedbed of chronic homelessness.
Economic Roundtable 5
RECOMMENDATIONS
Public assistance programs pay only a quarter of public costs for all homeless persons and a twentieth of
the costs for the chronically homeless with the highest public costs—the 10th decile, but they are the
primary point of public contact with individuals experiencing homelessness. Public assistance programs
by themselves have limited capacity to provide health and mental health services; however, they are the
best positioned public programs for identifying these needs. The critical role for assistance programs is
not to fund all of the services needed to prevent chronic homelessness, but to connect individuals need-
ing those services with other organizations that can provide them.
SCREENING
The intake and assessment process for public assistance programs does not include questions about
whether children have disabilities. Often problems are identified after they have grown into chronic dis-
abilities rather than when families are assessed for public assistance or when problems first emerge.
This is particularly the case for CalWORKs children with all types of disabilities and for both CalWORKs
and General Relief adults experiencing mental health problems.
Recommendations:
1. Modify the intake process for CalWORKs to include questions about whether children have spe-
cial needs.
2. Modify the intake process for CalWORKs and General Relief to include questions about whether
adults need behavioral health services. Examples of questions for seeking this type of infor-
mation range from those developed by the Centers for Disease Control and Prevention to those
used by the American Community Survey.
TRIPWIRES
Tripwire events for flagging risks and occurrences of homelessness include:
1. Homelessness
2. Prolonged or repeated episodes of homelessness
3. Homeless children
4. Domestic violence
5. Children who are not attending school regularly
6. Long-term unemployed adults
Recommendation:
Public assistance programs should quickly open the door to integrated public and private heath,
mental health, housing, and case management services for individuals and families that experi-
ence any of the tripwire events indicating risk of recurring or prolonged homelessness.
BREAKING DOWN SILOS
6 Antecedents of Chronic Homelessness
All of the combined human service resources of health, mental health, justice system, housing, social service, and educational agencies are required to close paths into homelessness and restore a place in the community for individuals who have experienced homelessness. Public assistance programs can be a catalyst for connecting at-risk and homeless recipients with crucial services and reducing massive public costs for chronic homelessness. This requires growing beyond the role of isolated eligibility determina-tion programs to expeditiously and reliably providing crucial linkage services.
Recommendation:
When any tripwire event occurs:
1. Immediately reassess the case. 2. Immediately notify appropriate service providers about the event and assessment results. 3. Facilitate access and rapid face-to-face engagement of recipients needing services with appro-
priate service providers. 4. This strategy of rapid engagement with needed services should be facilitated by co-locating
mental health services in public assistance offices.
TIMELY SERVICES FOR AT-RISK INDIVIDUALS
Mental health, substance abuse, and other needed behavioral health services should be made accessible to all who need these services. Among CalWORKs recipients, the primary group with access to these ser-vices is welfare-to-work participants; among General Relief recipients, the primary groups are recipients who are employed or SSI eligible. Access to services that can prevent, stabilize, or reverse disabilities and prevent movement into chronic homelessness should be readily available to all public assistance re-cipients. Access to services is especially important for children and transition-age youth.
Recommendation:
Facilitate access to the following services children, adults and families that experience any of the tripwire events:
1. Home visits by a public health nurse for any family with children 2. Mental health services 3. Substance abuse rehabilitation services
RECIPIENT EDUCATION
Anecdotal information indicates that families are reluctant to interact with children’s services workers
or probation officers because of concern that this may result in individuals being removed from the
home. Medical, mental health, and rehabilitation services are more likely to be accepted by recipients,
and wide availability and use of these services can have a crucial effect on preventing homelessness.
Recommendation:
Initiate an extensive recipient education campaign to win the trust of participants in the services
that are offered to them. It is important that these services not be experienced as intrusive or sanc-
tioning.
Chapter 2
Opening a Window
OVERVIEW
Homeless individuals are characterized by the absence of connections that are crucial for well-being, in-
cluding connections to shelter, family, and health. The acute deprivation, desperation, and chaos inher-
ent in homelessness destabilize the lives of individuals and communities. These deficits are more severe
and indelible among individuals experiencing chronic homelessness, for whom homelessness has be-
come a way of life.
On any given day there is a large population of people at risk of becoming homeless, a much smaller
population that is actually homeless, and a still smaller population that is chronically homeless. The
most recent count found that on a given night in January 2015, 44,359 individuals in Los Angeles County
were experiencing homelessness, and among them 34 percent were chronically homeless.1 Over the
course of a year, the annual homeless count becomes much larger as the chronically homeless core is
augmented by more and more people with short homeless stints. Because of their continuous presence
in public spaces, hospitals, jails, and homeless shelters, as well as their serious health and mental health
conditions, chronically homeless individuals are the most visible and painful face of homelessness.
This report sheds light on the circumstances that are precursors to chronic homelessness. This view of
homelessness is provided by statistical analysis of nine years of records for 8,969,289 residents of Los
Angeles County who received some form of public assistance from 2002 through 2010, including
942,562 recipients who experienced episodes of homelessness.
PREVENTING HOMELESSNESS
The purpose of this report is to provide tools for preventing homelessness. Prevention is critical for re-
ducing the number of people who experience homelessness as well as the number who become chroni-
cally homeless. Housing does not provide a solution until the pathways into homelessness are nar-
rowed.
The homeless population is dynamic, with many individuals making lasting exits after short episodes of
homelessness, a smaller number of individuals cycling into and out of homelessness, and an even
smaller number of individuals experiencing continuous, unremitting, chronic homelessness. However,
the number of chronically homeless individuals is growing and is substantially larger than the inventory
of affordable housing that is available for them. The number of Los Angeles residents experiencing
chronic homelessness continues to grow even after housing over 10,000 individuals in the past three
years. This tells us that the flow of individuals into chronic homelessness is unabated—the pathways
have not been narrowed, much less closed.
1 Los Angeles Homeless Services Authority, http://www.lahsa.org/homelesscount_results (August 10, 2015).
8 Antecedents of Chronic Homelessness
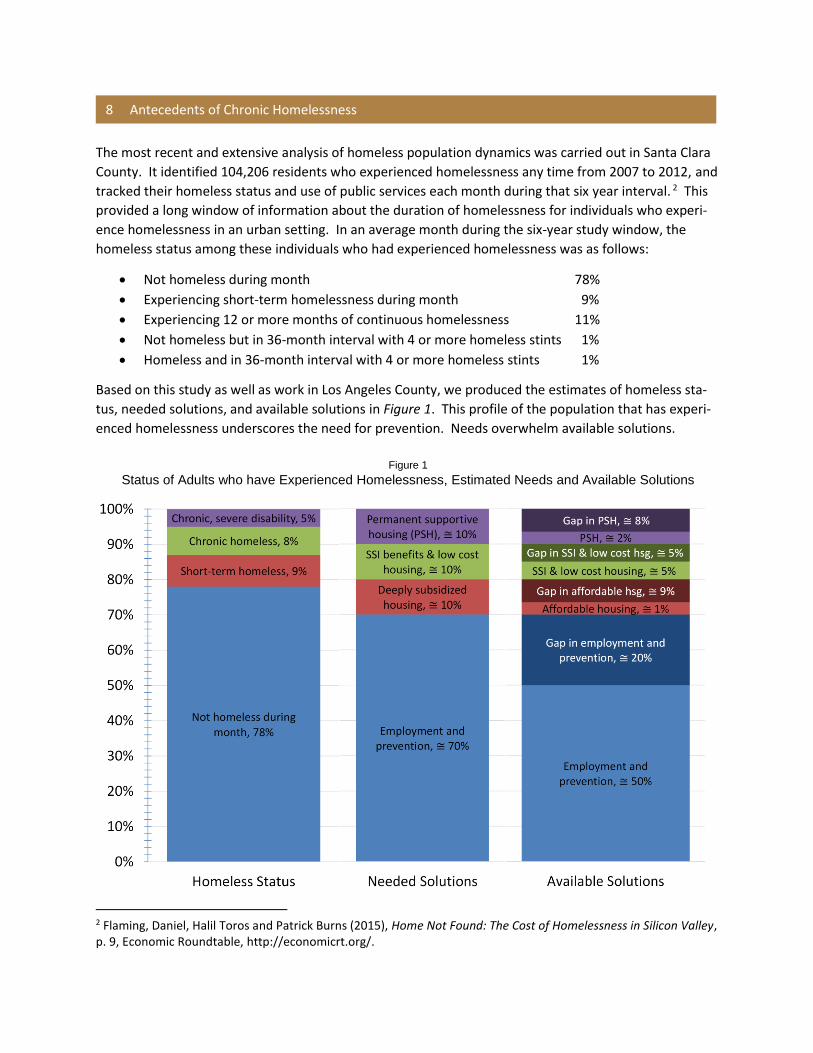
The most recent and extensive analysis of homeless population dynamics was carried out in Santa Clara
County. It identified 104,206 residents who experienced homelessness any time from 2007 to 2012, and
tracked their homeless status and use of public services each month during that six year interval. 2 This
provided a long window of information about the duration of homelessness for individuals who experi-
ence homelessness in an urban setting. In an average month during the six-year study window, the
homeless status among these individuals who had experienced homelessness was as follows:
Not homeless during month 78%
Experiencing short-term homelessness during month 9%
Experiencing 12 or more months of continuous homelessness 11%
Not homeless but in 36-month interval with 4 or more homeless stints 1%
Homeless and in 36-month interval with 4 or more homeless stints 1%
Based on this study as well as work in Los Angeles County, we produced the estimates of homeless sta-
tus, needed solutions, and available solutions in Figure 1. This profile of the population that has experi-
enced homelessness underscores the need for prevention. Needs overwhelm available solutions.
2 Flaming, Daniel, Halil Toros and Patrick Burns (2015), Home Not Found: The Cost of Homelessness in Silicon Valley, p. 9, Economic Roundtable, http://economicrt.org/.
Figure 1
Status of Adults who have Experienced Homelessness, Estimated Needs and Available Solutions
Economic Roundtable 9
These estimates of homeless status, needs and available solutions are partially quantitative and partially
impressionistic. They are drawn from our analyses of homeless population dynamics and public costs
for homelessness in Los Angeles and Santa Clara counties, as well as our operational experience imple-
menting the 10th Decile Project that houses high need, high cost individuals in Los Angeles County.3
Employment and Prevention
Employment and prevention are the foundation for an effective response to homelessness. This in-
cludes readily available and effective mental health and employment services. Most people, but not
enough, escape homelessness with the help of family and friends or by finding a job, as evidenced by
the fact that 87 percent of people who experienced homelessness in Santa Clara County did not become
chronically homeless during the six-year study window. However, many of these individuals remain pre-
cariously housed with marginal incomes and continue to be vulnerable to homelessness.
We estimate that employment and prevention services are an adequate response for roughly 70 percent
of individuals who experience homelessness, but that 20 percent of individuals have an acute need for
these services and are unable to obtain them. Within the Santa Clara County study population, nearly
half of adults in the bottom half of the public cost distribution and a quarter of adults among the five
percent with the highest public costs had earned income during the study window.4 Re-entering the la-
bor market becomes increasingly difficult the longer individuals are disconnected from work, but for
many individuals, employment is a genuine possibility as well as the only realistic option for escaping
acute poverty, but many need help to move past the wreckage caused by homelessness and find a job.
Deeply Subsidized Housing
Jobless individuals need housing that is affordable with their very modest income to avoid homeless-
ness. However, HUD funding for the Section 8 Housing Choice Voucher Program, the primary resource
for making rental housing affordable to low and very-low income households, has declined since 2010.
To obtain these scarce subsidies, homeless individuals must compete with low-income seniors, families
and persons with disabilities, all of whom need the same help. A decade and a half ago, the federal De-
partment of Housing and Urban Development reported that there was a 10 year wait in Los Angeles for
Section 8 vouchers.5 The City of Los Angeles wait list was closed in 2004 and has not reopened since,
indicating that the wait has grown longer.6 Chronically homeless individuals with acute disabilities are
3 This work is described in the following Economic Roundtable reports: Where We Sleep: The Cost of Housing and Homelessness in Los Angeles (2009), Crisis Indicator: Triage Tool for Identifying Homeless Adults in Crisis (2011), Getting Home: Outcomes from Housing High Cost Homeless Hospital Patients (2013), Home Not Found: The Cost of Homelessness in Silicon Valley (2015), www.economicrt.org.
4 These employment outcomes are from social service records and are for individuals 18 to 64 years of age in 2007 who received some form of public assistance. In many instances, employment was short term and intermittent. Forty-seven percent of individuals in the bottom half of the public cost distribution and 23 percent of individuals in the top 5 percent of costs had earned income during the six-year study window.
5 Department of Housing and Urban Development, Waiting in Vain: an update on America's rental housing crisis, Washington, D.C.: Department of Housing and Urban Development (1999).
6 City of Los Angeles, http://www.lacity.org/311-directory-online-services/servicedetail/2908 (August 10, 2015).
10 Antecedents of Chronic Homelessness
given priority access to Section 8 vouchers, but this still leaves the majority of currently and formerly
homeless individuals without access to affordable housing. A subgroup within this population is employ-
able and if they are able to find work their need for affordable housing is temporary. Overall, we esti-
mate that only one in ten individuals in this segment of the population touched by homelessness is able
to obtain a Section 8 voucher.
Supplemental Security Insurance (SSI) and Low-Cost Market Rate Housing
Low income individuals who cannot earn an income because of a mental or physical impairment are eli-
gible for Supplemental Security Insurance (SSI) benefits that provide up to $889 a month in cash aid.
This income enables individuals to pay for basic necessities, including low cost housing, for example, at a
board and care facility. Among residents of Santa Clara County who experienced homelessness and had
received medical care, 17 percent were diagnosed with a psychosis. This is only one of many disabling
health conditions that affect homeless individuals. In a previous study we estimated that 49 percent of
indigent adults with disabilities in Los Angeles County who are eligible for SSI are not receiving it.7 This
represents 24,000 individuals. If these individuals were receiving income support through SSI they
would be able to pay for some form of basic shelter and avoid homelessness. We estimate that this gap
population makes up roughly 5 percent of Los Angeles adults who experience homelessness.
Permanent Supportive Housing
Permanent supportive housing (PSH), that is housing that is permanently affordable to an individual and
has on-site services including case management, is the most complete response to homelessness. How-
ever, this wrap around housing is costly because it requires both deep rent subsidies, often through Sec-
tion 8, and funding to pay for ongoing supportive services. We estimate that a majority of chronically
homeless individuals need permanent supportive housing, but that because of the scarce number of
available units and Section 8 vouchers, as well as insufficient funding for supportive services, most are
unable to obtain it.
Roughly half of the people needing permanent supportive housing are frequent users of health care and
justice system services with public costs that are sufficiently high to offset the cost of providing housing
and supportive services. The Roundtable’s study of public costs for homelessness in Los Angeles County
used a two-year study window and found that 10 percent of the population experiencing homelessness
had public costs averaging roughly $70,000, and that those costs went down by more than two-thirds
after these individuals are stabilized in permanent supportive housing. 8 The six-year window for the
Santa Clara County study meant that a larger share of the study population was made up of people with
comparatively short homeless stints, so the share in the highest cost group dropped to 5 percent.
Chronically homeless individuals with acute needs are now being given higher priority for access to per-
manent supportive housing, but because of the scarcity of housing units with supportive services, most
7 Economic Roundtable (2011), Dividends of a Hand Up: Benefits of Moving Indigent Adults with Disabilities onto SSI, pp. 9, 47, www.economicrt.org.
8 Economic Roundtable (2009), Where We Sleep: The Costs of Housing and Homelessness in Los Angeles, http://economicrt.org/publication/.
Economic Roundtable 11
do not receive this type of housing. We estimate that this gap population makes up roughly 8 percent of
Los Angeles adults who experience homelessness.
Based on the rough estimates of needed and available solutions to homelessness shown in Figure 1, 42
percent of people who experience homelessness do not receive the help that they need to exit home-
lessness, as opposed to being aided while they remain homeless. The primary reason is that there is not
money to pay for the solutions. The shortfall in the types of help needed by different groups experienc-
ing homelessness shows that Los Angeles will need to spend far more than it has been willing to spend
in order to end homelessness. The problem will be more solvable if fewer people become homeless.
This requires more effective efforts to prevent homelessness, beginning with children who are vulnera-
ble to becoming homeless as adults. This report focuses on addressing that challenge.
STUDY BACKGROUND
The Los Angeles County Board of Supervisors, together with the California Employment Development
and Social Services departments, authorized release to the Economic Roundtable of all public assistance
recipient records from 2002 through 2010, quarterly wage records, and health, mental health, child wel-
fare, justice system, and education records for individuals who received any type of public assistance.9
This report provides the first results from this project, analyzing homeless dynamics in public assistance
records. Chapter 3 reports on three matched study and comparison groups of highly vulnerable popula-
tions: homeless teenagers, teen mothers, and young adults experiencing homelessness. Chapters 4, 5,
and 6 report on demography, disabilities, and work.
The larger project, once funded, will link records to integrate data across agencies and identify opportu-
nities to prevent and avoid public costs that result from unemployment, poverty and homelessness. This
comprehensive analysis will include health, mental health, justice system, education, child welfare, and
labor market outcomes.
PUBLIC ASSISTANCE RECORDS AND HOMELESSNESS
The primary case management data system used during the period covered by this report was called
LEADER (Los Angeles Eligibility, Automated Determination, Evaluation, and Reporting). These records
include a flag for homelessness. Among other things, the flag indicates that the recipient does not have
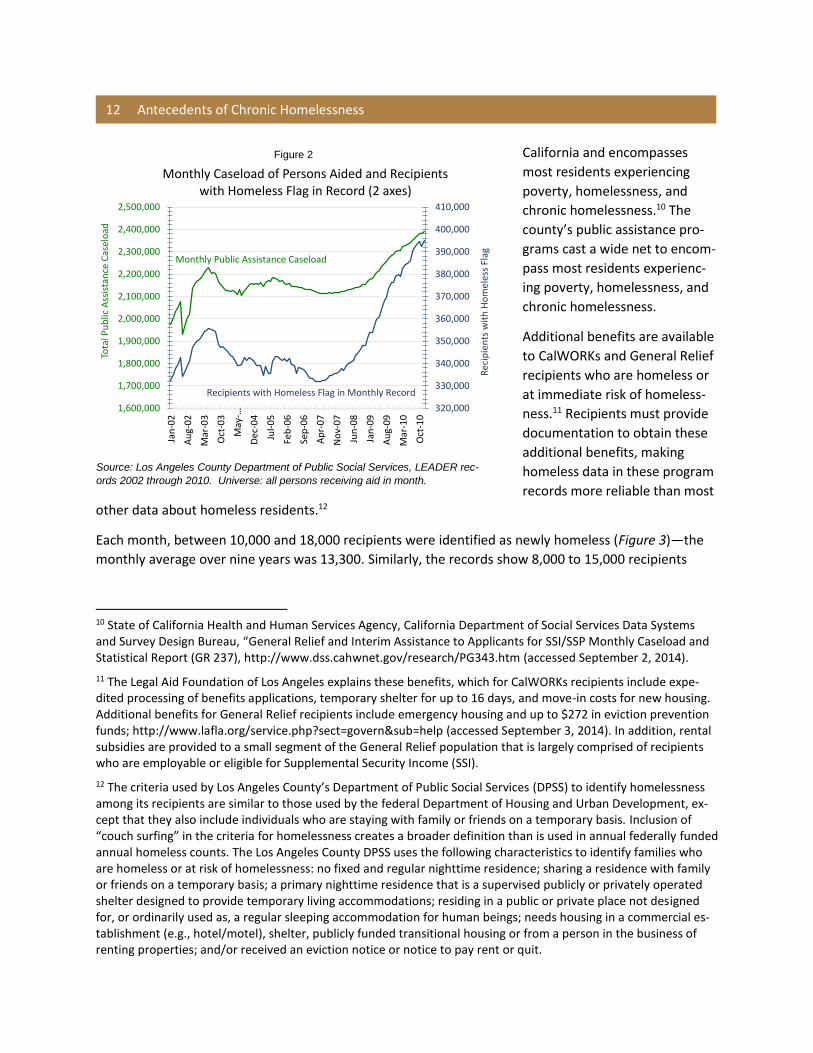
a home address. Figure 2 shows the total monthly caseload (left axis) and total monthly number of re-
cipients with a homeless flag in their record each month from 2002 to 2010 (right axis).
The county’s public assistance records are an extensive source of information about individuals experi-
encing homelessness, a population that is largely invisible in most other official data sources. These rec-
ords are comparatively reliable because the information is reviewed and accepted by social services
staff. The county’s public assistance caseload accounts for two thirds of all General Relief recipients in
9 Los Angeles County Board of Supervisors, June 7, 2005; California Health and Human Services Agency Committee for the Protection of Human Subjects, May 11, 2007; California Employment Development Department and Department of Social Services, September 9, 2009.
12 Antecedents of Chronic Homelessness
California and encompasses
most residents experiencing
poverty, homelessness, and
chronic homelessness.10 The
county’s public assistance pro-
grams cast a wide net to encom-
pass most residents experienc-
ing poverty, homelessness, and
chronic homelessness.
Additional benefits are available
to CalWORKs and General Relief
recipients who are homeless or
at immediate risk of homeless-
ness.11 Recipients must provide
documentation to obtain these
additional benefits, making
homeless data in these program
records more reliable than most
other data about homeless residents.12
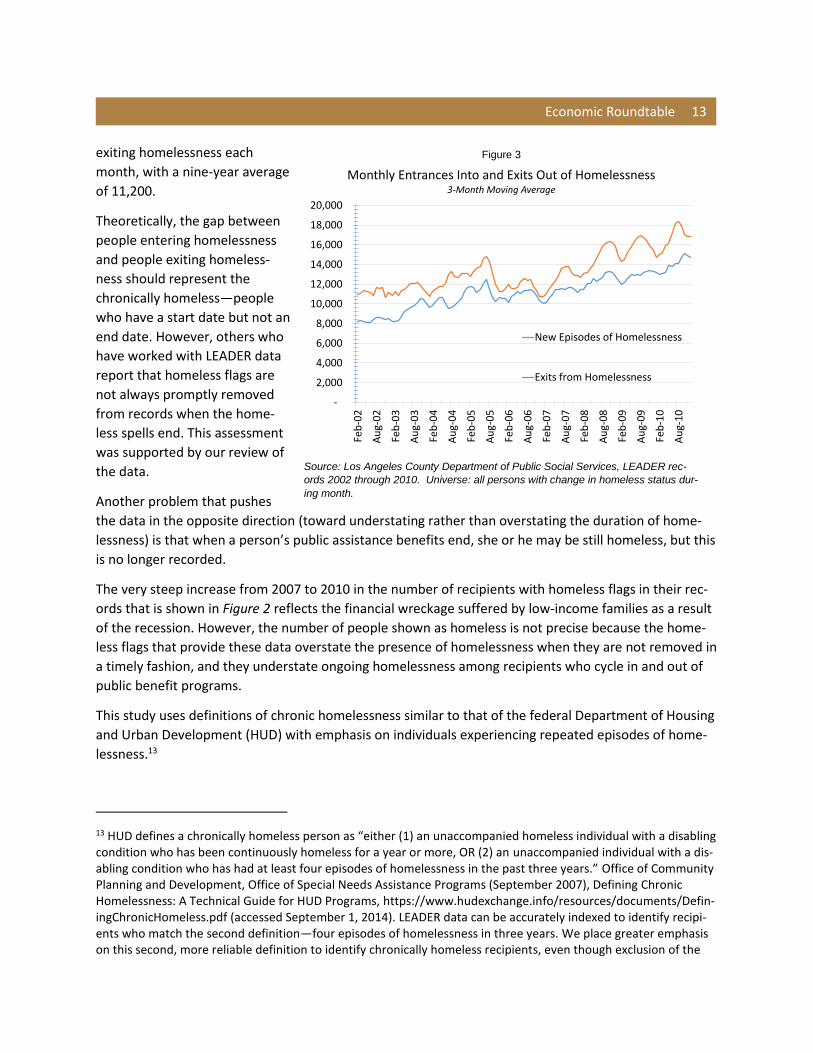
Each month, between 10,000 and 18,000 recipients were identified as newly homeless (Figure 3)—the
monthly average over nine years was 13,300. Similarly, the records show 8,000 to 15,000 recipients
10 State of California Health and Human Services Agency, California Department of Social Services Data Systems and Survey Design Bureau, “General Relief and Interim Assistance to Applicants for SSI/SSP Monthly Caseload and Statistical Report (GR 237), http://www.dss.cahwnet.gov/research/PG343.htm (accessed September 2, 2014).
11 The Legal Aid Foundation of Los Angeles explains these benefits, which for CalWORKs recipients include expe-dited processing of benefits applications, temporary shelter for up to 16 days, and move-in costs for new housing. Additional benefits for General Relief recipients include emergency housing and up to $272 in eviction prevention funds; http://www.lafla.org/service.php?sect=govern&sub=help (accessed September 3, 2014). In addition, rental subsidies are provided to a small segment of the General Relief population that is largely comprised of recipients who are employable or eligible for Supplemental Security Income (SSI).
12 The criteria used by Los Angeles County’s Department of Public Social Services (DPSS) to identify homelessness among its recipients are similar to those used by the federal Department of Housing and Urban Development, ex-cept that they also include individuals who are staying with family or friends on a temporary basis. Inclusion of “couch surfing” in the criteria for homelessness creates a broader definition than is used in annual federally funded annual homeless counts. The Los Angeles County DPSS uses the following characteristics to identify families who are homeless or at risk of homelessness: no fixed and regular nighttime residence; sharing a residence with family or friends on a temporary basis; a primary nighttime residence that is a supervised publicly or privately operated shelter designed to provide temporary living accommodations; residing in a public or private place not designed for, or ordinarily used as, a regular sleeping accommodation for human beings; needs housing in a commercial es-tablishment (e.g., hotel/motel), shelter, publicly funded transitional housing or from a person in the business of renting properties; and/or received an eviction notice or notice to pay rent or quit.
Figure 2
Source: Los Angeles County Department of Public Social Services, LEADER rec-
ords 2002 through 2010. Universe: all persons receiving aid in month.
320,000
330,000
340,000
350,000
360,000
370,000
380,000
390,000
400,000
410,000
1,600,000
1,700,000
1,800,000
1,900,000
2,000,000
2,100,000
2,200,000
2,300,000
2,400,000
2,500,000
Jan
-02
Au
g-0
2
Mar
-03
Oct
-03
May
-…
Dec
-04
Jul-
05
Feb
-06
Sep
-06
Ap
r-0
7
No
v-0
7
Jun
-08
Jan
-09
Au
g-0
9
Mar
-10
Oct
-10
Rec
ipie
nts
wit
h H
om
eles
s Fl
ag
Tota
l Pu
blic
Ass
ista
nce
Cas
elo
ad
Monthly Caseload of Persons Aided and Recipients with Homeless Flag in Record (2 axes)
Monthly Public Assistance Caseload
Recipients with Homeless Flag in Monthly Record
Economic Roundtable 13
exiting homelessness each
month, with a nine-year average
of 11,200.
Theoretically, the gap between
people entering homelessness
and people exiting homeless-
ness should represent the
chronically homeless—people
who have a start date but not an
end date. However, others who
have worked with LEADER data
report that homeless flags are
not always promptly removed
from records when the home-
less spells end. This assessment
was supported by our review of
the data.
Another problem that pushes
the data in the opposite direction (toward understating rather than overstating the duration of home-
lessness) is that when a person’s public assistance benefits end, she or he may be still homeless, but this
is no longer recorded.
The very steep increase from 2007 to 2010 in the number of recipients with homeless flags in their rec-
ords that is shown in Figure 2 reflects the financial wreckage suffered by low-income families as a result
of the recession. However, the number of people shown as homeless is not precise because the home-
less flags that provide these data overstate the presence of homelessness when they are not removed in
a timely fashion, and they understate ongoing homelessness among recipients who cycle in and out of
public benefit programs.
This study uses definitions of chronic homelessness similar to that of the federal Department of Housing
and Urban Development (HUD) with emphasis on individuals experiencing repeated episodes of home-
lessness.13
13 HUD defines a chronically homeless person as “either (1) an unaccompanied homeless individual with a disabling condition who has been continuously homeless for a year or more, OR (2) an unaccompanied individual with a dis-abling condition who has had at least four episodes of homelessness in the past three years.” Office of Community Planning and Development, Office of Special Needs Assistance Programs (September 2007), Defining Chronic Homelessness: A Technical Guide for HUD Programs, https://www.hudexchange.info/resources/documents/Defin-ingChronicHomeless.pdf (accessed September 1, 2014). LEADER data can be accurately indexed to identify recipi-ents who match the second definition—four episodes of homelessness in three years. We place greater emphasis on this second, more reliable definition to identify chronically homeless recipients, even though exclusion of the
Figure 3
Source: Los Angeles County Department of Public Social Services, LEADER rec-
ords 2002 through 2010. Universe: all persons with change in homeless status dur-
ing month.
-
2,000
4,000
6,000
8,000
10,000
12,000
14,000
16,000
18,000
20,000
Feb
-02
Au
g-0
2
Feb
-03
Au
g-0
3
Feb
-04
Au
g-0
4
Feb
-05
Au
g-0
5
Feb
-06
Au
g-0
6
Feb
-07
Au
g-0
7
Feb
-08
Au
g-0
8
Feb
-09
Au
g-0
9
Feb
-10
Au
g-1
0
Monthly Entrances Into and Exits Out of Homelessness3-Month Moving Average
New Episodes of Homelessness
Exits from Homelessness
14 Antecedents of Chronic Homelessness
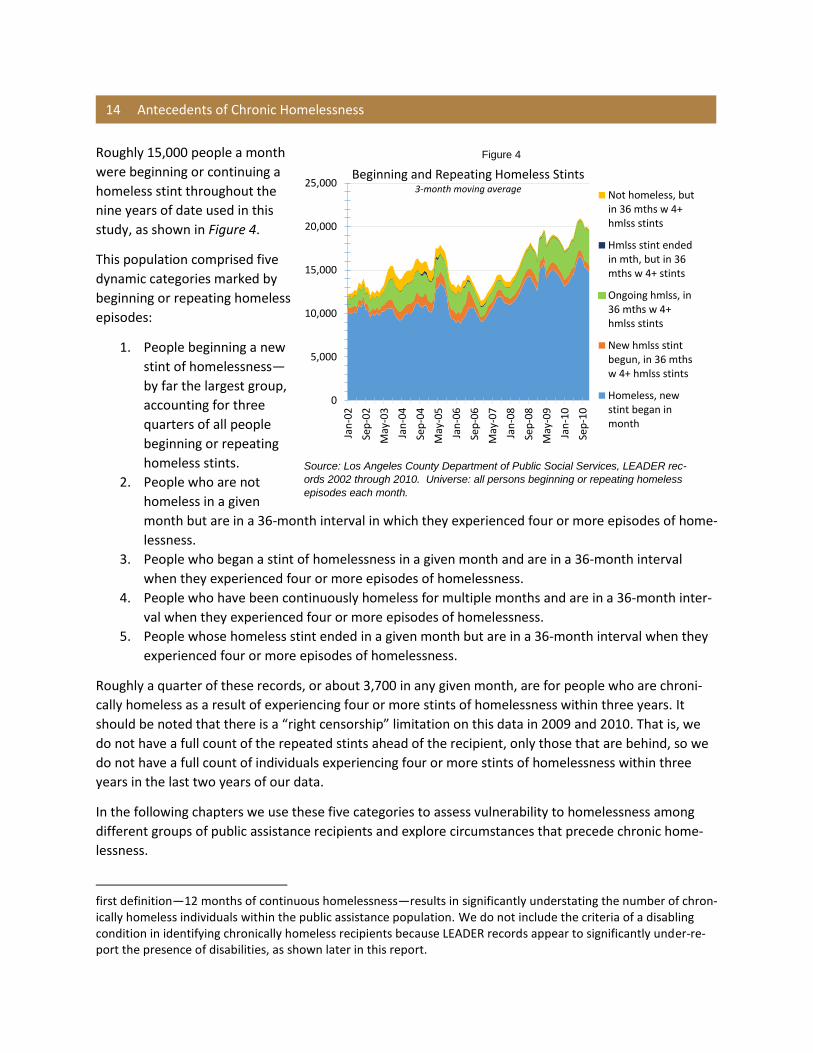
Roughly 15,000 people a month
were beginning or continuing a
homeless stint throughout the
nine years of date used in this
study, as shown in Figure 4.
This population comprised five
dynamic categories marked by
beginning or repeating homeless
episodes:
1. People beginning a new
stint of homelessness—
by far the largest group,
accounting for three
quarters of all people
beginning or repeating
homeless stints.
2. People who are not
homeless in a given
month but are in a 36-month interval in which they experienced four or more episodes of home-
lessness.
3. People who began a stint of homelessness in a given month and are in a 36-month interval
when they experienced four or more episodes of homelessness.
4. People who have been continuously homeless for multiple months and are in a 36-month inter-
val when they experienced four or more episodes of homelessness.
5. People whose homeless stint ended in a given month but are in a 36-month interval when they
experienced four or more episodes of homelessness.
Roughly a quarter of these records, or about 3,700 in any given month, are for people who are chroni-
cally homeless as a result of experiencing four or more stints of homelessness within three years. It
should be noted that there is a “right censorship” limitation on this data in 2009 and 2010. That is, we
do not have a full count of the repeated stints ahead of the recipient, only those that are behind, so we
do not have a full count of individuals experiencing four or more stints of homelessness within three
years in the last two years of our data.
In the following chapters we use these five categories to assess vulnerability to homelessness among
different groups of public assistance recipients and explore circumstances that precede chronic home-
lessness.
first definition—12 months of continuous homelessness—results in significantly understating the number of chron-ically homeless individuals within the public assistance population. We do not include the criteria of a disabling condition in identifying chronically homeless recipients because LEADER records appear to significantly under-re-port the presence of disabilities, as shown later in this report.
Figure 4
Source: Los Angeles County Department of Public Social Services, LEADER rec-
ords 2002 through 2010. Universe: all persons beginning or repeating homeless
episodes each month.
0
5,000
10,000
15,000
20,000
25,000
Jan
-02
Sep
-02
May
-03
Jan
-04
Sep
-04
May
-05
Jan
-06
Sep
-06
May
-07
Jan
-08
Sep
-08
May
-09
Jan
-10
Sep
-10
Beginning and Repeating Homeless Stints3-month moving average
Not homeless, butin 36 mths w 4+hmlss stints
Hmlss stint endedin mth, but in 36mths w 4+ stints
Ongoing hmlss, in36 mths w 4+hmlss stints
New hmlss stintbegun, in 36 mthsw 4+ hmlss stints
Homeless, newstint began inmonth
Economic Roundtable 15
PUBLIC ASSISTANCE PROGRAMS
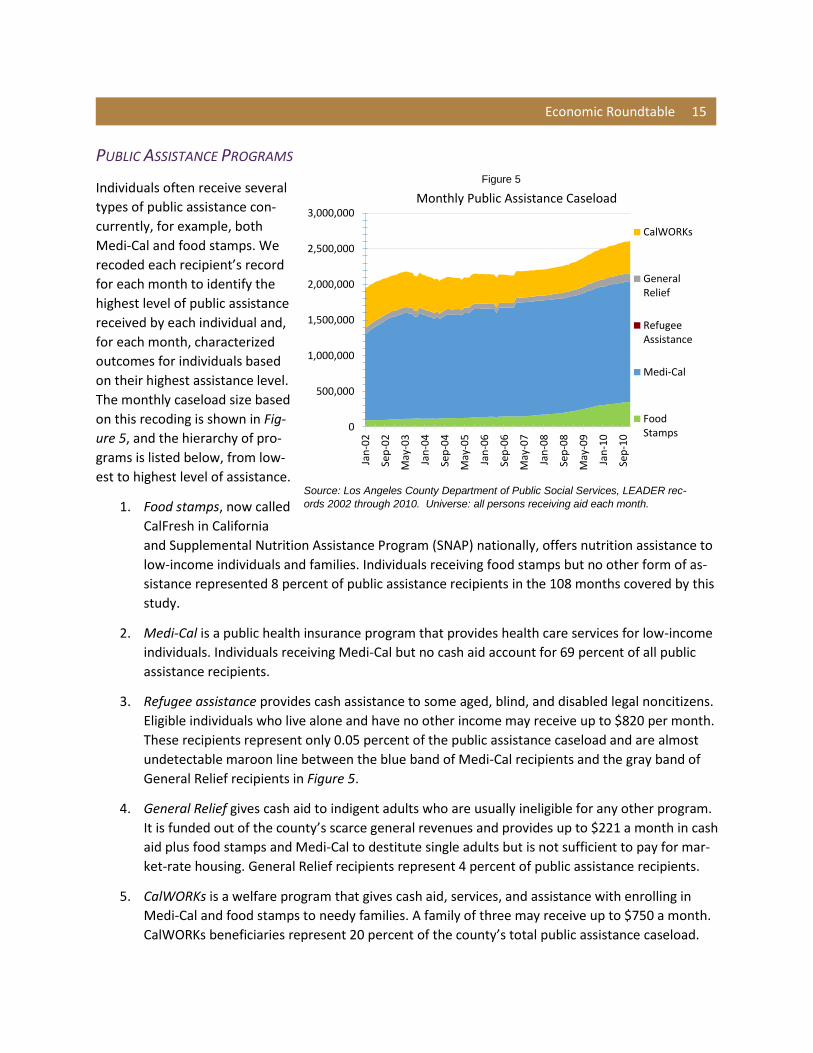
Individuals often receive several
types of public assistance con-
currently, for example, both
Medi-Cal and food stamps. We
recoded each recipient’s record
for each month to identify the
highest level of public assistance
received by each individual and,
for each month, characterized
outcomes for individuals based
on their highest assistance level.
The monthly caseload size based
on this recoding is shown in Fig-
ure 5, and the hierarchy of pro-
grams is listed below, from low-
est to highest level of assistance.
1. Food stamps, now called
CalFresh in California
and Supplemental Nutrition Assistance Program (SNAP) nationally, offers nutrition assistance to
low-income individuals and families. Individuals receiving food stamps but no other form of as-
sistance represented 8 percent of public assistance recipients in the 108 months covered by this
study.
2. Medi-Cal is a public health insurance program that provides health care services for low-income
individuals. Individuals receiving Medi-Cal but no cash aid account for 69 percent of all public
assistance recipients.
3. Refugee assistance provides cash assistance to some aged, blind, and disabled legal noncitizens.
Eligible individuals who live alone and have no other income may receive up to $820 per month.
These recipients represent only 0.05 percent of the public assistance caseload and are almost
undetectable maroon line between the blue band of Medi-Cal recipients and the gray band of
General Relief recipients in Figure 5.
4. General Relief gives cash aid to indigent adults who are usually ineligible for any other program.
It is funded out of the county’s scarce general revenues and provides up to $221 a month in cash
aid plus food stamps and Medi-Cal to destitute single adults but is not sufficient to pay for mar-
ket-rate housing. General Relief recipients represent 4 percent of public assistance recipients.
5. CalWORKs is a welfare program that gives cash aid, services, and assistance with enrolling in
Medi-Cal and food stamps to needy families. A family of three may receive up to $750 a month.
CalWORKs beneficiaries represent 20 percent of the county’s total public assistance caseload.
Figure 5
Source: Los Angeles County Department of Public Social Services, LEADER rec-
ords 2002 through 2010. Universe: all persons receiving aid each month.
0
500,000
1,000,000
1,500,000
2,000,000
2,500,000
3,000,000
Jan
-02
Sep
-02
May
-03
Jan
-04
Sep
-04
May
-05
Jan
-06
Sep
-06
May
-07
Jan
-08
Sep
-08
May
-09
Jan
-10
Sep
-10
Monthly Public Assistance Caseload
CalWORKs
GeneralRelief
RefugeeAssistance
Medi-Cal
FoodStamps
Chapter 3
Paths into Chronic Homelessness
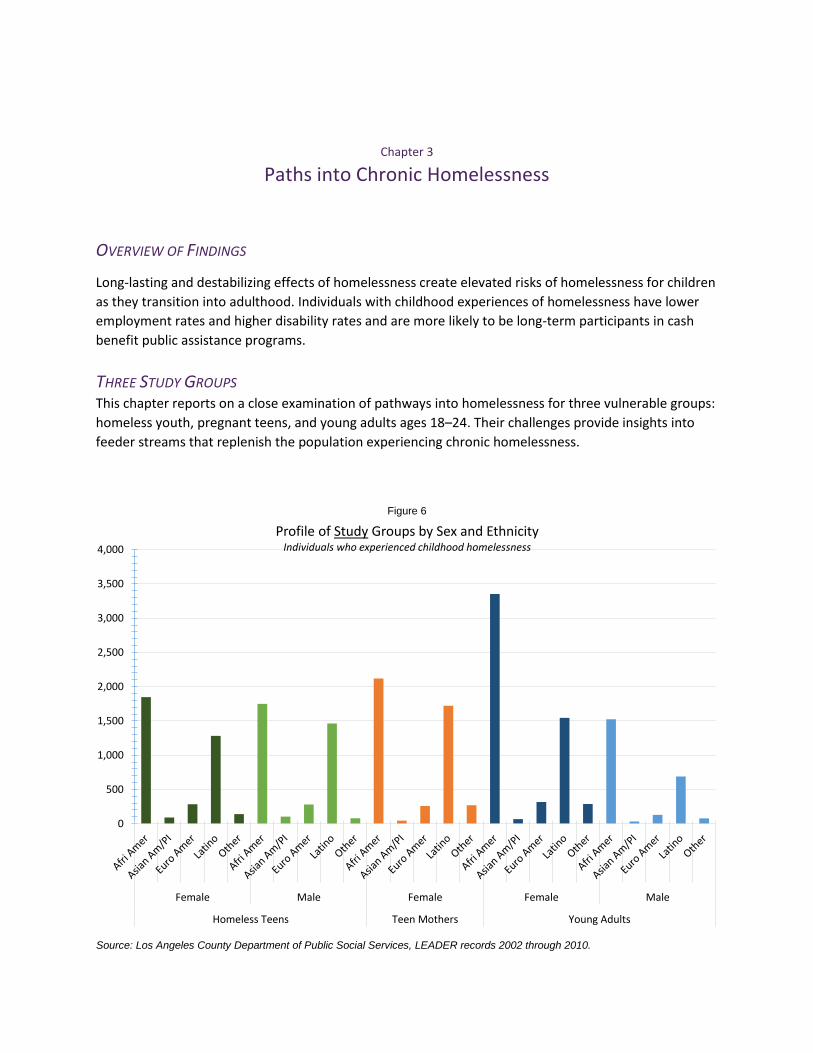
OVERVIEW OF FINDINGS
Long-lasting and destabilizing effects of homelessness create elevated risks of homelessness for children
as they transition into adulthood. Individuals with childhood experiences of homelessness have lower
employment rates and higher disability rates and are more likely to be long-term participants in cash
benefit public assistance programs.
THREE STUDY GROUPS This chapter reports on a close examination of pathways into homelessness for three vulnerable groups:
homeless youth, pregnant teens, and young adults ages 18–24. Their challenges provide insights into
feeder streams that replenish the population experiencing chronic homelessness.
Figure 6
Source: Los Angeles County Department of Public Social Services, LEADER records 2002 through 2010.
0
500
1,000
1,500
2,000
2,500
3,000
3,500
4,000
Female Male Female Female Male
Homeless Teens Teen Mothers Young Adults
Profile of Study Groups by Sex and EthnicityIndividuals who experienced childhood homelessness
Economic Roundtable 17
Outcomes for three vulnerable groups making the transition from childhood to adulthood over the nine-
year time window in our data set are studied to provide snapshots of pathways into chronic homeless-
ness among public assistance recipients entering adulthood. Gender and ethnic characteristics of the
three groups are shown in Figure 6. The study groups have the following characteristics:
1. Homeless teenagers who were 18 years of age in 2004 to 2006. Their average age was 15 years
at the beginning our data window in 2002 and 23 years at the end of the window in 2010. All
remained single throughout the data window. All had experienced continuous or cyclical home-
lessness by 2006. The 7,325 youth in this study group were CalWORKs recipients for 18 or more
months from 2002 to 2006, and during that time experienced 12 or more months of homeless-
ness and/or one or more 36-month interval in which they had four or more stints of homeless-
ness. Teen mothers in the second group were excluded from this group. In summary, these were
high-risk youth who had experienced extensive homelessness and extended welfare depend-
ency.
2. Teen mothers who had one or more pregnancies when they were 19 years of age or younger
during 2002–2006. Their average age was 16 years at the beginning our data window in 2002
and 24 years at the end of the window in 2010. All remained single throughout the data win-
dow. All 4,432 of these young women had received CalWORKs benefits for seven or more
months from 2002 to 2006. All had experienced homelessness at some point from 2002 to 2006.
Public assistance records show this group to have been flagged as homeless an average of 27
months during the five years from 2002 through 2006. For most this included homeless experi-
ences before their eighteenth birthday. In summary, these were high-risk teen mothers who did
not have the support of a spouse and had a history of homelessness.
3. Young adults who were 18–24 years of age in 2004. Their average age was 19 years at the begin-
ning our data window in 2002 and 27 years at the end of the window in 2010. All remained sin-
gle throughout the data window. The 8,022 individuals in this group had received cash aid (Gen-
eral Relief or possibly CalWORKs) for 12 or more months and been homeless for 8 or more
months from 2002 through 2004. None had an identified disability, and none had any earned
income during the three years from 2002 to 2004. In summary, these were young adults who
had experienced homelessness and were not making headway in their lives but did not have a
documented barrier to self-sufficiency.
The three study groups include a total of 19,764 individuals. Sixty-nine percent are women, 54 percent
African American, 34 percent Latino, 6 percent European American, 2 percent Asian American/Pacific
Islander, and 4 percent other ethnicities.
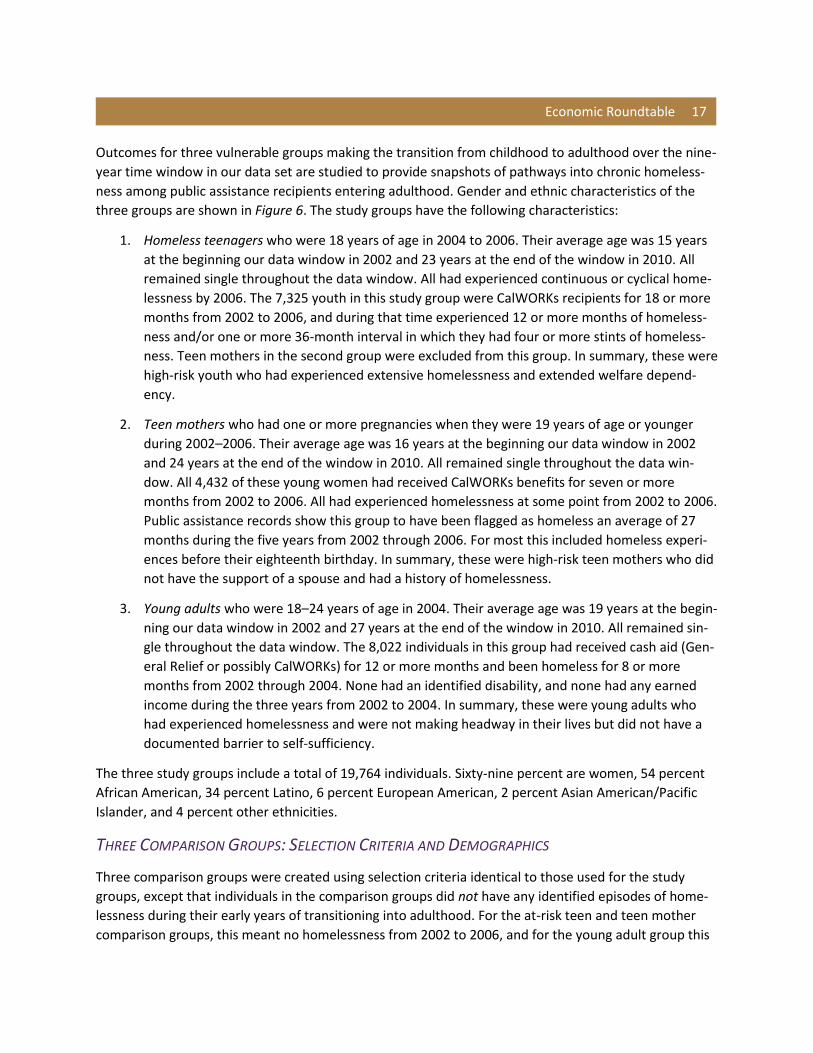
THREE COMPARISON GROUPS: SELECTION CRITERIA AND DEMOGRAPHICS
Three comparison groups were created using selection criteria identical to those used for the study
groups, except that individuals in the comparison groups did not have any identified episodes of home-
lessness during their early years of transitioning into adulthood. For the at-risk teen and teen mother
comparison groups, this meant no homelessness from 2002 to 2006, and for the young adult group this
18 Antecedents of Chronic Homelessness
meant no homelessness from 2002 to 2004. Gender and ethnic characteristics of the comparison groups
are shown in Figure 7.
The three comparison groups include a total of 74,197 individuals. Fifty-nine percent are women, 23
percent African American, 53 percent Latino, 11 percent European American, 10 percent Asian Ameri-
can/Pacific Islander, and 2 percent other ethnicities.
The most striking difference between the study groups that experienced childhood homelessness and
the comparison groups that did not is that African Americans are vastly over-represented among individ-
uals with experiences of childhood homelessness. African Americans make up 54 percent of the study
groups but only 23 percent of the comparison groups—129 percent overrepresentation.
A second noteworthy difference is that women make up 17 percent more of the study groups than of
the comparison groups—they are over-represented in the at-risk groups that experienced childhood
homelessness. The single highest point of over-representation is among African American female young
adults 18–24, who experienced homelessness as they were transitioning into adulthood. The share of
African Americans within the female young adult study group is 173 percent larger than their share of
the comparison group that did not experience homelessness.
Figure 7
Source: Los Angeles County Department of Public Social Services, LEADER records 2002 through 2010.
0
2,000
4,000
6,000
8,000
10,000
12,000
Female Male Female Female Male
At-Risk Teens Teen Mothers Young Adults
Profile of Comparison Groups by Sex and EthnicityIdentical to study groups except they they did not experience childhood homelessness
Economic Roundtable 19
The long-lasting and destabilizing effects of homelessness on young women of all ethnicities may create
elevated risks of homelessness for their children as they start their own families.
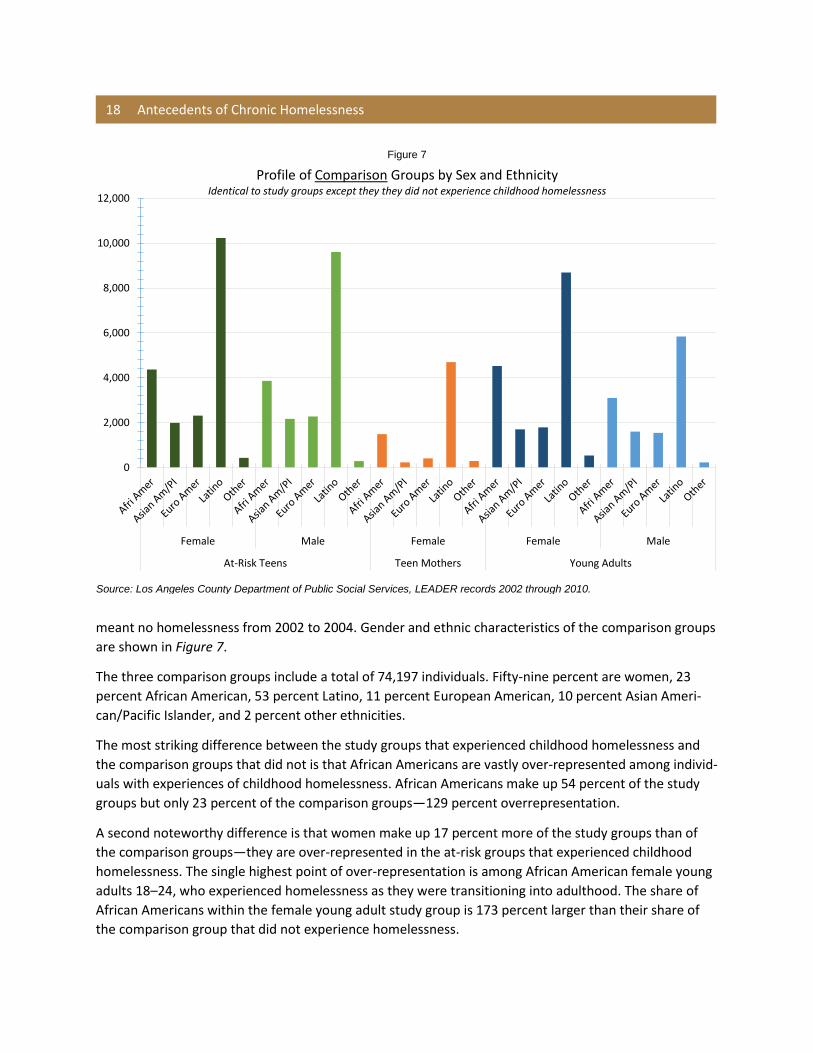
PUBLIC ASSISTANCE BENEFITS
Use of public assistance programs by the study groups from 2002 through 2010, broken out by sex, is
shown in Figure 8, and corresponding information for the comparison groups is shown in Figure 9. Many
recipients received multiple benefits but are shown only at the highest level of benefit they received,
with CalWORKs being the highest, followed by General Relief, Medi-Cal, and food stamps.
The predominant pattern for both the study and comparison groups is that at the beginning of our nine-
year time window in 2002, the individuals were children receiving CalWORKs benefits. This can be seen
in Figures 8 and 9. By 2005 or 2006, all had reached their eighteenth birthday and aged out of CalWORKs
as children, with some continuing in CalWORKs as young parents, General Relief as destitute young
adults, or Medi-Cal and food stamps as noncash beneficiaries or leaving all public assistance programs.
Figure 8
Source: Los Angeles County Department of Public Social Services, LEADER records 2002 through 2010.
0%
10%
20%
30%
40%
50%
60%
70%
80%
90%
100%
02 04 06 08 10 02 04 06 08 10 02 04 06 08 10 02 04 06 08 10 02 04 06 08 10
Female HomelessTeens
Male HomelessTeens
Teen Mothers Young AdultFemales
Young Adult Males
Public Assistance Received by Study Groups During the Year, 2002-2010
CalWORKs General Relief Medi-Cal Food Stamps No Benefits
20 Antecedents of Chronic Homelessness
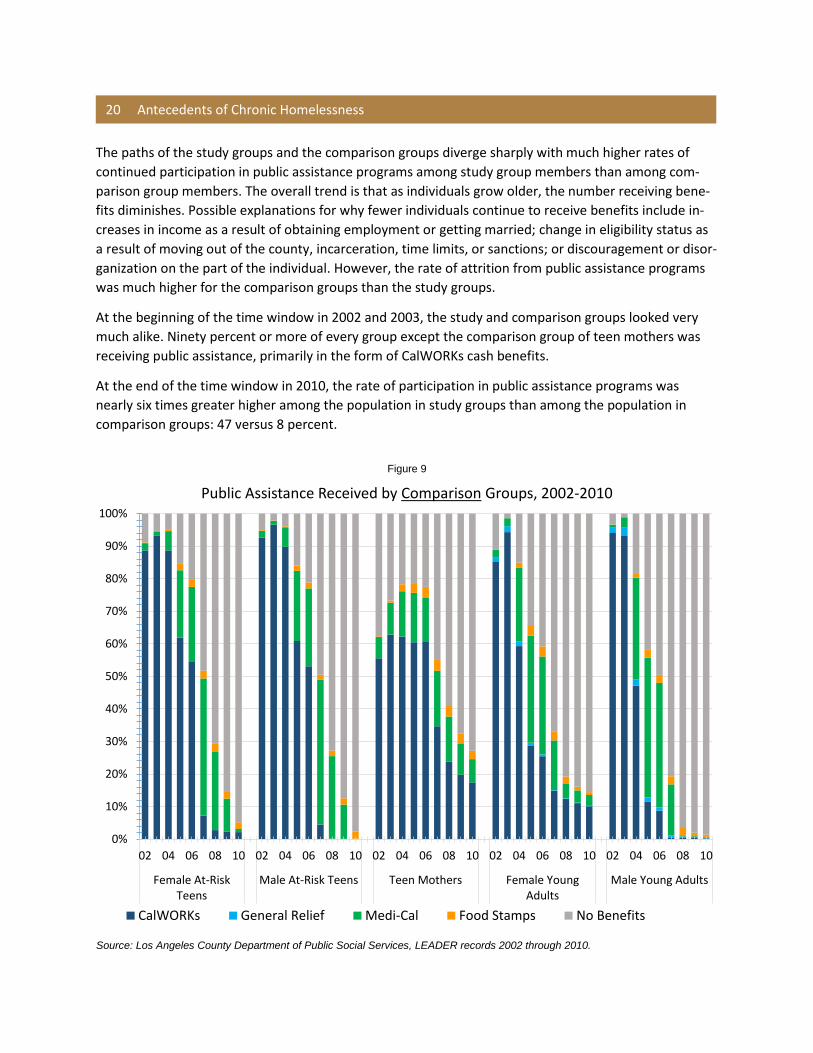
The paths of the study groups and the comparison groups diverge sharply with much higher rates of
continued participation in public assistance programs among study group members than among com-
parison group members. The overall trend is that as individuals grow older, the number receiving bene-
fits diminishes. Possible explanations for why fewer individuals continue to receive benefits include in-
creases in income as a result of obtaining employment or getting married; change in eligibility status as
a result of moving out of the county, incarceration, time limits, or sanctions; or discouragement or disor-
ganization on the part of the individual. However, the rate of attrition from public assistance programs
was much higher for the comparison groups than the study groups.
At the beginning of the time window in 2002 and 2003, the study and comparison groups looked very
much alike. Ninety percent or more of every group except the comparison group of teen mothers was
receiving public assistance, primarily in the form of CalWORKs cash benefits.
At the end of the time window in 2010, the rate of participation in public assistance programs was
nearly six times greater higher among the population in study groups than among the population in
comparison groups: 47 versus 8 percent.
Figure 9
Source: Los Angeles County Department of Public Social Services, LEADER records 2002 through 2010.
0%
10%
20%
30%
40%
50%
60%
70%
80%
90%
100%
02 04 06 08 10 02 04 06 08 10 02 04 06 08 10 02 04 06 08 10 02 04 06 08 10
Female At-RiskTeens
Male At-Risk Teens Teen Mothers Female YoungAdults
Male Young Adults
Public Assistance Received by Comparison Groups, 2002-2010
CalWORKs General Relief Medi-Cal Food Stamps No Benefits
Economic Roundtable 21
The most visible difference between women in the study groups and those in the comparison groups is
that by 2010, 38 percent of those in the study groups continued to receive CalWORKs benefits whereas
only 8 percent of those in the comparison groups still received CalWORKs—a rate nearly five times
greater for the study groups. Fifty-three percent of young women in the teen mothers study group con-
tinued to receive CalWORKs in 2010 versus 17 percent of those in the teen mothers’ comparison
group—a rate three times greater for the study group.
A second difference among women that was smaller in scale but even more extreme was receipt of Gen-
eral Relief benefits. In 2010, 8 percent of study group women received General Relief compared to 0.06
percent of comparison group women—a rate 130 times greater.
Similar rates of both study and comparison group females received just Medi-Cal and/or food stamps in
2010: 7 percent of those in the study groups versus 5 percent of those in the comparison groups.
In 2010, 53 percent of study group women were receiving some form of public assistance versus only 13
percent of comparison group women.
The most visible difference among men is that 25 percent of those in the study groups were receiving
General Relief benefits in 2010 compared to 0.1 percent of those in the comparison groups—a rate
more than 200 times greater for the study groups. In Figure 8 the blue shading that represents General
Relief benefits is prominent; in Figure 9, it is difficult to detect.
In 2010, 35 percent of study group men were receiving some type of public assistance versus only 2 per-
cent of men in the comparison groups.
A second difference is that men are less likely to receive benefits than are women. The gap was 18 per-
centage points in the study groups and 11 percentage points in the comparison groups. This may well
indicate a weaker social safety net for single adult males rather than greater success in the labor market.
Extended participation in cash benefit public assistance programs is more frequent among recipients
with childhood experiences of homelessness. Participation in General Relief is particularly prominent
among young adult men who have experienced homelessness.
EARNED INCOME
We have information about the study and comparison groups in months when they received public as-
sistance that includes whether they had earned income and whether they were identified as being disa-
bled or homeless. This information is incomplete in that we have it only for people receiving public assis-
tance and only in months when they received public assistance, which are months when they needed
help. It is a record of people’s difficult times.
Even though we do not have a full picture of our study population in any given month, we can use this
partial information to assess comparative outcomes for the study and comparison groups and identify
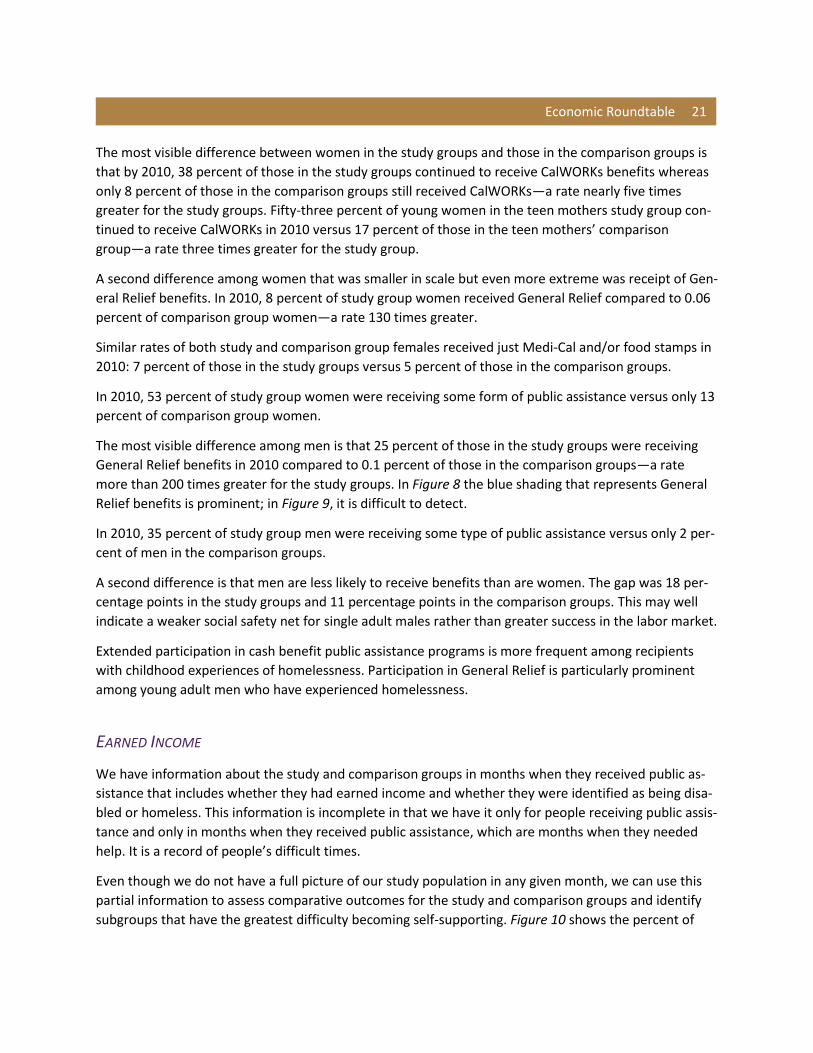
subgroups that have the greatest difficulty becoming self-supporting. Figure 10 shows the percent of
22 Antecedents of Chronic Homelessness
each group, broken out by sex, that had any earned income in years when they received public assis-
tance. For all of the groups, the monthly employment rate, which is not shown, was only about half as
high as the annual employment rate shown in Figure 9. This indicates that recipients who are part of the
labor force have difficulty maintaining continuous employment.
Two things stand out in Figure 10. First, the comparison group employment rates are strikingly higher
than the study group rates. Second, among the study groups, women’s employment rate is strikingly
higher than men’s rate. Breaking out the study and comparison groups by gender, the employment rates
in 2010 were:
Study group women: 30 percent
Study group men: 14 percent
Comparison group women: 44 percent
Comparison group men: 31 percent
Figure 10
Source: Los Angeles County Department of Public Social Services, LEADER records 2002 through 2010.
0%
5%
10%
15%
20%
25%
30%
35%
40%
45%
50%
02 04 06 08 10 02 04 06 08 10 02 04 06 08 10 02 04 06 08 10 02 04 06 08 10
Homeless/At-RiskFemale Teens
Homeless/At-RiskMale Teens
Teen Mothers Female Young Adults Male Young Adults
Percent of Study and Comparison Groups with any Earned Income in Years when They Received Public Assistance, 2002-2010
Study Groups Comparison Groups
Economic Roundtable 23
Experiences of homelessness while transitioning from childhood to adulthood are associated with re-
duced employment rates for both women and men.
Men in both the study and comparison groups had employment rates that were much lower than those
of similar women, with the gap being much greater—over half for men in the study groups. Men with
experiences of homelessness in their backgrounds and long-term connections to public assistance have
much poorer labor market outcomes than do women with similar backgrounds
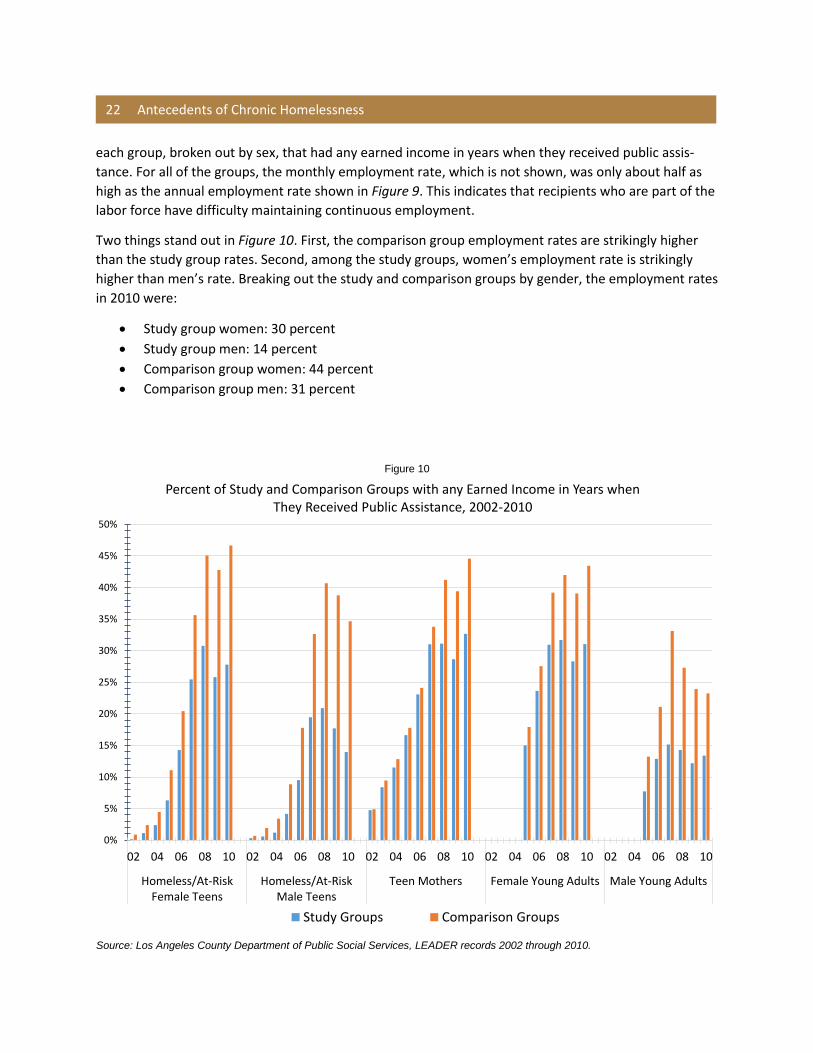
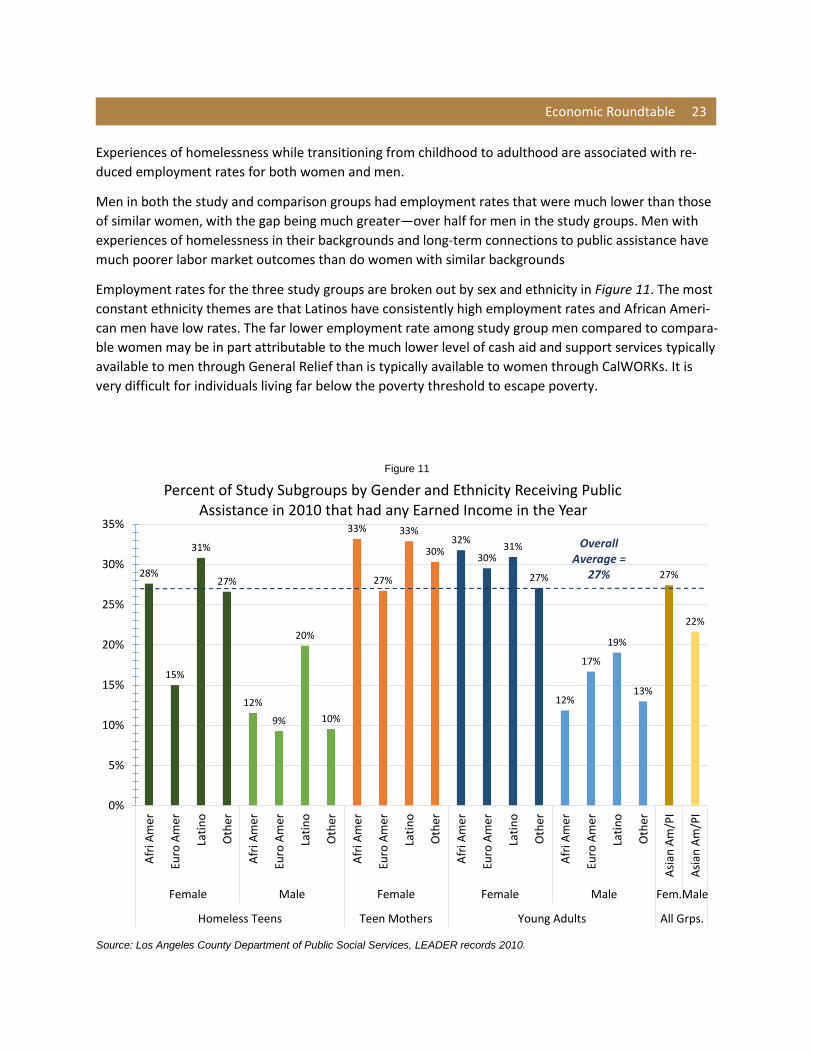
Employment rates for the three study groups are broken out by sex and ethnicity in Figure 11. The most
constant ethnicity themes are that Latinos have consistently high employment rates and African Ameri-
can men have low rates. The far lower employment rate among study group men compared to compara-
ble women may be in part attributable to the much lower level of cash aid and support services typically
available to men through General Relief than is typically available to women through CalWORKs. It is
very difficult for individuals living far below the poverty threshold to escape poverty.
Figure 11
Source: Los Angeles County Department of Public Social Services, LEADER records 2010.
28%
15%
31%
27%
12%
9%
20%
10%
33%
27%
33%
30%32%
30%31%
27%
12%
17%
19%
13%
27%
22%
0%
5%
10%
15%
20%
25%
30%
35%
Afr
i Am
er
Euro
Am
er
Lati
no
Oth
er
Afr
i Am
er
Euro
Am
er
Lati
no
Oth
er
Afr
i Am
er
Euro
Am
er
Lati
no
Oth
er
Afr
i Am
er
Euro
Am
er
Lati
no
Oth
er
Afr
i Am
er
Euro
Am
er
Lati
no
Oth
er
Asi
an A
m/P
I
Asi
an A
m/P
I
Female Male Female Female Male Fem.Male
Homeless Teens Teen Mothers Young Adults All Grps.
Percent of Study Subgroups by Gender and Ethnicity Receiving Public Assistance in 2010 that had any Earned Income in the Year
Overall Average =
27%
24 Antecedents of Chronic Homelessness
Teen mothers had the highest employment rate of any group. This is an encouraging outcome given the
daunting challenges a teen mother faces in taking on the full responsibilities of parenthood by herself.
The comparative success achieved by these young mothers may be attributable the financial incentives
for educational achievement as well as the transportation, child care, and case management support
they receive through the Cal-Learn program. Higher levels of financial assistance and support services
for high-need individuals are associated with higher levels of employment.
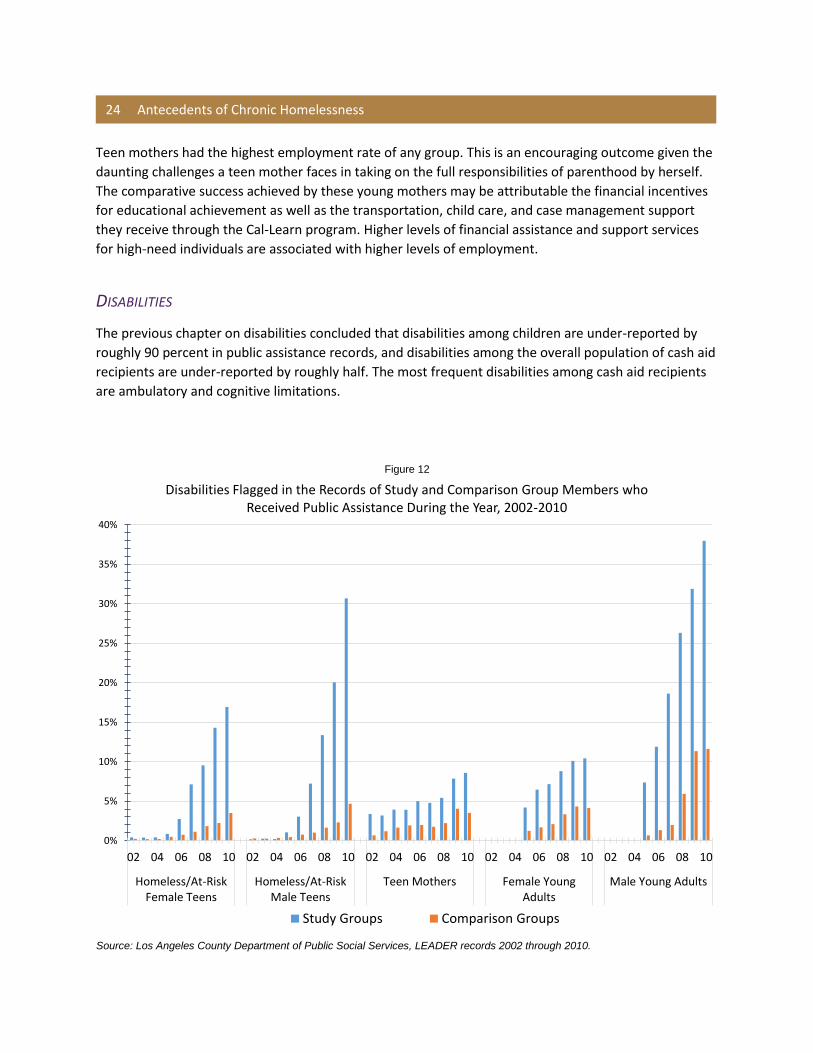
DISABILITIES
The previous chapter on disabilities concluded that disabilities among children are under-reported by
roughly 90 percent in public assistance records, and disabilities among the overall population of cash aid
recipients are under-reported by roughly half. The most frequent disabilities among cash aid recipients
are ambulatory and cognitive limitations.
Figure 12
Source: Los Angeles County Department of Public Social Services, LEADER records 2002 through 2010.
0%
5%
10%
15%
20%
25%
30%
35%
40%
02 04 06 08 10 02 04 06 08 10 02 04 06 08 10 02 04 06 08 10 02 04 06 08 10
Homeless/At-RiskFemale Teens
Homeless/At-RiskMale Teens
Teen Mothers Female YoungAdults
Male Young Adults
Disabilities Flagged in the Records of Study and Comparison Group Members who Received Public Assistance During the Year, 2002-2010
Study Groups Comparison Groups
Economic Roundtable 25
We were able to chart the year-by-year emergence of disability flags in the public assistance records of
study group members. Based on earlier findings, it is likely that these flags under-report the actual prev-
alence of disabilities, nevertheless, the results shown in Figure 12 are informative.
Disabilities become increasingly prominent over time among both comparison and study groups. How-
ever, the disability rate among study group members is more than double that of the comparison
groups. Experiences of homelessness while transitioning from childhood to adulthood are associated
with elevated disability rates in adulthood.
Individuals who had experienced chronic homelessness as children—the homeless teen study group—
had disability rates in 2010 that were five times higher for women than their comparison group counter-
parts and seven times higher for men. Experiences of chronic homelessness in childhood are associated
with highly elevated rates of disabilities in adulthood.
The study group of teen mothers had the lowest disability rate of any study group: 9 percent in 2010.
Higher levels of financial assistance and support services for high-need individuals are associated with
lower levels of disabilities.
The study group of young adults was chosen to create a group that was likely to have problems that had
not yet been formally identified. These individuals had experiences of homelessness as they were transi-
tioning into adulthood and they had not found jobs, but no disabilities had been identified during the
first three years they were transitioning out of CalWORKs as children and into adulthood. For most men
in this study group who remained public assistance recipients, the transition into adulthood entailed
shifting to the much lower level of benefits provided by General Relief. By 2010, 38 percent of the men
in this study group had been identified as having disabilities. The combination of unaddressed problems
and low levels of assistance appears to be associated with proliferation of disabilities.
There was less difference in sex disability rates in the comparison groups than in the study groups. The
disability rate for men in the comparison groups was less than twice as high as the rate for women (7
percent versus 4 percent), whereas the rate for men in the study groups was three times higher than the
rate for women (34 percent versus 11 percent). Low levels of support for individuals with persistent and
unaddressed problems are associated with increases in disabilities.
PROBLEMS
Domestic violence, mental health, and substance abuse problems can be flagged in a recipient’s record
if an individual declares that they have this need or if the case worker identifies this as an urgent need
for assistance. These problems are vastly under-reported in public assistance records—only 0.4 percent
of the nearly 9 million recipients studied had one of these problems flagged—but they are an indicator
of where problems are more likely versus less likely to be recognized within the public assistance popu-
lation. The majority of those flagged were CalWORKs recipients (58 percent of the flags were in the rec-
ords of CalWORKs recipients, 8 percent in General Relief records, 27 percent in Medi-Cal records, and 7
percent in food stamp-only records).
26 Antecedents of Chronic Homelessness
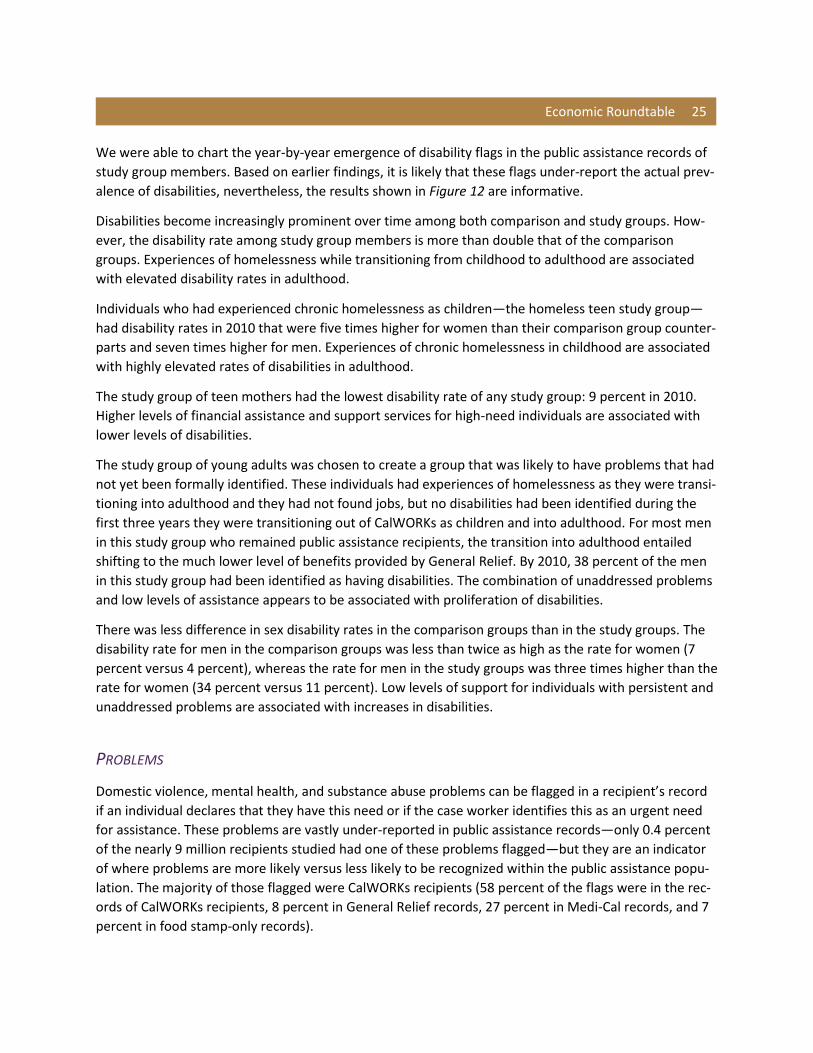
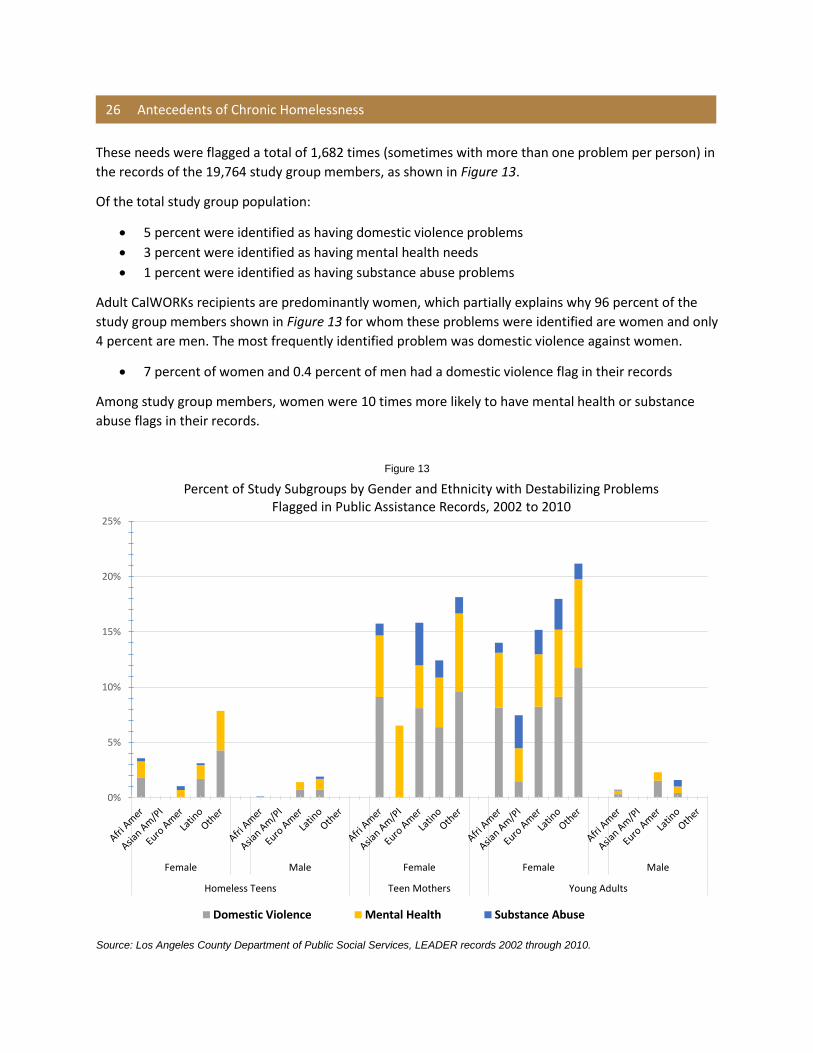
These needs were flagged a total of 1,682 times (sometimes with more than one problem per person) in
the records of the 19,764 study group members, as shown in Figure 13.
Of the total study group population:
5 percent were identified as having domestic violence problems
3 percent were identified as having mental health needs
1 percent were identified as having substance abuse problems
Adult CalWORKs recipients are predominantly women, which partially explains why 96 percent of the
study group members shown in Figure 13 for whom these problems were identified are women and only
4 percent are men. The most frequently identified problem was domestic violence against women.
7 percent of women and 0.4 percent of men had a domestic violence flag in their records
Among study group members, women were 10 times more likely to have mental health or substance
abuse flags in their records.
Figure 13
Source: Los Angeles County Department of Public Social Services, LEADER records 2002 through 2010.
0%
5%
10%
15%
20%
25%
Female Male Female Female Male
Homeless Teens Teen Mothers Young Adults
Percent of Study Subgroups by Gender and Ethnicity with Destabilizing Problems Flagged in Public Assistance Records, 2002 to 2010
Domestic Violence Mental Health Substance Abuse
Economic Roundtable 27
4 percent of women and 0.4 percent of men had a mental health flag in their records
1 percent of women and 0.1 percent of men had a substance abuse flag in their records
Within the study groups, the lowest employment rates and highest disability rates are found among
men receiving General Relief, however, the fact that men are only one-tenth as likely to have a mental
health or substance abuse problem identified indicates that screening and services for mental health
and substance abuse needs are far less available to men. Mental health and substance abuse screening
and services are scarce for the population of single adult males with extended dependence on public as-
sistance that is at highest risk of chronic homelessness.
HOMELESSNESS
The most reliable indicator of homelessness in the public assistance records that were analyzed is the
appearance of a new homeless flag after the flag has been missing for a month or more. This leaves out
information about all of the recipients who have been continuously homeless, but it also filters out rec-
ords in which the homeless flag has not been removed even though a homeless stint has ended.
The share of individuals in each study group, broken out by sex, who were receiving some type of public
assistance and who experienced one or more new episodes of homelessness each year is shown in Fig-
ure 14. The following profiles emerge.
Female homeless teens: The annual percentage experiencing new episodes of homelessness
peaked at 37 percent in 2006 when the average age of these young women was 19 years, and
plateaued at about 24 percent from 2008 onward, after their average age was 21 years.
Male homeless teens: The annual percentage of new episodes of homelessness continued to
climb throughout the data window, reaching 47 percent in 2010 when the average age of these
young men was 23 years.
Teen mothers: The annual percentage of new episodes of homelessness peaked at 46 percent in
2006 when the average age of these young women was 20 years, and dropped below 20 percent
after 2007, decreasing to 14 percent in 2010, when their average age was 24 years.
Female young adults: The annual percentage of new episodes of homelessness was highest at
the beginning of the data window in 2002—47 percent—when the average age of this group
was 19 years. The annual rate of new homeless stints decreased to 18 percent in 2010 when the
average age was 27 years.
Male young adults: The annual percentage of new episodes of homelessness began high (53
percent) and ended high (48 percent). The lowest rate of identified new episodes was in 2004,
when their average age was 21 years, and the share receiving CalWORKs dropped and the share
receiving General Relief increased (see Figure 8). The drop in reported new stints may have been
the result of transitioning out of their old households that had been flagged as homeless and
into their own new single households, as well as into a new benefit program and not yet being
identified as someone experiencing homelessness. This group had the highest rate of new
homeless episodes, ranging around 50 percent in most years.
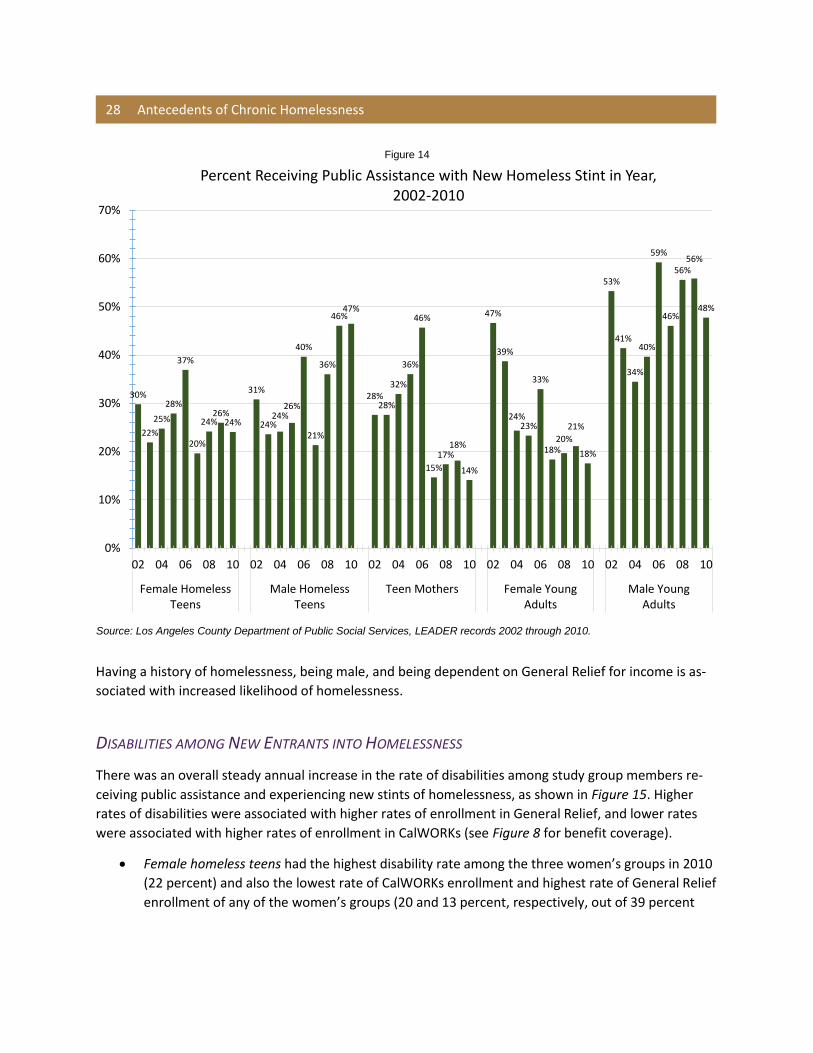
28 Antecedents of Chronic Homelessness
Having a history of homelessness, being male, and being dependent on General Relief for income is as-
sociated with increased likelihood of homelessness.
DISABILITIES AMONG NEW ENTRANTS INTO HOMELESSNESS
There was an overall steady annual increase in the rate of disabilities among study group members re-
ceiving public assistance and experiencing new stints of homelessness, as shown in Figure 15. Higher
rates of disabilities were associated with higher rates of enrollment in General Relief, and lower rates
were associated with higher rates of enrollment in CalWORKs (see Figure 8 for benefit coverage).
Female homeless teens had the highest disability rate among the three women’s groups in 2010
(22 percent) and also the lowest rate of CalWORKs enrollment and highest rate of General Relief
enrollment of any of the women’s groups (20 and 13 percent, respectively, out of 39 percent
Figure 14
Source: Los Angeles County Department of Public Social Services, LEADER records 2002 through 2010.
30%
22%
25%
28%
37%
20%
24%26%
24%
31%
24%24%
26%
40%
21%
36%
46%47%
28%28%
32%
36%
46%
15%
17%18%
14%
47%
39%
24%23%
33%
18%20%
21%
18%
53%
41%
34%
40%
59%
46%
56%56%
48%
0%
10%
20%
30%
40%
50%
60%
70%
02 04 06 08 10 02 04 06 08 10 02 04 06 08 10 02 04 06 08 10 02 04 06 08 10
Female HomelessTeens
Male HomelessTeens
Teen Mothers Female YoungAdults
Male YoungAdults
Percent Receiving Public Assistance with New Homeless Stint in Year, 2002-2010
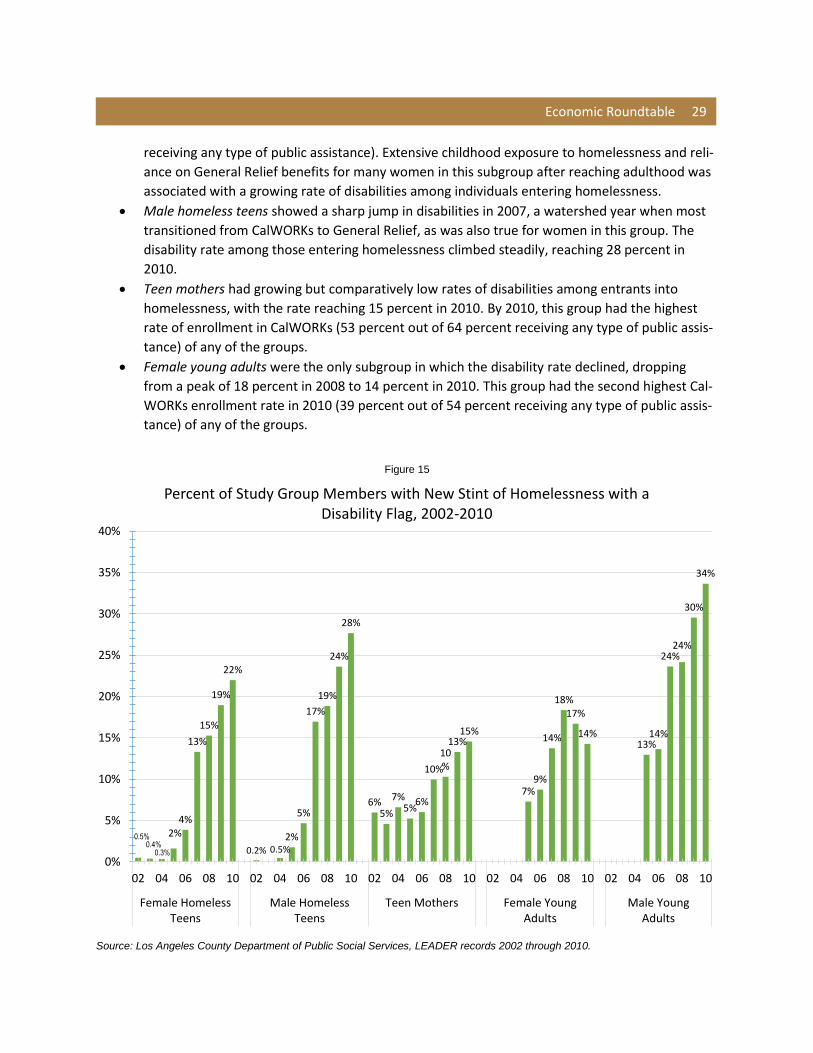
Economic Roundtable 29
receiving any type of public assistance). Extensive childhood exposure to homelessness and reli-
ance on General Relief benefits for many women in this subgroup after reaching adulthood was
associated with a growing rate of disabilities among individuals entering homelessness.
Male homeless teens showed a sharp jump in disabilities in 2007, a watershed year when most
transitioned from CalWORKs to General Relief, as was also true for women in this group. The
disability rate among those entering homelessness climbed steadily, reaching 28 percent in
2010.
Teen mothers had growing but comparatively low rates of disabilities among entrants into
homelessness, with the rate reaching 15 percent in 2010. By 2010, this group had the highest
rate of enrollment in CalWORKs (53 percent out of 64 percent receiving any type of public assis-
tance) of any of the groups.
Female young adults were the only subgroup in which the disability rate declined, dropping
from a peak of 18 percent in 2008 to 14 percent in 2010. This group had the second highest Cal-
WORKs enrollment rate in 2010 (39 percent out of 54 percent receiving any type of public assis-
tance) of any of the groups.
Figure 15
Source: Los Angeles County Department of Public Social Services, LEADER records 2002 through 2010.
0.5%0.4%
0.3%
2%4%
13%
15%
19%
22%
0.2% 0.5%2%
5%
17%
19%
24%
28%
6%5%
7%5%
6%
10%
10%
13%15%
7%9%
14%
18%17%
14%13%
14%
24%24%
30%
34%
0%
5%
10%
15%
20%
25%
30%
35%
40%
02 04 06 08 10 02 04 06 08 10 02 04 06 08 10 02 04 06 08 10 02 04 06 08 10
Female HomelessTeens
Male HomelessTeens
Teen Mothers Female YoungAdults
Male YoungAdults
Percent of Study Group Members with New Stint of Homelessness with a Disability Flag, 2002-2010
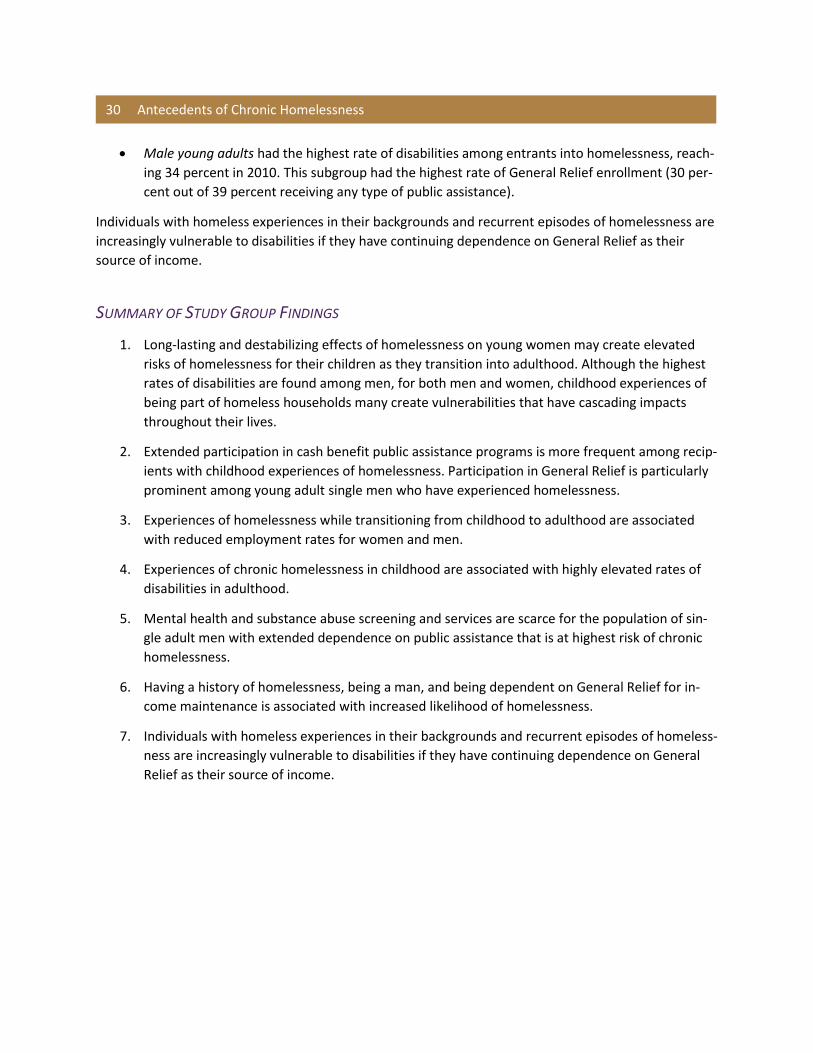
30 Antecedents of Chronic Homelessness
Male young adults had the highest rate of disabilities among entrants into homelessness, reach-
ing 34 percent in 2010. This subgroup had the highest rate of General Relief enrollment (30 per-
cent out of 39 percent receiving any type of public assistance).
Individuals with homeless experiences in their backgrounds and recurrent episodes of homelessness are
increasingly vulnerable to disabilities if they have continuing dependence on General Relief as their
source of income.
SUMMARY OF STUDY GROUP FINDINGS
1. Long-lasting and destabilizing effects of homelessness on young women may create elevated
risks of homelessness for their children as they transition into adulthood. Although the highest
rates of disabilities are found among men, for both men and women, childhood experiences of
being part of homeless households many create vulnerabilities that have cascading impacts
throughout their lives.
2. Extended participation in cash benefit public assistance programs is more frequent among recip-
ients with childhood experiences of homelessness. Participation in General Relief is particularly
prominent among young adult single men who have experienced homelessness.
3. Experiences of homelessness while transitioning from childhood to adulthood are associated
with reduced employment rates for women and men.
4. Experiences of chronic homelessness in childhood are associated with highly elevated rates of
disabilities in adulthood.
5. Mental health and substance abuse screening and services are scarce for the population of sin-
gle adult men with extended dependence on public assistance that is at highest risk of chronic
homelessness.
6. Having a history of homelessness, being a man, and being dependent on General Relief for in-
come maintenance is associated with increased likelihood of homelessness.
7. Individuals with homeless experiences in their backgrounds and recurrent episodes of homeless-
ness are increasingly vulnerable to disabilities if they have continuing dependence on General
Relief as their source of income.
Chapter 4
Homelessness within Public Assistance Programs
OVERVIEW OF FINDINGS
Highly vulnerable groups include children, African Americans, and youth ages 16–24, all of whom are
disproportionally represented among the homeless. General Relief recipients who experience homeless-
ness are four times more likely to be long-term recipients that those who do not experience homeless-
ness.
Figure 16
Source: Los Angeles County Department of Public Social Services, LEADER records 2002 through 2010. Universe: all persons in
one of the four public assistance programs shown. Individuals are grouped by the highest level of assistance they received, starting
with those receiving just Food Stamps (FS). Next, those receiving Medi-Cal (MC), but no cash aid; some of whom also received
Food Stamps. Next, those receiving cash aid through General Relief, many of whom also received Medi-Cal and Food Stamps.
The highest level of benefits went to CalWORKs (CW) recipients, many of whom also received Medi-Cal and Food Stamps.
0
25,000
50,000
75,000
100,000
125,000
150,000
175,000
200,000
225,000
250,000
275,000
300,000
Jan
-02
Jun
-02
No
v-0
2
Ap
r-0
3
Sep
-03
Feb
-04
Jul-
04
Dec
-04
May
-05
Oct
-05
Mar
-06
Au
g-0
6
Jan
-07
Jun
-07
No
v-0
7
Ap
r-0
8
Sep
-08
Feb
-09
Jul-
09
Dec
-09
May
-10
Oct
-10
Homeless Public Assistance Recipients by Program
CalWORKs,homeless
General Relief,homeless
Medi-Cal,homeless
Food Stamps,homeless
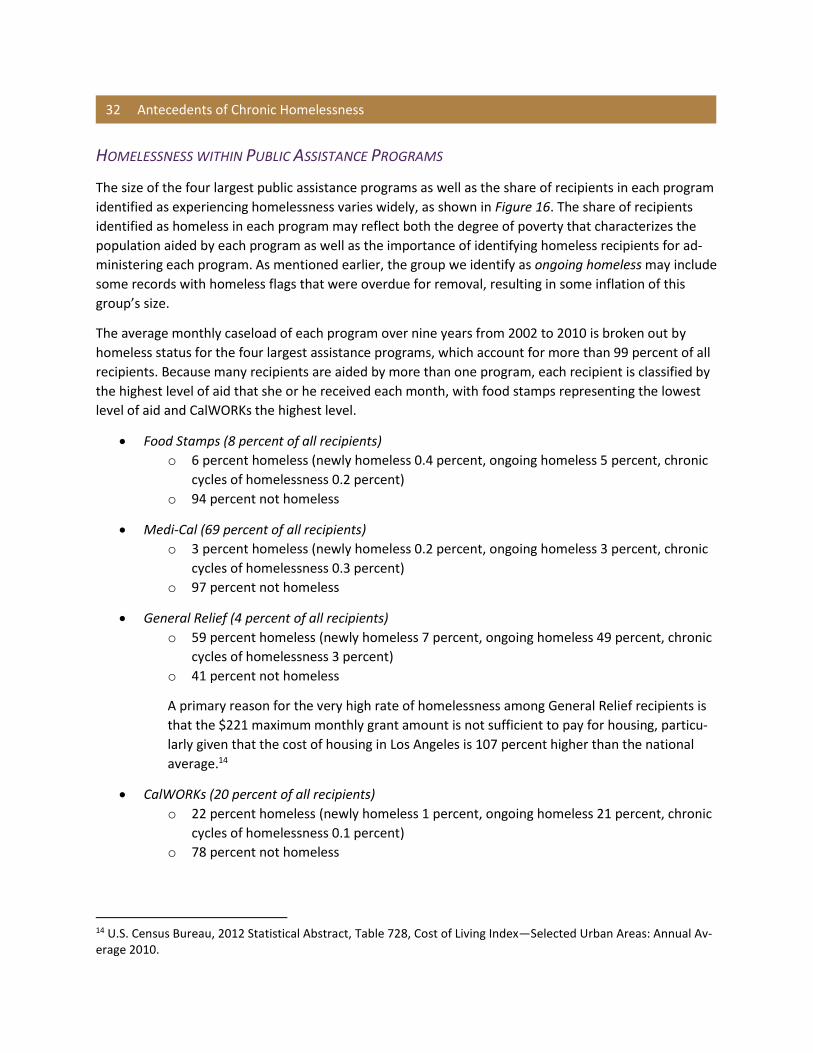
32 Antecedents of Chronic Homelessness
HOMELESSNESS WITHIN PUBLIC ASSISTANCE PROGRAMS
The size of the four largest public assistance programs as well as the share of recipients in each program
identified as experiencing homelessness varies widely, as shown in Figure 16. The share of recipients
identified as homeless in each program may reflect both the degree of poverty that characterizes the
population aided by each program as well as the importance of identifying homeless recipients for ad-
ministering each program. As mentioned earlier, the group we identify as ongoing homeless may include
some records with homeless flags that were overdue for removal, resulting in some inflation of this
group’s size.
The average monthly caseload of each program over nine years from 2002 to 2010 is broken out by
homeless status for the four largest assistance programs, which account for more than 99 percent of all
recipients. Because many recipients are aided by more than one program, each recipient is classified by
the highest level of aid that she or he received each month, with food stamps representing the lowest
level of aid and CalWORKs the highest level.
Food Stamps (8 percent of all recipients)
o 6 percent homeless (newly homeless 0.4 percent, ongoing homeless 5 percent, chronic
cycles of homelessness 0.2 percent)
o 94 percent not homeless
Medi-Cal (69 percent of all recipients)
o 3 percent homeless (newly homeless 0.2 percent, ongoing homeless 3 percent, chronic
cycles of homelessness 0.3 percent)
o 97 percent not homeless
General Relief (4 percent of all recipients)
o 59 percent homeless (newly homeless 7 percent, ongoing homeless 49 percent, chronic
cycles of homelessness 3 percent)
o 41 percent not homeless
A primary reason for the very high rate of homelessness among General Relief recipients is
that the $221 maximum monthly grant amount is not sufficient to pay for housing, particu-
larly given that the cost of housing in Los Angeles is 107 percent higher than the national
average.14
CalWORKs (20 percent of all recipients)
o 22 percent homeless (newly homeless 1 percent, ongoing homeless 21 percent, chronic
cycles of homelessness 0.1 percent)
o 78 percent not homeless
14 U.S. Census Bureau, 2012 Statistical Abstract, Table 728, Cost of Living Index—Selected Urban Areas: Annual Av-erage 2010.
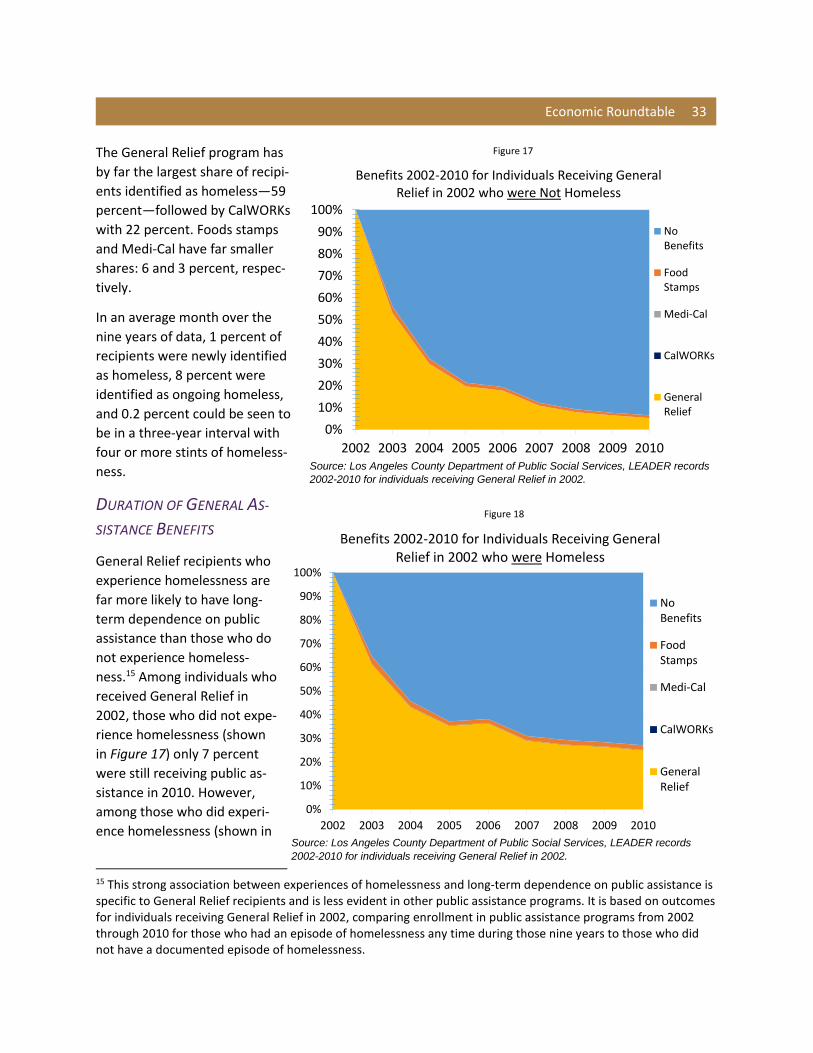
Economic Roundtable 33
The General Relief program has
by far the largest share of recipi-
ents identified as homeless—59
percent—followed by CalWORKs
with 22 percent. Foods stamps
and Medi-Cal have far smaller
shares: 6 and 3 percent, respec-
tively.
In an average month over the
nine years of data, 1 percent of
recipients were newly identified
as homeless, 8 percent were
identified as ongoing homeless,
and 0.2 percent could be seen to
be in a three-year interval with
four or more stints of homeless-
ness.
DURATION OF GENERAL AS-
SISTANCE BENEFITS
General Relief recipients who
experience homelessness are
far more likely to have long-
term dependence on public
assistance than those who do
not experience homeless-
ness.15 Among individuals who
received General Relief in
2002, those who did not expe-
rience homelessness (shown
in Figure 17) only 7 percent
were still receiving public as-
sistance in 2010. However,
among those who did experi-
ence homelessness (shown in
15 This strong association between experiences of homelessness and long-term dependence on public assistance is specific to General Relief recipients and is less evident in other public assistance programs. It is based on outcomes for individuals receiving General Relief in 2002, comparing enrollment in public assistance programs from 2002 through 2010 for those who had an episode of homelessness any time during those nine years to those who did not have a documented episode of homelessness.
Figure 17
Source: Los Angeles County Department of Public Social Services, LEADER records
2002-2010 for individuals receiving General Relief in 2002.
0%
10%
20%
30%
40%
50%
60%
70%
80%
90%
100%
2002 2003 2004 2005 2006 2007 2008 2009 2010
Benefits 2002-2010 for Individuals Receiving General Relief in 2002 who were Not Homeless
NoBenefits
FoodStamps
Medi-Cal
CalWORKs
GeneralRelief
Figure 18
Source: Los Angeles County Department of Public Social Services, LEADER records
2002-2010 for individuals receiving General Relief in 2002.
0%
10%
20%
30%
40%
50%
60%
70%
80%
90%
100%
2002 2003 2004 2005 2006 2007 2008 2009 2010
Benefits 2002-2010 for Individuals Receiving General Relief in 2002 who were Homeless
NoBenefits
FoodStamps
Medi-Cal
CalWORKs
GeneralRelief
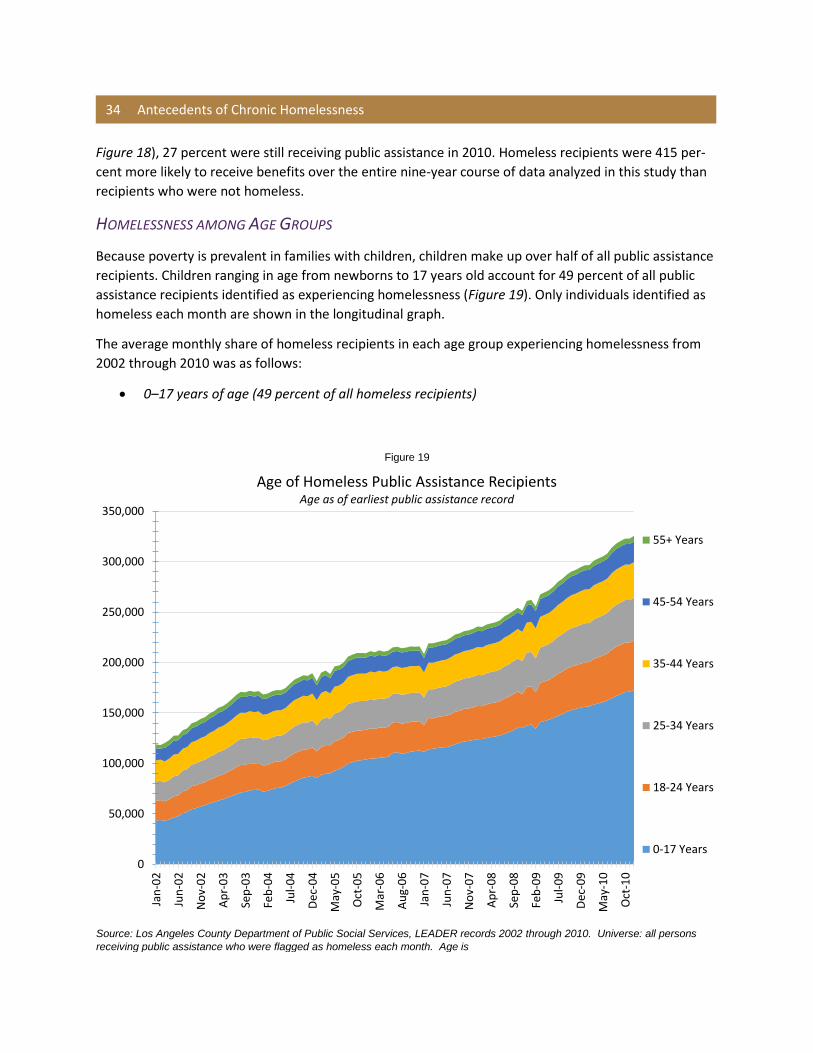
34 Antecedents of Chronic Homelessness
Figure 18), 27 percent were still receiving public assistance in 2010. Homeless recipients were 415 per-
cent more likely to receive benefits over the entire nine-year course of data analyzed in this study than
recipients who were not homeless.
HOMELESSNESS AMONG AGE GROUPS
Because poverty is prevalent in families with children, children make up over half of all public assistance
recipients. Children ranging in age from newborns to 17 years old account for 49 percent of all public
assistance recipients identified as experiencing homelessness (Figure 19). Only individuals identified as
homeless each month are shown in the longitudinal graph.
The average monthly share of homeless recipients in each age group experiencing homelessness from
2002 through 2010 was as follows:
0–17 years of age (49 percent of all homeless recipients)
Figure 19
Source: Los Angeles County Department of Public Social Services, LEADER records 2002 through 2010. Universe: all persons
receiving public assistance who were flagged as homeless each month. Age is
0
50,000
100,000
150,000
200,000
250,000
300,000
350,000
Jan
-02
Jun
-02
No
v-0
2
Ap
r-0
3
Sep
-03
Feb
-04
Jul-
04
Dec
-04
May
-05
Oct
-05
Mar
-06
Au
g-0
6
Jan
-07
Jun
-07
No
v-0
7
Ap
r-0
8
Sep
-08
Feb
-09
Jul-
09
Dec
-09
May
-10
Oct
-10
Age of Homeless Public Assistance RecipientsAge as of earliest public assistance record
55+ Years
45-54 Years
35-44 Years
25-34 Years
18-24 Years
0-17 Years
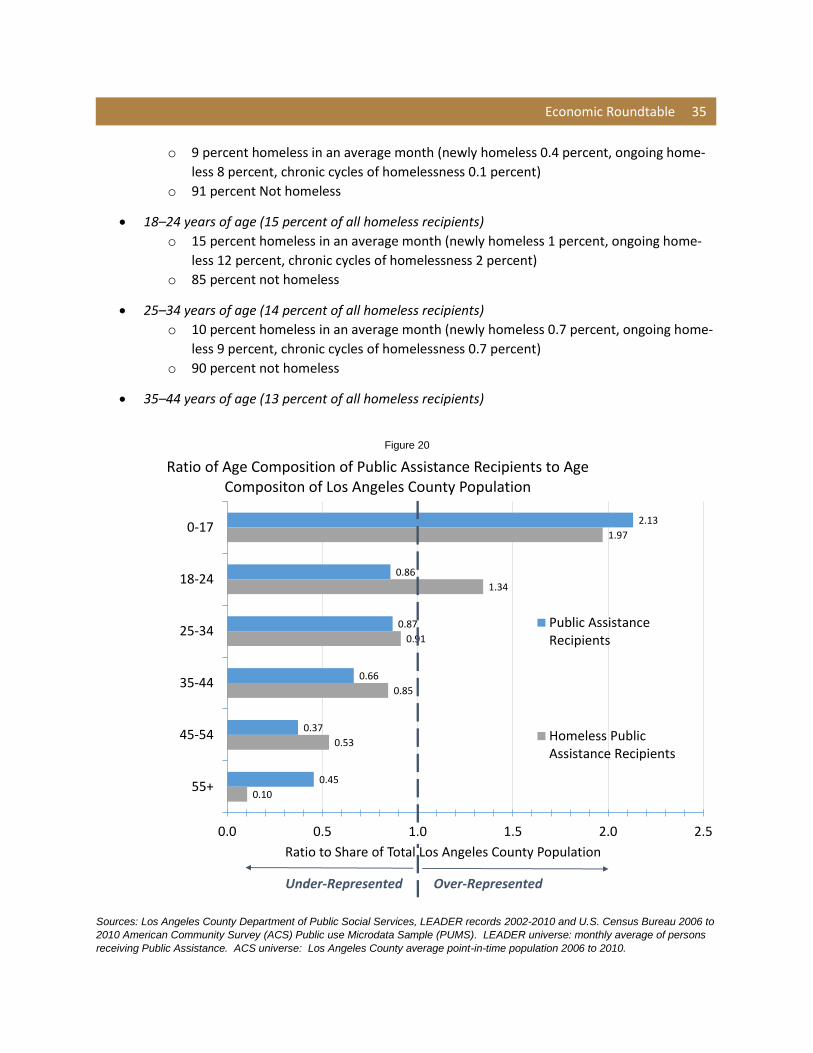
Economic Roundtable 35
o 9 percent homeless in an average month (newly homeless 0.4 percent, ongoing home-
less 8 percent, chronic cycles of homelessness 0.1 percent)
o 91 percent Not homeless
18–24 years of age (15 percent of all homeless recipients)
o 15 percent homeless in an average month (newly homeless 1 percent, ongoing home-
less 12 percent, chronic cycles of homelessness 2 percent)
o 85 percent not homeless
25–34 years of age (14 percent of all homeless recipients)
o 10 percent homeless in an average month (newly homeless 0.7 percent, ongoing home-
less 9 percent, chronic cycles of homelessness 0.7 percent)
o 90 percent not homeless
35–44 years of age (13 percent of all homeless recipients)
Figure 20
Sources: Los Angeles County Department of Public Social Services, LEADER records 2002-2010 and U.S. Census Bureau 2006 to
2010 American Community Survey (ACS) Public use Microdata Sample (PUMS). LEADER universe: monthly average of persons
receiving Public Assistance. ACS universe: Los Angeles County average point-in-time population 2006 to 2010.
2.13
0.86
0.87
0.66
0.37
0.45
1.97
1.34
0.91
0.85
0.53
0.10
0.0 0.5 1.0 1.5 2.0 2.5
0-17
18-24
25-34
35-44
45-54
55+
Ratio to Share of Total Los Angeles County Population
Ratio of Age Composition of Public Assistance Recipients to Age Compositon of Los Angeles County Population
Public AssistanceRecipients
Homeless PublicAssistance Recipients
Over-RepresentedUnder-Represented
1.0
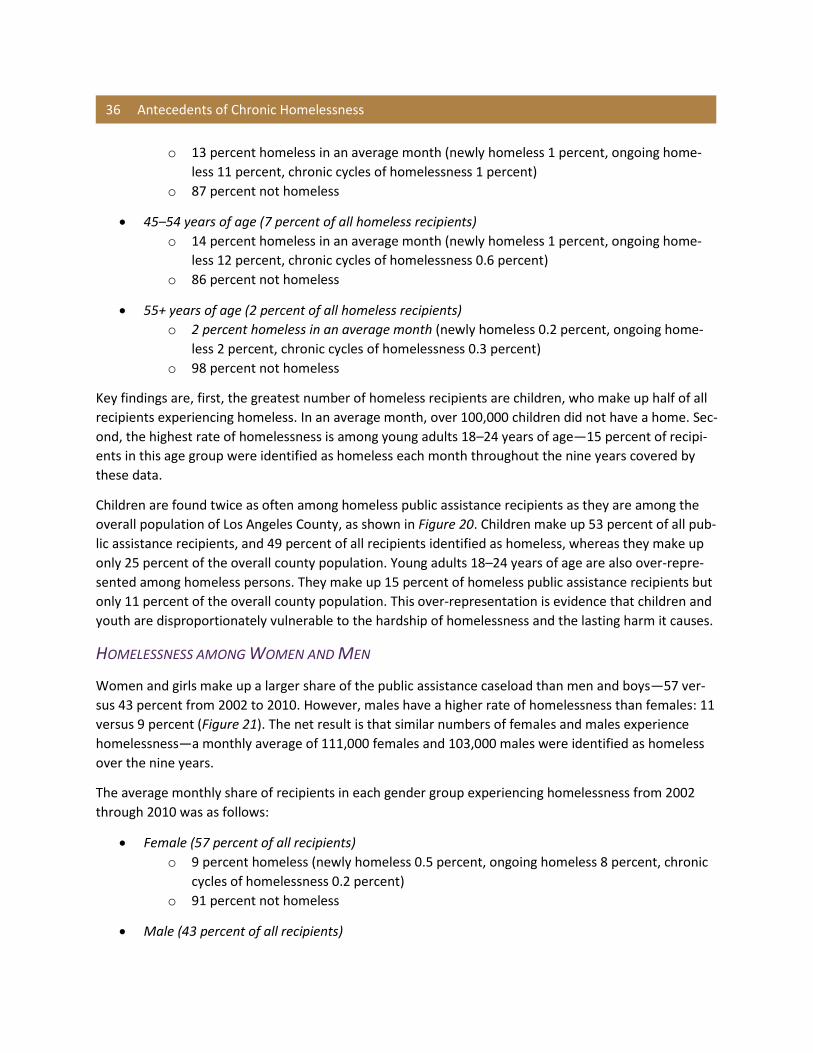
36 Antecedents of Chronic Homelessness
o 13 percent homeless in an average month (newly homeless 1 percent, ongoing home-
less 11 percent, chronic cycles of homelessness 1 percent)
o 87 percent not homeless
45–54 years of age (7 percent of all homeless recipients)
o 14 percent homeless in an average month (newly homeless 1 percent, ongoing home-
less 12 percent, chronic cycles of homelessness 0.6 percent)
o 86 percent not homeless
55+ years of age (2 percent of all homeless recipients)
o 2 percent homeless in an average month (newly homeless 0.2 percent, ongoing home-
less 2 percent, chronic cycles of homelessness 0.3 percent)
o 98 percent not homeless
Key findings are, first, the greatest number of homeless recipients are children, who make up half of all
recipients experiencing homeless. In an average month, over 100,000 children did not have a home. Sec-
ond, the highest rate of homelessness is among young adults 18–24 years of age—15 percent of recipi-
ents in this age group were identified as homeless each month throughout the nine years covered by
these data.
Children are found twice as often among homeless public assistance recipients as they are among the
overall population of Los Angeles County, as shown in Figure 20. Children make up 53 percent of all pub-
lic assistance recipients, and 49 percent of all recipients identified as homeless, whereas they make up
only 25 percent of the overall county population. Young adults 18–24 years of age are also over-repre-
sented among homeless persons. They make up 15 percent of homeless public assistance recipients but
only 11 percent of the overall county population. This over-representation is evidence that children and
youth are disproportionately vulnerable to the hardship of homelessness and the lasting harm it causes.
HOMELESSNESS AMONG WOMEN AND MEN
Women and girls make up a larger share of the public assistance caseload than men and boys—57 ver-
sus 43 percent from 2002 to 2010. However, males have a higher rate of homelessness than females: 11
versus 9 percent (Figure 21). The net result is that similar numbers of females and males experience
homelessness—a monthly average of 111,000 females and 103,000 males were identified as homeless
over the nine years.
The average monthly share of recipients in each gender group experiencing homelessness from 2002
through 2010 was as follows:
Female (57 percent of all recipients)
o 9 percent homeless (newly homeless 0.5 percent, ongoing homeless 8 percent, chronic
cycles of homelessness 0.2 percent)
o 91 percent not homeless
Male (43 percent of all recipients)
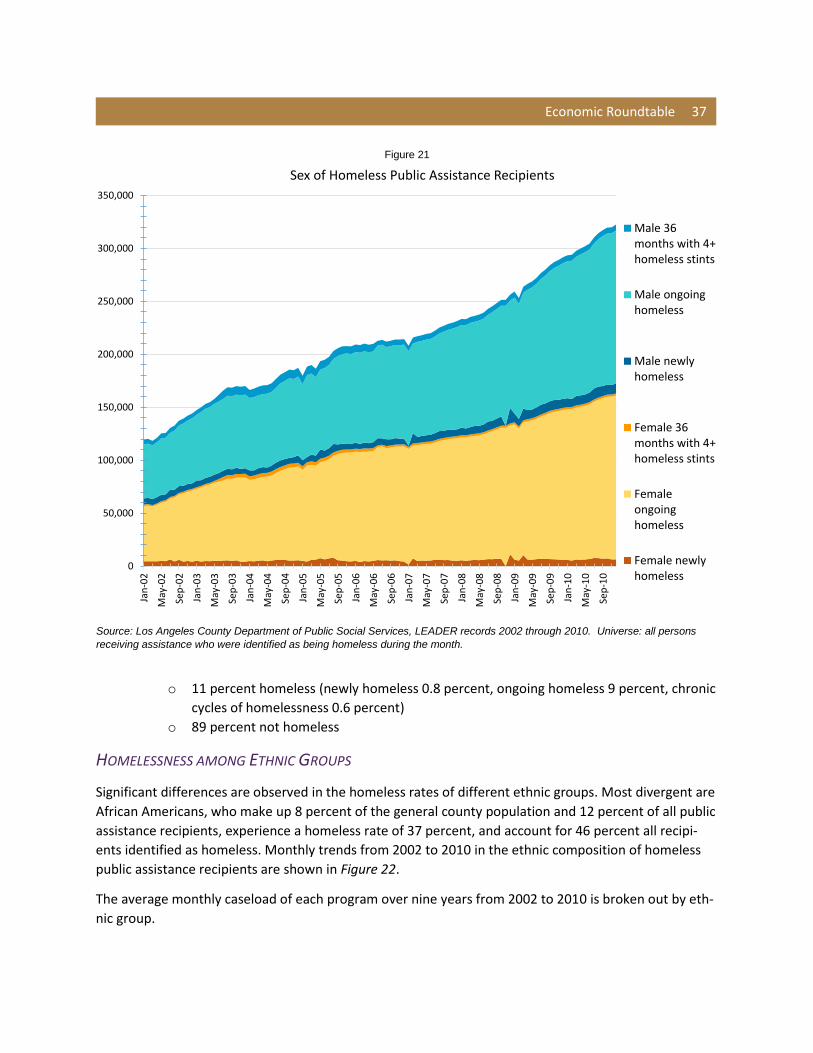
Economic Roundtable 37
o 11 percent homeless (newly homeless 0.8 percent, ongoing homeless 9 percent, chronic
cycles of homelessness 0.6 percent)
o 89 percent not homeless
HOMELESSNESS AMONG ETHNIC GROUPS
Significant differences are observed in the homeless rates of different ethnic groups. Most divergent are
African Americans, who make up 8 percent of the general county population and 12 percent of all public
assistance recipients, experience a homeless rate of 37 percent, and account for 46 percent all recipi-
ents identified as homeless. Monthly trends from 2002 to 2010 in the ethnic composition of homeless
public assistance recipients are shown in Figure 22.
The average monthly caseload of each program over nine years from 2002 to 2010 is broken out by eth-
nic group.
Figure 21
Source: Los Angeles County Department of Public Social Services, LEADER records 2002 through 2010. Universe: all persons
receiving assistance who were identified as being homeless during the month.
0
50,000
100,000
150,000
200,000
250,000
300,000
350,000
Jan
-02
May
-02
Sep
-02
Jan
-03
May
-03
Sep
-03
Jan
-04
May
-04
Sep
-04
Jan
-05
May
-05
Sep
-05
Jan
-06
May
-06
Sep
-06
Jan
-07
May
-07
Sep
-07
Jan
-08
May
-08
Sep
-08
Jan
-09
May
-09
Sep
-09
Jan
-10
May
-10
Sep
-10
Sex of Homeless Public Assistance Recipients
Male 36months with 4+homeless stints
Male ongoinghomeless
Male newlyhomeless
Female 36months with 4+homeless stints
Femaleongoinghomeless
Female newlyhomeless
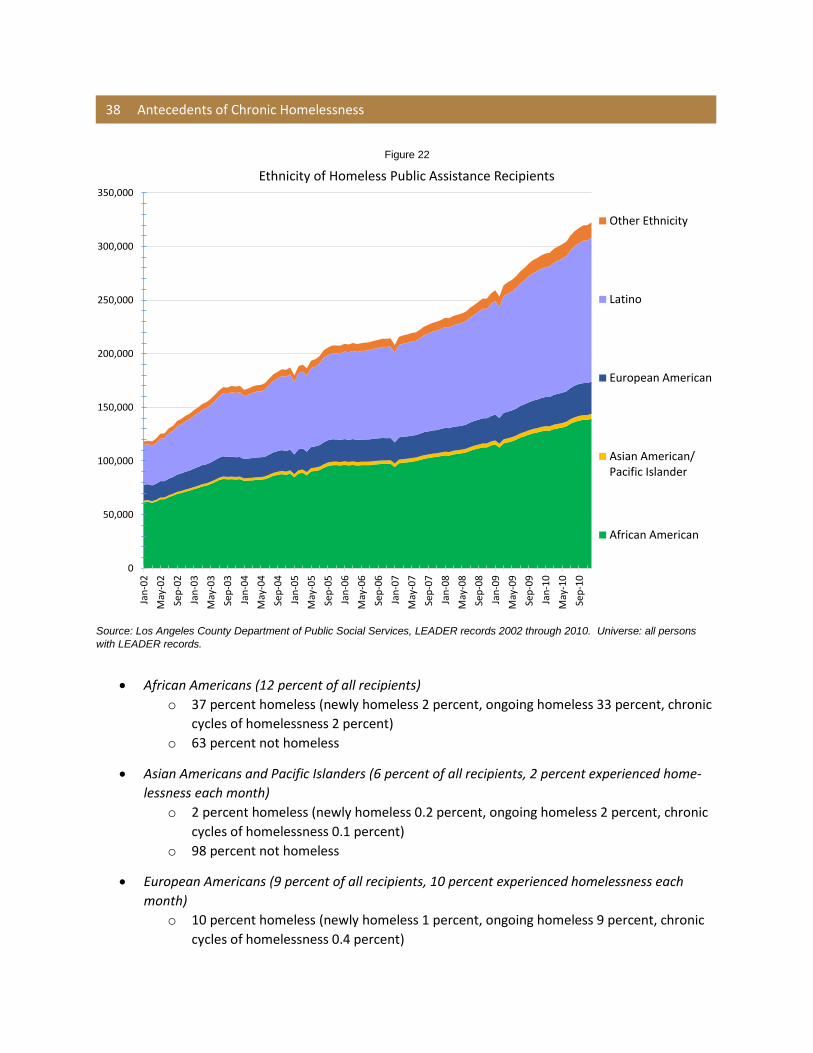
38 Antecedents of Chronic Homelessness
African Americans (12 percent of all recipients)
o 37 percent homeless (newly homeless 2 percent, ongoing homeless 33 percent, chronic
cycles of homelessness 2 percent)
o 63 percent not homeless
Asian Americans and Pacific Islanders (6 percent of all recipients, 2 percent experienced home-
lessness each month)
o 2 percent homeless (newly homeless 0.2 percent, ongoing homeless 2 percent, chronic
cycles of homelessness 0.1 percent)
o 98 percent not homeless
European Americans (9 percent of all recipients, 10 percent experienced homelessness each
month)
o 10 percent homeless (newly homeless 1 percent, ongoing homeless 9 percent, chronic
cycles of homelessness 0.4 percent)
Figure 22
Source: Los Angeles County Department of Public Social Services, LEADER records 2002 through 2010. Universe: all persons
with LEADER records.
0
50,000
100,000
150,000
200,000
250,000
300,000
350,000
Jan
-02
May
-02
Sep
-02
Jan
-03
May
-03
Sep
-03
Jan
-04
May
-04
Sep
-04
Jan
-05
May
-05
Sep
-05
Jan
-06
May
-06
Sep
-06
Jan
-07
May
-07
Sep
-07
Jan
-08
May
-08
Sep
-08
Jan
-09
May
-09
Sep
-09
Jan
-10
May
-10
Sep
-10
Ethnicity of Homeless Public Assistance Recipients
Other Ethnicity
Latino
European American
Asian American/Pacific Islander
African American
Economic Roundtable 39
o 90 percent not homeless
Latinos (70 percent of all recipients)
o 5 percent homeless (newly homeless 0.3 percent, ongoing homeless 5 percent, chronic
cycles of homelessness 0.2 percent)
o 95 percent not homeless
Other (3 percent of all recipients, 12 percent experienced homelessness each month). The Other
ethnicity category includes American Indians and Alaskan natives as well as individuals coded as
Other.
o 12 percent homeless (newly homeless 1 percent, ongoing homeless 10 percent, chronic
cycles of homelessness 0.6 percent)
o 88 percent not homeless
Figure 23
Sources: Los Angeles County Department of Public Social Services, LEADER records 2002-2010 and U.S. Census Bureau 2006 to
2010 American Community Survey (ACS) Public use Microdata Sample (PUMS). LEADER universe: monthly average of persons
receiving Public Assistance. ACS universe: Los Angeles County average point-in-time population 2006 to 2010.
1.51
0.43
0.33
1.48
1.53
5.74
0.10
0.36
0.83
1.89
0 1 2 3 4 5 6 7
African American
Asian American/PI
European American
Latino
Other Ethnicity
Ratio to Share of Total Los Angeles County Population
Ratio of Ethnic Composition of Public Assistance Recipients to Ethnic Compositon of Los Angeles County Population
Public AssistanceRecipients 2010
Homeless PublicAssistance Recipients
Over-RepresentedUnder-Represented
1

40 Antecedents of Chronic Homelessness
When the representation of ethnic groups among public assistance recipients is benchmarked against
the overall ethnic composition of Los Angeles County’s population, we see that every ethnic group ex-
cept Asian Americans and European Americans is over-represented among recipients, as shown in Fig-
ure 23.
When homeless recipients are benchmarked against the county population, the Other category is over-
represented by a factor of almost two and African Americans are over-represented by a factor of almost
six. Latino, European American, and Asian American/PI recipients are under-represented among home-
less persons.
MARITAL STATUS OF HOMELESS PUBLIC ASSISTANCE RECIPIENTS
Over one third (36 percent) of public assistance recipients 15 years of age or older were married and liv-
ing with their spouses, but this cohort makes up only 7 percent of recipients who experienced homeless-
ness. In contrast, over half (55 percent) of public assistance recipients were single, but this cohort makes
Figure 24
Source: Los Angeles County Department of Public Social Services, LEADER records 2002 through 2010. Recipients 15 years of
age and older identified as homeless each month.
0
20,000
40,000
60,000
80,000
100,000
120,000
140,000
160,000
180,000
Jan
-02
Jun
-02
No
v-0
2
Ap
r-0
3
Sep
-03
Feb
-04
Jul-
04
Dec
-04
May
-05
Oct
-05
Mar
-06
Au
g-0
6
Jan
-07
Jun
-07
No
v-0
7
Ap
r-0
8
Sep
-08
Feb
-09
Jul-
09
Dec
-09
May
-10
Oct
-10
Marital Status of Homeless Public Assistance Recipients 15+ Years of Age
Widowed
Divorced
Separated
Married, livingwith spouse
Single
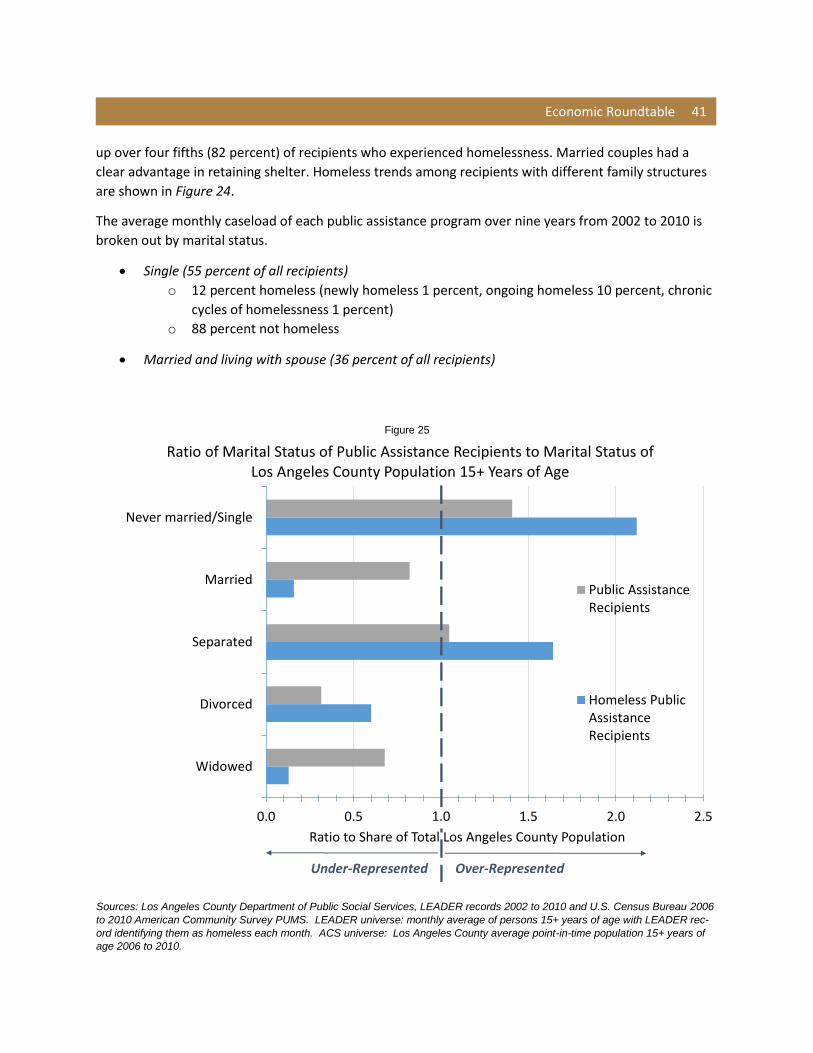
Economic Roundtable 41
up over four fifths (82 percent) of recipients who experienced homelessness. Married couples had a
clear advantage in retaining shelter. Homeless trends among recipients with different family structures
are shown in Figure 24.
The average monthly caseload of each public assistance program over nine years from 2002 to 2010 is
broken out by marital status.
Single (55 percent of all recipients)
o 12 percent homeless (newly homeless 1 percent, ongoing homeless 10 percent, chronic
cycles of homelessness 1 percent)
o 88 percent not homeless
Married and living with spouse (36 percent of all recipients)
Figure 25
Sources: Los Angeles County Department of Public Social Services, LEADER records 2002 to 2010 and U.S. Census Bureau 2006
to 2010 American Community Survey PUMS. LEADER universe: monthly average of persons 15+ years of age with LEADER rec-
ord identifying them as homeless each month. ACS universe: Los Angeles County average point-in-time population 15+ years of
age 2006 to 2010.
0.0 0.5 1.0 1.5 2.0 2.5
Never married/Single
Married
Separated
Divorced
Widowed
Ratio to Share of Total Los Angeles County Population
Ratio of Marital Status of Public Assistance Recipients to Marital Status of Los Angeles County Population 15+ Years of Age
Public AssistanceRecipients
Homeless PublicAssistanceRecipients
Over-RepresentedUnder-Represented
1.0
42 Antecedents of Chronic Homelessness
o 2 percent homeless (newly homeless 0.1 percent, ongoing homeless 1 percent, chronic
cycles of homelessness 1 percent)
o 98 percent not homeless
Separated (3 percent of all recipients)
o 13 percent homeless (newly homeless 1 percent, ongoing homeless 11 percent, chronic
cycles of homelessness 1 percent)
o 87 percent not homeless
Divorced (3 percent of all recipients)
o 16 percent homeless (newly homeless 1 percent, ongoing homeless 14 percent, chronic
cycles of homelessness 1 percent)
o 84 percent not homeless
Widowed (3 percent of all recipients)
o 2 percent homeless (newly homeless 0.1 percent, ongoing homeless 2 percent, chronic
cycles of homelessness 0.1 percent)
o 98 percent not homeless
The over-representation of single adults in the public assistance population compared to the overall
population of Los Angeles County is shown in Figure 25. The comparative under-representation of mar-
ried adults among public assistance recipients is also shown, along with even greater under-representa-
tion of married persons among adults experiencing homelessness.
When the representation of marital groups among homeless public assistance recipients 15 years of age
and older is benchmarked against the overall marital composition of Los Angeles County residents 15
and older, we see that recipients who are single are 112 percent more prevalent among persons experi-
encing homelessness, and recipients who are separated are 64 percent more prevalent, than their pres-
ence in the county’s population would lead us to expect. In contrast, recipients who are married and liv-
ing with their spouses are 84 percent less prevalent that we would expect, and similarly recipients who
are divorced are 40 percent less prevalent and recipients who are widowed are 87 percent less preva-
lent among homeless persons.
SUMMARY OF FINDINGS
Highlights from exploring the demographic characteristics of homeless public assistance recipients in-
clude:
1. Recipients of cash aid have far higher reported monthly rates of homelessness (General Relief
59 percent, CalWORKs 22 percent) than other recipients (food stamps 6 percent, Medi-Cal 3 per-
cent). A primary reason for the very high rate of homelessness among General Relief recipients
is that the $221 maximum monthly grant amount is not sufficient to pay for housing, particularly
given that the cost of housing in Los Angeles is 107 percent higher than the national average.
Economic Roundtable 43
2. The majority of public assistance recipients are children; they account for half of all recipients
identified as homeless.
3. The next age group, young adults 18–24 years of age, have the highest reported homeless rate
of any age group: 15 percent.
4. African Americans make up a share of the homeless population that is almost six times as great
as their share of the overall county population. Thirty-seven percent of African American recipi-
ents are identified as homeless each month.
5. Latinos are under-represented among public assistance recipients experiencing homelessness,
with a share that is 17 percent smaller than their share of the overall county population.
6. Married couples have a clear advantage in retaining shelter; only 2 percent are identified as
homeless each month compared with 12 percent of single adults.
7. General Relief recipients who experience homelessness are 415 percent more likely to have
long-term dependence on public assistance than those who do not experience homelessness,
with 27 percent participation in public assistance programs for those who were homeless com-
pared to 7 percent for those who were not homeless.
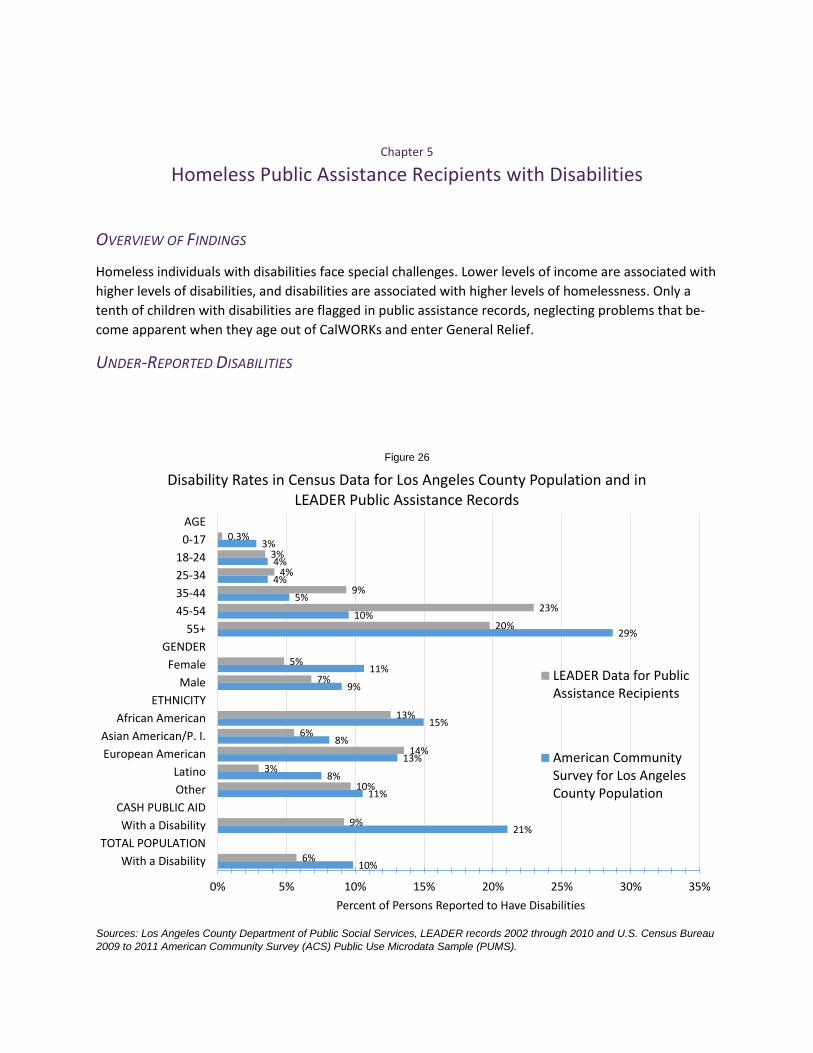
Chapter 5
Homeless Public Assistance Recipients with Disabilities
OVERVIEW OF FINDINGS
Homeless individuals with disabilities face special challenges. Lower levels of income are associated with
higher levels of disabilities, and disabilities are associated with higher levels of homelessness. Only a
tenth of children with disabilities are flagged in public assistance records, neglecting problems that be-
come apparent when they age out of CalWORKs and enter General Relief.
UNDER-REPORTED DISABILITIES
Figure 26
Sources: Los Angeles County Department of Public Social Services, LEADER records 2002 through 2010 and U.S. Census Bureau
2009 to 2011 American Community Survey (ACS) Public Use Microdata Sample (PUMS).
0.3%
3%
4%
9%
23%
20%
5%
7%
13%
6%
14%
3%
10%
9%
6%
3%
4%
4%
5%
10%
29%
11%
9%
15%
8%
13%
8%
11%
21%
10%
0% 5% 10% 15% 20% 25% 30% 35%
AGE
0-17
18-24
25-34
35-44
45-54
55+
GENDER
Female
Male
ETHNICITY
African American
Asian American/P. I.
European American
Latino
Other
CASH PUBLIC AID
With a Disability
TOTAL POPULATION
With a Disability
Percent of Persons Reported to Have Disabilities
Disability Rates in Census Data for Los Angeles County Population and in LEADER Public Assistance Records
LEADER Data for PublicAssistance Recipients
American CommunitySurvey for Los AngelesCounty Population
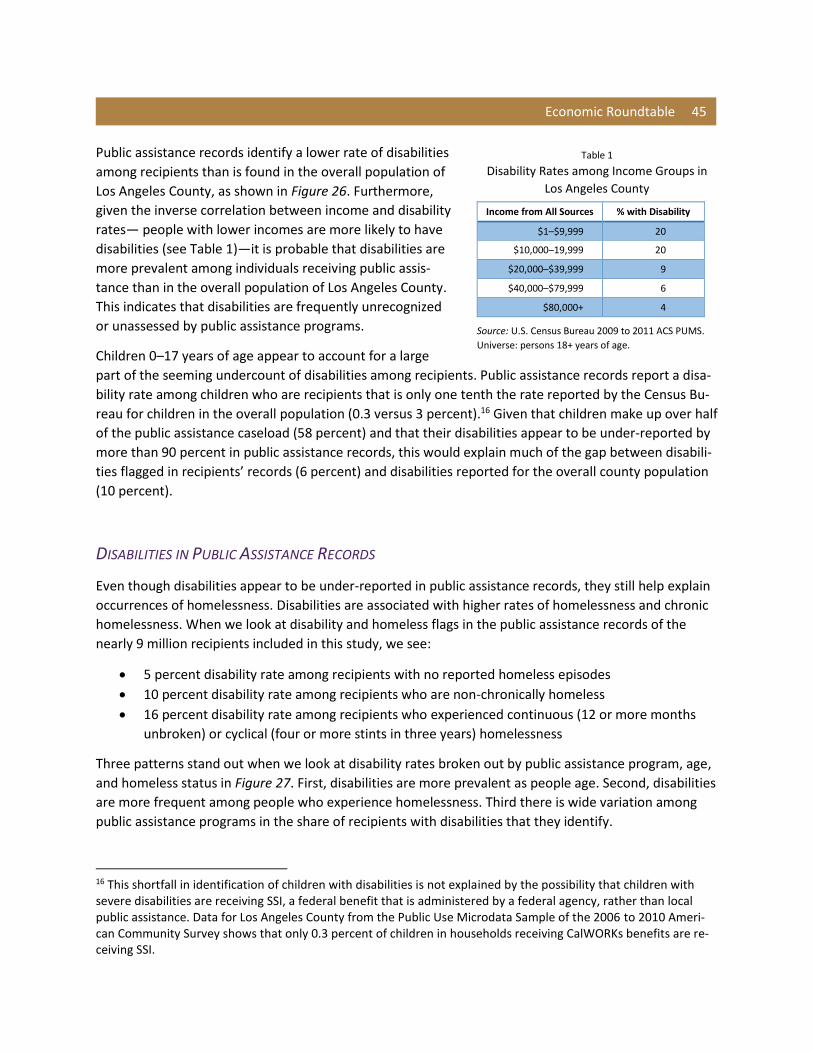
Economic Roundtable 45
Public assistance records identify a lower rate of disabilities
among recipients than is found in the overall population of
Los Angeles County, as shown in Figure 26. Furthermore,
given the inverse correlation between income and disability
rates— people with lower incomes are more likely to have
disabilities (see Table 1)—it is probable that disabilities are
more prevalent among individuals receiving public assis-
tance than in the overall population of Los Angeles County.
This indicates that disabilities are frequently unrecognized
or unassessed by public assistance programs.
Children 0–17 years of age appear to account for a large
part of the seeming undercount of disabilities among recipients. Public assistance records report a disa-
bility rate among children who are recipients that is only one tenth the rate reported by the Census Bu-
reau for children in the overall population (0.3 versus 3 percent).16 Given that children make up over half
of the public assistance caseload (58 percent) and that their disabilities appear to be under-reported by
more than 90 percent in public assistance records, this would explain much of the gap between disabili-
ties flagged in recipients’ records (6 percent) and disabilities reported for the overall county population
(10 percent).
DISABILITIES IN PUBLIC ASSISTANCE RECORDS
Even though disabilities appear to be under-reported in public assistance records, they still help explain
occurrences of homelessness. Disabilities are associated with higher rates of homelessness and chronic
homelessness. When we look at disability and homeless flags in the public assistance records of the
nearly 9 million recipients included in this study, we see:
5 percent disability rate among recipients with no reported homeless episodes
10 percent disability rate among recipients who are non-chronically homeless
16 percent disability rate among recipients who experienced continuous (12 or more months
unbroken) or cyclical (four or more stints in three years) homelessness
Three patterns stand out when we look at disability rates broken out by public assistance program, age,
and homeless status in Figure 27. First, disabilities are more prevalent as people age. Second, disabilities
are more frequent among people who experience homelessness. Third there is wide variation among
public assistance programs in the share of recipients with disabilities that they identify.
16 This shortfall in identification of children with disabilities is not explained by the possibility that children with severe disabilities are receiving SSI, a federal benefit that is administered by a federal agency, rather than local public assistance. Data for Los Angeles County from the Public Use Microdata Sample of the 2006 to 2010 Ameri-can Community Survey shows that only 0.3 percent of children in households receiving CalWORKs benefits are re-ceiving SSI.
Table 1
Disability Rates among Income Groups in
Los Angeles County
Income from All Sources % with Disability
$1–$9,999 20
$10,000–19,999 20
$20,000–$39,999 9
$40,000–$79,999 6
$80,000+ 4
Source: U.S. Census Bureau 2009 to 2011 ACS PUMS.
Universe: persons 18+ years of age.
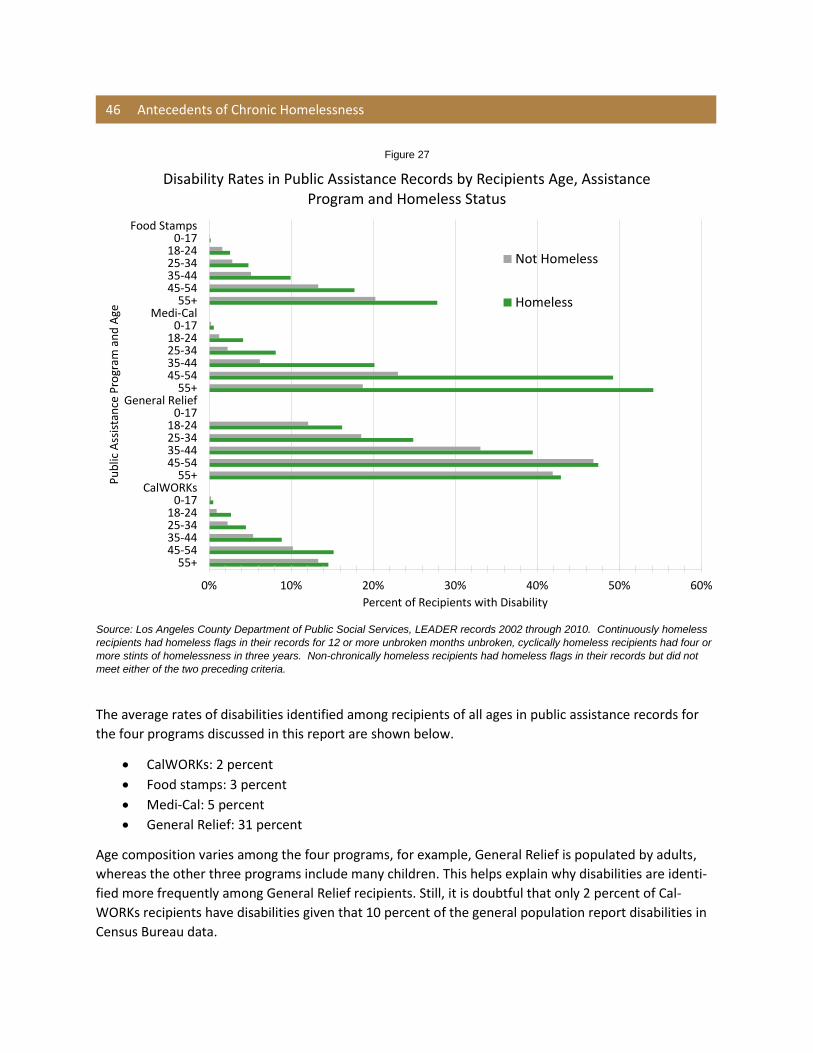
46 Antecedents of Chronic Homelessness
The average rates of disabilities identified among recipients of all ages in public assistance records for
the four programs discussed in this report are shown below.
CalWORKs: 2 percent
Food stamps: 3 percent
Medi-Cal: 5 percent
General Relief: 31 percent
Age composition varies among the four programs, for example, General Relief is populated by adults,
whereas the other three programs include many children. This helps explain why disabilities are identi-
fied more frequently among General Relief recipients. Still, it is doubtful that only 2 percent of Cal-
WORKs recipients have disabilities given that 10 percent of the general population report disabilities in
Census Bureau data.
Figure 27
Source: Los Angeles County Department of Public Social Services, LEADER records 2002 through 2010. Continuously homeless
recipients had homeless flags in their records for 12 or more unbroken months unbroken, cyclically homeless recipients had four or
more stints of homelessness in three years. Non-chronically homeless recipients had homeless flags in their records but did not
meet either of the two preceding criteria.
0% 10% 20% 30% 40% 50% 60%
Food Stamps0-17
18-2425-3435-4445-54
55+Medi-Cal
0-1718-2425-3435-4445-54
55+General Relief
0-1718-2425-3435-4445-54
55+CalWORKs
0-1718-2425-3435-4445-54
55+
Percent of Recipients with Disability
Pu
blic
Ass
ista
nce
Pro
gram
an
d A
ge
Disability Rates in Public Assistance Records by Recipients Age, Assistance Program and Homeless Status
Not Homeless
Homeless
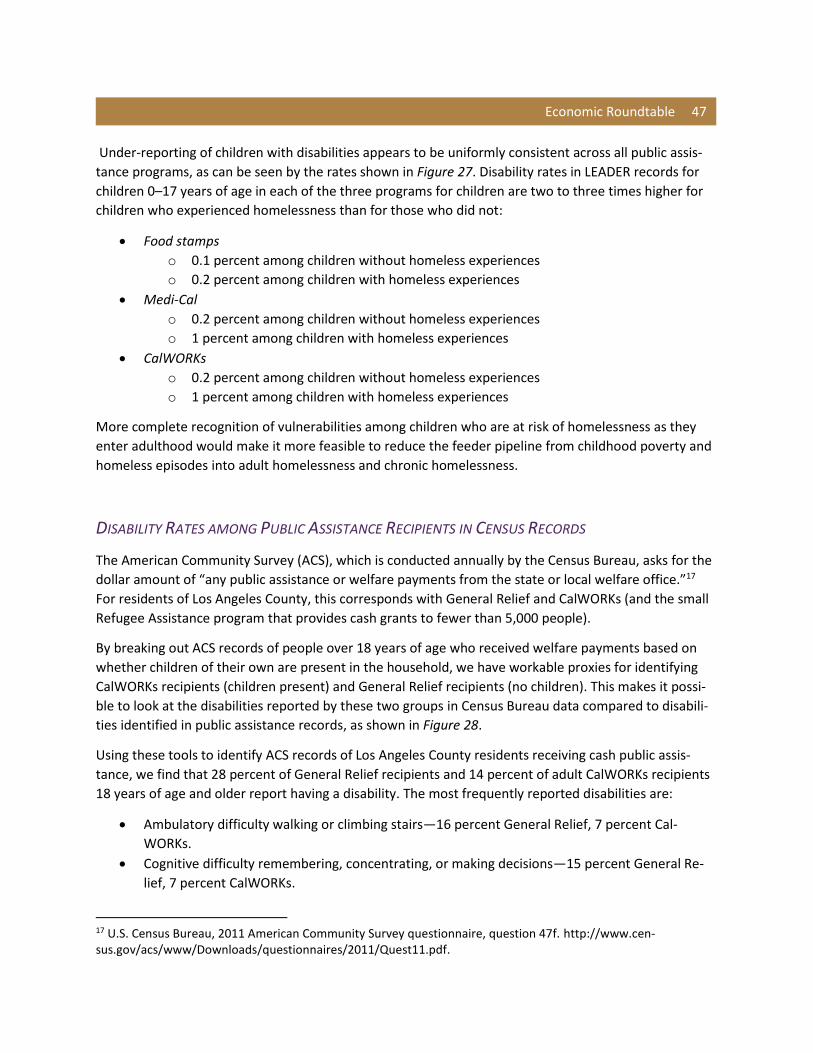
Economic Roundtable 47
Under-reporting of children with disabilities appears to be uniformly consistent across all public assis-
tance programs, as can be seen by the rates shown in Figure 27. Disability rates in LEADER records for
children 0–17 years of age in each of the three programs for children are two to three times higher for
children who experienced homelessness than for those who did not:
Food stamps
o 0.1 percent among children without homeless experiences
o 0.2 percent among children with homeless experiences
Medi-Cal
o 0.2 percent among children without homeless experiences
o 1 percent among children with homeless experiences
CalWORKs
o 0.2 percent among children without homeless experiences
o 1 percent among children with homeless experiences
More complete recognition of vulnerabilities among children who are at risk of homelessness as they
enter adulthood would make it more feasible to reduce the feeder pipeline from childhood poverty and
homeless episodes into adult homelessness and chronic homelessness.
DISABILITY RATES AMONG PUBLIC ASSISTANCE RECIPIENTS IN CENSUS RECORDS
The American Community Survey (ACS), which is conducted annually by the Census Bureau, asks for the
dollar amount of “any public assistance or welfare payments from the state or local welfare office.”17
For residents of Los Angeles County, this corresponds with General Relief and CalWORKs (and the small
Refugee Assistance program that provides cash grants to fewer than 5,000 people).
By breaking out ACS records of people over 18 years of age who received welfare payments based on
whether children of their own are present in the household, we have workable proxies for identifying
CalWORKs recipients (children present) and General Relief recipients (no children). This makes it possi-
ble to look at the disabilities reported by these two groups in Census Bureau data compared to disabili-
ties identified in public assistance records, as shown in Figure 28.
Using these tools to identify ACS records of Los Angeles County residents receiving cash public assis-
tance, we find that 28 percent of General Relief recipients and 14 percent of adult CalWORKs recipients
18 years of age and older report having a disability. The most frequently reported disabilities are:
Ambulatory difficulty walking or climbing stairs—16 percent General Relief, 7 percent Cal-
WORKs.
Cognitive difficulty remembering, concentrating, or making decisions—15 percent General Re-
lief, 7 percent CalWORKs.
17 U.S. Census Bureau, 2011 American Community Survey questionnaire, question 47f. http://www.cen-sus.gov/acs/www/Downloads/questionnaires/2011/Quest11.pdf.
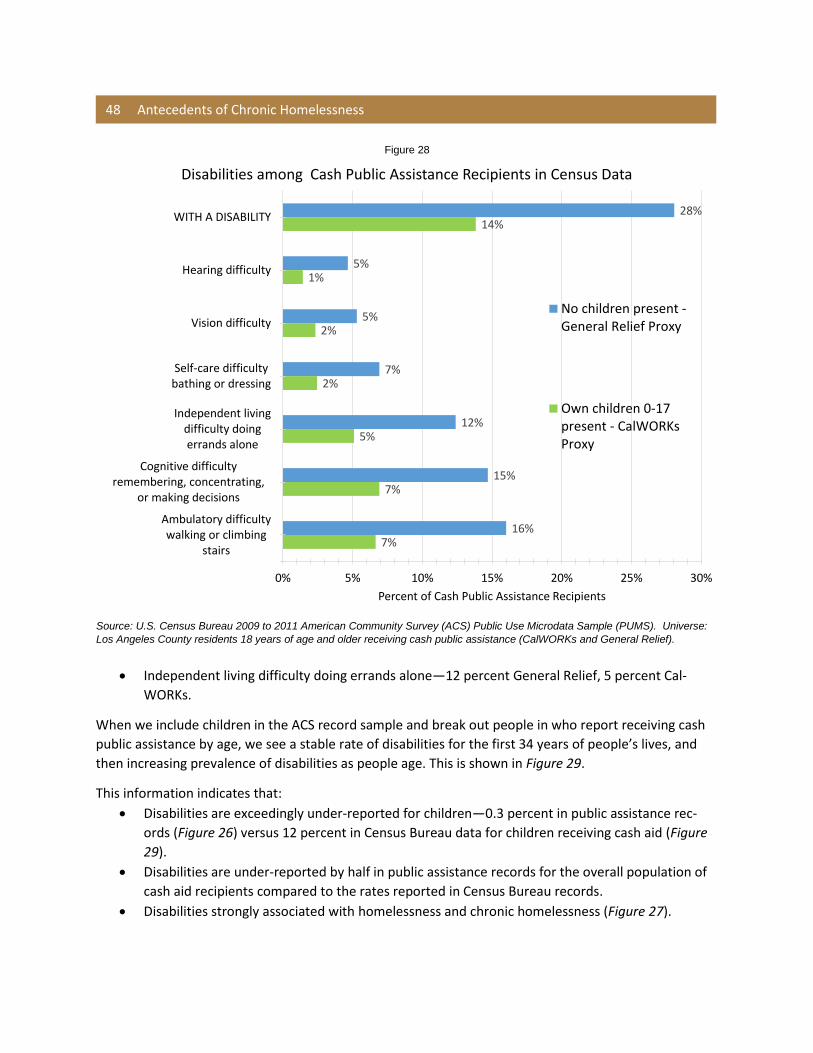
48 Antecedents of Chronic Homelessness
Independent living difficulty doing errands alone—12 percent General Relief, 5 percent Cal-
WORKs.
When we include children in the ACS record sample and break out people in who report receiving cash
public assistance by age, we see a stable rate of disabilities for the first 34 years of people’s lives, and
then increasing prevalence of disabilities as people age. This is shown in Figure 29.
This information indicates that:
Disabilities are exceedingly under-reported for children—0.3 percent in public assistance rec-
ords (Figure 26) versus 12 percent in Census Bureau data for children receiving cash aid (Figure
29).
Disabilities are under-reported by half in public assistance records for the overall population of
cash aid recipients compared to the rates reported in Census Bureau records.
Disabilities strongly associated with homelessness and chronic homelessness (Figure 27).
Figure 28
Source: U.S. Census Bureau 2009 to 2011 American Community Survey (ACS) Public Use Microdata Sample (PUMS). Universe:
Los Angeles County residents 18 years of age and older receiving cash public assistance (CalWORKs and General Relief).
28%
5%
5%
7%
12%
15%
16%
14%
1%
2%
2%
5%
7%
7%
0% 5% 10% 15% 20% 25% 30%
WITH A DISABILITY
Hearing difficulty
Vision difficulty
Self-care difficultybathing or dressing
Independent livingdifficulty doingerrands alone
Cognitive difficultyremembering, concentrating,
or making decisions
Ambulatory difficultywalking or climbing
stairs
Percent of Cash Public Assistance Recipients
Disabilities among Cash Public Assistance Recipients in Census Data
No children present -General Relief Proxy
Own children 0-17present - CalWORKsProxy
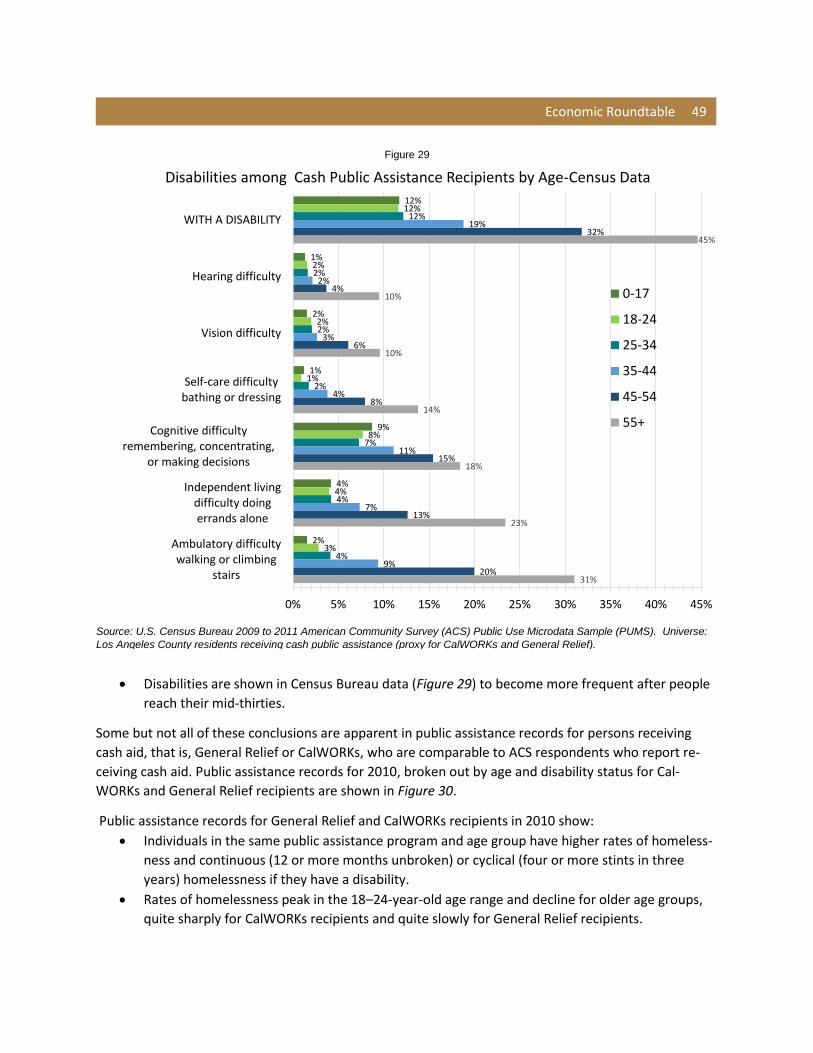
Economic Roundtable 49
Disabilities are shown in Census Bureau data (Figure 29) to become more frequent after people
reach their mid-thirties.
Some but not all of these conclusions are apparent in public assistance records for persons receiving
cash aid, that is, General Relief or CalWORKs, who are comparable to ACS respondents who report re-
ceiving cash aid. Public assistance records for 2010, broken out by age and disability status for Cal-
WORKs and General Relief recipients are shown in Figure 30.
Public assistance records for General Relief and CalWORKs recipients in 2010 show:
Individuals in the same public assistance program and age group have higher rates of homeless-
ness and continuous (12 or more months unbroken) or cyclical (four or more stints in three
years) homelessness if they have a disability.
Rates of homelessness peak in the 18–24-year-old age range and decline for older age groups,
quite sharply for CalWORKs recipients and quite slowly for General Relief recipients.
Figure 29
Source: U.S. Census Bureau 2009 to 2011 American Community Survey (ACS) Public Use Microdata Sample (PUMS). Universe:
Los Angeles County residents receiving cash public assistance (proxy for CalWORKs and General Relief).
12%
1%
2%
1%
9%
4%
2%
12%
2%
2%
1%
8%
4%
3%
12%
2%
2%
2%
7%
4%
4%
19%
2%
3%
4%
11%
7%
9%
32%
4%
6%
8%
15%
13%
20%
45%
10%
10%
14%
18%
23%
31%
0% 5% 10% 15% 20% 25% 30% 35% 40% 45%
WITH A DISABILITY
Hearing difficulty
Vision difficulty
Self-care difficultybathing or dressing
Cognitive difficultyremembering, concentrating,
or making decisions
Independent livingdifficulty doingerrands alone
Ambulatory difficultywalking or climbing
stairs
Disabilities among Cash Public Assistance Recipients by Age-Census Data
0-17
18-24
25-34
35-44
45-54
55+
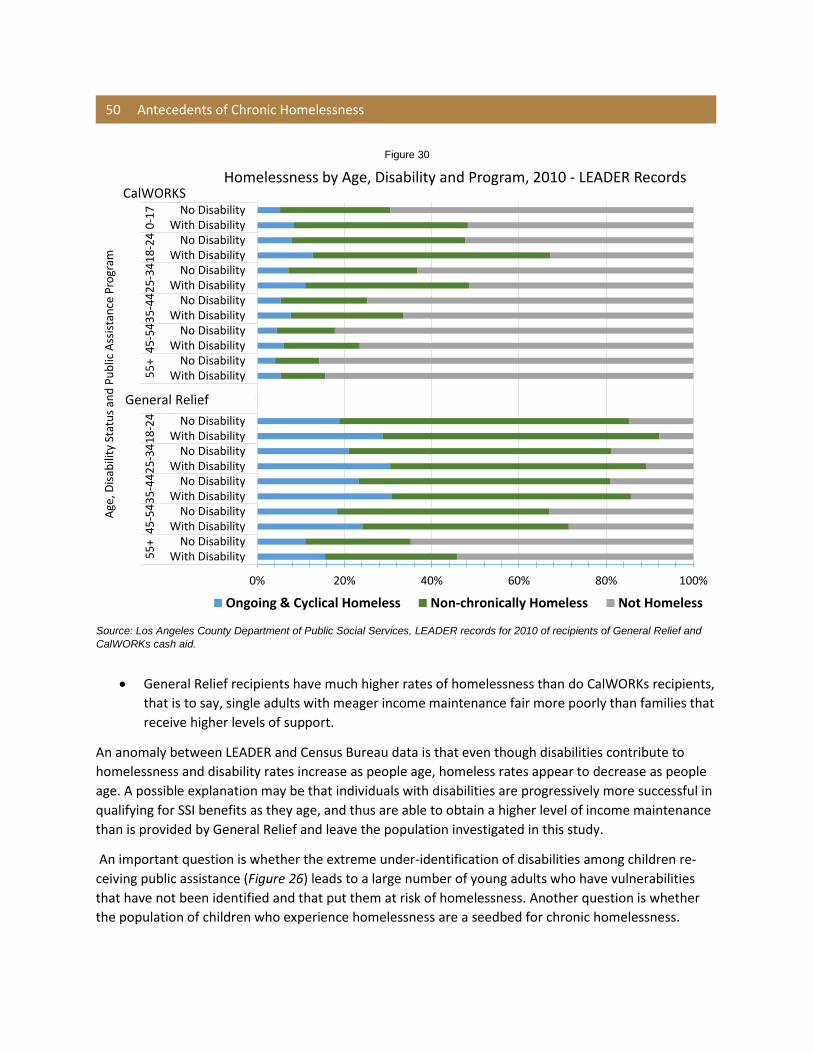
50 Antecedents of Chronic Homelessness
General Relief recipients have much higher rates of homelessness than do CalWORKs recipients,
that is to say, single adults with meager income maintenance fair more poorly than families that
receive higher levels of support.
An anomaly between LEADER and Census Bureau data is that even though disabilities contribute to
homelessness and disability rates increase as people age, homeless rates appear to decrease as people
age. A possible explanation may be that individuals with disabilities are progressively more successful in
qualifying for SSI benefits as they age, and thus are able to obtain a higher level of income maintenance
than is provided by General Relief and leave the population investigated in this study.
An important question is whether the extreme under-identification of disabilities among children re-
ceiving public assistance (Figure 26) leads to a large number of young adults who have vulnerabilities
that have not been identified and that put them at risk of homelessness. Another question is whether
the population of children who experience homelessness are a seedbed for chronic homelessness.
Figure 30
Source: Los Angeles County Department of Public Social Services, LEADER records for 2010 of recipients of General Relief and
CalWORKs cash aid.
0% 20% 40% 60% 80% 100%
No DisabilityWith Disability
No DisabilityWith Disability
No DisabilityWith Disability
No DisabilityWith Disability
No DisabilityWith Disability
No DisabilityWith Disability
No DisabilityWith Disability
No DisabilityWith Disability
No DisabilityWith Disability
No DisabilityWith Disability
No DisabilityWith Disability
0-1
71
8-2
42
5-3
43
5-4
44
5-5
45
5+
18
-24
25
-34
35
-44
45
-54
55
+
Age
, Dis
abili
ty S
tatu
s an
d P
ub
lic A
ssis
tan
ce P
rogr
am
Homelessness by Age, Disability and Program, 2010 - LEADER Records
Ongoing & Cyclical Homeless Non-chronically Homeless Not Homeless
General Relief
CalWORKS
Economic Roundtable 51
SUMMARY OF FINDINGS ABOUT DISABILITIES
1. Disabilities are associated with low incomes.
2. Only 10 percent (and possibly fewer) of the disabilities among children receiving public assistance are identified in public assistance records.
3. Disabilities are associated with higher rates of homelessness and chronic home-lessness.
4. Disabilities are more than six times more prevalent among General Relief recipi-ents than in any other assistance program.
5. Census data indicate that the most frequent disabilities among cash aid recipi-ents are ambulatory and cognitive limitations.
6. Disabilities are under-reported by half in public assistance records for the over-all population of cash aid recipients compared to the rates reported in Census Bureau records.
7. More complete recognition of vulnerabilities among children who are at risk of homelessness as they enter adulthood would make it more feasible to reduce the feeder pipeline from childhood poverty and homeless episodes into adult homelessness and chronic homelessness.
Chapter 6
Work History and Homelessness
OVERVIEW OF FINDINGS
Employment rates and earnings when employed are both too low to provide a path out of poverty for
most recipients. Disabilities and homelessness are strongly associated with very low employment rates.
Disabilities may compound the vulnerabilities associated with poverty, placing some recipients at
greater risk of homelessness.
EMPLOYMENT
The United States has moved increasingly toward an employment-based social safety net, where jobs
provide income, validation, and social inclusion. A defining characteristic of homelessness is acute pov-
erty, and for people who do not have family wealth or a disability offset by SSI, the only escape from
poverty is through work. Both the CalWORKs and General Relief programs place strong emphasis on re-
quiring employable recipients to work and provide services intended to help them obtain jobs. Recipi-
ents are required to report their earnings, which are verified using state payroll tax records.18 This sec-
tion examines data on earned income and homelessness, particularly differences between homeless and
nonhomeless aid recipients.
Depending on the year and individuals’ homeless status, a few General Relief recipients (2–8 percent)
and more CalWORKs recipients (16–34 percent) had earned income in months when they received cash
public assistance benefits (Figure 31).
During months for which we have consistent reports, when individuals 18 years of age or older received
benefits, 5 percent of nonhomeless General Relief recipients and 33 percent of nonhomeless CalWORKs
recipients reported earnings in a typical month, versus 3 and 18 percent, respectively, of those who ex-
perienced homelessness.
The monthly employment rate for those identified as homeless is 40 percent lower for General Relief
recipients and 45 percent lower for CalWORKs recipients than for those not identified as homeless (3.2
versus 5.4 percent and 33 versus 18 percent, respectively).
Because individuals are more likely to be employed sometime during the course of a year than they are
to be employed every month of the year, annual employment rates are roughly a third higher than the
monthly rages shown in Figure 31.
18 Anecdotal reports from professionals who work with recipients in these programs indicate that employment programs would be more effective if there were robust tracking systems for maintaining records showing how long people are able to stay in jobs and how often they come back to cash assistance after having obtained a job. This information would be valuable for identifying people who need more supportive services to stay employed.
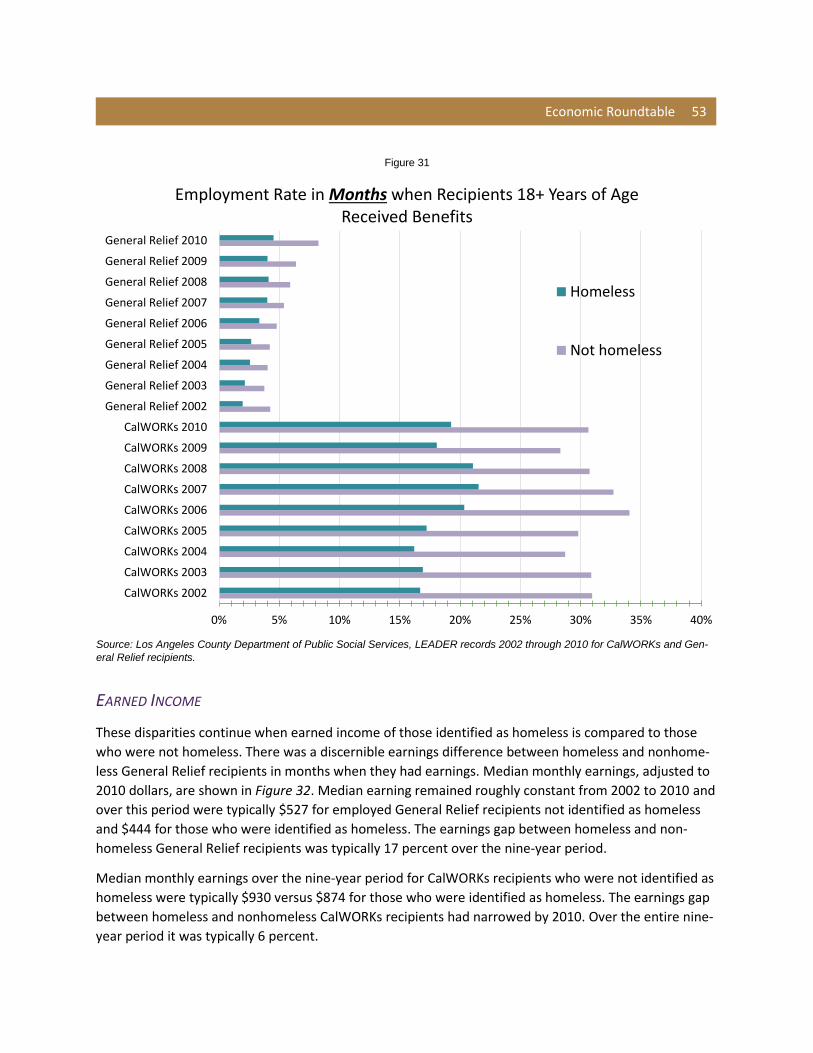
Economic Roundtable 53
EARNED INCOME
These disparities continue when earned income of those identified as homeless is compared to those
who were not homeless. There was a discernible earnings difference between homeless and nonhome-
less General Relief recipients in months when they had earnings. Median monthly earnings, adjusted to
2010 dollars, are shown in Figure 32. Median earning remained roughly constant from 2002 to 2010 and
over this period were typically $527 for employed General Relief recipients not identified as homeless
and $444 for those who were identified as homeless. The earnings gap between homeless and non-
homeless General Relief recipients was typically 17 percent over the nine-year period.
Median monthly earnings over the nine-year period for CalWORKs recipients who were not identified as
homeless were typically $930 versus $874 for those who were identified as homeless. The earnings gap
between homeless and nonhomeless CalWORKs recipients had narrowed by 2010. Over the entire nine-
year period it was typically 6 percent.
Figure 31
Source: Los Angeles County Department of Public Social Services, LEADER records 2002 through 2010 for CalWORKs and Gen-
eral Relief recipients.
0% 5% 10% 15% 20% 25% 30% 35% 40%
CalWORKs 2002
CalWORKs 2003
CalWORKs 2004
CalWORKs 2005
CalWORKs 2006
CalWORKs 2007
CalWORKs 2008
CalWORKs 2009
CalWORKs 2010
General Relief 2002
General Relief 2003
General Relief 2004
General Relief 2005
General Relief 2006
General Relief 2007
General Relief 2008
General Relief 2009
General Relief 2010
Employment Rate in Months when Recipients 18+ Years of Age Received Benefits
Homeless
Not homeless
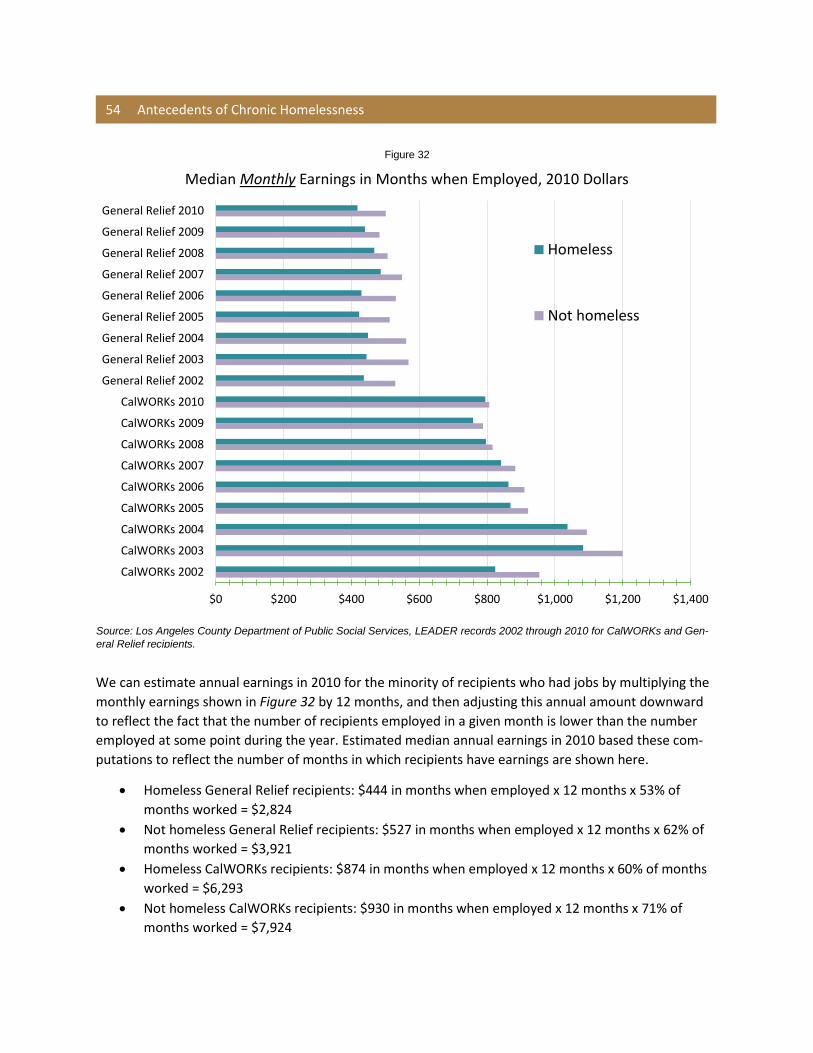
54 Antecedents of Chronic Homelessness
We can estimate annual earnings in 2010 for the minority of recipients who had jobs by multiplying the
monthly earnings shown in Figure 32 by 12 months, and then adjusting this annual amount downward
to reflect the fact that the number of recipients employed in a given month is lower than the number
employed at some point during the year. Estimated median annual earnings in 2010 based these com-
putations to reflect the number of months in which recipients have earnings are shown here.
Homeless General Relief recipients: $444 in months when employed x 12 months x 53% of
months worked = $2,824
Not homeless General Relief recipients: $527 in months when employed x 12 months x 62% of
months worked = $3,921
Homeless CalWORKs recipients: $874 in months when employed x 12 months x 60% of months
worked = $6,293
Not homeless CalWORKs recipients: $930 in months when employed x 12 months x 71% of
months worked = $7,924
Figure 32
Source: Los Angeles County Department of Public Social Services, LEADER records 2002 through 2010 for CalWORKs and Gen-
eral Relief recipients.
$0 $200 $400 $600 $800 $1,000 $1,200 $1,400
CalWORKs 2002
CalWORKs 2003
CalWORKs 2004
CalWORKs 2005
CalWORKs 2006
CalWORKs 2007
CalWORKs 2008
CalWORKs 2009
CalWORKs 2010
General Relief 2002
General Relief 2003
General Relief 2004
General Relief 2005
General Relief 2006
General Relief 2007
General Relief 2008
General Relief 2009
General Relief 2010
Median Monthly Earnings in Months when Employed, 2010 Dollars
Homeless
Not homeless
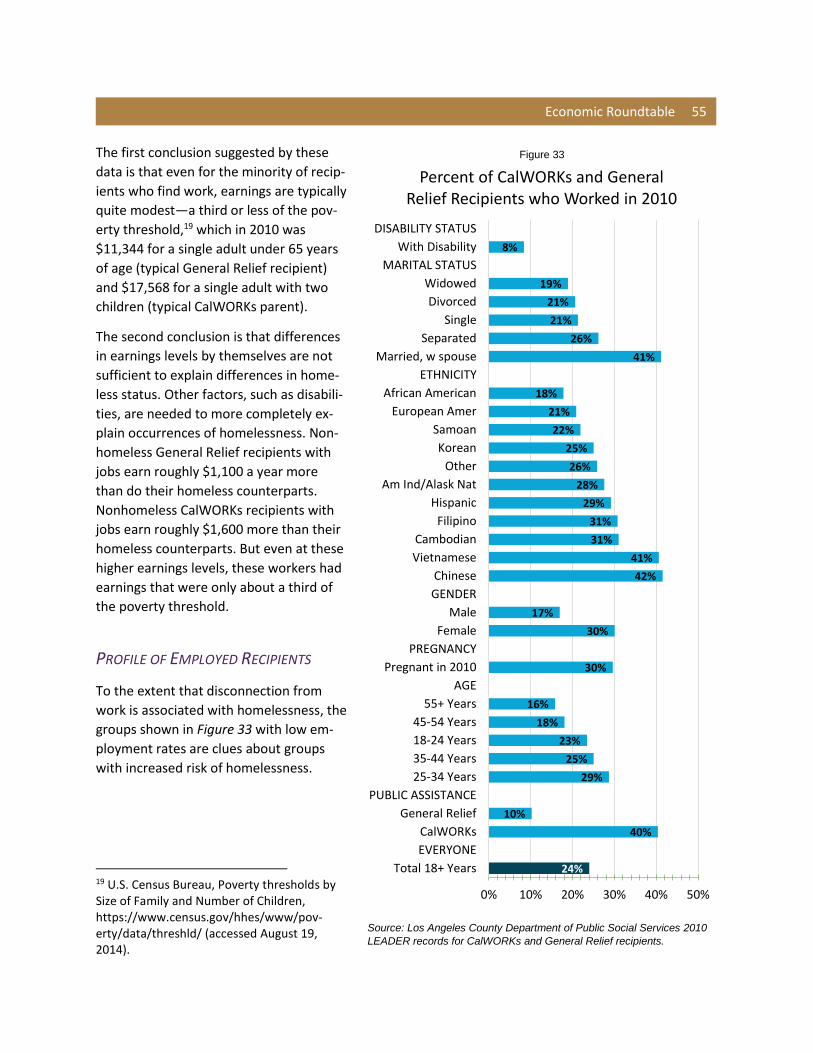
Economic Roundtable 55
The first conclusion suggested by these
data is that even for the minority of recip-
ients who find work, earnings are typically
quite modest—a third or less of the pov-
erty threshold,19 which in 2010 was
$11,344 for a single adult under 65 years
of age (typical General Relief recipient)
and $17,568 for a single adult with two
children (typical CalWORKs parent).
The second conclusion is that differences
in earnings levels by themselves are not
sufficient to explain differences in home-
less status. Other factors, such as disabili-
ties, are needed to more completely ex-
plain occurrences of homelessness. Non-
homeless General Relief recipients with
jobs earn roughly $1,100 a year more
than do their homeless counterparts.
Nonhomeless CalWORKs recipients with
jobs earn roughly $1,600 more than their
homeless counterparts. But even at these
higher earnings levels, these workers had
earnings that were only about a third of
the poverty threshold.
PROFILE OF EMPLOYED RECIPIENTS
To the extent that disconnection from
work is associated with homelessness, the
groups shown in Figure 33 with low em-
ployment rates are clues about groups
with increased risk of homelessness.
19 U.S. Census Bureau, Poverty thresholds by Size of Family and Number of Children, https://www.census.gov/hhes/www/pov-erty/data/threshld/ (accessed August 19, 2014).
Figure 33
Source: Los Angeles County Department of Public Social Services 2010
LEADER records for CalWORKs and General Relief recipients.
8%
19%
21%
21%
26%
41%
18%
21%
22%
25%
26%
28%
29%
31%
31%
41%
42%
17%
30%
30%
16%
18%
23%
25%
29%
10%
40%
24%
0% 10% 20% 30% 40% 50%
DISABILITY STATUS
With Disability
MARITAL STATUS
Widowed
Divorced
Single
Separated
Married, w spouse
ETHNICITY
African American
European Amer
Samoan
Korean
Other
Am Ind/Alask Nat
Hispanic
Filipino
Cambodian
Vietnamese
Chinese
GENDER
Male
Female
PREGNANCY
Pregnant in 2010
AGE
55+ Years
45-54 Years
18-24 Years
35-44 Years
25-34 Years
PUBLIC ASSISTANCE
General Relief
CalWORKs
EVERYONE
Total 18+ Years
Percent of CalWORKs and General Relief Recipients who Worked in 2010
56 Antecedents of Chronic Homelessness
The overall annual employment rate in 2010 for CalWORKs and General Relief recipients was 24 percent.
Groups with markedly lower employment rates were:
African Americans (18 percent)
Persons 45 years of age or older (18 percent and less)
Males (17 percent)
General Relief recipients (10 percent)
Persons with disabilities (8 percent)
Groups with markedly above-average employment rates included:
Persons of Chinese ethnicity (42 percent)
Persons of Vietnamese ethnicity (41 percent)
Married persons living with their spouse (41 percent)
CalWORKs recipients (40 percent)
SUMMARY OF EMPLOYMENT FINDINGS
1. Employment rates are too low to provide a path out of poverty for most recipients.
a. The monthly employment rate was 9 percent in 2010 for nonhomeless General Relief
recipients.
b. The monthly employment rate was 32 percent in 2010 for nonhomeless CalWORKs re-
cipients.
c. Specific groups had significantly lower rates of employment (African Americans, persons
45 years of age and older, males, and General Relief recipients).
2. Earnings are too low to provide a path out of poverty for recipients who do find employment.
a. Median monthly earnings were $501 in 2010 for employed nonhomeless General Relief
recipients.
b. Median monthly earnings were $806 in 2010 for employed nonhomeless CalWORKs re-
cipients.
3. Recipients with identified disabilities found jobs only one third as often as the overall population
of CalWORKs and General Relief recipients (8 versus 24 percent).
4. Lower employment rates and earnings levels do not account for homelessness, since nonhome-
less recipients often are not employed, and earnings for employed recipients are only about a
third of the poverty threshold. Disabilities may compound the vulnerabilities associated with
poverty, placing some recipients at greater risk of homelessness.
Chapter 7
Recommendations
The number of Los Angeles residents experiencing chronic homelessness continues to grow even after
housing over 10,000 individuals in the past three years. This tells us that the flow of individuals into
chronic homelessness is unabated—the pathways have not been closed.20 Multiple failures create these
paths into homelessness and chronic homelessness—families, schools, social services, health and mental
health care, the criminal justice system, lack of affordable housing, and a stagnant labor market; see Fig-
ure 34.
Public assistance programs are Los Angeles’s primary interface with individuals experiencing homeless-
ness, touching most of this population on a continuing basis, even though public assistance programs
pay only a quarter of public costs for all homeless persons and a twentieth of the costs for the chroni-
cally homeless with the highest public costs—the 10th decile.21
Screening
The intake and assessment process for public assistance programs does not include questions about
whether children have disabilities. Often problems are identified after they have grown into chronic dis-
abilities rather than when individuals are assessed for public assistance or when problems first emerge.
This is particularly the case for CalWORKs children with all types of disabilities and for both CalWORKs
and General Relief adults experiencing mental health problems.
Recommendations:
1. Modify the intake process for CalWORKs to include questions about whether children have
special needs.
2. Modify the intake process for both CalWORKs and General Relief to include questions about
whether adults need behavioral health services. Examples of questions for seeking this type
of information range from those developed by the Centers for Disease Control and Preven-
tion to those used by the American Community Survey.22
20 United Way reports that its partners in the Home for Good initiative housed 14,249 individuals from 2011 through 2013, http://www.unitedwayla.org/home-for-good/our-progress/. The annual homeless count conducted by the Los Angeles Homeless Services Authority showed 13,613 chronically homeless residents in 2013, up from 10,901 in 2011, and 10,245 in 2009, http://www.lahsa.org/homelesscount_results.asp.
21 In an earlier report we estimated that Los Angeles County’s Department of Public Social Services pays 28 percent of all public outlays for all homeless adults and 5 percent of outlays for individuals in the 10th decile. Where We Sleep (2009), pp. 20, 121, www.economicrt.org.
22 Module 17 of the Centers for Disease Control and Prevention’s Behavioral Risk Factor Surveillance System Ques-tionnaire includes questions about mental illness, http://www.cdc.gov/brfss/questionnaires/pdf-ques/2012_BRFSS.pdf; questions 17 and 18 of the ACS ask about mental disabilities, http://www.cen-sus.gov/acs/www/Downloads/questionnaires/2014/Quest14.pdf.
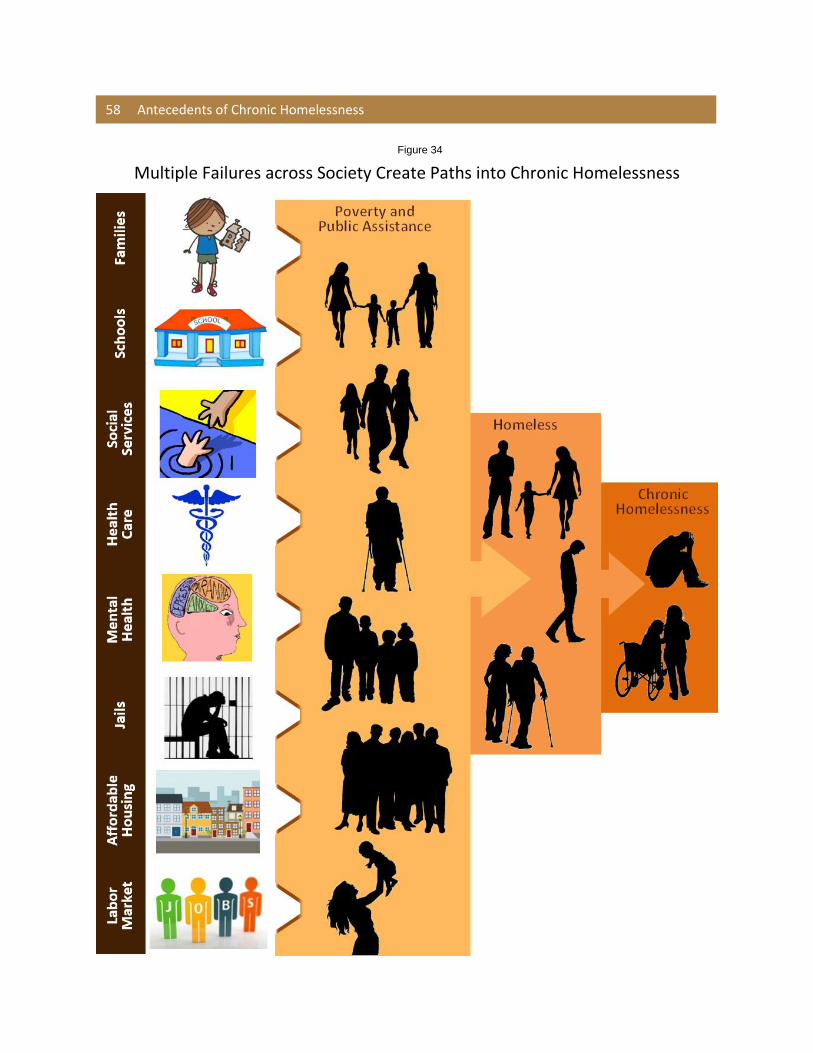
58 Antecedents of Chronic Homelessness
Figure 34
Multiple Failures across Society Create Paths into Chronic Homelessness
Economic Roundtable 59
Tripwires
Public assistance programs by themselves have a limited capacity for providing health and mental health
services. However they are the best positioned public programs for serving as tripwires for flagging risks
and occurrences of homelessness. Tripwire events include:
1. Homelessness
2. Prolonged or repeated episodes of homelessness
3. Homeless children
4. Domestic violence
5. Children who are not attending school regularly
6. Long-term unemployed adults
Recommendation:
Public assistance programs should quickly open the door to integrated public and private heath,
mental health, housing, and case management services for individuals and families that experi-
ence any of the tripwire events that indicate risk of recurring or prolonged homelessness.
Breaking Down Silos
The combined human service resources of health, mental health, justice system, housing, social service, and educational agencies are required to close paths into homelessness and restore a place in the com-munity for individuals who have experienced homelessness. Public assistance programs can be a catalyst for connecting at-risk and homeless recipients with crucial services and reducing massive public costs for chronic homelessness. This requires growing beyond the role of siloed eligibility determination pro-grams to expeditiously and reliably providing crucial linkage services. Recommendations: When any tripwire event occurs:
1. Immediately reassess the case 2. Immediately notifying appropriate service about the tripwire event and assessment results. 3. Facilitating access and rapid face-to-face engagement of recipients needing services with
appropriate service providers. 4. This strategy of rapid engagement with needed services should be facilitated by co-locating
mental health services in public assistance offices.
Timely Services for At-risk Individuals
Mental health, substance abuse, and other needed behavioral health services should be made accessible to all individuals who need them. Among CalWORKs recipients, the primary group with access to these services is welfare-to-work participants; among General Relief recipients, the primary groups with ac-cess are recipients who are employed or SSI-eligible. Access to services that can prevent, stabilize, or re-verse disabilities and prevent movement into chronic homelessness should be readily available to all
60 Antecedents of Chronic Homelessness
public assistance recipients. Access to services is especially important for children and transition age youth.
Recommendations:
Facilitate access to the following services for children, adults, and families that experience any tripwire event:
1. Home visits by a public health nurse for any family with children. 2. Mental health services. 3. Substance abuse rehabilitation services.
Recipient Education
Anecdotal information indicates that families are reluctant to interact with children’s services workers
or probation officers because of concern that this may result in individuals being removed from the
home. Medical, mental health, and rehabilitation services are more likely to be accepted by recipients,
and wide availability and use of these services can have a crucial effect on preventing chronic homeless-
ness.
Recommendation:
Initiate an extensive recipient education campaign to win the trust of participants in the services
that are offered to them. It is important that these services not be experienced as intrusive or
sanctioning.
Chapter 8
Department of Public Social Service Research Review Panel
Comments and Recommendations
REFERENCE AREA OF CONCERN COMMENTS/RECOMMENDATIONS
Page 1, 5th paragraph
“…nine years of public assistance records for 8,969,289 residents who received some form of assistance from 2002-2010…”
DPSS recommends the inclusion of a methods section in the report. It is unclear in this section, and for most of the analyses, when new records for each year are being presented and when a co-hort is being analyzed over time.
Economic Roundtable response:
This information is provided in the body of the report. The purpose of the executive summary is to provide a succinct overview of the report without going into this level of detail.
Page 1, 1st paragraph, 3rd sentence
“Multiple failures create these paths into homelessness and chronic homelessness—families, schools, social services, health and mental health care, the criminal jus-tice system, lack of affordable housing, and stagnant labor market. “
This statement seems to rely on speculation in-stead of a solid analysis of the impact of each mentioned factors on homelessness and chronic homelessness. Although we agree that public agencies are an important source of contact with the homeless, the report should not rely on a conclusion based on just the association between homelessness and public agencies without a rig-orous analysis to support that conclusion.
Economic Roundtable response:
This assessment is supported by a large body of research carried out by the Economic Roundtable as well as by the work of many other researchers.
Page 2, De-mographic Findings
“13,000 public assistance recipients newly identified as homeless.”
It is unclear who these 13,000 recipients are. Using “public assistance recipients” can mean recipients of different County, State or Federal public assistance. There is also concern about duplication for each month.
Please clarify if these recipients are DPSS appli-cants/ participants only or if the researchers are referring to multiple types of public assistance (e.g., mental health). Because this number is be-ing reported on the executive summary, it would be very helpful to report which public assistance program data sources were used to arrive at the 13,000 number stated in the report. The report needs to show that the number reported does not contain duplication, or if it does, to state this limitation.
Economic Roundtable response:
This information is provided in the body of the report. The purpose of the executive summary is to provide a succinct overview of the report without going into this level of detail.
62 Antecedents of Chronic Homelessness
REFERENCE AREA OF CONCERN COMMENTS/RECOMMENDATIONS
Page 2, Findings about Disa-bilities
“Fewer than one in 10 children with dis-abilities are identified.”
How was this number calculated? What is the denominator?
Economic Roundtable response:
This information is provided in the body of the report.
Page 11, Study Back-ground, 2nd sentence
The report states that it provides the first results of analyzing homeless dy-namics in public assistance records, quarterly wage records, and health, mental health, child welfare, justice sys-tem and education records for individu-als who received any type of public as-sistance records. However, the data sources presented throughout the re-port are derived from LEADER data alone. The report can be misinterpreted by the reader to be inclusive of other sources of data from other public agen-cies.
In order to support this statement made about the study, please include data from the other sources that are mentioned (e.g., health and mental health, child welfare, justice system, and education records) to provide a clear and balanced report on the dynamics of the home-less population in public records.
Economic Roundtable response:
This information is provided on page 12.
Page 11, Figure 2
There is no thorough interpretation of the graph and no discussion of its rele-vance to the section.
DPSS recommends the inclusion of a thorough interpretation of the graph.
Economic Roundtable response:
The graph shows the growing share of the public assistance caseload with a homeless flag in their record. It is part of a four-page discussion about the reliability of the homeless flag and methods for using the flag as an indicator of homelessness.
Page 11, Public As-sistance Records and Home-lessness, 2nd sen-tence; Page 23,
The report omits operational definitions of key measures, such as “spells of homelessness.”
The use of the homeless flag in LEADER to identify homelessness is not an accu-rate method of counting the number of homeless individuals at one time. The flag is reliant on LEADER users to update
The use of the homeless flag makes the validity of the report’s findings questionable. DPSS does not use this flag to count homeless in any internal documents because of its unreliability. The flag causes an overstatement of homeless participants because it is not removed or up-dated in real time. Instead, DPSS uses the resi-dential address, either a shelter or DPSS office
Economic Roundtable 63
REFERENCE AREA OF CONCERN COMMENTS/RECOMMENDATIONS
Homeless-ness; and Figure 2, Figure 3 and Figure 16.
the flags. This has a significant impact in the entire study that used homeless flag to identify homeless participants.
address, to count the homeless. DPSS recom-mends that the authors use the residential ad-dress to describe how homeless spells are cal-culated and to revise its descriptive information on the homeless throughout the report.
Economic Roundtable response:
We reviewed the effect of using DPSS’ method of counting recipients who use a DPSS office ad-dress as their mailing address as homeless and found that it identified homelessness among only about half of the recipients who have homeless flags in their records. Our conclusion is that homeless flags are the most complete indicator of the entire population of public assistance recip-ients who have experienced homelessness. However, as stated in chapter 2, homeless flags ap-pear to sometimes remain in records after homeless episodes end, thus sometimes overstating the duration of homelessness. DPSS office addresses in recipient records appear to be the most accurate indicator of the duration of homelessness. The complete results of our review of the two methods for identifying homeless recipients follow this section with DPSS comments.
Page 11, Public As-sistance Record and Homeless-ness, 3rd sentence.
The report assumes that the homeless served by DPSS may either have mail sent to a given address, or if there is no fixed address, then the mail must be re-ceived at the DPSS district office. How-ever, this statement is not accurate be-cause the applicant/participant may have mail sent to an alternative address.
DPSS recommends that the report more care-fully describe mailing options available to homeless applicants/ participants.
Economic Roundtable response:
Language has been added to the report to include the possibility of an alternative address.
Page 11, Public As-sistance Records and Home-lessness
The sentence that states “Among other reasons, the flag tells case workers if they can send mail to a client’s home ad-dress, or if instead the client has no fixed address and will need to receive mail at the DPSS office” is flawed be-cause it implies that the flag dictates where the homeless family receives his or her mail.
DPSS recommends removing this sentence be-cause it is misleading.
Economic Roundtable response:
Language indicating that the homeless flag dictates where mail is received has been removed.
64 Antecedents of Chronic Homelessness
REFERENCE AREA OF CONCERN COMMENTS/RECOMMENDATIONS
Page 11, Public As-sistance Records, last sen-tence and
“Additional benefits are available to Cal-WORKs and General Relief recipients who are homeless or at immediate risk of homelessness.” Footnote, #4, in rela-tion to this statement, does not mention additional benefits available to Welfare-
DPSS recommends that the report include evic-tion prevention and rental subsidy services for CalWORKs Welfare-to-Work participants to ac-curately depict DPSS programs for homeless and at-risk families.
footnote #8
to-Work participants for eviction pre-vention and rental subsidy within Cal-WORKs.
Economic Roundtable response:
DPSS documents describing programs related to homelessness are provided following this table.
Page 12, Footnote #10
The last part of the footnote states, “and/or received a notice to pay rent or quit.” Although this definition is recog-nized as homeless by the State’s home-less definition, families who receive a notice to pay rent or quit are not tracked as homeless by DPSS.
DPSS recommends that the report include a dis-tinction between being homeless or at-risk of homelessness by the State’s and DPSS’ defini-tions. Applicants/participants who are at-risk of homelessness are not tracked as homeless by DPSS. The authors must remove this phrase to accurately depict DPSS’ definition of homeless-ness.
Economic Roundtable response:
This information is about eligibility for homeless assistance rather than tracking homeless recipi-ents.
Page 13, 4th para-graph: five dynamic categories.
The definitions of the five categories are confusing. There are multiple layers of descriptions for some of the categories that create confusion.
DPSS recommends that a matrix be created to breakdown the characteristics of each category. The last four categories (as they were listed) all contain the characteristics of being “in a 36-month interval when they experience four or more episodes of homelessness.” This can be stated as a standard for the four categories to consolidate the information.
Economic Roundtable response:
The text accompanying Figure 4 on pages 14-15 explains each category of homelessness.
Page 15, Figure 6 and Page 18, Figure 7
Presentation of the data on the graph is not ideal. The narration in the study and comparison groups on ethnicities is ex-pressed as a percentage of each cate-gory, not in actual numbers.
DPSS recommends using percentage for the graphs on Figure 5 and 6 instead of actual num-bers, or to change the text into actual numbers for consistency. It is also suggested to combine the two graphs into a single graph to show the
Economic Roundtable 65
REFERENCE AREA OF CONCERN COMMENTS/RECOMMENDATIONS
differences.
Economic Roundtable response:
This recommendation is helpful, however we believe it is useful to show the number of homeless individuals in each group. The number in groups is discussed before comparing percentages.
Page 17, Selection Criteria
The selection criteria for the study and comparison groups are not clearly de-fined. It is also unclear what type of ser-vices the comparison group received.
DPSS recommends the inclusion of the criteria used to select the study and comparison groups. In addition, the services that the com-parison group received need to be discussed to understand the impact of homelessness on the study and comparison groups.
Economic Roundtable response:
Selection criteria are described in detail on pages 17 to 18.
Page 18, sentence 1
This concluding statement about the ef-fects of homelessness in young women of all ethnicities is not drawn from the data. African Americans were previously discussed to be overrepresented in the study group, but no mention of other ethnicities.
DPSS recommends the inclusion of details about how other ethnicities are over-repre-sented to support this statement. If not, DPSS recommends eliminating the statement as it is unfounded.
Economic Roundtable response:
This statement about the long-lasting and destabilizing effects of homelessness is supported by the report findings.
Page 19, Figure 8
There is concern about the data for the “no benefits” category.
DPSS recommends the inclusion of the source of the “no benefits” data.
Economic Roundtable response:
This information is derived from LEADER records and the Person Aid code.
Page 21 and throughout
“Rate” and “percentage” are used inter-changeably, but they are not the same thing.
DPSS recommends changing the word “rate” to “percent” as appropriate.
Economic Roundtable response:
Our review did not identify any inaccurate use of these terms.
Page 21, 8th para-graph
Some conclusions seem over-reaching. “This may indicate a weaker social safety net for single adult males…”
DPSS recommends that you consider alterna-tive reasoning such as that the safety net is more substantial when children are involved
66 Antecedents of Chronic Homelessness
REFERENCE AREA OF CONCERN COMMENTS/RECOMMENDATIONS
(i.e., CalWORKs). Also, such a conclusion may depend on the “dose” or types of services the single men received, information that is not considered.
Economic Roundtable response:
The suggested language that “the safety net is more substantial when children are involved” seems to make the same point – that the social safety net is weaker for single adults.
Page 22, 1st paragraph
The following statement is confusing and the conclusion is unclear: “For all groups, the monthly employment rate, which is not shown, was only about half as high as the annual employment rate shown in Figure 9.”
DPSS recommends a revision of this statement to provide clarity on what this sentence means and what groups are being referred to.
Economic Roundtable response:
Workers who find intermittent employment are more likely to have a job sometime during a given year than sometime during a given month.
Page 22, Figure 10
Graph presentation To facilitate interpretation, DPSS suggests using different color bars for females and males.
Economic Roundtable response:
The point of the chart is to show differences between the study groups and the comparison groups, rather than between males and females.
Page 23, Figure 11 and other graphs
Is the use of “Euro-American” an ac-cepted convention for “White” or “Cau-casian”?
If “Euro-American” is the same as white, DPSS recommends the use the more conventional term.
Economic Roundtable response:
Yes, European-American is accepted terminology and is consistent with the APA style manual.
Page 23, Figure 11
An interesting finding not addressed in the study is that Whites were the least likely to have earned income in three out of five groups.
DPSS recommends that address this finding if you are drawing conclusions about other groups from these charts.
Economic Roundtable response:
We agree that this is an interesting finding. It is true for the Homeless Teen and Teen Mother study groups, but not for the Young Adult study group.
Economic Roundtable 67
REFERENCE AREA OF CONCERN COMMENTS/RECOMMENDATIONS
Page 24, 1st sen-tence
The conclusion that more financial assis-tance and supportive services for high-need individuals are associated with higher levels of employment lacks sup-port and is an assumption, not a finding.
First, DPSS recommends defining what “high-need individuals” mean. Is it just teen mothers? What makes them high-need? Second, there is no empirical basis for this conclusion because it only considers one observation, employment rate, and it does not control for other variables leading to higher levels of employment for teen mothers.
Economic Roundtable response:
The conclusion that more financial assistance and supportive services are associated with higher levels of employment is accurate. We do not present sufficient evidence to assert that one causes the other, but we do present sufficient evidence to assert that they are associated. The criteria that identify these individuals as “high need” are listed at the beginning of the chapter.
Page 25, 6th para-graph, last sentence
The conclusion doesn’t take into ac-count that identifying disabilities is diffi-cult and problematic because people may not want to self-report or may have existing undiagnosed or misdiagnosed disabilities in the beginning of the study. This makes the conclusion inaccurate.
The report needs to address this limitation of identifying disabilities in public assistance recip-ients within the study. Also, it is recommended that you qualify or eliminate the conclusion that low levels of assistance are associated with proliferation of disabilities because it is not based on empirical findings.
Economic Roundtable response:
We agree that more complete identification of disabilities will require more effort. Our findings support the conclusion that unaddressed problems and low levels of aid are associated with disa-bilities. It follows from this that there is an urgent need to identify disabilities earlier and more comprehensively, and to use all available services to address these life altering problems.
Page 31, Figure 16
It is unclear whether the number of homeless reported is the number of households or individuals.
The graph needs to clarify whether the number reported is for homeless persons or for home-less households/cases. This information may be compared to other sources of data reported by different agencies.
Economic Roundtable response:
The number is for individuals, as indicated by the title and the source note.
Page 34, 2nd para-graph
There is a discrepancy between the per-centage of homeless children ages 0-17 in the paragraph and in the bullet point.
DPSS recommends the verification of this infor-mation.
Economic Roundtable response:
The discrepancy has been corrected to show that children make up 49% of homeless recipients.
68 Antecedents of Chronic Homelessness
REFERENCE AREA OF CONCERN COMMENTS/RECOMMENDATIONS
Page 44, 3rd and 4th paragraphs
Stating that disabilities are associated with higher rates of homelessness and chronic homelessness using the home-less flag in LEADER makes this portion of the study unreliable.
Although there is a logical connection between homelessness and disability, the possibility that disabilities are more prevalent among the homeless is unknown in public assistance par-ticipants. DPSS recommends providing empiri-cal evidence for this conclusion or remove the statement.
Economic Roundtable response:
Our assessment is that the homeless flag is an accurate indicator of episodes of homelessness, and that the data accurately indicates that disabilities are associated with higher rates of home-less episodes.
Page 47, 2nd para-graph
The recommendation offered seems out of place and not directly related to the discussion of disabilities in public assis-tance participants.
The discussion in this section focused on how much higher reported disabilities are for indi-viduals and children who experienced home-lessness compared to those who did not. There is no discussion supporting the idea that ad-dressing disabilities in children who experi-enced homelessness is likely to result in signifi-cant reduction of adult homelessness or chronic homelessness. Please present evidence and precisely describe the basis for this recom-mendation.
Economic Roundtable response:
Findings in this report show a strong link between disabilities and homelessness. It is reasonable to conclude that early help with, for example, mental disabilities will help children develop and acquire adult competencies more successfully.
Page 57, Screening
The recommendation regarding modify-ing the CalWORKs intake process to in-clude questions regarding children’s po-tential special needs and whether adults need behavioral health services implies that the CalWORKs intake process does not take these into consideration.
DPSS recommends that you discuss what DPSS is currently doing to address these issues. For example, the Department is already working to develop a Family Stabilization screening tool to be used during a CalWORKs participant’s GAIN appraisal appointment. This screening tool aims to identify barriers to CalWORKs participant’s ability to get employment before the partici-pant is assigned to a Welfare-to-Work activity.
Economic Roundtable response:
All of the supporting documents provided by DPSS are included in in the last section of this chap-ter. With support from other departments, DPSS can do much more to identify vulnerabilities
Economic Roundtable 69
REFERENCE AREA OF CONCERN COMMENTS/RECOMMENDATIONS
among recipients that contribute to homelessness.
Page 57, Screening
The recommendation is not based on relevant analyses of DPSS screening tools.
With very few exceptions, the content of DPSS data is based on what is required by law to de-termine eligibility and operate our programs. There are many pieces of information that would be good to know but are not necessary for DPSS. The report’s focus on identifying chil-dren with disabilities is a good example. DPSS
does not capture this information about chil-dren because we do not administer any pro-grams for disabled children.
Economic Roundtable response:
We are recommending a change in county and DPSS policy to address crucial needs of children.
Page 59, Tripwires
The report implies that public assistance programs do not have any policies for in-tegrating mental health, housing, and case management services for individu-als and families that experience tripwire events. However, DPSS has existing poli-cies regarding referrals to specific agen-cies related to tripwire events (e.g., housing programs/ services, domestic vi-olence, substance abuse).
DPSS recommends the inclusion of existing poli-cies related to the tripwire events mentioned in the report.
Economic Roundtable response:
All of the supporting documents provided by DPSS are included in this chapter. We stand by our conclusion that much more extensive and effective efforts are needed.
Page 59, Breaking down the Silos
This recommendation is not based on a process analysis of administration of public assistance programs and appears to come from out of the blue.
DPSS recommends that you base your recom-mendations on findings included in the report.
Economic Roundtable response:
All of the supporting documents provided by DPSS are included in this chapter.
Through-out the re-port
Charts and conclusions are difficult to in-terpret without knowing the number of cases involved in the analyses.
DPSS recommends that you indicate the total number of individuals referred to, where ap-propriate.
Economic Roundtable response:
70 Antecedents of Chronic Homelessness
REFERENCE AREA OF CONCERN COMMENTS/RECOMMENDATIONS
The report provides information about the size of each group that is discussed.
General comment
Individuals in DPSS data are clustered by case. Some cases have several individu-als and others have one person. More importantly, not every person listed in a case receives public assistance.
DPSS recommends the inclusion of a discussion about cases by program and how the research-ers determined who in the case is on public as-sistance and who among those is homeless. CalWORKs child-only cases are a good example. Also, include a description of the thousands of homeless families served by DPSS.
Economic Roundtable response:
Homeless flags in person-level records identified homeless episodes. The Person Aid code was the primary source of information about whether and what type of benefits were received.
General comment
The findings in the study may or may not be unique to the United States.
Have similar findings have been observed in other countries?
Economic Roundtable response:
The purpose of this report is to provide evidence-based recommendations for addressing and pre-venting homelessness in Los Angeles County.
Economic Roundtable 71
COMPARISON OF METHODS FOR IDENTIFYING HOMELESS RECIPIENTS
The central recommendation in this report is that the Department of Public Social Services (DPSS) use its
extensive interface with individuals experiencing homelessness to identify tripwire events that indicate
increased future risk of homelessness, such as homelessness among children, and summon help from
appropriate service providers such as visiting nurses and mental health service providers. This mission
will be carried out most effectively by using the most inclusive and comprehensive information available
to identify recipients who have experienced homelessness.
In response to the recommendations provided by DPSS, the Economic Roundtable reviewed the results
from using two alternative methods to identify homeless recipients. The first method is the one used in
this report - the homeless flag that is entered into recipient records when public assistance recipients
declare to DPSS staff that they are homeless. The alternative methodology, used by DPSS, is to count
recipients as homeless when they use a DPSS office address as their mailing address.
Public Assistance Guidelines
When public assistance recipients declare that they are homeless, a flag for this housing status is en-
tered in their case record. The mailing address that the recipient provides can be the address of a friend
or relative, a service provider, or if the individual does not provide a mailing address, the DPSS district
office is used as the mailing address.
This provides two options for identifying recipients who have experienced or are experiencing homeless-
ness – the homeless flag or use of a DPSS office as a mailing address.
Reliability of Homeless Indicators
Ninety-eight percent of recipients using a DPSS office address have a homeless flag in their record, as
shown in Figure 35.
The two indicators validate each other as accurate identifiers of homelessness. Individuals using a DPSS
office address do indeed appear to be homeless because in nearly all cases there is also a homeless flag
in their record.
Frequency of Homeless Indicators
Only about half of recipients with a homeless flag in their record also have a DPSS office as their mailing
address, as shown in Figure 36.
Among General Relief recipients, the percent using a DPSS office as their mailing address comes close to
the percent with a homeless flag (51 percent vs. 65 percent). The share of recipients with a homeless
flag who use a DPSS office address is substantially lower for other aid programs and recipient groups.
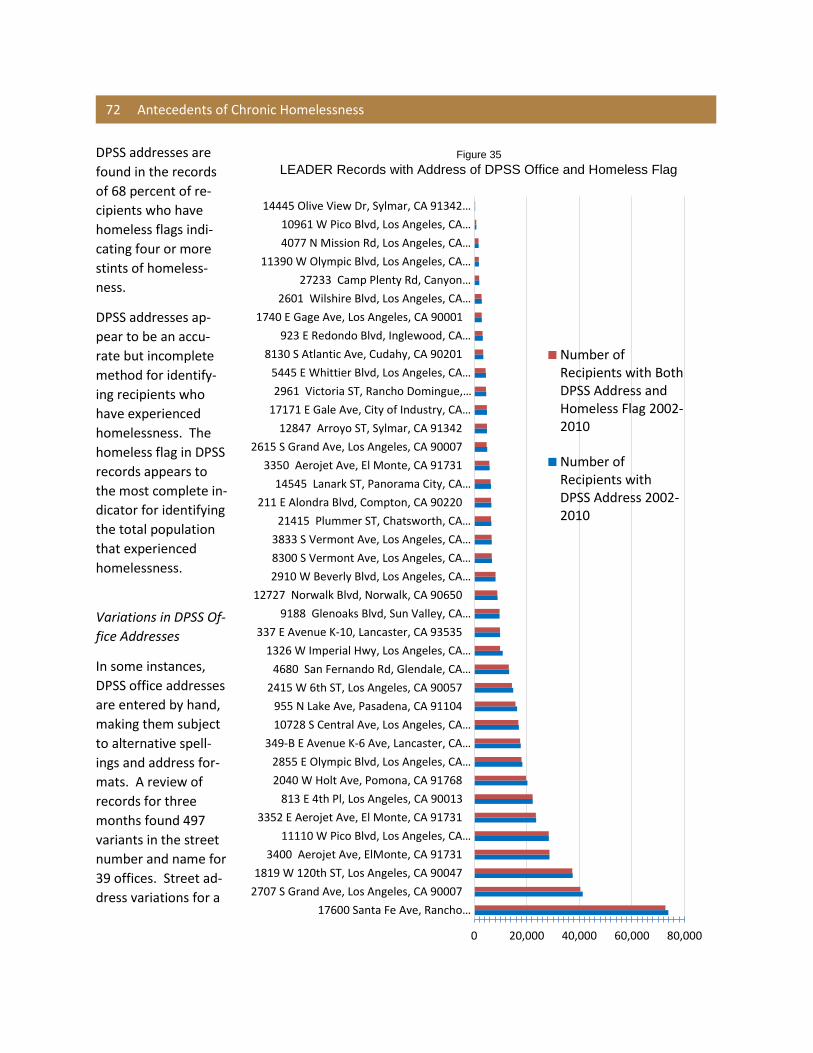
72 Antecedents of Chronic Homelessness
DPSS addresses are
found in the records
of 68 percent of re-
cipients who have
homeless flags indi-
cating four or more
stints of homeless-
ness.
DPSS addresses ap-
pear to be an accu-
rate but incomplete
method for identify-
ing recipients who
have experienced
homelessness. The
homeless flag in DPSS
records appears to
the most complete in-
dicator for identifying
the total population
that experienced
homelessness.
Variations in DPSS Of-
fice Addresses
In some instances,
DPSS office addresses
are entered by hand,
making them subject
to alternative spell-
ings and address for-
mats. A review of
records for three
months found 497
variants in the street
number and name for
39 offices. Street ad-
dress variations for a
Figure 35
LEADER Records with Address of DPSS Office and Homeless Flag
0 20,000 40,000 60,000 80,000
17600 Santa Fe Ave, Rancho…
2707 S Grand Ave, Los Angeles, CA 90007
1819 W 120th ST, Los Angeles, CA 90047
3400 Aerojet Ave, ElMonte, CA 91731
11110 W Pico Blvd, Los Angeles, CA…
3352 E Aerojet Ave, El Monte, CA 91731
813 E 4th Pl, Los Angeles, CA 90013
2040 W Holt Ave, Pomona, CA 91768
2855 E Olympic Blvd, Los Angeles, CA…
349-B E Avenue K-6 Ave, Lancaster, CA…
10728 S Central Ave, Los Angeles, CA…
955 N Lake Ave, Pasadena, CA 91104
2415 W 6th ST, Los Angeles, CA 90057
4680 San Fernando Rd, Glendale, CA…
1326 W Imperial Hwy, Los Angeles, CA…
337 E Avenue K-10, Lancaster, CA 93535
9188 Glenoaks Blvd, Sun Valley, CA…
12727 Norwalk Blvd, Norwalk, CA 90650
2910 W Beverly Blvd, Los Angeles, CA…
8300 S Vermont Ave, Los Angeles, CA…
3833 S Vermont Ave, Los Angeles, CA…
21415 Plummer ST, Chatsworth, CA…
211 E Alondra Blvd, Compton, CA 90220
14545 Lanark ST, Panorama City, CA…
3350 Aerojet Ave, El Monte, CA 91731
2615 S Grand Ave, Los Angeles, CA 90007
12847 Arroyo ST, Sylmar, CA 91342
17171 E Gale Ave, City of Industry, CA…
2961 Victoria ST, Rancho Domingue,…
5445 E Whittier Blvd, Los Angeles, CA…
8130 S Atlantic Ave, Cudahy, CA 90201
923 E Redondo Blvd, Inglewood, CA…
1740 E Gage Ave, Los Angeles, CA 90001
2601 Wilshire Blvd, Los Angeles, CA…
27233 Camp Plenty Rd, Canyon…
11390 W Olympic Blvd, Los Angeles, CA…
4077 N Mission Rd, Los Angeles, CA…
10961 W Pico Blvd, Los Angeles, CA…
14445 Olive View Dr, Sylmar, CA 91342…
Number ofRecipients with BothDPSS Address andHomeless Flag 2002-2010
Number ofRecipients withDPSS Address 2002-2010
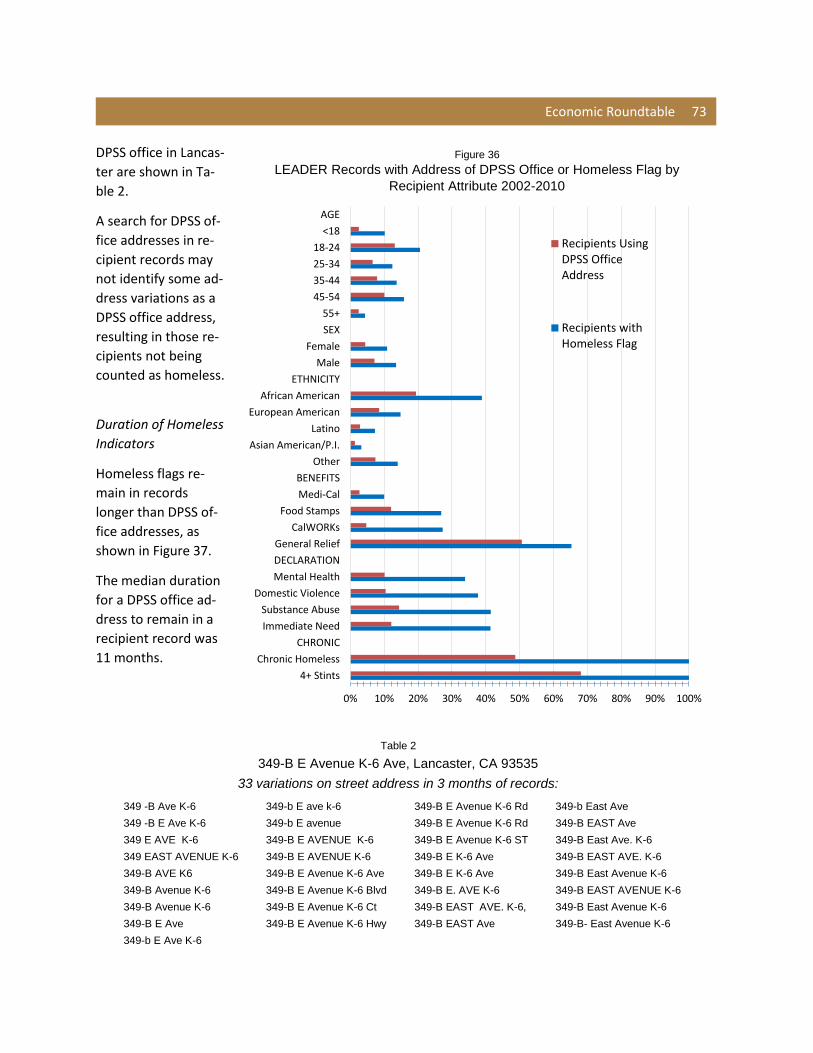
Economic Roundtable 73
DPSS office in Lancas-
ter are shown in Ta-
ble 2.
A search for DPSS of-
fice addresses in re-
cipient records may
not identify some ad-
dress variations as a
DPSS office address,
resulting in those re-
cipients not being
counted as homeless.
Duration of Homeless
Indicators
Homeless flags re-
main in records
longer than DPSS of-
fice addresses, as
shown in Figure 37.
The median duration
for a DPSS office ad-
dress to remain in a
recipient record was
11 months.
Figure 36
LEADER Records with Address of DPSS Office or Homeless Flag by
Recipient Attribute 2002-2010
0% 10% 20% 30% 40% 50% 60% 70% 80% 90% 100%
4+ Stints
Chronic Homeless
CHRONIC
Immediate Need
Substance Abuse
Domestic Violence
Mental Health
DECLARATION
General Relief
CalWORKs
Food Stamps
Medi-Cal
BENEFITS
Other
Asian American/P.I.
Latino
European American
African American
ETHNICITY
Male
Female
SEX
55+
45-54
35-44
25-34
18-24
<18
AGE
Recipients UsingDPSS OfficeAddress
Recipients withHomeless Flag
Table 2
349-B E Avenue K-6 Ave, Lancaster, CA 93535
33 variations on street address in 3 months of records:
349 -B Ave K-6 349-b E ave k-6 349-B E Avenue K-6 Rd 349-b East Ave
349 -B E Ave K-6 349-b E avenue 349-B E Avenue K-6 Rd 349-B EAST Ave
349 E AVE K-6 349-B E AVENUE K-6 349-B E Avenue K-6 ST 349-B East Ave. K-6
349 EAST AVENUE K-6 349-B E AVENUE K-6 349-B E K-6 Ave 349-B EAST AVE. K-6
349-B AVE K6 349-B E Avenue K-6 Ave 349-B E K-6 Ave 349-B East Avenue K-6
349-B Avenue K-6 349-B E Avenue K-6 Blvd 349-B E. AVE K-6 349-B EAST AVENUE K-6
349-B Avenue K-6 349-B E Avenue K-6 Ct 349-B EAST AVE. K-6, 349-B East Avenue K-6
349-B E Ave 349-B E Avenue K-6 Hwy 349-B EAST Ave 349-B- East Avenue K-6
349-b E Ave K-6
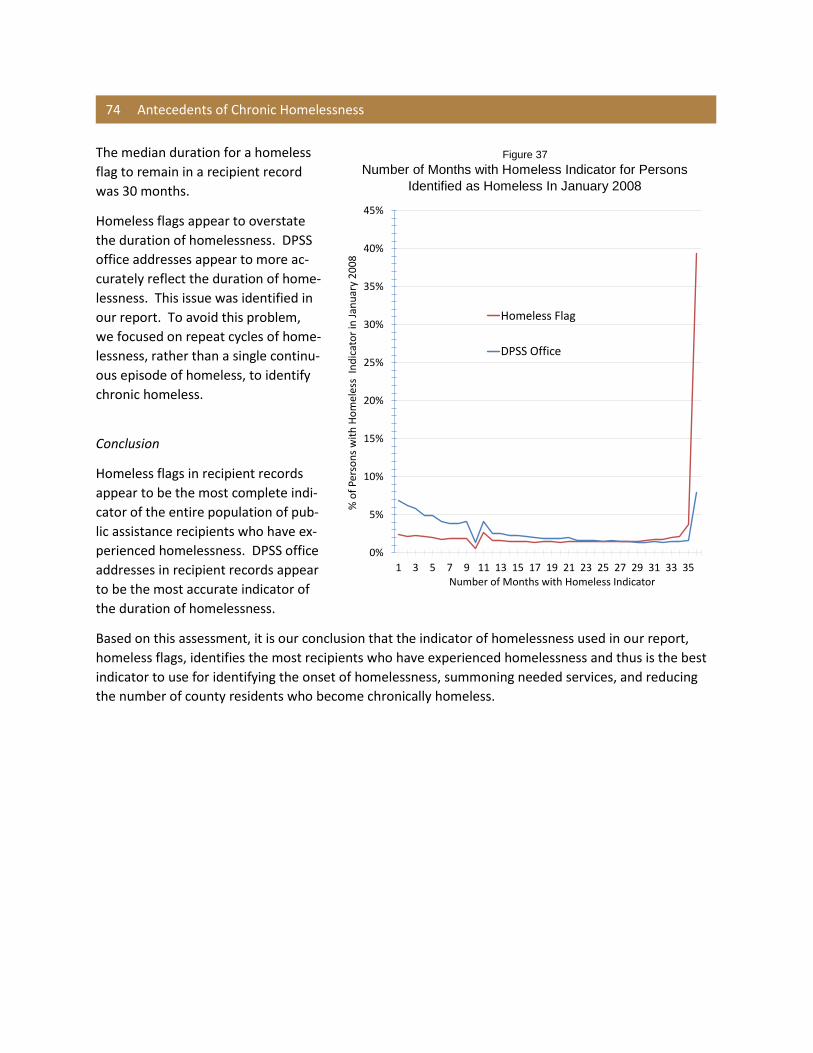
74 Antecedents of Chronic Homelessness
The median duration for a homeless
flag to remain in a recipient record
was 30 months.
Homeless flags appear to overstate
the duration of homelessness. DPSS
office addresses appear to more ac-
curately reflect the duration of home-
lessness. This issue was identified in
our report. To avoid this problem,
we focused on repeat cycles of home-
lessness, rather than a single continu-
ous episode of homeless, to identify
chronic homeless.
Conclusion
Homeless flags in recipient records
appear to be the most complete indi-
cator of the entire population of pub-
lic assistance recipients who have ex-
perienced homelessness. DPSS office
addresses in recipient records appear
to be the most accurate indicator of
the duration of homelessness.
Based on this assessment, it is our conclusion that the indicator of homelessness used in our report,
homeless flags, identifies the most recipients who have experienced homelessness and thus is the best
indicator to use for identifying the onset of homelessness, summoning needed services, and reducing
the number of county residents who become chronically homeless.
Figure 37
Number of Months with Homeless Indicator for Persons
Identified as Homeless In January 2008
0%
5%
10%
15%
20%
25%
30%
35%
40%
45%
1 3 5 7 9 11 13 15 17 19 21 23 25 27 29 31 33 35
% o
f Pe
rso
ns
wit
h H
om
eles
s In
dic
ato
r in
Jan
uar
y 2
00
8
Number of Months with Homeless Indicator
Homeless Flag
DPSS Office
Economic Roundtable 75
INFORMATION ABOUT DEPARTMENT OF PUBLIC SOCIAL SERVICES PROGRAMS TO ASSIST HOMELESS
RECIPIENTS
Supporting documents about domestic violence services and homeless assistance programs provided by
the Department of Public Social Services are listed below and shown on the following pages.
1. District Access Team Fact Sheet
2. DPSS Office List
3. Emergency Assistance to Prevent Eviction (EAPE) Program Fact Sheet
4. Homeless Assistance (HA) Program Fact Sheet
5. Homeless Case Management (HCM) for CalWORKs Families Fact Sheet
6. Moving Assistance (MA) Program Fact Sheet
7. 4-Month Rental Assistance (RA) Program Fact Sheet
8. Skid Row Assessment Team (SRAT) Fact Sheet
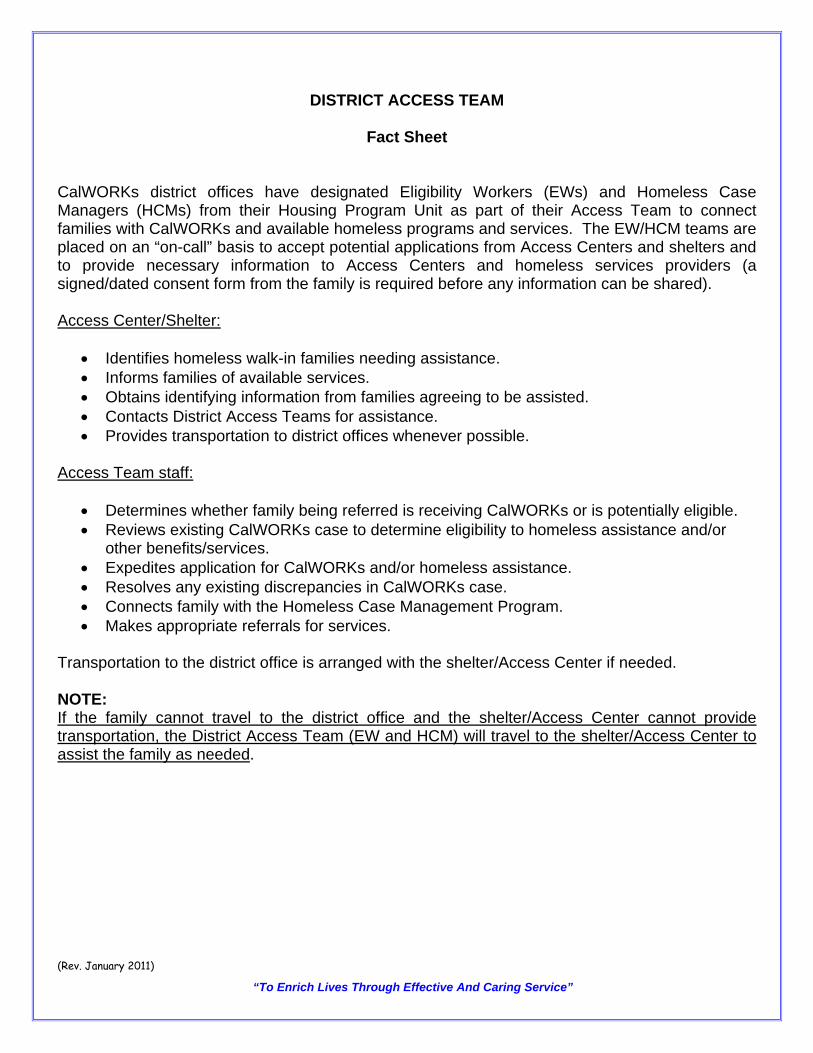
DISTRICT ACCESS TEAM
Fact Sheet
CalWORKs district offices have designated Eligibility Workers (EWs) and Homeless Case Managers (HCMs) from their Housing Program Unit as part of their Access Team to connect families with CalWORKs and available homeless programs and services. The EW/HCM teams are placed on an “on-call” basis to accept potential applications from Access Centers and shelters and to provide necessary information to Access Centers and homeless services providers (a signed/dated consent form from the family is required before any information can be shared). Access Center/Shelter:
• Identifies homeless walk-in families needing assistance. • Informs families of available services. • Obtains identifying information from families agreeing to be assisted. • Contacts District Access Teams for assistance. • Provides transportation to district offices whenever possible.
Access Team staff:
• Determines whether family being referred is receiving CalWORKs or is potentially eligible. • Reviews existing CalWORKs case to determine eligibility to homeless assistance and/or
other benefits/services. • Expedites application for CalWORKs and/or homeless assistance. • Resolves any existing discrepancies in CalWORKs case. • Connects family with the Homeless Case Management Program. • Makes appropriate referrals for services.
Transportation to the district office is arranged with the shelter/Access Center if needed. NOTE: If the family cannot travel to the district office and the shelter/Access Center cannot provide transportation, the District Access Team (EW and HCM) will travel to the shelter/Access Center to assist the family as needed. (Rev. January 2011)
“To Enrich Lives Through Effective And Caring Service”

CALIFORNIA WORK OPPORTUNITY AND RESPONSIBILITY TO KIDS (CalWORKs) PROGRAM
EMERGENCY ASSISTANCE TO PREVENT EVICTION (EAPE) PROGRAM FACT SHEET
The EAPE Program helps CalWORKs Welfare-to-Work (WtW) families who are behind in rent and/or utility bills due to a financial crisis which could lead to an eviction and homelessness. It provides eligible families with a once-in-a-lifetime* maximum of $2,000 to pay their past due rent and/or utilities for up to two months to help them keep their housing. Families can apply for EAPE in person at any CalWORKs office.
To be eligible for EAPE, the participant must:
• Be CalWORKs approved;
• Have exhausted or not be eligible to the State’s Permanent Homeless Assistance Arrearages payment;
• Be employed full-time, or employed part-time and actively participating in an approved
GAIN WtW activity or Post-Time Limit (PTL) services, or unemployed and actively participating in an approved GAIN WtW activity or PTL services;
• Have a verifiable financial hardship resulting from circumstances beyond the family’s
control that caused the nonpayment of rent and/or utilities;
• Provide verification of the financial hardship;
• Provide verification of the past due rent and/or utilities; and
• Agree to pay a part of the past due rent and/or utilities.
Eligible families can only receive EAPE when the payment of back rent and/or utilities will prevent eviction. Families can access EAPE as needed until the once-in-a-lifetime* maximum is reached.
*Payments under the EAPE Program are limited to a once-in-a-lifetime maximum of $2,000. There are no exceptions to this rule.
Revised November 2012
County of Los Angeles Department of Public Social Services
SHERYL L. SPILLER, Director
CALIFORNIA WORK OPPORTUNITY AND RESPONSIBILITY TO KIDS (CalWORKs) Program
Homeless Assistance (HA) Program Fact Sheet
The CalWORKs HA Program provides Temporary HA and Permanent HA. Temporary HA provides temporary shelter payments to homeless families while they are looking for permanent housing. Permanent HA helps homeless families secure a permanent residence or provides up to two months back rent when the family has received a pay rent or quit notice. Families can apply for Temporary and/or Permanent HA at any CalWORKs office. A family is considered homeless when:
• It lacks a fixed and regular nighttime residence; or • It has a primary nighttime residence that is a supervised publicly or privately operated
shelter designed to provide temporary living accommodations; or • It is residing in a public or private place not designed for, or ordinarily used as, a regular
sleeping accommodation for human beings; or • It has a need for housing in a commercial establishment (e.g., hotel/motel), shelter,
publicly-funded transitional housing, or from a person in the business of renting properties who has a history of renting properties; or
• It receives a pay rent or quit notice. Temporary HA Temporary HA provides once-in-a-lifetime* temporary shelter payments for up to 16 consecutive calendar days. An eligible family may receive $65 per day (for a family of up to four) and $15 per day for each additional person up to a maximum of $125 per day. The family must be actively searching for permanent housing, provide verification for the housing search, and provide verification of shelter expenditures. To be eligible for Temporary HA, the family must:
• Be apparently eligible to CalWORKs or be CalWORKs approved; • Meet the definition of “homeless;” • Not have more than $100.00 in liquid resources (i.e., cash on hand [not to include the
current month’s grant], bank account, etc.); and • Obtain temporary shelter from a commercial establishment (e.g., hotel or motel, paid
emergency shelter) or from a person who has a history of renting rooms/properties.
County of Los Angeles Department of Public Social Services
SHERYL L. SPILLER, Director
Permanent HA Permanent HA provides a once-in-a-lifetime* payment to cover security deposit costs including the last month's rent and any legal payment, fee, deposit or charge that is required by a landlord as a condition of assuming occupancy. An amount, in addition to the amount allowable for security deposits, is also available to cover utility deposits (turn-on-fees) required for gas, electricity and/or water. The Permanent HA payment amount for security deposits cannot exceed two times the total rent (rent amount before subsidies). Permanent HA cannot pay for the first month’s rent or the costs of overdue utility bills. To be eligible for the Permanent HA payment, the family must:
• Be CalWORKs approved; • Meet the definition of “homeless;” • Not have more than $100.00 in liquid resources (i.e., cash on hand [not to include the
current month’s grant], bank account, etc.); and • Secure permanent housing where the family’s share of the rent does not exceed 80% of
the family’s Total Monthly Household Income (TMHI). Permanent HA Arrearages provides a once-in-a-lifetime* payment that can pay up to two months of back rent when the family receives a pay rent or quit notice resulting from a financial hardship due to circumstances beyond the family’s control. Each month of the rent arrearage payment cannot exceed 80% of the family’s TMHI. To be eligible for the Permanent HA Arrearages payment, the family must:
• Be CalWORKs approved; • Have a pay rent or quit notice; • Provide proof that the eviction is a result of a financial hardship and not for other lease
or rental violations; • Not have more than $100.00 in liquid resources (i.e., cash on hand [not to include the
current month’s grant], bank account, etc.); and • Have permanent housing where the family’s share of the rent does not exceed 80% of
the family’s TMHI. An eligible family may receive Temporary HA shelter payments and/or the Permanent HA payment or the Permanent HA Arrearages payment. The family cannot receive both the Permanent HA payment and the Permanent HA Arrearages payment. *Temporary HA and Permanent HA payments are limited to a once-in-a-lifetime issuance unless the family meets an exception. Exceptions to the once-in-a-lifetime HA rule are limited to every 365 calendar days. However, this does not apply the first time a family receives HA under an exception. Revised March 2014
HOMELESS CASE MANAGEMENT FOR CalWORKs FAMILIES
Fact Sheet
GAIN Services Workers (GSWs) have been assigned to CalWORKs district offices as Homeless Case Managers (HCMs) to assess/case manage homeless and at-risk families applying for or already receiving CalWORKs. Any family applying for any of the DPSS Housing Program benefits [Homeless Assistance (HA), Moving Assistance (MA), Emergency Assistance to Prevent Eviction (EAPE), Rental Assistance (RA), and Housing Relocation (HRP)] will be referred to the HCM by the Eligibility Worker. Homeless Case Management Objectives and Goals Homeless Case Management is a voluntary program for families who are homeless or at-risk of homelessness. Definition: Homeless Case Management is a method of assessing the needs of the CalWORKs homeless and at-risk family and arranging, coordinating, monitoring, evaluating, and advocating for a package of multiple services to meet the specific family’s complex needs. It requires establishing a trusting and caring relationship with the homeless and at-risk family which may include linking the family with systems that provide the family with needed services, resources, and opportunities. Services will include: a) crisis intervention; b) short-term stabilization; c) needs assessment; d) assistance with application and receipt of Specialized Supportive Services; and e) an individualized housing plan. Objective: To determine the eligibility and appropriate services for the CalWORKs homeless and at-risk family and facilitate access to services. To assist the family in developing an individualized housing plan that will lead to permanent housing. Goals: The primary goal of the Homeless Case Manager is to provide quality services in the most efficient and effective manner to CalWORKs homeless and at-risk families with multiple, complex needs to help the family fulfill its potential. The Homeless Case Management method rests on a foundation of professional training, values, knowledge, theory, and skills used in the service of attaining goals that are established in partnership with the homeless and at-risk family. Such goals include:
• assisting families who are homeless or at-risk of being homeless to obtain and retain stable housing;
• enhancing developmental, problem-solving, and coping capacities of the homeless and at-risk family;
• conducting assertive, community-based outreach; • nurturing trusting, caring relationships with the homeless and at-risk families; • respecting client autonomy; • prioritizing family self-determined needs; and • linking and providing families with active assistance to obtain needed resources.
The HCM will work in partnership with the family to identify barriers and set goals to address the barriers, make appropriate referrals to services which will meet the complex needs of the family, monitor those services, conduct outreach to identify available resources for the family in the community, and most importantly, serve as an advocate for the family between the Eligibility Worker and the GAIN Services Worker to ensure the case is in order for the family to receive all entitled benefits and services.
Rev. January 2011
SHERYL L. SPILLER Director PHIL ANSELL Chief Deputy
CALIFORNIA WORK OPPORTUNITY AND RESPONSIBILITY
TO KIDS (CalWORKs) PROGRAM
MOVING ASSISTANCE (MA) PROGRAM FACT SHEET
The MA Program helps CalWORKs Welfare-to-Work (WtW) families who are homeless or at risk of becoming homeless due to a financial crisis resulting from circumstances out of the family’s control. It provides eligible families with a once-in-a-lifetime* payment of up to $2,500 to secure permanent housing. Families can apply for MA in person at any CalWORKs office. The MA payment (not to exceed $2,500) can include:
Up to two times the total rent (before subsidies) for move-in costs [security deposits (last month’s rent, cleaning fees, key deposits)];
Utility deposits (turn-on-fees) required for gas, electricity and/or water, when not included in the rent;
Truck rental [truck rental fee, any deposit associated with the rental of the truck, and mileage (if separate from the truck rental amount)];
Up to $405 for the purchase of a stove and/or refrigerator when the new residence does not have one; and
For families with a timed-out adult, up to the amount of the timed-out adult’s portion of the family’s reduced grant for two months, so that the family can remain in their current housing while they are in the process of moving into the new residence.
To be eligible for the MA payment, the participant must:
Be CalWORKs approved;
Have exhausted or not be eligible to the State’s Homeless Assistance Program;
Be employed full-time, or employed part-time and actively participating in an approved GAIN WtW activity or Post-Time Limit (PTL) services, or unemployed and actively participating in an approved GAIN WtW activity or PTL services;
Be homeless or at risk of becoming homeless due to a financial crisis resulting from circumstances beyond the family’s control (proof of the financial crisis required); and
Secure permanent housing where the family’s share of the rent does not exceed 80% of the family’s Total Monthly Household Income.
The MA Program can be used in conjunction with the State’s Homeless Assistance Program when the participant needs to purchase a stove and/or refrigerator because the new place of residence does not have one and/or the participant needs to rent a truck to move into the new residence. *Eligibility to the MA Program is limited to once-in-a-lifetime unless the family meets an exception. An exception to the once-in-a-lifetime rule for MA cannot be used unless 12 consecutive months have passed from the issuance of the previous MA payment. However, this rule does not apply if the need is due to a natural disaster.
Revised November 2014
County of Los Angeles
Department of Public Social Services
Page 1 of 2
County of Los Angeles Department of Public Social Services
Sheryl L. Spiller Director
Phil Ansell Chief Deputy
CALIFORNIA WORK OPPORTUNITY AND RESPONSIBILITY TO KIDS (CalWORKs) PROGRAM
4-MONTH RENTAL ASSISTANCE (RA) PROGRAM
FACT SHEET The 4-Month RA Program provides formerly homeless CalWORKs Welfare-to-Work (WtW) families with a short-term rental subsidy after securing non-subsidized permanent housing. The program can also be accessed by a CalWORKs WtW family who lives in non-subsidized permanent housing, when the family demonstrates they are experiencing a valid financial hardship and receive DPSS administered eviction prevention funds. Eligible families can qualify for a once-in-a-lifetime* rental subsidy of up to $500 per family (based on family size) for a maximum of four consecutive months to help the family while their housing situation stabilizes. To be eligible for RA, the family must:
Be CalWORKs approved;
Be employed full-time, or employed part-time and actively participating in an approved GAIN WtW activity or Post-Time Limit (PTL) services, or unemployed and actively participating in an approved GAIN WtW activity or PTL services;
Have received or be eligible to receive the Permanent Homeless
Assistance (HA) payment and/or Moving Assistance Program payment, or have received the Permanent HA Arrearages and/or the Emergency Assistance to Prevent Eviction Program payment, to prevent the family’s eviction;
Have signed a rental/lease agreement to secure non-subsidized
permanent housing within the past 30 calendar days of the request for RA or received the Permanent HA Arrearages payment and/or EAPE Program payment, to prevent the family’s eviction;
Agree to receive RA payments; and
Provide a rent receipt or verification that rent has been paid for each
month a subsidy is issued before another subsidy payment is issued.
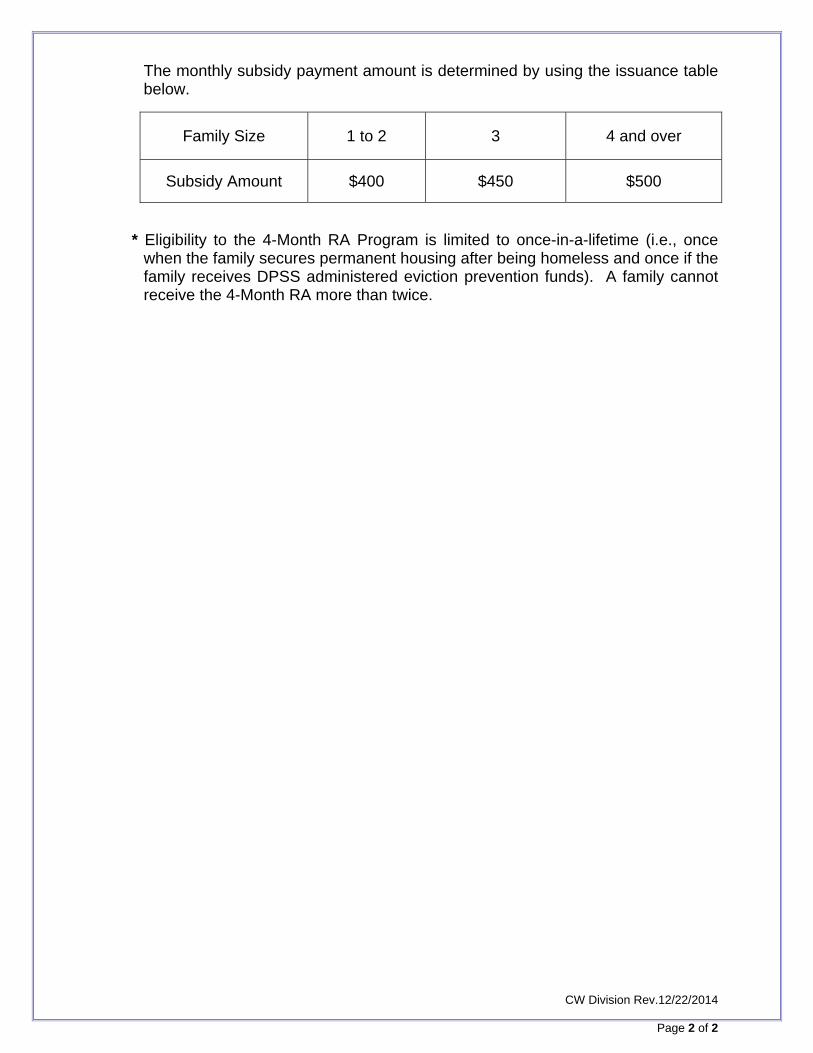
Page 2 of 2
The monthly subsidy payment amount is determined by using the issuance table below.
Family Size 1 to 2 3 4 and over
Subsidy Amount $400 $450 $500
* Eligibility to the 4-Month RA Program is limited to once-in-a-lifetime (i.e., once when the family secures permanent housing after being homeless and once if the family receives DPSS administered eviction prevention funds). A family cannot receive the 4-Month RA more than twice.
CW Division Rev.12/22/2014
SHERYL L. SPILLER, Director
CALIFORNIA WORK OPPORTUNITY AND RESPONSIBILITY TO KIDS (CalWORKs) PROGRAM
SKID ROW ASSESSMENT TEAM (SRAT) FACT SHEET
DPSS Staff Assigned to Skid Row: One Deputy District Director (DDD), one Eligibility Supervisor (ES), one Eligibility Worker (EW), and one Homeless Case Manager (HCM).
EW on Skid Row
Identifies families in need of CalWORKs and/or homeless services and benefits; Assists the families to apply for DPSS benefits, via Your Benefits Now or arranging for the
family to apply for benefits at a DPSS District Office (including applying for homeless assistance);
Works with EWs/ES/DDDs in District Housing Program Units to resolve case issues; Works with shelters in the area to link families who are not eligible to CalWORKs; Hands out flyers with CalWORKs programs information; Links eligible families to HCM on-site for case management services; Hands out General Relief (GR) cards with nearest GR District information for individuals without
families who they may encounter; Works with District staff to evaluate families for all CalWORKs benefits and services; and Assists SRAT to transport families to the Family Solutions Center (FSC).
HCM on Skid Row
Provides intensive case management to families on Skid Row in order to move the family out of Skid Row and into a stable transitional or permanent housing situation;
Receives direct referrals for homeless families from the Union Rescue Mission and conducts the assessment;
Initiates immediate contact with family by meeting the family at the URM and/or the LEAVEY Center;
Provides case management as appropriate during the time the family is living in Skid Row and for at least ten days after a family has moved out of Skid Row;
Makes routine referrals to the Department of Mental Health and the Department of Public Health;
Assists with the expediting of any CalWORKs/GAIN appointments or issues necessary to remove barriers to receive DPSS benefits or homeless assistance, as appropriate;
Monitors the family/case to ensure benefits and/or services were provided; Identifies families that are potential referrals to the FSC within two business days of meeting
with the family and notifies SRAT; and Completes the daily and weekly SRAT/Skid Row/HCM reports.
Meeting: SRAT staff attends weekly meeting with SRAT supervisors and managers to discuss Skid Row issues and protocols. Training: Training takes place on an ongoing basis as needed.
(Rev. May 2013)
County of Los Angeles
Department of Public Social Services