sensors for energy harvesting system -...
TRANSCRIPT

International Journal of Computer Applications (0975 – 8887)
National Conference “Electronics, Signals, Communication and Optimization" (NCESCO 2015)
14
Sensors for Energy Harvesting System
P.Siva Subba Rao Ph.D. Student, VTU
Belagavi & Principal Scientist,
Structural Technologies Division,
CSIR-National Aerospace Laboratories,
HAL Airport road, Bengaluru - 560017,
INDIA
S. Raja Sr. Principal Scientist
Structural Technologies Division,
CSIR-National Aerospace Laboratories,
HAL Airport road, Bengaluru - 560017,
INDIA
Deepika S. Project Graduate Trainee Structural Technologies
Division, CSIR-National Aerospace
Laboratories, HAL Airport road,
Bengaluru - 560017, INDIA
V.R.Ranganath Chief Scientist
Structural Technologies Division,
CSIR-National Aerospace Laboratories,
HAL Airport road, Bengaluru - 560017,
INDIA
ABSTRACT
A considerable attention has been given to the energy
harvesting system, as the energy obtained from this system is
used for powering up small electronic devices instead of using
batteries. Battery manufactures make batteries of required size
with long life of usage. However, it is difficult to replace such
batteries once its life is expired. This difficulty can be
partially overcome by using the energy produced from a
suitable energy harvesting system. The input to the energy
harvesting system is the ambient energy from the environment
as external sources. One of the external source considered for
this investigation is vibration. Vibration can be converted to
voltage by using piezoelectric sensors which are fixed on the
vibrating structure or unit, and the energy produced by piezo
sensors can power up small electronic devices. As a result,
electronic system becomes the self powered system or uses
less battery. In order to obtain greater power and efficiency
from the piezo sensors, a study has been made for selection of
a suitable sensor depending upon the structure or unit. In this
present work an aluminum beam has been taken as a
structural membrane. Both the beam and the sensor thickness
are varied and the experiments are conducted to find the best
suitable sensor. It is observed that more energy is harvested
using a thin sensors on a suitably thin structure as compared
to stiff/thick structures.
Keywords
Energy harvesting system; Piezoelectric sensors; Cantilever
beam.
1. INTRODUCTION “Energy harvesting” or “Energy scavenging” is the process of
extracting small amount of energy from ambient environment
and then reusing it for electronic devices. While executing
different machines or mechanical systems some vibrations are
generated. The conversion of this ambient vibration energy
into usable electrical energy is called energy harvesting. The
vibrations are detected by the sensors. The best mechanism to
convert the vibrations into electrical energy is piezoelectric
mechanism. Piezoelectric mechanism has received greatest
attention because these materials have the advantage of larger
power and ease of application. The most commonly used
piezoelectric material is PZT (Lead Zirconate Titanate)
because it has very high electromechanical coupling ability.
Piezoelectric materials are commercially available. These
materials undergoes deformation when an electric field is
applied across them (piezoelectric effect) and conversely
produce voltage when strain is applied(converse piezoelectric
effect). Thus they can be used as both actuators and sensors. It
is the piezoelectric effect that is employed in an energy
harvesting system.
A piezoelectric transducer is a device that uses the
piezoelectric effect to measure pressure, acceleration, strain or
force by converting them to an electrical charge. Piezoelectric
transducers are used to convert one form of
energy(mechanical energy) in to another form of energy
(electrical energy). Piezoelectric sensors have proven to be
versatile tool for the measurement of various parameters like
strain, acceleration, load etc,. A piezoelectric transducer has
very high DC output impedance and can be modeled as a
proportional voltage source and filter network.
Piezoelectric generators are of major interest due to the solid
state nature facilitating its integration. Different approaches of
energy harvesting using piezoelectric materials have been
developed [1–3]. Since a piezoelectric element subjected to a
vibration generates an alternating voltage across its electrodes,
most of the proposed electrical circuits include an AC-to-DC
converter. Thus, an electrical energy is provided to a storage
device, such as a capacitor or a battery, in order to feed the
terminal electric load under a DC voltage. The AC-to-DC
converter, usually a diode bridge, is sometimes followed by a
DC-to-DC converter. This is used for power optimization or
load voltage regulation [4–6].
2. MATERIALS AND METHODS
2.1 Sensors A sensor is a device that detects the changes in electrical or
physical or other quantities and thereby produces output as an
acknowledgement of change in the quantity. A sensor
converts the physical parameter into a signal which can be
measured electrically. The sensors used in the present study
are piezoelectric sensors.
2.2 Piezoelectric Sensors The piezoelectric sensors use piezoelectric effect to convert
the quantities such as force, strain, etc. into an electrical
charge. Besides the voltage conversion, the piezoelectric
sensors are used for the measurement of various process
parameters. These piezoelectric sensors posses ruggedness,
and have high natural frequency and an excellent linearity
over a wide amplitude range. Additionally, piezoelectric
technology is insensitive to electromagnetic fields and
radiation, enabling measurements under harsh conditions [7].

International Journal of Computer Applications (0975 – 8887)
National Conference “Electronics, Signals, Communication and Optimization" (NCESCO 2015)
15
3. PIEZOELECTRIC ENERGY
HARVESTING SYSTEM
3.1 Principle and working Among various approaches of converting mechanical
vibration to electric energy, using piezoelectric materials on
the vibrating structures is one of the most economical/ simple
approach. Piezoelectric materials produce electric charge
when subjected to external mechanical loads [8]. According to
the definition of “direct piezoelectric effect”, when a
mechanical strain is applied to crystals by an external stress,
an electric charge occurs on the surface(s) of the crystal and
the polarity of this electric charge can be reversed by
reversing the direction of the mechanical strain. This
phenomenon is shown in Fig. 1. [9]
Fig 1: Schematic of direct piezoelectric effect; (a)
piezoelectric material, (b) energy generation under
tension, (c) energy generation under compression.
Sometimes, piezoelectric material itself works as structures
for energy harvester, in the form of cantilever beam. It may
contain one or two piezoelectric thin sheets to form the main
structure, that is unimorph or bimorph . In this study, we used
unimorph configuration for conducting experiment and is
shown in Fig. 2.
Fig 2: Unimorph cantilever beam
A unimorph cantilever consists of one active layer and one
inactive layer. The active layer is piezoelectric, deformation in
that layer may be induced by the application of an electric
field. This deformation induces a bending displacement in the
cantilever as shown in Figure 3. The inactive layer may be
fabricated from a non-piezoelectric material (aluminum
beam).
Fig 3: Schematic representation of the response of a
unimorph cantilever
3.2 Energy Harvesting System Approach A simplified vibrational energy harvesting system is shown in
Fig. 4. It consists of vibration amplifier, force transducer, a
piezoelectric element, energy harvesting circuit and an energy
storage unit. Piezoelectric sensors has a small displacement
and high force output. Hence, a monolithic is rarely used
directly as a device. A mechanical impedance matching
structure such as a beam with PZT patch above the root is
employed in this approach for harvesting energy. This
element is attached to a full-wave rectifier. This is in turn
connected to a filter which would allow output of only a
certain frequency range. Then a regulator is connected where
the energy harvesting unit stores the acquired energy.
Fig 4: Piezoelectric Energy Harvesting System
When the input signal is applied to vibration amplifier, it
amplifies the input signal for the required level and then feeds
it into the force transducer. The force transducer produces the
force to the cantilever beam and it start vibrating at a
particular resonant frequency which will match. When a PZT
is subjected to vibrations, a voltage is developed across its
thickness. As a result the PZT acts as a sensor. The voltage
generated from the PZT material is AC (Alternating Current).
Since AC can periodically change its direction, it has to be
converted into DC (Direct Current) which flows in only one
direction. The AC – to – DC converter (rectifier) is used for
the conversion and then it is filtered by using the capacitor
filter. After filtering the energy is stored in the storage device
which will be used for low power applications.
3.3 Operating Modes of a Piezoelectric
Transducer Piezoelectric materials are manufactured in such a manner
that the piezoelectric cause and effect are made more
prominent along some particular direction. This way, the
piezoelectric materials can be efficiently used as sensors and
actuators. In the present study, PZT5H piezo sensor
manufactured by M/s Sparkler Piezoceramics, Pune were
used. The properties of the PZT5H are mentioned in the
Table 1. Most common operating modes for a cantilever beam
are “31”operating mode and “33” operating mode.
A 31-mode piezoelectric actuator produces
displacement perpendicular to an electric field
applied parallel to the material’s polarization
direction. Approximately twice the strain can be
obtained from a 33-mode piezoelectric actuator than
a 31-mode piezoelectric actuator for the same
applied field; this is due to the relative magnitudes
of the piezoelectric coefficients. In this case the
bending beam has electrodes on its top and bottom
surfaces.
A 33-mode piezoelectric actuator produces
displacement in the same direction as an electric
field applied parallel to the materials polarization
direction. Here the bending beam has all electrodes
on its top surface.
Although piezoelectric materials working in d31 mode
normally have lower coupling coefficient than d33 mode, d31
mode is more commonly used. This is because, when a single
layer cantilever beam bends, more lateral stress is produced
than vertical stress, which makes it easier to couple in d31
mode. While operating in d31 mode, electric fields are more
International Journal of Computer Applications (0975 – 8887)
National Conference “Electronics, Signals, Communication and Optimization" (NCESCO 2015)
16
pronounced in 3-direction and stresses and strains are more
pronounced in 1 direction. In case of sensors, the electric field
is generated in 3-direction because of the stress and strain
developed in 1-direction. In case of actuators, electric field is
applied in 3-direction and stress and strain in 1-direction;
these are utilized for extension or bending in the material.
[10].
In 31-operating mode, it is assumed that
E1= E2 = 0
€yy = €zz = γyz = γxy = γxz = 0
So, the constitutive relations gets reduced to
σxx = C11 €xx + d31 E3 . . . . (1)
D3 = d31€xx + k33 E3 . . . . (2)
€xx = S11 σxx + e31 E3 . . . . (3)
D3 = e31 σxx + k33 E3 . .. . (4)
From equation (1), we can write
€xx = (σxx - d22 E3) / C22 . . . .(5)
Substituting the above equation in equation (2), we get
D3 = dT13 €33 + (K33 - d
213/C22) E3 . . . . (6)
Cp=A/τ(K33-d213/C11)E3 = A/ τ ( K33(1-K31
2)) . . . . (7)
Above equation is called open loop capacitance or free
capacitance, where
𝐾31 =𝑑13
𝐶11𝒦33
is the coupling coefficient of 31 piezoelectric transducer.
Thus, the charge produced on the surface of the PZT can be
written as
Q = Cp * V . . . . (8)
As a result, the voltage is generated from PZT by mechanical
stress.
Table 1. Material properties of PZT
Property PZT
Density 7500Kg/m3
Young’s modulus 48e9N/m2
Poisson’s ratio 0.22
Piezoelectric strain
constants(d)
d 33 =550e-12 C/N
d 31= -265e-12 C/N
Piezoelectric stress
constant(e)
e 31 =-0.0101
e32 =-0.0101
e33=0.0719
Relative permittivity 1699
Maximum voltage 180 V
3.4 Modes of Vibration A complex body can vibrate in many different ways, each
having its own frequency. The frequency can be determined
by the moving mass in that mode and the restoring force
which tries to return the specific distortion of the body back to
its equilibrium position. When any complex body vibrates
there is no one “simple harmonic oscillator”, as a reason many
modes are excited and vibrate together. The shape of vibration
is very complicated and changes from one instant to another
and also, it is difficult to determine the shape of the modes.
However, by using resonance both the frequency and the
shape of the mode can be obtained. If vibration is given to a
body to the nearest resonance frequency of the mode then that
mode responds. If a beam with tension is vibrated, the beam
has the variety of modes of vibration with different
frequencies [11-12]. For the energy harvesting system using
sensors, three modes of vibrations are used as discussed
below.
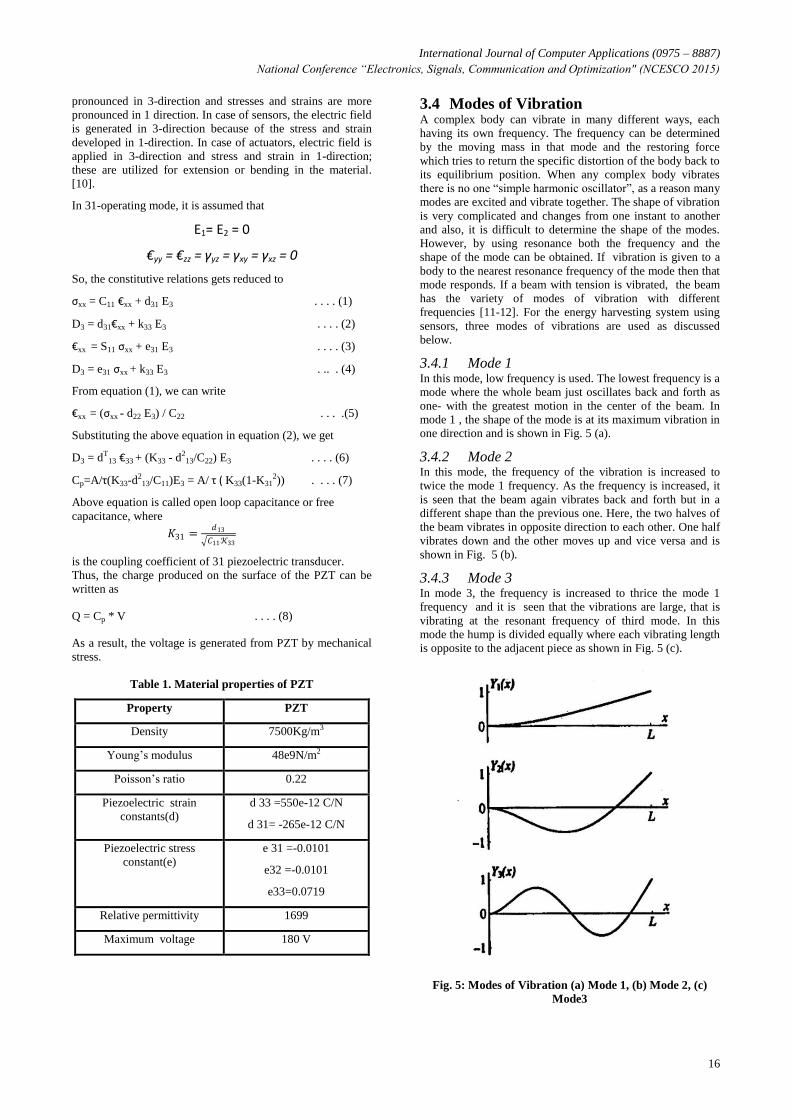
3.4.1 Mode 1 In this mode, low frequency is used. The lowest frequency is a
mode where the whole beam just oscillates back and forth as
one- with the greatest motion in the center of the beam. In
mode 1 , the shape of the mode is at its maximum vibration in
one direction and is shown in Fig. 5 (a).
3.4.2 Mode 2 In this mode, the frequency of the vibration is increased to
twice the mode 1 frequency. As the frequency is increased, it
is seen that the beam again vibrates back and forth but in a
different shape than the previous one. Here, the two halves of
the beam vibrates in opposite direction to each other. One half
vibrates down and the other moves up and vice versa and is
shown in Fig. 5 (b).
3.4.3 Mode 3 In mode 3, the frequency is increased to thrice the mode 1
frequency and it is seen that the vibrations are large, that is
vibrating at the resonant frequency of third mode. In this
mode the hump is divided equally where each vibrating length
is opposite to the adjacent piece as shown in Fig. 5 (c).
Fig. 5: Modes of Vibration (a) Mode 1, (b) Mode 2, (c)
Mode3
International Journal of Computer Applications (0975 – 8887)
National Conference “Electronics, Signals, Communication and Optimization" (NCESCO 2015)
17
4. EXPERIMENTAL SETUP An experimental study was made on the physical model,
along with the energy harvesting circuit setup as shown in
Fig. 6. As discussed in Section 3, energy harvesting circuit
captures the energy from the system and converts it into an
useful and storable form. An aluminum beam was mounted
with PZT patch at the top near the root, using adhesive
(Araldite®). An assumption is taken that the adhesive
transfers the mechanical disturbance without any losses.
Fig 6: Experimental setup for Energy Harvesting
The vibrations were generated using signal generator that
amplifies and drives to force transducer. Then, it was fed into
shaker, and it produces same frequency (vibration). If this
resonance frequency matches to PZT resonance frequency, it
starts vibrating more, due to which, reaction PZT produces
AC signal. Output of the PZT is converted to DC voltage by
using rectifier and further stored in a battery or capacitor.
A typical energy harvesting circuit with full wave rectifier is
shown in Fig. 7. A filter was used to eliminate the AC ripples
and to convert it to pure DC voltage. For rectification,
Schottky barrier diode DO-34 package BAT85 (D1-4) was
used. The filter capacitor (C1) is a Metalized Polyester,
Round type capacitors (MER Series) of value 10K/100 which
has very low dissipation factor less than 0.8% for less than
1kHz. The load resister R1 is the carbon type resistor. The
load resistor was selected based on the maximum power
recorded as shown in the Figure 8. The maximum power
recorded at 1.7K Ω. The voltages were measured across the
resister R1 (1.7K Ω) for all experiments conducted on beams.
As a result, comparison of the power in all experiments gives
the measured voltages. This is equal to the power/energy
generated by the PZT attached for the beams.
Fig. 7: Full wave rectifier circuit
0.1 1 10 100 10000
2
4
6
8
10
12
14
Ha
rve
ste
d p
ow
er
in m
W
Resistance (Ohm ()) in log scale
Fig. 8: Variation of power with respect to load resistance
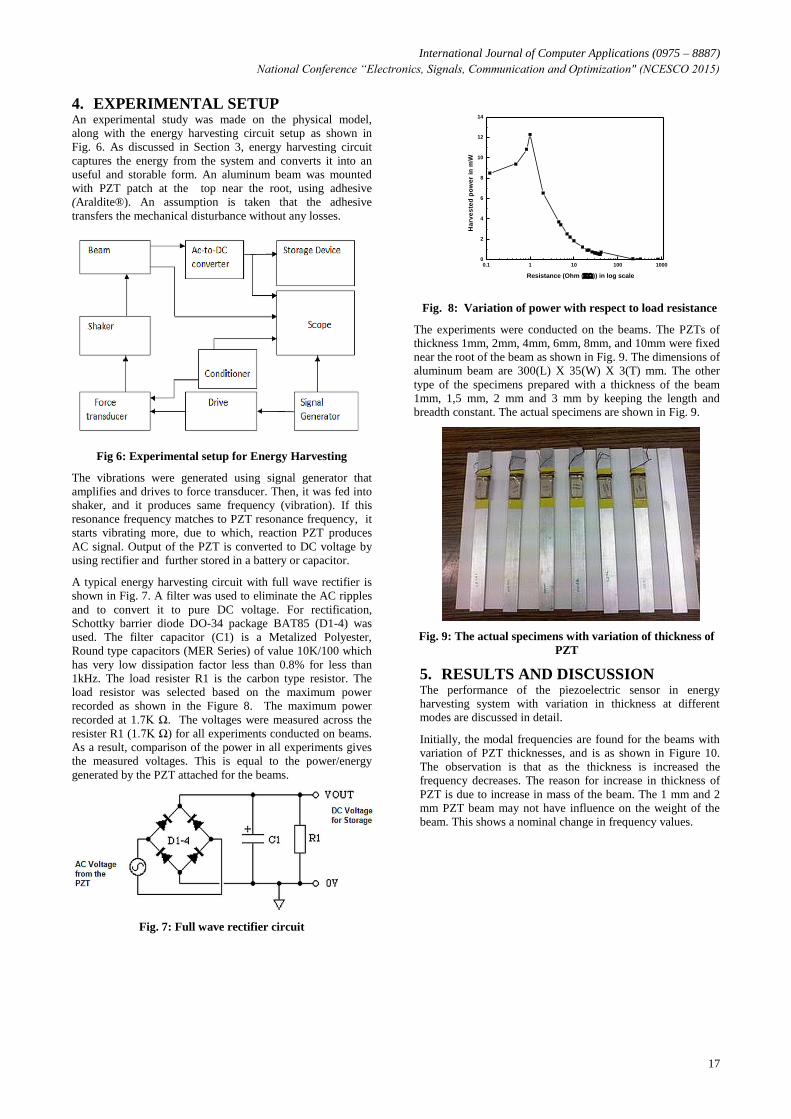
The experiments were conducted on the beams. The PZTs of
thickness 1mm, 2mm, 4mm, 6mm, 8mm, and 10mm were fixed
near the root of the beam as shown in Fig. 9. The dimensions of
aluminum beam are 300(L) X 35(W) X 3(T) mm. The other
type of the specimens prepared with a thickness of the beam
1mm, 1,5 mm, 2 mm and 3 mm by keeping the length and
breadth constant. The actual specimens are shown in Fig. 9.
Fig. 9: The actual specimens with variation of thickness of
PZT
5. RESULTS AND DISCUSSION The performance of the piezoelectric sensor in energy
harvesting system with variation in thickness at different
modes are discussed in detail.
Initially, the modal frequencies are found for the beams with
variation of PZT thicknesses, and is as shown in Figure 10.
The observation is that as the thickness is increased the
frequency decreases. The reason for increase in thickness of
PZT is due to increase in mass of the beam. The 1 mm and 2
mm PZT beam may not have influence on the weight of the
beam. This shows a nominal change in frequency values.

International Journal of Computer Applications (0975 – 8887)
National Conference “Electronics, Signals, Communication and Optimization" (NCESCO 2015)
18
mode1 mode2 mode30
50
100
150
200
250
300
350
400
450
500
550
600
650
1 mm
2 mm
4 mm
6 mm
8 mm
10 mm
Fre
qu
ncy (
Hz)
Fig 10: Frequency variation for different modes of sensor
thickness
With varying force at different beam thickness of 1.0 mm, 1.5
mm, 2.0 mm and 3.0 mm the frequency at three different
modes are measured as shown in Fig. 11.
mode1 mode2 mode30
50
100
150
200
250
300
350
400
450
500
550
600
650
700
Fre
qu
en
cy (
Hz)
1.0 mm
1.5 mm
2.0 mm
3.0 mm
Fig 11: Frequency variation for different modes of
different thickness beams
The AC output voltage is measured by varying the applied
input vibrational force and is shown in Fig. 12 for 1 mm
thickness PZT beam. It is observed that for mode 2
frequency, the voltage is higher than the output voltage at the
other two modes. The reason is as explained in the modal
shapes in Fig. 5 shows, the transfer of the vibration energy is
more in mode 2 as compared to other modes.
0.0 0.2 0.4 0.6 0.8 1.0 1.2 1.4 1.6 1.8 2.0 2.20
5
10
15
20
25
30
35
40
Mode1 29.20 Hz
Mode2 168.8Hz
Mode3 456.4Hz
AC
ou
tpu
t (v
olt
s)
Force (N)
Fig 12: Variation of voltage with respect to applied force
Mode 1
Mode 2
Mode 3
0.0 0.5 1.0 1.5 2.0
0
1000
2000
3000
4000
5000
Po
we
r (m
icro
wa
tt)
Force (N)
Fig 13: Variation of current with respect to applied force
It is also observed that the mode2 gives more DC power as
compared to the other modes in the PZT with variation in the
thickness beams. The power recorded for 1 mm thickness
beam fixed with 1 mm PZT sensor output recorded and shown
in the Fig. 13. This gives an idea that the thin structure
vibrates more and transfers more energy to the piezo sensor.
The order of the power harvested is approximately 500 µW in
mode 2.
6. CONCLUSIONS An energy harvesting electronic circuit using piezoelectric
sensor was designed for vibrational energy conversion
application. From the results, it is concluded that the thinner
PZT’s generates more power and is independent of the
thickness of the structure or unit. It is further suggested that
there is a good mechanical coupling for thin PZTs as the PZT
is closely attached / fixed to the structure as compared to thick
PZTs. It is also observed that more energy is harvested from
thin structures as compared to stiff / thick structures.
Moreover, selection of the sensors is one of the most critical
aspect for the energy harvesting system. The energy harvested
from the structural vibrations is stored in smaller capacitances
used in place of batteries to power up the electronics. This is
going to be a futuristic method for self powered electronic
system.
7. ACKNOWLEDGMENT Authors would like to thank the Director, CSIR-NAL,
Bengaluru for driving the confidence. Dr. S. Satish Chandra,
Head, STTD, NAL, Bengaluru is profusely thanked for
providing all facilities for completing the developmental
work. The technical support by the STTD staff, NAL,
Bengaluru and project trainee personnel is sincerely
acknowledged.
8. REFERENCES [1] G. Poulin, E. Sarraute, F. Costa. 2004 Generation of
electrical energy for portable devices, comparative study
of an electromagnetic and a piezoelectric system Sensors
and Actuators A 116 pp 461–471
[2] D. L. Churchill, M. J. Hamel, C. P. Townsend, S. W.
Arms. 2003 Strain energy harvesting for wireless sensor
networks, in: Proceedings of SPIE Smart Structures and
Materials Conference, vol. 5005 pp 319-323
[3] S. Roundy, P. K. Wright. 2004 A piezoelectric vibration
based generator for wireless electronics, in: Proceedings
of Smart Mater. Struct, vol. 13 pp 1131–1142.

International Journal of Computer Applications (0975 – 8887)
National Conference “Electronics, Signals, Communication and Optimization" (NCESCO 2015)
19
[4] G. Ottman, H. Hofmann, A. Bhatt, G. Lesieutre. 2002
Adaptive piezoelectric energy harvesting circuit for
wireless remote power supply, IEEE Trans Power
Electronics, vol. 17, No. 5, pp 669-676 .
[5] G. Ottman, H. Hofmann, A. Bhatt, G. Lesieutre. 2003
Optimized piezoelectric energy harvesting circuit using
step-down converter in discontinuous conduction mode,
IEEE Trans. Power Electronics, Vol. 18,Nno. 2, pp 696-
703
[6] E. Lefeuvre, A. Badel, C. Richard, L. Petit, D. Guyomar.
2006 A comparison between several vibration-powered
piezoelectric generators for standalone systems, Sensors
and Actuators A 126 pp405–416
[7] http://en.wikipedia.org/wiki/Piezoelectric_sensor
[8] Ling Bing. K, Li. T, Hng. H. H, Boey. F, Zhzng. T, Li. S.
2014 Waste Energy Harvesting. pp 19-133
[9] D. Vatansever, E Siores and T. Shah. 2012 Alternative
Resource for Renewable Energy: Piezoelectric and
Photovoltaic Smart Structures. University of Bolton,
Institute for Materials Research and Innovation, United
Kingdom Chapter 10 http://dx.doi.org/10.5772/50570.
[10] P. Siva Subba Rao, S. Raja, V. Shankar, V. R.
Ranganath, Archana Kashikar, 2012. "An estimation of
the energy transformed from a vibrating structural
system International Journal of Earth Sciences and
Engineering pp525-532,Vol. 05 No.01 ISSN 0974-5904 .
[11] http://computationaldesignlab.org/hnat/ME_Exp_Websit
e/Vibrating%20Beam/Beam_Vibration.html
[12] http://www.theory.physics.ubc.ca/341-current/modes.pdf
IJCATM : www.ijcaonline.org