sensor based in-season nitrogen prediction for quality ...8)15/9.pdf · am-euras. j. agric. &...
TRANSCRIPT

American-Eurasian J. Agric. & Environ. Sci., 15 (8): 1556-1567, 2015ISSN 1818-6769© IDOSI Publications, 2015DOI: 10.5829/idosi.aejaes.2015.15.8.12766
Corresponding Author: Tolera Abera, Department of Soil Science, Sokoine University of Agriculture, P.O. Box: 3008,Chuo Kikuu, Morogoro, Tanzania.
1556
Sensor Based In-Season Nitrogen Prediction for Quality Protein MaizeVarieties on Farmers’ Field around Bako-Tibe, Western Ethiopia
Tolera Abera, Ernest Semu, Tolessa Debele, Dagne Wegary and Haekoo Kim1 1 2 3 3
Department of Soil Science, Sokoine University of Agriculture, P.O. Box: 3008,1
Chuo Kikuu, Morogoro, TanzaniaWheat Project coordinator Support to Agricultural Research for Development of2
Strategic Crops in Africa (SARD-SC), ICARDA c/o ILRI P.O. Box: 5689 Addis Ababa, EthiopiaInternational Maize and Wheat Improvement Centre (CIMMYT),3
Global Conservation Agriculture Program, P.O. Box: 5689. Addis Ababa, Ethiopia
Abstract: The green seeker sensor reading of normalized difference vegetation index (NDVI) is highly relatedwith leaf N content in quality protein maize (Zea mays). Mean yield components of quality protein maize weresignificantly affected by application of nitrogen rate in 2013 and 2014 cropping seasons. Increasing N rate from0 to 100 kg ha increased significantly all parameters of quality protein maize varieties. Significantly a taller1
plant height, higher leaf area and leaf area index was recorded from 50-100 kg N ha than other treatments.1
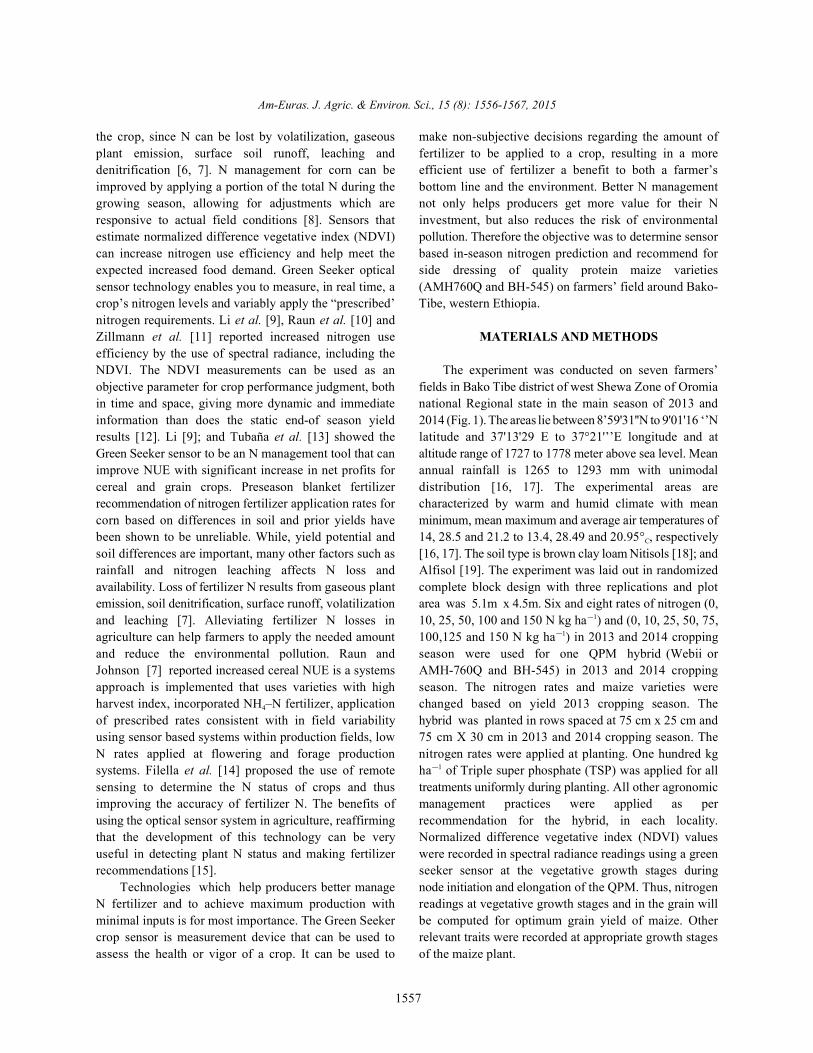
Higher correlation between NDVI reading and leaf area were observed, with correlation coefficients of 0.46 and0.47 at V4 and V6 growth stage in 2013 cropping season resulted in a good correlation between NDVI and leafarea. N application rates produced significantly higher increase up to 50-100 kg ha and small increase after1
suggesting that the rate supplied sufficient N for maximum yield of maize. Significantly higher mean grain yieldof quality maize varieties (AMH760Q and BH-545) was obtained between 50-100 kg N ha in both cropping1
seasons. Better correlation coefficients of 0.36 and 0.60 in 2013 and 2014 cropping season between INSEY andmean grain yields of maize were observed, indicating that predicating grain yield with In Season Estimation ofYield of quality protein maize. The Normalized Difference Vegetative Index (NDVI) reading at V4 and V6 have5 % and 1% positive meaningful correlation with grain yield (r=0.72 and 0.65), indicating, Normalized DifferenceVegetative Index reading at V4 and V6 put positive impression in grain yield of QPM. In conclusion based onpromising results validation of nitrogen rate for side dressing and N use efficiency of QPM varieties (AMH760Qand BH-545) production in the area is needed.
Key words: QPM NDVI INSEY Nitrogen Maize
INTRODUCTION Western Ethiopia. Pasuquin et al. [4] reported the total
Nitrogen is an essential element and important grain yield response to fertilizer N and an expected AEN,constituent of many biomolecules in plants and low N is with the assumption that a greater AEN can be achieveda limiting factor to high yields in a variety of agricultural at higher yield responses. Currently, sky-rocketed pricessystems [1]. Increased crop productivity has been of synthetic fertilizer have made it difficult for smallholderassociated with a 20-fold increase in the global use of N farmers to use inorganic nitrogen for crop production.fertilizer use during the past five decades [2] and this is Carranca [5] reported crops are often fertilized with largeexpected to increase at least 3-fold by 2050 [3]. Nitrogen amounts of N fertilizer, but only a small fraction of this(N) is an essential plant nutrient and is the most yield fertilizer (roughly 5% to 50%, is taken up by the plants.limiting factor in major hybrid maize production in Furthermore, not all the nitrogen applied is taken up by
fertilizer N requirement is estimated from the expected
Am-Euras. J. Agric. & Environ. Sci., 15 (8): 1556-1567, 2015
1557
the crop, since N can be lost by volatilization, gaseous make non-subjective decisions regarding the amount ofplant emission, surface soil runoff, leaching and fertilizer to be applied to a crop, resulting in a moredenitrification [6, 7]. N management for corn can be efficient use of fertilizer a benefit to both a farmer’simproved by applying a portion of the total N during the bottom line and the environment. Better N managementgrowing season, allowing for adjustments which are not only helps producers get more value for their Nresponsive to actual field conditions [8]. Sensors that investment, but also reduces the risk of environmentalestimate normalized difference vegetative index (NDVI) pollution. Therefore the objective was to determine sensorcan increase nitrogen use efficiency and help meet the based in-season nitrogen prediction and recommend forexpected increased food demand. Green Seeker optical side dressing of quality protein maize varietiessensor technology enables you to measure, in real time, a (AMH760Q and BH-545) on farmers’ field around Bako-crop’s nitrogen levels and variably apply the “prescribed’ Tibe, western Ethiopia.nitrogen requirements. Li et al. [9], Raun et al. [10] andZillmann et al. [11] reported increased nitrogen use MATERIALS AND METHODSefficiency by the use of spectral radiance, including theNDVI. The NDVI measurements can be used as an The experiment was conducted on seven farmers’objective parameter for crop performance judgment, both fields in Bako Tibe district of west Shewa Zone of Oromiain time and space, giving more dynamic and immediate national Regional state in the main season of 2013 andinformation than does the static end-of season yield 2014 (Fig. 1). The areas lie between 8’59'31''N to 9'01'16 ‘’Nresults [12]. Li [9]; and Tubaña et al. [13] showed the latitude and 37'13'29 E to 37°21'’’E longitude and atGreen Seeker sensor to be an N management tool that can altitude range of 1727 to 1778 meter above sea level. Meanimprove NUE with significant increase in net profits for annual rainfall is 1265 to 1293 mm with unimodalcereal and grain crops. Preseason blanket fertilizer distribution [16, 17]. The experimental areas arerecommendation of nitrogen fertilizer application rates for characterized by warm and humid climate with meancorn based on differences in soil and prior yields have minimum, mean maximum and average air temperatures ofbeen shown to be unreliable. While, yield potential and 14, 28.5 and 21.2 to 13.4, 28.49 and 20.95° , respectivelysoil differences are important, many other factors such as [16, 17]. The soil type is brown clay loam Nitisols [18]; andrainfall and nitrogen leaching affects N loss and Alfisol [19]. The experiment was laid out in randomizedavailability. Loss of fertilizer N results from gaseous plant complete block design with three replications and plotemission, soil denitrification, surface runoff, volatilization area was 5.1m x 4.5m. Six and eight rates of nitrogen (0,and leaching [7]. Alleviating fertilizer N losses in 10, 25, 50, 100 and 150 N kg ha ) and (0, 10, 25, 50, 75,agriculture can help farmers to apply the needed amount 100,125 and 150 N kg ha ) in 2013 and 2014 croppingand reduce the environmental pollution. Raun and season were used for one QPM hybrid (Webii orJohnson [7] reported increased cereal NUE is a systems AMH-760Q and BH-545) in 2013 and 2014 croppingapproach is implemented that uses varieties with high season. The nitrogen rates and maize varieties wereharvest index, incorporated NH –N fertilizer, application changed based on yield 2013 cropping season. The4
of prescribed rates consistent with in field variability hybrid was planted in rows spaced at 75 cm x 25 cm andusing sensor based systems within production fields, low 75 cm X 30 cm in 2013 and 2014 cropping season. TheN rates applied at flowering and forage production nitrogen rates were applied at planting. One hundred kgsystems. Filella et al. [14] proposed the use of remote ha of Triple super phosphate (TSP) was applied for allsensing to determine the N status of crops and thus treatments uniformly during planting. All other agronomicimproving the accuracy of fertilizer N. The benefits of management practices were applied as perusing the optical sensor system in agriculture, reaffirming recommendation for the hybrid, in each locality.that the development of this technology can be very Normalized difference vegetative index (NDVI) valuesuseful in detecting plant N status and making fertilizer were recorded in spectral radiance readings using a greenrecommendations [15]. seeker sensor at the vegetative growth stages during
Technologies which help producers better manage node initiation and elongation of the QPM. Thus, nitrogenN fertilizer and to achieve maximum production with readings at vegetative growth stages and in the grain willminimal inputs is for most importance. The Green Seeker be computed for optimum grain yield of maize. Othercrop sensor is measurement device that can be used to relevant traits were recorded at appropriate growth stagesassess the health or vigor of a crop. It can be used to of the maize plant.
C
1
1
1

Am-Euras. J. Agric. & Environ. Sci., 15 (8): 1556-1567, 2015
1558
Fig. 1: Study district in West Shewa Zone of Oromia, Ethiopia
In-season estimation of yield (INSEY) vs. grain significantly all parameters of quality protein maizeyield relationship was established for the area as: varieties (Tables 1 and 2). Significantly a taller plantINSEY= NDVI/GDD, where, GDD is the number of height, higher leaf area and leaf area index was recordedgrowing degree days greater than zero from seeding from 50-100 kg N ha-1 than other treatments. Similarly Liu(or seed emergence) to sensing. The INSEY provides an and Wiatrak [22] found significantly taller plants heightestimate of daily biomass production or growth rate [10] was recorded from treatments with 135 kg N ha thanand is therefore an important determinant of final grain treatments with 0 or 45 kg N ha . All yield components ofyield. Growth degree day (GDD) = (T maximm + T quality protein maize varieties (AMH760Q and BH-545)minimum/2)-base temperature for maize). The base were obtained between 50-100 kg N ha in 2013 and 2014temperature for maize is 10°C. The collected data were cropping season. There was correlation between NDVIanalyzed using [20]. Mean separation was done using reading and leaf area of quality protein maize (Fig. 2).least significance difference (LSD) at 5 % probability level Higher correlation between NDVI reading and leaf area[21]. were observed, with correlation coefficients of 0.46 and
RESULTS AND DISCUSSION resulted in a good correlation between NDVI and leaf area.
Yield Components of Maize: The mean yield components implying that greater NUE is achieved at 50 kg N ha .of quality protein maize were significantly affected by Application of 50 kg N ha was more responsive to maizeapplication of nitrogen rate in 2013 and 2014 cropping at vegetative growth of maize. season, except number of leaves plant , thousand grains1
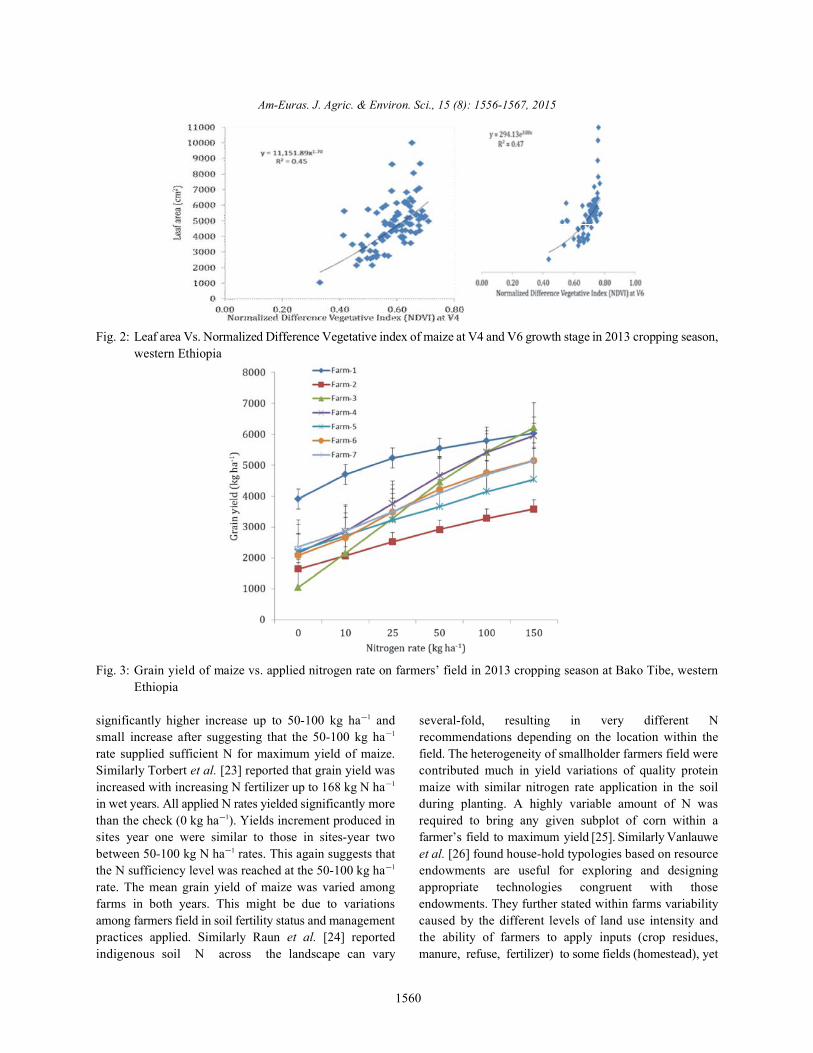
weight and harvest index of maize which was non- Grain Yield of Maize: Mean grain yield of maize wassignificant in 2014 (Tables 1 and 2). Significantly higher significantly increased by applied N fertilizer in allincrease of mean yield components of quality protein farms in both years (Tables 3 and 4) and (Figs. 3 and 4).maize parameters were obtained up to 50 kg N ha and Yields were highest in 2014 as compared to 2013 cropping1
slight increase up to 100 kg N ha then very minimum season which might be due to maize variety used1
increase. Increasing N rate from 0 to 100 kg ha increased difference in both years. N application rates produced1
1
1
1
0.47 at V4 and V6 growth stage in 2013 cropping season
It can be noted that leaf area peaked at 50 kg N ha ,1
1
1

Am-Euras. J. Agric. & Environ. Sci., 15 (8): 1556-1567, 2015
1559
Table 1: Effects of nitrogen rate on plant height, leaf area, leaf area index, dry biomass, harvesting index and thousand weight of quality protein maize(AMH760Q) on farmers’ field around Bako Tibe, western Ethiopia in 2013 cropping season
N kg ha Plant height (cm) Leaf area (cm) Leaf area index Dry biomass (kg ha ) Harvest index (%) Thousand grains weight (g)1 1
0 253 3119 1.52 11295 22.66 37210 274 4588 2.18 12955 25.18 37125 282 4626 2.19 13328 32.08 36050 289 5974 2.87 14701 33.24 391100 298 5313 2.55 15791 34.87 403150 297 5478 2.71 17950 32.21 415LSD (5%) 9.4981 924.8 0.4768 2887 8.2988 28.29CV (%) 5.48 31.06 33.24 32.8 24.74 11.96
Table 2: Effects of Nitrogen rate on mean number of leaf plant, leaf area, leaf area index plant height, thousand seed weight, dry biomass and harvest indexof quality protein maize (BHQP-545) on farmers’ field in Bako-Tibe districts, western Ethiopia in 2014 cropping season
N kg ha Number of leaves plant Leaf area (cm) Leaf area index Plant height (cm) Thousand grains weight (g) Dry biomass (kg ha ) Harvestindex (%)1 1 1
0 18 6304 2.82 263 290 17232 28.5510 19 6866 3.05 267 287 19765 27.1825 18 6917 3.07 277 287 23122 25.6850 19 7864 3.50 295 286 24455 26.6475 19 8405 3.74 288 291 25626 27.33100 19 8347 3.71 297 287 26391 28.13125 18 8581 3.81 292 305 28814 26.86150 19 8735 3.88 292 292 28158 27.26LSD (%) NS 728.63 0.3241 12.086 NS 3601.3 NSCV (%) 8.89 12.98 12.98 5.88 9.48 20.56 21.33NS= Non-significant difference at 5 % probability level
Table 3: Effects of nitrogen rate on mean grain yield of quality protein maize (AMH760Q) on farmers’ field around Bako-Tibe district, western Ethiopia. Mean grain yield ( kg ha )1
--------------------------------------------------------------------------------------------------------------------------------------------------N kg ha Farm-1 Farm-2 Farm-3 Farm-4 Farm-5 Farm-6 Farm-7 Mean1
0 3904 1637 1042 2165 2219 2077 2356 220010 4693 2064 2150 2851 2716 2656 2872 285725 5224 2518 3271 3753 3221 3480 3485 356450 5535 2916 4456 4652 3657 4218 4088 4217100 5787 3276 5422 5415 4140 4753 4699 4785150 6028 3578 6210 5947 4534 5150 5144 5227LSD (5%) 0.0468 147.35 214.52 251.93 128.98 234.38 146.86 64.475CV (%) 2.17 3.04 3.14 3.35 2.076 3.44 2.14 2.76Farm-1-6= farmers name (Takele Uluma, Adisu Fufa, Adisu Likessa, Mulatu Shuker, Shuker Gemechu, Tesfaye Tsagaye and Gutu Tolera)
Table 4: Effects of nitrogen rate on grain yield and thousand seed weight of quality protein maize (BHQP-545) on farmers’ field in Bako-Tibe districts, westernEthiopia in 2014 cropping season
Grain yield (kg ha )1
--------------------------------------------------------------------------------------------------------------------------------------------N kg ha Farm-1 Farm-2 Farm-3 Farm-4 Farm-5 Mean1
0 4322 2213 5249 6158 4890 456610 5199 3334 5596 6578 5070 515525 5273 4612 6562 6916 5449 576250 5606 6176 6604 7680 5860 638575 6588 6200 6690 8154 5905 6707100 6747 6678 6890 8177 6275 6953125 6854 6920 7098 8474 6290 7127150 7422 7205 7612 8798 6594 7526LSD (%) 1767.1 1126.5 1852.6 1684.7 1441.8 676.93CV (%) 16.81 11.87 16.18 12.63 14.22 14.9Farm1-5= farmers name (Bekele , Woyessa adugna, Kisa Dhaba, Shugt Aboma and Fekadu)
Am-Euras. J. Agric. & Environ. Sci., 15 (8): 1556-1567, 2015
1560
Fig. 2: Leaf area Vs. Normalized Difference Vegetative index of maize at V4 and V6 growth stage in 2013 cropping season,western Ethiopia
Fig. 3: Grain yield of maize vs. applied nitrogen rate on farmers’ field in 2013 cropping season at Bako Tibe, westernEthiopia
significantly higher increase up to 50-100 kg ha and several-fold, resulting in very different N1
small increase after suggesting that the 50-100 kg ha recommendations depending on the location within the1
rate supplied sufficient N for maximum yield of maize. field. The heterogeneity of smallholder farmers field wereSimilarly Torbert et al. [23] reported that grain yield was contributed much in yield variations of quality proteinincreased with increasing N fertilizer up to 168 kg N ha maize with similar nitrogen rate application in the soil1
in wet years. All applied N rates yielded significantly more during planting. A highly variable amount of N wasthan the check (0 kg ha ). Yields increment produced in required to bring any given subplot of corn within a1
sites year one were similar to those in sites-year two farmer’s field to maximum yield [25]. Similarly Vanlauwebetween 50-100 kg N ha rates. This again suggests that et al. [26] found house-hold typologies based on resource1
the N sufficiency level was reached at the 50-100 kg ha endowments are useful for exploring and designing1
rate. The mean grain yield of maize was varied among appropriate technologies congruent with thosefarms in both years. This might be due to variations endowments. They further stated within farms variabilityamong farmers field in soil fertility status and management caused by the different levels of land use intensity andpractices applied. Similarly Raun et al. [24] reported the ability of farmers to apply inputs (crop residues,indigenous soil N across the landscape can vary manure, refuse, fertilizer) to some fields (homestead), yet

Am-Euras. J. Agric. & Environ. Sci., 15 (8): 1556-1567, 2015
1561
Fig. 4: Mean grain yield vs. nitrogen rate on farmers’ field around Bako Tibe in 2014 cropping season, western Ethiopia
exploiting others (distant fields). Differences in soil farmers field difference. Significantly higher mean grainvariability between farms that vary in resource yield maize of quality maize varieties (AMH760Q andendowment are attributable to differential soil BH-545) was obtained between 50-100 kg N ha in 2013management between farms and fields over time [27]. and 2014 cropping seasons. Therefore application ofWibawa et al. [28]; and Penny [29] reported within-field 50-100 kg N ha was profitable for quality protein maizeyield variation is typically attributed to variability in soil varieties around Bako-Tibe western Ethiopia.texture, changes in landscape position, cropping history, There was correlation between INSEY and meansoil physical and chemical properties and nutrient grain yields of maize (Figs. 5, 6 and 7). Better correlationavailability across fields. This indeed the need site based between INSEY and mean grain yields of maize weremanagement nitrogen for maize production by maintain observed, with correlation coefficients of 0.36 and 0.60 inmaize production levels, while reducing nitrogen input 2013 and 2014 cropping season (Figs. 5 and 6), indicatingapplied using sensor based N management. The NDVI that predicating grain yield with In Season Estimation ofhandheld sensor is therefore an interesting tool in order Yield, resulted in a good correlation between INSEY andto monitor efficiently and in real time crop growth under mean grain yields of quality protein maize. INSEY wasdifferent management systems [12]. Similarly Kanke et al. found to be correlated to grain yield [8]. Significantly[15] using the optical sensor system in agriculture can be higher correlation coefficients between mean grain yieldsvery useful in detecting plant N status and making with In Season Estimation of Yield were obtained in 2014fertilizer recommendations within smallholder farmers field. cropping season indicating better predication mean grainTherefore the NDVI measurements can be used for crop yield of QPM (BH-545) with right niche of productionperformance judgment both in time and space, giving area. In 2014 cropping season correlation coefficientsmore dynamic and immediate information than static of 0.25 was obtained at V6 and V8 growth stages ofend-of season yield results to avoid the smallholder maize (Fig. 7). It can be noted that mean grain yield peaked
1
1

Am-Euras. J. Agric. & Environ. Sci., 15 (8): 1556-1567, 2015
1562
Fig. 5: Grain yield vs. In Season Estimation of Yield (INSEY) of maize in V6 growth stage of maize in 2013 croppingseason at Bako Tibe, western Ethiopia
Fig. 6: Grain yield vs. In Season Estimation of Yield at V4 growth stage of maize on farmers’ field at Bako Tibe in 2014cropping season, western Ethiopia
between 50-100 kg N ha , implying that greater NUE is Interrelationships Between GrowthPhenology and Yield1
achieved at 50-100 kg N ha . Application of 50-100 kg N Components of Maize: Application nitrogen rates were1
ha was more responsive to maize at vegetative growth significantly positively associated with all growth1
of maize. This method of nitrogen management for maize phenology, yield and yield components of maize (Table 6).production provides an opportunity for the producer to However, there were negatively significant associationsapply only the needed N fertilizer on their farms, thereby between application nitrogen rates and number of deadmaximizing their production, reducing their cost of leafs (r= -0.205) indicating application of higher nitrogenproduction and reducing the incidence of environmental rates have directly reduced the number of dead leafs perpollution. In conclusion based on promising result plant . Significantly higher positive association betweenvalidation of nitrogen rate for side dressing and N use application nitrogen rates and leaf area and leaf areaefficiency of quality protein maize varieties (AMH760Q index; between application nitrogen rates and grain yield;and BH-545) production in the area is needed. and between application nitrogen rates and plant height
1

Equation: Exponential Growth, s ingle 2 parameter F = 180,083.14x 1.42
R² = 0.25
2000
3000
4000
5000
6000
7000
8000
9000
10000
11000
0.04 0.05 0.06 0.07 0.08 0.09 0.10 0.11 0.12In Season Estimation of Yield at V6
SE estimate: 0.1863
In Season Estimation of Yield at V8
0.06 0.07 0.08 0.09 0.10 0.11
Grain yield (kg ha 1
2000
4000
6000
8000
10000
12000Equation: Exponential Growth, Single, 2 ParameterF= 467.3515*e (26.7229*X )R2
SE of estimate0.2487
3.2810
Am-Euras. J. Agric. & Environ. Sci., 15 (8): 1556-1567, 2015
1563
Fig. 7: Combined mean grain yield vs. In Season Estimation of Yield at V6 and V8 growth stage of maize on farmers fieldat Bako Tibe in 2014 cropping season, western Ethiopia
(r= 0.41, 0.43 and 0.57) were obtained indicating showed significantly positive association with mean grainapplication of nitrogen rates directly increased leaf area, yield of maize (r = 0.53), it means that if the grain yield wasleaf area index, grain yield and plant height of quality increased, the harvest index will be increase (Table 6).protein maize varieties in 2013 cropping season (Table 6). The calculated In Season Estimation yield at V4 with InNormalized difference vegetative index at V4 and V6 were Season Estimation yield at V6 in possibility level is 0.5 andshowed significant positive association with plant 0.1 meaningful positive association (r=0.75), it means that,height of quality protein maize in 2013 cropping season. the higher In Season Estimation yield at V4, put positiveThis indicated that the normalized difference vegetative increase on In Season Estimation yield at V6.index measurements the higher will be the plant height of In 2014 cropping season application nitrogen withquality protein maize vice versa. Normalized difference growth phenology, yield and yield components ofvegetative index measurements with in season estimation quality protein maize, respectively in possibility levelsof yield at 0.1 and 0.5 have positive meaningful perfect have 0.1 and 0.5 positive meaningful correlation betweencorrelation it means that if the normalized difference (r=0.46 to 0.81) except thousand seed weight and harvestvegetative index measurements increase, the In Season index which were non-significant and negativeEstimation of Yield will be increase for quality protein association (Table 7). It means that if the application ofmaize in 2013 cropping season. Plant height and dry nitrogen rates increase, the growth phenology, yield andbiomass of with in grain yield of quality protein maize at yield components of quality protein maize will be0.1 and 0.5 have positive meaningful correlation (r= 0.55 increased. Significantly higher positive associationand 0.69), indicating the higher plant height and dry (r= 0.75 and 0.81) was obtained between applicationbiomass, the higher will be grain yield of quality protein nitrogen and Normalized Difference Vegetative Index andmaize in 2013 cropping season. In Season Estimation of Yield at V4 and V6 growth stage
The character of leaf length and leaf width with of quality protein maize, it means that, if the application ofquality protein maize leaf area plant and leaf area index nitrogen rates is further, the Normalized Difference1
plant , respectively, in possibility levels have 5 % and Vegetative Index and In Season Estimation of Yield at V41
1% positive meaningful correlation (r=0.76 and 0.82; and and V6 growth stage of quality protein maize will be0.73 and 0.81), it means that, if the leaf length and leaf increased. Number of leaves plant was negativelywidth is further, the maize leaf area and leaf area index will associated with leaf area (r= -0.078), leaf area indexbe increased. The leaf area with leaf area index of quality (r= -0.076) and harvest index (r= -0.26) of quality proteinprotein maize, respectively in possibility levels have 5% maize but positively associated with other parameters ofand 1% positive meaningful perfect correlation (r=0.99). maize. This may be attributed to the fact that increased inThis indicated that the higher the leaf area the higher will number of leaves plant and might have directly reducedbe the leaf area index and vice versa. Harvest index was leaf area, leaf area index and harvest index (Table 7).
1
1

Am-Euras. J. Agric. & Environ. Sci., 15 (8): 1556-1567, 2015
1564
Table 5: Relationship between various phonological growth, yield and yield components of maize in Bako Tibe, 2013 cropping season, western Ethiopia
N NDVIF NDVIS DL NL PH GY TW LL LW LA LAI DB HI INSEYS INSEYS
N 0.217* 0.316* -0.205* 0.137 0.573* 0.433* 0.330* 0.225* 0.336* 0.408* 0.412* 0.367* 0.224* 0.217* 0.316*NDVIF 0.751* 0.179** 0.104 0.607* 0.302* 0.039 0.451* 0.507* 0.477* 0.423* 0.251* 0.164 1* 0.751*NDVIS 0.079* 0.126* 0.660* 0.452* 0.224* 0.442* 0.501* 0.486* 0.447* 0.344* 0.274* 0.751* 1*DL 0.122 -0.106 -0.341* -0.187** 0.067 -0.058 -0.047 -0.088 -0.173** -0.217* 0.179** 0.079NL 0.183 0.111 -0.019 0.072 0.124 0.146 0.136 0.058 0.147 0.105 0.126PH 0.551* 0.3389* 0.371* 0.487* 0.521* 0.495* 0.447* 0.308* 0.607* 0.660*GY 0.425* 0.306* 0.363* 0.400* 0.395* 0.691* 0.530* 0.302* 0.452*TW 0.199** 0.182* 0.256* 0.261* 0.294* 0.308* 0.039 0.224*LL 0.444* 0.755* 0.731* 0.336* 0.054 0.451* 0.442*LW 0.820* 0.810* 0.362* 0.120 0.507* 0.501*LA 0.995* 0.361* 0.155 0.477* 0.486*LAI 0.354* 0.154 0.423* 0447*DB 0.182** 0.251* 0.344*HI 0.164 0.274*INSEYF 0.751*INSEYS
N= Nitrogen rate, NDVIF= Normalized difference vegetative index at V4, NDVIS= Normalized difference vegetative index at V6, DL= number of dead leaf,NL= number of leaf plant-1, PH= Plant height, GY= grain yield, TW= thousand seed weight, LL= Leaf length, LW= Leaf width, LA= Leaf area plant-1, LAI=Leaf area index plant-1, DB= Dry biomass, HI= Harvest index, INSEYS= In season Estimation of Yield at V4, INSEYS=In season Estimation of Yield atV6, *and**= significant at 1 and 5 % probability level.
Table 6: Relationship between various phonological growth, yield and yield components of maize in Bako Tibe, 2014 cropping season, western Ethiopia.
N LN LA LAI PH NDVIF NDVIS GY TW DB HI INSEYF INSEYS
N 0.060* 0.609* 0.606* 0.461* 0.809* 0.752* 0.621* 0.112 0.483* -0.011 0.809* 0.753*LN -0.078 -0.076 0.379* 0.162 0.169 0.186** 0.036 0.298* -0.264 0.163 0.169LA 0.999* 0.396* 0.555* 0.503* 0.388* 0.001 0.316* 0.019 0.555* 0.503*LAI 0.397* 0.556* 0.500* 0.388* 0.001 0.315* 0.019 0.556* 0.500*PH 0.538* 0.507* 0.409* 0.031 0.361* -0.076 0.538* 0.507*NDVIF 0.855* 0.721* 0.056 0.569* -0.072 1* 0.855*NDVIS 0.648* 0.109 0.491* -0.021 0.855* 1*GY 0.035 0.668* 0.067 0.721* 0.648*TW 0.090 -0.091 0.056 0.109DB -0.636 0.569 0.491HI -0.072 -0.021INSEYF 0.855*INSEYS
N= Nitrogen rate, NL= number of leaf plant-1, LA= Leaf area plant-1, LAI= Leaf area index plant-1 , PH= Plant height, NDVIF= Normalized differencevegetative index at V4, NDVIS= Normalized difference vegetative index at V6, GY= grain yield, TW= thousand seed weight, , DB= Dry biomass, HI= Harvestindex, INSEYS= In season Estimation of Yield at V4, INSEYS=In season Estimation of Yield at V6, *and**= significant at 1 and 5 % probability level.
Table 7: Rainfall, temperature and relative humidity data for the Bako Agricultural Research Center
Rainfall (mm)-----------------------------------------------------------------------------------------------------------------------------------------------------------------
Year J F M A M J J A S O N D Total
Mean 6.83 12.70 40.07 57.63 138.87 265.36 261.75 251.46 132.88 60.18 25.66 12.22 1266Temperature (0c) Mean
Minimum 11.48 11.60 13.42 13.79 14.63 14.49 14.67 14.77 14.39 13.81 12.72 11.02 13.40Maximum 30.37 31.84 31.92 31.57 29.50 25.83 24.65 24.43 25.30 27.75 28.91 29.84 28.49Mean 20.93 21.72 22.67 22.68 22.06 20.16 19.66 19.60 19.85 20.78 20.81 20.43 20.95Relative humidity (%) 49 46 47 51 53 65 64 62 64 55 53 50 54.80

Am-Euras. J. Agric. & Environ. Sci., 15 (8): 1556-1567, 2015
1565
Table 8: Rainfall and temperature data obtained from nearby weather stations.Rainfall (mm)-----------------------------------------------------------------------------------------------------------------------------------------------------------------
Years J F M A M J J A S O N D TotalMean 13.8 7.3 33.2 59.0 127.6 212.5 241.3 301.1 207.6 48.9 36.6 3.9 1292.8
Temperature (°C) MeanMinimum 12.3 13.8 14.8 15.4 15.3 15.2 14.6 14.7 14.3 12.6 11.7 12.5 14.0Maximum 30.5 32.0 31.7 31.2 29.0 25.6 23.9 24.3 25.8 28.0 28.9 29.1 28.5Mean 21.4 22.9 23.2 23.3 22.2 20.4 19.3 19.5 20.0 20.3 20.3 20.8 21.2
Leaf area was revealed perfect positive association with negative association with harvest index (r= -0.64). Thisleaf area index (r = 0.99). This indicated that the higher the may be attributed to the fact that higher dry biomassleaf area the higher will be the leaf area index and vice might have directly reduced harvest index of qualityversa. Leaf area and leaf area index were significant protein maize. The NDVI has been correlated to plantpositive association with Normalized Difference physiological parameters, maize yield and biomassVegetative Index measurements and In Season Estimation production (Govaerts, 2007). Govaerts (2007) found theof Yield (r= 0.50 and 0.55) at V4 and V6 growth stage of highest correlation between NDVI and final maize yieldquality protein maize. This indicates the higher leaf area was again obtained during the reproductive phase R1.and leaf area index the higher will be Normalized Therefore there a strong relationship was observedDifference Vegetative Index measurements and In Season between NDVI, INSEY and grain yield of quality proteinEstimation of Yield. maize.
Plant height have 5 % and 1% positive meaningfulcorrelation with Normalized Difference Vegetative Index CONCLUSIONreading and calculated In Season Estimation of Yield at V4and V6 (r= 0.50 and 0.54). This revealed if the plant height The mean yield components of quality protein maizeis further, the Normalized Difference Vegetative Index were significantly affected by application of nitrogen ratereading and calculated In Season Estimation of Yield will in 2013 and 2014 cropping season. Higher correlationbe increased. The Normalized Difference Vegetative Index between NDVI reading and leaf area were observed, withreading at V4 and V6 have 5 % and 1% positive correlation coefficients of 0.46 and 0.47 at V4 and V6meaningful correlation with grain yield (r=0.72 and 0.65). growth stage in 2013 cropping season. N application ratesIt means that, Normalized Difference Vegetative Index produced significantly higher increase up to 50-100 kgreading at V4 and V6 put positive impression in grain yield ha and small increase after suggesting that the 50-100of quality protein maize. The Normalized Difference kg ha rate supplied sufficient N for maximum yield ofVegetative Index reading at V4 and V6 have 5 % and 1% maize. Significantly higher mean grain yield maize ofhigher and perfect positive meaningful correlation with quality maize varieties (AMH760Q and BH-545) wasIn Season Estimation yield grain yield (r=0.85 and 1). obtained between 50-100 kg N ha in 2013 and 2014This indicated that the higher the Normalized Difference cropping seasons. Better correlation coefficients of 0.36Vegetative Index reading at V4 and V6 the higher will be and 0.60 in 2013 and 2014 cropping season betweenthe In Season Estimation yield and vice versa. Mean grain INSEY and mean grain yields of maize were observed,yield of maize was positively associated with dry biomass indicating that predicating grain yield with In Seasonmaize (r = 0.67). This may be attributed to the fact that Estimation of Yield of quality protein maize. Theincreased grain yield might have directly increased dry Normalized Difference Vegetative Index (NDVI) reading atbiomass. Significantly positive correlation coefficients V4 and V6 have 5 % and 1% positive meaningfulwere observed between dry biomass and Normalized correlation with grain yield (r=0.72 and 0.65). RemotelyDifference Vegetative Index reading and In Season sensed NDVI green seeker can provide valuableEstimation of Yield at V4 (r= 0.57) and dry biomass and information about in-field N variability in maize andNormalized Difference Vegetative Index reading and In significant linear relationships between sensor NDVI andSeason Estimation of Yield at V6 (r= 0.49). This showed maize grain yield have been found suggesting that an Nthe higher biomass, the higher will be Normalized recommendation based on NDVI could optimize NDifference Vegetative Index reading and In Season application and N use efficiency. Therefore there a strongEstimation of Yield. Dry biomass was non-significantly relationship was observed between NDVI, INSEY and
1
1
1

Am-Euras. J. Agric. & Environ. Sci., 15 (8): 1556-1567, 2015
1566
grain yield of quality protein maize. In conclusion based 5. Carranca, C., 2012. Nitrogen Use Efficiency byon promising result validation of nitrogen rate for side Annual and Perennial Crops. In: Farming for Fooddressing and N use efficiency of quality protein maize and Water Security; Lichtfouse, E., (Ed) Springervarieties (AMH760Q and BH-545) production in the area Science+Business Media: Dordrecht, theis needed. Netherlands, pp: 57-82.
ACKNOWLEDGEMENTS The evolution and future of earth’s nitrogen cycle.
The authors thank International Maize and Wheat 7. Raun, W.R. and G.V. Johnson, 1999. Review andImprovement Centre (CIMMYT), Regional University interpretation Improving Nitrogen Use EfficiencyFund for Capacity Building for Agriculture (RUFORUM), for Cereal Production. Agronomy Journal,International Development Research Center (IDRC) and 91: 357-363.Carnegie Corporation of New York funding the 8. Stevens, L.J., 2014. A regional investigation ofexperiment. I am very grateful to Ambo Plant Protection in-season nitrogen requirement for maize using modelResearch Center for providing me all necessary and sensor based recommendation approaches.equipment’s and logistics during the research work. M.Sc. Thesis. University of Nebraska -Lincoln,All the technical and field assistants of Land and Water United States, pp: 309.Resources Research Process are also acknowledged for 9. Li, F., Y. Miao, F. Zhang, Z. Cui, R. Li, X. Chen,unreserved effort during executing the experiment. H. Zhang, J. Schroder, W.R. Raun and L. Jia, 2009.Holleta and Debre Zeit Agricultural Research Center, In-season optical sensing improves nitrogen-useSoil and Plant Analysis Laboratory are acknowledged for efficiency for winter wheat. Soil Science Society oftheir provision of laboratory service for soil. I want to America Journal, 73(5): 1566-1574.thank farmers at Bako Tibe for providing me their land for 10. Raun, W.R., J.B. Solie, K.L. Martin, K.W. Freeman,field research work. M.L. Stone, G.V. Johnson and R.W. Mullen,
REFERENCES Variability in Corn Evaluated Using Optical
1. Zhang, N., Y. Gibon, A. Gur, C. Chen, N. Lepak, 28: 173-182.M. Ho¨hne, Z. Zhang, D. Kroon, H. Tschoep, M. Stitt 11. Zillmann, E., S. Graeffa, J. Linka, W.D. Batchelorb andand E. Buckler, 2010. Fine Quantitative Trait Loci W. Claupeina, 2006. Assessment of cereal nitrogenMapping of Carbon and Nitrogen Metabolism requirements derived by optical on-the-go sensorsEnzyme Activities and Seedling Biomass in the on heterogeneous soils. Agronomy Journal,Maize IBM Mapping Population. Plant Physiology, 98: 682-690.154: 1753-1765. 12. Govaerts, B., 2007. Conservation agriculture, a
2. Glass, A.D.M., 2003. Nitrogen use efficiency of crop sustainable production alternative for the (sub)plants: physiological constraints upon nitrogen tropical Highlands; Toward an integrated evaluationabsorption. Critical Review in Plant Sci., 22: 453-470. of the system. PhD. Thesis. Dissertationes De
3. Good, A.G., A.K. Shrawat and D.G. Muench, 2004. Agricultura, pp: 277.Can less yield more? Is reducing nutrient input into 13. Tubaña, B.S., D.B. Arnall, O. Walsh, B. Chung,the environment compatible with maintaining crop J.B. Solie, K. Girma and W.R. Raun, 2008.production? Trends in Plant Science, 9: 597-605. Adjusting midseason nitrogen rate using a
4. Pasuquin, J.M., C. Witt and M. Pampolino, 2010. A sensor-based optimization algorithm to increase usenew site-specific nutrient management approach for efficiency in corn (Zea mays L.). Journal Plantmaize in the favorable tropical environments of Nutrition,31: 1393-1419.Southeast Asia. 19 World Congress of Soil Science, 14. Filella, I., L. Serrano, J. Serra and J. Penuelas, 1995.th
Soil Solutions for a Changing World. 1-6 August Evaluating wheat nitrogen status with canopy2010, Brisbane, Australia. Published on DVD., reflectance indices and discriminant analysis. Croppp: 4-7. Science, 35: 1400-1405.
6. Canfield, D.E., A.N. Glazer and P.G. Falkowski, 2010.
Science, 330: 192-196.
2005. Growth Stage, development and Spatial
Sensor Readings. Journal of Plant Nutrition,

Am-Euras. J. Agric. & Environ. Sci., 15 (8): 1556-1567, 2015
1567
15. Kanke, Y., W.R. Raun, J. Solie, M. Stone and 24. Raun, W.R., I. Ortiz-Monasterio and J.B. Solie, 2009.R. Taylor, 2012. Red edge as a potential index for Temporally and spatially dependent nitrogendetecting differences in plant nitrogen status in management for diverse environments. Section IIwinter wheat. Journal of Plant Nutrition, Making of a Wheat Crop, pp: 203-214.35: 1526-1541. 25. Schmidt, J.P., A.J. DeJoia, R.B. Ferguson, R.K.
16. MBARC., 2014. Meteorological data of Bako area for Taylor, R.K. Young and J.L. Havlin, 2002. Corn yield1960-2014. Bako, Oromia, Etiopia. response to nitrogen at multiple in-field locations.
17. NMSA., 2014. Meteorological data of Ilu-Gelan area Agronomy Journal, 94: 798-806.for 2009-2014. NMSA, Addis Ababa, Ethiopia, pp: 2. 26. Vanlauwe, B., D. Coyne, J. Gockowski, S. Hauser,
18. Mesfin, A., 1998. Nature and Management of J. Huising, C. Masso, G. Nziguheba, M. Schut andEthiopian Soils, Alemaya University of Agriculture, P. Van Asten, 2014. Sustainable intensification andEthiopia, pp: 272. the African smallholder farmer. Current Opinion in
19. FAO., 2007. FAO World Reference Base for Soil Environmental Sustainability, 8: 15-22.Resources. World Soil Resources Report 103. FAO, 27. Tittonell, P., A. Muriuki, C.J. Klapwijk, K.D.Rome, pp: 128. Shepherd, R. Coe and B. Vanlauwe, 2012. Soil
20. SAS., 2010. SAS/STAT Software Syntax, Version 9.0. heterogeneity and soil fertility gradients inSAS Institute, Cary, NC, USA. smallholder farms of the East African highlands. Soil
21. Steel, R.G.D. and J.H. Torrie, 1980. Principles and Science Society of America Journal, 77: 525-538.Procedures of Statistics: A Biometrical Approach. 28. Wibawa, W.D., D.L. Diludlu, L.J. Swenson, D.G.2 Edition. McGraw-Hill, New York, pp: 631. Hopkins and W.C. Dahnke, 1993. Variable fertilizernd
22. Liu, K. and P. Wiatrak, 2011. Corn production and application based on yield goal and soil map unit.plant characteristics response to N fertilization Journal of Production Agriculture, 6: 165-166.management in dry-land conventional tillage 29. Penny, D.C., 1996. Yield and nutrient mapping for sitesystem. International Journal of Plant Production, specific fertilizer management. Communications in5(4): 405-416. Soil Science and Plant Analysis, 27: 1265-1279.
23. Torbert, H.A., K.N. Potter and J.E. Morrison, 2001.Tillage system, fertilizer nitrogen rate and timingeffect on corn yields in the Texas Black land Prairie.Agronomy Journal, 93: 1119-1124.