sensitivity analysis of hydrological parameters in...
TRANSCRIPT
Sensitivity analysis of hydrological parameters in modeling flowand transport in the unsaturated zone of Yucca Mountain,Nevada, USAKeni Zhang & Yu-Shu Wu & James E. Houseworth
Abstract The unsaturated fractured volcanic deposits atYucca Mountain in Nevada, USA, have been intensivelyinvestigated as a possible repository site for storing high-level radioactive waste. Field studies at the site haverevealed that there exist large variabilities in hydrologicalparameters over the spatial domain of the mountain.Systematic analyses of hydrological parameters using asite-scale three-dimensional unsaturated zone (UZ) flowmodel have been undertaken. The main objective of thesensitivity analyses was to evaluate the effects ofuncertainties in hydrologic parameters on modeled UZflow and contaminant transport results. Sensitivity analy-ses were carried out relative to fracture and matrixpermeability and capillary strength (van Genuchten α)through variation of these parameter values by onestandard deviation from the base-case values. The param-eter variation resulted in eight parameter sets. Modelingresults for the eight UZ flow sensitivity cases have beencompared with field observed data and simulation resultsfrom the base-case model. The effects of parameteruncertainties on the flow fields were evaluated throughcomparison of results for flow and transport. In general,this study shows that uncertainties in matrix parameterscause larger uncertainty in simulated moisture flux thancorresponding uncertainties in fracture properties forunsaturated flow through heterogeneous fractured rock.
Résumé Considérée comme un site potentiel pour lestockage de déchets hautement radioactifs, la zone nonsaturée et fracturée de la montagne Yucca dans le Nevada,USA, a fait l’objet de nombreuses études. Des inves-tigations de terrain au niveau du site ont révélé l’existenced’une importante variabilité spatiale pour les paramètreshydrogéologiques. Des analyses systématiques de cesparamètres ont été effectuées en utilisant un modèled’écoulement de la zone non saturée (ZNS), en 3-D et à
l’échelle du site. Le principal objectif des analyses desensibilité était d’évaluer les effets engendrés par desincertitudes au niveau des paramètres hydrogéologiques,sur les résultats de la modélisation d’écoulement et detransport de polluants dans la ZNS. Les analyses desensibilité ont été réalisées en fonction des perméabilitésde fracture et de matrice et de la force capillaire (vanGenuchten α), à travers la variation des valeurs de cesparamètres et un écart type par rapport aux valeurs les plusprobables. La démarche a conduit à huit séries deparamètres. Les résultats de la modélisation pour les huitcas d’écoulement dans la ZNS ont été comparés avec desdonnées observées sur le terrain et les résultats desimulations obtenus avec le modèle aux conditionsinitiales. Les effets sur les champs d’écoulement desincertitudes sur les paramètres ont été évalués encomparant les résultats pour l’écoulement et le transport.En général, cette étude montre que pour un écoulementinsaturé à travers un milieu hétérogène et fracturé, lesincertitudes sur les paramètres de la matrice entraînent deserreurs plus importantes sur le flux d’humidité simulé quedes incertitudes équivalentes sur les propriétés de fracture.
Resumen Se ha investigado intensivamente la zonafracturada no saturada de Montaña Yuca en Nevada,Estados Unidos de América, como un sitio potencial parael almacenamiento de residuos radioactivos de alto nivel.Los estudios de campo del sitio han mostrado que existeuna gran variabilidad en los parámetros hidrológicos entodo el ambiente espacial de la montaña. Se ha realizadoanálisis sistemático de parámetros hidrológicos usando unmodelo 3-D, a escala del sitio, de flujo (UZ) de la zona nosaturada. El principal objetivo del análisis de sensibilidadfue evaluar los efectos de las incertidumbres en losparámetros hidrológicos en el modelo UZ y los resultadosdel transporte de contaminantes. Los análisis de sensibi-lidad se llevaron a cabo en relación con la permeabilidadintersticial y de fracturas y la fortaleza de capilaridad (αde van Genuchten), haciendo variar los valores de esosparámetros mediante una desviación standard a partir delos valores básicos del caso. La variación de parámetrosdio por resultado grupos de ocho parámetros. Losresultados del modelo para los ocho casos de sensibilidadde flujo UZ se han comparado con datos de campo y losresultados de la simulación del modelo de caso básico. Seevaluaron los efectos de las incertidumbres de los parámetros
Received: 20 October 2005 /Accepted: 10 April 2006Published online: 27 June 2006© Springer-Verlag 2006
K. Zhang ()) :Y.-S. Wu : J. E. HouseworthEarth Sciences Division,Lawrence Berkeley National Laboratory,Berkeley, CA 94720, USAe-mail: [email protected]
Hydrogeology Journal (2006) 14: 1599–1619 DOI 10.1007/s10040-006-0055-y

en los campos de flujo mediante comparación deresultados para flujo y transporte. En general, este estudiomuestra que los resultados de las incertidumbres en losparámetros de la matriz causan mayor incertidumbre en lasimulación del flujo de humedad que las correspondientesincertidumbres en propiedades de fracturas para flujo nosaturado a través de roca fracturada heterogénea.
Keywords Unsaturated zone . Fractured rocks .Numerical modeling . Hydraulic properties .YuccaMountain
Introduction
Site characterization studies of the unsaturated tuff atYucca Mountain in Nevada, USA (Fig. 1a) started in thelate 1970s. The initial hydrological, geological, andgeophysical investigations of Yucca Mountain focusedon the feasibility of the site as a geological repository forstoring high-level radioactive waste. These investigationsled to a conceptual model of unsaturated zone (UZ) flowprocesses (Montazer and Wilson 1984). Soon after,theoretical studies and numerical modeling efforts werecarried out to quantitatively model unsaturated groundwa-ter flow and to simulate the natural state of the UZunderlying Yucca Mountain (e.g., Rulon et al. 1986;Pollock 1986; Tsang and Pruess 1987; Weeks 1987).
Since the 1990s, more progress was made in developmentand application of site-scale three-dimensional UZ flowand transport models using the effective continuummethod (ECM) approach. These models incorporatedgeological and hydrological complexities such as geolog-ical layering, degree of welding, fault offsets, and distinctproperties for rock matrix and fractures (Wittwer et al.1992, 1995). Ahlers et al. (1995a,b) continued develop-ment of the UZ site-scale model with increased spatialresolution. Their studies incorporated additional physicalprocesses of gas and heat flow and introduced an inversemodeling approach for estimating model-input properties.More comprehensive UZ models were developed for theTotal System Performance Assessment-Viability Assess-ment (TSPA-VA; e.g., Wu et al. 1999a,b; Bandurraga andBodvarsson 1999; Ahlers et al. 1999). This new generationof UZ flow models used a more rigorous dual-permeabilitynumerical approach for handling unsaturated flow infractured rock and was able to better represent the observedhydrologic conditions such as perched water bodies.
More recent UZ models include those primarily devel-oped for the TSPA-site recommendation (SR) calculations(e.g., Wu et al. 2002a; Moridis et al. 2003; Robinson et al.2003) and for the TSPA-license application (LA; e.g., Wuet al. 2004, BSC 2004f). These TSPA-SR and TSPA-LAmodels have been significantly improved by usinghigher spatial resolution and incorporating most updatedfield measurements. More importantly, the newer models
Fig. 1 a Location map of the study area; b Schematic showing the conceptualized flow processes and effects of capillary barriers, majorfaults, and perched-water zones within a typical east–west cross section of the UZ flow model domain
1600
Hydrogeology Journal (2006) 14: 1599–1619 DOI 10.1007/s10040-006-0055-y

have taken into account coupled processes of liquid flowand geochemical transport in highly heterogeneous,unsaturated fractured porous rock, and have been appliedto analyze the effect of current and future climates onradionuclide transport through the UZ system.
This report presents the results of the continuing effortin developing and applying flow and transport models ofthe Yucca Mountain UZ system. More specifically, thiswork documents the results of sensitivity analyses of site-scale UZ flow-model parameters. The sensitivity analysesare intended to evaluate the effects of uncertainties infracture and matrix hydrologic parameters on unsaturatedzone flow and transport-model results. In performing suchsensitivity and uncertainty analyses, the UZ flow model(Wu et al. 2004, BSC 2004f), incorporates the uncertain-ties of the most important fracture and matrix parameters.The main emphasis of this study is on confirming thedefensibility and credibility of the unsaturated zone flowmodel, including the effect of variability in hydrologicalproperties, in describing unsaturated zone flow andtransport processes at Yucca Mountain.
The surface net infiltration is described using a futurehigh-infiltration scenario, called the glacial transition,mean infiltration map. The uncertainties for fracture andmatrix permeabilities and van Genuchten α are incorpo-rated into the analyses. Sensitivity simulations wereperformed using the UZ flow model by incrementing ordecrementing a selected parameter by one standarddeviation; this modification was performed for all theunits/layers as well as faults. Each simulation adjusts oneparameter only, with other parameters not changing theirvalues from the base parameter set (the parameter set usedfor site-scale flow modeling, which is from field mea-surement and model calibrations). The parameter variationresults in a total of eight parameter sets that account forthe uncertainties of the four hydrological parameters.Eight new three-dimensional UZ flow fields were gener-ated using the eight parameter sets. Then the sensitivity ofthe UZ model results, as well as radionuclide transportfrom the repository to the water table, were evaluated forthese flow fields. The glacial transition, mean infiltrationmap, representing future climate, is used as the topboundary condition for all cases.
Site hydrogeology and conceptual model
The UZ formation is between 500 and 700 m thick in thearea of the repository and overlies a relatively flat watertable. The current design places the repository in thehighly fractured Topopah Spring welded tuff unit, approx-imately 300 m above the water table. Geologically, YuccaMountain is a structurally complex system of Tertiaryvolcanic rock. Subsurface hydrological processes in theUZ occur in a heterogeneous environment of layered,anisotropic, and fractured volcanic rocks (Scott and Bonk1984). These UZ volcanic formations consist of alternat-ing layers of welded and nonwelded ash flow and air-falltuffs. The primary geological formations, beginning from
the land surface and progressing downward, are the TivaCanyon (TCw), Yucca Mountain, Pah Canyon, and theTopopah Spring tuffs (TSw) of the Paintbrush Group(PTn). Underlying these are the Calico Hills (CHn)Formation and the Prow Pass, Bullfrog, and Tram tuffsof the Crater Flat (CFu) Group (Buesch et al. 1995).
Figure 1b presents a typical geological profile along avertical east–west transect of the northern model domain,displaying the conceptual model used in this study toanalyze UZ flow patterns. As illustrated in Fig. 1b, theground surface of the UZ is subject to spatially andtemporally varying net infiltration pulses from precipita-tion, which provide the water source for deep percolationinto the UZ. Surface infiltration pulses are expected tomove rapidly through the top highly fractured TCw unit,with little attenuation in travel times. Once it enters thePTn, percolating water may be subject to very differentprocesses, because the PTn unit has very different hydro-geologic properties from the TCw and TSw units, whichdisplay the low porosity and intensive fracturing typical ofthe densely welded tuffs. In comparison, the PTn matrixhas high porosity and low fracture intensity, whichprovides a large capacity for storing groundwater oftransient percolation from the TCw unit. In addition, thepossibility for capillary barriers exists in the PTn layers(Montazer and Wilson 1984; Wu et al. 2002b), becauselarge contrasts in rock properties exist across the interfacesof units and inner PTn layers.
In the lower hydrogeological units of the UZ, field testshave revealed perched water in several boreholes at YuccaMountain (Rousseau et al. 1998). These perched waterlocations are found to be associated with low-permeabilityzeolites in the CHn or the densely welded basal vitrophyreof the TSw unit, below the repository horizon. Therefore,a permeability-barrier conceptual model has been used toexplain perched water phenomena in UZ flow-modelingstudies since 1996 (Wu et al. 1999b, 2002a).
Another complicating factor for UZ flow is theexistence of many vertical or near-vertical faults in theUZ. These faults are also expected to play an importantrole in impacting percolation flux. Permeability withinfaults is much higher than that in the surrounding tuff(Montazer and Wilson 1984). For example, pneumaticpermeability measurements taken along portions of faultsreveal low air-entry pressures, indicating that largefracture apertures are present in the fault zones. Faultzones may act as vertical capillary barriers to lateral flow.Once water is diverted into a fault zone, however, its highpermeability could facilitate rapid downward flow throughthe unsaturated system (Wang and Narasimhan 1987; Wuet al. 2002a). In this modeling study, faults are treated asintensively fractured zones.
In addition to possible effects of capillary andpermeability barriers, field data also indicate that thegeological formations at the site are more heterogeneousvertically than horizontally, such that layer-wise represen-tations are found to provide reasonable approximations tothe complex geological system. In this layer-wise approx-imation, model calibration results are able to match
1601
Hydrogeology Journal (2006) 14: 1599–1619 DOI 10.1007/s10040-006-0055-y

different types of observational data obtained fromdifferent locations and depths (e.g., Bandurraga andBodvarsson 1999; Ahlers et al. 1999; Wu et al. 2002a).
As shown in Fig. 1b, the key conceptualizations andassumptions made in this study, as well as in the currentUZ flow model, are: (1) ambient water flow in the UZsystem is at a quasi-steady-state condition, subject tospatially varying net infiltration on the ground surface; (2)hydrogeological units/layers are internally homogeneous,unless interrupted by faults or altered by post-depositionalprocesses; (3) capillary barriers exist within the PTn unit,causing lateral flow; (4) perched water in the lower units
results from permeability barrier effects; and (5) majorfaults serve as fast downward flow pathways for laterallydiverted flow.
Model description
This section describes the geological model and numericalmodel grids, the modeling approach for handling fracture-matrix interaction, the numerical scheme and codes, inputparameters, and boundary conditions used in the UZ flowmodel for this study.
Table 1 Lithostratigraphy, unsaturated zone model layer, and hydrogeological unit correlation used in the UZ flow model and submodels
Major unit Lithostratigraphic nomenclature UZ model grid unit/layera Hydrogeological unitb
Tiva Canyon welded (TCw) Tpcr TCw11 CCR, CUCTpcp TCw12 CUL, CWTpcLDTpcpv3 TCw13 CMWTpcpv2
Paintbrush nonwelded (PTn) Tpcpv1 PTn21 CNWTpbt4 PTn22 BT4Tpy (Yucca) PTn23 TPY
PTn24 BT3Tpbt3Tpp (Pah) PTn25 TPPTpbt2 PTn26 BT2Tptrv3Tptrv2
Topopah Spring welded (TSw) Tptrv1 TSw31 TCTptrn TSw32 TRTptrl, Tptf TSw33 TULTptpul, RHHtopTptpmn TSw34 TMNTptpll TSw35 TLLTptpln TSw36 TM2 (upper 2/3 of Tptpln)
TSw37 TM1 (lower 1/3 of Tptpln)Tptpv3 TSw38 PV3Tptpv2 TSw39 (vit, zeo) PV2
Calico Hills nonwelded (CHn) Tptpv1 Ch1 (vit, zeo) BT1 or BT1a (altered)Tpbt1Tac(Calico) Ch2 (vit, zeo) CHV (vitric) or CHZ (zeolitic)
Ch3 (vit, zeo)Ch4 (vit, zeo)Ch5 (vit, zeo)
Tacbt (Calicobt) Ch6 (vit, zeo) BTTcpuv (Prowuv) Pp4 PP4 (zeolitic)Tcpuc (Prowuc) Pp3 PP3 (devitrified)Tcpmd (Prowmd) Pp2 PP2 (devitrified)Tcplc (Prowlc)Tcplv (Prowlv) Pp1 PP1 (zeolitic)Tcpbt (Prowbt)Tcbuv (Bullfroguv)
Crater Flat undifferentiated (CFu) Tcbuc (Bullfroguc) Bf3 BF3 (welded)Tcbmd (Bullfrogmd)Tcblc (Bullfroglc)Tcblv (Bullfroglv) Bf2 BF2 (nonwelded)Tcbbt (Bullfrogbt)Tctuv (Tramuv)Tctuc (Tramuc) Tr3 Not AvailableTctmd (Trammd)Tctlc (Tramlc)Tctlv (Tramlv) Tr2 Not AvailableTctbt (Trambt) and below
aDefined by the rock material type, represented by the code name, for grid layers or blocks belonging to the same rock unitbHydrogeological units or layers defined for the UZ model exclude alluvial covers. The top model boundary is at the ground surface of themountain (or the tuff-alluvium contact in areas of significant alluvial covers)
1602
Hydrogeology Journal (2006) 14: 1599–1619 DOI 10.1007/s10040-006-0055-y

Geological model and numerical gridThe geological model used for developing the UZ modelgrid is the current geological framework model (BSC2004a,b). Table 1 lists the geological units/layers fordifferent hydrogeologic units and the associated UZ modelnumerical grid-layer information. These geologic forma-tions have been organized into layered hydrogeologicunits based primarily on the degree of welding (Montazerand Wilson 1984): the Tiva Canyon welded hydrogeologicunit (TCw), the Paintbrush nonwelded (PTn), the TopopahSpring welded unit (TSw), the Calico Hills nonwelded(CHn), and the Crater Flat undifferentiated unit (CFu).
The three-dimensional unsaturated zone model domain,as well as the numerical grid for this study, is shown in theplan view in Fig. 2. The three-dimensional modelencompasses approximately 40 km2 of the area over themountain. The UZ model grid of Fig. 2 was primarilydesigned for model calibration and simulations of three-dimensional flow fields delivered for use in calculations(BSC 2004f). Also shown in Fig. 2 are the locations ofseveral boreholes used in model sensitivity and uncertain-ty analyses. Note that the model domain is selected tofocus on the study area of the repository and to investigatethe effects of major faults on moisture flow around andbelow the repository. In the numerical model grid, faults
are represented in the model by vertical or inclined 30-m-wide zones.
The three-dimensional numerical model grid, as shownin plan view in Fig. 2, has 2,042 mesh columns of fractureand matrix continua and an average of 59 computationalgrid layers in the vertical direction. The grid has 245,506gridblocks and 989,375 connections in a dual-permeabil-ity grid.
Numerical codes and modeling approachThe model simulation results presented in this report werecarried out using the TOUGH2 code Version 1.6 (LBNL2003; Wu et al. 1996) for unsaturated flow and the T2R3Dcode (LBNL 1999; Wu and Pruess 2000) for radionuclidetransport. They were chosen because of their generalizedcapability of handling fracture and matrix interactionusing the dual-permeability approach (consider fractureand matrix as two overlap continuum), which is the keyfor simulating unsaturated zone fluid flow in the fracturedporous rock of Yucca Mountain. In particular, the dual-permeability modeling approach has been used in thisstudy to evaluate fluid flow and tracer transport in thefracture and matrix system of the UZ system of YuccaMountain.
As applied in this study, the traditional dual-perme-ability concept is first modified using an active fracturemodel (Liu et al. 1998) to represent fingering effects ofliquid flow through fractures and to limit flow into thematrix system. In addition, the dual-permeability model isalso modified by adding additional global fracture andmatrix connections (connections between matrix andfracture gridblocks at different layers) at interfaces ofTCw–PTn, PTn–TSw, and boundaries of vitric–nonvitricunits to better simulate fracture and matrix flow at thesetransitions. Note that vitric units in the CHn are handled assingle-porosity matrix only (i.e., the effect of fractures onflow within Calico Hills vitric zones is neglected).
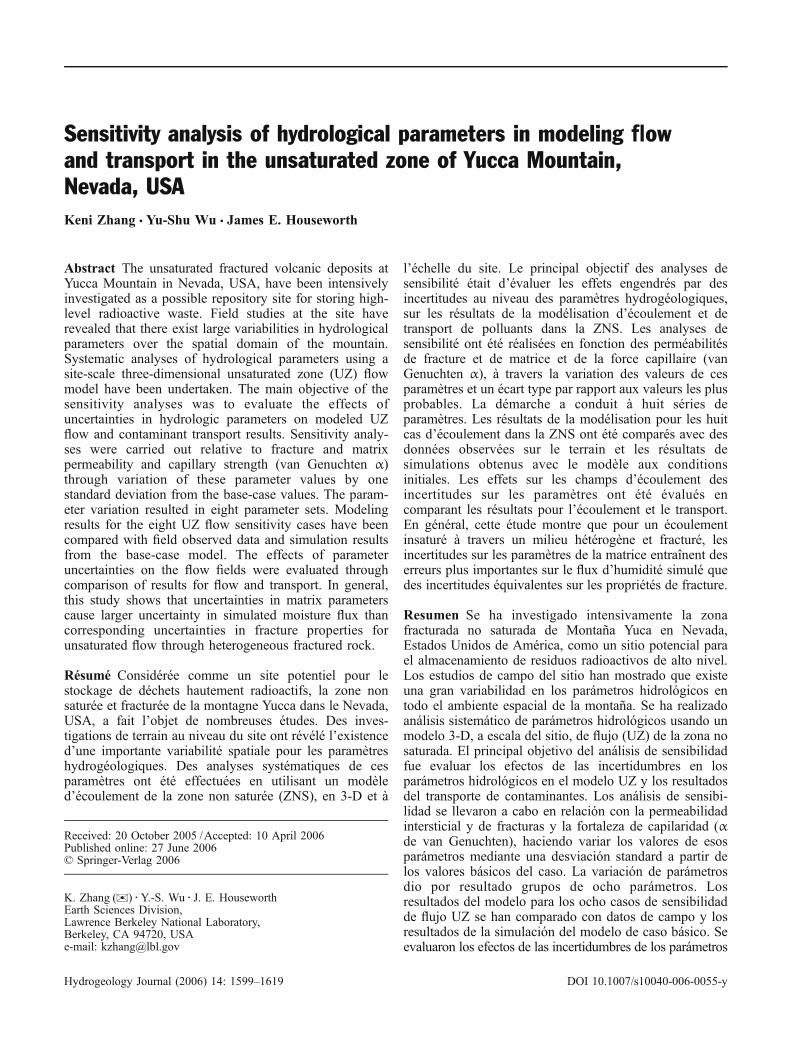
Boundary conditionsThe ground surface of the mountain (or the tuff-alluviumcontact in areas of significant alluvial cover) is taken asthe top model boundary; the water table is treated as thebottom model boundary. Both the top and bottomboundaries of the model are treated as Dirichlet-typeboundaries with specified constant, but spatially varyingconditions. Surface infiltration is applied using a sourceterm in the fracture gridblocks. Lateral boundaries, asshown in Fig. 2, are treated as no-flow (closed) boundariesin the unsaturated zone flow model, which allow flow tooccur only along the vertical plane. Net infiltration is usedas a flux boundary condition for the UZ flow model.Figure 3 shows in plan view the spatial distribution ofinfiltration flux for the glacial transition mean infiltrationscenario, which corresponds to a future climate (BSC2004c). Figure 3 shows higher infiltration rates in thenorthern part of the model domain and along the mountainridge east of the Solitario Canyon fault.
Fig. 2 Plan view of the three-dimensional UZ flow-model grid,showing the model domain, faults and tunnels incorporated,repository layout, and location of boreholes UZ-14 and SD-12(and others)
1603
Hydrogeology Journal (2006) 14: 1599–1619 DOI 10.1007/s10040-006-0055-y
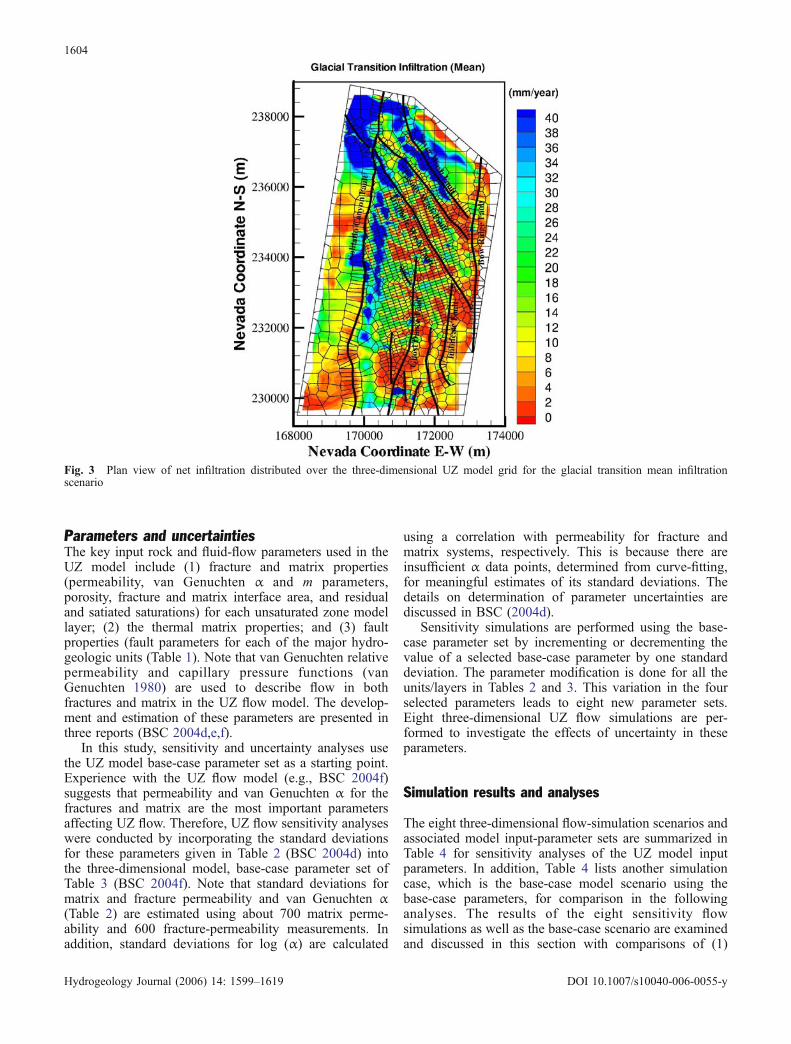
Parameters and uncertaintiesThe key input rock and fluid-flow parameters used in theUZ model include (1) fracture and matrix properties(permeability, van Genuchten α and m parameters,porosity, fracture and matrix interface area, and residualand satiated saturations) for each unsaturated zone modellayer; (2) the thermal matrix properties; and (3) faultproperties (fault parameters for each of the major hydro-geologic units (Table 1). Note that van Genuchten relativepermeability and capillary pressure functions (vanGenuchten 1980) are used to describe flow in bothfractures and matrix in the UZ flow model. The develop-ment and estimation of these parameters are presented inthree reports (BSC 2004d,e,f).
In this study, sensitivity and uncertainty analyses usethe UZ model base-case parameter set as a starting point.Experience with the UZ flow model (e.g., BSC 2004f)suggests that permeability and van Genuchten α for thefractures and matrix are the most important parametersaffecting UZ flow. Therefore, UZ flow sensitivity analyseswere conducted by incorporating the standard deviationsfor these parameters given in Table 2 (BSC 2004d) intothe three-dimensional model, base-case parameter set ofTable 3 (BSC 2004f). Note that standard deviations formatrix and fracture permeability and van Genuchten α(Table 2) are estimated using about 700 matrix perme-ability and 600 fracture-permeability measurements. Inaddition, standard deviations for log (α) are calculated
using a correlation with permeability for fracture andmatrix systems, respectively. This is because there areinsufficient α data points, determined from curve-fitting,for meaningful estimates of its standard deviations. Thedetails on determination of parameter uncertainties arediscussed in BSC (2004d).
Sensitivity simulations are performed using the base-case parameter set by incrementing or decrementing thevalue of a selected base-case parameter by one standarddeviation. The parameter modification is done for all theunits/layers in Tables 2 and 3. This variation in the fourselected parameters leads to eight new parameter sets.Eight three-dimensional UZ flow simulations are per-formed to investigate the effects of uncertainty in theseparameters.
Simulation results and analyses
The eight three-dimensional flow-simulation scenarios andassociated model input-parameter sets are summarized inTable 4 for sensitivity analyses of the UZ model inputparameters. In addition, Table 4 lists another simulationcase, which is the base-case model scenario using thebase-case parameters, for comparison in the followinganalyses. The results of the eight sensitivity flowsimulations as well as the base-case scenario are examinedand discussed in this section with comparisons of (1)
Fig. 3 Plan view of net infiltration distributed over the three-dimensional UZ model grid for the glacial transition mean infiltrationscenario
1604
Hydrogeology Journal (2006) 14: 1599–1619 DOI 10.1007/s10040-006-0055-y
matrix moisture data at two boreholes, UZ-14 and SD-12;(2) percolation behavior and flux patterns; and (3)radionuclide transport from the repository to the watertable.
Comparisons of simulated and measured moisturedataComparisons of simulated and measured matrix liquidsaturations along the vertical column representing bore-holes UZ-14 and SD-12 are shown in Figs. 4 and 5 fromthe eight sensitivity and the base-case simulation scenar-ios. Figure 6 shows the comparison of water potentials forSD-12. As shown in Figs. 4, 5 and 6, the modeled resultsfrom the nine simulations with the UZ flow model havesimilar patterns. However, the simulation results withadjusted matrix parameters show greater deviation from
the base-case scenario than simulation results withmodified fracture parameters. A comparison of thesimulated liquid saturations from the eight simulationscenarios with the base-case results indicates:
– Simulated matrix liquid saturations decrease as matrixpermeability and matrix van Genuchten α increase
– Simulated matrix liquid saturations increase as matrixpermeability and matrix van Genuchten α decrease
– Increasing fracture van Genuchten α (equivalent tolowering capillarity in fractures) or a reduction infracture permeability also results in an increase inmatrix saturation, particularly, in the TSw unit
Decreasing fracture van Genuchten α (equivalent toincreasing capillarity in fractures) or increasing fracturepermeability reduces matrix saturations in general, but themagnitude of the change is relatively small. Figure 6shows that variation in fracture properties results in littlechange in matrix water potentials, while a decrease inmatrix permeability and matrix α seems to have a largeimpact on water potentials within the TSw unit at boreholeSD-12.
Percolation fluxes and patternsPercolation fluxes at the repository horizon and at thewater table are analyzed using the eight simulation results(Table 4). In the analysis, the percolation flux is defined astotal vertical liquid mass flux through both fractures andmatrix and is converted from simulated mass flux (kg/s) tomillimeters per year (mm/year) per unit area using aconstant water density. The flux distribution at therepository horizon and at the water table are plotted andcompared, for each case, to show the effect of parameteruncertainty. A statistical evaluation of the distribution offlux at the TCw/PTn interface, the repository horizon, andwater table are performed to quantify these effects.
1. Percolation fluxes at repository horizon: Because onlyglaq+kM and glaq-aM simulations show appreciabledifferences from the base-case simulation in terms ofpercolation fluxes, the discussion focuses on these twosimulations. Figures 7, 8 and 9 show three samplepercolation fluxes along the repository layer for thesimulated flow fields. Figure 7 presents the simulatedrepository fluxes from the base-case simulation(glaq_mA, BSC 2004f), while Figs. 8 and 9 are thecases with increased matrix permeability (glaq+kM)and decreased matrix van Genutchen α (glaq-aM),respectively.Comparisons of the calculated repository percolation
fluxes (Figs. 7, 8 and 9) with the surface infiltration maps(Fig. 3) indicate that percolation fluxes at the repository,obtained by the base case and the two sensitivitysimulations, are different from surface infiltration patterns,particularly, in the northern part of the model domain.Under steady-state flow conditions, percolation flux and
Table 2 Uncertainties (or standard deviations) of model parameters
Model layer Matrix property Fracture propertyσLog(kM)
σLog(αM)
σLog(kF)
σLog(αF)
TCw11 0.47 0.24 1.15 0.58TCw12 2.74 1.37 0.78 0.39TCw13 2.38 1.19 1.15 0.58PTn21 2.05 1.03 0.88 0.44PTn22 1.41 0.71 0.20 0.10PTn23 0.64 0.32 0.20 0.10PTn24 1.09 0.55 1.15 0.58PTn25 0.39 0.20 0.10 0.05PTn26 1.12 0.56 1.15 0.58TSw31 3.02 1.51 1.15 0.58TSw32 0.94 0.47 0.66 0.33TSw33 1.61 0.81 0.61 0.31TSw34 0.97 0.49 0.47 0.24TSw35 1.65 0.83 0.75 0.38TSw36 3.67 1.84 0.54 0.27TSw37 3.67 1.84 0.28 0.14TSw38 1.57 0.79 1.15 0.58TSwz (zeolitic portionof tsw39)
2.74 1.37 1.15 0.58
TSwv (vitric portion oftsw39)
1.38 0.69 a a
CH1z 2.74 1.37 1.15 0.58CH1v 1.11 0.56 a aCH2v 1.62 0.81 a aCH3v 1.62 0.81 a aCh4v 1.62 0.81 a aCH5v 1.62 0.81 a aCH6v 1.11 0.56 a aCH2z 0.91 0.46 1.15 0.58CH3z 0.91 0.46 1.15 0.58CH4z 0.91 0.46 1.15 0.58CH5z 0.91 0.46 1.15 0.58CH6z 2.05 1.03 1.15 0.58Pp4 2.74 1.37 1.15 0.58Pp3 0.75 0.38 1.15 0.58Pp2 1.18 0.59 1.15 0.58Pp1 1.52 0.76 1.15 0.58Bf3 1.64 0.82 1.15 0.58Bf2 1.52 0.76 1.15 0.58
aConceptual model does not include fractures in these model layersK permeability; α van Genuchten α
1605
Hydrogeology Journal (2006) 14: 1599–1619 DOI 10.1007/s10040-006-0055-y

its distribution along any horizon of the model domainwould be similar to surface infiltration if there were nolateral flow. Consequently, the differences between surfaceinfiltration and repository percolation patterns indicate theoccurrence of lateral flow across the TCw, PTn, and TSwunits.
Most of the lateral flow between the ground surfaceand the repository horizon is found to be caused by thecapillary barrier effect within the PTn (Wu et al. 2004,BSC 2004f. The large-scale lateral flow is shown in Fig. 8,corresponding to the simulation scenario in which thematrix permeability is increased by one standard devia-tion. In this case, the high-infiltration zones along the crestof the mountain surface appear as high-percolation-fluxzones close to the Ghost Dance fault at the repository
Table 3 Base-case parameters for the UZ Flow and transport model
Model layer kM (m2) αM (1/Pa) mM (−) kF (m2) αF (1/Pa) mF (−) γ (−)
TCw11 3.74E-15 1.01E-5 0.388 4.24E-11 5.27E-3 0.633 0.587TCw12 5.52E-20 3.11E-6 0.280 9.53E-11 1.57E-3 0.633 0.587TCw13 5.65E-17 3.26E-6 0.259 1.32E-11 1.24E-3 0.633 0.587PTn21 9.90E-13 1.01E-5 0.176 1.86E-12 1.68E-3 0.580 0.090PTn22 2.65E-12 1.60E-4 0.326 2.00E-11 7.68E-4 0.580 0.090PTn23 1.23E-13 5.58E-6 0.397 2.60E-13 9.23E-4 0.610 0.090PTn24 7.86E-14 1.53E-4 0.225 4.67E-13 3.37E-3 0.623 0.090PTn25 7.00E-14 5.27E-5 0.323 7.03E-13 6.33E-4 0.644 0.090PTn26 2.21E-13 2.49E-4 0.285 4.44E-13 2.79E-4 0.552 0.090TSw31 2.95E-17 8.70E-5 0.218 5.42E-12 1.00E-4 0.633 0.129TSw32 2.23E-16 1.14E-5 0.290 4.72E-12 1.00E-4 0.633 0.600TSw33 6.57E-18 6.17E-6 0.283 5.18E-12 1.59E-3 0.633 0.600TSw34 1.77E-19 8.45E-6 0.317 2.21E-12 1.04E-4 0.633 0.569TSw35 4.48E-18 1.08E-5 0.216 6.08E-12 1.02E-4 0.633 0.569TSw36 2.00E-19 8.32E-6 0.442 8.99E-12 7.44E-4 0.633 0.569TSw37 2.00E-19 8.32E-6 0.442 8.99E-12 7.44E-4 0.633 0.569TSw38 2.00E-18 6.23E-6 0.286 8.10E-13 2.12E-3 0.633 0.569TSwz 3.50E-17 4.61E-6 0.059 8.10E-13 1.50E-3 0.633 0.370TSwv 1.49E-13 4.86E-5 0.293 a a a a
CH1z 3.50E-17 2.12E-7 0.349 2.50E-14 1.40E-3 0.633 0.370CH1v 6.65E-13 8.73E-5 0.240 a a a a
CH2v 2.97E-11 2.59E-4 0.158 a a a a
Ch3v 2.97E-11 2.59E-4 0.158 a a a a
CH4v 2.97E-11 2.59E-4 0.158 a a a a
CH5v 2.97E-11 2.59E-4 0.158 a a a a
CH6v 2.35E-13 1.57E-5 0.147 a a a a
CH2z 5.20E-18 2.25E-6 0.257 2.50E-14 8.90E-4 0.633 0.370CH3z 5.20E-18 2.25E-6 0.257 2.50E-14 8.90E-4 0.633 0.370CH4z 5.20E-18 2.25E-6 0.257 2.50E-14 8.90E-4 0.633 0.370CH5z 5.20E-18 2.25E-6 0.257 2.50E-14 8.90E-4 0.633 0.370CH6z 8.20E-19 1.56E-7 0.499 2.50E-14 1.40E-3 0.633 0.370Pp4 8.77E-17 4.49E-7 0.474 2.50E-14 1.83E-3 0.633 0.370Pp3 7.14E-14 8.83E-6 0.407 2.20E-13 2.47E-3 0.633 0.199Pp2 1.68E-15 2.39E-6 0.309 2.20E-13 3.17E-3 0.633 0.199Pp1 2.35E-15 9.19E-7 0.272 2.50E-14 1.83E-3 0.633 0.370Bf3 4.34E-13 1.26E-5 0.193 2.20E-13 2.93E-3 0.633 0.199Bf2 8.10E-17 1.18E-7 0.617 2.50E-14 8.90E-4 0.633 0.370PcM38 3.00E-19 6.23E-6 0.286 3.00E-18 6.23E-6 0.286 0.00PcM39 6.20E-18 4.61E-6 0.059 6.20E-17 4.61E-6 0.059 0.00PcM1z 9.30E-20 2.12E-7 0.349 9.30E-19 2.12E-7 0.349 0.00PcM2z 2.40E-18 2.25E-6 0.257 2.40E-17 2.25E-6 0.257 0.00PcM5z 2.40E-18 2.25E-6 0.257 2.40E-18 2.25E-6 0.257 0.00PcM6z 1.10E-19 1.56E-7 0.499 1.10E-19 1.56E-7 0.499 0.00PcM4p 7.70E-19 4.49E-7 0.474 7.70E-19 4.49E-7 0.474 0.00
aModel layers do not include fracturesK permeability; α van Genuchten parameter α; m van Genuchten parameter m; γ active fracture parameter γ. Subscripts: F fracture; Mmatrix
Table 4 Eight simulation scenarios for sensitivity and uncertaintyanalyses of unsaturated zone flow model parameters: parameter setsand their variations, as well as the base-case simulation scenario(glaq_mA)
Simulation/designation Parameter set/variation
1: glaq+kM Table 3 with kM þ �km2: glaq-kM Table 3 with kM � �kM3: glaq+aM Table 3 with �M þ ��M
4: glaq-aM Table 3 with �M � ��M
5: glaq+kF Table 3 with kF þ �kF6: glaq-kF Table 3 with kF � �kF7: glaq+aF Table 3 with �F þ ��F
8: glaq-aF Table 3 with �F � ��F
qlaq_mA Table 3 (base-case scenario)
Please note: σ standard deviation for fracture and matrix permeabilitiesand van Genuchten α
1606
Hydrogeology Journal (2006) 14: 1599–1619 DOI 10.1007/s10040-006-0055-y

level. This is because high-matrix permeability enhancescapillary barrier effects and the resulting lateral flow in thePTn (Pan et al. 2004). Significant lateral flow can be seenin Fig. 9, when the van Genuchten α parameter is reducedby a standard deviation, i.e., the capillarity of the matrixsystem is increased, thus enhancing the capillary barriereffect. The remaining six simulations with fracture andother matrix parameter variations are also found to besimilar to Fig. 7 for percolation fluxes at the repositoryhorizon. This similarity indicates that parameter variationsrelated to fracture properties have little impact on lateral flowthrough the PTn unit. These results imply that the capillary-
barrier effects in the PTn are primarily controlled by thecontrasts in matrix capillary properties (Wu et al. 2002a,b).
Note that flow focusing or redistribution in the verynorthern part of the model domain (below the repositoryblock) results mainly from the repository layering, wherethe repository horizon laterally intersects the low-perme-ability CHn zeolitic zones. These low-permeability zeo-lites provide strong permeability barriers to downwardflow, shifting the major flow paths toward faults.2. Percolation fluxes at the water table: Simulated
percolation fluxes at the water table are shown for thebase-case (Fig. 10) and two new flow simulations(Figs. 11 and 12). When comparing the percolation-flux patterns at the water table with those at therepository (Figs. 7, 8, and 9), as well as amongthemselves from the eight simulation scenarios (onlytwo examples are shown in Figs. 11 and 12), thefollowing observations were noted:
– All the nine flow fields present similar modeledpercolation patterns at the water table, as shown inFig. 10, except for the cases with a matrixpermeability increase (glaq+kM, Fig. 11) and amatrix van Genuchten α decrease (glaq-aM, Fig. 12).
– In the northern half of the model domain, all nineflow fields are nearly the same. Because of thesignificant impact of faults, perched water andlower-permeability zeolitic units, the flow isfocused mainly into major faults in the north.
– In the southwest-corner portion of the modeldomain, the area where nonfractured vitric zonesare located within the CHn unit, no differencesappear between the modeled water table fluxesusing modified fracture properties, because thereare no fractures within the vitric units. This issimply the result of the conceptual model of
Fig. 4 Simulated matrix liquid saturations at borehole UZ-14 fromthe results of the eight simulation scenarios as well as the base-casesimulation (glaq_mA)
Fig. 5 Simulated matrix liquid saturations at borehole SD-12 fromthe results of the eight simulation scenarios as well as the base-casesimulation (glaq_mA)
Fig. 6 Simulated water potentials at borehole SD-12 from theresults of the eight simulation scenarios as well as the base-casesimulation (glaq_mA)
1607
Hydrogeology Journal (2006) 14: 1599–1619 DOI 10.1007/s10040-006-0055-y

Fig. 7 Simulated percolation fluxes at the repository horizon under the glacial-transition mean infiltration scenario using the results of thebase-case simulation (glaq_mA)
Fig. 8 Simulated percolation fluxes at the repository horizon using the base-case parameter set with increase in matrix permeability byone standard deviation using the results of simulation: glaq+kM
1608
Hydrogeology Journal (2006) 14: 1599–1619 DOI 10.1007/s10040-006-0055-y

Fig. 9 Simulated percolation fluxes at the repository horizon using the base-case parameter set with decrease in matrix van Genuchtenparameter α by one standard deviation using the results of simulation: glaq-aM
Fig. 10 Simulated percolation fluxes at the water table under the glacial transition mean infiltration scenario using the results of the base-case simulation: glaq_mA
1609
Hydrogeology Journal (2006) 14: 1599–1619 DOI 10.1007/s10040-006-0055-y

nonfractured vitric zones, with flow in the CHnvitric independent of fracture properties.
– Changes in matrix properties seem to have moreimpact on flux patterns in the southern half of themodel domain. Even in these cases, however,similar flux patterns are obtained for increasedmatrix permeability and decreased matrix vanGenuchten α. The only obvious differences occurin water-table flux distributions for the two cases,as shown in Figs. 11 and 12. Larger matrixpermeability and smaller van Genuchten α (stron-ger matrix capillarity) within the vitric and zeoliticzones result in a significant difference between theflux patterns at the repository level and at the watertable, because these parameter changes causechanges in capillary barrier conditions and lateralflow above these zones.
3. Fracture and matrix flow components and statistics:Table 5 lists percentages of vertical fracture and matrixflow components (not including flux in faults) and faultflow over the entire model domain and within therepository footprint, a smaller area covering therepository drifts only (Fig. 2). The statistics arecalculated at three horizons: (1) the TCw/PTn interfaceor the top of the PTn unit, (2) the repository level, and(3) the water table. Fracture and matrix flow percent-ages are computed for the nonfault zones only (i.e.,excluding the vertical flow through all the faults), whilefault flow percentages represent total vertical fractureand matrix flux through fault blocks over the entiremodel layer or the repository footprint at the threehorizons. The percentages of fracture, matrix, and faultflow components sum to 100%. These statistics arecalculated from vertical flow along each grid column,using the flow fields from the eight parameter-sensitiv-ity simulations. In addition, Table 5 includes the base-case simulation scenario using the base-case fractureand matrix parameters (glaq_mA) for comparison(BSC 2004f).A comparison between the computed flux data
(Table 5) on fracture, matrix, and fault flow componentsamong the eight parameter sensitivity simulations, as wellas the base-case (glaq_mA) results, shows the following:
– At the top of the PTn or TCw/PTn interface, theflux distribution is essentially similar to surfaceinfiltration. Fracture and matrix flow componentsand fault flow percentage are very similar for allnine (eight sensitivity and one base-case) simula-tions. The results show that fracture flow domi-nates both over the small area within the repositoryfootprint and the entire model domain. Fault flowconsists of nearly 4% over the model domain,while over the repository footprint, fault flow takesabout 1.4% only. For the eight new simulations, theonly differences are that the case with increasedmatrix permeability (glaq+kM) has slightly largematrix flow components compared to other cases,
while the cases with decreased matrix permeability(glaq-kM) and increased van Genuchten α (glaq+aM) show some reduction in matrix flow portions.Note that in all cases, nonfault matrix flow withinthe repository footprint is practically zero at theTCw/PTn interface, showing the dominance offracture flow within the TCw.
– At the repository level, compared with the base-case (glaq_mA) results, a significant increaseoccurs in matrix flow components when the matrixpermeability is increased (glaq+kM). The matrixflow increases from 5.5 to 16.8% over the modeldomain and from 0.2 to 9.5% within the repositoryfootprint, while fracture flow decreases from 70.2to 60.5% over the model domain and from 98.5 to87.9% inside the footprint. In addition, a decreasein matrix van Genuchten α leads to a large increasein matrix flow. However, fault flow percentages areonly slightly impacted by any variations in thefracture and matrixparameters. Within the reposi-tory footprint, fault flow consists of only 1–2% oftotal flow, except in the cases of increased matrixpermeability (glaq+kM) and decreased fracture vanGenuchten α (glaq-aF), which have more than 2%fault flow.
– At the water table, fracture and matrix flowcomponents and fault flow from the eight sensitiv-ity simulations show more differences from thoseof the base case (glaq_mA), as compared with thetwo horizons above. Larger differences can be seenin the flux within the repository footprint. Matrixflow increases from 42.3% for the base case to55.9% when matrix permeability is increased byone standard deviation (glaq+kM). This increase inmatrix flow is accompanied by a correspondingdecrease in fault flow from 49.9 to 37.9%. Whenmatrix permeability is decreased by one standarddeviation (glaq-kM), fracture flow increases from7.8 to 21.6%. Fracture flow also increases signif-icantly when fracture permeability is increased byone standard deviation (glaq+kF). Fracture flowincreases three times, from 7.8 to 23.7%, with acorresponding decrease in matrix flow.
– Overall, fracture flow is dominant above the PTnunit, accounting for about 95% of the totalpercolation fluxes over the entire model layer.Fracture flow percentage is over 98% within therepository footprint at the TCw/PTn interface. Atthe repository level, nonfault fracture flow reducesto 60–70% and matrix flow increases from 1% atthe top of the PTn to 5–8% at the repository level.In comparison, fault flow increases from less than4% at the TCw/PTn interface to 23–26% atrepository horizon, indicating significant lateralflow and diversion occurs within the PTn unit. Atthe water table, fault flow makes up about 50% ofthe total flow over the entire model domain andwithin the repository footprint, except when matrixpermeability increases by one standard deviation,
1610
Hydrogeology Journal (2006) 14: 1599–1619 DOI 10.1007/s10040-006-0055-y

Fig. 11 Simulated percolation fluxes at the water table using the base-case parameter set with increase in matrix permeability by onestandard deviation using the results of simulation: glaq+kM
Fig. 12 Simulated percolation fluxes at the water table using the base-case parameter set with decrease in matrix van Genuchten parameterα by one standard deviation using the results of simulation: glaq-aM
1611
Hydrogeology Journal (2006) 14: 1599–1619 DOI 10.1007/s10040-006-0055-y

in which case, fault flow is about 38%. Acomparison of fault flow at the water table withthat at the repository level indicates that significant
lateral diversion or flow focusing into faults alsooccurs during flow through CHn, because of theexistence of perched water and low-permeability
Table 5 Comparison of the water flux through matrix, fractures and faults as a percentage of the total flux over the entire model domainand within the repository footprint at three different horizons for the eight simulations as well as the base case results
(a) Flux distribution at the TCw/PTn interfaceSimulation designation Flux at TCw/PTn interface over entire model
domain (%)Flux at TCw/PTn interface within repository footprint (%)
Fracture Matrix Fault Fracture Matrix Fault Total flow rate (kg/s)
glaq_mA 95.1 1.1 3.8 98.6 0.0 1.4 3.1glaq+kM 94.4 1.6 3.9 98.5 0.1 1.5 3.1glaq-kM 95.3 1.0 3.8 98.6 0.0 1.4 3.1glaq+aM 95.3 1.0 3.8 98.6 0.0 1.4 3.1glaq-aM 95.0 1.3 3.8 98.6 0.0 1.4 3.1glaq+kF 95.1 1.1 3.8 98.6 0.0 1.4 3.1glaq-kF 95.1 1.1 3.8 98.6 0.0 1.4 3.1glaq+aF 95.1 1.1 3.8 98.6 0.0 1.4 3.1glaq-aF 95.2 1.1 3.8 98.6 0.0 1.4 3.1
(b) Flux distribution at the repository levelSimulation designation Flux at repository level over entire model domain
(%)Flux at repository horizon within repository footprint (%)
Fracture Matrix Fault Fracture Matrix Fault Total flow rate (kg/s)glaq_mA 70.2 5.5 24.3 98.5 0.2 1.4 3.1glaq+kM 60.5 16.8 22.7 87.9 9.5 2.6 1.2glaq-kM 69.3 5.1 25.7 98.6 0.0 1.4 3.1glaq+aM 69.3 5.4 25.4 98.5 0.0 1.5 3.1glaq-aM 69.3 8.0 22.7 97.4 0.8 1.8 2.8glaq+kF 70.1 5.1 24.8 98.4 0.1 1.5 3.1glaq-kF 70.9 5.8 23.3 98.6 0.3 1.1 3.1glaq+aF 70.1 6.3 23.6 98.4 0.3 1.3 3.1glaq-aF 69.2 5.1 25.7 97.8 0.1 2.1 3.1
(c) Flux distribution at the water tableSimulation designation Flux at water table over entire model Domain (%) Flux at water table within repository footprint (%)
Fracture Matrix Fault Fracture Matrix Fault Total Flow Rate (kg/s)glaq_mA 11.5 27.0 61.6 7.8 42.3 49.9 2.2glaq+kM 11.7 32.5 55.8 6.2 55.9 37.9 1.8glaq-kM 21.1 15.0 63.8 21.6 29.3 49.2 2.2glaq+aM 12.6 24.4 63.0 9.4 41.2 49.5 2.1glaq-aM 10.8 28.6 60.6 7.1 46.0 46.9 2.2glaq+kF 18.2 20.0 61.8 23.7 26.3 50.0 2.2glaq-kF 9.6 29.5 61.0 6.1 45.0 48.9 2.1glaq+aF 10.2 26.5 63.2 6.3 41.3 52.3 2.2glaq-aF 15.0 27.9 57.1 11.9 42.2 46.0 2.2
Fig. 13 Area frequency and distribution of simulated percolation fluxes within the repository domain normalized to the mean glacialtransition infiltration rate (17.02 mm/year) of the base-case simulation (glaq_mA)
1612
Hydrogeology Journal (2006) 14: 1599–1619 DOI 10.1007/s10040-006-0055-y
zeolitic zones within this unit. Secondly, over thenonfaulted zone, matrix flow is larger than fractureflow at the water table, due to dominant matrixflow through nonfractured vitric zones.
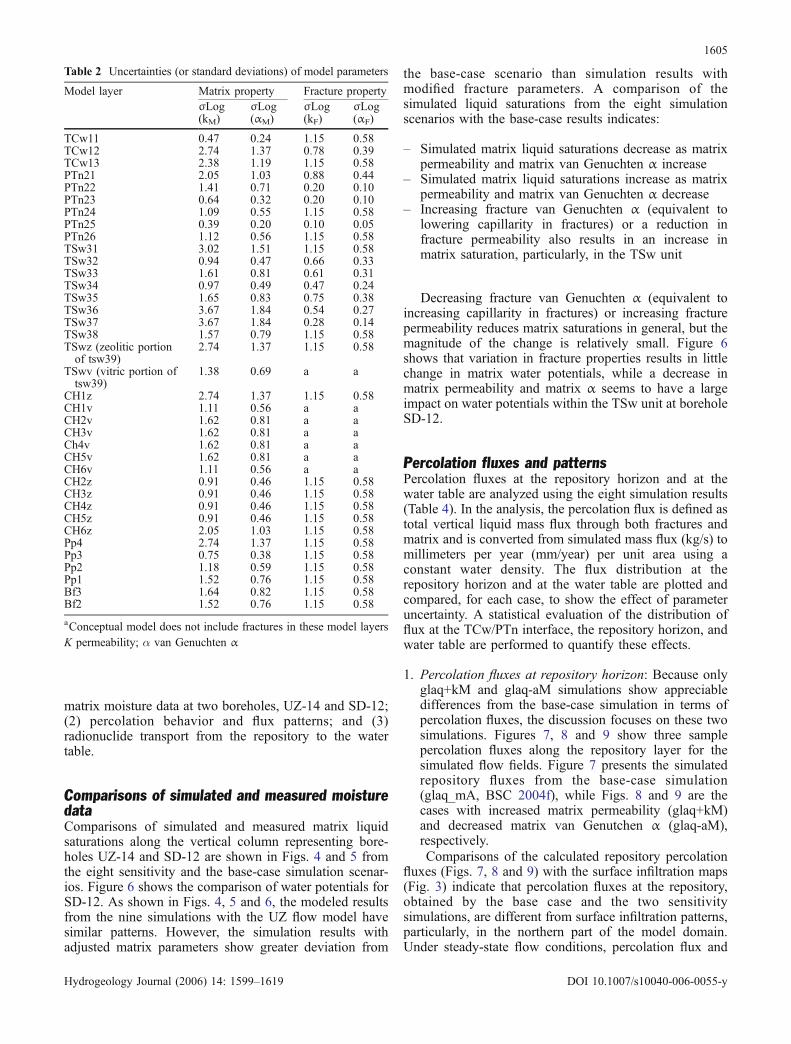
4. Distributions of percolation fluxes within the repository:Percolation fluxes within the repository footprint at therepository horizon were further analyzed using fre-quency distribution plots for the percentage of therepository area subject to a particular, normalizedpercolation rate. The normalized flux rates are deter-mined by dividing percolation rates by the modeldomain average infiltration rate of 17.02 mm/year.Figures 13, 14, 15, 16 and 17 show the frequencydistribution of normalized percolation flux within therepository footprint at the repository horizon for theeight sensitivity flow simulations as well as for the basecase. Analysis of percolation flux distribution withinthe repository footprint will help in assessing flow-focusing phenomena at the footprint. The percolation
frequency distributions, as presented in the figures,provide insight into flow-redistribution phenomena atthe repository.
Figures 14, 15, 16 and 17 show similar patterns in theflux-area frequency distribution based on the eightsensitivity simulation results, compared to that of the basecase shown in Fig. 13. The highest flux frequency for alldistributions occurs for a normalized flux less than 1.
A normalized flux of about 0.2–1.0 occurs over about50–60% of the repository area. The areas with normalizedpercolation fluxes greater than 3 comprise a very smallportion, constituting less than a few percent of the totalrepository area.
Despite the similarity in flux frequency distributions, aclose examination of the plots reveals certain differences,as follows:
– The two cases with decreased matrix permeability(glaq-kM) and increased matrix van Genuchten α
Fig. 14 Area frequency and distribution of simulated percolation fluxes within the repository domain normalized to the mean glacialtransition infiltration rate (17.02 mm/year), simulated using the base-case parameter set with variations in matrix permeability a glaq+kMand b glaq-kM
1613
Hydrogeology Journal (2006) 14: 1599–1619 DOI 10.1007/s10040-006-0055-y

(glaq+aM) have a highest frequency percentage inabout 14% of the area, while the corresponding twocases with increased matrix permeability (glaq+kM)and decreased matrix van Genuchten α (glaq-aM)show highest frequency in 18% of the area (seeFigs. 14 and 15).
– Flux distribution patterns for the four cases withfracture property variations (Figs. 16 and 17) showless sensitivity. In contrast to the matrix parameterchanges, however, the highest flux frequenciesoccur for the two cases with decreased fracturepermeability (glaq-kF) and increased fracture vanGenuchten α (glaq+aF), covering 18% of the area.The cases that have increased fracture permeability(glaq+kF) and decreased fracture van Genuchten α(glaq-aF) show lower frequency.
– In all sensitivity simulations, increasing permeabil-ity results in very similar flux-frequency patterns todecreasing van Genuchten α, and decreasing
permeability leads to very similar results toincreasing van Genuchten α.
Radionuclide transport from repository to watertableResults of tracer transport simulation can provide addi-tional insight into flow patterns below the repository.Tracer transport simulations are carried out using the eightsensitivity cases and base-case flow fields. Additionaldiscussions for transport simulations are presented in BSC(2004g). Tracer-transport times are estimated by conser-vative (nonsorbing) and reactive (sorbing) tracer simula-tions, in which tracers are tracked after release from therepository and transported to the water table. Transportsimulations are run to 1,000,000 years for the nine three-
Fig. 15 Area frequency and distribution of simulated percolation fluxes within the repository domain normalized to the mean glacialtransition infiltration rate (17.02 mm/year), simulated using the base-case parameter set with variations in matrix van Genuchten parameterα. Variations shown for a glaq+aM and b glaq-aM
1614
Hydrogeology Journal (2006) 14: 1599–1619 DOI 10.1007/s10040-006-0055-y

dimensional (base case and the eight sensitivity analysissimulations), steady-state flow fields. A uniform mass oftracer is released into the repository fracture elements atthe beginning of the simulation. In addition, hydrodynam-ic/mechanical dispersion through the fracture-matrix sys-tem is ignored, because past studies have indicated thatmechanical dispersion has an insignificant effect (BSC2004f). A constant molecular diffusion coefficient of3.2×10−11 m2/s is used for the conservative componentof technetium (Tc), and 1.6×10⁻¹⁰ m2/s is selected for thereactive component of neptunium (Np). For the conserva-tive tracer, Kd=0, and for the reactive tracer, Kd=4 cc/g(cubic centimeter/gram) for zeolitic matrix, Kd=1 cc/g forother matrix rock in TSw and CHn units, and Kd=0 for allfractures and other units. Tracer transport modeling wasconducted with a radionuclide transport code (T2R3D;Wu and Pruess 2000) using the same flow model grid(Fig. 2) and the same dual-permeability approach for
fracture-matrix interaction. In transport simulation, iso-thermal, unsaturated, steady-state flow fields of the ninesimulations were used as direct input to the T2R3D.
Figures 18 and 19 show fractional mass breakthroughcurves of normalized cumulative radionuclide massarriving at the water table for the conservative and reactivecases respectively. The fractional mass breakthrough inthe two figures is defined as cumulative radionuclide massarriving at the water table over the entire model bottomboundary over time, normalized by the total initial massreleased from the entire repository. The two figurespresent the behavior of breakthrough at the water tablefor conservative and reactive tracers under the ninesimulated UZ flow fields of Table 4.
Figure 18 shows conservative tracer-transport simulationresults, indicating that large differences exist in breakthroughcurves only in the three scenarios (glaq+kM, glaq-kM andglaq+aM, i.e., modified matrix properties), when com-
Fig. 16 Area frequency and distribution of simulated percolation fluxes within the repository domain normalized to the mean glacialtransition infiltration rate (17.02 mm/year), simulated using the base-case parameter set with variations in fracture permeability a glaq+kFand b glaq-kF
1615
Hydrogeology Journal (2006) 14: 1599–1619 DOI 10.1007/s10040-006-0055-y

pared to the base case and the eight sensitivity simulationresults. The remaining five simulations show similartransport results to the base case. With the increase inmatrix permeability, tracer transport time is consistentlylonger than the base case. This is because of thesignificant increase in matrix flow on both repositoryand water table horizons (Table 5) for the cases withincreased matrix permeability. With increased matrix α,the early tracer transport times (<1,000 years) are longerthan the base case.
As shown in Fig. 19, there are more differences inreactive tracer transport times with the eight new flowfields than with the base case. In contrast to theconservative tracer transport, modeling results with mod-ified fracture properties tend to provide shorter transporttimes, while those with matrix property changes givelonger transport times. Overall, as shown in Figs. 18 and19, varying matrix properties seems to cause morechanges in tracer transport times than varying fractureparameters.
Concluding remarks
This report presents sensitivity analyses of the unsaturatedzone flow model results to model input parameters. Thesensitivity analyses are conducted by varying fracture andmatrix properties of the site-scale UZ flow model, usingthe statistical data of standard deviation from measure-ments. Specifically, the sensitivity analyses are intended toestimate the effect of uncertainties in fracture and matrixhydrologic parameters on unsaturated zone flow andtransport model predictions.
Modeling studies for sensitivity analyses of the UZflow model input parameters are conducted to evaluatehow best to account for uncertainties in four keyparameters: permeability and van Genuchten α for bothfractures and matrix. In particular, sensitivity simulationsare performed using standard deviations associated withthe three-dimensional model, base-case parameter set, byincrementing and decrementing a selected parameter byone standard deviation for all units/layers and faults.
Fig. 17 Area frequency and distribution of simulated percolation fluxes within the repository domain normalized to the mean glacialtransition infiltration rate (17.02 mm/year), simulated using the base-case parameter set with variations in fracture matrix van Genuchtenparameter α. Variations shown for a glaq+aF and b glaq-aF
1616
Hydrogeology Journal (2006) 14: 1599–1619 DOI 10.1007/s10040-006-0055-y

These parameter variations result in a total of eightparameter sets. Therefore, eight new three-dimensionalUZ flow fields are generated to account for the uncertain-ties in the four hydrological parameters for the fracturesand the matrix. The mean glacial transition infiltrationscenario used in this report corresponds to a potentialfuture climate with higher average surface infiltration thanthe present-day climate. The three-dimensional UZ flowmodel, based on the current geological framework model,is used to incorporate site-specific data for YuccaMountain and implement updated hydrological properties.
Modeling results of the eight three-dimensional flowsimulations have been compared with observed boreholemoisture water data and among themselves. In addition,the eight sensitivity simulations are also compared withthe base-case simulation results that use the base-caseproperty set. The eight sensitivity flow fields cover a widerange of variability in modeled liquid saturation, waterpotential, and percolation flux. The comparisons showthat the eight modeled results, even though showing somesimilarities with the measured saturation and water-potential profiles, as well as simulated results with the
Fig. 18 Comparisons of simulated breakthrough curves of cumulative conservative tracer (Tc) mass arriving at the water table, afterrelease from the repository for the eight sensitivity simulation and base-case flow fields
Fig. 19 Comparisons of simulated breakthrough curves of cumulative reactive tracer (Np) mass arriving at the water table, after releasefrom the repository for the eight sensitivity simulation and base-case flow fields
1617
Hydrogeology Journal (2006) 14: 1599–1619 DOI 10.1007/s10040-006-0055-y

base-case parameter set, are different from the base-casesimulation results. In general, the eight new modelingresults indicate that uncertainties in matrix parameterscause larger uncertainty in simulated liquid saturation,water potential, and percolation flux than correspondinguncertainty in fracture properties.
Comparisons of the repository percolation fluxesobtained by the eight sensitivity simulations and thebase-case flow field indicate that percolation fluxes atthe repository are generally similar to each other. The onlymajor differences are predicted when matrix permeabilityis increased by one standard deviation or matrix vanGenuchten α is decreased by one standard deviation. Themodeled percolation fluxes also show little sensitivity tochanges in fracture parameters.
Simulated percolation fluxes at the water table from theeight sensitivity simulations (as compared with the basecase) show similar percolation flux patterns, except in thetwo cases of increased matrix permeability and decreasedmatrix van Genuchten α. For these cases, the water-tableflux shows some differences in the southwest portion ofthe model domain, where nonfractured vitric zones of theCHn unit intersect the water table. In the northern half ofthe model domain, all the eight flow fields at the watertable are nearly the same as the base case. In all cases, thelower-permeability zeolitic units in the north cause lateralflow, which focuses flow into fractures and results in theformation of perched water bodies. Similar to therepository-level fluxes, uncertainty in fracture propertieshas little impact on flow patterns at the water table.
At the top of the PTn unit, fracture and matrix flowcomponents and fault flow percentage are very similar forall the eight sensitivity cases, and are comparable to thebase-case simulation results. In all cases, fracture flowdominates, both within the repository footprint and overthe entire model domain. At the repository level, matrixflow components from the six sensitivity simulations outof the eight simulations show similar fracture and matrixflow components compared to the base case. The twoexceptional cases are those with increased matrix perme-ability and decreased matrix van Genuchten α, whichpredict a significant increase in matrix flow and acorresponding decrease in fracture flow. Large changesin simulated fracture and matrix flow components at thewater table are shown by the statistics from the eightsensitivity results within the repository footprint, whencompared with the base case. The most significant changeis the case with increased matrix permeability.
In terms of impacting radionuclide transport fromrepository to water table, conservative tracer transportshows longer breakthrough times with modified matrixproperties than the base case, with little sensitivity tovariation in fracture properties. For reactive tracer trans-port, the sensitivity results are more variable. Delayedinitial breakthrough relative to the base case is found forthe sensitivity cases with decreased matrix permeabilityand increased matrix van Genuchten α. At later times,delayed breakthrough relative to the base case is foundonly for the sensitivity case with increased matrix
permeability. Similar to flow patterns, variations in matrixproperties have a greater effect on tracer transport timesthan variations in fracture properties.
The modeling sensitivity analyses in this study providea systematic evaluation of how uncertainty in fracture andmatrix parameters affects simulated flow and transportresults in the Yucca Mountain UZ using the site-scale flowand transport model. Even though the investigations aresite-specific, many insights obtained from this study mayalso be applicable to other sites featuring unsaturatedfractured rock, as long as fracture permeability is muchhigher than matrix permeability at those sites, and netsurface infiltration rates are relatively low. Under suchconditions, fracture transmissivity is many orders ofmagnitude higher than ambient infiltration, and changesin fracture properties will then have little impact onunsaturated water flow. Note that there are certainlimitations to the current modeling studies, and onesignificant limitation to this study is that the sensitivityanalyses are based on a limited number (eight or nine) ofthree-dimensional simulation results with respect to fourfracture-matrix parameters only. In addition, the site-scaleUZ flow model, on which the modeling analyses arebased, uses a volume-averaging numerical approach thatdoes not incorporate small-scale heterogeneity. Futuremodeling efforts such as using Monte Carlo simulations,may be directed towards resolving some of these issues.
Acknowledgements The authors would like to thank Dr. CharlesHaukwa and the anonymous reviewers for their critical comments.We also would like to thank Bechtel SAIC Company for the projectmanagement. Thanks are also due to Hui-Hai Liu for his help andcontribution to estimating parameter uncertainties. This work wassupported by the Director, Office of Civilian Radioactive WasteManagement, US Department of Energy, through MemorandumPurchase Order EA9013MC5X between Bechtel SAIC Company,LLC, and the Ernest Orlando Lawrence Berkeley NationalLaboratory (Berkeley Lab). The support is provided to BerkeleyLab through the US Department of Energy Contract No. DE-AC03-76SF00098.
References
Ahlers CF, Bandurraga TM, Bodvarsson GS, Chen G, Finsterle S,Wu YS (1995a) Summary of model calibration and sensitivitystudies using the LBNL/USGS three-dimensional unsaturatedzone site-scale model, Yucca Mountain Site CharacterizationProject Report, Lawrence Berkeley National Laboratory,Berkeley, CA
Ahlers CF, Bandurraga TM, Bodvarsson GS, Chen G, Finsterle S,Wu YS (1995b) Performance analysis of the LBNL/USGSthree-dimensional unsaturated zone site-scale model, YuccaMountain Project Milestone 3GLM105M, Lawrence BerkeleyNational Laboratory, Berkeley, CA
Ahlers CF, Finsterle S, Bodvarsson GS (1999) Characterization andprediction of subsurface pneumatic response of at YuccaMountain, Nevada. J Contam Hydrol 38(1–3):47–68
Bandurraga TM, Bodvarsson GS (1999) Calibrating hydrogeologicproperties for the 3-D site-scale unsaturated zone model ofYucca Mountain, Nevada. J Contam Hydrol 38:(1–3):25–46
BSC (Bechtel SAIC Company) (2004a) Geologic framework model(GFM2000). MDL-NBS-GS-000002 REV 02, Bechtel SAICCompany, Las Vegas, NV
1618
Hydrogeology Journal (2006) 14: 1599–1619 DOI 10.1007/s10040-006-0055-y

BSC (Bechtel SAIC Company) (2004b) Development of numericalgrids for UZ flow and transport modeling. ANL-NBS-HS-000015 REV 02, Bechtel SAIC Company, Las Vegas, NV
BSC (Bechtel SAIC Company) (2004c) Simulation of net infiltra-tion for present-day and potential future climates. MDL-NBS-HS-000023 REV 00, Bechtel SAIC Company, Las Vegas, NV
BSC (Bechtel SAIC Company) (2004d) Calibrated propertiesmodel. MDL-NBS-HS-000003 REV 02, Bechtel SAIC Com-pany, Las Vegas, NV
BSC (Bechtel SAIC Company) (2004e) Analysis of hydrologicproperties data, ANL-NBS-HS-000042 REV 00, Bechtel SAICCompany, Las Vegas, NV
BSC (Bechtel SAIC Company) (2004f) UZ Flow Models andSubmodels. MDL-NBS-HS-000006 REV 02, Bechtel SAICCompany, Las Vegas, NV
BSC (Bechtel SAIC Company) (2004g) Particle tracking model andabstraction of transport processes. MDL-NBS-HS-000020 REV01, Bechtel SAIC Company, Las Vegas, NV
Buesch DC, Spengler RW, Moyer TC, Geslin JK (1995) Nomen-clature and macroscopic identification of lithostratigraphic unitsof the Paintbrush Group exposed at Yucca Mountain, Nevada,Report USGS OFR 94-469, US Geol Surv, Lakewood, CO
LBNL (Lawrence Berkeley National Laboratory) (1999) Softwarecode: T2R3D. V1.4, Earth Sciences Division, LawrenceBerkeley National Laboratory, Berkeley, CA
LBNL (Lawrence Berkeley National Laboratory) (2003) Softwarecode: TOUGH2. V1.6, Earth Sciences Division, LawrenceBerkeley National Laboratory, Berkeley, CA
Liu HH, Doughty C, Bodvarsson GS (1998) An active fracturemodel for unsaturated flow and transport in fractured rocks.Water Resour Res 34:2633–2646
Montazer P, Wilson WE (1984) Conceptual hydrologic model offlow in the unsaturated zone, Yucca Mountain, Nevada. Water-Resources Investigations Report 84–4345, US Geol Surv,Lakewood, CO
Moridis GJ, Hu Q, Wu YS, Bodvarsson GS (2003) Preliminary 3-Dsite-scale studies of radioactive colloid transport in theunsaturated zone at Yucca Mountain, Nevada. J Contam Hydrol60:251–286
Pan L, Wu YS, Zhang K (2004) A modeling study of flow diversionand focusing in unsaturated fractured rock. Vadose Zone J3:233–246
Pollock DW (1986) Simulation of fluid flow and energy transportprocesses associated with high-level radioactive waste disposalin unsaturated alluvium. Water Resour Res 22(5):765–775
Robinson BA, Li C, Ho CK (2003) Performance assessment modeldevelopment and analysis of radionuclide transport in theunsaturated zone, Yucca Mountain, Nevada. J Contam Hydrol62–63, 249–268
Rousseau JP, Kwicklis EM, Gillies C (eds) (1998) Hydrogeology ofthe unsaturated zone, North Ramp area of the exploratorystudies facility, Yucca Mountain, Nevada, Water-ResourcesInvestigations 98–4050, US Geol Surv, Lakewood, CO
Rulon J, Bodvarsson GS, Montazer P (1986) Preliminary numericalsimulations of groundwater flow in the unsaturated zone, Yucca
Mountain, Nevada. LBL-20553, Lawrence Berkeley NationalLaboratory, Berkeley, CA
Scott RB, Bonk J (1984) Preliminary geologic map of YuccaMountain, Nye County, Nevada, with geologic sections, ReportUSGS OFR-84-494, US Geol Surv, Lakewood, CO
Tsang YW, Pruess K (1987) A study of thermally inducedconvection near a high-level nuclear waste repository inpartially saturated fracture tuff. Water Resour Res 23(10):1958–1966
van Genuchten MTh (1980) A closed-form equation for predictingthe hydraulic conductivity of unsaturated soils. Soil Sci SocAmer J 44(5):892–898
Wang JS, Narasimhan TN (1987) Hydrologic modeling of verticaland lateral movement of partially saturated fluid flow near afault zone at Yucca Mountain. SAND87-7070, Sandia NationalLaboratories and LBL-23510, Lawrence Berkeley NationalLaboratory, Berkeley, CA
Weeks EP (1987) Effects of topography on gas flow in unsaturatedfractured rock: concepts and observations, flow and transportthrough unsaturated rock. In: Evens DD, Nicholson TJ (eds)Geophysical monograph 42. American Geophysical Union,Washington, DC, pp 165–170
Wittwer C, Bodvarsson GS, Chornack MP, Flint A, Flint L, LewisBD, Spengler RW, Rautman CA (1992) Design of a three-dimensional site-scale model for the unsaturated zone at YuccaMountain, Nevada. High Level Radioactive Waste Manage-ment, Proceedings of the Third International Conference, 12–16April 1992, Las Vegas, NV, pp 263–271
Wittwer C, Chen G, Bodvarsson GS, Chornack M, Flint A, Flint,Kwicklis E, Spengler R (1995) Preliminary development of theLBL/USGS three-dimensional site-scale model of Yucca Moun-tain, Nevada, LBL-37356, Lawrence Berkeley National Labo-ratory, Berkeley, CA
Wu YS, Pruess K (2000) Numerical simulation of non-isothermalmultiphase tracer transport in heterogeneous fractured porousmedia. Adv Water Resour 23:699–723
Wu YS, Ahlers CF, Fraser P, Simmons A, Pruess K (1996) SoftwareQualification of Selected TOUGH2 Modules, Report LBL-39490; UC-800, Lawrence Berkeley National Laboratory,Berkeley, CA
Wu YS, Haukwa C, Bodvarsson GS (1999a) A site-scale model forfluid and heat flow in the unsaturated zone of Yucca Mountain,Nevada. J Contam Hydrol 38(1–3):185–217
Wu YS, Ritcey AC, Bodvarsson GS (1999b) A modeling study ofperched water phenomena in the unsaturated zone at YuccaMountain. J Contam Hydrol 38(1–3):157–184
Wu YS, Pan L, Zhang W, Bodvarsson GS (2002a) Characterizationof flow and transport processes within the unsaturated zone ofYucca Mountain, Nevada. J Contam Hydrol 54:215–247
Wu YS, Zhang W Pan L, Hinds J, Bodvarsson GS (2002b)Modeling capillary barriers in unsaturated fractured rock. WaterResour Res 38(11):1253
Wu YS, Lu G, Zhang K, Bodvarsson GS (2004) A mountain-scalemodel for characterizing unsaturated flow and transport infractured tuffs of Yucca Mountain. Vadose Zone J 3:796–805
1619
Hydrogeology Journal (2006) 14: 1599–1619 DOI 10.1007/s10040-006-0055-y