semiconductor road conditions: slow, bumpy, but … 2015 gartner luncheon...
TRANSCRIPT

CONFIDENTIAL AND PROPRIETARY This presentation, including any supporting materials, is owned by Gartner, Inc. and/or its affiliates and is for the sole use of the intended Gartner audience or other intended recipients. This presentation may contain information that is confidential, proprietary or otherwise legally protected, and it may not be further copied, distributed or publicly displayed without the express written permission of Gartner, Inc. or its affiliates. © 2015 Gartner, Inc. and/or its affiliates. All rights reserved.
CONFIDENTIAL AND PROPRIETARY This presentation, including any supporting materials, is owned by Gartner, Inc. and/or its affiliates and is for the sole use of the intended Gartner audience or other intended recipients. This presentation may contain information that is confidential, proprietary or otherwise legally protected, and it may not be further copied, distributed or publicly displayed without the express written permission of Gartner, Inc. or its affiliates. © 2015 Gartner, Inc. and/or its affiliates. All rights reserved.
Semiconductor Road Conditions: Slow, Bumpy, But Straight Ahead MEPTEC Luncheon September 15, 2015
Jim Walker
Gartner
This webinar and accompanying slides are the intellectual property of Gartner and only clients with licensed access to Gartner’s Semiconductor research may view the webinar and slides.

1 CONFIDENTIAL AND PROPRIETARY I © 2015 Gartner, Inc. and/or its affiliates. All rights reserved. 1 CONFIDENTIAL AND PROPRIETARY I © 2015 Gartner, Inc. and/or its affiliates. All rights reserved.
Semiconductor Devices
Application Markets
Outsourcing Services – Foundry & SATS/OSAT
Mergers/Acquisitions
Summary & Recommendations
Presentation Overview

2 CONFIDENTIAL AND PROPRIETARY I © 2015 Gartner, Inc. and/or its affiliates. All rights reserved. 2 CONFIDENTIAL AND PROPRIETARY I © 2015 Gartner, Inc. and/or its affiliates. All rights reserved.
The outlook for 2015 semiconductor growth has
weakened due to softness in key electronic equipment
categories including PCs, smartphones and tablets

3 CONFIDENTIAL AND PROPRIETARY I © 2015 Gartner, Inc. and/or its affiliates. All rights reserved. 3 CONFIDENTIAL AND PROPRIETARY I © 2015 Gartner, Inc. and/or its affiliates. All rights reserved.
Strong dollar remains an issue as electronic equipment vendors increase prices in affected regions, impacting demand
Traditional PC weaker, 2015 set to decline 8.7% slightly worse than previously expected
2015 total ultramobile unit production expected to decline 1.9%, down from growth of 6.2% previously. Outlook for hybrids, clamshells and tablets all lower
Any issues with the launch of Windows 10 or Intel’s Skylake in 3Q15, which are expected to reinvigorate PC sales, could lead to further downside.
2015 total mobile phone unit production growth lowered to 0.7% versus 3.0% in our previous update. Smartphone growth lowered to 14.8% on softness in key markets
Key Assumptions: Semiconductor Electronic Equipment

4 CONFIDENTIAL AND PROPRIETARY I © 2015 Gartner, Inc. and/or its affiliates. All rights reserved. 4 CONFIDENTIAL AND PROPRIETARY I © 2015 Gartner, Inc. and/or its affiliates. All rights reserved.
0
50
100
150
200
250
300
350
400
450
2009 2010 2011 2012 2013 2014 2015 2016 2017 2018 2019
1Q15 Forecast 2Q15 Forecast
Billions of Dollars and Revenue Growth
Worldwide Semiconductor 2Q15 Revenue Forecast: 2015 Growth Reduced Again, Memory Cycle Unchanged
$368
4.4%
$301
31.8%
$229
-14.4%
$308
2.1%
$300
2.6%
$315
5.2%
$340
7.9%
$348
2.2%
$315
5.0%
$340
7.9%
$354
4.0%
$357
0.9% 1Q15 Forecast
$352
1.3%
$370
3.6%
$388
5.6%
$391
5.6%
$404
4.1%
$407
4.1%

5 CONFIDENTIAL AND PROPRIETARY I © 2015 Gartner, Inc. and/or its affiliates. All rights reserved. 5 CONFIDENTIAL AND PROPRIETARY I © 2015 Gartner, Inc. and/or its affiliates. All rights reserved.
Semiconductor Revenue, 2Q15 Update: Device Revenue and Annual Growth Revenue ($B) 2014 2015 2016 2017 2018 2019 CAGR Memory 80.3 84.4 78.0 80.1 89.5 92.5 2.9%
Microcomponents 63.7 63.5 65.5 67.9 68.8 71.1 2.2%
Logic 12.8 12.9 13.7 14.6 15.3 15.9 4.4%
Analog 20.8 21.1 21.8 22.2 22.7 23.5 2.4%
Discrete 19.1 19.5 19.9 20.2 20.8 21.6 2.4%
Optoelectronics 27.1 29.3 31.7 34.7 37.5 40.3 8.3%
ASIC 20.6 21.4 22.0 22.6 23.4 24.7 3.7%
ASSP 89.0 88.6 91.7 96.9 101.1 104.5 3.3%
Non-Optical Sensors 6.8 7.2 7.9 8.7 9.5 10.3 8.5%
Total Semiconductor 340.3 347.8 352.2 367.8 388.5 404.3 3.5%
Annual Growth (%) Memory 16.6% 5.1% -7.5% 2.6% 11.7% 3.4%
Microcomponents 6.3% -0.4% 3.3% 3.6% 1.3% 3.3%
Logic 4.7% 0.5% 6.2% 6.2% 4.8% 4.5%
Analog 7.6% 1.2% 3.1% 2.0% 2.2% 3.4%
Discrete 7.3% 1.9% 2.2% 1.5% 2.9% 3.6%
Optoelectronics 5.7% 8.2% 8.4% 9.4% 8.1% 7.4%
ASIC 4.1% 3.9% 2.8% 2.9% 3.7% 5.2%
ASSP 4.2% -0.4% 3.4% 5.7% 4.3% 3.4%
Non-Optical Sensors 8.0% 5.5% 9.3% 10.0% 9.4% 8.5%
Total Semiconductor 7.9% 2.2% 1.3% 4.4% 5.6% 4.1%
Non-Memory 5.5% 1.3% 4.1% 4.9% 3.9% 4.3%

6 CONFIDENTIAL AND PROPRIETARY I © 2015 Gartner, Inc. and/or its affiliates. All rights reserved. 6 CONFIDENTIAL AND PROPRIETARY I © 2015 Gartner, Inc. and/or its affiliates. All rights reserved.
NAND Market: Cautious Optimism, As Long as the Industry Remains Responsible
0
5
10
15
20
25
30
35
40
45
50
2011 2012 2013 2014 2015 2016 2017 2018 2019
Reve
nu
e
(Bil
lio
ns o
f D
olla
rs)
Source: Gartner June 2015
Upcoming “Forecast Analysis: NAND Flash, Worldwide, 2Q15 Update”
Petabytes 18,796 30,466 43,359 61,065 84,631 117,176 161,176 214,479 275,314 CAGR 14-19
Bit Growth 77.5% 62.1% 42.3% 40.8% 38.6% 38.5% 37.6% 33.1% 28.4% 35.1%
ASP 1GB eqv.* 1.24 0.73 0.64 0.46 0.36 0.28 0.23 0.19 0.15 CAGR 14-19
ASP Change -33.4% -40.6% -13.5% -26.8% -21.5% -22.9% -17.2% -19.9% -18.3% -20.0%
~ Cost Curve -35% -30% -20% -23% -20% -18% -15% -20% -20%
SSD Price Declines outpacing NAND price Declines through 2016
CAGR 14-19
8.1% -3.7%
23.1% 3.1% 8.8%
4.9%
6.7%
13.8% 6.6%
18.2%

7 CONFIDENTIAL AND PROPRIETARY I © 2015 Gartner, Inc. and/or its affiliates. All rights reserved. 7 CONFIDENTIAL AND PROPRIETARY I © 2015 Gartner, Inc. and/or its affiliates. All rights reserved.
DRAM Forecast, 2Q15: DRAM Market Metrics – 2015 an All Time High
0
10
20
30
40
50
2011 2012 2013 2014 2015 2016 2017 2018 2019
32.0%
-17.4%
18.6% 2.3%
-7.0% 33.2%
-25.1%
3.8%
-11.3%
7
Megabytes Bn 2,910 3,837 4,716 6,156 7,717 10,098 12,975 16,137 19,807 CAGR 14-19
Bit Growth 48.6% 31.9% 22.9% 30.5% 25.4% 30.8% 28.5% 24.4% 22.7% 26.3%
ASP 4Gb eqv. 5.20 3.50 3.79 3.83 3.17 2.00 1.45 1.38 1.15 -21.4%
ASP Change -49.6% -32.7% 8.4% 1.1% -17.2% -36.9% -27.6% -4.6% -16.6%
ASP 4Gb eqv.* 3.55 2.03 2.84 3.52 2.62 1.39 0.97 1.04 0.91 -23.8%
ASP Change -61.9% -42.8% 39.9% 24.2% -25.8% -46.7% -30.7% 7.8% -12.8%
* Commodity pricing, the blended average of device densities being sold into the PC market.
Low Power DRAM
Standard DRAM
$47.8
Reve
nu
e
(Bil
lio
ns o
f D
olla
rs)
CAGR 14-19
-0.6%

8 CONFIDENTIAL AND PROPRIETARY I © 2015 Gartner, Inc. and/or its affiliates. All rights reserved. 8 CONFIDENTIAL AND PROPRIETARY I © 2015 Gartner, Inc. and/or its affiliates. All rights reserved.
Where is the Semi Growth in 2015? Smartphones and SSDs Drive the Market
Source: Gartner, June 2015 “Semiconductor Forecast Database, Worldwide, 2Q15 Update”
2014 to 2015 Growth Contribution by Electronic Application Share of Growth
-8 -6 -4 -2 0 2 4 6 8 10
Smartphone
SSD
Industrial
Automotive
Wearable
Consumer Excl. Wearable
Ultramobile
Traditional Phone
Traditional PCs
Other
$ Billions
99%
55%
22%
21%
11%
4%
2%
-30%
-80%
-6%

9 CONFIDENTIAL AND PROPRIETARY I © 2015 Gartner, Inc. and/or its affiliates. All rights reserved. 9 CONFIDENTIAL AND PROPRIETARY I © 2015 Gartner, Inc. and/or its affiliates. All rights reserved.
0
100
200
300
400
500
600
700
2013 2014 2015 2016 2017 2018 2019
Desk-based PCs Notebook PCs Ultramobile
Traditional notebook and desktop segments shrinking, units down 8.7% in 2015, slightly weaker compared to 1Q15 forecast
Inventory in the PC market remains high despite vendors looking to clear the supply chain in anticipation of Windows 10 and Intel’s Skylake
Corporate PC refresh cycle has run its course
Production CAGR '14-'19 is 1.8%
Semi TAM CAGR '14-'19 is -1.6%
PC and Ultramobile Production Forecast Waiting for Windows 10 and Skylake PC and Ultramobile Unit Production (Millions of Units)
3.1% 5.0%
3.4% -5.1% 9.8% 3.8%
61.2 64.4 58.6 56.6 56.6 57.8 59.4
19.4% 18.9% 16.9% 16.1% 15.4% 14.9% 14.7%
Semi Revenue and Share of Market (Billions of Dollars)
3.0%
Source: Gartner, June 2015
“Semiconductor Forecast Database, Worldwide, 2Q15 Update”

10 CONFIDENTIAL AND PROPRIETARY I © 2015 Gartner, Inc. and/or its affiliates. All rights reserved. 10 CONFIDENTIAL AND PROPRIETARY I © 2015 Gartner, Inc. and/or its affiliates. All rights reserved.
Outlook for tablets revised downward significantly, Apple units down 23% in 1Q15
Tablet form factor represents 87% of ultramobile units in 2014 and will decline to 72% in 2019
Hybrid and Clamshell form factors remain small but represent a significant portion of the premium category (86%) in 2019
MediaTek and Intel taking share in application processor market
Cellular penetration increasing
Production CAGR ‘14-’19 is 6.3%
Semi TAM CAGR ‘14-’19 is 8.0%
Ultramobile Production Forecast Hybrids and Clamshells Countering Tablets Slack
Source: Gartner, June 2015
“Semiconductor Forecast Database, Worldwide, 2Q15 Update”
0
50
100
150
200
250
300
350
400
450
2013 2014 2015 2016 2017 2018 2019
Ultramobile Tablet Ultramobile Clamshell Ultramobile Hybrid
Ultramobile Unit Production (Millions of Units)
17.1 20.4 20.6 22.6 25.0 27.3 30.0
5.4% 6.0% 5.9% 6.4% 6.8% 7.0% 7.4%
Semi Revenue and Share of Market (Billions of Dollars)
8.9%
53.3%
7.9% 7.8%
15.2% -1.9% 8.9%

11 CONFIDENTIAL AND PROPRIETARY I © 2015 Gartner, Inc. and/or its affiliates. All rights reserved. 11 CONFIDENTIAL AND PROPRIETARY I © 2015 Gartner, Inc. and/or its affiliates. All rights reserved.
0
500
1,000
1,500
2,000
2,500
2013 2014 2015 2016 2017 2018 2019
Premium Traditional OS Basic Traditional OSUtility Traditional OS Premium Smart OSBasic Smart OS Utility Smart OS
Apple iPhone Units bright spot for the market with units and ASPs up strongly driven by iPhone 6 and 6 plus
High-end Android units have been muted
Softness in the overall China smartphone market
Shift to LTE in key markets like China continues to accelerate at the expense of 3G, a key driver for semiconductor content
Smartphones expected to account for over 95% of total phone units in 2019
Production CAGR '14-'19 is 2.6%
Semi TAM CAGR '13-'18 is 4.3%
Mobile Phone Production Forecast: Smartphone Growth Revised Down to 15%
Source: Gartner, June 2015
“Semiconductor Forecast Database, Worldwide, 2Q15 Update”
Mobile Phone Unit Production and Growth (Millions of Units)
66.7 72.9 78.1 80.4 85.3 90.3 90.1
21.1% 21.4% 22.5% 22.8% 23.2% 23.3% 22.3%
Semi Revenue and Share of Semiconductor Market (Billions of Dollars)
-0.1%
2.8 % 4.6 % 3.5%
2.5% 0.7 % 4.6 %

12 CONFIDENTIAL AND PROPRIETARY I © 2015 Gartner, Inc. and/or its affiliates. All rights reserved. 12 CONFIDENTIAL AND PROPRIETARY I © 2015 Gartner, Inc. and/or its affiliates. All rights reserved.
Smartphone Component
Ultra-low cost
Smartphone
Low cost
Smartphone
Mid-range
Smartphone
Mid-range
Smartphone (LTE)
High end
Smartphone (LTE)
Flagship
Smartphone (LTE)
Baseband Processor $ 3.50 $ 5.50 $ 10.00 $ 15.00 $ 25.00 $ 15.00
Application/Multimedia Processor Integrated in BB Integrated in BB Integrated in BB Integrated in BB Integrated in BB $ 25.00
RF Content $ 1.50 $ 2.50 $ 4.00 $ 6.50 $ 10.00 $ 12.00
Wireless Connectivity Bundled in BB Bundled in BB Bundled in BB Bundled in BB $ 4.00 $ 5.50
Memory - Total $ 3.00 $ 6.00 $ 11.50 $ 11.50 $ 23.00 $ 38.00
DRAM $ 2.00 $ 4.00 $ 8.00 $ 8.00 $ 16.00 $ 24.00
NAND $ 1.00 $ 2.00 $ 3.50 $ 3.50 $ 7.00 $ 14.00
User Interface + Sensors $ 1.50 $ 2.00 $ 3.00 $ 3.00 $ 6.00 $ 8.00
Power Management Bundled in BB Bundled in BB Bundled in BB Bundled in BB Bundled in BB $ 3.00
Other Semiconductors $ 2.00 $ 3.00 $ 5.00 $ 5.00 $ 7.00 $ 8.50
Display/touchscreen $ 6.00 $ 10.00 $ 18.00 $ 18.00 $ 35.00 $ 60.00
Display Size 3.5-4.0-inch
Capacitive, HVGA
4.0-4.5-inch
Capacitive, WVGA
4.5-5.0-inch WVGA,
720p
4.5-5.0-inch WVGA,
720p 5.0-5.5-inch 1080p
5.0-5.5-inch 2K
qHD
Camera Module/Image Sensor $ 1.00 $ 1.80 $ 5.00 $ 5.00 $ 10.00 $ 22.00
Camera Details 2MP 3MP 5/8MP, 1.3MP Front 5/8MP, 1.3MP Front 8MP/13MP Primary,
2~5MP Front
16MP+ OIS
Primary, 5~8MP
Front
Battery $ 2.00 $ 2.50 $ 4.00 $ 4.00 $ 6.50 $ 8.00
Battery Size 1300mAh 1500mAh 1800mAh 1800mAh 2500mAh 3000mAh
Casing/PCBs/Connectors/etc. $ 3.50 $ 5.00 $ 8.00 $ 8.00 $ 18.00 $ 22.00
Total $ 24.00 $ 38.30 $ 68.50 $ 76.00 $ 144.50 $ 202.00
Smartphone Type and Semiconductor Content

13 CONFIDENTIAL AND PROPRIETARY I © 2015 Gartner, Inc. and/or its affiliates. All rights reserved. 13 CONFIDENTIAL AND PROPRIETARY I © 2015 Gartner, Inc. and/or its affiliates. All rights reserved.
Wearable Semiconductor Content Forecast: Strong Growth but off a Small Base
0
500
1,000
1,500
2,000
2,500
3,000
3,500
4,000
4,500
2014 YR 2015 YR 2016 YR 2017 YR 2018 YR 2019 YR
ASSP Memory Analog
Nonoptical Sensors ASIC Logic
Microcontrollers Optoelectronics Discrete
CMOS Image Sensors
• Wearable semiconductor revenue grows > 5X from 2014 to 2019, but is only 1% of total semi revenue in 2019
• ASSP and ASIC combined represent over 1/3 of wearables semi revenue from 2015 to 2019; more opportunity to integrate
• Memory has CAGR of 49.0% mainly due to growth of smart watches and HMD/cameras
• Complete reference designs/turnkey solutions will be opportunity for semi companies, distributors and integrators
• Semi TAM CAGR ’14-’19 is 25.3%
Wearable Semiconductor Revenue ($K)
14 CONFIDENTIAL AND PROPRIETARY I © 2015 Gartner, Inc. and/or its affiliates. All rights reserved. 14 CONFIDENTIAL AND PROPRIETARY I © 2015 Gartner, Inc. and/or its affiliates. All rights reserved.
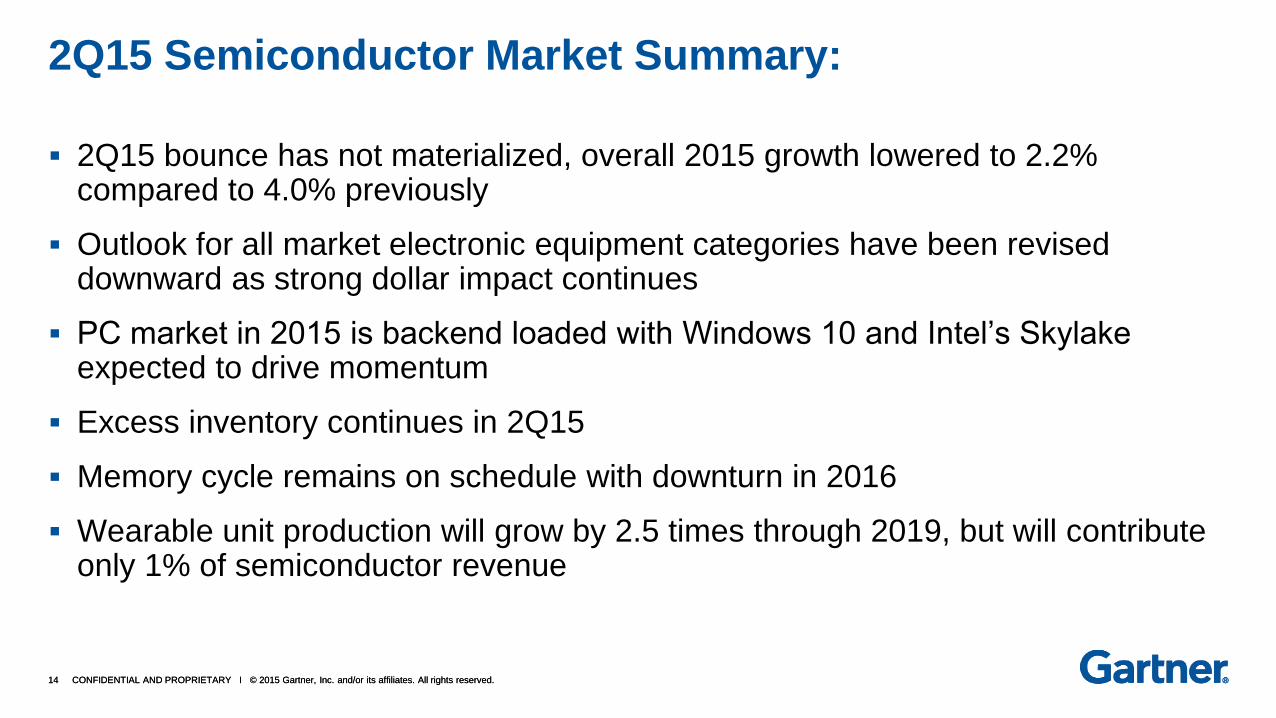
2Q15 bounce has not materialized, overall 2015 growth lowered to 2.2% compared to 4.0% previously
Outlook for all market electronic equipment categories have been revised downward as strong dollar impact continues
PC market in 2015 is backend loaded with Windows 10 and Intel’s Skylake expected to drive momentum
Excess inventory continues in 2Q15
Memory cycle remains on schedule with downturn in 2016
Wearable unit production will grow by 2.5 times through 2019, but will contribute only 1% of semiconductor revenue
2Q15 Semiconductor Market Summary:

CONFIDENTIAL AND PROPRIETARY This presentation, including any supporting materials, is owned by Gartner, Inc. and/or its affiliates and is for the sole use of the intended Gartner audience or other intended recipients. This presentation may contain information that is confidential, proprietary or otherwise legally protected, and it may not be further copied, distributed or publicly displayed without the express written permission of Gartner, Inc. or its affiliates. © 2015 Gartner, Inc. and/or its affiliates. All rights reserved.
CONFIDENTIAL AND PROPRIETARY This presentation, including any supporting materials, is owned by Gartner, Inc. and/or its affiliates and is for the sole use of the intended Gartner audience or other intended recipients. This presentation may contain information that is confidential, proprietary or otherwise legally protected, and it may not be further copied, distributed or publicly displayed without the express written permission of Gartner, Inc. or its affiliates. © 2015 Gartner, Inc. and/or its affiliates. All rights reserved.
Manufacturing Markets -Outsourcing Services: Foundry and SATS/OSAT

16 CONFIDENTIAL AND PROPRIETARY I © 2015 Gartner, Inc. and/or its affiliates. All rights reserved. 16 CONFIDENTIAL AND PROPRIETARY I © 2015 Gartner, Inc. and/or its affiliates. All rights reserved.
The growth of foundry revenue slows to single-digit rate as markets which have driven high growth saturate
In 2015, foundry capex increases by 17.2% to $22.2 billion, lowered than our previous forecast due to 20nm capacity will be converted sooner to 16nm
Competition in wafer prices intensifies as fab utilization rate drops to 85% or lower starting 2Q15
The policy of aggressive investment to semiconductor manufacturers by Chinese government has benefited the supply chain in China and many JVs have been announced
2Q15 Foundry Highlights

17 CONFIDENTIAL AND PROPRIETARY I © 2015 Gartner, Inc. and/or its affiliates. All rights reserved. 17 CONFIDENTIAL AND PROPRIETARY I © 2015 Gartner, Inc. and/or its affiliates. All rights reserved.
2Q15 Foundry Revenue and Forecast
0
10
20
30
40
50
60
70
80
2013 2014 2015 2016 2017 2018 2019
1Q15
2Q15
Billions of Dollars and Revenue Growth
1Q15 Forecast $49.9
6.4%
$52.1
4.4%
$55.2
6.1%
$59.3
5.2%
$46.9
16.1%
$49.8
6.3%
$52.4
5.2%
$55.6
6.1%
$58.5
5.2%
$61.3
4.7%
$40.4
16.2%
Foundry Revenue CAGR
2014 - 2019 = 5.5%
$62.9
4.7%

18 CONFIDENTIAL AND PROPRIETARY I © 2015 Gartner, Inc. and/or its affiliates. All rights reserved. 18 CONFIDENTIAL AND PROPRIETARY I © 2015 Gartner, Inc. and/or its affiliates. All rights reserved.
SATS Industry Highlights – 2015
Virtual and vertical integration of outsourcing is occurring as the manufacturing processes of wafer fab, packaging, and system assembly converge. Outsourcing business models are changing as system level integration is re-established.
Wafer-based packaging processes are now mainstream. In addition to companies within the SATS market, the foundry market has also emerged as a SATS competitor. Process leverage is key.
The SATS industry has reached above the 50% outsourcing mark, but will still exhibit a growth rate above that of the overall semiconductor device industry with a (CAGR) of 5.2% from 2014 through 2019.
China is the growth market for semiconductor manufacturing, with $100 billion supplied by China Gov’t, including M&A and JV. Expansion into China by SATS companies continues, as engineering expertise and supply chain infrastructure are fully developed in the area.
Consolidation must occur among the more than 150 companies participating in the SATS industry. 36 have revenue over $100 million USD. Many SATS companies will not be able to develop the necessary capital required for the increased complexity and wafer-like equipment cost required to stay competitive.
As competition intensifies and capital requirements increase, the SATS market will stratify into three segments: leading edge, specialty niche and sunset/mature packaging services.
18

19 CONFIDENTIAL AND PROPRIETARY I © 2015 Gartner, Inc. and/or its affiliates. All rights reserved. 19 CONFIDENTIAL AND PROPRIETARY I © 2015 Gartner, Inc. and/or its affiliates. All rights reserved.
SATS Market History/Forecast, 1999 to 2019
0
10
20
30
40
50
60
0
5,000
10,000
15,000
20,000
25,000
30,000
35,000
40,000
199
9
200
0
200
1
200
2
200
3
200
4
200
5
200
6
200
7
200
8
200
9
201
0
201
1
201
2
201
3
20
14
201
5
201
6
201
7
201
8
201
9Percent Outsourcing Millions of Dollars
Revenue Ratio
Revenue CAGR
1999-2009 = 8.0%
Revenue CAGR
2010-2019= 4.4%

20 CONFIDENTIAL AND PROPRIETARY I © 2015 Gartner, Inc. and/or its affiliates. All rights reserved. 20 CONFIDENTIAL AND PROPRIETARY I © 2015 Gartner, Inc. and/or its affiliates. All rights reserved.
Worldwide Packaging & Test Revenue Forecast 2013- 2019 (Millions of US Dollars)
20 Gartner: June 2015
2013 2014 2015 2016 2017 2018 2019
CAGR
2014-2019
Packaging and Test Market (IDM)* 24,683.8 26,052.0 26,710.2 26,967.2 27,676.0 28,935.0 30,345.3 3.1%
Packaging Revenue Only 19,571.6 20,676.1 21,297.0 21,463.8 21,930.6 23,032.8 24,156.4 3.2%
Test Revenue Only 5,112.2 5,375.9 5,413.2 5,503.4 5,745.5 5,902.2 6,188.9 2.9%
Outsourcing Market (SATS) 25,081.9 27,130.2 28,242.6 29,033.4 30,760.9 32,978.8 34,911.5 5.2%
Packaging Revenue Only 19,600.6 21,328.2 22,050.4 22,516.1 23,800.6 25,651.5 27,231.0 5.0%
Test Revenue Only 5,481.3 5,802.0 6,192.2 6,517.3 6,960.3 7,327.3 7,680.5 5.8%
Worldwide Total Packaging and Test
Market 49,765.7 53,182.2 54,952.8 56,000.6 58,436.9 61,913.8 65,256.7 4.2%
Total Packaging and Test Market
Growth 3.5% 6.9% 3.3% 1.9% 4.4% 5.9% 5.4%
Worldwide Total Packaging Market 39,172.2 42,004.2 43,347.3 43,980.0 45,731.2 48,684.3 51,387.3 4.1%
Outsourced Packaging Market 50.0% 50.8% 50.9% 51.2% 52.0% 52.7% 53.0%
Worldwide Total Test Market 10,593.5 11,178.0 11,605.5 12,020.6 12,705.7 13,229.5 13,869.4 4.4%
Outsourced Test Market 51.7% 51.9% 53.4% 54.2% 54.8% 55.4% 55.4%
Ratio of Outsourced Market 50.4% 51.0% 51.4% 51.8% 52.6% 53.3% 53.5%
SATS Growth Rate 2.3% 8.2% 4.1% 2.8% 6.0% 7.2% 5.9%

21 CONFIDENTIAL AND PROPRIETARY I © 2015 Gartner, Inc. and/or its affiliates. All rights reserved. 21 CONFIDENTIAL AND PROPRIETARY I © 2015 Gartner, Inc. and/or its affiliates. All rights reserved.
2015 Capex, Top SATS Companies
21 Gartner: June 2015
2014 2015
Advanced Semiconductor Engineering 1,442.6 905.0
Amkor Technology 680.0 600.0
SPIL 642.0 468.0
STATS ChipPAC 534.7 365.0
Powertech Technology 330.0 254.0
King Yuan Electronics 140.0 140.0
Jiangsu Changjiang Electronic Technology (JCET) 105.0 121.3
ChipMOS Technologies (Bermuda) LTD. 112.9 120.0
J-Devices 45.2 104.5
UTAC 120.0 100.0
Other Companies 869.6 832.8
Total SATS Spending 5,022.0 4,010.6

22 CONFIDENTIAL AND PROPRIETARY I © 2015 Gartner, Inc. and/or its affiliates. All rights reserved. 22 CONFIDENTIAL AND PROPRIETARY I © 2015 Gartner, Inc. and/or its affiliates. All rights reserved.
2014
Rank
2013
Rank Company Region
2013
Revenue
2014
Revenue
2013 Market
Share (%)
2014 Market
Share
Change
2013-2014
1 1 ASE Taiwan 4,740 5,170 18.9% 19.1% 9.1%
2 2 Amkor Technology
United
States 2,956 3,129 11.8% 11.5% 5.9%
3 3 SPIL Taiwan 2,335 2,741 9.3% 10.1% 17.4%
4 4 STATS ChipPAC Singapore 1,599 1,586 6.4% 5.8% -0.8%
5 5 Powertech Technology Taiwan 1,267 1,321 5.1% 4.9% 4.3%
6 6 Jiangsu Changjiang Electronics Technology China 850 982 3.4% 3.6% 15.5%
7 7 J-Devices Japan 843 864 3.4% 3.2% 2.5%
8 8 UTAC Singapore 748 734 3.0% 2.7% -1.9%
9 9 ChipMOS Technologies Taiwan 649 696 2.6% 2.6% 7.3%
10 10 Chipbond Technology Taiwan 530 575 2.1% 2.1% 8.5%
11 11 STS Semiconductor South Korea 499 522 2.0% 1.9% 4.6%
12 13 Tianshui Huatian Microelectronics China 398 519 1.6% 1.9% 30.3%
13 12 King Yuan Electronics Taiwan 426 477 1.7% 1.8% 11.9%
14 18 Nantong Fujitsu Microelectronics China 287 343 1.1% 1.3% 19.4%
15 14 Carsem Semiconductor Malaysia 350 336 1.4% 1.2% -4.0%
16 17 Walton Advanced Engineering Taiwan 296 331 1.2% 1.2% 11.8%
17 15 Unisem Malaysia 315 319 1.3% 1.2% 1.3%
18 21 Orient Semiconductor Electronics Taiwan 228 317 0.9% 1.2% 38.6%
19 19 AOI Electronics Japan 282 306 1.1% 1.1% 8.6%
20 16 Formosa Advanced Technologies Taiwan 302 304 1.2% 1.1% 0.6%
Top 20 Total 19,901 21,572 79.3% 79.5% 8.4%
Other Companies 5,180 5,558 20.7% 20.5% 7.3%
Total Market 25,082 27,130 100.0% 100.0% 8.2%
2014 SATS Market Share (Top 20)
Gartner: June 2015
23 CONFIDENTIAL AND PROPRIETARY I © 2015 Gartner, Inc. and/or its affiliates. All rights reserved. 23 CONFIDENTIAL AND PROPRIETARY I © 2015 Gartner, Inc. and/or its affiliates. All rights reserved.
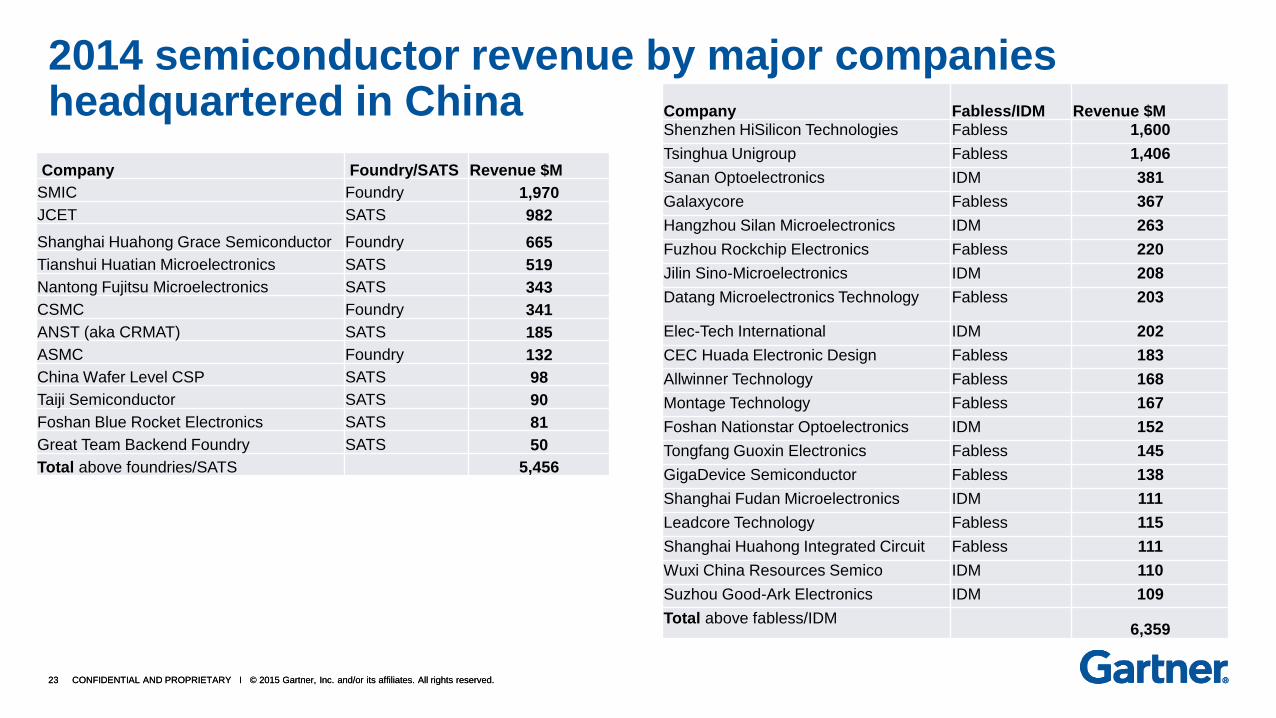
2014 semiconductor revenue by major companies headquartered in China
AP
CPU
Baseband
MEMS
IGBT Company Foundry/SATS Revenue $M
SMIC Foundry 1,970
JCET SATS 982
Shanghai Huahong Grace Semiconductor Foundry 665
Tianshui Huatian Microelectronics SATS 519
Nantong Fujitsu Microelectronics SATS 343
CSMC Foundry 341
ANST (aka CRMAT) SATS 185
ASMC Foundry 132
China Wafer Level CSP SATS 98
Taiji Semiconductor SATS 90
Foshan Blue Rocket Electronics SATS 81
Great Team Backend Foundry SATS 50
Total above foundries/SATS 5,456
Company Fabless/IDM Revenue $M Shenzhen HiSilicon Technologies Fabless 1,600
Tsinghua Unigroup Fabless 1,406
Sanan Optoelectronics IDM 381
Galaxycore Fabless 367
Hangzhou Silan Microelectronics IDM 263
Fuzhou Rockchip Electronics Fabless 220
Jilin Sino-Microelectronics IDM 208
Datang Microelectronics Technology Fabless 203
Elec-Tech International IDM 202
CEC Huada Electronic Design Fabless 183
Allwinner Technology Fabless 168
Montage Technology Fabless 167
Foshan Nationstar Optoelectronics IDM 152
Tongfang Guoxin Electronics Fabless 145
GigaDevice Semiconductor Fabless 138
Shanghai Fudan Microelectronics IDM 111
Leadcore Technology Fabless 115
Shanghai Huahong Integrated Circuit Fabless 111
Wuxi China Resources Semico IDM 110
Suzhou Good-Ark Electronics IDM 109
Total above fabless/IDM 6,359
24 CONFIDENTIAL AND PROPRIETARY I © 2015 Gartner, Inc. and/or its affiliates. All rights reserved. 24 CONFIDENTIAL AND PROPRIETARY I © 2015 Gartner, Inc. and/or its affiliates. All rights reserved.
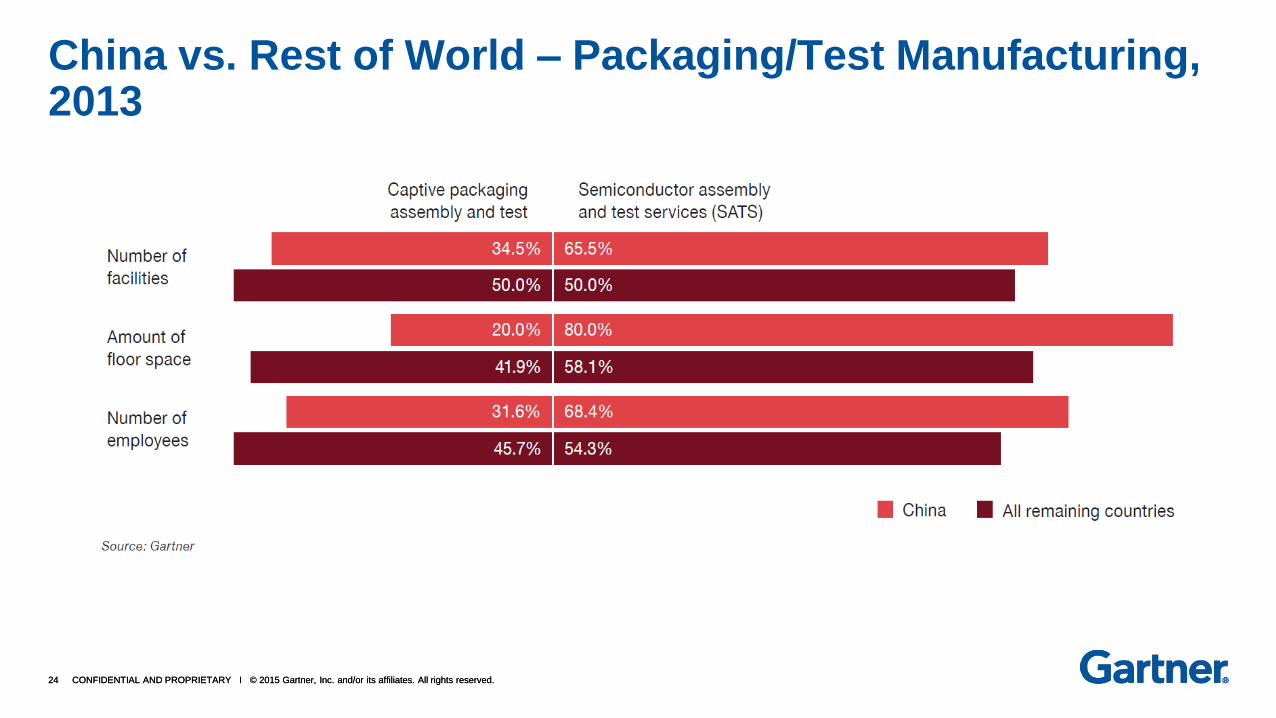
China vs. Rest of World – Packaging/Test Manufacturing, 2013

25 CONFIDENTIAL AND PROPRIETARY I © 2015 Gartner, Inc. and/or its affiliates. All rights reserved. 25 CONFIDENTIAL AND PROPRIETARY I © 2015 Gartner, Inc. and/or its affiliates. All rights reserved.
How new Chinese national policy supports homegrown semiconductors
Semiconductor
Industry Fund
01, 02 Project
Regional
subsidy Tax
reduction
Newly Established for capital operation
No.16, No 4 documents
Venture
companies
Chinese Public
companies
State-own
Organizations
Global Markets
Applications in
Domestic market
National relevant
vertical markets
Market oriented $100B investment
Government guide oriented
$20B
National fund for selected projects

26 CONFIDENTIAL AND PROPRIETARY I © 2015 Gartner, Inc. and/or its affiliates. All rights reserved. 26 CONFIDENTIAL AND PROPRIETARY I © 2015 Gartner, Inc. and/or its affiliates. All rights reserved.
China market represents 33% of the total purchasing TAM for semiconductor chip vendors
Source: Gartner (May 2015)
Purchasing TAM by Region, WW, 2014 (%)
27 CONFIDENTIAL AND PROPRIETARY I © 2015 Gartner, Inc. and/or its affiliates. All rights reserved. 27 CONFIDENTIAL AND PROPRIETARY I © 2015 Gartner, Inc. and/or its affiliates. All rights reserved.
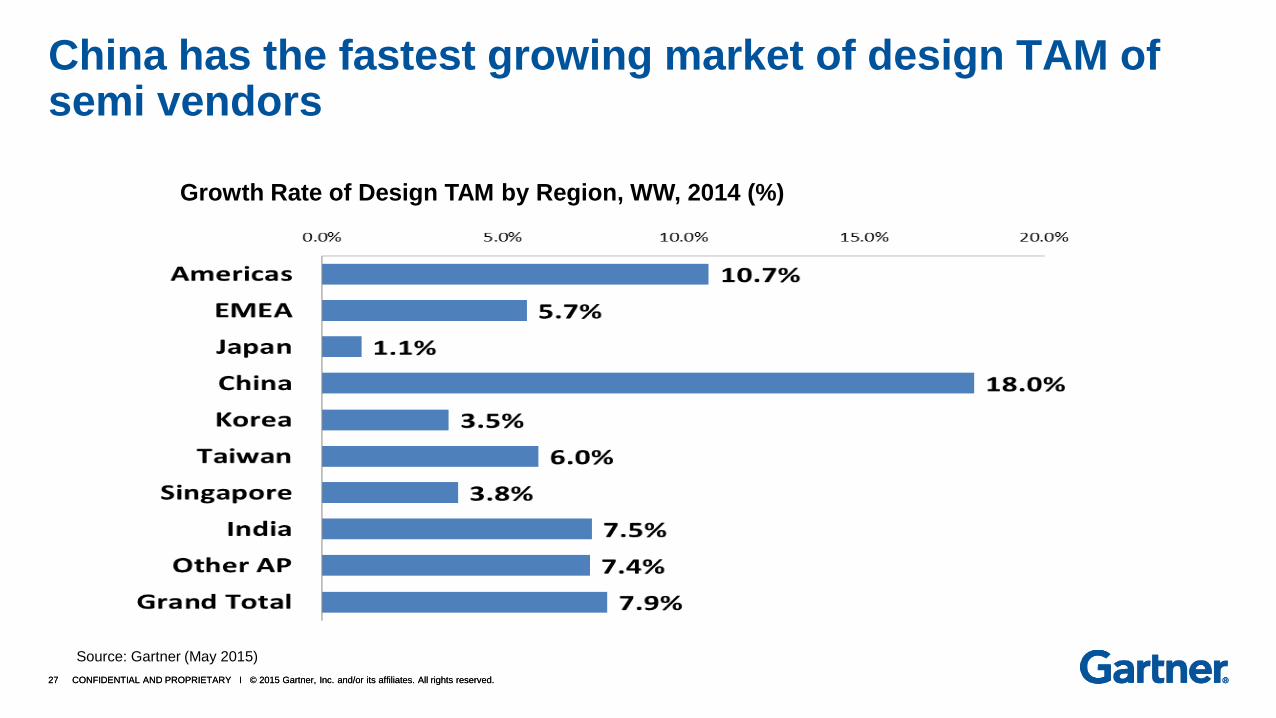
China has the fastest growing market of design TAM of semi vendors
Source: Gartner (May 2015)
Growth Rate of Design TAM by Region, WW, 2014 (%)

28 CONFIDENTIAL AND PROPRIETARY I © 2015 Gartner, Inc. and/or its affiliates. All rights reserved. 28 CONFIDENTIAL AND PROPRIETARY I © 2015 Gartner, Inc. and/or its affiliates. All rights reserved.
Top 10 SATS Competitive Analysis – 2015
ASE - Diversified IDM/Fabless customer base and factory locations, advanced Strong position in the SiP, flip-chip, wafer-bumping and test markets and emerging TSV market. Focus on top tier semi companies. EMS division becoming a growing advantage, especially for SiP and supply chain management.
Amkor - Diversification and scale of manufacturing sites. IDM strength. Technical expertise for package/die stacking, copper pillar, and lead-frame packaging. Leadless-lead-frame (QFN, SON, DFN and MLF) market pioneer. TSV leader. Strong marketing/sales. New Korea factory.
SPIL – Fabless customer base strength; provides flip-chip packaging solutions for graphics and computer chipset markets. Recognized as executing effectively. Reputation of excellent support to design companies and foundries. Very strong financially – no debt.
JCET/STATSChipPAC - Technology and patent innovator. Largest China-based SATS. Provides excellent packaging and test solutions for WLP, 3D and SiP technologies. RDL services, wafer bumping and WLP, integrated passive devices and TSV into complex package designs. STATSChipPAC weak sales and finances. Large customer concern over I.P. protection due to China takeover.
28

29 CONFIDENTIAL AND PROPRIETARY I © 2015 Gartner, Inc. and/or its affiliates. All rights reserved. 29 CONFIDENTIAL AND PROPRIETARY I © 2015 Gartner, Inc. and/or its affiliates. All rights reserved.
Top 10 SATS Competitive Analysis – 2015
PTI - Leading-edge and largest memory packaging/test provider; DRAM and NAND flash memory customers. Competitive advantage in wafer-level burn-in and thin-wafer handling. Copper pillar bump, RDL and WLCSP, 3D and TSV technologies. Acquisition of Greatek reducing dependence on memory market to become more broad-based supplier
UTAC - Broad package portfolio. Leading supplier of leadless-lead-frame packages (SON, DFN and QFN). Expertise in RF, mixed signal and memory testing. Weak sales and financials.
ChipMOS – Niche market focus. LCD driver packaging market leader. Excellent expertise in wafer bumping, tape carrier packaging (TCP), chip-on-film (COF) and chip-on-glass (COG). Packaging and test for LP-DRAM, flash memory, and mixed-signal products for mobile applications. Wall Street darling.
J-Devices – Japanese IDM factory consolidator with Toshiba, Fujitsu, Renesas, Sony. Mostly Japanese customers. Automotive and industrial focus. Amkor now majority owner of JV. Will become part of Amkor in 2016.
Chipbond Technology - Solder bumping, copper bumping, gold bumping and RDL. Tape carrier packaging (TCP), COF and COG packaging for LCD display drivers. Growing RDL and WLP market. Fabless companies main customers.
29

30 CONFIDENTIAL AND PROPRIETARY I © 2015 Gartner, Inc. and/or its affiliates. All rights reserved. 30 CONFIDENTIAL AND PROPRIETARY I © 2015 Gartner, Inc. and/or its affiliates. All rights reserved.
2014 Rank 2013 Rank Company Region
2013
Revenue
2014
Revenue
2013 Market
Share (%)
2014 Market
Share
Change
2013-2014 Market Focus
11 11 STS Semiconductor South Korea 499 522 2.00% 1.90% 4.60% Memory
12 13
Tianshui Huatian
Microelectronics China 398 519 1.60% 1.90% 30.30%
SOT, SOIC, QFP
13 12 King Yuan Electronics Taiwan 426 477 1.70% 1.80% 11.90% Test
14 18
Nantong Fujitsu
Microelectronics China 287 343 1.10% 1.30% 19.40% BGA, CSP
15 14 Carsem Semiconductor Malaysia 350 336 1.40% 1.20% -4.00% QFN, Analog
16 17
Walton Advanced
Engineering Taiwan 296 331 1.20% 1.20% 11.80% Memory
17 15 Unisem Malaysia 315 319 1.30% 1.20% 1.30% QFN, Analog
18 21
Orient Semiconductor
Electronics Taiwan 228 317 0.90% 1.20% 38.60%
Memory Cards,
SiP modules
19 19 AOI Electronics Japan 282 306 1.10% 1.10% 8.60% Japanese OEM's
20 16
Formosa Advanced
Technologies Taiwan 302 304 1.20% 1.10% 0.60% Memory
Second 10 Total 3,384 3,773 13.50% 13.90% 11.50%
Total Market 25,082 27,130 100.00% 100.00% 8.20%
Note: Numbers may not add to totals shown because
of rounding.
Source: Gartner (April 2015)
Second Tier SATS – Revenue (Millions of USD)

31 CONFIDENTIAL AND PROPRIETARY I © 2015 Gartner, Inc. and/or its affiliates. All rights reserved. 31 CONFIDENTIAL AND PROPRIETARY I © 2015 Gartner, Inc. and/or its affiliates. All rights reserved.
SATS/OSAT - Taiwan vs. China Growing the Market via Consolidation
Complimentary Product/Packages/Customers
Non-memory + memory; memory + memory
– OSE + PTI ( or Walton, Nantong Fujitsu)
– Consolidation of Korean memory SATS (Signetics/STS/Hana Micron/AT Semicon/LB Semicon)
– Tianshui Huatian + ??
Packaging + Test
– KYEC + SPIL (SPIL owns part already)
– Ardentec + Sigurd
Top 10 Merger
– ASE + SPIL
– UTAC + (PTI or Korean company)
– Amkor + J-Devices (2016)
– Amkor + PTI
– ChipBond or ChipMOS + ??
31

32 CONFIDENTIAL AND PROPRIETARY I © 2015 Gartner, Inc. and/or its affiliates. All rights reserved. 32 CONFIDENTIAL AND PROPRIETARY I © 2015 Gartner, Inc. and/or its affiliates. All rights reserved.
Recommendations
SATS vendors must establish partnerships/joint ventures or merge with foundries, electronics manufacturing service/original design manufacturing (EMS/ODM) companies and/or materials and equipment suppliers as system level integration evolves for the IoT.
Chip-to-package and package-to-board manufacturing technologies continue to converge and overlap. Establish closer customer partnerships to reduce competition for value-added services.
Successful SATS vendors will strengthen design and test engineering staffs to ensure a steady stream of new package and test offerings. Adjust company R&D budgets accordingly.
Develop China SATS partner or JV. Just having a factory there will not be enough.
Second and third tier SATS companies must decide to merge, consolidate, or pursue specialty, alternative manufacturing markets that require less capital in order to survive in the longer term
32
33 CONFIDENTIAL AND PROPRIETARY I © 2015 Gartner, Inc. and/or its affiliates. All rights reserved. 33 CONFIDENTIAL AND PROPRIETARY I © 2015 Gartner, Inc. and/or its affiliates. All rights reserved.
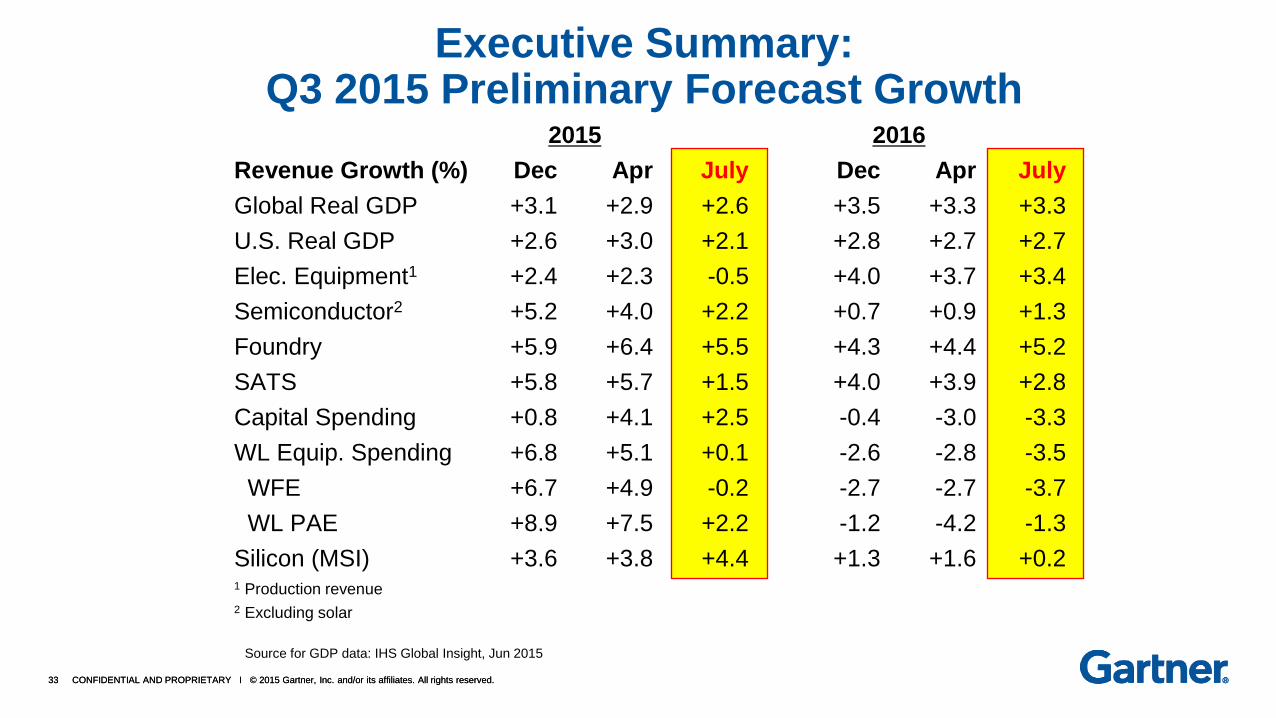
Executive Summary: Q3 2015 Preliminary Forecast Growth
2015 2016
Revenue Growth (%) Dec Apr July Dec Apr July
Global Real GDP +3.1 +2.9 +2.6 +3.5 +3.3 +3.3
U.S. Real GDP +2.6 +3.0 +2.1 +2.8 +2.7 +2.7
Elec. Equipment1 +2.4 +2.3 -0.5 +4.0 +3.7 +3.4
Semiconductor2 +5.2 +4.0 +2.2 +0.7 +0.9 +1.3
Foundry +5.9 +6.4 +5.5 +4.3 +4.4 +5.2
SATS +5.8 +5.7 +1.5 +4.0 +3.9 +2.8
Capital Spending +0.8 +4.1 +2.5 -0.4 -3.0 -3.3
WL Equip. Spending +6.8 +5.1 +0.1 -2.6 -2.8 -3.5
WFE +6.7 +4.9 -0.2 -2.7 -2.7 -3.7
WL PAE +8.9 +7.5 +2.2 -1.2 -4.2 -1.3
Silicon (MSI) +3.6 +3.8 +4.4 +1.3 +1.6 +0.2 1 Production revenue
2 Excluding solar
Source for GDP data: IHS Global Insight, Jun 2015