semi-rigid connections - digital scholarship | lehigh...
TRANSCRIPT

, .• SEMI-RIGID CONNECTIONS
Analysis and Design
FRITZ ENGINEERING L:ABORAroRV UBRARY
by Norzan Mohd. Yusof
A Thesis presented to the Graduate Committee
of Lehigh University in candidacy for the Degree of
Master of Science
m
Civil Engineering
Lehigh University
1986
ACKNOWLEDGMENTS
The research reported in this manuscript was carried out at Fritz
Engineering Laboratory, Lehigh University, Bethlehem, Pennsylvania. Dr. Irwin
J. Kugelman is the Chairman of the Department of Civil Engineering. The
author is indebted to Lehigh University Computing Center for extending all the
resources necessary to complete this work. The author wishes to express sincere
thanks to those who have an impact on the thesis development particularly Dr.
George C. Driscoll who introduces STRUCTR program and provided many
hours of discussion in understanding the problem and Dr. Lynn S. Beedle for his
encouragement and support throughout my graduate studies at Lehigh
University. Thank you is also due to all the faculty members and graduate
students at the Department of Civil Engineering for all the helps that they
rendered m one way or another. The author is also indebted to the
Government of Malaysia for the financial support. throughout the author's
graduate studies. The author is indebted to both of his parents for the support
and guidance throughout some difficult times. Finally, the author would like to
express sincere thanks to his wife, Zaharah for typing the manuscript and giving
the author complete freedom to concentrate on this work and to his son,
Nadzari Yusof for his patience.
Jll
Table of Contents
ABSTRACT 1. INTRODUCTION 2. THEORETICAL ANALYSIS
2.1 STRUCTURE AND MODEL
3. STRUCTR INPUT
4. TEST RESULTS 4.1 NON-DIMENSIONALIZING 4.2 RESULTS 4.3 VERIFICATION OF RESULTS
5. DISCUSSION 6. CONCLUSIONS NOMENCLATURE
REFERENCES
VITA
I vi
1
2
4
6
8
10
10 11 14
15
20
52
53
55
Figure 6-1: Figure 6-2:
Figure 6-3: Figure 6-4: Figure 6-5: Figure 6-6: Figure 6-7: Figure 6-8: Figure 6-9: Figure 6-10: Figure 6-11: Figure 6-12: Figure 6-13: Figure 6-14: Figure 6-15: Figure 6-16: Figure 6-17: Figure 6-18: Figure 6-19: Figure 6-20: Figure 6-21: Figure 6-22: Figure 6-23: Figure 6-24: Figure 6-25: Figure 6-26: Figure 6-27:
List of Figures
TYPES OF SEMI-RIGID CONNECTION MOMENT-ROTATION CURVE-SEMI-RIGID CONNECTION TEST ASSEMBLAGES TEST MODEL NODE AND MEMBER NUMBERING PLASTIC MECHANISM METHOD TEST 2 MOMENT-ROTATION CURVE TEST 2 LOAD-ROTATION CURVE TEST 2 LOAD-DEFLECTION CURVE
TEST 5 MOMENT-ROTATION CURVE TEST 5 LOAD-ROTATION CURVE TEST 5 LOAD-DEFLECTION CURVE TEST 9 MOMENT-ROTATION CURVE TEST 9 LOAD-ROTATION CURVE TEST 9 LOAD-DEFLECTION CURVE TEST 10 MOMENT-ROTATION CURVE TEST 10 LOAD-ROTATION CURVE TEST 10 LOAD-DEFLECTION CURVE TEST 16 MOMENT-ROTATION CURVE TEST 16 LOAD-ROTATION CURVE TEST 16 LOAD-DEFLECTION CURVE TEST 20 MOMENT-ROTATION CURVE TEST 20 LOAD-ROTATION CURVE TEST 20 LOAD-DEFLECTION CURVE TEST 22 MOMENT-ROTATION CURVE TEST 22 LOAD-ROTATION CURVE TEST 22 LOAD-DEFLECTION CURVE
!vii
25 26
27 28 29 30 31 32 33 34 35 36 37 38 39 40 41 42 43 44 45 46 47 48 49 50 51

List of Tables
Table 6-1: COLLAPSE AND TEST ROTATION 22 Table 6-2: COLLAPSE LOAD WITH ORIGINAL RIGID MEMBER 23
STIFFNESS Table 6-3: COLLAPSE LOAD WITH REVISED RIGID MEMBER 24
STIFFNESS
I viii

ABSTRACT
Semi-rigid connections are used in continous frame construction, primarily
for lateral load resistance in office or apartment buildings of moderate height.
The concept of semi-rigid connections is to achieve economy in design without
sacrificing the safety of the structure in question. At the same time the actual
behaviour of the structure, particularly at the joint, can be accurately predicted.
A theoretical analysis of the behavior of a top and seat angle connection is
carried out by varying the angle size, beam size and column size. Altogether
seven cases are analysed. Particular attention will be focussed on the partial
restraint afforded by the top and seat angle type of connections. This paper
will demonstrate a rigorous analysis of top and seat angle connections usmg
STRUCTR, an application program. The results obtained are compared to an
experimental results carried out in 1940's thus verifying the validity of this
analysis. Results show that this method underestimate the maximum moment
and max1mum load obtained through experimental results but is in close
agreement with the plastic mechanism method.
1

Chapter 1
INTRODUCTION
The design of steel frames in multi-story and industrial steel buildings IS
usually based on the following assumptions:
1. In beam design the beam-to-column connections are assumed to be simply supported or pin connected.
2. In most column design, moments introduced due to frame action are often neglected.
3. For calculating lateral or wind loads, the beam-to-column connections are usually designed as rigid.
Although this approach saves calculation time and results m a safe
structure, it overlooks the economic aspect, had the structure been designed m
accordance to the way it actually behaves. That IS, support conditions usually
lie in between simple and rigid(fixed) support. Thus the connection is m
actuality a semi-rigid connection. Various types of semi-rigid connection are as
shown. ( See Figure 6-1 ) .
In the past, several researches had been carried out in order to determine
the savmgs. It was found that savings in terms of weight of as much as 20%
can be achieved had the semi-rigid approach been used. But there remam the
question of carrymg out the design in a simplified manner. Several attempts had
been made to analyse this behaviour by vanous simplifications but designers
were reluctant to use it due to the cumbersome formula that has to be used.
Various research for determining an accurate and simple design had been carried
out as early as the 1940's in Great Britain and USA.(refer 1, 2) This paper will
2
also show one of the several ways of analyzing semi-rigid connections. The
experimental results which will be used for comparison are obtained from a
series of test on top-and-seat-angle connections carried out at Fritz Engineering
Laboratory. Building connections may be classified under three different
headings with respect to their moment-rotation characteristics. According to the
AISC specification, the categories are as follows:
• Type 1 - known as " Rigid Frames " (Continous Frames), assumes that the beam-to-column connections have sufficient rigidity to prevent any rotation between the intersecting members.
• Type 2 - known as " Simple Framing " (Unrestrained Free-Ended), assumes that the ends of the member, beams and girders are connected for shear only therefore allowing the member to rotate freely under gravity load.
• Type 3 - known as " Semi-Rigid Framing " (Partially Restrained), assumes that the connections of beams and girders possesses a dependable and known moment capacity intermediate m degree between the rigidity of type 1 and the flexibility of type 2.
3

Chapter 2 THEORETICAL ANALYSIS
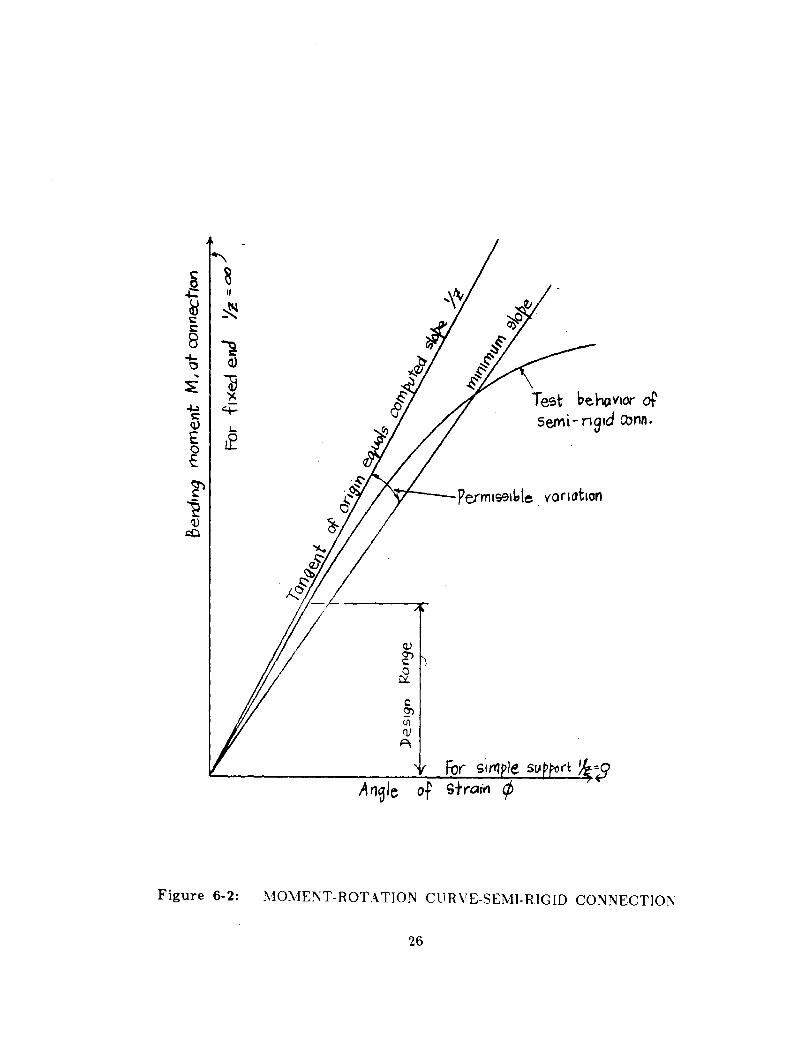
The semi-rigid connection may be thought of as a weakened section
between the end of the beam and the face of the column to which the
connection is made. The effect on analysis is the inverse of the effect produced
by end haunches or added cover plates. The typical test behaviour of a bolted
or welded connection is as shown in Figure 6-2, which shows the relationship
between moment transmitted through the connection and the angle change
between the joint center and the end of the beam. In the design range the
relationship is assumed to be linear and the inverse slope is termed the
connection factor Z, where;
Z = QjM
• where Q represents additional angle change due to yield
• and M represents end moment in the beam
The connection factor Z may be defined as -, angle change for unit
moment " and can be determined experimentally. Thus for a given connection,
Z needs to be determined before any analysis could proceed. Z is also that
property of a semi-rigid connection which when used in conjunction with E and
I of the connected member, becomes the necessary correction factor to make the
ordinary exact methods of analysis valid. It vanes inversely with the rigidity of
the semi-rigid connection, becoming zero for a rigid connection and infinite for a
pm connection. The slope of the moment rotation curve of Fig. 6-2 is therefore
4

the reciprocal(I/Z).
For the top-and-seat-angle connection, the elastic-plastic load deflection
behavior of the member i.e top and seat angles, beam, and column is analysed
using STRUCTR,a general purpose FORTRAN program for structural analysis
by the direct stiffness method. The plastic moment capacity, Mp, of the member
must be known at the potential locations of the plastic hinges. As the load
mcreases a plastic hinge, Mp, will form at the location of greatest moment, say
B. Mp IS m equilibrium on both sides of the hinge. Rotational degree of
freedom eb is removed from element AB by condensation. The reduced element
stiffness matrix now effectively having a row and column of zeroes corresponding
to eb are assembled into the structure. Therefore the rotation at B in the
element and structure are now independent.
Structural analysis in the presence of plastic hinges proceeds in a senes of
linear steps, the beginning of each step being marked by introduction of another
plastic hinge and the consequent reduction of structure stiffness. Collapse is
indicated by very large displacements or by the structure matrix not being
positive definite. The limiting load that would cause a collapse mechanism can
then be determined together with its corresponding deflections.
For this analysis to be carried out the following assumptions were made:-
1. There is no out-of-plane loading or displacement.
2. The depth of beam and column are modelled as a rigid members. Therefore the interior of the joint between the connections is assumed to be infinitely rigid.
5

3. The angles are simulated as beam elements.
4. Shear deflection is ignored. i.e. deflection is due to the bending effect only.
5. An elastic-perfectly plastic hinge is formed.
6. Moment-curvature is linear until the extreme fiber stress reaches the yield point, after which the moment remains at a value Mp as curvature increases indefinitely.
7. Prying action of the connection IS ignored.
8. The effect of axial force on the value of plastic moment capacity, Mp, is ignored.
2.1 STRUCTURE AND MODEL
The actual test set-up of the structure IS as shown in Fig 6-3. The test
assemblage consists of two beams stub riveted to a column stub and supported
in an inverted position. The supports supply shear and moment at the
connection approximately equivalent to the shear and moment at the end of a
building framed to each end of a column. Due to the symmetrical nature of the
structure and its loading condition, the structure is modelled as a line element
about its centerline of symmetry. Thus, along the centerline of the column
section any chosen node point is restrained against horizontal displacement and
rotation but free to move vertically. At the extreme end of the column the
support conditions are fixed. The column properties I.e Ixx,lyy and Zxx are
taken as halved thus the capacities of the column are also half what they
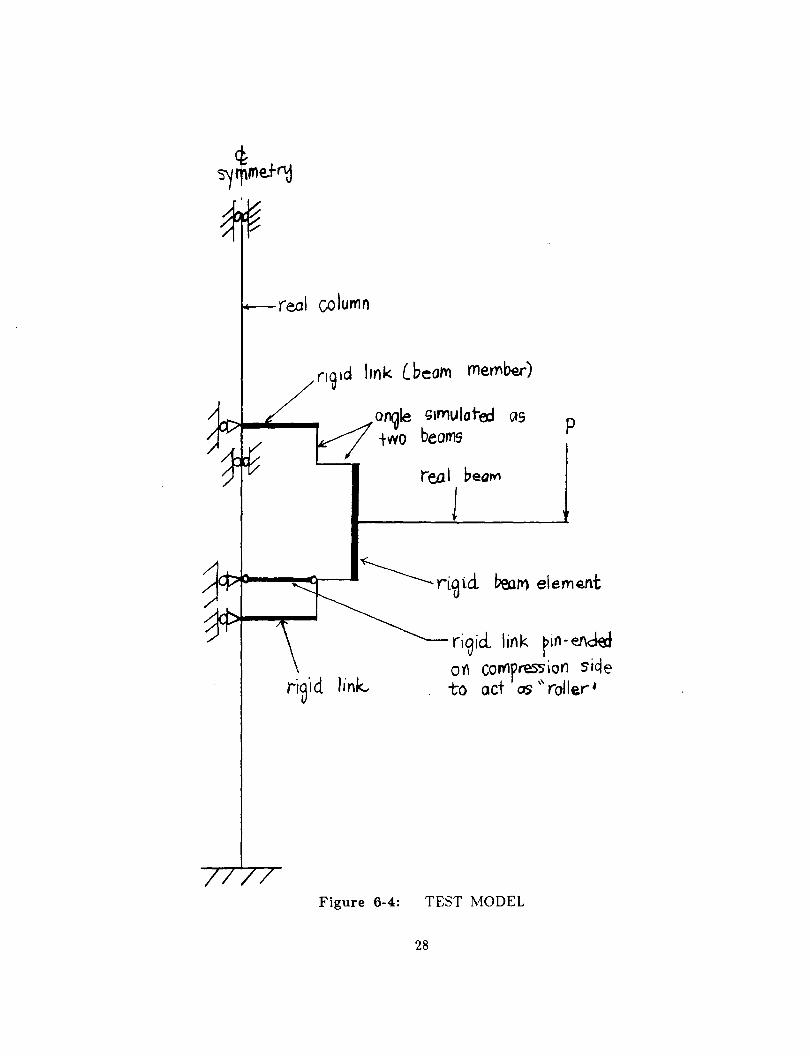
actually are. For the model of the structure refer to fig 6-4. The rigid member
is modelled by imposing a large modulus of elasticity, a large moment of
inertia, and a large area. Thus the rest of the structure is very flexible when
compared to the rigid members.
6

By defining the geometry of a structure, it is thus possible to analyze
structures with seat and top angle semi-rigid connections using an ordinary
structural analysis computer program with line-type bending members. The
analysis concentrates on the bending behaviour of the beam, column, and the
flexible angles used to make the connections.
Dummy rigid beams are used to space the bolt lines of the angles at the
proper distance from the centerlines of the connected beam and column.
Equilibrium of forces are thus invoked at the outer fibers of the beam and
column rather than at the centerline. Similarly, compatibility results according
to the plane-sections-remain-plane concept. The angles are modelled as a pa1r of
rectangular beams of width and thickness equal to those of the angle placed at
right angles to each other. The entire assemblage of columns, beams, and angles
is analyzed as a rigid frame.
An elastic analysis identifies the points of max1mum stress and therefore
plastic hinges may form. After changes in boundary conditions, additional steps
of elastic analysis can give increments in the elastic-plastic load-deflection curve
of the entire structure up to the point where a mechanism defining ultimate
load is defined.
7

Chapter 3
STRUCTR INPUT
For analysis purposes, a standard format of input 1s adopted and listed
under the following categories.
1. Overall Dimensions:- This includes the height of column center to center span of the beam and the beam centerline above the foundation.
2. Member Sizes:- These are the member types such as beam and column, their area, and moment of inertia with respect to both axes and torsional constant which are necessary for stiffness calculations. Plastic moment capacity, Mp , and yielding load, Py, are needed for the plastic capacity program SETUP.FOR. Column and beam depth are required for determining the coordinate locations of angles and dummy rigid members. For the angle leg section, the area, moment of inertia, plastic section modulus, plastic moment capacity, and yield load are calculated from the properties of a rectangle.
3. Inner fastener gage line for angles:- The effective part of the angle leg which resists bending lies between its heel and the first gage line of the fasteners. For this solution the angle is assumed to be flat and there is no bending moment from the inner gage line to the toe. Where the angle is non-uniform such as the top angle in Test 20, plastic moment capacity, Mp and yield load, Py are calculated using the effective area and moment of inertia at the inner gage line for the horizontal leg of the member. Similarly, the same principle applies for the vertical leg. Therefore two values of Mp and Py are inputted in the plastic capacity program SETUP.FOR.
4. Node coordinates:- The following defines the node coordinates:-
• Xc Xct,Xcb column top and bottom at the same horizontal location.
• Y ct = column top Y coordinate.
• Y cb = column bottom Y coordinate.
• Yb = Ybi=Ybj = Y-coordinates of beam centerline.( end)
• Xbj = X-coordinate of right end of beam.
8
and J

• Xav = X-coordinate of angle vertical leg.
• Y avt= Y -coordinate of bolt line in top angle vertical leg.
• Yaht= Y-coordinate of angle horizontal leg in top angle.
• Xbi = X-coordinate of bolt line in horizontal leg.
• Yahb= Y-coordinate of angle horizontal leg in bottom angle.
• Yavb= Y-coordinate of bolt line in bottom angle vertical leg.
In addition the following information is required:
• Db = depth of beam.
• De = depth of column.
• ta = thickness of angle legs.
• ga = gage distance in angle legs.
5. Boundary condition:- Altogether there are 14 nodal points and 15 members with three degrees of freedom at each joint, i.e, two translations and a rotation. Thus there are 42 equations to be solved. As previously mentioned on page 6, along the centerline of the column except at the support, the boundary condition imposed is known displacement in x-diredion, known rotation, and unknown displacement in y-direction. For the support, all displacements and rotations are known and for the rest of the joints, the displacement are unknown. Therefore there are 13 knowns and 29 unknowns. This boundary condition is applied throughout the test. Refer to Fig 6-5 for node and member numbering sequence. With each formation of a plastic hinge, the boundary condition of the particular member in question is changed and the next step of analysis is repeated. Altogether six steps of load-deformation analysis are carried out for each test.
9
Chapter 4
TEST RESULTS
4.1 NON-DIMENSIONALIZING
The results obtained from STRUCTR output were non-dimensionalized for
presentation purposes. This way will allow any unit to be used depending on
one's preference. To dimensionalize the moment, M, and load, P, are divided by
Mmax and Pmax of the test results. Therefore the graph will have an upper
limiting value of 1.0. The tabulated results can then be interpreted with ease.
Similarly the corresponding deflections from STRUCTR output are divided by
the elastic deflection due to the maximum test load, Pmax.
For a cantilever beam:-
Deflection ~max = PmaxL**3/3EI where,
• Pmax = Load applied
• L Span of beam
• E Modulus of Elasticity
• I = Second moment of Inertia
10

4.2 RESULTS
Below are the typical results obtained by usmg STRUCTR on the the
seven test cases. These results were then plotted as shown in Figure 6-7 to
Figure 6-27.
Test 2
Point Load Deflection Moment Rotation
1 0. 0. 0. 0. 2 0.1269 0.305 0.2713 0.000528 3 0.1618 0.542 0.3459 0.001150 4 0.1717 4.659 0.3672 0.013096 5 0.1834 52.703 0.3921 0.151180 6 0.4818 1.0300 4.423069
where load = P /Pmax , moment = M/Mmax and deflection =t:l./ t:l.max Pmax = 2155 N (46.6 kips) Mrnax = 876.6 Nm (62.2 kipft)
t:l.max = 2.64 mm (0.1041 in)
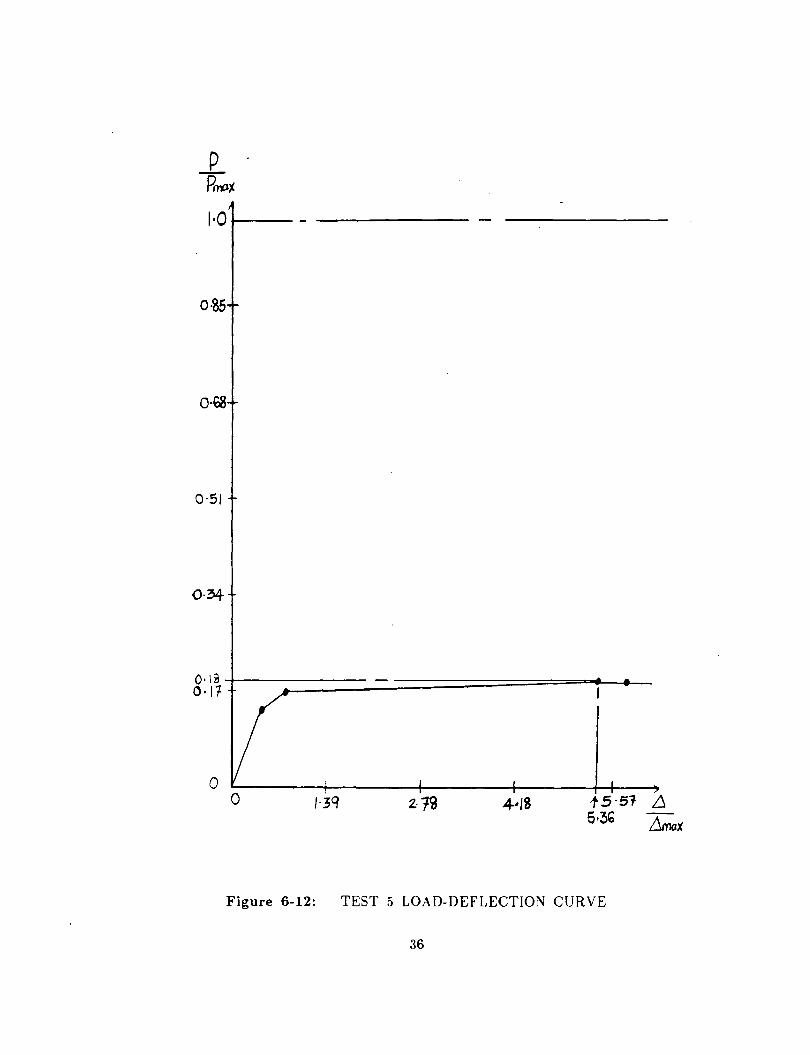
Test 5
Point Load Deflection Moment Rotation
1 0. 0. 0. 0. 2 0.1361 0.4464 0.2876 0.000507 3 0.1676 0.7681 0.3542 0.000991 4 0.1818 5.3550 0.3841 0.008560 5 0.1835 5.7650 0.3877 0.009234 6 0.1849 6.7180 0.3907 0.010840
where load = P /Pmax , moment = M/Mmax and deflection =t:l./ t:l.max Pmax = 2728 N (59 kips) Mmax = 1385.6 N (98.3 kipft)
t:l.max = 1.825 mm (0.072 in)
11

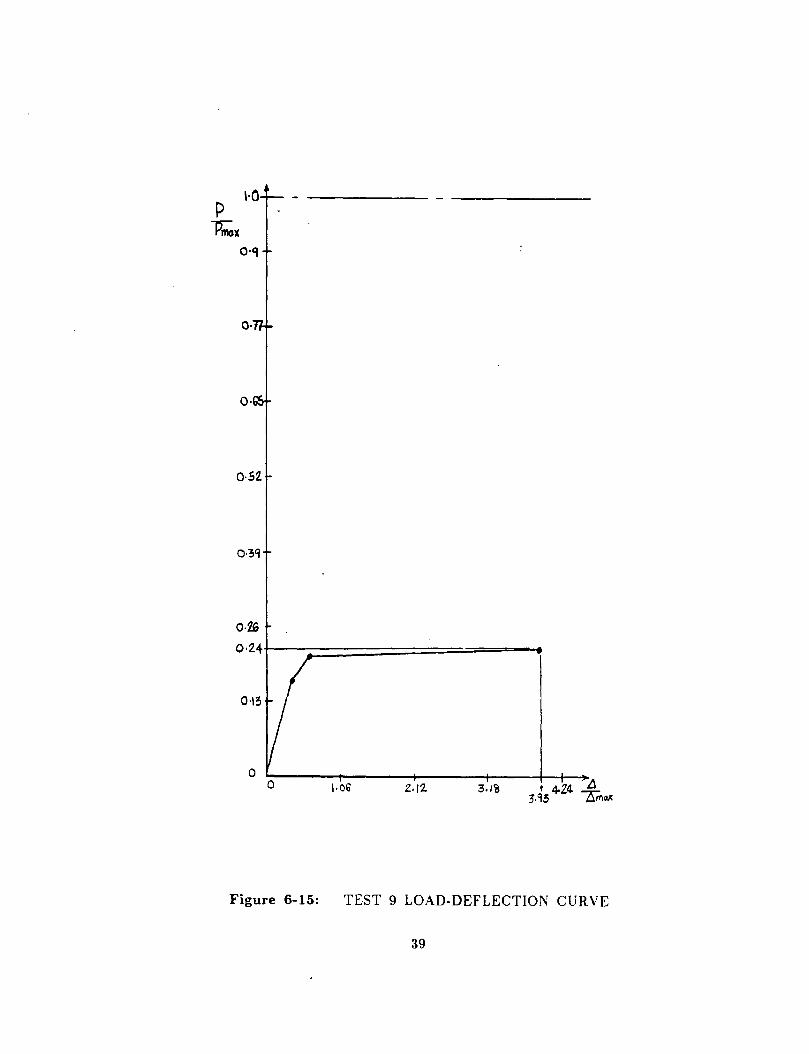
Test 9
Point Load Deflection Moment Rotation ------------------------------------------------------------------------------------------
1 0. 0. 0. 0. 2 0.1631 0.3567 0.3446 0.000406 3 0.206 0.6034 0.4351 0.000854 4 0.2196 3.9340 0.4638 0.008054 5 1.02 4.9672 0.3895 0.010970 6 1.095 5.0880 0.3822 0.011250
where load = P /Pmax , moment = M/Mmax and deflection =b./ b.max Pmax = 3583 N (77.5 kips) Mmax = 1820.4 N {129.2 kipft)
b.max = 2.397 mm (0.0944 in)
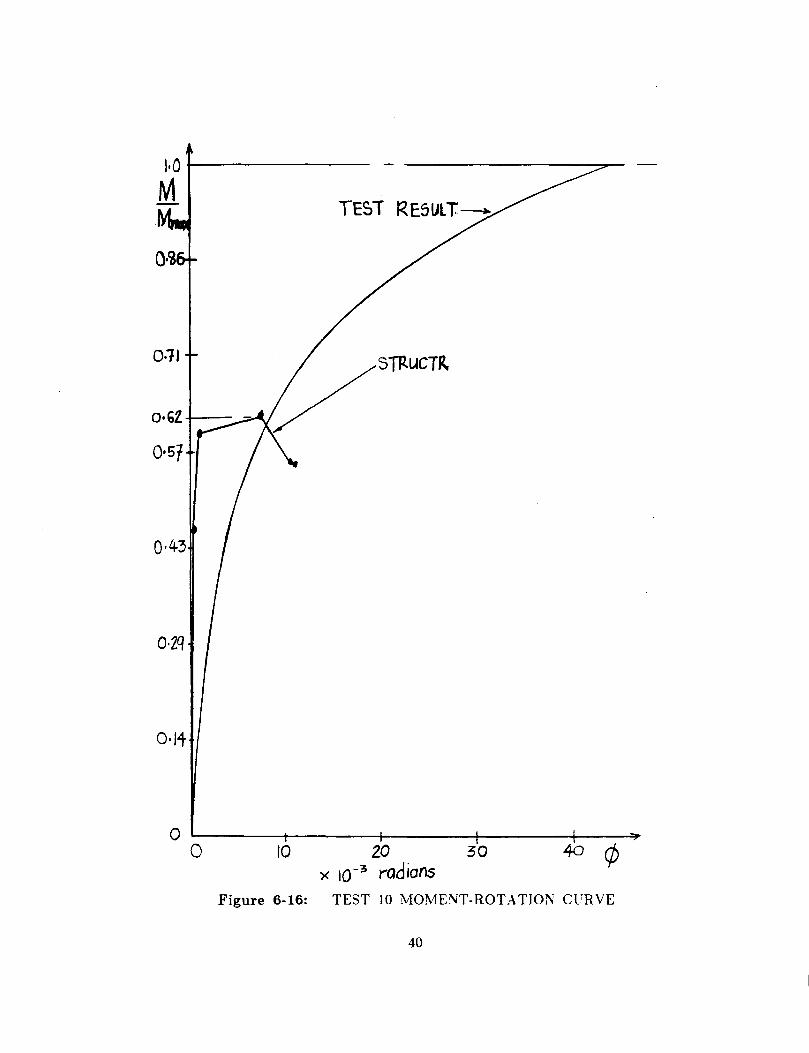
Test 10
Point Load Deflection Moment Rotation
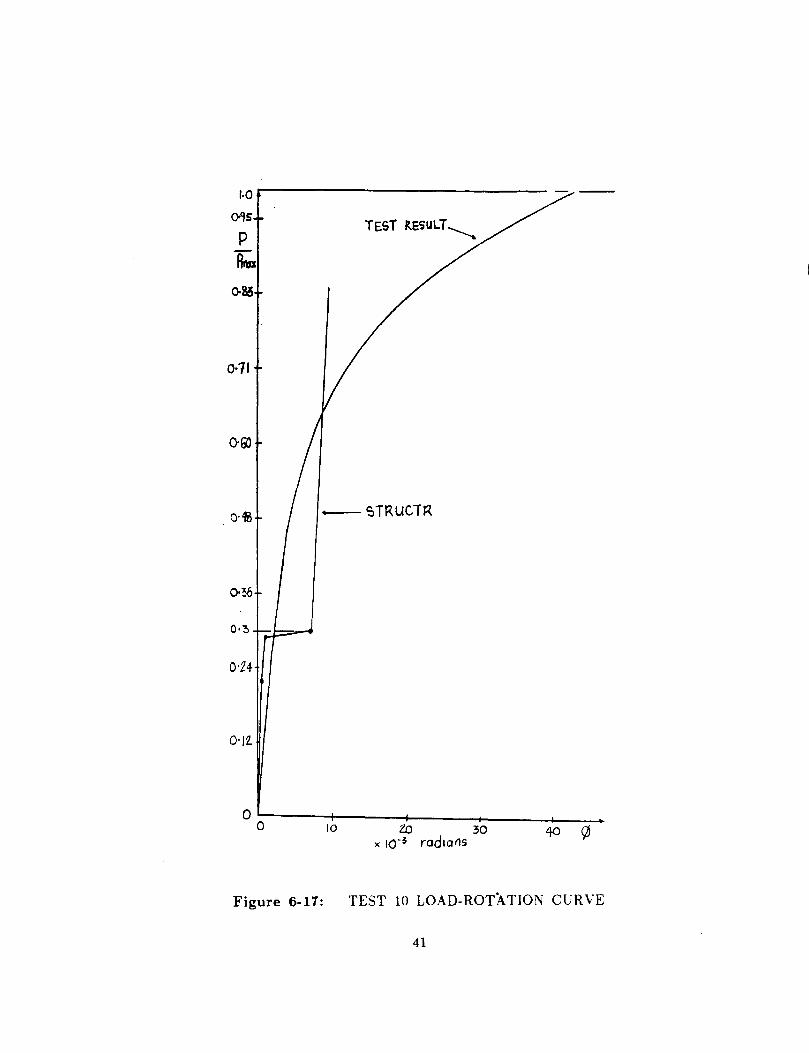
1 0.0 0.0 0.0 0.0 2 0.2189 0.3753 0.4625 0.000341 3 0.2830 0.6184 0.5979 0.000766 4 0.2955 3.4552 0.6243 0.007404 5 1.069 4.4415 0.5531 0.010457 6 1.104 4.4914 0.5498 0.010594
where load = P /Pmax , moment = M/Mmax and deflection =b./ b.max Pmax = 3884 N (84.0 kips) Mmax = 1973.2 Nm (140 kipft)
b.max = 2.598 mm (0.1023 in )
Test 16
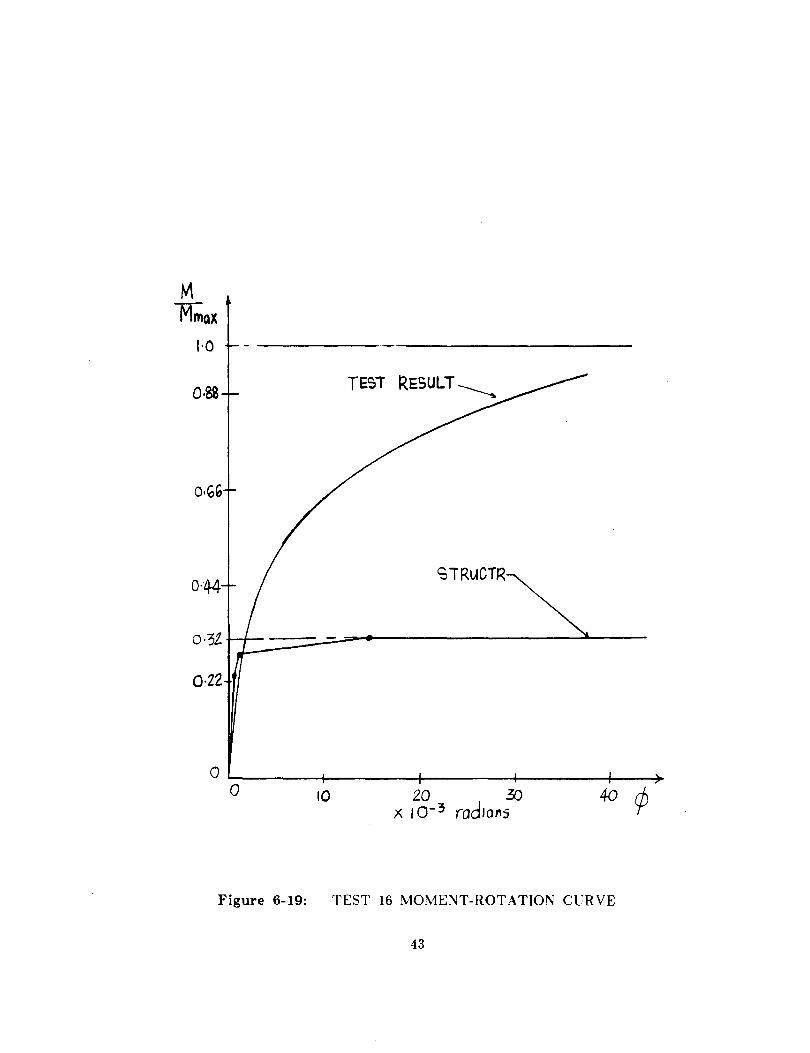
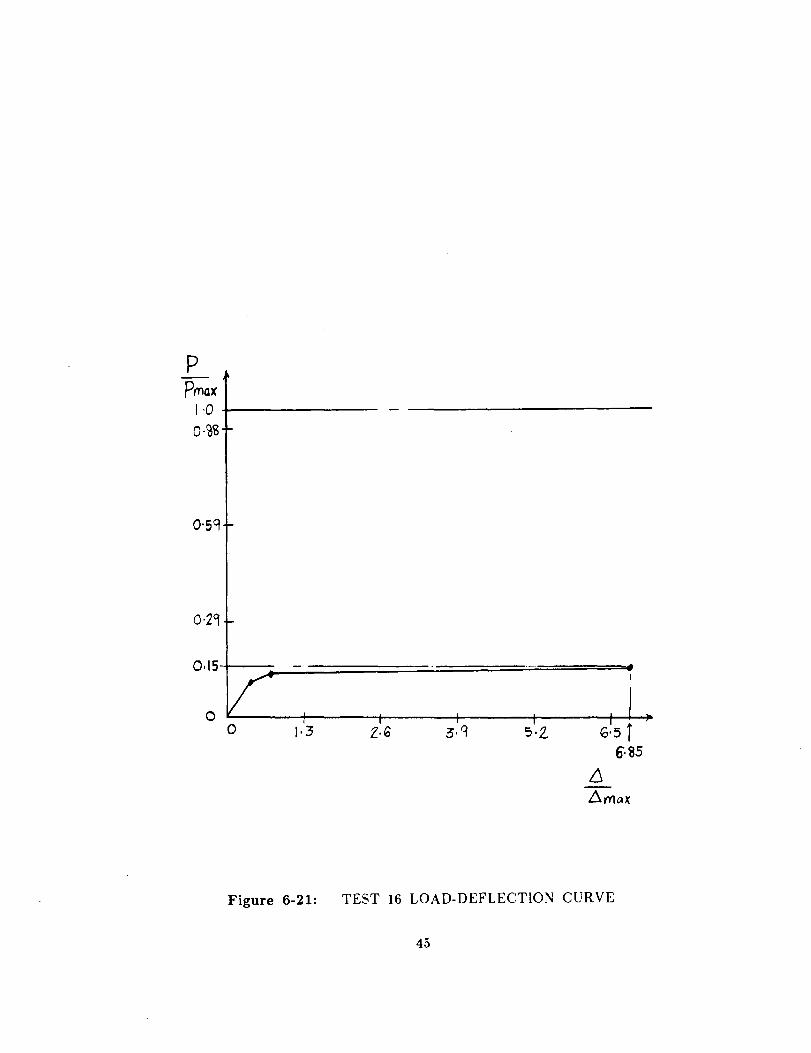
Point Load Deflection Moment Rotation
1 0.0 0.0 0.0 0.0 2 0.1098 0.4058 0.2351 0.000659 3 0.1370 0.7356 0.2933 0.00134 4 0.1501 6.8463 0.3212 0.014491 5 0. 7936 1.697 13.2084 6 0.8178 1.749 14.0
where load = P /Pmax , moment = M/Mmax and deflection =b./ b.max Pmax = 1572 N (34.0 kips) Mmax = 638.9 Nm (45.33 kipft)
b.max = 1.955mm (0.07697 in)
12

Test 20
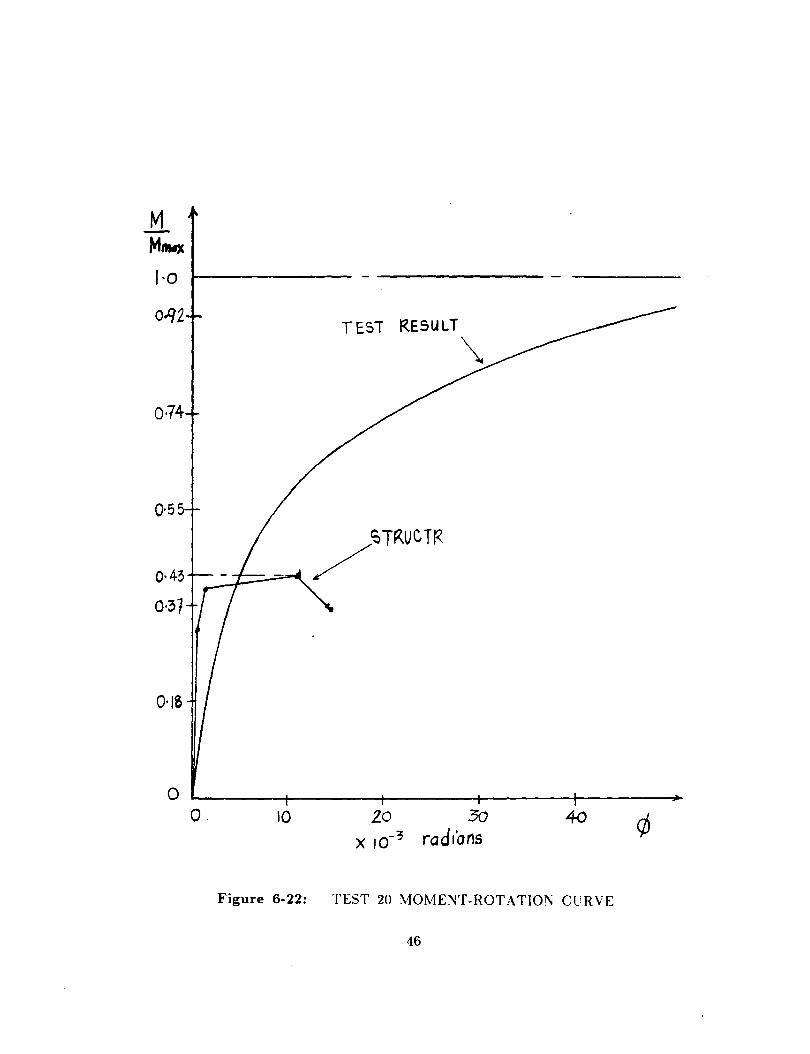
Point Load Deflection Moment Rotation
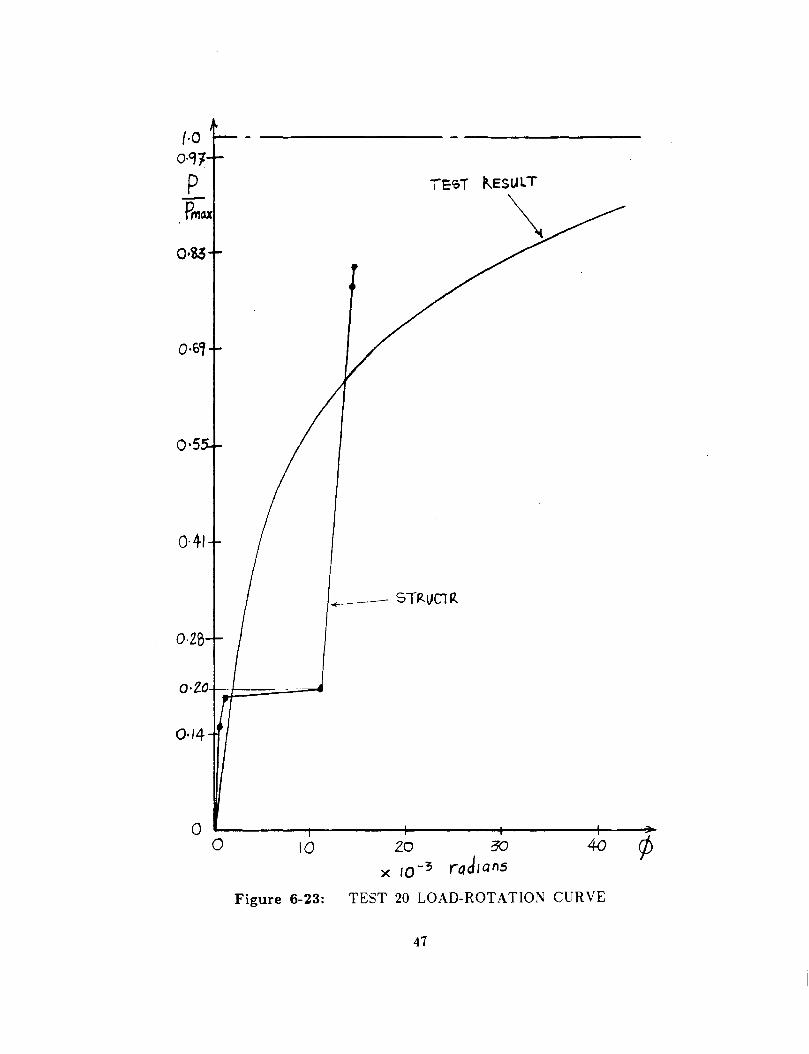
1 0.0 0.0 0.0 0.0 2 0.1516 0.3078 0.3223 0.00054 3 0.1929 0.5216 0.4099 0.00116 4 0.2012 3.3942 0.4275 0.01106 5 0.7839 4.1701 0.3643 0.01451 6 0.8194 4.2214 0.3604 0.01472
where load = P /Pmax , moment = M/Mmax and deflection =b./ b..max Pmax = 3352 N (72.5 kip) Mmax = 1532.7 Nm (108.75 kipft)
b..max = 3.484 mm (0.1372 in)
Test 22
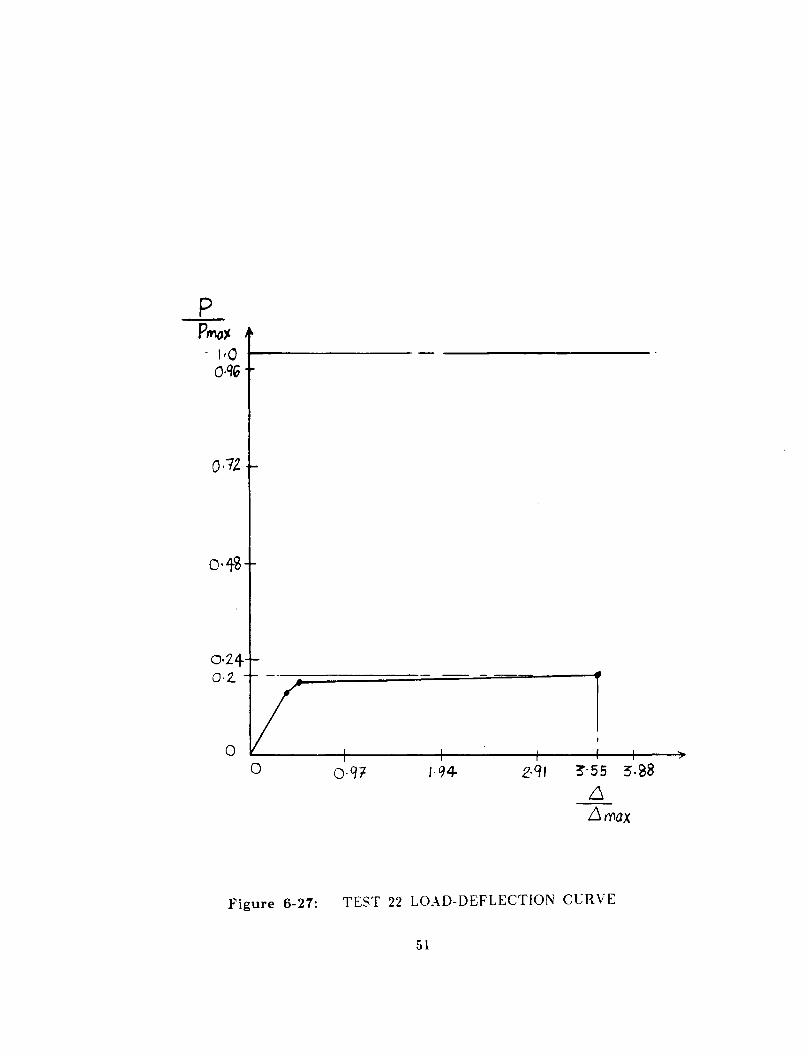
Point Load Deflection Moment Rotation
1 0.0 0.0 0.0 0.0 2 0.1522 0.3331 0.3235 0.000459 3 0.1775 0.4766 0.3771 0.000774 4 0.2042 3.5499 0.434 0.008705 5 0.5153 62.7 1.095 0.1596 6 0.7577 108.97 1.6] 0.2774
where load = P /Pmax , moment = M/Mmax and deflection =b./ b..max Pmax = 3838 N (83.0 kips) Mmax = 1754.7 Nm (124.5 kipft)
b..max = 2.618 mm (0.1031 in )
13

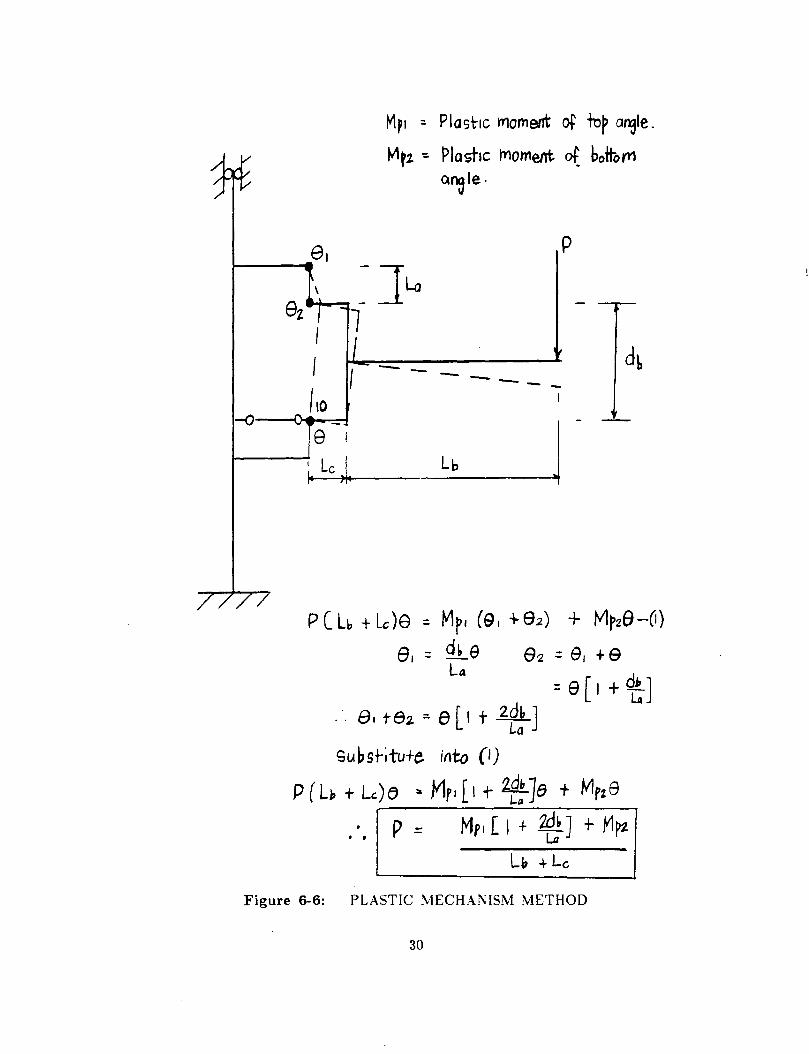
4.3 VERIFICATION OF RESULTS
The limiting load P obtained while usmg STRUCTR is checked by
comparmg it with the collapse load obtained from the plastic mechanism
concept. In this method, a plastic hinge is assumed to form at nodes 3,5 and 10
since this is the most likely location for the hinge to form. When the structure
is loaded until a m-echanism occurs, a rigid body motion takes place. The rigid
body will rotate about a common point which is node 5. This is the
instantaneous center for the rigid body motion. Refering to figure 6-6 and
taking equilibrium about node 10 and applying principle of virtual work the
collapse load P can be found by using the following equation:-
P = { Mp1[ 1 + 2Db/La] + Mp2 }/{ Lb + Lc } where
• Mp1
• Mp2
plastic moment capacity of top angle
plastic moment capacity of seat angle
• Db = overall depth of beam (including the shims if any)
• La = length of top angle vertical leg (node 3 to node 5)
• Lb = length of beam (node 7 to node 8)
• Lc = length of seat angle horizontal leg (node 10 to node 11)
The collapse load obtained via this method IS compared to the one
obtained using STRUCTR.
14
Chapter 5
DISCUSSION
The results of the analysis is plotted as moment-rotation, load-rotation and
load-deflection graphs.(refer to fig 6-7 to 6-27) From the results tabulated it is
observed that the limiting load, P ,increases with increase in angle member sizes.
By companng results of test 2 with test 16 it is observed that test 2 has
a larger limiting load, P, value of 57% greater than test 16. This was achieved
because of a larger thickness of the top angle by 3.175 mm.(O.l25 in). In test
2 the limiting load, P, pnor to collapse is 17% of the maximum load obtained
experimentally. But for the limiting moment, 37% of the maximum moment is
achieved prior to collapse, which is approximately twice the limiting load value.
This due to the fact that the limiting load, P, is actually the shear force acting
at the support. In reality the load applied to the structure is always double the
limiting load, P. For the first two hinges the load, moment, deflection and
rotation lie within the test result domain but once the third hinge is formed a
large deformation takes place. At collapse the deformation is 4.6 times the
maximum deflection due to maximum test load. The maximum rotation is
0.0311 radian. For the test result, at limiting load, P the rotation is 0.0031
radian. Thus by comparing these results it can be said that the contained
plastic flow region is approximately ten times the elastic region.
The degree of variation of contained plastic flow is as shown in Table 6-1
for all the tests conducted. For all the tests carried out plastic hinges formed 'at
nodes 3,5 and 10 prior to collapse. Beyond the collapse mechanism, plastic hinge
15

were formed at node 11 to node 6(test 2,16), node 11 to node 8(test 9,10,20),
node 11 to node 7 (test 22) and node 11 to node 10(test 5). For tests 9,10
and 20 the moment-rotation curve shows an instability condition after collapse
occurs. These may be due to the formation of hinges at node 8. For tests 2,16
and 5 it is observed that deflection and rotation increases without further
increase in load once the collapse mechanism is achieved. This is as expected.
For test 22 the deflection and rotation increases with mcrease m load and
moment even after collapse. This indicates a similarity to a strain-hardening
effect. Test 10 produces the maximum M/Mmax ratio of 0.62 which coincides
with the largest angle member used.
An interesting observation IS that none of the analytical test results
reached the maximum load and moment obtained through the experiment. As
mentioned above the maximum it ever reached was 62% of the maximum
moment achieved via the experiment. This could be due to the following :-
1) In our analysis, the strain-hardening effect is neglected. This results in
the lowering of the limiting load and moment as compared to the experimental
result. Furthermore, after the formation of the first plastic hinge, the modulus
of elasticity of the particular member starts to vary. Ideally the effect of these
variations should be taken into account before the next step of analysis is
carried out. Also an abrupt change in cross-section of the member such as the
angle and rigid member makes the analysis more complicated.
2) The angle member should be analysed as a short beam. The largest
16
slenderness ratio of the angle member is 1/12(test 2) and the smallest 1s
1/6.9(test 9,10). Therefore, shear deflection can be a significant contribution to
the load-deformation characteristic of the connection. According to Timoshenko's
theory of short beams, the shear deflection contribution can be as high as 10%
of the total deflection of the beam.
Another interesting problem anses when modelling the rigid members.
During the initial stage of the analysis the rigid member is assumed to have a
very large moment of inertia, I, and cross-sectional area, A. The E value is
assumed to be 1000 times the normal E value of steel. Results of the analysis
are as shown in Table 2. As can be seen from Table 6-2 the error computed
with respect to plastic mechanism concept is very large. For test 10 the error is
201.8%. Only test 5 and 22 seems to provide reasonable accuracy. On checking
it was found that equilibrium is never achieved from the first load-step of the
analysis. If this is not corrected, further load-step will propogates larger
equilibrium error as was found out in test 2 analysis. The error in equilibrium
doubles each times the load step 1s incremented. This 1s due to the
illconditioned effect( numerical instability) of the structural equation matrix. A
small change in the stiffness [K] or load vector {R} will produce large change m
displacement {D}. The structural equations [K]{D}={R} are equilibrium
equations which are written m terms of differences m displacement of
neighbouring nodes. If these differences are quite small in comparison with the
displacements themselves the equations become ill-conditioned. This is what is
actually happening to our structure(model) where a condition of a very stiff
member surrounded by a flexible member exists. To overcome these inaccuracies
17

the rigid member is modified by scaling down the E value from a prevwus
value of 1000 times to 10 times the normal E value; other values remaining
constant. The final results are shown in Table 6-3. As seen in Table 3 the
modification results m a drastic reduction m error; almost negligible.
Equilibrium Is also maintained throughout the load-step.
In order to avoid future error when carrying this form of analysis the
following procedure 1s recommended:-
1) Equilibrium must be checked for at every load step particularly in the
region of sizable change m geometric and material properties. In our case
between the rigid member and the flexible member.
2) When introducing boundary conditions avoid introducing a hinge next
to an existing hinge, as in node 10. If a hinge is formed in this location, it is
better to introduce the hinge at the ith end of member 3 rather than the jth
end of member 4.
3) Avoid introducing a hinge at both ends particularly in the regwn
expenencmg compresswn. It was found out that if for example, a hinge is
formed at node 11 after formation of a hinge at node 10, it is best to introduce
a hinge at the ith end of member 14 rather than introducing hinges at the ith
and jth ends of member 3. However this effect does not apply to the members
experiencing tension,i.e, member 1 and member 2.
18

4) A trial and error method ts necessary m order to provide the right
amount of rigidity to the rigid link member.
19
Chapter 6 CONCLUSIONS
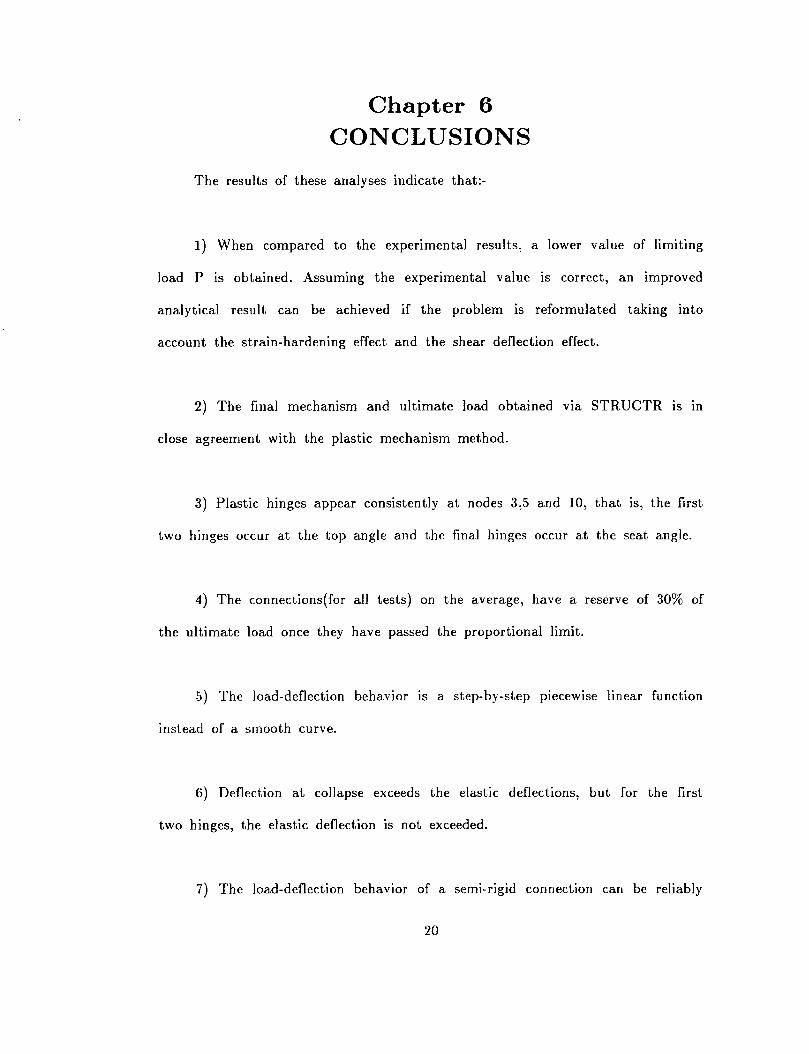
The results of these analyses indicate that:-
1) When compared to the experimental results, a lower value of limiting
load P 1s obtained. Assuming the experimental value is correct, an improved
analytical result can be achieved if the problem is reformulated taking into
account the strain-hardening effect and the shear deflection effect.
2) The final mechanism and ultimate load obtained v1a STRUCTR IS m
close agreement with the plastic mechanism method.
3) Plastic hinges appear consistently at nodes 3,5 and 10, that is, the first
two hinges occur at the top angle and the final hinges occur at the seat angle.
4) The connections(for all tests) on the average, have a reserve of 30% of
the ultimate load once they have passed the proportional limit.
5) The load-deflection behavior IS a step-by-step p1ecew1se linear function
instead of a smooth curve.
6) Deflection at collapse exceeds the elastic deflections, but for the first
two hinges, the elastic deflection is not exceeded.
7) The load-deflection behavior of a semi-rigid connection can be reliably
20

analysed usmg a linear structural analysis program thus relieving designer's of
doing it manually.
21

Test No.
Rotation at collapse
test rotation
STRUCTR Collapse load
===================================================== 2 0.0131 0.0013 0.1717 6 0.00866 0.0021 0.1818 9 0.00806 0.0021 0.2196
10 0.0074 0.0011 0.2966 16 0.0146 0.0014 0.1601 20 0.0111 0.0021 0.2012 22 0.00871 0.00167 0.2042
Table 6-1: COLLAPSE A:'IID TEST ROTATIO\
22
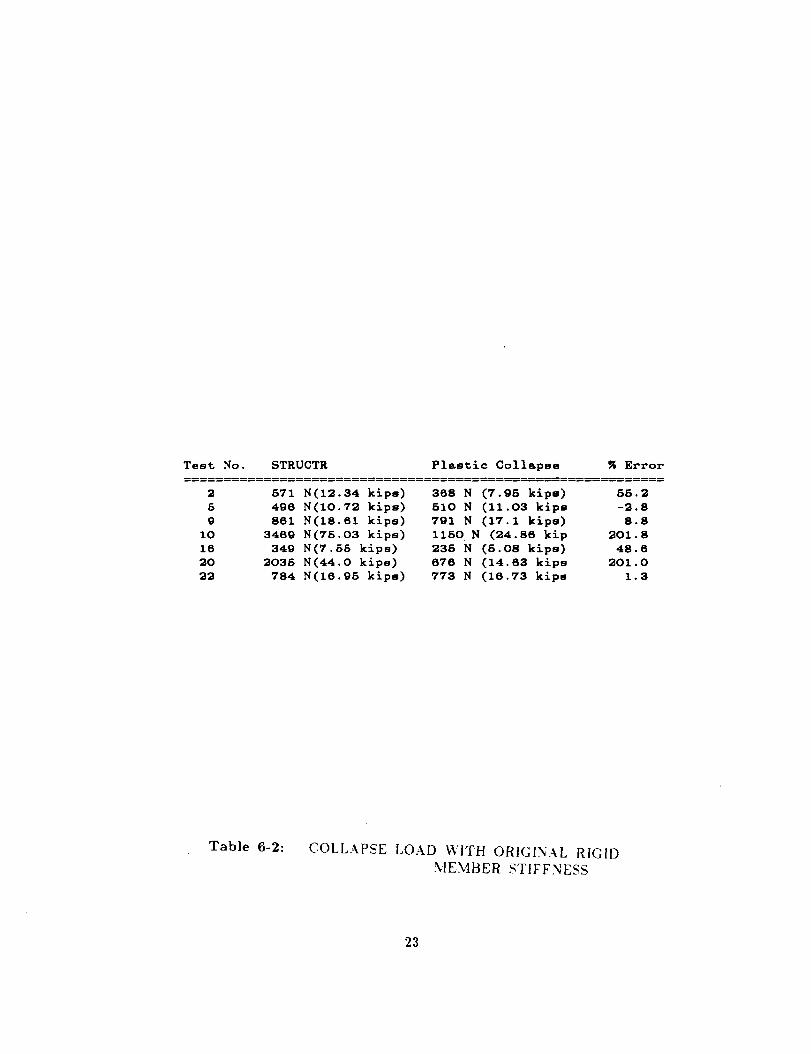
Test No. STRUCTR Plastic Collapse " Error ============================================================
2 671 6 496 9 861
10 3469 16 349 20 2036 22 784
Table 6-2:
N(12.34 kips) 368 N (7 .96 kips) 66.2 N(10.72 kips) 610 N (11.03 kips -2.8 N(18.61 kips) 791 N (17.1 kips) 8.8 N(76.03 kips) 1160 N (24.86 kip 201.8 N(7.66 kips) 236 N (6.08 kips) 48.6 N(44.0 kips) 676 N (14.63 kips 201.0 N(16.96 kips) 773 N (16.73 kips 1.3
COLLAPSE LOAD WITH ORIGI:\AL RIGID \JE~BER STIFF~ESS
23

Test No. STRUCTR Plastic Collapse ~ Error ============================================================
2 370 6 496 9 787
10 1148 16 236 20 674 22 784
Table 6-3:
N(8 kips) 368 N (7 .96 kips) N(10.72 kips) 610 N (11.03 kips) N(17.02 kips) 791 N (17 .1 kips) N(24.82 kips) 1160 N (24. 86 kips) N(6.1 kips) 236 N (6.08 kips) N(14.68 kips) 676 N (14.63 kips) N(16.96 kips) 773 N (16.73 kips)
COLLAPSE LOAD WITH REVISED RIGID l\·1EMBER STIFF:\ESS
24
0.6 -2.8 -0.6 -0.2 0.4
-0.3 1.3

A ·r
r-0 0
J!
.t
T~~e A The w-eb- ongle connechon
T~~e. fJ Top ond seat angle connection
Ttjpe C Combinatiort of +~peS A; ~
T\1pe D The n e eked - down co nnec:h ::Jr.
Figure 6-1: TYPES OF SE~1I-RIG1D CO!\:\ECTION
25
~
§ ~ ~
,, dJ ~ ..:: s:: 8 ~
-G Q) .. "i ~
Test be ho v1or ot' ')(.
~ ~ semi- ng1d ~nn. s:: v L.. E 1E 0 t
~ Perm1SS1ble . vanat1on ~ v .c:O
Figure 6-2: MOME!\T-ROTATJON CURVE-SEMI-RIGID CO~NECTJOl\
26

;- - :-= ~.:--,..._~- ~ r--------~ r.----15": ; - -"::J -.:- = -=f
~rotat1on bor.s
opp11ed Load
Jlala t:J mea~ure. r--H-----++-- ~onz.ootat ~V'etr~eAt
/ ofd Centv of' rotdh"'
'
Beam Stub
a
Figure 6-3: TEST ASSEY!BLAGES
27
real column
n~,d lmk L.beam rnember)
oncale GIFYIUiated C'S p two beams
Figure 6-4:
real beaM
1
ri~icl link ~in-~~ ot\ co111pres5ion sicie to act as '' r-oller-~
TEST MODEL
28

y
~
X
~ p
3
I]] [D
sar 6
~ @] @] t 8
m 10~ [}}] II
0] rn (11 13
'*>DE #
l Xc let z. Xc '(ovt
~ 3 ><.av Yovt 4 Xo \aht 5 Xav Yoht 6 x.,~ Yaht 1 x~~ Y11 9 X~j Yb q Xc l'ahb 10 Xav '( ahb II X~~ Yahb 12. Y..c Yavb 15 Xav Yovb 14 Xv Ycb
Figure 6-5: NODE A~D MEMBER Nl'MBERI:"JG
29
-o
/
e, \
/,o -e I
Mpt = Plasbc moment ot' to~ a~le.
~tz -=- ~lashc trloment ot bott-om Q~le-
p
~]La l
- d~ -- ---I
-
I L I I• c ''
Lb j
subshtu+e iflto (1)
P ( Ll> + Lc:)B :.. Jtlr, [I t ~]e + Mp:S
. , p = Mp, [ I + ~] + t'lpt
L17 + Lc
Figure 6-6: PLASTIC YlECHANISM ~1ETHOD
30

0·8
ST~UCTR
O·IG
0 0 10 /3.{ zo 30 4-0
x ro-' radt ans
Figure 6-7: TEST 2 MOMENT-ROTATION CCRVE
31

p
~"" 1·0~-------
0·64
O·ZI S TRUCTR o o11 t-L===----=----......_ _____ ~,:..._;__;___ ___ _
0 0 10 20 30
Figure 6-8: TEST 2 LOAD-ROTATION Cl'RVE
32

p "Jl;o~
1·0
0·86
0·~1 0·17k~----------------------.,
0 I
32·4 t
Figure 6-9: TEST 2 LOAD-DEFLECTIOl\ CtRVE
33

M M-1
1·0
0·81
0·4-' 0'3'3
0·'31
TEST RESULT~
STRUCTR
\
0~------~-------r------~--------~--------~ 0 15 20
Figure 6-10: TEST 5 MOMENT-ROTATION CURVE
34

p PI'IIX. 1·0 1------------
0·!51
03
STRUCTR~
0·18±-t:.======-=-=-.,_._.,..._ ______ ~...!ll-.---0·11
0 L---------------~------~-------+-----------0 5 10 15 20 ¢
x 10-3 radtans
Figure 6-11: TEST 5 LOAD-ROTATION Cl'RVE
35
0·85
Q·f:,8
0·51
0· I 9 -+-------0·11
0 0 2.·19
Figure 6-12: TEST 5 LOAD-DEFLECTION CURVE
36

1·0
o-77
0·62.
0·31
0·15
TEST RESULT~
E=IOOO X~
STRUCTR~ ----_..,--
0 L-------+--------r------_,--------r-------~· 0 10 2.0 '30 - 4o
,<. 10 3 radrans ¢ Figure 6-13: TEST 9 MOMENT-ROTATION CURVE
37

l·O +--------
£_ An.,
0·9
OT1
055
O·SZ
0·39
0·2.£ 0·24 0 ·22 t-t~;..-.,
0·13
-------------- - ---
E•IOOO~ -
0------~------~------~------~------~ 0 10 2.0
Figure 6-14: TEST 9 LOAD-ROTATION CURVE
38
p Pmox
0·.52.
0·2»
0·24t-~-================--~
0·13
0 0
Figure 6-15: TEST 9 LOAD-DEFLECTION CURVE
39
1·0 ...___ ______ _
M
0·11 STRUCT~
0·43
0·14
0 ~------+-------+-------~-------+----~ 0 10 20 30
x 10-3 radians 40 ¢
Figure 6-16: TEST 10 MOMENT-ROTATION CURVE
40
1·0~--------------
()o~S
p
~
0·11
O·bO
0·24
-STRUCTR
0~----~----~-----+----~----0 10 ZiJ 30 x 1()-:s rod1at1s
Figure 6-17: TEST 10 LOAD-ROTATION ClJRVE
41

p Pmat I.(J.f-----
0"15
0·11
o. 3 +-------.-.:::-..:::....=========-=---~ 0·2.4
0 ~------+-------~------~----~--+---+ 0 I·Cf6 2·~3 3·~ 3·'H .6 .Llmax
Figure 6-18: TEST 10 LOAD-DEFLECTION Cl'RVE
42
M Mmax
1·0
0·44
0·32.
O·ZZ
TEST
STRUCTR
0 ~------~-------4--------+-------~---+ 0 10 20 !I)
x 1 o-3 rad1a11s 40 ¢
Figure 6-19: TEST 16 MOME;\IT-ROTATION CURVE
43

0·88 TEST RESLILT
~
0·29
STRUCTR
\ 0·15 H::==:......===--_....-----..!.------
0 0 10 20 30
x 10~ rod1ans so¢
Figure 6-20: TEST 16 LOAD-ROTATION CCRVE
44
p Pmax
1·0 +-------0·~~
O·S'l
0·29
oo~s-r---::::;_-=-============-=-=========-41
5·2.
Figure 6-21: TEST 16 LOAD-DEFLECTION CURVE
45
_M_ Mm.x
I·O
OJ/2 TESi RESULT
\
0·74
0·5
0·15
0 ~------r-------+-------T-------~-------+ 0 10 zo 30
x 1o-3 rad1'ans
Figure 6-22: TEST 20 :VIOMENT-ROTATION CURVE
46
1·0 O·'J1 p Pmox
0·6~
0·5
0·4-1
o-2B
0·/4
0 0
TEST ~ESULT
\
-4-------- S TP-.\JCl R
10 20 30 40 x 10 -3 radtans
Figure 6-23: TEST 20 LOAD-ROTATI0:'\1 CURVE
47

p Pmo}C
1·0 +------O.q1
0·55
0·2<o
0· 'lJ) t-------:-::.=======---.:;;=--=----------,.
0 0 0·73 1·46
L1mox
Figure 6-24: TEST 20 LOAD-DEFLECTION CURVE
48

M_ ,M,..x 1·0 +---O·q6
0·16
0 10 20 30 ;< 10-3 r-odJ·ans
Figure 6-25: TEST 22 :\10!viE:"'T-ROTATIO~ Cl'RVE
49

0·60
O·'JB
0·24 o-20
0-12.
--------------
TEST RESUL. i
~
o~-----~~---+-----4-----+-~ 0 30
Figure 6-26: TEST 22 LOAD-ROTATIO!\ Cl"RVE
50
p Pmol'
.. 110 t--------O·qG
0·12.
0 /·94 z.q, ~·ss 3"·88
t6 ~max
Figure 6-27: TEST 22 LOAD-DEFLECTION CCRVE
51
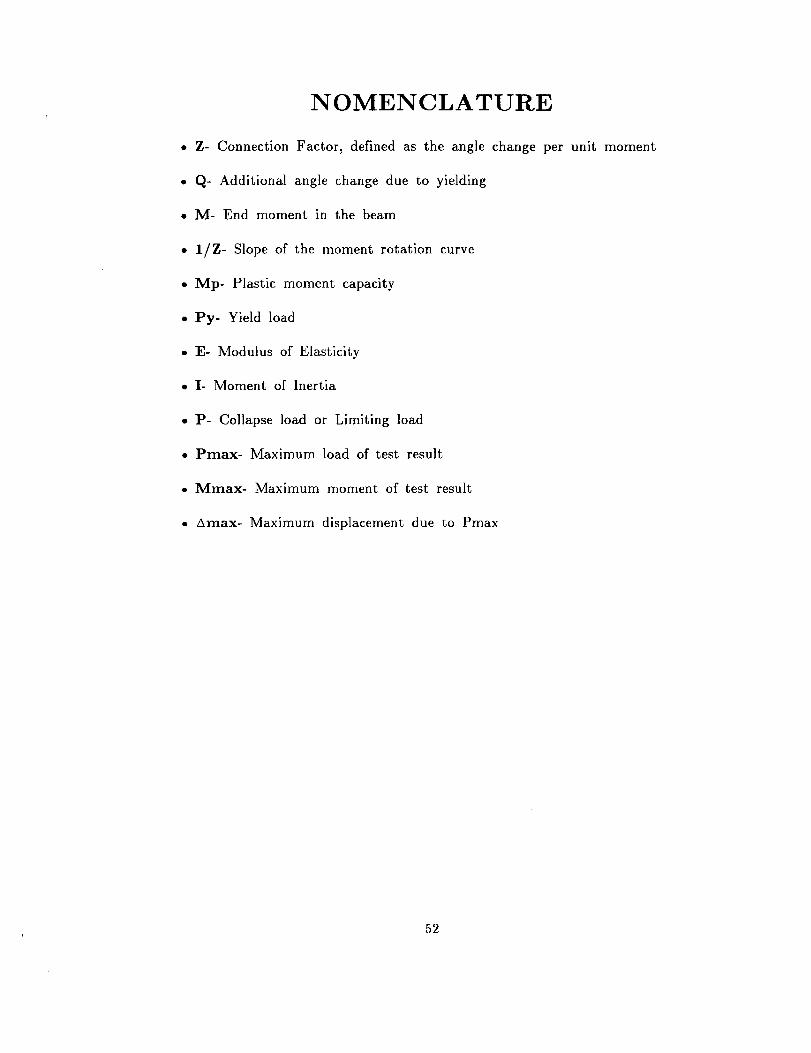
NOMENCLATURE
• Z- Connection Factor, defined as the angle change per unit moment
• Q- Additional angle change due to yielding
• M- End moment in the beam
• 1/Z- Slope of the moment rotation curve
• Mp- Plastic moment capacity
• Py- Yield load
• E- Modulus of Elasticity
• 1- Moment of Inertia
• P- Collapse load or Limiting load
• Pmax- Maximum load of test result
• Mmax- Maximum moment of test result
• t.max- Maximum displacement due to Pmax
52
'
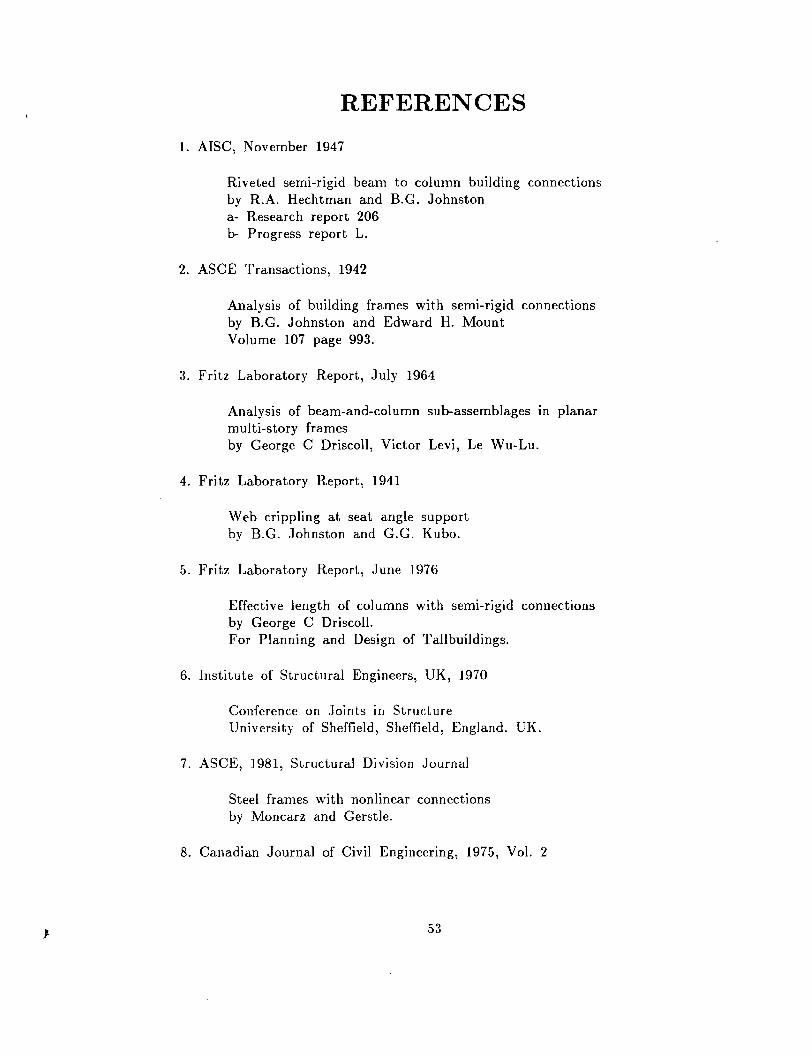
REFERENCES
1. AISC, November 1947
Riveted semi-rigid beam to column building connections by R.A. Hechtman and B.G. Johnston a- Research report 206 b- Progress report L.
2. ASCE Transactions, 1942
Analysis of building frames with semi-rigid connections by B.C. Johnston and Edward H. Mount Volume 107 page 993.
3. Fritz Laboratory Report, July 1964
Analysis of beam-and-column sub-assemblages m planar multi-story frames by George C Driscoll, Victor Levi, Le Wu-Lu.
4. Fritz Laboratory Report, 1941
Web crippling at seat angle support by B.G. Johnston and G.G. Kubo.
5. Fritz Laboratory Report, June 1976
Effective length of columns with semi-rigid connections by George C Driscoll. For Planning and Design of Tallbuildings.
6. Institute of Structural Engineers, UK, 1970
Conference on Joints in Structure University of Sheffield, Sheffield, England. UK.
7. ASCE, 1981, Structural Division Journal
Steel frames with nonlinear connections by Moncarz and Gerstle.
8. Canadian Journal of Civil Engineering, 1975, Vol. 2
53
Analysis of flexibly connected steel frames by Frye, M.J. and Morris G.A.
9. Lothers, J.E.
Advanced Steel Design 3rd. Edition Chapter 8, Page 367-404.
10. Driscoll, George C. et al,
STRUCTR - A general purpose FORTRAN program for structural analysis. Unpublished report, Fritz Engineering Laboratory, 1986.
54

VITA
Norzan Mohd. Yusof was born in Kuala Pilah, Negri Sembilan, Malaysia
on May 21, 1956. He is the eldest son of Mohd. Yusof Ya'acob and Yam Hj.
Loya. He received his Bachelor of Engineering Degree in Civil Engineering with
second class honors from the University of Wales Institute of Science and
Technology, Cardiff, Wales, United Kingdom in July 1980. Upon graduation, he
went to work for the Public Works Department, a Malaysian Government body
who are responsible for the infrastructural development of Malaysia. Here
initially, he was attached to the construction division, where he was responsible
for the supervision of a highway projects. Upon completion of the highway
project, he was transfered to the design and research division where he, was
responsible for the structural analysis and design of various buildings for the
department. After two years of design office experience, he won a Malaysian
Government Fellowships to pursue his master's degree in Civil Engineering at
Lehigh University starting spring semester 1985.
55