sem physio 9 – cardiac muscle and the heart as a pump prof. dr. Željko dujić
TRANSCRIPT

Sem Physio 9 – Cardiac muscle Sem Physio 9 – Cardiac muscle and the heart as a pump and the heart as a pump
Prof. dr. Željko DujićProf. dr. Željko Dujić

Figure 9-1 Structure of the heart, and course of blood flow through the heart chambers and heart valves.
Downloaded from: StudentConsult (on 5 October 2012 01:26 PM)
© 2005 Elsevier

Figure 9-2 "Syncytial," interconnecting nature of cardiac muscle fibers.
Downloaded from: StudentConsult (on 5 October 2012 01:26 PM)
© 2005 Elsevier

Figure 9-5 Mechanisms of excitation-contraction coupling and relaxation in cardiac muscle.
Downloaded from: StudentConsult (on 5 October 2012 01:26 PM)
© 2005 Elsevier

Figure 9-3 Rhythmical action potentials (in millivolts) from a Purkinje fiber and from a ventricular muscle fiber, recorded by means of microelectrodes.
Downloaded from: StudentConsult (on 5 October 2012 01:26 PM)
© 2005 Elsevier

Figure 9-4 Force of ventricular heart muscle contraction, showing also duration of the refractory period and relative refractory period, plus the effect of premature contraction. Note that premature contractions do not cause wave summation, as occurs in skeletal muscle.
Downloaded from: StudentConsult (on 5 October 2012 01:26 PM)
© 2005 Elsevier

AFTER THE EFFECTIVE OR ABSOLUTE REFRACTORY PERIOD (FAST FIBER)
TIME
MV
-80
0
RRP
ARP

POST-REPOLARIZATION REFRACTORINESS (SLOW FIBER)
A
B
C
mV
TIME
-60
0
200 MSEC
POSTREPO

Figure 9-6 Events of the cardiac cycle for left ventricular function, showing changes in left atrial pressure, left ventricular pressure, aortic pressure, ventricular volume, the electrocardiogram, and the phonocardiogram.
Downloaded from: StudentConsult (on 5 October 2012 01:26 PM)
© 2005 Elsevier

- End diastolic volume, end systolic volume, stroke - End diastolic volume, end systolic volume, stroke
volume, ejection fractionvolume, ejection fraction
- A-V valves and the function of papillary muscles- A-V valves and the function of papillary muscles
- Aortic and pulmonary artery valves (rapid closure, - Aortic and pulmonary artery valves (rapid closure, high velocity of blood flow through the valves, large high velocity of blood flow through the valves, large mechanical load) mechanical load)

Figure 9-7 Mitral and aortic valves (the left ventricular valves).
Downloaded from: StudentConsult (on 5 October 2012 01:26 PM)
© 2005 Elsevier

- Cardiac work: external work (moving the blood from - Cardiac work: external work (moving the blood from low pressure to high pressure compartments) and low pressure to high pressure compartments) and kinetic energy of blood flow component (usually kinetic energy of blood flow component (usually lower that 1% for left ventricle). Kinetic work is lower that 1% for left ventricle). Kinetic work is high in pulmonary/aortic stenosis (up to 50%).high in pulmonary/aortic stenosis (up to 50%).
- Oxygen consumption at rest – 75% of local reserves - Oxygen consumption at rest – 75% of local reserves on Hb, during work fresh blood serves to replenish on Hb, during work fresh blood serves to replenish myocardial oxygen demandsmyocardial oxygen demands

Figure 9-8 Relationship between left ventricular volume and intraventricular pressure during diastole and systole. Also shown by the heavy red lines is the "volume-pressure diagram," demonstrating changes in intraventricular volume and pressure during the normal cardiac cycle. EW, net external work.
Downloaded from: StudentConsult (on 5 October 2012 01:26 PM)
© 2005 Elsevier

Figure 9-9 The "volume-pressure diagram" demonstrating changes in intraventricular volume and pressure during a single cardiac cycle (red line). The tan shaded area represents the net external work (EW) output by the left ventricle during the cardiac cycle.
Downloaded from: StudentConsult (on 5 October 2012 01:26 PM)
© 2005 Elsevier

- External work (shaded area of the pressure-- External work (shaded area of the pressure-volume curve)volume curve)
- Potential energy- Potential energy
- Preload and afterload- Preload and afterload
- Energetic sources in heart: fats, laktate, - Energetic sources in heart: fats, laktate, glucoseglucose

PRELOAD AND AFTERLOAD IN THE HEART
INCREASE IN FILLING INCREASE IN FILLING PRESSURE=INCREASED PRELOADPRESSURE=INCREASED PRELOAD
PRELOAD REFERS TO END DIASTOLIC PRELOAD REFERS TO END DIASTOLIC VOLUME.VOLUME.
AFTERLOAD IS THE AORTIC AFTERLOAD IS THE AORTIC PRESSURE DURING THE EJECTION PRESSURE DURING THE EJECTION PERIOD/AORTIC VALVE OPENINGPERIOD/AORTIC VALVE OPENING..

- Efficiency of cardiac contraction 25%- Efficiency of cardiac contraction 25%
- Frank-Starling’s law- Frank-Starling’s law
- Bainbridge effect (increase in heart rate) - Bainbridge effect (increase in heart rate)
- Importance of pericardium (limits heart - Importance of pericardium (limits heart expansion acutely)expansion acutely)

LENGHT/ TENSION AND THE FRANK-STARLING RELATION
LE
FT
VE
NT
RIC
UL
AR
PR
ES
SU
RE
INITIAL MYOCARDIAL FIBER LENGHTLEFT VENTRICULAR END-DIASTOLIC VOLUME
Diastole
Systole


- Arterial pressure (under normal range) in - Arterial pressure (under normal range) in aorta does not affect cardiac output aorta does not affect cardiac output
- Increased atrial pressure increases ventricular - Increased atrial pressure increases ventricular volume and the contractility (Frank Starling volume and the contractility (Frank Starling law)law)
- Right ventricle is more compliant (larger - Right ventricle is more compliant (larger changes in volume per unit of filling changes in volume per unit of filling pressure) pressure)
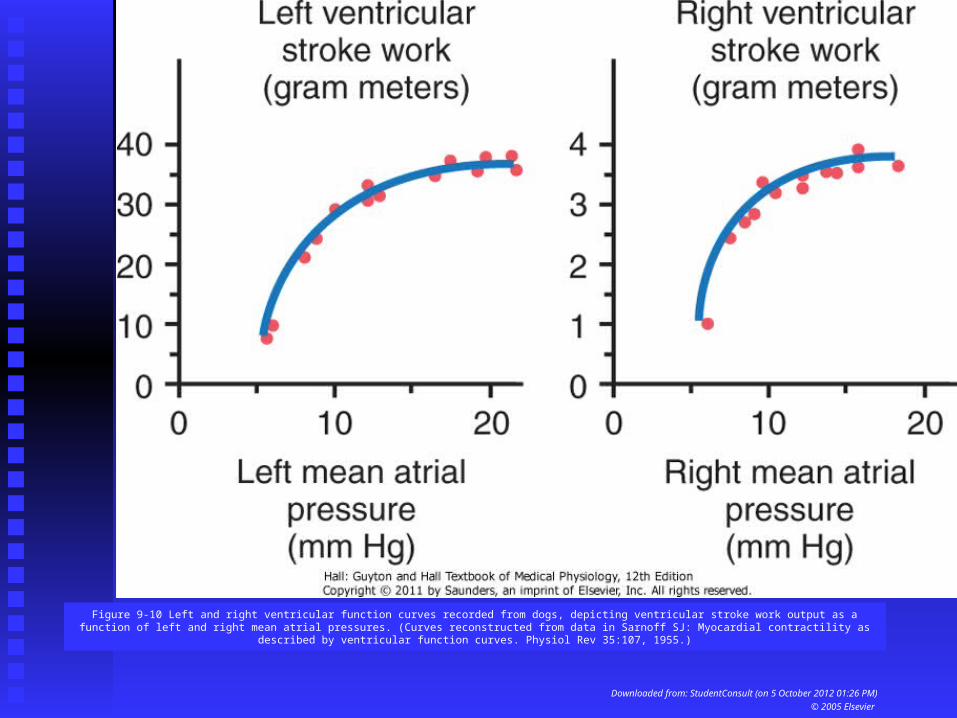
Figure 9-10 Left and right ventricular function curves recorded from dogs, depicting ventricular stroke work output as a function of left and right mean atrial pressures. (Curves reconstructed from data in Sarnoff SJ: Myocardial contractility as described by ventricular function curves. Physiol Rev 35:107, 1955.)
Downloaded from: StudentConsult (on 5 October 2012 01:26 PM)
© 2005 Elsevier

Figure 9-11 Approximate normal right and left ventricular volume output curves for the normal resting human heart as extrapolated from data obtained in dogs and data from human beings.
Downloaded from: StudentConsult (on 5 October 2012 01:26 PM)
© 2005 Elsevier
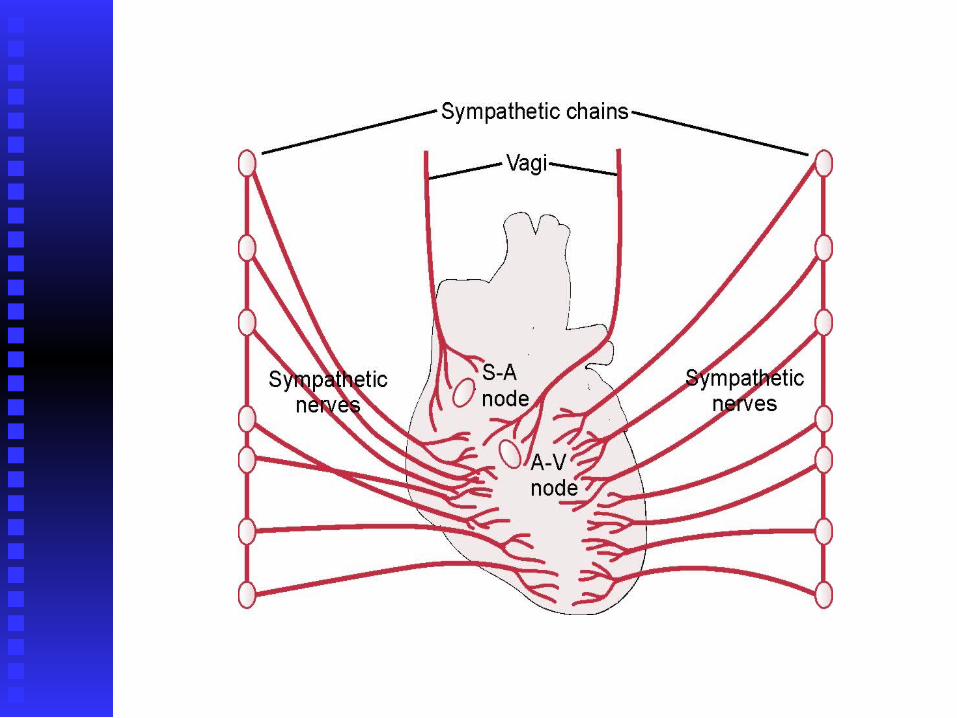


Figure 9-13 Effect on the cardiac output curve of different degrees of sympathetic or parasympathetic stimulation.
Downloaded from: StudentConsult (on 5 October 2012 01:26 PM)
© 2005 Elsevier

- Calcium effects: spastic contraction- Calcium effects: spastic contraction
- Potassium effects: high potassium causes dilatation - Potassium effects: high potassium causes dilatation and weakening of the heart and block in conduction and weakening of the heart and block in conduction through AV nodethrough AV node
- Temperature effects: moderate increase stimulates - Temperature effects: moderate increase stimulates
heart’s contractilityheart’s contractility