self sustainable integrated township : a resource-based planning to improve the quality of urban...
TRANSCRIPT

Self Sustainable Integrated
Township: A resource-based
planning to improve the quality
of urban life
A future of Inclusive Planning for all...
Ar.Sahil Singh Kapoor
M.Tech. (Urban Development and Management
TERI University, New Delhi

Sustainable Development in India: Challenges and Opportunities
1
• Integrated Township development approach of Micro Level planning
• Productivity
• Mobility
• Livability
• Minimize on Land
• Enhanced standard of living
• Increasing Competitiveness
• Urban Sprawl
• Traffic safety and accessibility
• Affordable Housing
Challenges Outcomes
Possible way
forwardEffects
“70% of the India of 2030 is yet to be built” – 2010 McKinsey Report

2
Objective
• The objective of this study is to analyze the potential shift towards Integrated Township
development with mixed land use, creating employment opportunities close to residential
place and requiring minimum land area.
Research Questions
• Can shift from conventional theories to Integrated Land use oriented urban planning
address ‘Sustainability’?
• A compact planning and coordinated infrastructure can tackle urban sprawl ?
• Can effective Decentralized solutions can optimize Basic urban services?
3
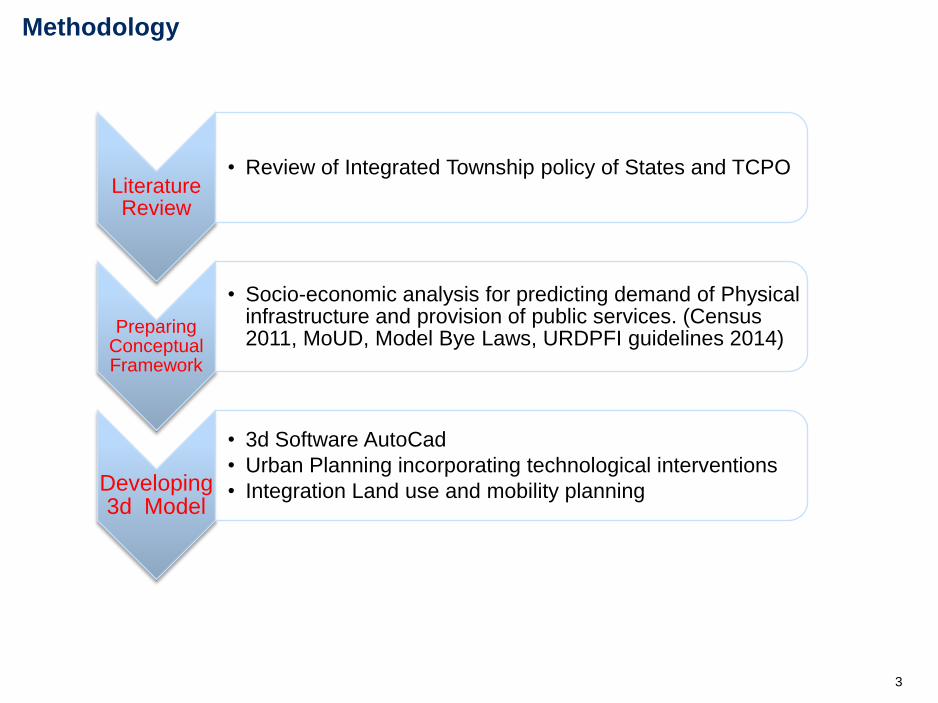
Literature Review
• Review of Integrated Township policy of States and TCPO
Preparing Conceptual Framework
• Socio-economic analysis for predicting demand of Physical infrastructure and provision of public services. (Census 2011, MoUD, Model Bye Laws, URDPFI guidelines 2014)
Developing 3d Model
• 3d Software AutoCad
• Urban Planning incorporating technological interventions
• Integration Land use and mobility planning
Methodology

4
Review of Integrated Township State Policy
Description Gujarat Integrated
Township Policy 2008
Uttar Pradesh Revised
Integrated Township
Policy 2014
Rajasthan Integrated
Township Policy 2007
EWS and LIG
Housing
Mandatory allocation of at
least 10% of land area
meant for residential
development
Provision of minimum
10% of total housing
units for both EWS and
LIG
7.5% of the total land under
Residential land use meant
for EWS/LIG housing
Commercial Provision of minimum 5%
of land area for commercial
development to sustain
EWS group and
recommendation of
minimum 5% of the total
proposed development area
for commercial purpose
use.
Maximum 8% of total
area under commercial
land use
Up to 5% of the total land
area
Mixed use Mixed use township with
recommended 10% of the
total developed area under
commercial land use
Maximum 12% of total
area under mixed land
use
Not considered
FAR of the
gross area
As per Building Bye-laws As per Building Bye-
laws
1
Source – Internet search

5
Experience of Integrated Townships in India
Source – Internet search
The two most lucrative examples of Integrated Townships in India are –
• Hiranandani Garden in Powai - Hiranandani Garden complex has numerous
facilities to support the residential establishment like Business Park, school,
hospital, shopping complexes and a hotel making it an integrated residential
cum commercial township.
• Magarpatta City in Pune - Similar to this is Magarpatta City located on the
outskirts of Pune city, comprising of Special Economic Zone (SEZ) offering
residential, IT and commercial.
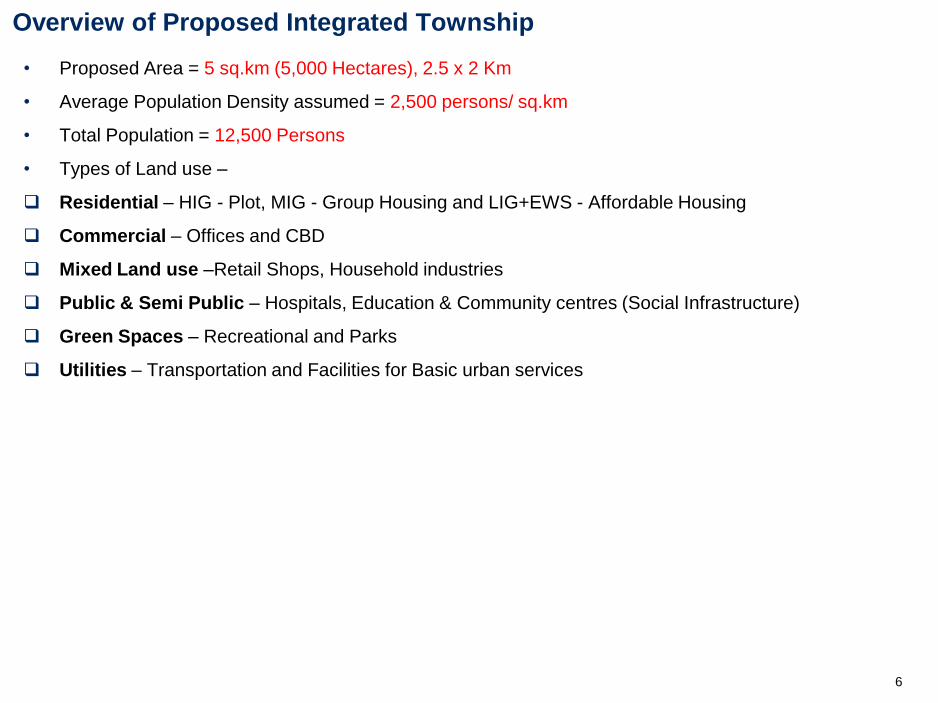
Overview of Proposed Integrated Township
6
• Proposed Area = 5 sq.km (5,000 Hectares), 2.5 x 2 Km
• Average Population Density assumed = 2,500 persons/ sq.km
• Total Population = 12,500 Persons
• Types of Land use –
Residential – HIG - Plot, MIG - Group Housing and LIG+EWS - Affordable Housing
Commercial – Offices and CBD
Mixed Land use –Retail Shops, Household industries
Public & Semi Public – Hospitals, Education & Community centres (Social Infrastructure)
Green Spaces – Recreational and Parks
Utilities – Transportation and Facilities for Basic urban services

7
INTEGRATED MODEL FOR SUSTAINABLE CITY
PROPOSED SUMMARY DETAILS
S.No. DESCRIPTION FIGURE ASSUMED REFRENCE SOURCECALCULATED
FIGUREREMARKS
1 PPRPOSED AREA 5 Sq.km (500 Hec)
2 Population Density assumed 2500 per sq.km. Noida Master Plan
2.1 Total Population assumed 12500
2.2Total Number of Households Avg 4 Person per Household
Chandigarh, Noida 3125
3 Population distribution as per Age Groups
3.1Age 0-4 0.09% of Total Population
Census_2011_Age data 187.5
3.2Age 5-9 10.48% of Total "
Census_2011_Age data 1875
3.3Age 10-14 10.96% " "
Census_2011_Age data 1500
3.4Age 15-59 60.29% of " "
Census_2011_Age data 8750
3.5Age 60 -99 0.08% of " "
Census_2011_Age data 187.5
4 Broad Classification
4.1Adolescent (10-19 Years) 20.90%
Census_2011_Age data 26.125
4.2 Young (15-24 years) 19.20% " 24
4.3 Adult (+18 years) 62.90% " 78.625
5 Gender Composition 5.1 Male 51.90% " 64.875
5.2 Female 48.10% " 60.125
6 Income Distribution AssumedEWS 60% of Total Population 0-3,300 Monthly per capita expenditure 7500
LIG 3-,300 - 7,300 "
MIG 35% of Total Population 7,300 - 14,500 " 4375
HIG 5% of Total Population Above 14,500 " 625
Demographic Analysis

8
S.No.Building
Description/Income Group
Population assumed
Plot Size (sq.mt)
Plinth Area
(sq.mt)
No. of Households/Plots
/DU
NO. of Storey
sFAR
Roof Top Area
(sq.mt)
Total Ground
Coverage
Max. Height(m)
Number of Multistore
y Buildings/
Hectare
Land Required (Hec)
1Plotted Development (HIG) 625(5% of 12500) 750 375 130 3 150 300 50% 12 9.75
13.33
2Group Housing, MIG
4375(35% of 12500) N/A
90 x 4 = 360 1095
Stilt + 3 180 360 65% 12
8.024691358
15.20
3LIG / EWS Housing
7500 (60% of 12500) N/A
50 x 4 = 200 1500 3 150 200 75% 8 12.5
10.41
TOTAL 40 Hec
4 HEALTHCARE
4.1Dispensary/Maternity Home 1 each per 10000 2000 660N/A 5 100 500 33% 15 2
0.25 x 2 = 0.50
4.2 Veteniary Hospital " " " 10.25
TOTAL 1 hec
5 EDUCATION
5.1Primary School 3 per 5000 2000 660N/A 2.5 120 600 33% 15 3
0.25 x 3 = 0.75
5.2 Sr. Secondary School 1 per 10000 6000 1800N/A 5 120 1000 30% 15 10.6
5.3 Sport Centre 1 per 10000 15000 1.5
TOTAL 3 Hec
6 SOCIO-CULTURAL
6.1Community Hall 1 per 10000 2000 500N/A 4 100 500 25% 12
0.25 x 2 = 0.50
6.2 Relegious Building 400 0.4
TOTAL 1 Hec
7 DISTRICT CENTRE
7.1 District Centre 10 Hec 30,000 N/A 4 125 30% 37 N/A 10 Hec
TOTAL 10 Hec
Buildings Design and Layout
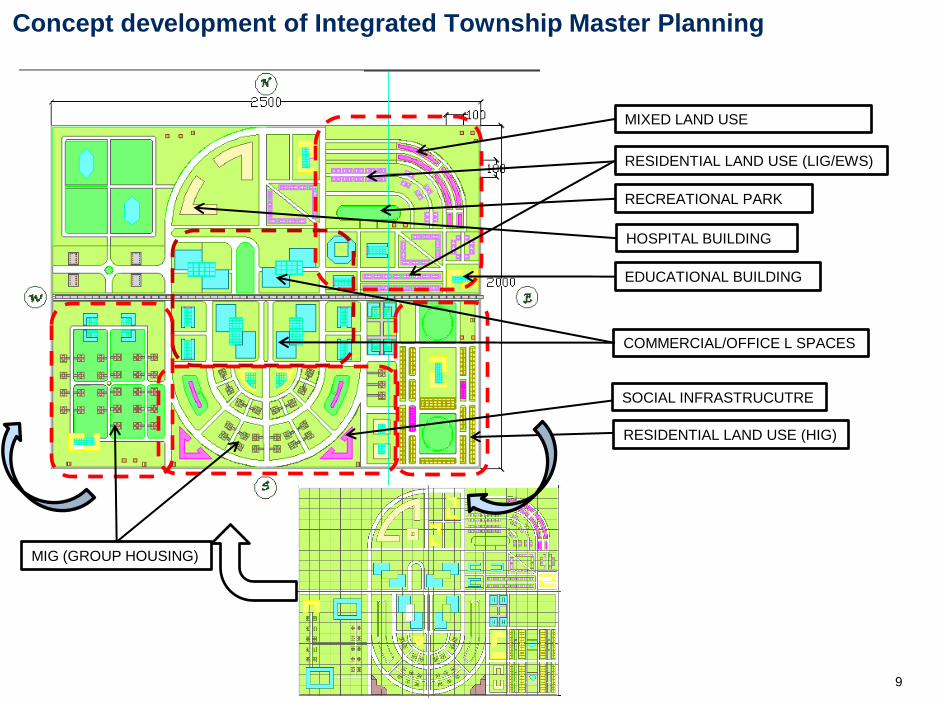
Concept development of Integrated Township Master Planning
9
COMMERCIAL/OFFICE L SPACES
MIXED LAND USE
RESIDENTIAL LAND USE (HIG)
RESIDENTIAL LAND USE (LIG/EWS)
RECREATIONAL PARK
SOCIAL INFRASTRUCUTRE
MIG (GROUP HOUSING)
HOSPITAL BUILDING
EDUCATIONAL BUILDING

1010
HIG, PLOT (Area
750 Sq.mt)
CBD, COMMERCIAL
BLDGS.
MIXED LAND USE
EDUCATIONAL
BLDGS.
HOSPITAL BLDG.
RECREATIONAL
PARKS
MIG (GROUP
HOUSING)
Integration and Land use segregation
MULTI=STOREY
PARKING
LIG/EWS
(AFFORDABLE
HOUSING)
COMMUNITY
CENTRE

11
Mobility Planning for efficiency
DEDICATED PUBLIC
TRANSPORT CORRIDOR
CLOSED LOOP FOR FAST
MOBILITY
Inner movement =
200- 300 m (Walk able)
Outer Ring = > 500 m
, Private Vehicles
Middle Ring =300 -
500 m, Public Transport

12
Descript
ion
Waste
Generated/House
hold (Gram)
No. of
Househ
olds
Total Waste
generated (Kg)
HIG 500 130 65
MIG 300 1095 330
LIG/EWS 180 1500 270
Others 1200 25 300
Total 715 (Kg Per day)
Decentralized Solid Waste Management
A – Green/ horticultural Waste, Pellet making.
B – Compost making, Organic waste composting (OWC) unit, Cost
Rs 5 Lakh for 50 Kg, 50 – 500 Kg
* Area required for is 185 sq.mt. for single unit A,B.
A
A,B
A
A
A,B
A
A,B
B
B
13
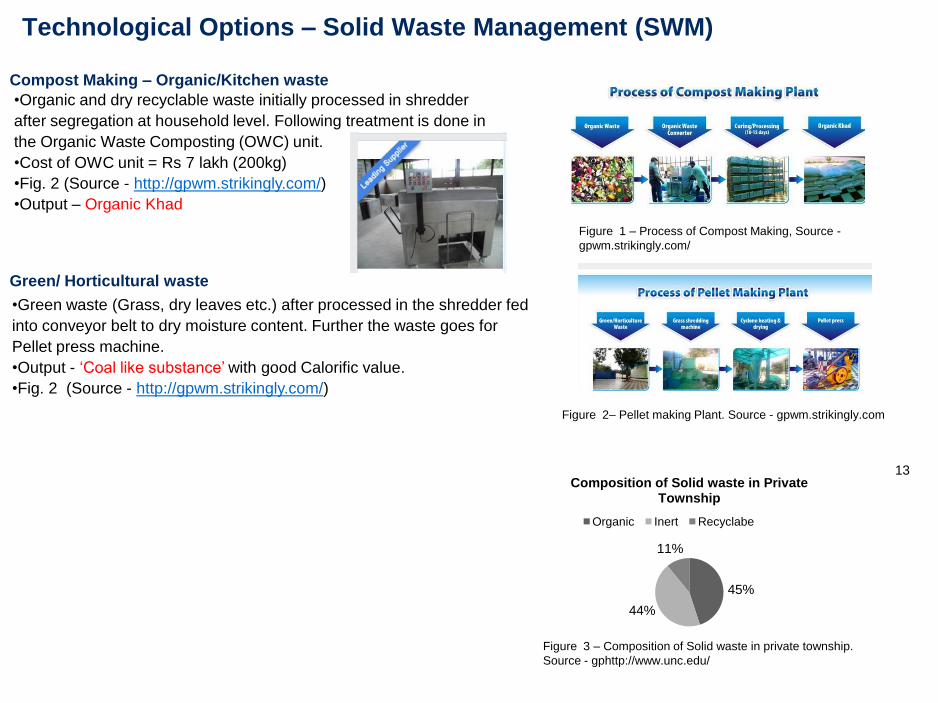
Technological Options – Solid Waste Management (SWM)
Figure 1 – Process of Compost Making, Source -
gpwm.strikingly.com/
Compost Making – Organic/Kitchen waste
•Organic and dry recyclable waste initially processed in shredder
after segregation at household level. Following treatment is done in
the Organic Waste Composting (OWC) unit.
•Cost of OWC unit = Rs 7 lakh (200kg)
•Fig. 2 (Source - http://gpwm.strikingly.com/)
•Output – Organic Khad
Green/ Horticultural waste
•Green waste (Grass, dry leaves etc.) after processed in the shredder fed
into conveyor belt to dry moisture content. Further the waste goes for
Pellet press machine.
•Output - „Coal like substance‟ with good Calorific value.
•Fig. 2 (Source - http://gpwm.strikingly.com/)
Figure 2– Pellet making Plant. Source - gpwm.strikingly.com
45%
44%
11%
Composition of Solid waste in Private Township
Organic Inert Recyclabe
Figure 3 – Composition of Solid waste in private township.
Source - gphttp://www.unc.edu/

Rain Water harvesting
14
COST OF SINGLE BOREWELL = 1
Lakh. Total cost = 10 Lakh (approx)
A
B
B
A
A
B
A
A
A
A
B
B
A – Borewell rain water harvesting
B – Recharge well of 1 m in dia. and 6
m depth. 1 well for ¼ hec. area
A
A
A
B

Rain water harvesting potential
15
Description Roof area
(sq.mt)
Number of
Buildings
Total Roof Top
Area (Sq.mt)
Average annual
Rainfall (Delhi)
HIG (Plot) 350 130 45,500 (Avg 0.790 m)
MIG (Group
Housing)
470 1095 5 lakh
LIG (Housing) 250 1500 3.75 Lakh
Educational
Bldgs
10,000 4 40,000
Commercial
Bldgs
12,000 18 2 Lakh
Hospital 20,000 1 20,000
Community
centers
/Dispensaries
8,000 8 64,000
Total 11 Lakh 8.96 Lakh cubic
metre
Figure – Rain water Harvesting Group HousingFigure – Recharge well in Parks
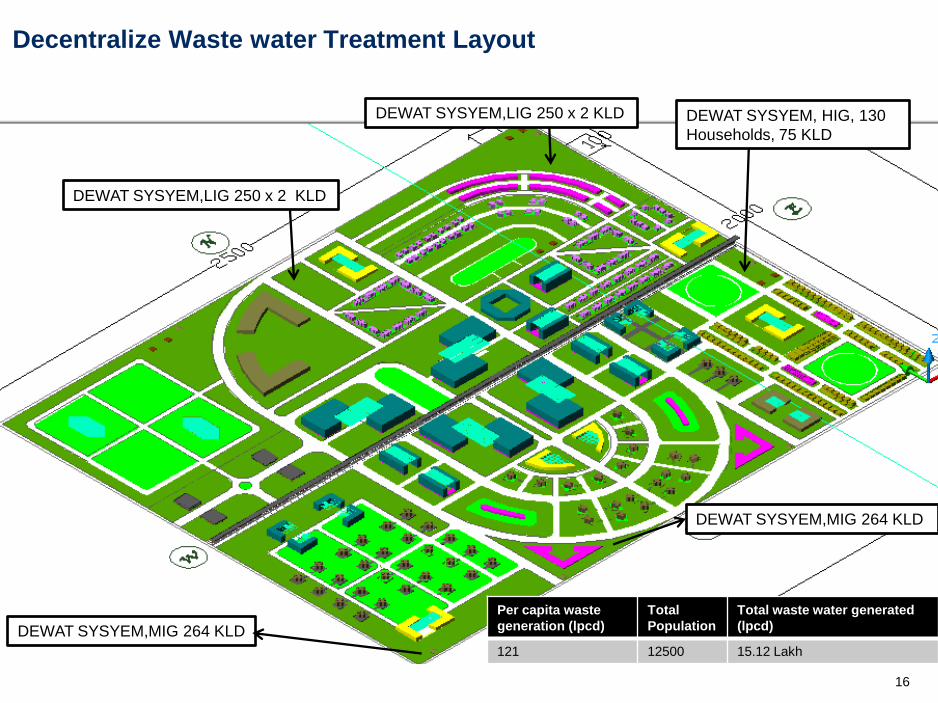
Decentralize Waste water Treatment Layout
16
DEWAT SYSYEM, HIG, 130
Households, 75 KLD
DEWAT SYSYEM,MIG 264 KLD
DEWAT SYSYEM,MIG 264 KLD
DEWAT SYSYEM,LIG 250 x 2 KLD
DEWAT SYSYEM,LIG 250 x 2 KLD
Per capita waste
generation (lpcd)
Total
Population
Total waste water generated
(lpcd)
121 12500 15.12 Lakh

17
Description Wastewat
er
generate
d (KLD)
Name of
Technology
Treatment Method Number of
Plants
setup
Capital cost O & M (Rs
2000 / KLD
/ year)
(Lakh)
Reuse of Treated
water
HIG, Individual
Plots
75 DEWAT Sedimentation,
anaerobic digestion,
filtration and phyto-
remediation
75 x 1 Rs 35,000 1.50 Horticulture , Biogas
generation
MIG, Group
Housing
528 DEWAT “ 264 x 2 Rs 1,50,000 10.56 Horticulture , Biogas
generation
LIG, Affordable
Housing
1000 DEWAT “ 500 x 2 Rs 2,00,000 20 Horticulture , Biogas
generation
Total Rs 4,00,000
Decentralize Technological option Waste water treatment
Source – Centre for Science and Environment 2010.
DEWAT System
•Advantages –
Low maintenance
Offers conventional treatment system
Low on O&M
Reuse of Treated Water – Horticulture
•Disadvantages –
Aerobic large space requirement
Anaerobic – Odor and difficult to control
Figure – DEWAT Aravind Eye hospital, Pondicherry
, Source – Centre for Science and Environment 2010.
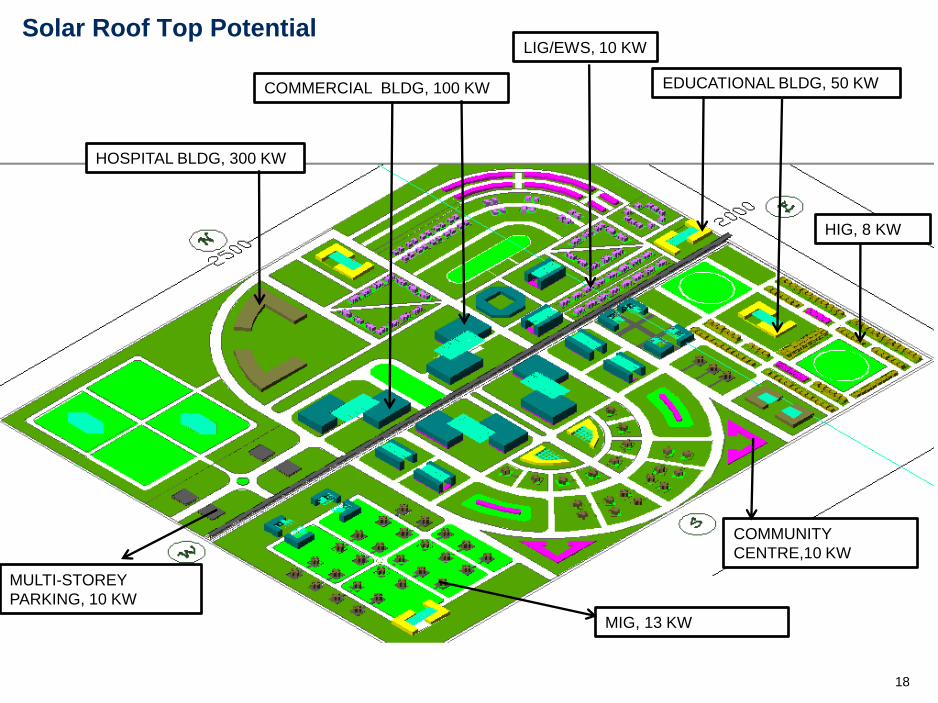
18
HIG, 8 KW
MIG, 13 KW
EDUCATIONAL BLDG, 50 KW
HOSPITAL BLDG, 300 KW
COMMERCIAL BLDG, 100 KW
COMMUNITY
CENTRE,10 KW
Solar Roof Top PotentialLIG/EWS, 10 KW
MULTI-STOREY
PARKING, 10 KW
Technological interventions for Sustainable cities
19
Description Roof Top
area
available
(sq.mt)
Roof top
area covered
by Solar PV
(sq.mt)
Electricity
from Solar PV
(Kw hr)
Average
electricity
consumption
per day of
single
Household
(units)
Average
electricity from
Solar PV per day
(units)
Capital
Cost
(Lakhs)
HIG (Plot) 340 80 (25%) 8 15 x 2 = 30 4 x 8 = 32 8
MIG (Group
Housing)
440 120 (30%) 12 12 x 4 = 48 4 x 12 = 48 12
LIG (Affordable
Housing)
300 100 (35%) 10 10 x 4 = 40 4 x 10 = 40 10
Average electricity consumption in Building
(units)
Educational
Bldg
9000 500 (5 %) 50 2000 50 x 4 = 200 50
Commercial
/Office
Bldg/Hospital
30,000 1000 (5%) 100 5000 100 x 4 = 400 100
Others
Community
centers /
Dispensaries
8000 100 (2%) 10 2000 10 x 4 = 400 10
Source – BEE, India Source – BEE, India.

20
Description Solar
generation
(Kw)
Total Number
of Buildings
Total Solar Power
Generation (Kwhr)
Residential
HIG (Plot) 8 130 1040
MIG (Group Housing) 12 1095 13140
LIG (Affordable
Housing)
10 1500 15000
Other then Residential
Educational Bldg 50 4 200
Commercial /Office
Buildings
100 18 1800
Main Hospital
Building
100 1 100
Community centers/
Dispensaries
10 8 80
Total 31,000 KW
Calculated Solar Potential
Source – BEE, India
FEED INTO GRID
FEED INTO GRID
FEED INTO GRID
CAPTIVE USE
CAPTIVE USE
CAPTIVE USE
CAPTIVE USE

21
Fig. – Compact cluster planning, Source -
http://cpwd.gov.in/Publication/IGDBooklet.PDF
Sustainable Building planning
Fig. –Compact cluster planning, Source -
http://cpwd.gov.in/Publication/IGDBooklet.PDF
Source: Own conceptual model
Compact cluster planning
Source: Own conceptual model

22
Sustainable vs. Unsustainable
Description Parameters for Sustainable Township In case parameter is not considered
Road Design with dedicated bicycle
and pedestrian track
Segregated movement of Motorized and
Non- motorized transport (NMT) on
road with safety of NMT user.
Safety of NMT user is compromised and
discourages walking and bicycling.
Street Lights LED Solar street Lights with stand alone
installation
Electric connection for street light
Dual water supply and distribution
system
Individual portable and recycled water
supply lines to minimize water
consumption
Per capita water consumption will
increase significantly
Rooftop Rain water harvesting in
Buildings
Continuous replenishment of water table
and aquifer
Seepage of rain water
Artificial recharge well rain water
collection
Stored water used for horticulture Additional water for Horticultural
purpose
Storm water collection from street Collect excess rain water and recharge
ground water table
Ponding of excess water on street
Decentralized waste water treatment Treating and reusing of wastewater
through cost efficient approach
Costly centralized waste water treatment
with high Operational cost
Treatment of Organic waste Efficient treatment of Organic waste Maximizing waste to landfill since
segregation taking place
Treatment of Horticultural waste Treating daily green waste for valuable
output product
Burning of waste in open
Plastic waste to fuel Effective degradation of plastic waste Maximizing plastic waste to landfill
Roof top Solar generation Minimizing electricity from
conventional sources by 10%
Dependence on Conventional sources for
electricity

THANK YOU
“Medium and small cities, those which nobody knows about, are going to
grow faster in the future. Our century is about global cities.” The Mayor
of Istanbul
23