selected procedures for volumetric calibrations (2019 ed)standard operating procedures . 14...
TRANSCRIPT
NISTIR 7383
Selected Procedures for Volumetric Calibrations
(2019 Ed)
Georgia L. Harris Val R. Miller
This publication is available free of charge from: https://doi.org/10.6028/NIST.IR.7383-2019
NISTIR 7383
Selected Procedures for Volumetric Calibrations
(2019 Ed)
Georgia L. Harris Val R. Miller
Office of Weights and Measures Physical Measurements Laboratory
This publication is available free of charge from: https://doi.org/10.6028/NIST.IR.7383-2019
May 2019
U.S. Department of Commerce Wilbur L. Ross, Jr., Secretary
National Institute of Standards and Technology Walter Copan, NIST Director and Under Secretary of Commerce for Standards and Technology
Certain commercial entities, equipment, or materials may be identified in this document in order to describe an experimental procedure or concept adequately.
Such identification is not intended to imply recommendation or endorsement by the National Institute of Standards and Technology, nor is it intended to imply that the entities, materials, or equipment are necessarily the best available for the purpose.
National Institute of Standards and Technology Interagency or Internal Report 7383 Natl. Inst. Stand. Technol. Interag. Intern. Rep. 7383, 157 pages (May 2019)
This publication is available free of charge from: https://doi.org/10.6028/NIST.IR.7383-2019
iii
Foreword
This NISTIR of Selected Publications was updated in 2019 from earlier versions published in 2006, 2012, and 2017 and includes Good Laboratory Practices, Good Measurement Practices, and Standard Operating Procedures for volumetric calibrations.
Primary changes in 2019 were to include the following items: • Incorporation of F-tests and t-tests consistent with changes added to NISTIR 6969
(2018, 2019) and NISTIR 5672 (2018, 2019);• Incorporation of Conformity Assessment guidance in the Calibration Certificate
section of the SOPs for calibrations (to perform conformity assessment whereapplicable) and other requirements of ISO/IEC 17025:2017 where applicable;
• Clarify sections and correct typographical errors based on inquiries and feedbackfrom users; and
• Improve formatting and file navigation to meet accessibility requirements.
Procedures were reviewed at 2012 Regional Measurement Assurance Program meetings with input provided by working metrologists who have implemented these procedures in their laboratories. As a result, additional updates were required in 2013. Intermediate updates of procedures after 2013 were compiled in the 2017 version as noted below.
• SOP 14, 18, 19, 26 (revised January 2016) to explicitly calculate and report themean volume and enter values from Run 1 and Run 2 into standard deviationcharts.
• SOP 21 (revised March 2017) to remove the neck calibration procedure and refinethe measurement process. The revision also includes calculations and correctionsfor the volume at 60 °F and 100 psig. Was also revised in January 2016 toexplicitly calculate and report the mean volume and enter values from Run 1 andRun 2 into standard deviation charts.
• SOP 31 (new March 2017) to create a separate procedure for prover and testmeasure calibrations.
Updates to the 2013 edition included the latest CIPM accepted equations for the calculation of water density in GLP 10. SOP 17 and 20 were modified so that they apply to control charts for check standards, standard deviation charts, and range charts for any process with replicate measurements (versus only those for volume transfer calibrations as previously written).
The calibration procedures for Small Volume Provers (SOP 26, Volumetric, and SOP-SVP, Gravimetric) were revised and replaced SOP 26 for generic “Gravimetric Calibrations of Dynamic Volumetric Standards” which includes Small Volume Provers and alternative standards in the 2013 edition.
The following Practices and Procedures that were included in the 2006 edition were removed in the 2012 publication:
This publication is available free of charge from: https://doi.org/10.6028/N
IST.IR.7383 -2019
iv
Standard Operating Procedures for: • Gravimetric Volume Calibrations Using a Single-Pan Balance (13) and Using
Equal Arm Balances (15). Contents specific to glassware calibrations have beenincluded in SOP 14. Few laboratories maintain mechanical balances or equal armbalances for gravimetric calibrations, therefore, these procedures will no longer beupdated.
Many of these procedures are updates to procedures that were originally published in NBS Handbook 145, Handbook for the Quality Assurance of Metrological Measurements, in 1986, by Henry V. Oppermann and John K. Taylor. The 2006 updates incorporated many of the requirements noted for procedures in ISO Guide 25, ANSI/NCSL Z 540-1-1994, and ISO/IEC 17025 laboratory [quality] management systems. The 2006 changes incorporated 1) uncertainty analyses that comply with current international methods in the Guide to the Expression of Uncertainty in Measurements (GUM) and 2) measurement assurance techniques using check standards. The 2012 updates included updated terminology consistent with the International Vocabulary of Metrology (VIM), primarily associated with metrological traceability. The 2013 update includes data sheets and example uncertainty budget tables in all SOPs.
Note regarding SI units: This publication conforms to the concept of primary use of the International System of Units (SI) recommended in the Omnibus Trade and Competitiveness Act of 1988 by citing SI units before customary units where both units appear together and placing separate sections containing requirements for SI units before corresponding sections containing requirements for customary units. In some cases, however, laboratory standards and/or trade practice are currently restricted to the use of customary units (e.g., retail sale of gasoline in the United States is still sold by U.S. gallons); therefore, some procedures in this publication specify only customary units. Non-SI units are predominately in common use in State legal metrology laboratories, and/or the petroleum industry for many volumetric measurements, therefore non-SI units have been used to reflect the practical needs of the laboratories performing these measurements as appropriate. SI units are used where practical, and where use or potential conversion errors, will not likely impact the quality of laboratory measurement results.
Endorsement Disclaimer Certain commercial equipment, instruments, or materials are identified in this publication in order to specify the experimental procedure adequately. Such identification is not intended to imply recommendation or endorsement by the National Institute of Standards and Technology, nor is it intended to imply that the materials or equipment identified are necessarily the best available for the purpose.
This publication is available free of charge from: https://doi.org/10.6028/N
IST.IR.7383 -2019
v
This publication is available free of charge from: https://doi.org/10.6028/N
IST.IR.7383 -2019
Table of Contents
Foreword iii
Good Laboratory Practices
10 Purity of Water GLP 10-1 13 Drying “To Contain” Volume Standards GLP 13-1
Good Measurement Practices
3 Method of Reading A Meniscus Using Water or Other Wetting Liquid
GMP 3-1
6 Cleaning Metal Volumetric Measures GMP 6-1 7 Cleaning Precision Glassware GMP 7-1
Standard Operating Procedures
14 Gravimetric Calibration of Volumetric Ware Using an Electronic Balance
SOP 14-1
16 Calibration of Measuring Flasks, Volume Transfer Method SOP 16-1 17 Control Charts of Laboratory Owned Check Standards for
Calibration of Measuring Flasks or Small Provers using Volume Transfer Methods
SOP 17-1
18 Calibration of Graduated Neck-Type Metal Volumetric Field Standards, Volumetric Transfer Method
SOP 18-1
19 Calibration of Large Neck-Type Metal Provers, Volume Transfer Method
SOP 19-1
20 Control Charts for Calibration of Neck Type Provers, Volume Transfer Method
SOP 20-1
21 Calibration of LPG Provers SOP 21-1 26 Gravimetric Calibration of Dynamic Volumetric Standards SOP 26-1 31 Scale Plate Calibration for Volumetric Field Standards SOP 31-1

vi
This publication is available free of charge from: https://doi.org/10.6028/N
IST.IR.7383 -2019
This page intentionally left blank.
This publication is available free of charge from: https://doi.org/10.6028/N
IST.IR
.7383-2019
Good Laboratory Practices

This publication is available free of charge from: https://doi.org/10.6028/N
IST.IR
.7383-2018
This page is intentionally blank.
GLP 10 – 2019 Page 1 of 6
This publication is available free of charge from: https://doi.org/10.6028/N
IST.IR.7383 -2019
GLP 10
Good Laboratory Practice for the
Purity of Water
1 Water for volume calibrations.
Water is used in two ways in the metrology laboratory. It may be used as a cleaning fluid. It may also be used as a transfer medium in volume transfer calibrations, or as standard reference material for gravimetric volume calibrations. In each of these cases, the water must be clean; in the case of gravimetric volume calibrations it must be pure, as well.
Dirty water can cause many measurement problems, including depositing residues in a volumetric vessel that could cause volumetric errors or could soil its interior. When in doubt of the cleanliness of the water supply, filters should be attached to the supply lines used.
Cleanliness of water may be achieved by removal of physical contaminating substances, especially by filtration. City water is ordinarily clean but may become dirty from the distribution system and especially from prolonged standing in some kinds of pipes and tubing. Hoses used to transfer water from and into large vessels and tanks may need internal cleaning, as well. Flushing to remove visible contamination is all that is usually required prior to use in volume transfer calibrations or prior to further purification.
2 Clean Water used in Volume Transfer Calibrations
Clean water is all that is necessary when making measurements by volumetric transfer since volumetric comparisons are involved. When the water density value is used in a volume transfer equation, the ratio of the density values of clean water versus pure water is essentially unchanged, despite impurities. The coefficient of expansion for distilled water and pure water are also essentially the same.
Note: the equations used in gravimetric calibrations do not use ratios and systematic errors will result in the calibration relative to impurities in the water. The use of low resolution density meters for evaluating the quality of clean water (instead of using pure water as described) is discouraged for use in gravimetric calibrations.
3 Pure Water used in Gravimetric Volume Calibrations
Pure water is needed for gravimetric volume calibrations. For gravimetric calibrations, filtration systems alone are not adequate. Pure water requires the removal of chemical contaminants and this may be achieved by distillation, reverse osmosis, ion exchange systems, or combinations of these systems. The purity of the water from any given system and maintenance requirement is often dependent on the quality of the source water. Source water should be tested to determine the best type of system to meet laboratory needs. Density calculations may be accurate even when appreciable levels of dissolved salts remain in the water. However, since it is very difficult to know what type and quantity of

GLP 10 – 2019 Page 2 of 6
This publication is available free of charge from: https://doi.org/10.6028/N
IST.IR.7383 -2019
salts are tolerable before density is affected, it is prudent to use the best system practical within budgetary constraints.
4 Water Quality Specifications and Purification Methods
Water that has electrical conductivity of ≤ 5 μS/cm is recommended as adequate for gravimetric calibration purposes. Such water may be produced by distillation, ion exchange, continuous electrodeionization reverse osmosis, electrodialysis, or a combination thereof, followed by polishing with a 0.45 µm membrane filter. The type of systems recommended here will typically provide water quality that meets Type I specifications and are relatively inexpensive for smaller quantities.
The ASTM D-11931 specifications for conductivity and resistivity are noted in Table 1. Alternatively, a similar ISO 3696 standard2 may be used.
Table 1. Conductivity and resistivity specifications for water from ASTM D-1193. Type I Type II Type III Type IV
Electrical conductivity, max, µS/cm at 298 K (25 °C) 0.056 1.0 0.25 5.0
Electrical resistivity, min, MΩ·cm at 298 K (25 °C) 18 1.0 4.0 0.20
Conductivity or resistivity (along with other water quality measurements) are often used to assess the water quality used in cooling towers, boilers, relative humidity systems, micro and nanoelectronic systems and in pharmaceuticals, to ensure water of sufficient purity and to minimize corrosion or build-up within such systems.
Conductivity and resistivity measurements do not have a direct correlation to water density, which is the critical attribute of concern for gravimetric volume calibrations. However, conductivity or resistivity measurements are a good indicator of water quality and whether the system is in good operating condition or needs service. Conductivity is simply the reciprocal of resistivity. For water quality specifications and assessment purposes, conductivity is usually measured in microSiemens per centimeter (µS/cm) and resistivity is usually measured in megaohms-centimeter (MΩ·cm), both usually at a reference temperature of 25 ºC. Conductivity is greatly influenced by temperature and is not linear. However, this is not a major concern for typical laboratory applications requiring pure water. Either a meter or indicator light should be included in laboratory systems to monitor water quality output. Standard reference materials are available to test conductivity and resistivity units. But, because the measurement values are used to assess quality, but not used to perform corrections to volume calibrations, traceable calibrations of the units are not essential.
Most manufacturers of systems at this level indicate that the resulting water will meet Type I specifications. The ASTM standard D 1193 also specifies design qualifications, installation qualifications, operational qualifications, and performance qualifications. In
1ASTM D 1193 - (06)2018, Standard Specification for REAGENT WATER, ASTM, http://www.astm.org, 1916 Race St., Philadelphia, PA 19103. 2 ISO 3696:1995 Water for Analytical Laboratory Use. Specification and Test Methods.
GLP 10 – 2019 Page 3 of 6
This publication is available free of charge from: https://doi.org/10.6028/N
IST.IR.7383 -2019
addition, D 1193 specifies that preventive maintenance shall be performed on a regular basis and not less than once per year. Sales literature will usually specify whether the equipment will provide water of the designated quality. Additionally, many manufacturers will provide a source water quality test and recommend a system to meet the purity and volume requirements of the laboratory.
A cartridge-type ion-exchange system is recommended for its simplicity and ease of operation. It can operate intermittently (on demand) and requires little or no maintenance except for change of cartridges, the need for which will be indicated. A relatively small system (2 L/h to 30 L/h) is adequate for laboratories calibrating glassware and test measures up to and including 20 L (5 gal) standards. It may be used on demand or to fill a small (20 L to 40 L) storage bottle to assure a continuous supply of calibration water.
There are two broad types of ion-exchange systems. Pressure cartridge systems (PCS) operate directly from line pressure (up to 700 kPa) and need no special operation precautions. The less expensive type operates from the water line through a needle valve to produce a specified flow through the cartridge(s). In this system, the outlet must not become blocked or turned off to prevent the water pressure from building up and bursting the cartridge. It is common practice to plumb directly from the output of this cartridge to a storage tank without using a valve in between. The unit is operated by simply turning the shut-off valve located at the water supply.
5 Water Density Measurements
Water density may be measured with a five- or six-place oscillation-type density meter calibrated using suitable standard reference materials that are representative of the range of use. These systems typically measure the density at a specific reference temperature (generally 20 ºC). However, density meters are generally not needed if an appropriate water purification system is used that includes a way to measure conductivity or resistivity and where outside validation of water quality has been obtained. If a density meter is used to determine actual density of water as a calibration medium in instances where water is not of the purity specified by this GLP for gravimetric calibrations, accuracy and traceability of the measurement results must be verified.
One method that may be used in the laboratory for monitoring water over time is to maintain a quality assurance reference flask (QARF) that is calibrated at any time a gravimetric calibration is performed. If the results of a proficiency test (interlaboratory comparison) that is conducted at the same time are found acceptable, one can assume that the quality of the water was acceptable on that day. In this way, the reference value for the flask may be monitored over time. Glassware is unlikely to change with use of pure water; thus, significant changes on a control chart for a QARF indicate other problems that may need to be investigated such as water quality or other changes in the calibration system or process.
Exposure of pure water in storage to air will likely cause degradation in the conductivity and/or resistivity measurements. However, pure water has been stored for over a year with little degradation in the density quality (if/when storage containers and lines are clean and that there is no bacterial growth, algae, or other contamination).
GLP 10 – 2019 Page 4 of 6
This publication is available free of charge from: https://doi.org/10.6028/N
IST.IR.7383 -2019
Temperature equilibrium is a critical factor in the density stability of water. This is especially important for large volumes. Water temperatures must be stable throughout the container with thermal gradients minimized to the extent possible and applicable. Temperature accuracy is as important as purity for a correct density determination. If water is coming straight from the tap through the purification system into the prover, the temperature may fluctuate appreciably. Therefore, it is important to store an adequate volume of water needed to complete a calibration that is either already purified or ready to enter the system.
6 Water Density Calculations
Water density tables (see Table 9.8 in NISTIR 6969) or calculations are required for most gravimetric calculations. For use in computer programs (most often spreadsheets), the use of calculations is preferred to the use of look-up tables.
Air-free water density calculation
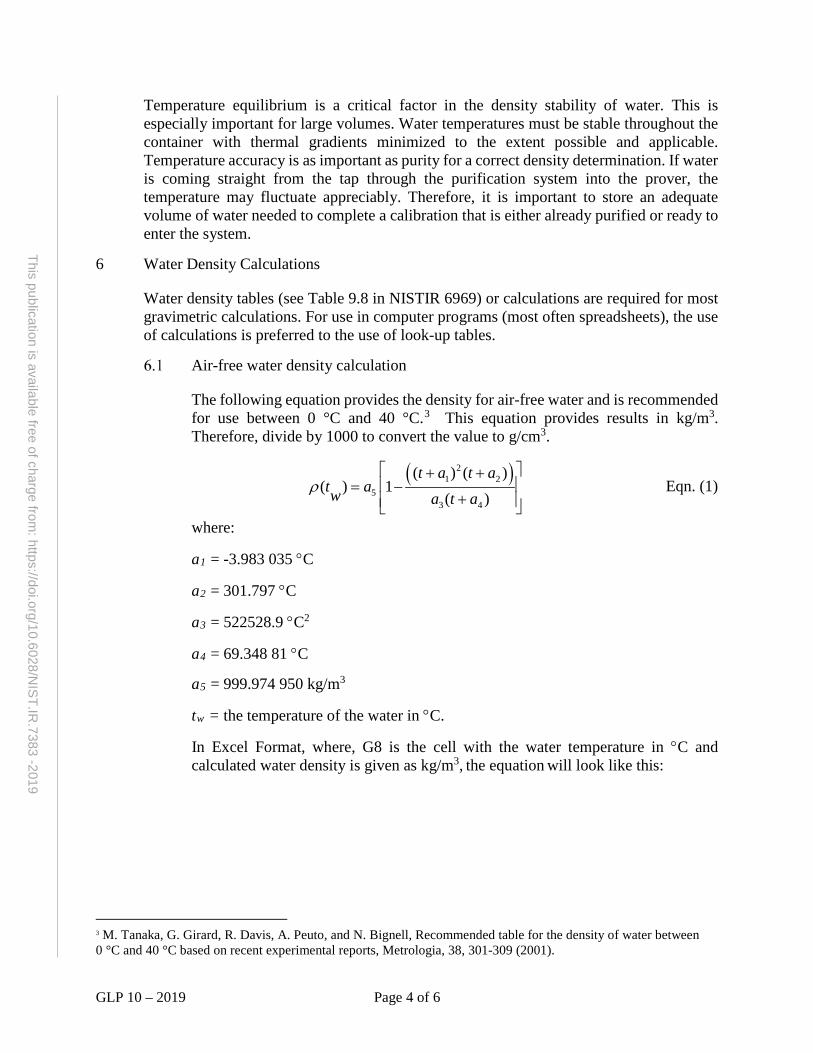
The following equation provides the density for air-free water and is recommended for use between 0 °C and 40 °C.3 This equation provides results in kg/m3. Therefore, divide by 1000 to convert the value to g/cm3.
( )21 2
53 4
( ) ( )( ) 1
( )
t a t at aw a t a
ρ + + = −
+ Eqn. (1)
where:
a1 = -3.983 035 °C
a2 = 301.797 °C
a3 = 522528.9 °C2
a4 = 69.348 81 °C
a5 = 999.974 950 kg/m3
tw = the temperature of the water in °C.
In Excel Format, where, G8 is the cell with the water temperature in °C and calculated water density is given as kg/m3, the equation will look like this:
3 M. Tanaka, G. Girard, R. Davis, A. Peuto, and N. Bignell, Recommended table for the density of water between 0 °C and 40 °C based on recent experimental reports, Metrologia, 38, 301-309 (2001).
GLP 10 – 2019 Page 5 of 6
This publication is available free of charge from: https://doi.org/10.6028/N
IST.IR.7383 -2019
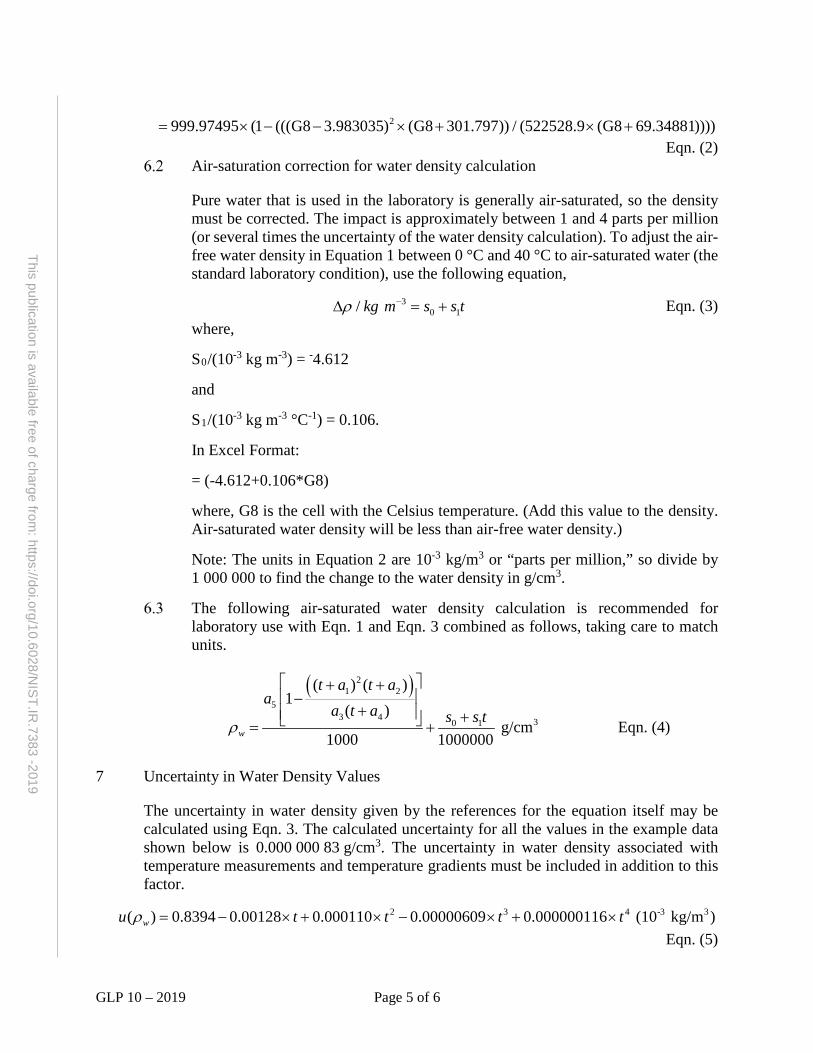
2999.97495 (1 (((G8 3.983035) (G8 301.797)) / (522528.9 (G8 69.34881))))= × − − × + × +Eqn. (2)
Air-saturation correction for water density calculation
Pure water that is used in the laboratory is generally air-saturated, so the density must be corrected. The impact is approximately between 1 and 4 parts per million (or several times the uncertainty of the water density calculation). To adjust the air-free water density in Equation 1 between 0 °C and 40 °C to air-saturated water (the standard laboratory condition), use the following equation,
30 1/ kg m s s tρ −∆ = + Eqn. (3)
where,
S0/(10-3 kg m-3) = -4.612
and
S1/(10-3 kg m-3 °C-1) = 0.106.
In Excel Format:
= (-4.612+0.106*G8)
where, G8 is the cell with the Celsius temperature. (Add this value to the density. Air-saturated water density will be less than air-free water density.)
Note: The units in Equation 2 are 10-3 kg/m3 or “parts per million,” so divide by 1 000 000 to find the change to the water density in g/cm3.
The following air-saturated water density calculation is recommended for laboratory use with Eqn. 1 and Eqn. 3 combined as follows, taking care to match units.
( )21 2
53 4 30 1
( ) ( )1
( ) g/cm
1000 1000000w
t a t aa
a t a s s tρ
+ + −
+ + = + Eqn. (4)
7 Uncertainty in Water Density Values
The uncertainty in water density given by the references for the equation itself may be calculated using Eqn. 3. The calculated uncertainty for all the values in the example data shown below is 0.000 000 83 g/cm3. The uncertainty in water density associated with temperature measurements and temperature gradients must be included in addition to this factor.
2 3 4 -3 3( ) 0.8394 0.00128 0.000110 0.00000609 0.000000116 (10 kg/m )wu t t t tρ = − × + × − × + ×Eqn. (5)
GLP 10 – 2019 Page 6 of 6
This publication is available free of charge from: https://doi.org/10.6028/N
IST.IR.7383 -2019
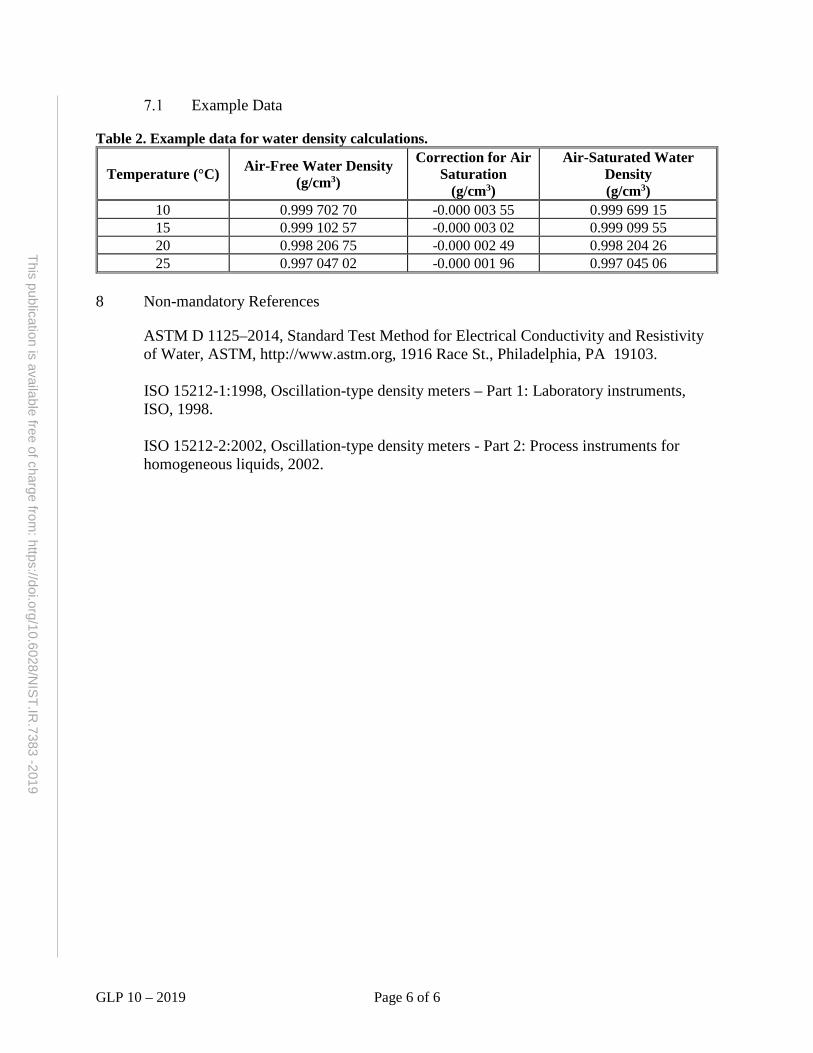
Example Data
Table 2. Example data for water density calculations.
Temperature (°C) Air-Free Water Density (g/cm3)
Correction for Air Saturation
(g/cm3)
Air-Saturated Water Density (g/cm3)
10 0.999 702 70 -0.000 003 55 0.999 699 15 15 0.999 102 57 -0.000 003 02 0.999 099 55 20 0.998 206 75 -0.000 002 49 0.998 204 26 25 0.997 047 02 -0.000 001 96 0.997 045 06
8 Non-mandatory References
ASTM D 1125–2014, Standard Test Method for Electrical Conductivity and Resistivity of Water, ASTM, http://www.astm.org, 1916 Race St., Philadelphia, PA 19103.
ISO 15212-1:1998, Oscillation-type density meters – Part 1: Laboratory instruments, ISO, 1998.
ISO 15212-2:2002, Oscillation-type density meters - Part 2: Process instruments for homogeneous liquids, 2002.
GLP 13 – 2019 Page 1 of 2
This publication is available free of charge from: https://doi.org/10.6028/N
IST.IR.7383 -2019
GLP 13 Good Laboratory Practice
for Drying “To Contain” Volume Standards
1 Purpose for drying
Vessels calibrated "To Contain"(TC) must be dried of all measurable water to obtain an "empty" weight. The drying process should not contaminate the container; otherwise, it will need to be re-cleaned before further calibration or volumetric use. The following is presented as guidance when drying is required.
2 Methods for drying
Drain as much of the residual water as practical before starting any drying process. If time is not a consideration, a glass tube may be inserted into the container to blow clean dry air (or nitrogen) through it to evaporate the residual water film. A filter or dust trap may be necessary to pre-clean the air used. Air lines must be selected to ensure that aging and wear do not introduce contaminants. Air may be drawn through a tube connected to a vacuum pump, but with some danger of drawing in dirty air from the surroundings. Clean absorbent cotton placed at the neck opening can minimize the entrance of foreign matter. Compressed air systems may introduce finely atomized oils or moisture into the air which may not be visible. If laboratory quality air is not available, nitrogen may be used.
Cleaning with solvents may be performed; ethanol is the preferred medium. Preliminary rinsing with acetone will remove large amounts of water, with which it is infinitely miscible, but this solvent often contains impurities such as traces of oils that could deposit on the container walls and be a disposal problem. Thus, a final alcohol (preferably ethanol or methanol) rinse is recommended, even if acetone is used to remove most of the water. Care must be taken to ensure that the alcohol is not mixed with acetone, and that the alcohol is not denatured with oils to an extent that will leave residue on the standard. The alcohol is drained as much as possible, followed by air drying as described above.
Some metal containers may be internally coated to minimize corrosion. When present, it should be ascertained that such coatings are not affected by alcohol or acetone; otherwise, solvent treatments should not be used.
The external surfaces of all containers should be clean when gravimetric calibrations are performed. Otherwise, any removal of external dust or dirt during the measurement process could cause errors of unknown magnitude.
Analytical glassware should not be dried by heating in an oven as the glass may suffer non-elastic expansion and put the glassware out of calibration.
Calibration Tip
Cover a vessel after it is clean and dry to minimize contaminants from collecting inside the vessel. Clean and dry the flask one to two days prior to the calibration
GLP 13 – 2019 Page 2 of 2
This publication is available free of charge from: https://doi.org/10.6028/N
IST.IR.7383 -2019
and allow the flask to come to equilibrium with the environment. Obtain an initial baseline “dry weight” of the clean container for use as a dry reference weight on subsequent weighing and drying cycles.
Safety Note
Safety Data Sheets (SDSs) must be available in the laboratory and should be reviewed to ensure safe handling and disposal of all chemicals noted in this procedure. Care must be taken to avoid mixing chemicals such as acetone and alcohols in the laboratory.
This publication is available free of charge from: https://doi.org/10.6028/N
IST.IR
.7383-2019
Good Measurement Practices

This publication is available free of charge from: https://doi.org/10.6028/N
IST.IR
.7383-2018
This page is intentionally blank.
GMP 3 – 2019 Page 1 of 7
This publication is available free of charge from: https://doi.org/10.6028/N
IST.IR.7383 -2019
GMP 3
Good Measurement Practice for
Method of Reading a Meniscus Using Water or Other Wetting Liquid
1 Meniscus Reading in Calibrations
The meniscus of most liquids used in volumetric calibrations is concave-up, with the lowest point in the center that is used to determine the meniscus reading. The curvature of a meniscus is related to the surface tension of the liquid and inversely related to the diameter of the tubing in which it is formed. When reading any meniscus, it is important to ascertain that it is in an equilibrium position. Tapping of sight glasses and/or small motions of containers may be used to induce slight displacements of the meniscus. Return to the same reading is evidence of a stable meniscus.
The meniscus formed by a non-wetting liquid, such as mercury (Hg), is convex with the highest point in the center and is no longer regularly used for volumetric calibrations. In the case of a convex meniscus, the highest point is used to make the reading. The reading of a mercury barometer or thermometer is a classic example of this kind.
In all apparatus where the volume is defined by a concave-up meniscus, the setting or reading is made on the lowest point of the meniscus. In order that the lowest point may be observed, it is necessary to place a shade of some dark material immediately below the meniscus, which renders the profile of the meniscus dark and clearly visible against a light background. A convenient device for this purpose is a collar-shaped section of thick black rubber tubing, cut open at one side and of such size as to clasp the tube firmly.
2 Types of Meniscus Readers
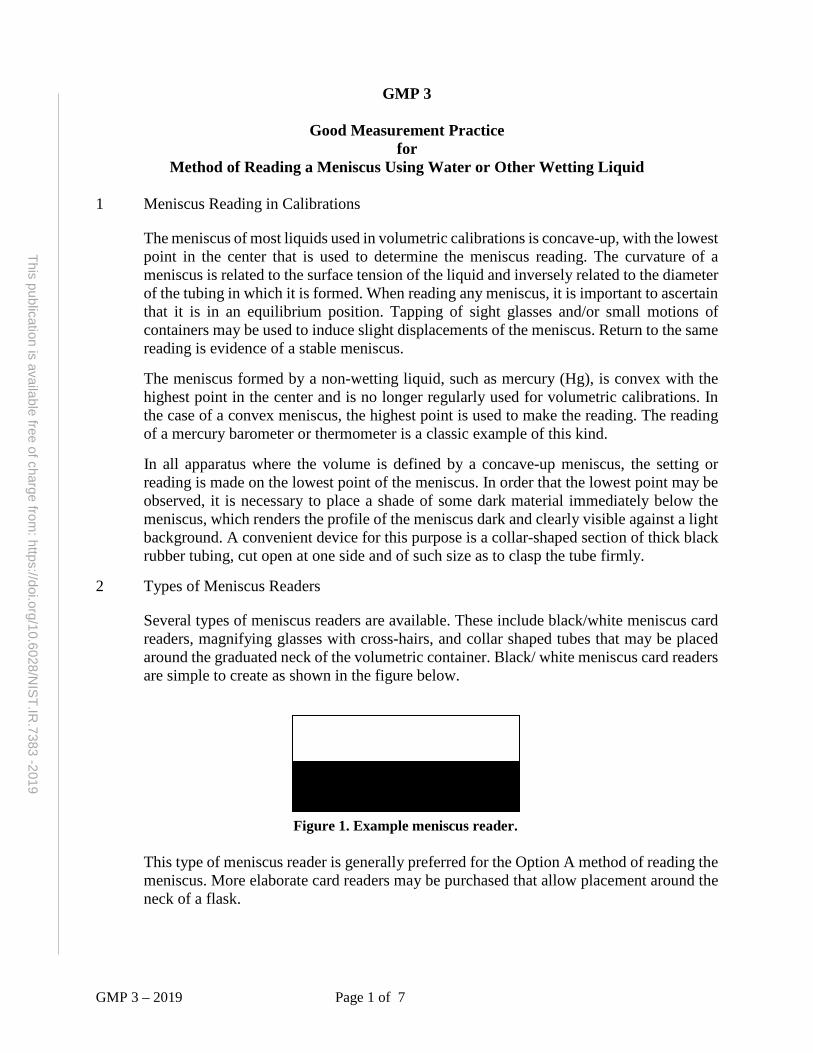
Several types of meniscus readers are available. These include black/white meniscus card readers, magnifying glasses with cross-hairs, and collar shaped tubes that may be placed around the graduated neck of the volumetric container. Black/ white meniscus card readers are simple to create as shown in the figure below.
This type of meniscus reader is generally preferred for the Option A method of reading the meniscus. More elaborate card readers may be purchased that allow placement around the neck of a flask.
Figure 1. Example meniscus reader.
GMP 3 – 2019 Page 2 of 7
This publication is available free of charge from: https://doi.org/10.6028/N
IST.IR.7383 -2019
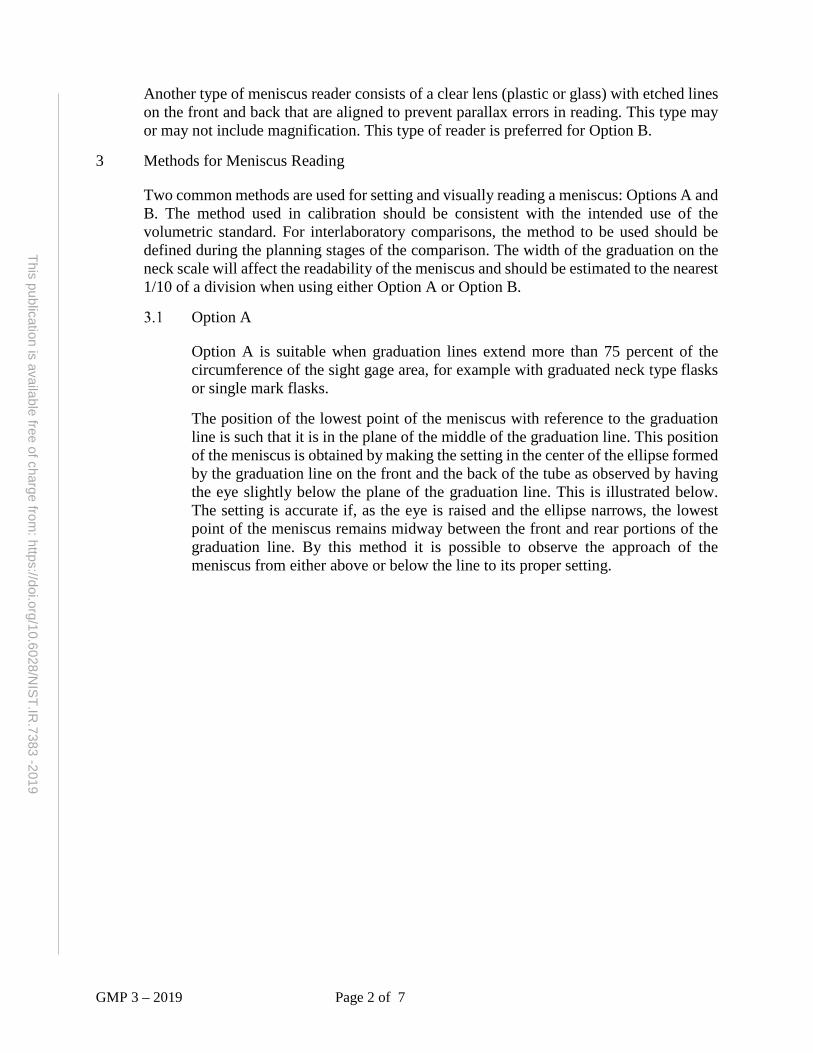
Another type of meniscus reader consists of a clear lens (plastic or glass) with etched lines on the front and back that are aligned to prevent parallax errors in reading. This type may or may not include magnification. This type of reader is preferred for Option B.
3 Methods for Meniscus Reading
Two common methods are used for setting and visually reading a meniscus: Options A and B. The method used in calibration should be consistent with the intended use of thevolumetric standard. For interlaboratory comparisons, the method to be used should bedefined during the planning stages of the comparison. The width of the graduation on theneck scale will affect the readability of the meniscus and should be estimated to the nearest1/10 of a division when using either Option A or Option B.
Option A
Option A is suitable when graduation lines extend more than 75 percent of the circumference of the sight gage area, for example with graduated neck type flasks or single mark flasks.
The position of the lowest point of the meniscus with reference to the graduation line is such that it is in the plane of the middle of the graduation line. This position of the meniscus is obtained by making the setting in the center of the ellipse formed by the graduation line on the front and the back of the tube as observed by having the eye slightly below the plane of the graduation line. This is illustrated below. The setting is accurate if, as the eye is raised and the ellipse narrows, the lowest point of the meniscus remains midway between the front and rear portions of the graduation line. By this method it is possible to observe the approach of the meniscus from either above or below the line to its proper setting.

GMP 3 – 2019 Page 3 of 7
This publication is available free of charge from: https://doi.org/10.6028/N
IST.IR.7383 -2019
Figure 2. Front and side view of reading a meniscus (Option A).
Option B
Option B, is typically used with opaque liquids or when the graduation mark does not extend around the circumference of the volumetric standard. (Option B is also referenced in several ISO and OIML standards for glassware, thus it is important to review meniscus reading practices with the user.)
In setting the meniscus or taking a reading, the observer's eye should be normal to and in the same horizontal plane as the meniscus. The illumination is adjusted to get a sharp definition of the meniscus. Elimination of parallax error is very important and can be judged by slight fluctuations of eye level that do not affect the reading.
The position of the lowest point of the meniscus with reference to the graduation line is horizontally tangent to the plane of the upper edge of the graduation line. The position of the meniscus is obtained by having the eye in the same plane of the upper edge of the graduation line as shown below. Offsets from reading in the same plane will produce parallax errors.
Front Side of Index Line
Meniscus Surface
Rear Side of Index Line
FRONT VIEW
Observer’s View from Slightly Below the Horizontal Level of the Graduation Line.
SIDE VIEW
Exaggerated Curvature Meniscus Surface
Circumferential Graduation Line
Line-of-Sight to Front Side of Index
Observer’s Eye
Line-of-Sight to Rear Side of Index Line-of-Sight to
Meniscus
Black Rubber Opaque Screen Placed a Fraction of a Millimeter Below the Graduation Line (or a Card Reader with the Black Side on the Bottom.)
GMP 3 – 2019 Page 4 of 7
This publication is available free of charge from: https://doi.org/10.6028/N
IST.IR.7383 -2019
Comparison of Option A and Option B Methods
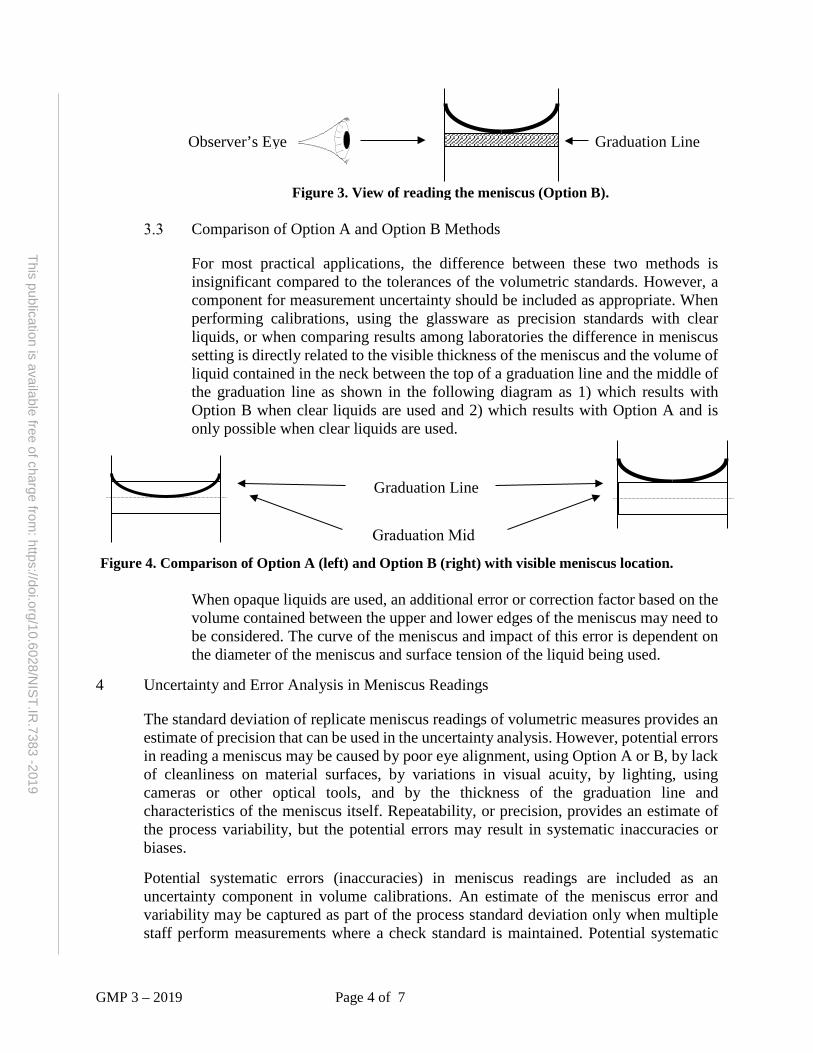
For most practical applications, the difference between these two methods is insignificant compared to the tolerances of the volumetric standards. However, a component for measurement uncertainty should be included as appropriate. When performing calibrations, using the glassware as precision standards with clear liquids, or when comparing results among laboratories the difference in meniscus setting is directly related to the visible thickness of the meniscus and the volume of liquid contained in the neck between the top of a graduation line and the middle of the graduation line as shown in the following diagram as 1) which results with Option B when clear liquids are used and 2) which results with Option A and is only possible when clear liquids are used.
When opaque liquids are used, an additional error or correction factor based on the volume contained between the upper and lower edges of the meniscus may need to be considered. The curve of the meniscus and impact of this error is dependent on the diameter of the meniscus and surface tension of the liquid being used.
4 Uncertainty and Error Analysis in Meniscus Readings
The standard deviation of replicate meniscus readings of volumetric measures provides an estimate of precision that can be used in the uncertainty analysis. However, potential errors in reading a meniscus may be caused by poor eye alignment, using Option A or B, by lack of cleanliness on material surfaces, by variations in visual acuity, by lighting, using cameras or other optical tools, and by the thickness of the graduation line and characteristics of the meniscus itself. Repeatability, or precision, provides an estimate of the process variability, but the potential errors may result in systematic inaccuracies or biases.
Potential systematic errors (inaccuracies) in meniscus readings are included as an uncertainty component in volume calibrations. An estimate of the meniscus error and variability may be captured as part of the process standard deviation only when multiple staff perform measurements where a check standard is maintained. Potential systematic
Graduation Line Observer’s Eye
Graduation Line
Graduation Mid
Figure 3. View of reading the meniscus (Option B).
Figure 4. Comparison of Option A (left) and Option B (right) with visible meniscus location.
GMP 3 – 2019 Page 5 of 7
This publication is available free of charge from: https://doi.org/10.6028/N
IST.IR.7383 -2019
variability is not captured using standard deviation or range charts alone because the process for each person may be repeatable, but accuracy of meniscus reading cannot be assessed without using a check standard or making special efforts to capture meniscus reading differences among staff.
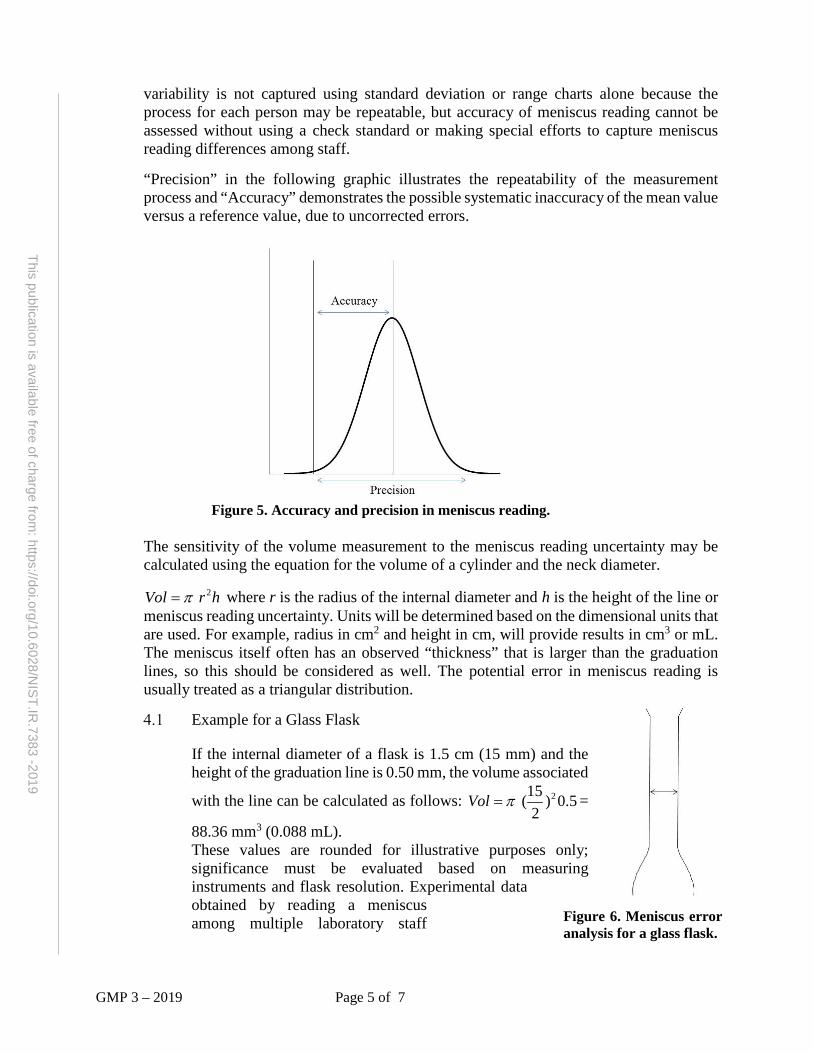
“Precision” in the following graphic illustrates the repeatability of the measurement process and “Accuracy” demonstrates the possible systematic inaccuracy of the mean value versus a reference value, due to uncorrected errors.
The sensitivity of the volume measurement to the meniscus reading uncertainty may be calculated using the equation for the volume of a cylinder and the neck diameter.
2 Vol r hπ= where r is the radius of the internal diameter and h is the height of the line or meniscus reading uncertainty. Units will be determined based on the dimensional units that are used. For example, radius in cm2 and height in cm, will provide results in cm3 or mL. The meniscus itself often has an observed “thickness” that is larger than the graduation lines, so this should be considered as well. The potential error in meniscus reading is usually treated as a triangular distribution.
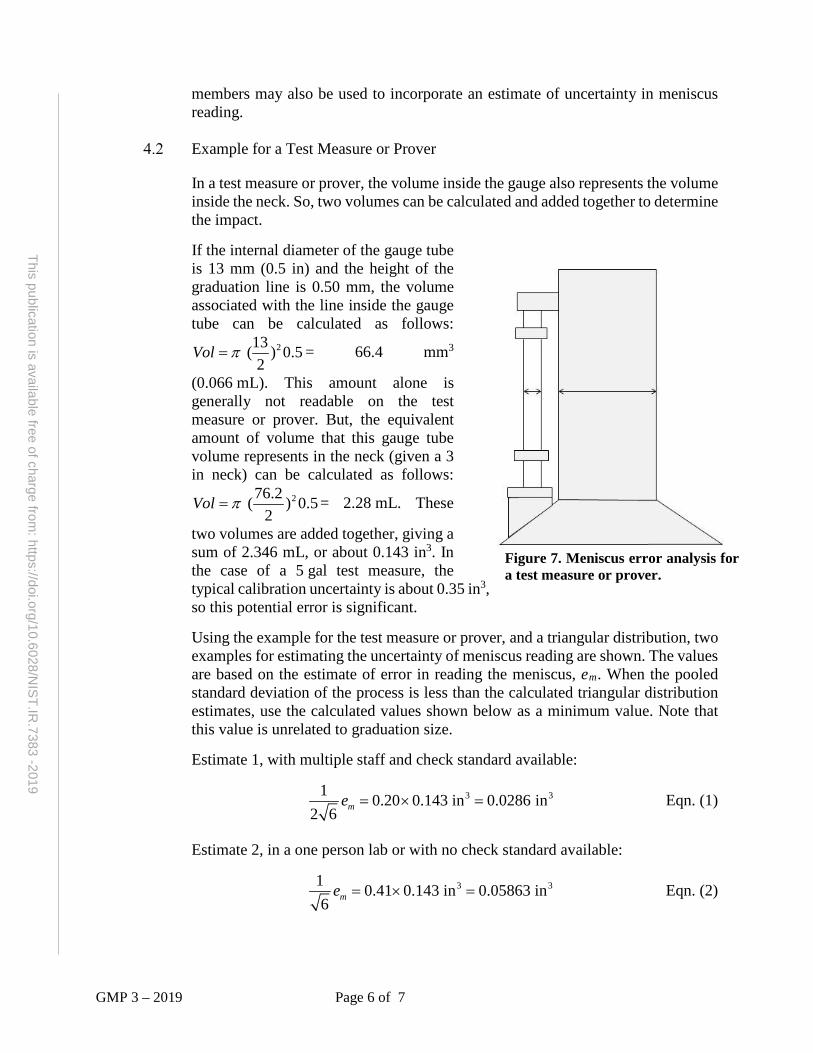
Example for a Glass Flask
If the internal diameter of a flask is 1.5 cm (15 mm) and the height of the graduation line is 0.50 mm, the volume associated
with the line can be calculated as follows: 215 ( ) 0.52
Vol π= =
88.36 mm3 (0.088 mL). These values are rounded for illustrative purposes only; significance must be evaluated based on measuring instruments and flask resolution. Experimental data obtained by reading a meniscus among multiple laboratory staff
Figure 5. Accuracy and precision in meniscus reading.
Figure 6. Meniscus error analysis for a glass flask.
GMP 3 – 2019 Page 6 of 7
This publication is available free of charge from: https://doi.org/10.6028/N
IST.IR.7383 -2019
members may also be used to incorporate an estimate of uncertainty in meniscus reading.
Example for a Test Measure or Prover
In a test measure or prover, the volume inside the gauge also represents the volume inside the neck. So, two volumes can be calculated and added together to determine the impact.
If the internal diameter of the gauge tube is 13 mm (0.5 in) and the height of the graduation line is 0.50 mm, the volume associated with the line inside the gauge tube can be calculated as follows:
213 ( ) 0.52
Vol π= = 66.4 mm3
(0.066 mL). This amount alone is generally not readable on the test measure or prover. But, the equivalent amount of volume that this gauge tube volume represents in the neck (given a 3 in neck) can be calculated as follows:
276.2 ( ) 0.52
Vol π= = 2.28 mL. These
two volumes are added together, giving a sum of 2.346 mL, or about 0.143 in3. In the case of a 5 gal test measure, the typical calibration uncertainty is about 0.35 in3, so this potential error is significant.
Using the example for the test measure or prover, and a triangular distribution, two examples for estimating the uncertainty of meniscus reading are shown. The values are based on the estimate of error in reading the meniscus, em. When the pooled standard deviation of the process is less than the calculated triangular distribution estimates, use the calculated values shown below as a minimum value. Note that this value is unrelated to graduation size.
Estimate 1, with multiple staff and check standard available:
3 31 0.20 0.143 in 0.0286 in2 6 me = × = Eqn. (1)
Estimate 2, in a one person lab or with no check standard available:
3 31 0.41 0.143 in 0.05863 in6 me = × = Eqn. (2)
Figure 7. Meniscus error analysis for a test measure or prover.
GMP 3 – 2019 Page 7 of 7
This publication is available free of charge from: https://doi.org/10.6028/N
IST.IR.7383 -2019
These values are rounded for illustrative purposes only; actual significance must be evaluated based on measuring instruments and resolutions. Experimental data obtained by reading a meniscus among multiple laboratory staff members may also be used to incorporate an estimate of uncertainty in meniscus reading provided the examples and assessments are fully documented.

This page is intentionally blank.
This publication is available free of charge from: https://doi.org/10.6028/N
IST.IR
.7383-2019
GMP 6 – 2019 Page 1 of 2
This publication is available free of charge from: https://doi.org/10.6028/N
IST.IR.7383 -2019
GMP 6
Good Measurement Practice for
Cleaning Metal Volumetric Measures
1 Cleanliness requirements
All volumetric test measures, including laboratory standards and those submitted for calibration must be clean at the time of measurement. Drainage is altered by greasy and oily surfaces. Corroded surfaces raise questions that impair future use, so corrosion-damaged containers may not be worth testing. Maintaining clean volumetric test measures improves reproducibility of delivered volume between calibration and usage.
Many laboratories will not accept test measures and provers for calibration unless they have been suitably cleaned to remove contents such as petroleum or other chemical residues. In those cases, all surfaces (inside and out), drain lines, pumps, and hoses that may be used during the calibration process must be cleaned so that no petroleum or other product residue remains that would otherwise spill onto the laboratory floor or drain into the sewer/waste-water system.
2 Cleaning methods
Metal measuring vessels are best cleaned by using a non-foaming dishwashing detergent. Warm water is most effective both for cleaning and rinsing, which must be thorough. If warm water cleaning and rinsing is used, the vessel must be equilibrated to calibration temperatures before use or calibration.
The cleaning operation involves the use of a liberal amount of the detergent solution and vigorous shaking, swirling, or other motion so that the solution contacts the entire inner surface of the vessel. Depending on the condition of the surface, this operation should be repeated one or more times to ensure removal of oily films and residues. As much as possible of the detergent solution should be drained prior to the water rinses to facilitate complete removal of the detergent from the prover. Ordinarily, three rinses will be sufficient, but this should be confirmed by testing the final rinse for any visual evidence of detergent or other residues.
When detergents are not sufficient to remove oily or greasy deposits, solvents may be used, provided it is ascertained that they do not affect any coatings on the container. The surfaces should be dry before any calibrations are attempted.
If lime or scale build-up has occurred (usually only in standards that are primarily used with water), they may be cleaned with a suitable lime or scale remover. Many of these chemicals contain acids and may react with metals, so appropriate care should be taken, and these chemicals should not be allowed to soak for extended periods of time. Many lime and scale removers have safety and handling requirements and may have special disposal requirements.
GMP 6 – 2019 Page 2 of 2
This publication is available free of charge from: https://doi.org/10.6028/N
IST.IR.7383 -2019
Safety requirements
The safety data sheet (SDS) must be reviewed prior to using or disposing of scale and lime removers.
3 Drying and protection
After cleaning or use, vessels should be drained completely and stored in a dry place. They should be covered to prevent entrance of dust and foreign matter. Metal containers further should be protected from damage by denting and/or dropping. Once such a vessel has been visibly dented, it is difficult to ascertain whether additional changes have occurred. Even when dents have been removed and the vessel has been calibrated, visual deformities can compromise future use. Accordingly, protection from damage while stored and when in use should be a major concern of the metrologist or owner of the device.
GMP 7 – 2019 Page 1 of 3
This publication is available free of charge from: https://doi.org/10.6028/N
IST.IR.7383 -2019
GMP 7
Good Measurement Practice for
Cleaning Precision Glassware
1 Cleanliness requirements
The volume contained in or delivered from precision glassware depends on the cleanliness of the container. Glassware must be sufficiently clean to ensure uniform wetting of the entire internal surface of the standard. When clean, the walls will be uniformly wetted, and the water will adhere to the surface in a continuous film. If films of dirt or grease are present, the meniscus may crinkle at the edges and liquids will not drain properly and will leave water drops on the internal walls. Lack of cleanliness can cause errors in setting a meniscus and incomplete wetting/drainage of the calibration liquid (generally water).
Glassware that is submitted for calibration should be cleaned (and autoclaved if needed) prior to submission to the laboratory to ensure removal of all chemical, biological, radiological, or other contaminants.
2 General cleaning options
If glassware is cleaned by the laboratory, appropriate inquiries should be made to determine prior and subsequent uses along with implications of certain cleaning methods. Some methods of cleaning glassware prior to calibration or use are ineffective or detrimental and may leave chemical contamination deposits that can be detected in some chemical analysis operations.
There are several suitable detergents (both liquid and powder), available from laboratory supply houses that do not contain phosphates. The catalog descriptions usually indicate whether they contain phosphates. Laboratory detergents that contain phosphates can leave a deposit on the glass that will cause water to "bead" on the surface making it appear to be dirty and making it difficult to properly set a meniscus. Once a phosphate deposit has occurred, it is very difficult to remove. It may be removed with hot (approx. 65 °C) sodium dichromate-sulfuric acid cleaning solution. However, use of this hot solution is hazardous, is a problem for safe disposal, and is not recommended unless proper safety equipment is available (see the next section).
If acetone is used to remove oil or grease film, always follow with alcohol (ethanol) before drying or rinsing with water. Denatured methanol can leave an oily residue due to the denaturing process. Acetone, if allowed to dry, may also leave a film deposit.
The above solvents need not be used if the glass does not have oil or grease film. Mechanical shaking of water and suitable non-phosphate detergents is usually adequate for cleaning glassware.
These cleaning agents do not preclude the use of other suitable methods, of which there are several. Some have special applications that would not normally be encountered by metrologists or field inspectors.
GMP 7 – 2019 Page 2 of 3
This publication is available free of charge from: https://doi.org/10.6028/N
IST.IR.7383 -2019
3 Advanced cleaning methods1
Safety and residue considerations
Safety data sheets (SDS) must be available, studied, and carefully followed, with all appropriate personal protective equipment (PPE), before using any of the following cleaning methods. Chromic acid solutions are not recommended for routine use because it is a hazardous waste and hazardous to health! Suitable education or training in the handling of chemicals is highly recommended.
Care should be exercised when using most cleaning solutions because they can cause skin irritations or severe burns on contact. Dilute solutions become concentrated as the water evaporates; therefore, always flush the exposed area immediately with large quantities of water.
Suitable chemical-specific-resistant goggles or a face mask should be worn to protect the eyes from splashes and rubber gloves should be worn to protect the hands. It is advisable to wear an acid resistant laboratory coat or a rubber apron to protect clothing when using strong acids for cleaning. The glassware should be handled gently to avoid breakage and to prevent spilling acids and other cleaning fluids. All cleaning should be done in a laboratory sink or on an acid-proof laboratory bench, preferably within a fume hood, to the extent possible.
Some of the cleaning materials mentioned leave minute traces or residues unless the rinsing process is carried out thoroughly. While such traces may not be harmful if the purpose of cleaning is to prepare the glassware for calibration, they can give trouble when the glassware is used in certain laboratory operations. For example, manganese and chromium compounds, even in extreme dilution, may retard or inhibit growth of micro-organisms, and traces of phosphorus may interfere with delicate tests for this element. When glassware is to be calibrated, final rinsing must be with pure distilled or deionized water.
Solvents
Frequently it is desirable to give glassware a preliminary rinse or soak with an organic solvent such as xylene or acetone to remove grease, followed by a water rinse. The rinsing with water must be done thoroughly if acid will be used later to clean the glassware.
Unless autoclaving is necessary, glassware should be cleaned as soon as possible after use to avoid setting and caking of residues. Pipets, for example, may be placed in a jar containing a weak antiseptic solution immediately after use. Autoclaving is necessary to disinfect glassware that may have been used to contain potentially dangerous biological fluids.
1 While the metrologist is not ordinarily faced with the problems for which these procedures are necessary, they are given here if they are needed.
GMP 7 – 2019 Page 3 of 3
This publication is available free of charge from: https://doi.org/10.6028/N
IST.IR.7383 -2019
Chemical cleaning optional methods
When a piece of glassware is badly contaminated with stopcock grease (except silicone grease), it may be necessary to rinse with acetone once or twice before using one of the methods below. For silicone grease, the acetone can be omitted, and the piece soaked for 30 min in fuming sulfuric acid. Warm decahydronaph-thalene (decalin) also has been suggested as a solvent for silicone grease. In this case, let the piece soak for 2 h, drain, and rinse once or twice with acetone, followed by a water rinse.
Fill with sulfuric acid-dichromate mixture and let stand. After removal of the mixture, rinse with distilled water at least six times. To make the cleaning mixture, dissolve 60 g to 65 g of sodium- or potassium-dichromate by heating in 30 mL to 35 mL of water, cool and slowly add concentrated sulfuric acid to make one liter of solution. This solution is available from laboratory supply companies. Note: Extreme care should be exercised in handling acidic solutions.
Scrub with a 1 % to 2 % hot solution of a detergent. Rinse well after brushing. Several suitable, commercial washing compounds are available.
Fuming sulfuric acid (very hazardous material) is an excellent cleaning agent. Usually, cleaning can be accomplished by use of a comparatively small amount of acid, manipulating the vessel so that the acid contacts the entire surface, and immediately emptying and rinsing.
4 Drying and protection
See GLP 13, Good Laboratory Practice for Drying Containers for appropriate drying techniques. It is not necessary to dry any container marked “to deliver.” If an article is to be dried after cleaning, as is necessary for all vessels marked "To Contain", acetone, followed by ethyl alcohol may be used. American Chemical Society, ACS, grading specification for reagents may be selected based on glassware use. Where ACS, reagent, or USP grades are selected the quality is suitable for use with food or medical processes and will meet or exceed other application requirements. Drying may be hastened by blowing clean, dry air into the vessel (or drawing the air through the vessel). Be sure not to mix acetone with alcohol.
Efficient air filters must be provided to remove any particles of oil or dirt from compressed air used for drying purposes.

This page is intentionally blank.
This publication is available free of charge from: https://doi.org/10.6028/N
IST.IR
.7383-2019
This publication is available free of charge from: https://doi.org/10.6028/N
IST.IR.7383-2019
Standard Operating Procedures

This publication is available free of charge from: https://doi.org/10.6028/N
IST.IR.7383-2018
This page is intentionally blank.
SOP 14 – 2019 Page 1 of 20
This publication is available free of charge from: https://doi.org/10.6028/N
IST.IR.7383 -2019
SOP No. 14 Recommended Standard Operating Procedure
for Gravimetric Calibration of Volumetric Standards Using an Electronic Balance
1 Introduction
Purpose of Test
This procedure is a precision mass calibration converting mass values to volumetric values using pure water as a standard reference material. The results provide calibration of either the "To Deliver" (TD) or "To Contain" (TC) volume of measuring containers that may be used as volumetric measuring standards. The procedure uses gravimetric calibration principles to minimize calibration uncertainties. Accordingly, the procedure is especially useful for high accuracy calibrations. The procedure references measurement control standards to ensure the validity of the standards and the measurement process; however, additional good measurement practices such as those required for precision mass calibrations must be used. The procedure uses an electronic balance and is suitable for all sizes of gravimetric calibrations only limited by the capacity and resolution of the balance and handling capabilities. Detailed measurement ranges, standards, equipment, and uncertainties for this SOP are generally compiled in a separate document in the laboratory. This procedure calculates the average volume based on two runs. Note: NIST calibrations generally make use of the average of five replicates.
Conformity Assessment
Standards that are calibrated for use in legal weights and measures applications should be evaluated for conformance to the appropriate specifications and tolerances that apply. Where compliance is required by law, conformity evaluations should be conducted prior to performing calibrations. See Section 6.2 for reporting results.
Prerequisites
Verify that valid calibration certificates with appropriate values and uncertainties are available for all the standards used in the calibration. All standards must have demonstrated metrological traceability to the international system of units (SI), which may be to the SI through a National Metrology Institute such as NIST.
Verify that the mass standards to be used have sufficiently small standard uncertainties for the level of calibration. Reference mass standards should not be used for gravimetric calibration due to the risk of water contamination. Weights of ASTM Class 2 or 3 or OIML Class F1 or F2 are recommended for this procedure. Working standards of other classes are generally not designed to maintain adequate stability needed; however, corrections obtained within a few days of the volume calibration may
SOP 14 – 2019 Page 2 of 20
This publication is available free of charge from: https://doi.org/10.6028/N
IST.IR.7383 -2019
provide adequate stability and may be used if the uncertainty is sufficiently small and the density is available for performing buoyancy corrections.
Verify that the balance used is in good operating condition with adequate capacity, sufficiently small resolution, and sufficiently small process standard deviation, as verified by a valid control chart or preliminary experiments using this procedure. Note: standard deviations obtained from mass calibrations do not reflect the process repeatability of gravimetric calibrations; therefore, process repeatability must be obtained using this procedure! The accuracy of the balance and weighing procedures should be evaluated to minimize potential bias in the measurement process.
Verify that the operator is experienced in precision weighing techniques and has had specific training in NISTIR 6969 SOP 2, SOP 4, SOP 29, GMP 3, GMP 10, and gravimetric calibrations.
Verify that an adequate quality and supply of distilled or deionized water (see GLP 10) is available. Note: Do not use tap water for this procedure!
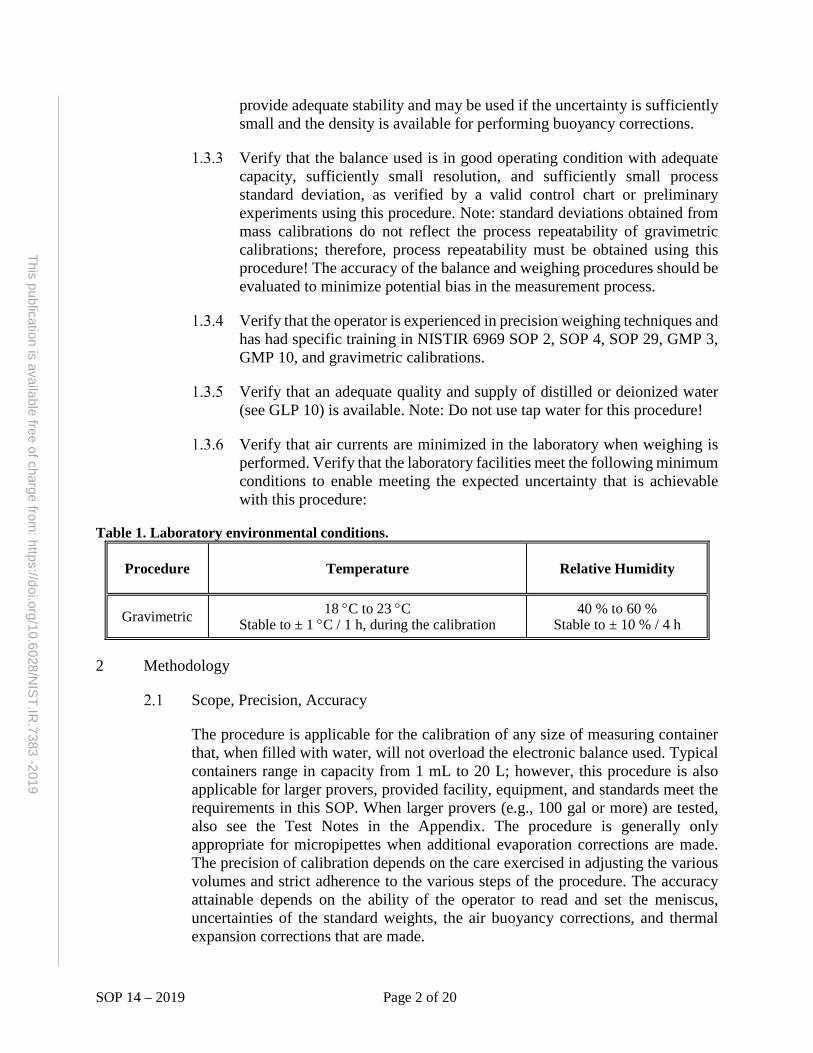
Verify that air currents are minimized in the laboratory when weighing is performed. Verify that the laboratory facilities meet the following minimum conditions to enable meeting the expected uncertainty that is achievable with this procedure:
Table 1. Laboratory environmental conditions.
Procedure Temperature Relative Humidity
Gravimetric 18 °C to 23 °C Stable to ± 1 °C / 1 h, during the calibration
40 % to 60 % Stable to ± 10 % / 4 h
2 Methodology
Scope, Precision, Accuracy
The procedure is applicable for the calibration of any size of measuring container that, when filled with water, will not overload the electronic balance used. Typical containers range in capacity from 1 mL to 20 L; however, this procedure is also applicable for larger provers, provided facility, equipment, and standards meet the requirements in this SOP. When larger provers (e.g., 100 gal or more) are tested, also see the Test Notes in the Appendix. The procedure is generally only appropriate for micropipettes when additional evaporation corrections are made. The precision of calibration depends on the care exercised in adjusting the various volumes and strict adherence to the various steps of the procedure. The accuracy attainable depends on the ability of the operator to read and set the meniscus, uncertainties of the standard weights, the air buoyancy corrections, and thermal expansion corrections that are made.
SOP 14 – 2019 Page 3 of 20
This publication is available free of charge from: https://doi.org/10.6028/N
IST.IR.7383 -2019
Summary
The electronic balance used is calibrated by incorporating standard masses into the procedure. The volumetric vessel to be calibrated is then weighed dry or “wetted down,” depending on whether the calibration is to be made on a “To Contain” or “To Deliver” basis. The container is filled with pure water of known temperature and re-weighed. The difference in mass is used to calculate the capacity of the container at the nominal capacity and at various capacities when multiple neck graduations are present. Transfer vessels may be used for all procedures except for flasks and containers marked.
Standards and Equipment Requirements
An electronic balance having sufficient capacity to weigh the loaded vessel is required. The balance selection affects the potential measurement errors associated with this procedure. Prior to use and where available, it is recommended to use the adjust/calibrate feature on balances. Option A provides a single point calibration factor for the balance. In general, concerns are greater for balances or mass comparators larger than 5 kg due to corner loading errors, non-linearity, and repeatability over the range of use. Option B as described in the calculation section for larger volumes corrects for balance non-linearity in both the filled and empty/drained ranges of use. Option B will also likely be required on mass comparators that have multiple ranges. It also provides corrections for variations in air density that may occur over a longer weighing process on larger volumes. For all procedures in this SOP, the balance should be zeroed prior to each measurement to minimize possible effects due to balance drift. The sensitivity or resolution of the balance may be a limiting factor in the accuracy of the measurement. The resolution and repeatability must be smaller than the accepted uncertainty of the calibration. Linearity errors or additional uncertainties may need to be considered when the mass standards are slightly less than the volume or container being measured.
Sufficient quantity of calibrated mass standards. Mass standards are selected so that they are slightly larger than the combined mass of the volume and container or transfer vessel that will be weighed. When summations of masses are used, the summation mass is used, and the “effective density” must be calculated, taking care not to use “average” density values.
Thermometer with resolution and uncertainty less than 0.1 °C to determine water temperature.
Thermometer with resolution and uncertainty less than 0.50 °C to determine air temperature.1
1 See NISTIR 6969, SOP 2 for calculating air density and requirements for temperature, barometric pressure, and relative humidity.
SOP 14 – 2019 Page 4 of 20
This publication is available free of charge from: https://doi.org/10.6028/N
IST.IR.7383 -2019
Barometer with resolution and uncertainty less than 135 Pa (1 mmHg) to determine air pressure.1
Hygrometer with resolution and uncertainty less than 10 % to determine relative humidity.1
Distilled or deionized water (See GLP 10) of sufficient quality and quantity for the calibration. Note: Do not use tap water for this procedure!
Stopwatch or another suitable timing device (does not need to be calibrated.)
General Considerations
Cleanliness checks
Verify that all containers to be calibrated are clean as evidenced by uniform drainage of water. No water droplets should remain on any interior surface as the water drains from the container. A reproducible “wet-down” weight is evidence for cleanliness in cases where it is not possible to visually check for uniform drainage. Use GMP 6 or 7 to clean vessels as necessary. All glassware must be meticulously cleaned, prior to calibration. When clean, the walls will be uniformly wetted. Instructions for cleaning are given in GMP 6 and GMP 7. An exception is plastic ware, which will not be wetted. Follow manufacturer's instructions for cleaning such vessels. Do not use cleaning agents that will attack, discolor, or swell plastic ware.
Use water that is thermally equilibrated with the laboratory environment. Equilibration can be achieved by storing the water in clean containers in the laboratory. It is important to use water that is equilibrated in the laboratory as much as possible to minimize potential calibration errors and convection currents during the calibration. Consider water to be equilibrated when within ± 5 °C of the laboratory temperature.
Volumetric calibrations to a marked volume (graduation line) are critically dependent on the setting of a meniscus. See GMP 3 for guidance in reading a meniscus.
Use GLP 13 as the procedure to dry any container to be calibrated on a “To Contain” basis.
Wet down (not used for any container calibrated “To Contain”).
For glassware and hand-held test measures: Fill the container to capacity with distilled or deionized water, then empty over a 30 s period while avoiding splashing. Drain for 10 s unless another drain time is specified. (This is commonly called a “30 s pour, 10 s drain” emptying procedure.) A 30 s (± 5 s) pour followed by a 10 s drain, with the measure held between a 10 degree and 15 degree angle from vertical is required during calibration
SOP 14 – 2019 Page 5 of 20
This publication is available free of charge from: https://doi.org/10.6028/N
IST.IR.7383 -2019
and use for glass flasks. A wet-down is not required for a transfer vessel that is used to weigh a delivered volume of water.
For stationary provers: Fill the container to capacity with distilled or deionized water, then empty. Time the drain once the cessation of the main flow is complete for 30 s and close the valve.
Calibration Procedure for Burets
Clamp the buret vertically on a support stand. Also clamp a plain glass test tube or beaker, large enough to hold a thermometer, near the buret.
Fill the buret with water and test for absence of leaks from the tip and stopcock. Drain and fill several times to condition the buret. Fill when ready to test.
Drain and record the delivery time, defined as the time of unrestricted flow from the zero mark to the lowest graduation mark with the stopcock fully open.
Fill the buret slightly above the zero mark with temperature-equilibrated water and fill the test tube that holds the thermometer. Record the water temperature.
Set the meniscus on the zero mark and touch the tip with the wetted wall of a beaker to remove any excess water. The buret tip must be full.
Measure and record the air temperature, air pressure, and relative humidity.
Zero the balance and then place a known mass standard on the balance pan that is slightly larger than the filled capacity of the empty transfer vessel or flask when filled with water. Record the reading as O1.
Zero the balance and then weigh an empty transfer vessel or flask including the stopper or cover to be used. Record as O2.
Fully open the stopcock and discharge the contents of the buret into the previously weighed flask or transfer vessel. The tip of the buret should be in contact with the wall of the flask. When the level in the buret is within a few millimeters above the line being calibrated, slow the discharge, and make an accurate setting. When the setting is completed, move the flask horizontally to break contact with the tip. Recheck the setting.
Stopper (or cover) the filled transfer vessel or flask. Check to make sure that the outside of the transfer vessel or flask is not wet. Zero the balance and then weigh the filled transfer vessel or flask. Record the balance reading as O3.
Measure and record the temperature of water in the container.
SOP 14 – 2019 Page 6 of 20
This publication is available free of charge from: https://doi.org/10.6028/N
IST.IR.7383 -2019
Test the next interval in the same manner - from the zero mark to the next interval of test.
For burets with a specified waiting time, empty as in 2.5.9 to within a few millimeters of the calibration mark. Pause for the specified waiting time (e.g., 10 s), then adjust the meniscus to the graduation line as in 2.5.9.
Measure and record the air temperature, air pressure, and relative humidity.
Make a duplicate determination for each interval (Run 2).
Calculate the volume for each interval as described in Section 3, Option A.
Calibration Procedure for Pipets (One-Mark)
Measure and record the air temperature, air pressure, and relative humidity.
Zero the balance and then place a known mass standard on the balance pan that is slightly larger than the filled capacity of the empty transfer vessel or flask when filled with water. Record the reading as O1.
Zero the balance and then weigh an empty transfer vessel or flask, including the stopper or cover that will be used. Record the balance reading as O2.
Fill the pipet to the index mark and measure the delivery time with the tip in contact with the internal surface of a beaker (not the transfer vessel that will be used.)
Refill the pipet by suction, slightly above the index line. Record the water temperature. Wipe tip with filter paper, then slowly lower level to the index line, using a stopcock or pinch clamp for fine control. The tip must be in contact with the wetted wall of the beaker while this setting is being made. Do not remove any water remaining on tip.
Hold the pipet in a vertical position and deliver water into the previously weighed transfer vessel or flask, with the tip in contact with the inside wall or neck.
After the flow has ceased, wait two seconds then remove the pipet from contact with the flask. Check to make sure that the outside of the transfer vessel or flask is not wet.
Stopper (or cover) the filled transfer vessel or flask. Zero the balance and then weigh the transfer vessel or flask. Record the balance reading as O3.
Measure and record the temperature of water in the container.
Measure and record the air temperature, air pressure, and relative humidity.
SOP 14 – 2019 Page 7 of 20
This publication is available free of charge from: https://doi.org/10.6028/N
IST.IR.7383 -2019
Make a duplicate determination for the pipet (Run 2).
Calculate the volume as described in Section 3, Option A.
Calibration of Flasks (To Contain) – Transfer vessel must not be used.
Clean and dry the flask to be calibrated as described in GLP 13. Then stopper the flask.
Measure and record the air temperature, air pressure, and relative humidity.
Zero the balance and then place a known mass standard on the balance pan that is slightly larger than the filled capacity of the flask when filled with water. Record the reading as O1.
Zero the balance and then weigh the dry flask including its stopper or cover. Record the balance reading as O2.
Place an appropriately sized funnel in neck and fill the flask to just below the reference graduation while maneuvering the flask to wet the entire neck below the stopper. Let stand for two minutes then adjust the meniscus to the reference graduation line, taking care to avoid wetting the neck above the capacity graduation.
Check that the outside surface of the flask, and its internal surface above the water level are dry, and that neither bubbles or foam are present in the water. Remove visible water droplets if needed with a laboratory wipe. Stopper or cover the flask.
Zero the balance and then weigh the filled flask and its stopper or cover, and record the balance reading as O3.
Measure and record the temperature of the water in the flask or another container.
Measure and record the air temperature, air pressure, and relative humidity.
Make a duplicate determination (Run 2) after drying the flask per GLP 13.
Perform volume calculations as described in Section 3, Option A.
Calibration of Flasks (To Deliver)
Clean but do not dry the flask to be calibrated. Condition the flask by filling and emptying the flask over a 30 s period by gradually inclining it to avoid splashing. When the main flow has ceased, hold the flask in a nearly vertical position for 10 seconds unless another drain time is specified, then touch off the drop of water adhering to the tip of the flask.
SOP 14 – 2019 Page 8 of 20
This publication is available free of charge from: https://doi.org/10.6028/N
IST.IR.7383 -2019
Measure and record the air temperature, air pressure, and relative humidity.
Zero the balance and then place a known mass standard on the balance pan that is slightly larger than the filled capacity of the flask when filled with water. Record the reading as O1.
Zero the balance and then weigh the drained (empty) flask including its stopper or cover. Record the balance reading as O2.
Fill the flask to just below the reference graduation. Let the flask stand for two minutes, then adjust the meniscus to the reference graduation line. Do not dry the inside of the flask above the graduation line but take care to ensure that the outside of the flask is dry.
Zero the balance and then weigh the filled vessel, with cap or stopper. Record the balance reading as O3.
Measure and record the temperature of the water in the flask.
Measure and record the air temperature, air pressure, and relative humidity.
Make a duplicate determination (Run 2).
Calculate the volume of the flask as described in Section 3, Option A.
Note: The order of weighing the filled and drained flask in Section 2.8 may be reversed. In that case, the filled vessel is still weighed and recorded as O3, the flask is drained as in 2.8.1, and the properly drained vessel is weighed and recorded as O2.
Calibration of Other Volumetric Glassware
Measuring Pipets (non-single-mark) – Calibrate in a manner like that used to calibrate burets (2.5).
Graduated Cylinders – Calibrate in a manner like that used for flasks (To Deliver cylinders, use section 2.8; To Contain cylinders, use section 2.7).
Calibration of Slicker-Plate Type Standards
This calibration makes use of Option B where equivalent mass standards are used at both the filled and empty loads on the balance. A transfer vessel is recommended.
Condition the slicker-plate type standards with several wet-down runs to fully ensure wet down and smooth valve operation.
Measure and record the air temperature, air pressure, and relative humidity.
SOP 14 – 2019 Page 9 of 20
This publication is available free of charge from: https://doi.org/10.6028/N
IST.IR.7383 -2019
Zero the balance and then place a standard mass, MS1, on the balance platform (MS1 should be slightly larger than the mass of the drained vessel, dry vessel, or empty transfer vessel.) Record reading as O1.
Zero the balance. Place the dry or “wet-down” transfer vessel on the balance platform, as appropriate, and record reading as O2. Caution: all containers must be dry on the outside for all weighing.
Fill the slicker-plate standard to just above the rim of the standard. Record the water temperature. Slide the slicker plate across the level top. Set the transfer vessel below the nozzle to ensure all volume is transferred into the vessel and that no splashing occurs.
Open the slicker-plate standard valve and remove the plate simultaneously and smoothly to deliver the water into the transfer vessel. Time the drain for 30 s after cessation of the main flow and close the valve. Cover the transfer vessel and move it from beneath the standard to ensure additional drops of water are not transferred. Note: Never fill the transfer vessel while it is sitting on the balance platform to ensure that the balance is not damaged with water and to avoid errors associated with balance drift and hysteresis.
Zero the balance and then place a standard mass, MS2, on the balance platform. MS2 should be slightly larger than the mass of the filled vessel. Record the balance reading as O3.
Zero the balance and then weigh the filled transfer vessel and record the balance reading as O4.
Immediately after weighing, check the temperature of the water in the filled container. Ensure that the water has not changed by more than 0.2 °C during the measurement process or repeat the run.
Measure and record the air temperature, barometric pressure, and relative humidity.
Make a duplicate determination (Run 2).
Calculate the volume as described in Section 3, Option B.
Calibration of Hand-held Graduated Neck Type Provers
A hand-held test measure is weighed empty and filled much like the procedure for To Deliver flasks (section 2.8). However, this calibration makes use of Option B where equivalent mass standards are used at both the filled and empty loads on the balance.
Condition the test measure by filling and draining using a 30 s pour followed by a 10 s drain. Take care to avoid splashing of water on the outside of the
SOP 14 – 2019 Page 10 of 20
This publication is available free of charge from: https://doi.org/10.6028/N
IST.IR.7383 -2019
measure. The wet-down will help equilibrate the test measure with the water temperature.
Measure and record the air temperature, air pressure, and relative humidity.
Zero the balance and then place standard masses, MS1, on the balance platform. MS1 should be slightly larger than the mass of the drained vessel. Record reading as O1.
Zero the balance and then place the “wet-down” test measure on the balance platform, and record the balance reading as O2. Caution: all containers must be dry on the outside for all weighing.
Fill the graduated neck type test measure to just below the nominal volume mark. Record the water temperature. Adjust the meniscus to nominal.
Zero the balance and then place standard masses, MS2, on the balance platform. MS2 should be slightly larger than the mass of the filled vessel. Record the balance reading as O3.
Zero the balance and then weigh the filled transfer vessel and record the balance reading as O4.
Immediately after weighing, check the temperature of the water in the filled container. Ensure that the water has not changed by more than 0.2 °C since step 2.11.6 or repeat the run.
Measure and record the air temperature, barometric pressure, and relative humidity.
Make a duplicate determination (Run 2).
Calculate the volume as described in Section 3, Option B. You may use the average water temperature in calculations. If a neck scale plate verification is performed, additional weighings may be performed after setting the meniscus at each level.
Calibration of Large Volume Graduated Neck Type Provers
This calibration makes use of Option B where approximately equivalent mass standards are used at both the filled and empty loads on the balance. A transfer vessel is recommended. The unknown vessel to be calibrated must be elevated to facilitate transfer of water into the transfer vessel.
Condition the prover with a wet-down run to fully ensure smooth valve operation, temperature equilibration, and wet-down of the delivery system.
Measure and record the air temperature, air pressure, and relative humidity.
SOP 14 – 2019 Page 11 of 20
This publication is available free of charge from: https://doi.org/10.6028/N
IST.IR.7383 -2019
Zero the balance and then place standard masses, MS1, on the balance platform. MS1 should be slightly larger than the mass of the drained vessel, dry vessel, or empty transfer vessel. Record reading as O1.
Zero the balance. Place dry or “wet-down” transfer vessel including cover on balance platform, as appropriate, and record reading as O2. Caution: all containers must be dry on the outside for all weighing.
Fill the graduated neck type prover to just below the nominal volume mark. Record the water temperature. Adjust the meniscus to nominal. Set the transfer vessel below the nozzle to ensure all volume is transferred into the vessel and that no splashing occurs. Use hoses and piping of minimum length to avoid errors associated with retention during delivery. Hoses should be translucent so that cessation of the main flow is visible. Care should be taken to ensure that there are no loops or sags in the hose that may hold water. When using hoses or piping, be sure to include them as part of the wet-down process.
Open the unknown prover valve to deliver the water into the transfer vessel. Time the drain for 30 s after the cessation of the main flow and close the valve. Cover the transfer vessel and move it from beneath the prover to ensure additional drops of water are not transferred.
Zero the balance and then place standard masses, MS2, on the balance platform. MS2 should be slightly larger than the mass of the filled vessel. Record the balance reading as O3.
Zero the balance and then weigh the filled transfer vessel and its cover. Record the balance reading as O4.
Immediately after weighing, check the temperature of the water in the filled container. The temperature should not change by more than 0.2 °C if the prover and water have been equilibrated in the laboratory environment.
Measure and record the air temperature, barometric pressure, and relative humidity.
Make a duplicate determination (Run 2).
Calculate the volume as described in Section 3, Option B. You may use the average water temperatures for calculations.
SOP 14 – 2019 Page 12 of 20
This publication is available free of charge from: https://doi.org/10.6028/N
IST.IR.7383 -2019
3 Calculations
Option A – One-point balance calibration. Compute the volume at the temperature under test, Vt, for each determination using the equation:
( )3 21
11s at
s w a
MV O OO
ρρ ρ ρ
= − − −
Eqn. (1)
Note: The O3 value is the filled volume container or transfer vessel and O2 is the dry, empty, or drained value. If the order of any weighing operations were changed, the calculated volume may indicate a negative value.
Option B – Two-point balance calibration. Compute the volume, Vt, for each determination using the equation:
4 22 1
3 2 1 1
11 1a at s s
s s w a
O OV M MO O
ρ ρρ ρ ρ ρ
= − − − −
Eqn. (2)
Table 2. Variables used in volume equations. Variable Description
Ms, Ms1, Ms2 mass of standards (i.e., true mass, vacuum mass) (g) ρs density of MS (g/cm³) ρw density of water at the temperature of measurement (g/cm³)
ρa density of air at the conditions of calibration – may be different for filled and empty/drained conditions (g/cm³)
Vt represents either the “To Contain” or “To Deliver” volume (depending on whether O2 represents a dry or a “wet down” container at the temperature of the measurement) (cm³ or mL)
Glassware is typically calibrated to 20 °C. Compute V20, the volume at 20 °C, for each run, using the expression:
( )20 1 20tV V tα = − − Eqn. (3)
where α is the cubical coefficient of expansion of the container being calibrated (°C-1), (see NISTIR 6969, Table 9.10), and, t, is the temperature (ºC) of the water. Compute the mean V20 for the duplicate measurements.
Test measures and provers are typically calibrated to 60 °F. Compute V60, the volume at 60 °F, for each run, using the expression (taking care to use the cubical coefficient of expansion in °F-1):
( )60 1 60tV V tα = − − Eqn. (4)
SOP 14 – 2019 Page 13 of 20
This publication is available free of charge from: https://doi.org/10.6028/N
IST.IR.7383 -2019
If using a different reference temperature, use the following equation and take care to match the cubical coefficient of expansion units with the units of temperature:
( ) 1ref t refV V t tα = − − Eqn. (5)
Other Reference temperatures may be used. Common reference temperatures for other liquids follow:
Table 3. Reference temperatures for measured volumes.
Commodity Reference Temperature
Frozen food labeled by volume (e.g., fruit juice) -18 ºC (0 ºF)Beer 3.9 ºC (39.1 ºF) Food that must be kept refrigerated (e.g., milk) 4.4 ºC (40 ºF) Distilled spirits or petroleum 15.56 ºC (60 ºF) Petroleum (International Reference) 15 ºC (59 ºF) Compressed Natural Gas (CNG) 15 °C (60 ºF) Wine 20 ºC (68 ºF) Unrefrigerated liquids (e.g., sold unchilled, like soft drinks) 20 ºC (68 ºF) Hydrogen (H2) 21 ºC (70 ºF) Petroleum (Hawaii) 26.67 ºC (80 ºF)
Calculate water density for air-saturated water, using the equations provided in GLP 10.
Calculate the air density per NISTIR 6969, Selected Mass Calibration Procedures, SOP 2, Option B.
Calculate the within process standard deviation, sw, for the replicate runs and determine the applicable degrees of freedom (number of replicates minus one).
Calculate the F statistic to compare the observed within process standard deviation, sw, to the accepted (pooled) within process standard deviation for the measurement process. (See NISTIR 6969, Sections 8.4 and 8.9.2, for more information on pooling standard deviations and F-tests.)
2Accepted
2Observed
w
w
ssF = Eqn. (6)
SOP 14 – 2019 Page 14 of 20
This publication is available free of charge from: https://doi.org/10.6028/N
IST.IR.7383 -2019
The calculated F statistic must be less than the F value obtained from an F table at 95 % confidence level (Table 9.12, NISTIR 6969) to be acceptable. The F value is obtained from the F table for numerator degrees of freedom and denominator degrees of freedom equal to the number of degrees of freedom in the accepted (pooled) within process standard deviation. If the data fails the F-test and the source of the error cannot be determined conclusively, the measurement must be repeated.
Calculate and report the mean volume of the volumetric standard at its applicable reference temperature.
If adjustments were made during replicate runs, report the “as found” volume or the mean of “as found” volumes and the “as left” volume or mean of “as left” volumes, as applicable, at the appropriate reference temperature. (I.e., do not calculate a mean value by combining “as found” and “as left” values when adjustments are made.)
4 Measurement Assurance
Where practical, duplicate the process with a suitable check standard (See GLP 1, SOP 30, in NISTIR 6969, or Sec. 7.4, in NBS Handbook 145).
Plot the calculated check standard volume and verify it is within established limits. A t-test may be incorporated to check the observed value against an accepted value.
( )p
cc
sSS
t−
= Eqn. (7)
The t-statistic is evaluated using Eqn. 7 with a 95 % confidence level. All values must be entered in the control chart, even if failing this statistic to ensure the variability obtained for the process is truly representative of the process and not unduly reduced over time. The observed value of the check standard is compared to the accepted mean value of the check standard and divided by the standard deviation for the check standard observations over time. The limits for the t-test are based on applicable warning and action limits on the control chart. See SOP 20 for applicable t-test limits.
The mean of the calculated check standard values is used to evaluate bias and drift over time and may be used to identify or signify problems with the volume standard or changes in water quality.
Check standard observations may also be used to calculate the standard deviation of the measurement process, sp.
This procedure uses replicate measurements to monitor the measurement process following SOP 20 and a standard deviation chart (preferred) or a range chart (optional). For standards that may be and are adjusted, do not combine an “as found” value with an “as left” value for the two runs recorded in the chart; use the
SOP 14 – 2019 Page 15 of 20
This publication is available free of charge from: https://doi.org/10.6028/N
IST.IR.7383 -2019
adjusted value from Run 1 and the value from Run 2, both at the applicable reference temperature, when entering values in a standard deviation or range chart. Control chart run values must both be from either before adjustment or after adjustment. A minimum of 12 replicate measurements are required to establish initial process limits and 25 to 30 points are required for reporting valid uncertainty values.
5 Assignment of Uncertainties
The limits of expanded uncertainty, U, include estimates of the standard uncertainty of the mass standards used, us, plus the measurement process repeatability, sp, and the additional items noted below and in the uncertainty budget table, Table 4, at approximately a 95 percent level of confidence. See NISTIR 6969, SOP 29 for the complete standard operating procedure for calculating the uncertainty.
The standard uncertainty for the standards, us, is obtained from the calibration report. The combined standard uncertainty, uc, is used and not the expanded uncertainty, U, therefore the reported uncertainty for the standard will usually need to be divided by the coverage factor k. Multiple mass standards are often used, so see SOP 29 for treatment of dependencies and correlations.
Standard deviation of the measurement process from control chart performance. See SOP No. 17 or 20.
The value for sp is obtained from the control chart data for check standards when a check standard is available using this procedure. It may also be estimated based on replicate measurements over time. Replicate measurements over time provide a pooled standard deviation that may be used (alternatively, the average range is used to estimate the standard deviation) per SOP 17 or 20. This standard deviation value is a repeatability factor related to the precision of the measurement process weighings and the setting of the meniscus when present, but does not include uncertainties associated with systematic errors in reading the meniscus. See GMP 3 for details. Use the larger of the sp from a check standard or the sw obtained from within process repeatability.
Include uncertainties associated with the reading of the meniscus when one is present. See GMP 3 for details.
Other standard uncertainties usually included at this calibration level include uncertainties associated with water temperature measurements, thermometer accuracy, calculation of air density, standard uncertainties associated with the density of the mass standards, coefficients of expansion, viscosity, or surface effects on the volume of liquid clinging to vessel walls after draining, improper observance of drainage times, and the lack of internal cleanliness.
Example components to be considered for an uncertainty budget table are shown in Table 4. Multiple values may need to be considered in some cases.
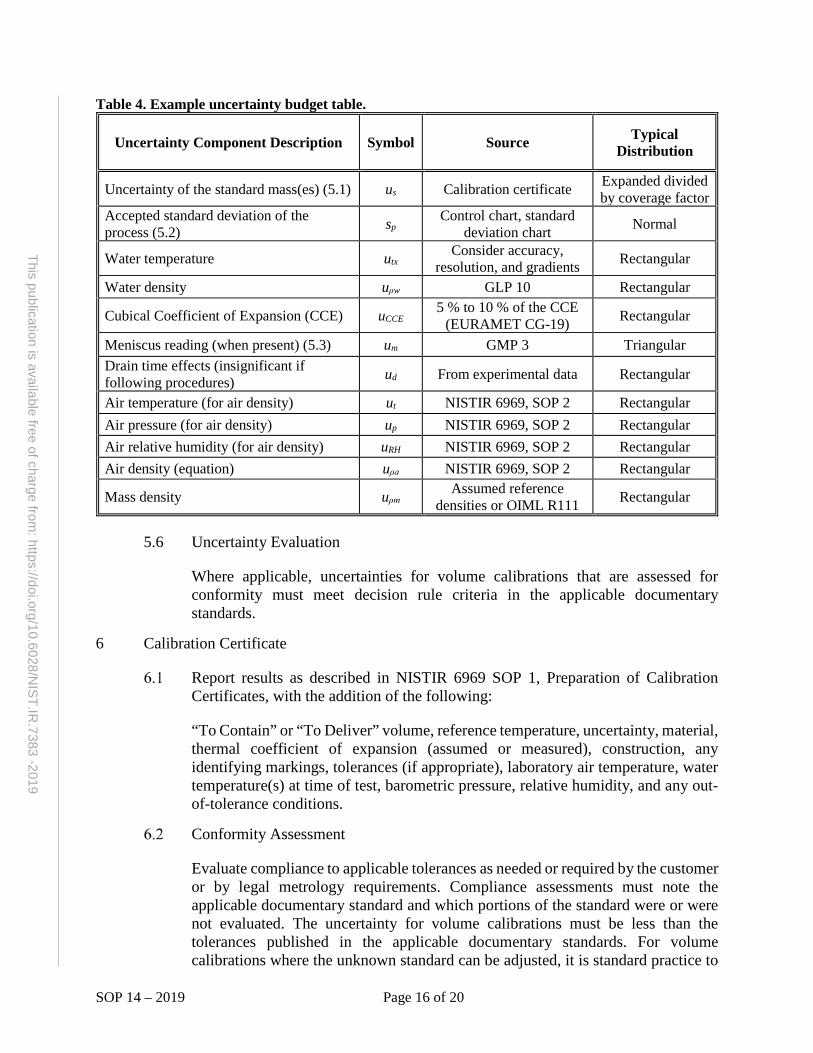
SOP 14 – 2019 Page 16 of 20
This publication is available free of charge from: https://doi.org/10.6028/N
IST.IR.7383 -2019
Table 4. Example uncertainty budget table.
Uncertainty Component Description Symbol Source Typical Distribution
Uncertainty of the standard mass(es) (5.1) us Calibration certificate Expanded divided by coverage factor
Accepted standard deviation of the process (5.2) sp
Control chart, standard deviation chart Normal
Water temperature utx Consider accuracy, resolution, and gradients Rectangular
Water density uρw GLP 10 Rectangular
Cubical Coefficient of Expansion (CCE) uCCE 5 % to 10 % of the CCE (EURAMET CG-19) Rectangular
Meniscus reading (when present) (5.3) um GMP 3 Triangular Drain time effects (insignificant if following procedures) ud From experimental data Rectangular
Air temperature (for air density) ut NISTIR 6969, SOP 2 Rectangular Air pressure (for air density) up NISTIR 6969, SOP 2 Rectangular Air relative humidity (for air density) uRH NISTIR 6969, SOP 2 Rectangular Air density (equation) uρa NISTIR 6969, SOP 2 Rectangular
Mass density uρm Assumed reference densities or OIML R111 Rectangular
5.6 Uncertainty Evaluation
Where applicable, uncertainties for volume calibrations that are assessed for conformity must meet decision rule criteria in the applicable documentary standards.
6 Calibration Certificate
Report results as described in NISTIR 6969 SOP 1, Preparation of Calibration Certificates, with the addition of the following:
“To Contain” or “To Deliver” volume, reference temperature, uncertainty, material, thermal coefficient of expansion (assumed or measured), construction, any identifying markings, tolerances (if appropriate), laboratory air temperature, water temperature(s) at time of test, barometric pressure, relative humidity, and any out-of-tolerance conditions.
Conformity Assessment
Evaluate compliance to applicable tolerances as needed or required by the customer or by legal metrology requirements. Compliance assessments must note the applicable documentary standard and which portions of the standard were or were not evaluated. The uncertainty for volume calibrations must be less than the tolerances published in the applicable documentary standards. For volume calibrations where the unknown standard can be adjusted, it is standard practice to
SOP 14 – 2019 Page 17 of 20
This publication is available free of charge from: https://doi.org/10.6028/N
IST.IR.7383 -2019
adjust the standard or leave the scale plate in a position close enough to its nominal volume to ensure that the absolute value of the measurement result plus the uncertainty is less than the applicable tolerance. Where the unknown standard cannot be adjusted, and a portion of the uncertainty band from the error exceeds tolerance limits, it is not appropriate to state compliance with the tolerances unless additional decision rules are communicated with and agreed to by the end user. Correction values (measurement results) may need to be used by the end user in such cases.
7 Additional References:
Bean, V. E., Espina, P. I., Wright, J. D., Houser, J. F., Sheckels, S. D., and Johnson, A. N., NIST Calibration Services for Liquid Volume, NIST Special Publication 250-72, National Institute of Standards and Technology, Gaithersburg, MD, (2009).
EURAMET Calibration Guide 19, Guidelines on the Determination of Uncertainty in Gravimetric Volume Calibration, (Version 2.1, 03/2012).
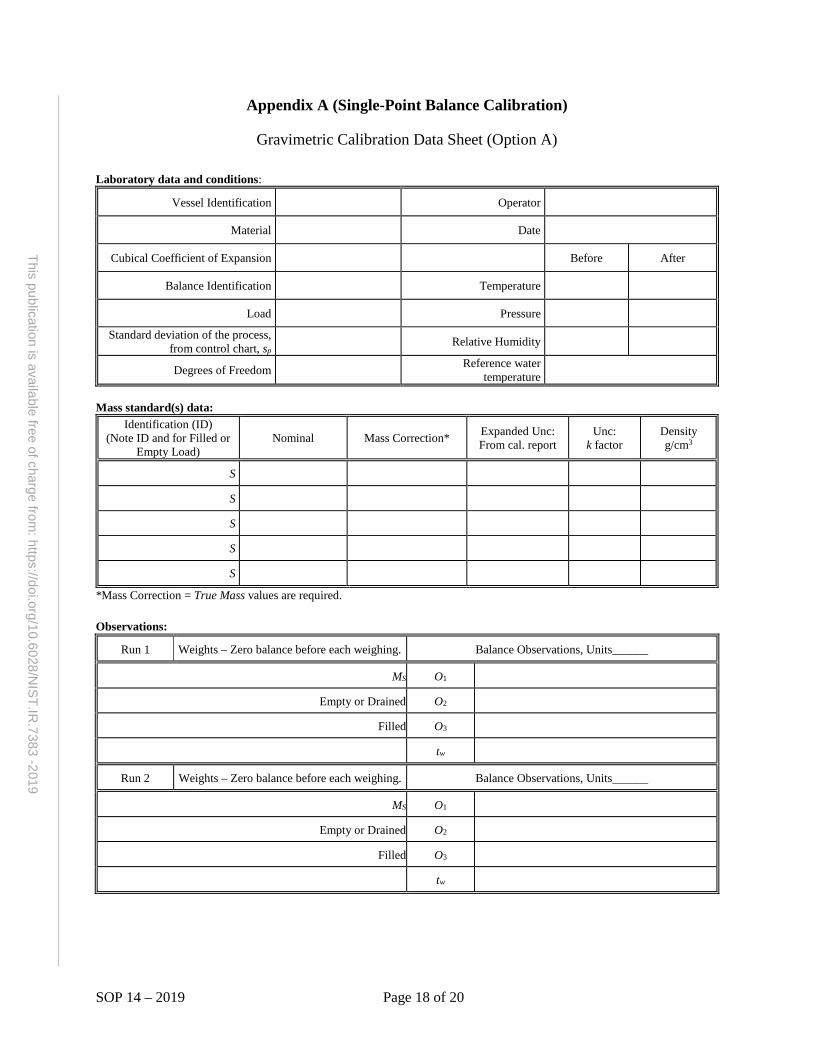
SOP 14 – 2019 Page 18 of 20
This publication is available free of charge from: https://doi.org/10.6028/N
IST.IR.7383 -2019
Appendix A (Single-Point Balance Calibration)
Gravimetric Calibration Data Sheet (Option A)
Laboratory data and conditions:
Vessel Identification Operator
Material Date
Cubical Coefficient of Expansion Before After
Balance Identification Temperature
Load Pressure
Standard deviation of the process, from control chart, sp Relative Humidity
Degrees of Freedom Reference water
temperature
Mass standard(s) data: Identification (ID)
(Note ID and for Filled or Empty Load)
Nominal Mass Correction* Expanded Unc: From cal. report
Unc: k factor
Density g/cm3
S
S
S
S
S
*Mass Correction = True Mass values are required.
Observations:
Run 1 Weights – Zero balance before each weighing. Balance Observations, Units______
MS O1
Empty or Drained O2
Filled O3
tw
Run 2 Weights – Zero balance before each weighing. Balance Observations, Units______
MS O1
Empty or Drained O2
Filled O3
tw
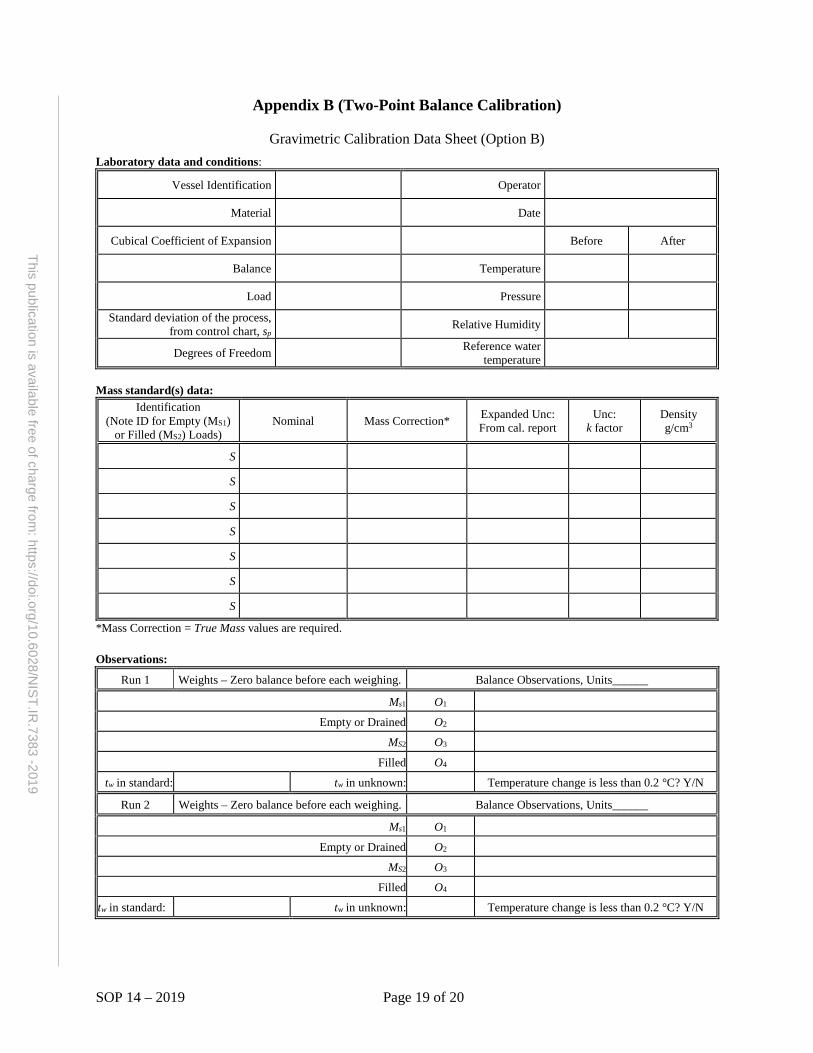
SOP 14 – 2019 Page 19 of 20
This publication is available free of charge from: https://doi.org/10.6028/N
IST.IR.7383 -2019
Appendix B (Two-Point Balance Calibration)
Gravimetric Calibration Data Sheet (Option B) Laboratory data and conditions:
Vessel Identification Operator
Material Date
Cubical Coefficient of Expansion Before After
Balance Temperature
Load Pressure
Standard deviation of the process, from control chart, sp Relative Humidity
Degrees of Freedom Reference water
temperature
Mass standard(s) data: Identification
(Note ID for Empty (MS1) or Filled (MS2) Loads)
Nominal Mass Correction* Expanded Unc: From cal. report
Unc: k factor
Density g/cm3
S
S
S
S
S
S
S
*Mass Correction = True Mass values are required.
Observations:
Run 1 Weights – Zero balance before each weighing. Balance Observations, Units______
Ms1 O1
Empty or Drained O2
MS2 O3
Filled O4
tw in standard: tw in unknown: Temperature change is less than 0.2 °C? Y/N
Run 2 Weights – Zero balance before each weighing. Balance Observations, Units______
Ms1 O1
Empty or Drained O2
MS2 O3
Filled O4
tw in standard: tw in unknown: Temperature change is less than 0.2 °C? Y/N
SOP 14 – 2019 Page 20 of 20
This publication is available free of charge from: https://doi.org/10.6028/N
IST.IR.7383 -2019
Appendix C
Test Notes for Large Provers
1. Pour and drain times.
It is impractical to completely drain a filled container because some of the contents will remain as a film. By strict adherence to a specified procedure, the residual contents can be held essentially constant so that, reproducible calibration constants can be obtained. The conventionally selected conditions are as follows:
For bottom-drain containers: open the drain valve fully and allow contents to discharge at maximum rate. When main flow ceases (flow decreases so that drain opening no longer runs full), wait 30 s, close the valve, and touch off any drops adhering to spout.
For pour-type containers: pour contents by gradually tilting container to an 85º angle, so that virtually all liquid is delivered in 30 s. Allow to drain for an additional 10 s, then touch off any drops adhering to the lip.
The instructions described above must be precisely followed during calibration and use of the calibrated vessels.
2. Evaporation losses.
A suitable cap should be placed on the top of open vessels to minimize evaporation losses. If used, the cap must be included in all weighings.
3. Slicker-plate.
When a slicker-plate standard is calibrated, the plate should be used to fix the water level in it. A transfer vessel is recommended for use when calibrating a slicker-plate type standard. But if the standard is weighed, the plate must be weighed with the standard during each such operation.
SOP 16 – 2019 Page 1 of 9
This publication is available free of charge from: https://doi.org/10.6028/N
IST.IR.7383 -2019
SOP 16
Standard Operating Procedure for Calibration of Measuring Flasks
Volume Transfer Method
1 Introduction
Purpose of Test
This procedure describes a method for volume transfer calibration of the “To Deliver” (TD) volume of measuring flasks from calibrated volumetric standards. The test items are then used as volumetric measurement standards, often for packaged commodity verification. If “To Contain” (TC) calibrations are to be performed, appropriate modifications are needed in the procedure to ensure complete drying of the flask between calibration runs. Detailed measurement ranges, standards, equipment, and uncertainties for this SOP are generally compiled in a separate document in the laboratory.
Conformity Assessment
Standards that are calibrated for use in legal weights and measures applications should be evaluated for conformance to the appropriate specifications and tolerances that apply. Where compliance is required by law, conformity evaluations should be conducted prior to performing calibrations. See Section 6.2 for reporting results.
Prerequisites
Verify that valid calibration certificates are available for all the standards used in the calibration. All standards must have demonstrated metrological traceability to the international system of units (SI), which may be to the SI through a National Metrology Institute such as NIST. Where reference standards do not have suitable calibration values and uncertainties, SOP 14 is preferred for calibration of measuring flasks.
Verify that the standards to be used have sufficiently small standard uncertainties for the intended level of calibration.
Verify that the standard burets and pipets are clean, free of leaks, and in good operational condition.
Verify the availability of an adequate supply of pure distilled or deionized water (See GLP 10) of sufficient quality and quantity for the calibration. Do not use tap water for this procedure to ensure the reference glassware is maintained with valid reference values!
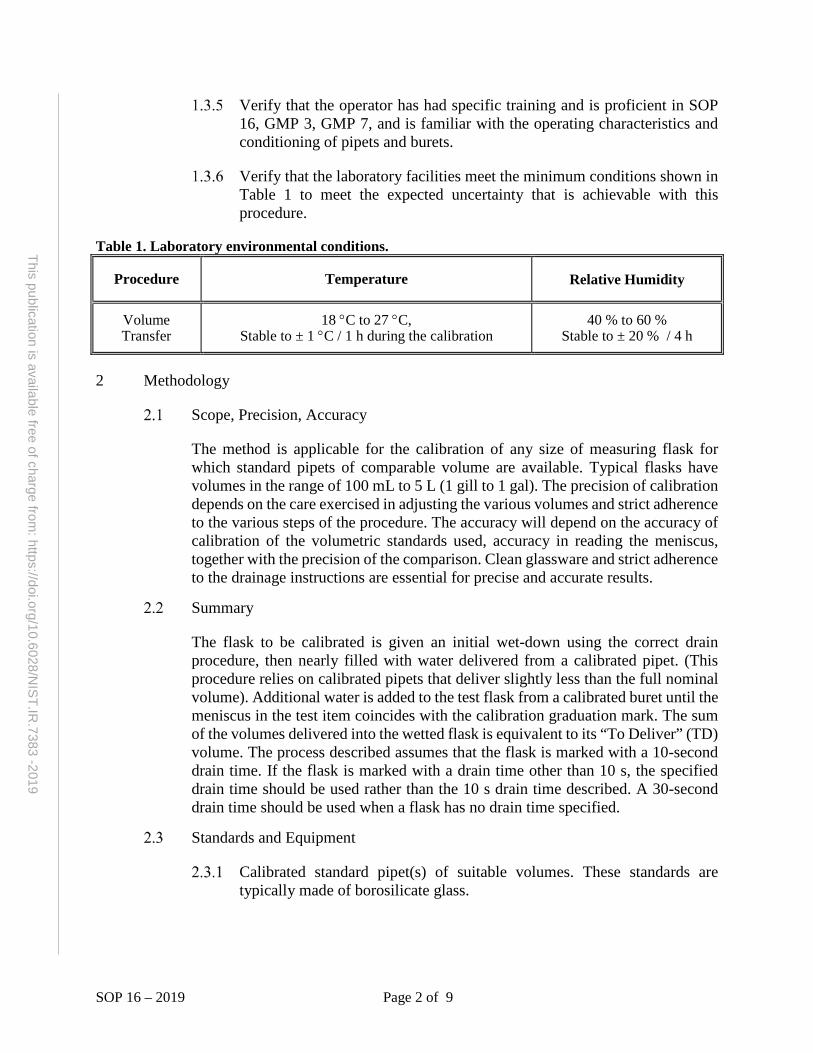
SOP 16 – 2019 Page 2 of 9
This publication is available free of charge from: https://doi.org/10.6028/N
IST.IR.7383 -2019
Verify that the operator has had specific training and is proficient in SOP 16, GMP 3, GMP 7, and is familiar with the operating characteristics and conditioning of pipets and burets.
Verify that the laboratory facilities meet the minimum conditions shown in Table 1 to meet the expected uncertainty that is achievable with this procedure.
Table 1. Laboratory environmental conditions.
Procedure Temperature Relative Humidity
Volume Transfer
18 °C to 27 °C, Stable to ± 1 °C / 1 h during the calibration
40 % to 60 % Stable to ± 20 % / 4 h
2 Methodology
Scope, Precision, Accuracy
The method is applicable for the calibration of any size of measuring flask for which standard pipets of comparable volume are available. Typical flasks have volumes in the range of 100 mL to 5 L (1 gill to 1 gal). The precision of calibration depends on the care exercised in adjusting the various volumes and strict adherence to the various steps of the procedure. The accuracy will depend on the accuracy of calibration of the volumetric standards used, accuracy in reading the meniscus, together with the precision of the comparison. Clean glassware and strict adherence to the drainage instructions are essential for precise and accurate results.
Summary
The flask to be calibrated is given an initial wet-down using the correct drain procedure, then nearly filled with water delivered from a calibrated pipet. (This procedure relies on calibrated pipets that deliver slightly less than the full nominal volume). Additional water is added to the test flask from a calibrated buret until the meniscus in the test item coincides with the calibration graduation mark. The sum of the volumes delivered into the wetted flask is equivalent to its “To Deliver” (TD) volume. The process described assumes that the flask is marked with a 10-second drain time. If the flask is marked with a drain time other than 10 s, the specified drain time should be used rather than the 10 s drain time described. A 30-second drain time should be used when a flask has no drain time specified.
Standards and Equipment
Calibrated standard pipet(s) of suitable volumes. These standards are typically made of borosilicate glass.
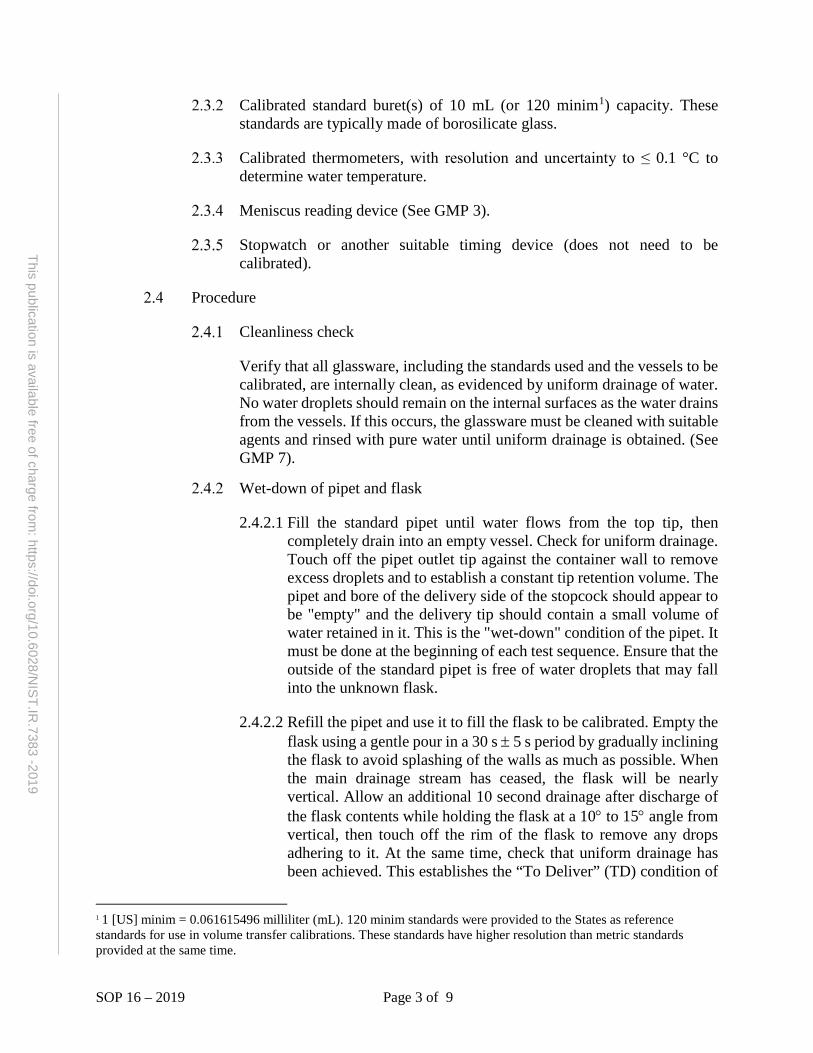
SOP 16 – 2019 Page 3 of 9
This publication is available free of charge from: https://doi.org/10.6028/N
IST.IR.7383 -2019
Calibrated standard buret(s) of 10 mL (or 120 minim1) capacity. These standards are typically made of borosilicate glass.
Calibrated thermometers, with resolution and uncertainty to ≤ 0.1 °C to determine water temperature.
Meniscus reading device (See GMP 3).
Stopwatch or another suitable timing device (does not need to be calibrated).
Procedure
Cleanliness check
Verify that all glassware, including the standards used and the vessels to be calibrated, are internally clean, as evidenced by uniform drainage of water. No water droplets should remain on the internal surfaces as the water drains from the vessels. If this occurs, the glassware must be cleaned with suitable agents and rinsed with pure water until uniform drainage is obtained. (See GMP 7).
Wet-down of pipet and flask
2.4.2.1 Fill the standard pipet until water flows from the top tip, then completely drain into an empty vessel. Check for uniform drainage. Touch off the pipet outlet tip against the container wall to remove excess droplets and to establish a constant tip retention volume. The pipet and bore of the delivery side of the stopcock should appear to be "empty" and the delivery tip should contain a small volume of water retained in it. This is the "wet-down" condition of the pipet. It must be done at the beginning of each test sequence. Ensure that the outside of the standard pipet is free of water droplets that may fall into the unknown flask.
2.4.2.2 Refill the pipet and use it to fill the flask to be calibrated. Empty the flask using a gentle pour in a 30 s ± 5 s period by gradually inclining the flask to avoid splashing of the walls as much as possible. When the main drainage stream has ceased, the flask will be nearly vertical. Allow an additional 10 second drainage after discharge of the flask contents while holding the flask at a 10° to 15° angle from vertical, then touch off the rim of the flask to remove any drops adhering to it. At the same time, check that uniform drainage has been achieved. This establishes the “To Deliver” (TD) condition of
1 1 [US] minim = 0.061615496 milliliter (mL). 120 minim standards were provided to the States as reference standards for use in volume transfer calibrations. These standards have higher resolution than metric standards provided at the same time.
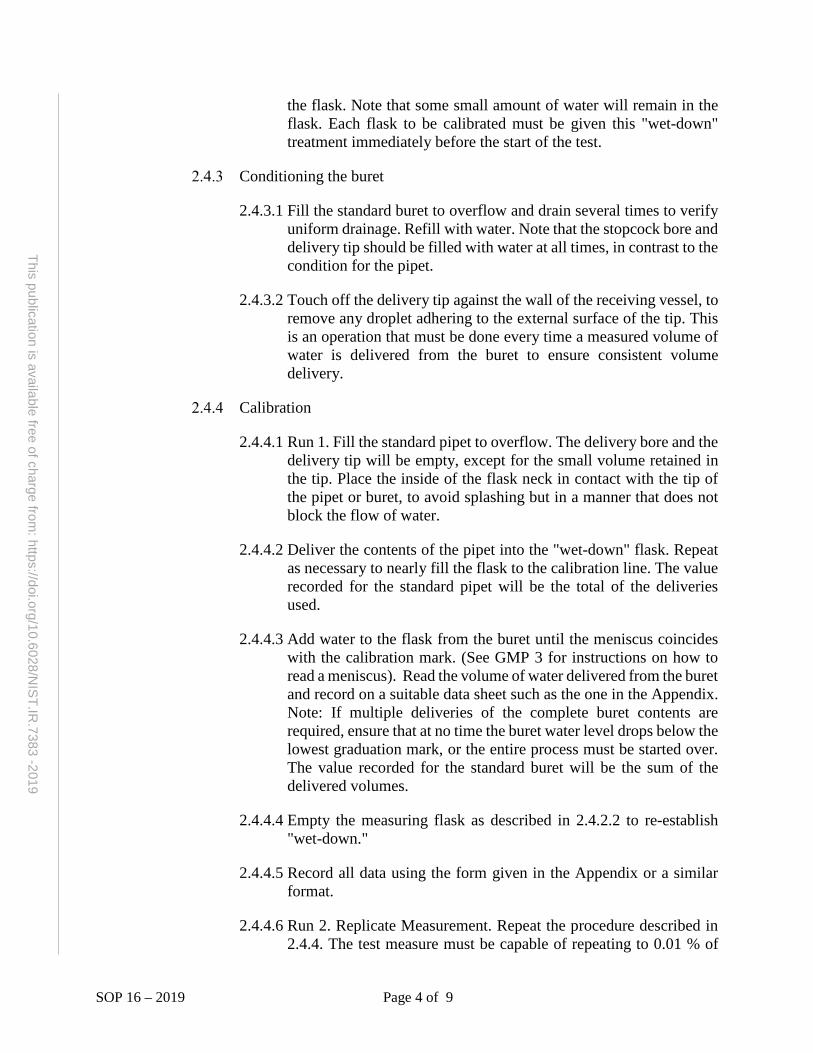
SOP 16 – 2019 Page 4 of 9
This publication is available free of charge from: https://doi.org/10.6028/N
IST.IR.7383 -2019
the flask. Note that some small amount of water will remain in the flask. Each flask to be calibrated must be given this "wet-down" treatment immediately before the start of the test.
Conditioning the buret
2.4.3.1 Fill the standard buret to overflow and drain several times to verify uniform drainage. Refill with water. Note that the stopcock bore and delivery tip should be filled with water at all times, in contrast to the condition for the pipet.
2.4.3.2 Touch off the delivery tip against the wall of the receiving vessel, to remove any droplet adhering to the external surface of the tip. This is an operation that must be done every time a measured volume of water is delivered from the buret to ensure consistent volume delivery.
Calibration
2.4.4.1 Run 1. Fill the standard pipet to overflow. The delivery bore and the delivery tip will be empty, except for the small volume retained in the tip. Place the inside of the flask neck in contact with the tip of the pipet or buret, to avoid splashing but in a manner that does not block the flow of water.
2.4.4.2 Deliver the contents of the pipet into the "wet-down" flask. Repeat as necessary to nearly fill the flask to the calibration line. The value recorded for the standard pipet will be the total of the deliveries used.
2.4.4.3 Add water to the flask from the buret until the meniscus coincides with the calibration mark. (See GMP 3 for instructions on how to read a meniscus). Read the volume of water delivered from the buret and record on a suitable data sheet such as the one in the Appendix. Note: If multiple deliveries of the complete buret contents are required, ensure that at no time the buret water level drops below the lowest graduation mark, or the entire process must be started over. The value recorded for the standard buret will be the sum of the delivered volumes.
2.4.4.4 Empty the measuring flask as described in 2.4.2.2 to re-establish "wet-down."
2.4.4.5 Record all data using the form given in the Appendix or a similar format.
2.4.4.6 Run 2. Replicate Measurement. Repeat the procedure described in 2.4.4. The test measure must be capable of repeating to 0.01 % of
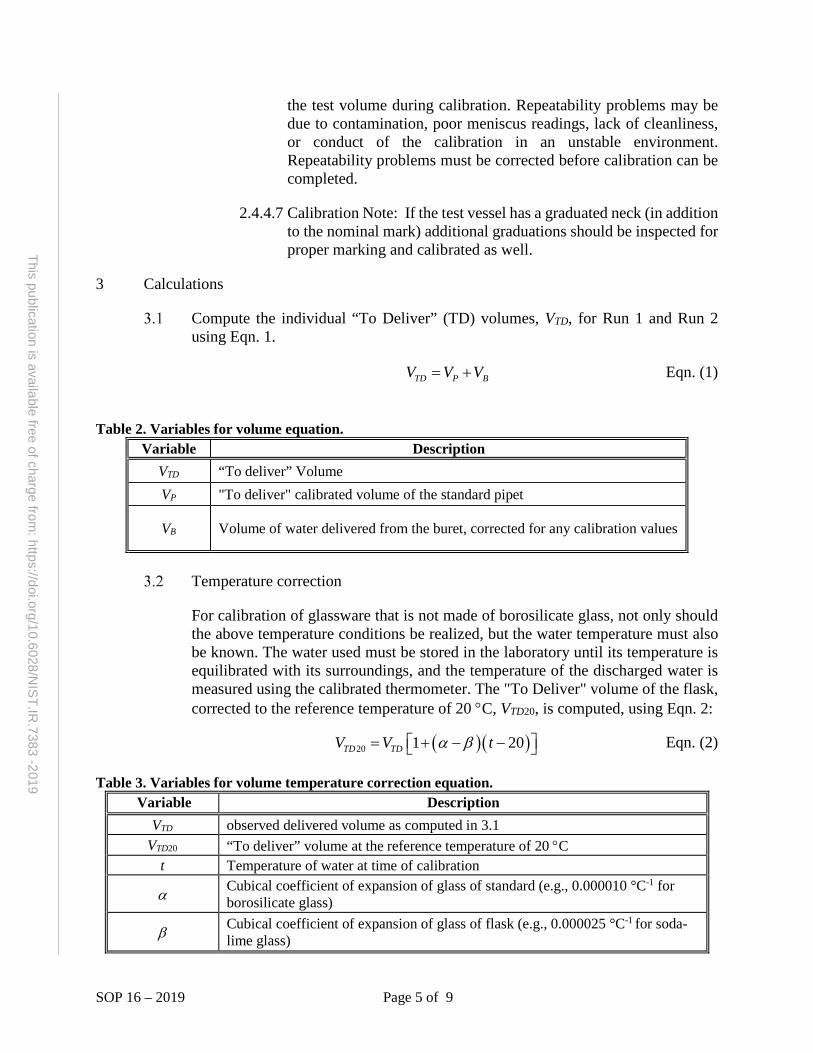
SOP 16 – 2019 Page 5 of 9
This publication is available free of charge from: https://doi.org/10.6028/N
IST.IR.7383 -2019
the test volume during calibration. Repeatability problems may be due to contamination, poor meniscus readings, lack of cleanliness, or conduct of the calibration in an unstable environment. Repeatability problems must be corrected before calibration can be completed.
2.4.4.7 Calibration Note: If the test vessel has a graduated neck (in addition to the nominal mark) additional graduations should be inspected for proper marking and calibrated as well.
3 Calculations
Compute the individual “To Deliver” (TD) volumes, VTD, for Run 1 and Run 2 using Eqn. 1.
TD P BV V V= + Eqn. (1)
Table 2. Variables for volume equation.
Variable Description VTD “To deliver” Volume VP "To deliver" calibrated volume of the standard pipet
VB Volume of water delivered from the buret, corrected for any calibration values
Temperature correction
For calibration of glassware that is not made of borosilicate glass, not only should the above temperature conditions be realized, but the water temperature must also be known. The water used must be stored in the laboratory until its temperature is equilibrated with its surroundings, and the temperature of the discharged water is measured using the calibrated thermometer. The "To Deliver" volume of the flask, corrected to the reference temperature of 20 °C, VTD20, is computed, using Eqn. 2:
( )( )20 1 20TD TDV V tα β = + − − Eqn. (2)
Table 3. Variables for volume temperature correction equation. Variable Description
VTD observed delivered volume as computed in 3.1 VTD20 “To deliver” volume at the reference temperature of 20 °C
t Temperature of water at time of calibration
α Cubical coefficient of expansion of glass of standard (e.g., 0.000010 °C-1 for borosilicate glass)
β Cubical coefficient of expansion of glass of flask (e.g., 0.000025 °C-1 for soda-lime glass)
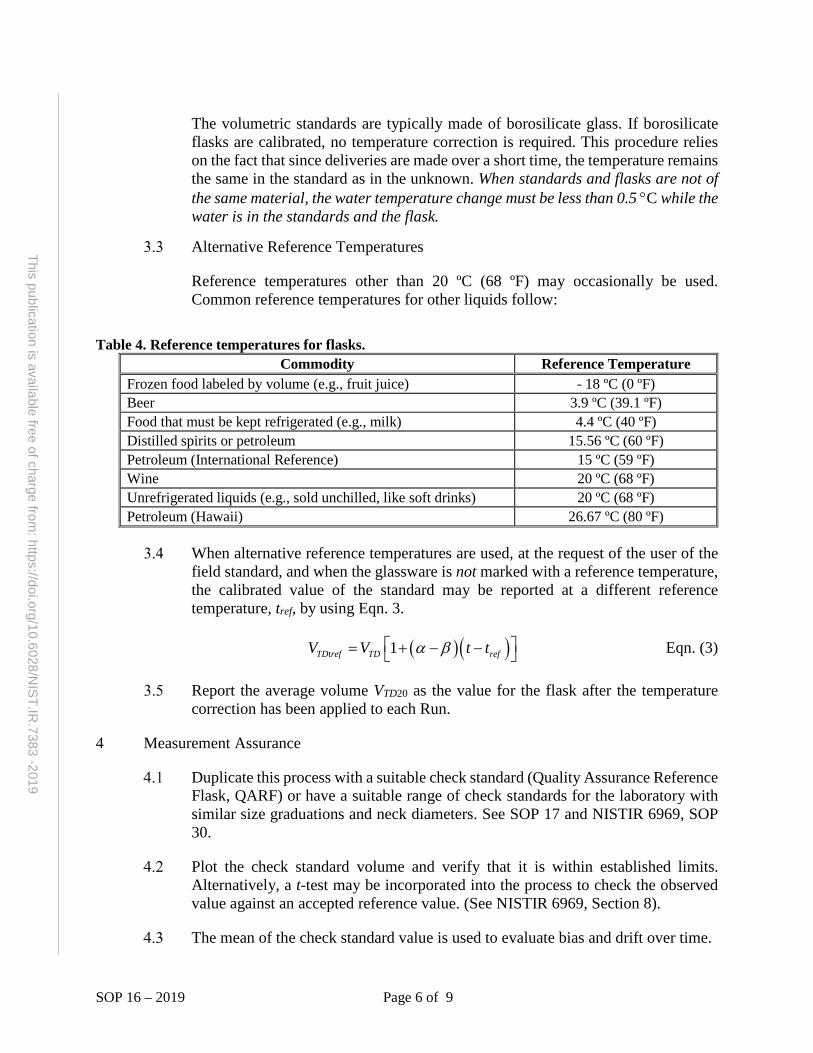
SOP 16 – 2019 Page 6 of 9
This publication is available free of charge from: https://doi.org/10.6028/N
IST.IR.7383 -2019
The volumetric standards are typically made of borosilicate glass. If borosilicate flasks are calibrated, no temperature correction is required. This procedure relies on the fact that since deliveries are made over a short time, the temperature remains the same in the standard as in the unknown. When standards and flasks are not of the same material, the water temperature change must be less than 0.5 °C while the water is in the standards and the flask.
Alternative Reference Temperatures
Reference temperatures other than 20 ºC (68 ºF) may occasionally be used. Common reference temperatures for other liquids follow:
Table 4. Reference temperatures for flasks.
Commodity Reference Temperature Frozen food labeled by volume (e.g., fruit juice) - 18 ºC (0 ºF) Beer 3.9 ºC (39.1 ºF) Food that must be kept refrigerated (e.g., milk) 4.4 ºC (40 ºF) Distilled spirits or petroleum 15.56 ºC (60 ºF) Petroleum (International Reference) 15 ºC (59 ºF) Wine 20 ºC (68 ºF) Unrefrigerated liquids (e.g., sold unchilled, like soft drinks) 20 ºC (68 ºF) Petroleum (Hawaii) 26.67 ºC (80 ºF)
When alternative reference temperatures are used, at the request of the user of the
field standard, and when the glassware is not marked with a reference temperature, the calibrated value of the standard may be reported at a different reference temperature, tref, by using Eqn. 3.
( )( )t 1TD ref TD refV V t tα β = + − − Eqn. (3)
Report the average volume VTD20 as the value for the flask after the temperature correction has been applied to each Run.
4 Measurement Assurance
Duplicate this process with a suitable check standard (Quality Assurance Reference Flask, QARF) or have a suitable range of check standards for the laboratory with similar size graduations and neck diameters. See SOP 17 and NISTIR 6969, SOP 30.
Plot the check standard volume and verify that it is within established limits. Alternatively, a t-test may be incorporated into the process to check the observed value against an accepted reference value. (See NISTIR 6969, Section 8).
The mean of the check standard value is used to evaluate bias and drift over time.
SOP 16 – 2019 Page 7 of 9
This publication is available free of charge from: https://doi.org/10.6028/N
IST.IR.7383 -2019
Check standard observations are used to calculate the standard deviation of the measurement process.
5 Assignment of Uncertainties
The limits of expanded uncertainty, U, include estimates of the standard uncertainty of the laboratory volumetric standards used, us, plus the standard deviation of the process, sp, at the 95 percent level of confidence. See NISTIR 6969, SOP 29 for the complete standard operating procedure for calculating the uncertainty.
The standard uncertainty for the standard, us, is obtained from the calibration certificates for the pipet and buret used for the calibration. The combined standard uncertainty, uc, from the calibration report must be used and not the expanded uncertainty, U. Therefore, the reported uncertainty for the standard will usually need to be divided by a coverage factor, k. Multiple standards are used in this procedure; however, they are typically calibrated independently. Multiple standard uncertainties are handled according to SOP 29.
The standard deviation of the measurement process, sp, is obtained from control chart performance (See SOP 17 or 20, and SOP 30) for a suitable Quality Assurance Reference Flask (QARF) using the same volume transfer procedures on flasks of comparable size and neck dimensions.
Other standard uncertainties usually included at this calibration level include uncertainties associated with the ability to read the meniscus, only part of which is included in the process variability (See GMP 3), the cubical coefficient of expansion for the flask under test, use of proper temperature corrections, the accuracy of temperature measurements taking into consideration potential gradients in the glassware during calibration, round robin or proficiency testing data showing reproducibility, environmental variations over time, and bias or drift of the standard.
Uncertainty Evaluation
Where applicable, uncertainties for volume calibrations that are assessed for conformity must be less than the tolerances specified in Handbook 105-2 and used for decision rules. Where decision rules cannot be met using this procedure, SOP 14, gravimetric calibration is preferred.
6 Calibration Certificate
Report results as described in NISTIR 6969, SOP 1, Preparation of Calibration/Test Results, with the addition of the following items:
“To Contain” or “To Deliver” volume, applicable reference temperature, uncertainty, material, thermal coefficient of expansion (assumed or measured), construction, any identifying markings, tolerances (if appropriate), laboratory
SOP 16 – 2019 Page 8 of 9
This publication is available free of charge from: https://doi.org/10.6028/N
IST.IR.7383 -2019
temperature, water temperature at time of test, barometric pressure, relative humidity, and any out-of-tolerance conditions.
Conformity Assessment
Evaluate compliance to applicable tolerances as needed or required by the customer or by legal metrology requirements. Compliance assessments must note the applicable documentary standard and which portions of the standard were or were not evaluated. The uncertainty for volume calibrations must be less than the tolerances published in the applicable documentary standards. For flasks, where the unknown standard cannot be adjusted, and a portion of the uncertainty band from the error exceeds tolerance limits, it is not appropriate to state compliance with the tolerances unless additional decision rules are communicated with and agreed to by the end user. Correction values (measurement results) may need to be used by the end user in such cases.
7 References
Bean, V. E., Espina, P. I., Wright, J. D., Houser, J. F., Sheckels, S. D., and Johnson, A. N., NIST Calibration Services for Liquid Volume, NIST Special Publication 250-72, National Institute of Standards and Technology, Gaithersburg, MD, (2009).
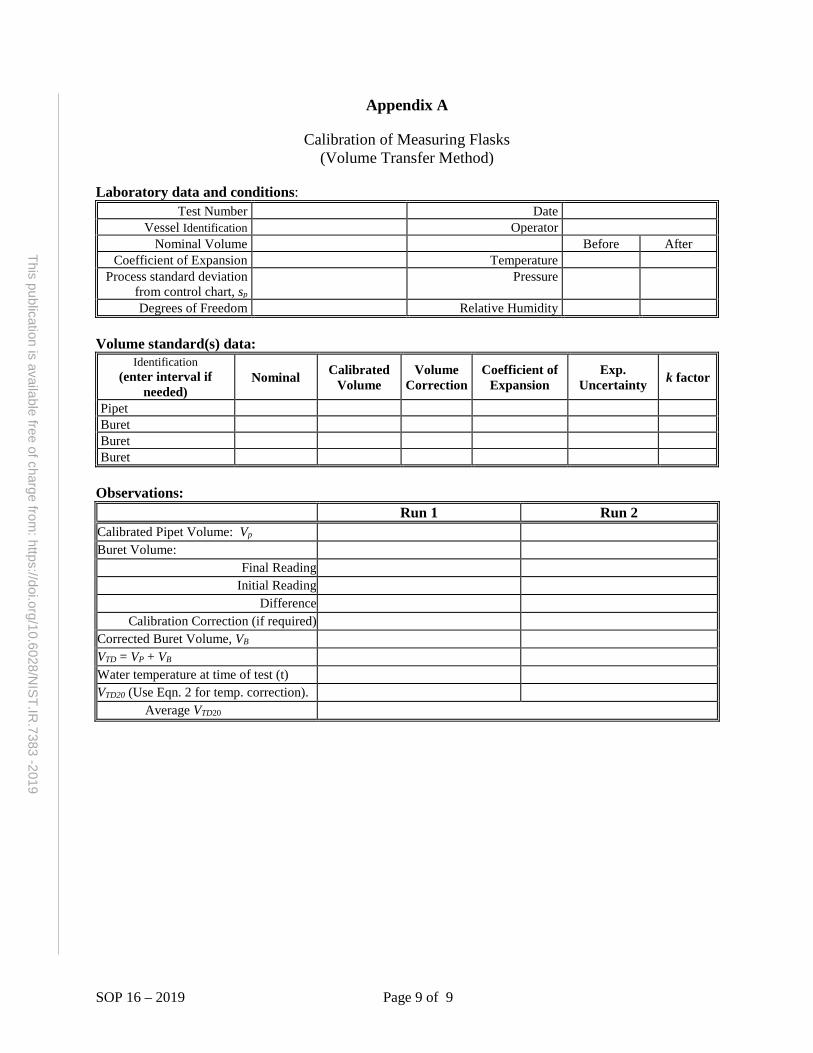
SOP 16 – 2019 Page 9 of 9
This publication is available free of charge from: https://doi.org/10.6028/N
IST.IR.7383 -2019
Appendix A
Calibration of Measuring Flasks (Volume Transfer Method)
Laboratory data and conditions:
Test Number Date Vessel Identification Operator
Nominal Volume Before After Coefficient of Expansion Temperature
Process standard deviation from control chart, sp
Pressure
Degrees of Freedom Relative Humidity Volume standard(s) data:
Identification (enter interval if
needed) Nominal Calibrated
Volume Volume
Correction Coefficient of
Expansion Exp.
Uncertainty k factor
Pipet Buret Buret Buret
Observations: Run 1 Run 2 Calibrated Pipet Volume: Vp Buret Volume:
Final Reading Initial Reading
Difference Calibration Correction (if required)
Corrected Buret Volume, VB VTD = VP + VB Water temperature at time of test (t) VTD20 (Use Eqn. 2 for temp. correction). Average VTD20

This page is intentionally blank.
This publication is available free of charge from: https://doi.org/10.6028/N
IST.IR
.7383-2019
SOP 17 – 2019 Page 1 of 5
This publication is available free of charge from: https://doi.org/10.6028/N
IST.IR.7383 -2019
SOP 17 Standard Operating Procedure for Control Charts of Check Standards
1 Introduction
Purpose
This procedure may be used to develop and maintain control charts to monitor the statistical control of laboratory check standards when replicate measurements are made as a part of the standard operating procedure. This procedure may be used for volume, length, time, or other calibrations when replicate measurements are made. See SOP 20 for standard deviation charts.
Prerequisites
The procedure to be monitored must match the calibration procedure that is used.
Either a check standard at each nominal value is used or a set of check standards are selected to monitor the range of items that are calibrated by the laboratory.
Equipment
A check standard is required and should be constructed of similar materials and design as the standards or devices under calibration. Check standards are maintained in the laboratory as a surrogate for items submitted for routine calibration. Examples of check standards might include a quality assurance reference flask (QARF), a test measure, an extra length standard, or a stopwatch, taking care that all check standards are sufficiently similar to those submitted for calibration to obtain a suitable standard deviation of the measurement process and similar stability over time.
All equipment designated in the applicable SOP.
2 Procedure
Summary
A check standard is obtained and calibrated several times initially to establish a reliable mean value and to estimate the standard deviation of a calibration process using the applicable SOP to define the applicable measurement assurance. A reference value should be obtained from a suitable calibration laboratory or may be determined in the laboratory by using a more accurate and precise calibration than the one that will be monitored provided that the laboratory has adequate training and has demonstrated competency using the better procedure. Directions for preparing and using a control chart for monitoring the mean ( x ) and the standard deviation chart are given. The x control chart monitors the process with respect to both the standard and the variability, while the standard deviation chart monitors
SOP 17 – 2019 Page 2 of 5
This publication is available free of charge from: https://doi.org/10.6028/N
IST.IR.7383 -2019
its short-term precision. When the calibration process is determined to be in a state of statistical control, the calibrations made at that time may be considered valid and the standard deviation of the measurement process may be included in uncertainty calculations using SOP 29.
Note: If a full evaluation of potential bias is desired, it is best if the reference value of the check standard is provided by an outside laboratory accredited to perform the applicable calibrations taking care to ensure that the calibration provider has a sufficiently small uncertainty.
Measure: Obtain Initial Measurements
Calibrate the check standard a minimum of 12 times on different days to establish the baseline chart. A calibration is defined as the result of replicate measurements as required by the SOP (i.e., a complete test consists of the number of runs specified in the SOP). Calibrations may be made on successive days, but no two complete tests should be made on any single day. Note: 25 to 30 points are needed to determine valid uncertainties.
Tabulate the measurement data using the notation and a form such as the one contained in the Appendix of this SOP. The appendix provides an example for duplicate runs only; modifications are needed when other replicates are used. The data may be maintained in a spreadsheet or other electronic program in lieu of a paper form.
Analyze the Measurement Data
A standard deviation may be calculated for each set of runs according to the appropriate SOP. A pooled standard deviation is then determined for the measurement process. When all the runs have the same number of replicates, each test will have the same number of degrees of freedom and an average of the standard deviations may be used. Use of a standard deviation of replicate measurements is preferred to the use of Range charts (see SOP 20 for guidance on Range charts).
Construction of Control Charts. See also SOP 9.
Construct the following control charts using the data of section 2.2.
Construct an x control chart for a check standard with the following control limits:
Reference value: (when available) Central Line: x (mean of the average values)
Lower warning limit (LWL): 2 psx −Lower control (or action) limit (LCL): 3 psx −
Upper warning limit (UWL): 2 psx +
Upper control (or action) limit (UCL): 3 psx +
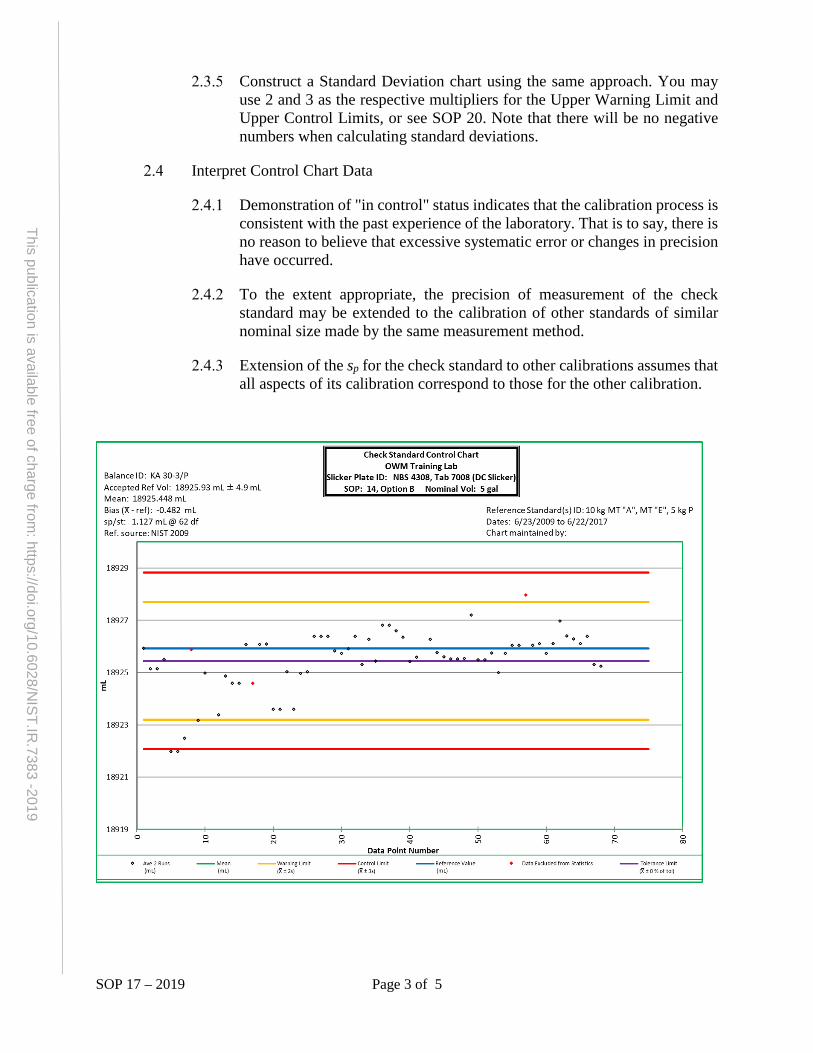
SOP 17 – 2019 Page 3 of 5
This publication is available free of charge from: https://doi.org/10.6028/N
IST.IR.7383 -2019
Construct a Standard Deviation chart using the same approach. You may use 2 and 3 as the respective multipliers for the Upper Warning Limit and Upper Control Limits, or see SOP 20. Note that there will be no negative numbers when calculating standard deviations.
Interpret Control Chart Data
Demonstration of "in control" status indicates that the calibration process is consistent with the past experience of the laboratory. That is to say, there is no reason to believe that excessive systematic error or changes in precision have occurred.
To the extent appropriate, the precision of measurement of the check standard may be extended to the calibration of other standards of similar nominal size made by the same measurement method.
Extension of the sp for the check standard to other calibrations assumes that all aspects of its calibration correspond to those for the other calibration.
SOP 17 – 2019 Page 4 of 5
This publication is available free of charge from: https://doi.org/10.6028/N
IST.IR.7383 -2019
Control the Measurement Process
An appropriate check standard is calibrated each time the laboratory performs calibrations using the SOP or on a set periodic basis if many calibrations are performed by the laboratory. If the calibrations extend over several days, the check standard is calibrated daily. The values of x and sp for each calibration of the check standard are plotted on the respective charts, preferably in sequential order. The limits on the charts are such that 95 % of the values should fall within the warning limits and rarely should a value fall outside of the control limits, provided the system is in a state of statistical control.
If the plotted value of x lies outside of the control limits and the corresponding value on the standard deviation chart is within the control limits, a source of systematic error is suspected.
If the values for the standard deviation chart fall outside of the warning limits but inside of the control limits, a decrease in precision is indicated. Other problems should be investigated.
No calibration data should be accepted when the system is out of control.
If the plotted values for either x , or sp are outside of the warning limits but inside of the control limits, a second set of duplicate calibrations should be made. If the new values are within the warning limits, the process may be considered in control. If they lie outside of the warning limits, lack of control is indicated. Investigation actions should be taken and attainment of control demonstrated before calibration measurements are considered acceptable.
Even while the system is in an apparent state of control, incipient troubles may be indicated when the control data show short- or long-term trends, shifts, or runs. The t-test and F-test may be used to assess the significance of such observations (see NIST IR 6969 Sections 8.9, 8.10, and 8.11).
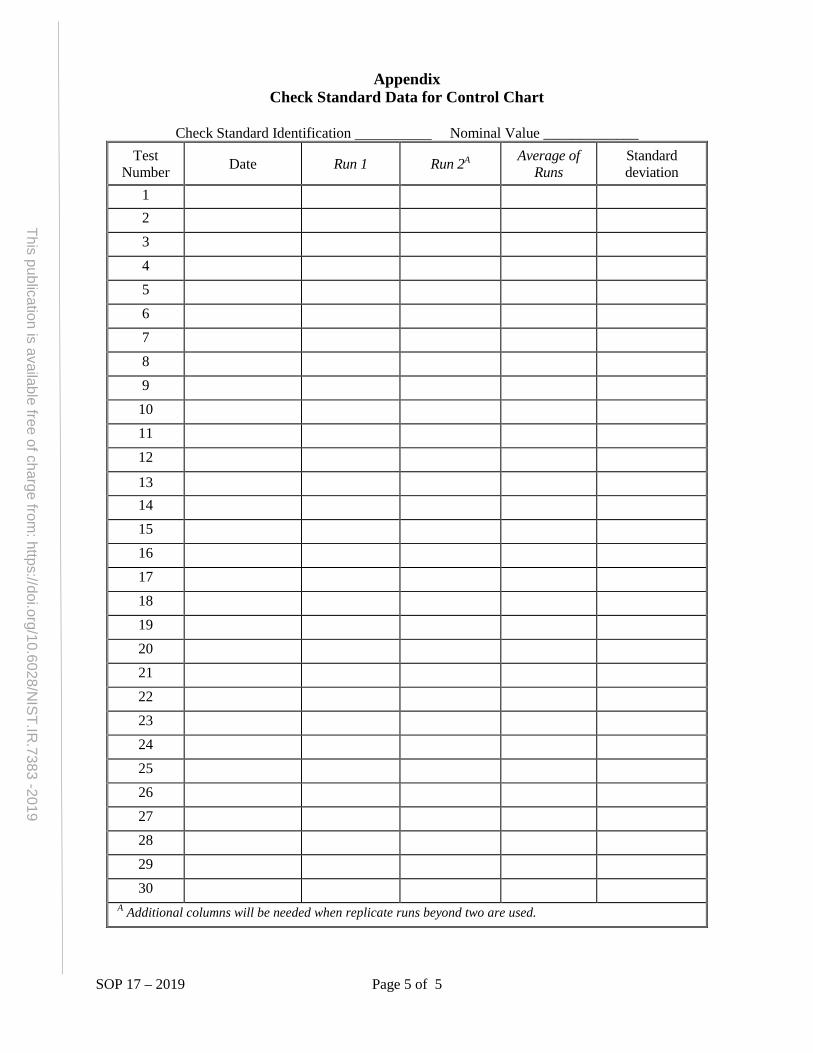
SOP 17 – 2019 Page 5 of 5
This publication is available free of charge from: https://doi.org/10.6028/N
IST.IR.7383 -2019
Appendix Check Standard Data for Control Chart
Check Standard Identification Nominal Value _____________ Test
Number Date Run 1 Run 2A Average of Runs
Standard deviation
1 2 3 4 5 6 7 8 9
10 11 12
13 14 15 16 17 18 19 20 21 22 23 24 25 26 27 28 29 30
A Additional columns will be needed when replicate runs beyond two are used.

This page is intentionally blank.
This publication is available free of charge from: https://doi.org/10.6028/N
IST.IR
.7383-2019
SOP 18 – 2019 Page 1 of 11
This publication is available free of charge from: https://doi.org/10.6028/N
IST.IR.7383 -2019
SOP 18
Standard Operating Procedure for Calibration of Graduated Neck-Type Metal Volumetric Field Standards
Using a Slicker-Plate Type1
1 Introduction
Purpose of Test
This procedure may only be used to calibrate small non-pressurized, graduated neck-type, metal field standards such as the 5 gal (or 20 L) standards used by weights and measures officials to test liquid dispensing equipment, gasoline pumps within a narrow range of laboratory and water temperatures (e.g., laboratory and water temperatures between 50 °F and 70 °F) and for test measure graduations that are at least 1 in³. Outside these limitations, SOP 19 is required.
Conformity Assessment
The test measure or prover being calibrated should be evaluated for conformance to appropriate specifications and tolerances (using the checklist provided in NIST Handbook 105-3, Specifications and Tolerances for Graduated Neck Type Volumetric Field Standards, 2010) if being used for legal weights and measures applications. (Alternatively, if requested by the customer, evaluation against OIML R 120 (2010), Standard capacity measures for testing measuring systems for liquids other than water, may be referenced). Where compliance is required by law, conformity evaluations should be conducted prior to performing calibrations. See Section 6.2 for reporting results.
Limiting factors:
This procedure uses a slicker-plate type standard to fill an unknown test measure of equal nominal volume in one delivery. It requires water temperature stability during the transfer from the standard to the unknown test measure within the limits shown in Table 1. SOP 19 is a more appropriate procedure when temperature corrections are needed due to lack of water equilibration, temperature differences between the standard and unknown provers, performance of the calibration outside the stated temperature range, and for unstable environments. Even water that is temperature-equilibrated with the laboratory environment may not provide adequate measurement results depending on test measure resolutions.
If the limits in Table 1 are exceeded, or materials other than stainless steel and mild steel are used, use SOP 19. These limits are to ensure that the impact of errors resulting from temperature differences on measured values is less than the
1 Non-SI units are predominately in common use in State legal metrology laboratories, and/or the petroleum industry for many volumetric measurements, therefore non-SI units have been used to reflect the practical needs of the laboratories performing these measurements as appropriate. Most laboratory standards for this calibration procedure are 5 gal “slicker-plate” type standards. Very few laboratories have 20 L “slicker-plate” type standards.
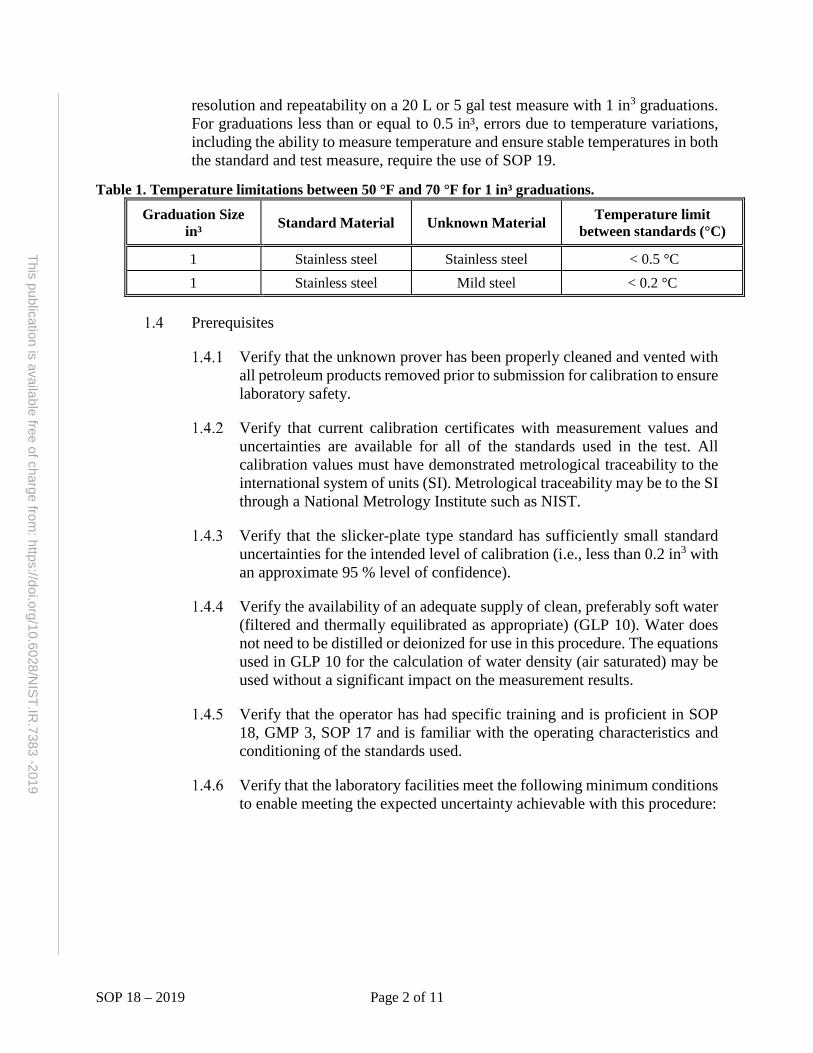
SOP 18 – 2019 Page 2 of 11
This publication is available free of charge from: https://doi.org/10.6028/N
IST.IR.7383 -2019
resolution and repeatability on a 20 L or 5 gal test measure with 1 in3 graduations. For graduations less than or equal to 0.5 in³, errors due to temperature variations, including the ability to measure temperature and ensure stable temperatures in both the standard and test measure, require the use of SOP 19.
Table 1. Temperature limitations between 50 °F and 70 °F for 1 in³ graduations.
Graduation Size in³ Standard Material Unknown Material Temperature limit
between standards (°C)
1 Stainless steel Stainless steel < 0.5 °C 1 Stainless steel Mild steel < 0.2 °C
Prerequisites
Verify that the unknown prover has been properly cleaned and vented with all petroleum products removed prior to submission for calibration to ensure laboratory safety.
Verify that current calibration certificates with measurement values and uncertainties are available for all of the standards used in the test. All calibration values must have demonstrated metrological traceability to the international system of units (SI). Metrological traceability may be to the SI through a National Metrology Institute such as NIST.
Verify that the slicker-plate type standard has sufficiently small standard uncertainties for the intended level of calibration (i.e., less than 0.2 in3 with an approximate 95 % level of confidence).
Verify the availability of an adequate supply of clean, preferably soft water (filtered and thermally equilibrated as appropriate) (GLP 10). Water does not need to be distilled or deionized for use in this procedure. The equations used in GLP 10 for the calculation of water density (air saturated) may be used without a significant impact on the measurement results.
Verify that the operator has had specific training and is proficient in SOP 18, GMP 3, SOP 17 and is familiar with the operating characteristics and conditioning of the standards used.
Verify that the laboratory facilities meet the following minimum conditions to enable meeting the expected uncertainty achievable with this procedure:
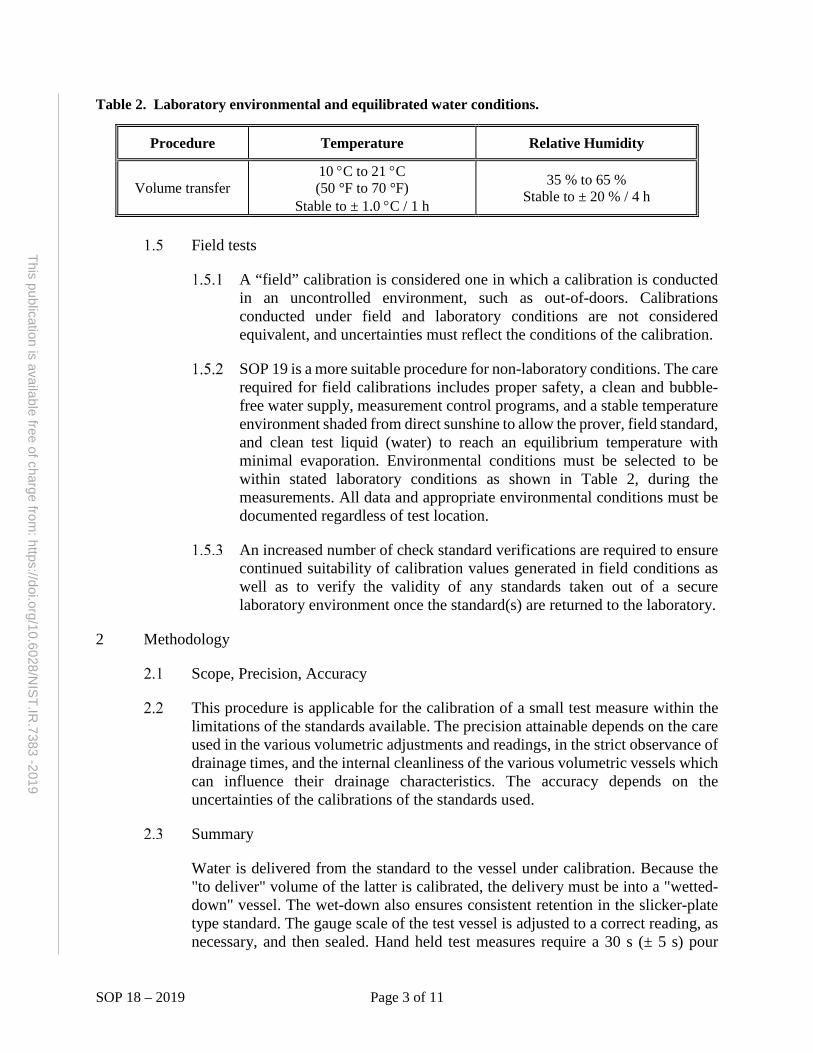
SOP 18 – 2019 Page 3 of 11
This publication is available free of charge from: https://doi.org/10.6028/N
IST.IR.7383 -2019
Table 2. Laboratory environmental and equilibrated water conditions.
Procedure Temperature Relative Humidity
Volume transfer 10 °C to 21 °C (50 °F to 70 °F)
Stable to ± 1.0 °C / 1 h
35 % to 65 % Stable to ± 20 % / 4 h
Field tests
A “field” calibration is considered one in which a calibration is conducted in an uncontrolled environment, such as out-of-doors. Calibrations conducted under field and laboratory conditions are not considered equivalent, and uncertainties must reflect the conditions of the calibration.
SOP 19 is a more suitable procedure for non-laboratory conditions. The care required for field calibrations includes proper safety, a clean and bubble-free water supply, measurement control programs, and a stable temperature environment shaded from direct sunshine to allow the prover, field standard, and clean test liquid (water) to reach an equilibrium temperature with minimal evaporation. Environmental conditions must be selected to be within stated laboratory conditions as shown in Table 2, during the measurements. All data and appropriate environmental conditions must be documented regardless of test location.
An increased number of check standard verifications are required to ensure continued suitability of calibration values generated in field conditions as well as to verify the validity of any standards taken out of a secure laboratory environment once the standard(s) are returned to the laboratory.
2 Methodology
Scope, Precision, Accuracy
This procedure is applicable for the calibration of a small test measure within the limitations of the standards available. The precision attainable depends on the care used in the various volumetric adjustments and readings, in the strict observance of drainage times, and the internal cleanliness of the various volumetric vessels which can influence their drainage characteristics. The accuracy depends on the uncertainties of the calibrations of the standards used.
Summary
Water is delivered from the standard to the vessel under calibration. Because the "to deliver" volume of the latter is calibrated, the delivery must be into a "wetted-down" vessel. The wet-down also ensures consistent retention in the slicker-plate type standard. The gauge scale of the test vessel is adjusted to a correct reading, as necessary, and then sealed. Hand held test measures require a 30 s (± 5 s) pour
SOP 18 – 2019 Page 4 of 11
This publication is available free of charge from: https://doi.org/10.6028/N
IST.IR.7383 -2019
followed by a 10 s drain, with the measure held at a 10 degree to 15 degree angle from vertical, during calibration and use. Provers are emptied by gravity drain, followed by a 30 s final drain after the cessation of the main flow.
Standards and Equipment
Calibrated slicker-plate type standard made of stainless steel.
Calibrated thermometer, with a resolution and uncertainty less than 0.1 °C.
Meniscus reading device. See GMP 3.
Timing device (calibration is not required; uncertainty of the measurement only needs to be less than 5 s for a 30 s pour or drain time).
Procedure
Cleanliness Verification - Fill and drain both standard and vessel to be calibrated and check for any soiling that would affect drainage, as evidenced by clinging droplets, greasy films, and the like. Clean either or both with non-foaming detergent and water, as necessary, and rinse thoroughly. Note: Many laboratories have a policy regarding cleanliness of submitted volumetric standards to minimize water contamination with flammable petroleum products. See GMP 6.
Fill the standard with water and then transfer the water into the unknown prover establishing a wet down of the standard. Wait 30 s after the cessation of the main flow on the standard before closing the drain valve.
Wet down the unknown test measure or prover to its nominal level and empty it following the applicable procedure. Hand held test measures require a 30 s (± 5 s) pour followed by a 10 s drain, with the measure held at a 10 degree to 15 degree angle from vertical, touching off any adhering drop from the neck, during calibration and use. Provers are emptied by gravity drain, followed by a 30 s final drain after the cessation of flow.
Note: Filling the vessel from the slicker-plate type standard following the instructions in steps 2.5.1, 2.5.2, and 2.5.3 will ensure that both the standard and vessel are properly “wetted-down”.
Run 1. Fill the slicker-plate standard with water by placing the fill tube or hose inside the standard near the bottom to minimize air bubbles. Fill the standard to slightly higher than the rim as the water level is raised by surface tension. Ensure that the reference standard is level to ensure consistent drain and retention characteristics. Measure and record the temperature in the standard. Use the slicker plate to strike off excess water, checking to see that no air bubbles are entrained in the water during this process.
SOP 18 – 2019 Page 5 of 11
This publication is available free of charge from: https://doi.org/10.6028/N
IST.IR.7383 -2019
Position the unknown vessel beneath the slicker-plate standard drain valve or piping to be sure no water is lost. Open the valve at the base of the standard at the same time as removing the slicker plate from the top of the standard to transfer water from the standard to the wet-down vessel. Allow a 30 s drain period after cessation of the main flow on the standard. Close the valve on the slicker-plate standard and then move the unknown vessel from beneath the drain valve or piping to prevent additional water transfer.
Level the test measure or prover and verify that the neck of the unknown test measure is vertical, or perpendicular to a level horizontal plane, by placing a level on the side of the neck as specified in NIST Handbook 105-3 (or suspend by its handle, if appropriate). Read and record the gauge reading. Measure and record the temperature of water in the unknown measure. If the temperature change between the standard and unknown test measure exceeds the allowable limits shown in Table 1, use SOP 19.
Adjust the graduated scale of the vessel as described in 3.3 if needed. Seal the scale adjustment device.
Run 2. Make a duplicate determination.
Replicate runs of the test measure or prover must agree within ± 0.02 % of the nominal volume during calibration at the reference temperature (± 0.2 in3 for 5 gal test measure), pass the F-test, or be within the limits on the standard deviation or range charts (as applicable). Agreement of 0.02 % is calculated as the difference between two consecutive runs, divided by the nominal volume, and then multiplied by 100.
Note: If excess disagreement between the runs is observed, check all vessels for cleanliness, leaks, or other damage, identify and correct any problems. Agreement problems may be due to temperature changes, contamination or lack of cleanliness, or poor field conditions, such as when calibration is conducted in an unstable environment. Agreement problems must be corrected before calibration can be completed.
3 Calculations
When the water temperature is reasonably close to 60 °F, the coefficients of expansion of the standard and the test vessel are sufficiently close together, and the deliveries and readings are made over a short period of time, temperature corrections are not made in this procedure. When conditions are not reasonably close to 60 ºF and temperature corrections are needed, use SOP 19. Calculations provided in SOP 19 may be required for reporting volumetric results.
Within the accuracy requirements of Table 1, no temperature corrections arising from dissimilarities of the standard and vessel are used. If differences are suspected or observed, use SOP 19.
SOP 18 – 2019 Page 6 of 11
This publication is available free of charge from: https://doi.org/10.6028/N
IST.IR.7383 -2019
The reading of Run 1 is used to adjust the scale of the vessel, if necessary, to the correct reading, which is set at the calibrated volume of the slicker-plate standard at 60 °F. Record the adjusted value as the “as left” value. Run 2 will validate the setting. Alternatively, the average of Run 1 and Run 2 may be used with the adjustment made after Run 2. In that case, a validation run should be conducted to ensure correct setting of the gage plate.
Note: When the accuracy requirements necessitate a temperature correction, the temperature of the water that has been recorded in both the standard and the unknown should be used to perform calculations according to the procedure given in SOP 19.
Determine and report the volume of the test vessel as follows:
Prover volume gauge readingS V= − Eqn. (1)
where: VS = Volume of the slicker-plate standard at the appropriate reference temperature (usually 60 °F).
Calculate the within process standard deviation, sw, for the replicate runs. The degrees of freedom for this SOP is one. This value is plotted on the standard deviation chart and may be used to incorporate an F-test as well.
If the F-test is used, calculate the F statistic to compare the observed within process standard deviation, sw, to the accepted (pooled) within process standard deviation for the measurement process. (See NISTIR 6969, Sections 8.4 and 8.9.2, for more information on pooling standard deviations and F-tests).
2Accepted
2Observed
w
w
ssF = Eqn. (1)
Where used, the calculated F statistic must be less than the F value obtained from an F table at 95 % confidence level (Table 9.12, NISTIR 6969) to be acceptable. The F value is obtained from the F-table for one degrees of freedom for the numerator and the degrees of freedom for the denominator is equal to the number of degrees of freedom in the pooled within process standard deviation. If the repeatability evaluation fails and the source of the error cannot be determined conclusively, the measurement must be repeated (or possibly, the test measure must be rejected).
Calculate and report the mean volume of the volumetric standard at its applicable reference temperature.
If adjustments were made during replicate runs, report the “as found” volume or the mean of “as found” volumes and also the “as left” volume or mean of “as left” volumes, as applicable, at the appropriate reference temperature. (I.e., do not

SOP 18 – 2019 Page 7 of 11
This publication is available free of charge from: https://doi.org/10.6028/N
IST.IR.7383 -2019
calculate a mean value by combining “as found” and “as left” values when adjustments are made).
4 Measurement Assurance
Duplicate the process with a suitable check standard. See SOP 17 or SOP 30. Plot the check standard volume and verify that it is within established limits. The mean of the check standard observations may be used to evaluate bias and drift over time when a reference value for the check standard is available. Check standard observations are used to calculate the standard deviation of the measurement process which contributes to the Type A uncertainty components.
A t-test may be incorporated to check the observed value against an accepted value.
( )p
cc
sSS
t−
= Eqn. (2)
The t-statistic is evaluated using Eqn. 2 with a 95 % confidence level. All values must be entered in the control chart, even if failing this statistic to ensure the variability obtained for the process is truly representative of the process and not unduly reduced over time. The observed value of the check standard is compared to the accepted mean value of the check standard and divided by the standard deviation for the check standard observations over time. The limits for the t-test are based on applicable warning and action limits on the control chart. The applicable limits are shown in SOP 20 and based on the number of replicates.
A standard deviation chart is also used for measurement assurance through the evaluation of replicate measurements. The standard deviation of each combination of Run 1 and Run 2 is calculated and the pooled (or average) standard deviation over time may be used to estimate the short-term variability in the measurement process. The short-term standard deviation may be used with an F-test (observed vs. accepted) to assess the measurement process. A standard deviation chart for unknown provers represents the variability in condition of test measures submitted for calibration as well as the short-term repeatability of the measurement process but does not monitor the stability of the reference standard.
For unknown standards that are adjusted, do not combine an “as found” value with an “as left” value for the two runs recorded in the chart; use the adjusted value from Run 1 and the value from Run 2, both at the applicable reference temperature, when entering values in a standard deviation or range chart.
5 Assignment of Uncertainties
The limits of expanded uncertainty, U, include estimates of the standard uncertainty of the laboratory volumetric standards used, us, plus the standard deviation of the process, sp, and the additional items noted below and in the uncertainty budget table, Table 3, at an approximate 95 %
SOP 18 – 2019 Page 8 of 11
This publication is available free of charge from: https://doi.org/10.6028/N
IST.IR.7383 -2019
level of confidence. See SOP 29 for the complete standard operating procedure for calculating the uncertainty.
The standard uncertainty for the standard, us, is obtained from the calibration certificate. The combined standard uncertainty, uc, is used and not the expanded uncertainty, U, therefore the reported uncertainty for the standard will usually need to be divided by the coverage factor k.
The standard deviation of the measurement process, sp, is obtained from a control chart for the check standard so that it reflects performance over time (See SOP 17 or 20, and SOP 30). The larger of the value from the standard deviation over time for a check standard from Section 4.1 or from the standard deviation chart taken from Section 4.2 is used in the uncertainty calculations. Where multiple staff members perform this calibration and obtain values for the check standard, the standard deviation for a check standard may represent variability and systematic errors associated with the meniscus reading. When a standard deviation chart is used alone, the repeatability represents the process only and does not represent potential systematic differences in meniscus readings. In a laboratory with only one staff member performing calibration and entering data for a check standard, additional uncertainties for meniscus readings are needed per Section 5.3 and GMP 3.
Other standard uncertainties usually included at this calibration level primarily include 1) uncertainties associated with the ability to read the meniscus, only part of which is included in the process variability due to parallax and visual capabilities (See GMP 3), and 2) uncorrected temperature corrections related to the cubical coefficient of expansion for the prover under test, use of proper temperature corrections, and the accuracy of temperature measurements. Additional factors that might be included are: round robin or proficiency testing data showing bias, environmental variations over time, and drift of the standard as noted in control charts.
To properly evaluate uncertainties and user requirements (tolerances), assessment of additional user uncertainties may be required by laboratory staff. Through proper use of documented laboratory and field procedures, additional uncertainty factors may be minimized to a level that does not contribute significantly to the previously described factors. Additional standard uncertainties in the calibration of field standards and their use in meter verification may include: how the prover level is established, how delivery and drain times are determined, the use of a proper “wet-down” prior to calibration or use, the cleanliness of the prover and calibration medium, prover retention characteristics related to inside surface, contamination or corrosion, total drain times, and possible air entrapment in the water.
Example components to be considered for an uncertainty budget table are shown in Table 3.
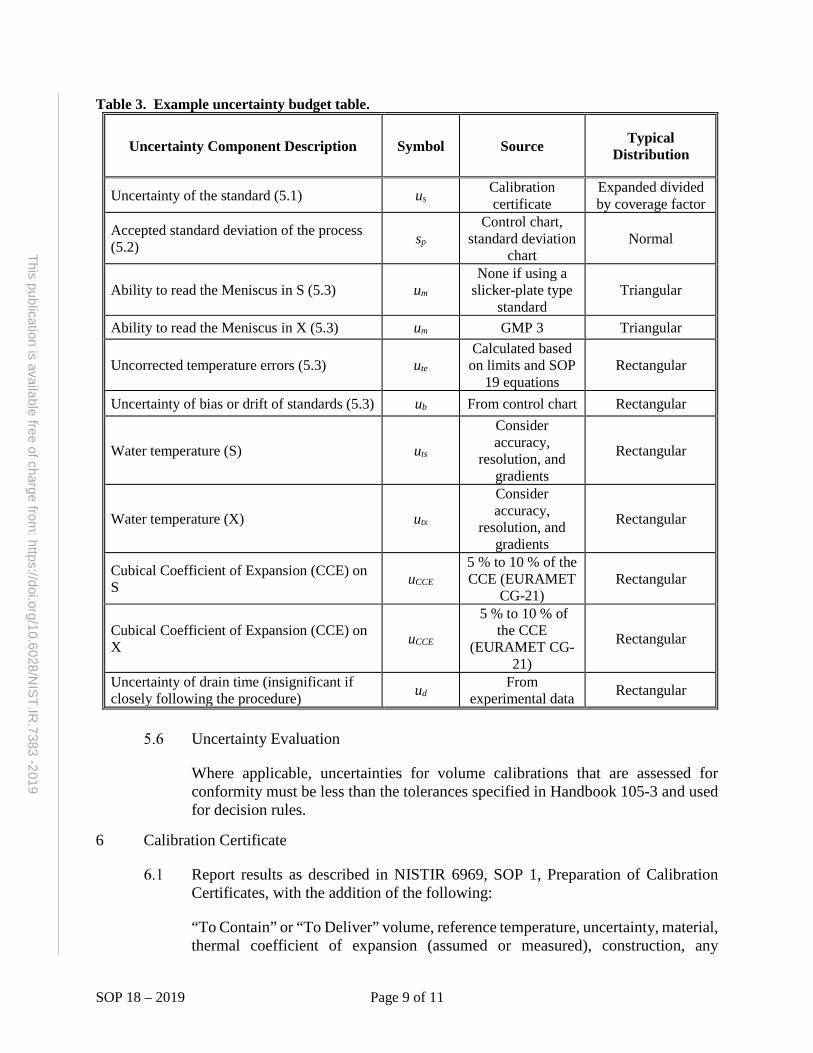
SOP 18 – 2019 Page 9 of 11
This publication is available free of charge from: https://doi.org/10.6028/N
IST.IR.7383 -2019
Table 3. Example uncertainty budget table.
Uncertainty Component Description Symbol Source Typical Distribution
Uncertainty of the standard (5.1) us Calibration certificate
Expanded divided by coverage factor
Accepted standard deviation of the process (5.2) sp
Control chart, standard deviation
chart Normal
Ability to read the Meniscus in S (5.3) um None if using a
slicker-plate type standard
Triangular
Ability to read the Meniscus in X (5.3) um GMP 3 Triangular
Uncorrected temperature errors (5.3) ute Calculated based on limits and SOP
19 equations Rectangular
Uncertainty of bias or drift of standards (5.3) ub From control chart Rectangular
Water temperature (S) uts
Consider accuracy,
resolution, and gradients
Rectangular
Water temperature (X) utx
Consider accuracy,
resolution, and gradients
Rectangular
Cubical Coefficient of Expansion (CCE) on S uCCE
5 % to 10 % of the CCE (EURAMET
CG-21) Rectangular
Cubical Coefficient of Expansion (CCE) on X uCCE
5 % to 10 % of the CCE
(EURAMET CG-21)
Rectangular
Uncertainty of drain time (insignificant if closely following the procedure) ud From
experimental data Rectangular
Uncertainty Evaluation
Where applicable, uncertainties for volume calibrations that are assessed for conformity must be less than the tolerances specified in Handbook 105-3 and used for decision rules.
6 Calibration Certificate
Report results as described in NISTIR 6969, SOP 1, Preparation of Calibration Certificates, with the addition of the following:
“To Contain” or “To Deliver” volume, reference temperature, uncertainty, material, thermal coefficient of expansion (assumed or measured), construction, any
SOP 18 – 2019 Page 10 of 11
This publication is available free of charge from: https://doi.org/10.6028/N
IST.IR.7383 -2019
identifying markings, tolerances (if appropriate), laboratory temperature, water temperature(s) at time of test, barometric pressure, relative humidity, and any out–of-tolerance conditions.
Conformity Assessment
Evaluate compliance to applicable tolerances as needed or required by the customer or by legal metrology requirements. Compliance assessments must note the applicable documentary standard and which portions of the standard were or were not evaluated. The uncertainty for volume calibrations must be less than the tolerances published in the applicable documentary standards. For volume calibrations where the unknown standard can be adjusted, it is standard practice to adjust the standard or leave the scale plate in a position close enough to its nominal volume to ensure that the absolute value of the measurement result plus the uncertainty is less than the applicable tolerance. Where the unknown standard cannot be adjusted, and a portion of the uncertainty band from the error exceeds tolerance limits, it is not appropriate to state compliance with the tolerances unless additional decision rules are communicated with and agreed to by the end user. Correction values (measurement results) may need to be used by the end user in such cases.
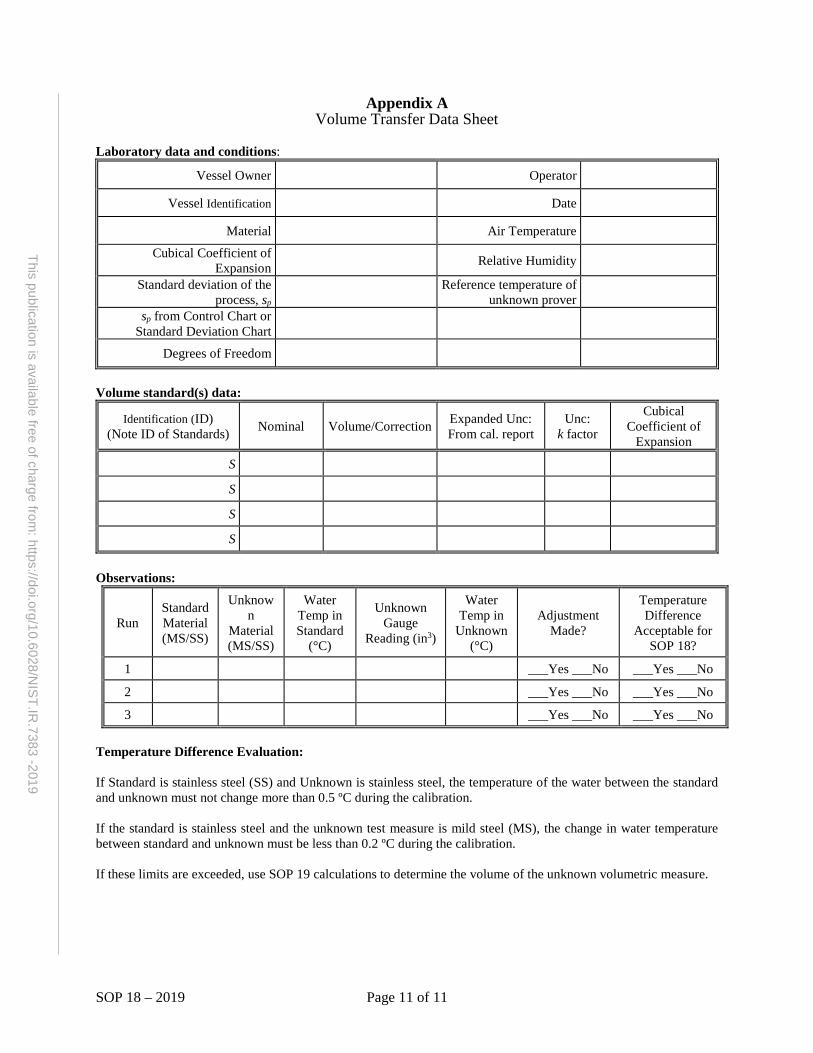
SOP 18 – 2019 Page 11 of 11
This publication is available free of charge from: https://doi.org/10.6028/N
IST.IR.7383 -2019
Appendix A Volume Transfer Data Sheet
Laboratory data and conditions:
Vessel Owner Operator
Vessel Identification Date
Material Air Temperature
Cubical Coefficient of Expansion Relative Humidity
Standard deviation of the process, sp
Reference temperature of unknown prover
sp from Control Chart or Standard Deviation Chart
Degrees of Freedom
Volume standard(s) data:
Identification (ID) (Note ID of Standards) Nominal Volume/Correction Expanded Unc:
From cal. report Unc:
k factor
Cubical Coefficient of
Expansion
S
S
S
S
Observations:
Run Standard Material (MS/SS)
Unknown
Material (MS/SS)
Water Temp in Standard
(°C)
Unknown Gauge
Reading (in3)
Water Temp in
Unknown (°C)
Adjustment Made?
Temperature Difference
Acceptable for SOP 18?
1 ___Yes ___No ___Yes ___No
2 ___Yes ___No ___Yes ___No
3 ___Yes ___No ___Yes ___No Temperature Difference Evaluation: If Standard is stainless steel (SS) and Unknown is stainless steel, the temperature of the water between the standard and unknown must not change more than 0.5 ºC during the calibration. If the standard is stainless steel and the unknown test measure is mild steel (MS), the change in water temperature between standard and unknown must be less than 0.2 ºC during the calibration. If these limits are exceeded, use SOP 19 calculations to determine the volume of the unknown volumetric measure.

This page is intentionally blank.
This publication is available free of charge from: https://doi.org/10.6028/N
IST.IR
.7383-2019
SOP 19 – 2019 Page 1 of 18
This publication is available free of charge from: https://doi.org/10.6028/N
IST.IR.7383 -2019
SOP 19 Standard Operating Procedure for
Calibration of Graduated Neck-Type Metal Provers (Volume Transfer Method)1
1 Introduction
Purpose of Test
This procedure is used to calibrate graduated neck type metal test measures and provers (20 L (5 gal) and larger) that are used in verification of petroleum, biodiesel, ethanol, milk, and/or water meters. Detailed measurement ranges, standards, equipment, and uncertainties for this SOP are generally compiled in a separate document in the laboratory.
Conformity Assessment
Standards that are calibrated for use in legal weights and measures applications should be evaluated for conformance to the appropriate specifications and tolerances that apply. Test measures or provers being calibrated should be evaluated using the checklist provided in NIST Handbook 105-3, Specifications and Tolerances for Graduated Neck Type Volumetric Field Standards, 2010. Alternatively, if requested by the customer, evaluation against OIML R 120 (2010), Standard capacity measures for testing measuring systems for liquids other than water, may be referenced. Where compliance is required by law, conformity evaluations should be conducted prior to performing calibrations. See Section 6.2 for reporting results.
Prerequisites
Verify that the unknown prover has been properly cleaned and vented, with all petroleum products removed prior to submission for calibration to ensure laboratory safety and compliance with environmental disposal requirements. The prover may be visually inspected to determine that residual liquid petroleum products are not present. Smell is not necessarily an adequate indicator of cleanliness.
Note: Many laboratories have a policy regarding cleanliness of submitted volumetric standards to minimize water contamination with flammable petroleum products.
Verify that valid current calibration certificates with measurement values and uncertainties are available for all the standards used in the test. All calibration values must have demonstrated metrological traceability to the
1 Non-SI units are predominately in common use in State legal metrology laboratories, and/or the petroleum industry for many volumetric measurements, therefore non-SI units have been used to reflect the practical needs of the laboratories performing these measurements as appropriate.
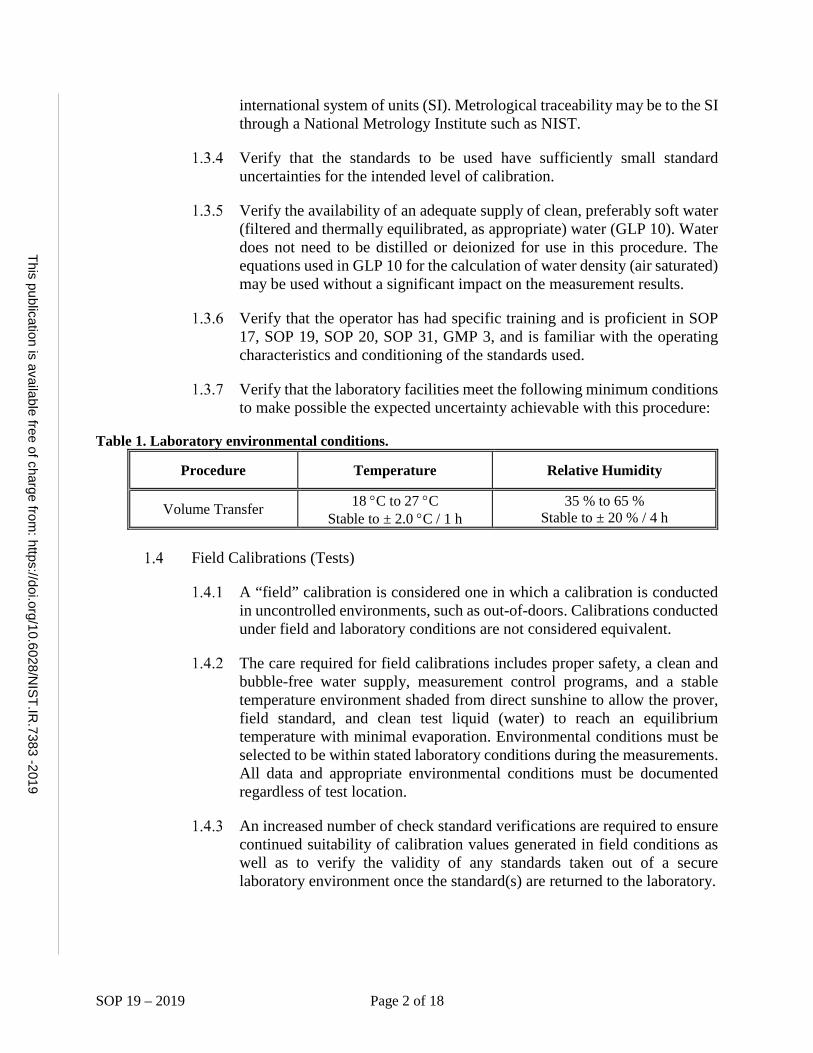
SOP 19 – 2019 Page 2 of 18
This publication is available free of charge from: https://doi.org/10.6028/N
IST.IR.7383 -2019
international system of units (SI). Metrological traceability may be to the SI through a National Metrology Institute such as NIST.
Verify that the standards to be used have sufficiently small standard uncertainties for the intended level of calibration.
Verify the availability of an adequate supply of clean, preferably soft water (filtered and thermally equilibrated, as appropriate) water (GLP 10). Water does not need to be distilled or deionized for use in this procedure. The equations used in GLP 10 for the calculation of water density (air saturated) may be used without a significant impact on the measurement results.
Verify that the operator has had specific training and is proficient in SOP 17, SOP 19, SOP 20, SOP 31, GMP 3, and is familiar with the operating characteristics and conditioning of the standards used.
Verify that the laboratory facilities meet the following minimum conditions to make possible the expected uncertainty achievable with this procedure:
Table 1. Laboratory environmental conditions.
Procedure Temperature Relative Humidity
Volume Transfer 18 °C to 27 °C Stable to ± 2.0 °C / 1 h
35 % to 65 % Stable to ± 20 % / 4 h
Field Calibrations (Tests)
A “field” calibration is considered one in which a calibration is conducted in uncontrolled environments, such as out-of-doors. Calibrations conducted under field and laboratory conditions are not considered equivalent.
The care required for field calibrations includes proper safety, a clean and bubble-free water supply, measurement control programs, and a stable temperature environment shaded from direct sunshine to allow the prover, field standard, and clean test liquid (water) to reach an equilibrium temperature with minimal evaporation. Environmental conditions must be selected to be within stated laboratory conditions during the measurements. All data and appropriate environmental conditions must be documented regardless of test location.
An increased number of check standard verifications are required to ensure continued suitability of calibration values generated in field conditions as well as to verify the validity of any standards taken out of a secure laboratory environment once the standard(s) are returned to the laboratory.
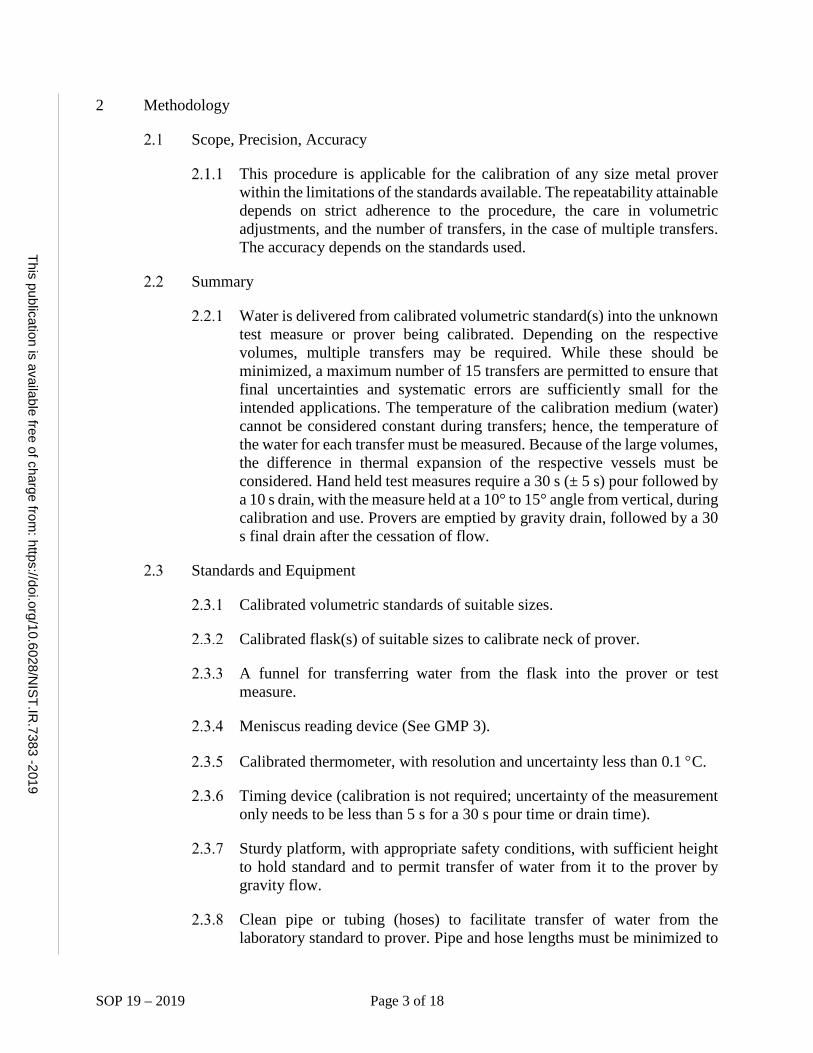
SOP 19 – 2019 Page 3 of 18
This publication is available free of charge from: https://doi.org/10.6028/N
IST.IR.7383 -2019
2 Methodology
Scope, Precision, Accuracy
This procedure is applicable for the calibration of any size metal prover within the limitations of the standards available. The repeatability attainable depends on strict adherence to the procedure, the care in volumetric adjustments, and the number of transfers, in the case of multiple transfers. The accuracy depends on the standards used.
Summary
Water is delivered from calibrated volumetric standard(s) into the unknown test measure or prover being calibrated. Depending on the respective volumes, multiple transfers may be required. While these should be minimized, a maximum number of 15 transfers are permitted to ensure that final uncertainties and systematic errors are sufficiently small for the intended applications. The temperature of the calibration medium (water) cannot be considered constant during transfers; hence, the temperature of the water for each transfer must be measured. Because of the large volumes, the difference in thermal expansion of the respective vessels must be considered. Hand held test measures require a 30 s (± 5 s) pour followed by a 10 s drain, with the measure held at a 10° to 15° angle from vertical, during calibration and use. Provers are emptied by gravity drain, followed by a 30 s final drain after the cessation of flow.
Standards and Equipment
Calibrated volumetric standards of suitable sizes.
Calibrated flask(s) of suitable sizes to calibrate neck of prover.
A funnel for transferring water from the flask into the prover or test measure.
Meniscus reading device (See GMP 3).
Calibrated thermometer, with resolution and uncertainty less than 0.1 °C.
Timing device (calibration is not required; uncertainty of the measurement only needs to be less than 5 s for a 30 s pour time or drain time).
Sturdy platform, with appropriate safety conditions, with sufficient height to hold standard and to permit transfer of water from it to the prover by gravity flow.
Clean pipe or tubing (hoses) to facilitate transfer of water from the laboratory standard to prover. Pipe and hose lengths must be minimized to
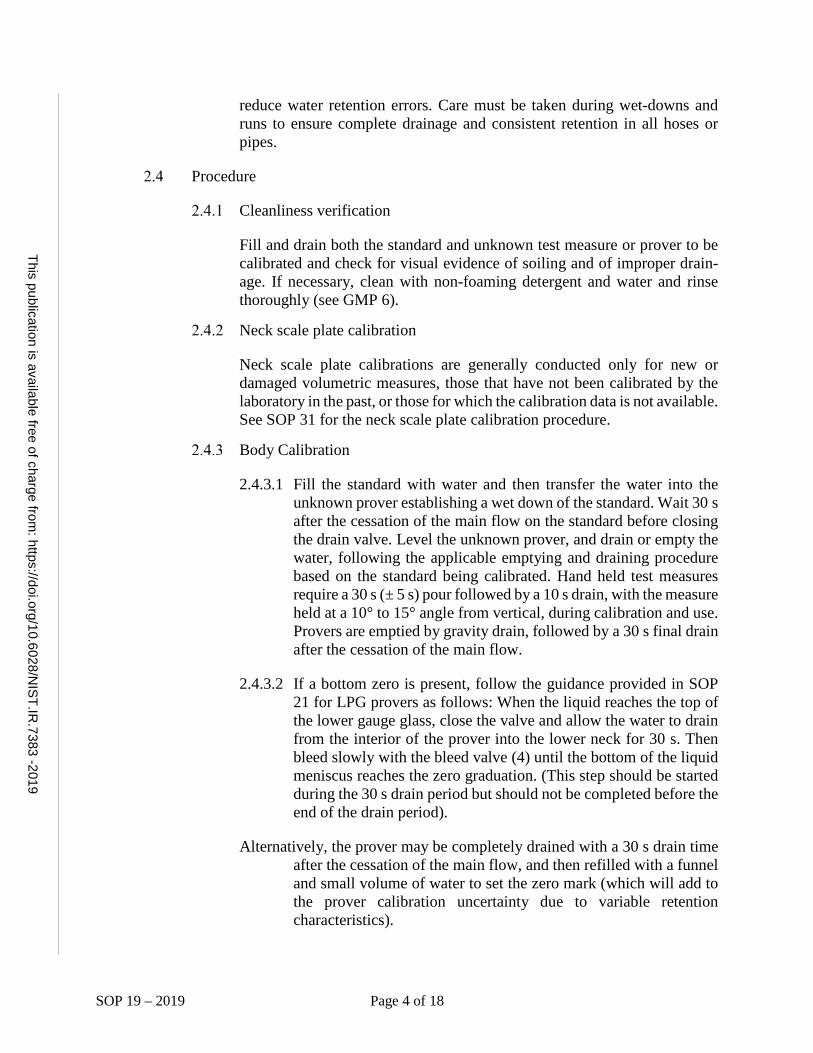
SOP 19 – 2019 Page 4 of 18
This publication is available free of charge from: https://doi.org/10.6028/N
IST.IR.7383 -2019
reduce water retention errors. Care must be taken during wet-downs and runs to ensure complete drainage and consistent retention in all hoses or pipes.
Procedure
Cleanliness verification
Fill and drain both the standard and unknown test measure or prover to be calibrated and check for visual evidence of soiling and of improper drain-age. If necessary, clean with non-foaming detergent and water and rinse thoroughly (see GMP 6).
Neck scale plate calibration
Neck scale plate calibrations are generally conducted only for new or damaged volumetric measures, those that have not been calibrated by the laboratory in the past, or those for which the calibration data is not available. See SOP 31 for the neck scale plate calibration procedure.
Body Calibration
2.4.3.1 Fill the standard with water and then transfer the water into the unknown prover establishing a wet down of the standard. Wait 30 s after the cessation of the main flow on the standard before closing the drain valve. Level the unknown prover, and drain or empty the water, following the applicable emptying and draining procedure based on the standard being calibrated. Hand held test measures require a 30 s (± 5 s) pour followed by a 10 s drain, with the measure held at a 10° to 15° angle from vertical, during calibration and use. Provers are emptied by gravity drain, followed by a 30 s final drain after the cessation of the main flow.
2.4.3.2 If a bottom zero is present, follow the guidance provided in SOP 21 for LPG provers as follows: When the liquid reaches the top of the lower gauge glass, close the valve and allow the water to drain from the interior of the prover into the lower neck for 30 s. Then bleed slowly with the bleed valve (4) until the bottom of the liquid meniscus reaches the zero graduation. (This step should be started during the 30 s drain period but should not be completed before the end of the drain period).
Alternatively, the prover may be completely drained with a 30 s drain time after the cessation of the main flow, and then refilled with a funnel and small volume of water to set the zero mark (which will add to the prover calibration uncertainty due to variable retention characteristics).
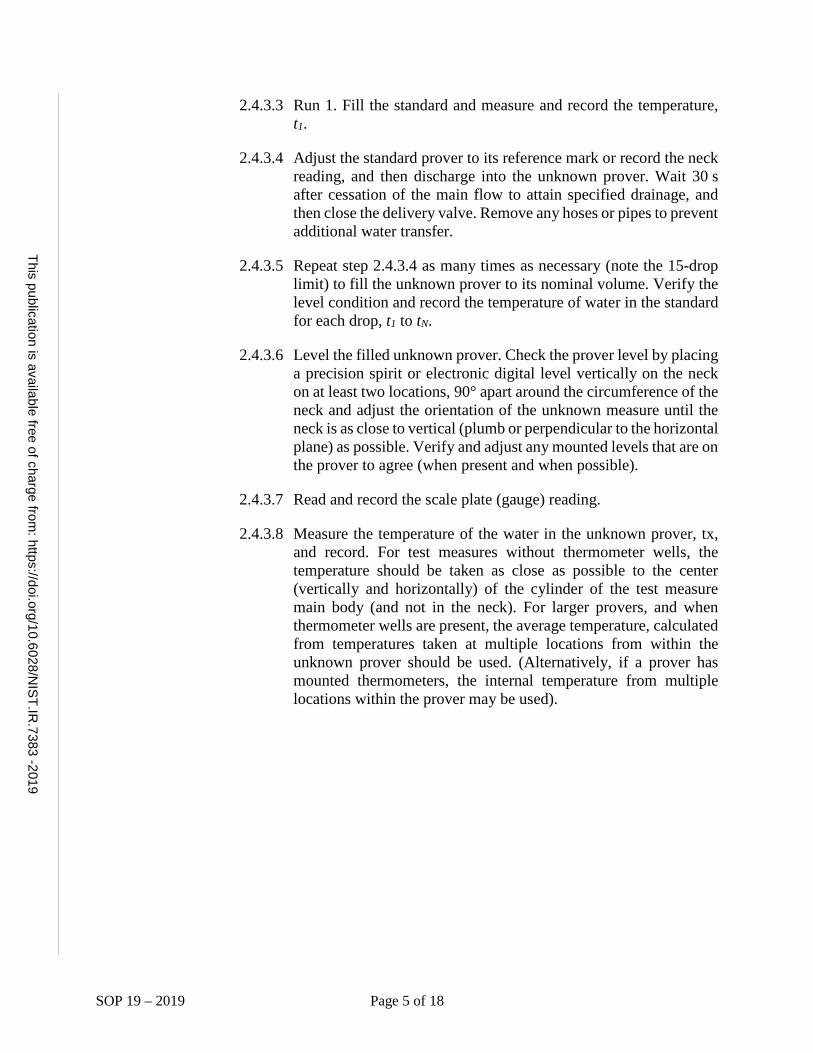
SOP 19 – 2019 Page 5 of 18
This publication is available free of charge from: https://doi.org/10.6028/N
IST.IR.7383 -2019
2.4.3.3 Run 1. Fill the standard and measure and record the temperature, t1.
2.4.3.4 Adjust the standard prover to its reference mark or record the neck reading, and then discharge into the unknown prover. Wait 30 s after cessation of the main flow to attain specified drainage, and then close the delivery valve. Remove any hoses or pipes to prevent additional water transfer.
2.4.3.5 Repeat step 2.4.3.4 as many times as necessary (note the 15-drop limit) to fill the unknown prover to its nominal volume. Verify the level condition and record the temperature of water in the standard for each drop, t1 to tN.
2.4.3.6 Level the filled unknown prover. Check the prover level by placing a precision spirit or electronic digital level vertically on the neck on at least two locations, 90° apart around the circumference of the neck and adjust the orientation of the unknown measure until the neck is as close to vertical (plumb or perpendicular to the horizontal plane) as possible. Verify and adjust any mounted levels that are on the prover to agree (when present and when possible).
2.4.3.7 Read and record the scale plate (gauge) reading.
2.4.3.8 Measure the temperature of the water in the unknown prover, tx, and record. For test measures without thermometer wells, the temperature should be taken as close as possible to the center (vertically and horizontally) of the cylinder of the test measure main body (and not in the neck). For larger provers, and when thermometer wells are present, the average temperature, calculated from temperatures taken at multiple locations from within the unknown prover should be used. (Alternatively, if a prover has mounted thermometers, the internal temperature from multiple locations within the prover may be used).
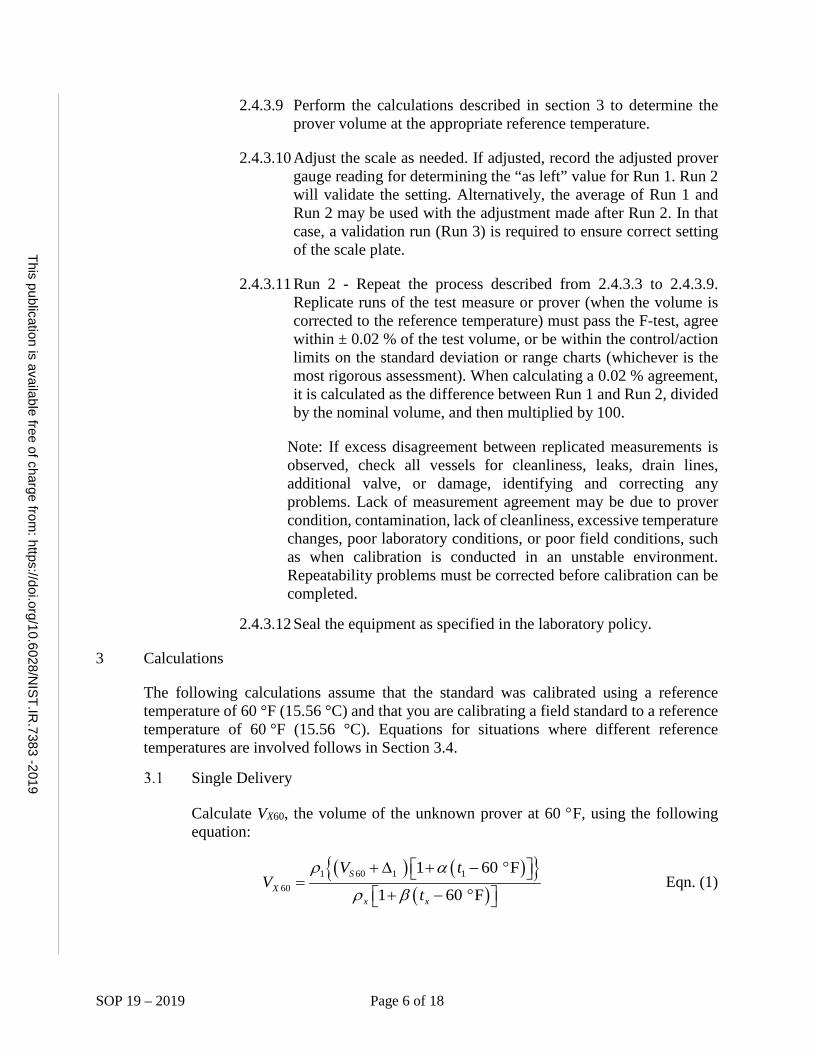
SOP 19 – 2019 Page 6 of 18
This publication is available free of charge from: https://doi.org/10.6028/N
IST.IR.7383 -2019
2.4.3.9 Perform the calculations described in section 3 to determine the prover volume at the appropriate reference temperature.
2.4.3.10 Adjust the scale as needed. If adjusted, record the adjusted prover gauge reading for determining the “as left” value for Run 1. Run 2 will validate the setting. Alternatively, the average of Run 1 and Run 2 may be used with the adjustment made after Run 2. In that case, a validation run (Run 3) is required to ensure correct setting of the scale plate.
2.4.3.11 Run 2 - Repeat the process described from 2.4.3.3 to 2.4.3.9. Replicate runs of the test measure or prover (when the volume is corrected to the reference temperature) must pass the F-test, agree within ± 0.02 % of the test volume, or be within the control/action limits on the standard deviation or range charts (whichever is the most rigorous assessment). When calculating a 0.02 % agreement, it is calculated as the difference between Run 1 and Run 2, divided by the nominal volume, and then multiplied by 100.
Note: If excess disagreement between replicated measurements is observed, check all vessels for cleanliness, leaks, drain lines, additional valve, or damage, identifying and correcting any problems. Lack of measurement agreement may be due to prover condition, contamination, lack of cleanliness, excessive temperature changes, poor laboratory conditions, or poor field conditions, such as when calibration is conducted in an unstable environment. Repeatability problems must be corrected before calibration can be completed.
2.4.3.12 Seal the equipment as specified in the laboratory policy.
3 Calculations
The following calculations assume that the standard was calibrated using a reference temperature of 60 °F (15.56 °C) and that you are calibrating a field standard to a reference temperature of 60 °F (15.56 °C). Equations for situations where different reference temperatures are involved follows in Section 3.4.
Single Delivery
Calculate VX60, the volume of the unknown prover at 60 °F, using the following equation:
( ) ( ){ }( )
1 60 1 160
1 60 F
1 60 FS
Xx x
V tV
t
ρ α
ρ β
+ ∆ + − ° = + − °
Eqn. (1)
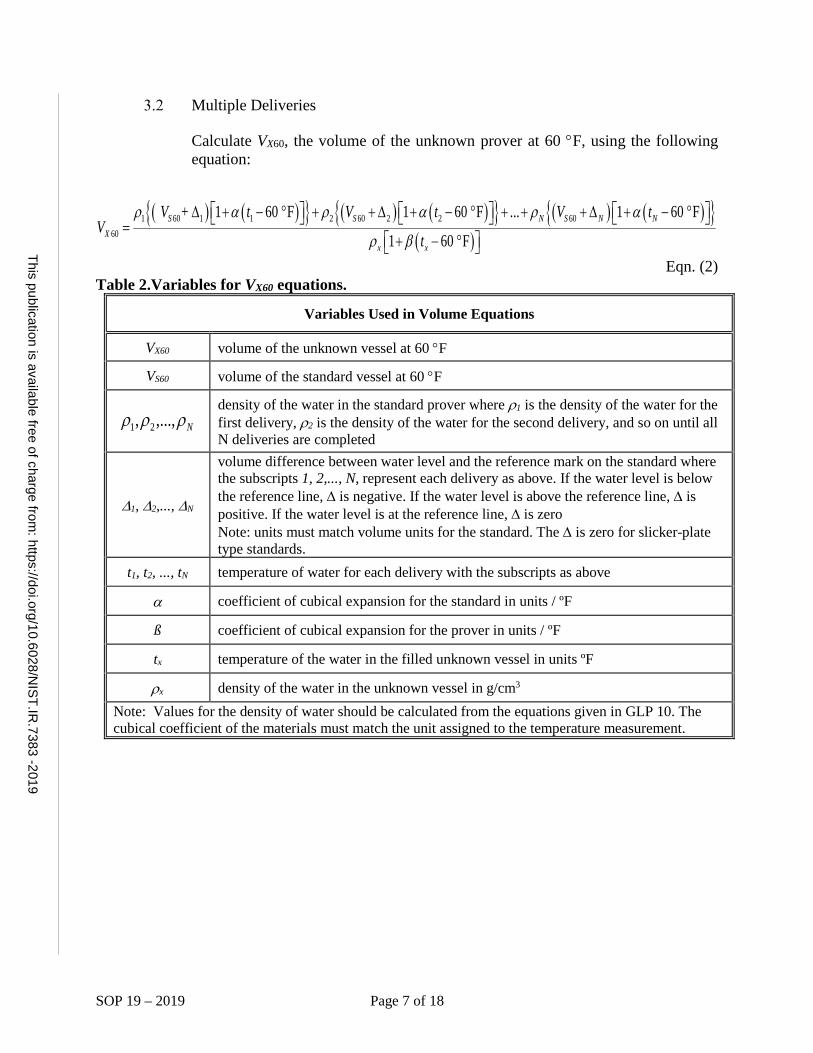
SOP 19 – 2019 Page 7 of 18
This publication is available free of charge from: https://doi.org/10.6028/N
IST.IR.7383 -2019
Multiple Deliveries
Calculate VX60, the volume of the unknown prover at 60 °F, using the following equation:
( ) ( ){ } ( ) ( ){ } ( ) ( ){ }( )
1 60 1 1 2 60 2 2 6060
+ 1 60 F 1 60 F ... 1 60 F
1 60 FS S N S N N
Xx x
V t V t V tV
t
ρ α ρ α ρ α
ρ β
∆ + − ° + + ∆ + − ° + + + ∆ + − ° = + − °
Eqn. (2) Table 2.Variables for VX60 equations.
Variables Used in Volume Equations
VX60 volume of the unknown vessel at 60 °F
VS60 volume of the standard vessel at 60 °F
Nρρρ ,...,, 21
density of the water in the standard prover where ρ1 is the density of the water for the first delivery, ρ2 is the density of the water for the second delivery, and so on until all N deliveries are completed
∆1, ∆2,..., ∆N
volume difference between water level and the reference mark on the standard where the subscripts 1, 2,..., N, represent each delivery as above. If the water level is below the reference line, ∆ is negative. If the water level is above the reference line, ∆ is positive. If the water level is at the reference line, ∆ is zero Note: units must match volume units for the standard. The ∆ is zero for slicker-plate type standards.
t1, t2, ..., tN temperature of water for each delivery with the subscripts as above
α coefficient of cubical expansion for the standard in units / ºF
ß coefficient of cubical expansion for the prover in units / ºF
tx temperature of the water in the filled unknown vessel in units ºF
ρx density of the water in the unknown vessel in g/cm3 Note: Values for the density of water should be calculated from the equations given in GLP 10. The cubical coefficient of the materials must match the unit assigned to the temperature measurement.
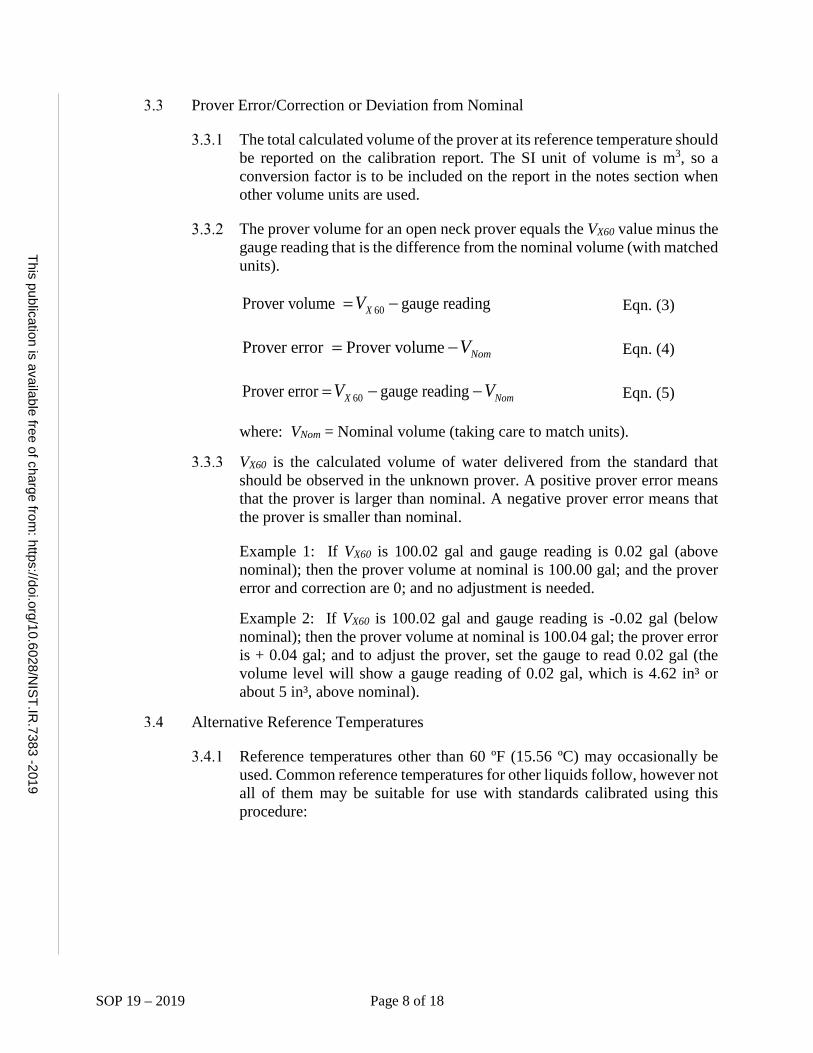
SOP 19 – 2019 Page 8 of 18
This publication is available free of charge from: https://doi.org/10.6028/N
IST.IR.7383 -2019
Prover Error/Correction or Deviation from Nominal
The total calculated volume of the prover at its reference temperature should be reported on the calibration report. The SI unit of volume is m3, so a conversion factor is to be included on the report in the notes section when other volume units are used.
The prover volume for an open neck prover equals the VX60 value minus the gauge reading that is the difference from the nominal volume (with matched units).
60Prover volume gauge readingX V= − Eqn. (3)
Prover error Prover volume Nom V= − Eqn. (4)
60Prover error gauge readingX Nom V V= − − Eqn. (5)
where: VNom = Nominal volume (taking care to match units).
VX60 is the calculated volume of water delivered from the standard that should be observed in the unknown prover. A positive prover error means that the prover is larger than nominal. A negative prover error means that the prover is smaller than nominal.
Example 1: If VX60 is 100.02 gal and gauge reading is 0.02 gal (above nominal); then the prover volume at nominal is 100.00 gal; and the prover error and correction are 0; and no adjustment is needed.
Example 2: If VX60 is 100.02 gal and gauge reading is -0.02 gal (below nominal); then the prover volume at nominal is 100.04 gal; the prover error is + 0.04 gal; and to adjust the prover, set the gauge to read 0.02 gal (the volume level will show a gauge reading of 0.02 gal, which is 4.62 in³ or about 5 in³, above nominal).
Alternative Reference Temperatures
Reference temperatures other than 60 ºF (15.56 ºC) may occasionally be used. Common reference temperatures for other liquids follow, however not all of them may be suitable for use with standards calibrated using this procedure:
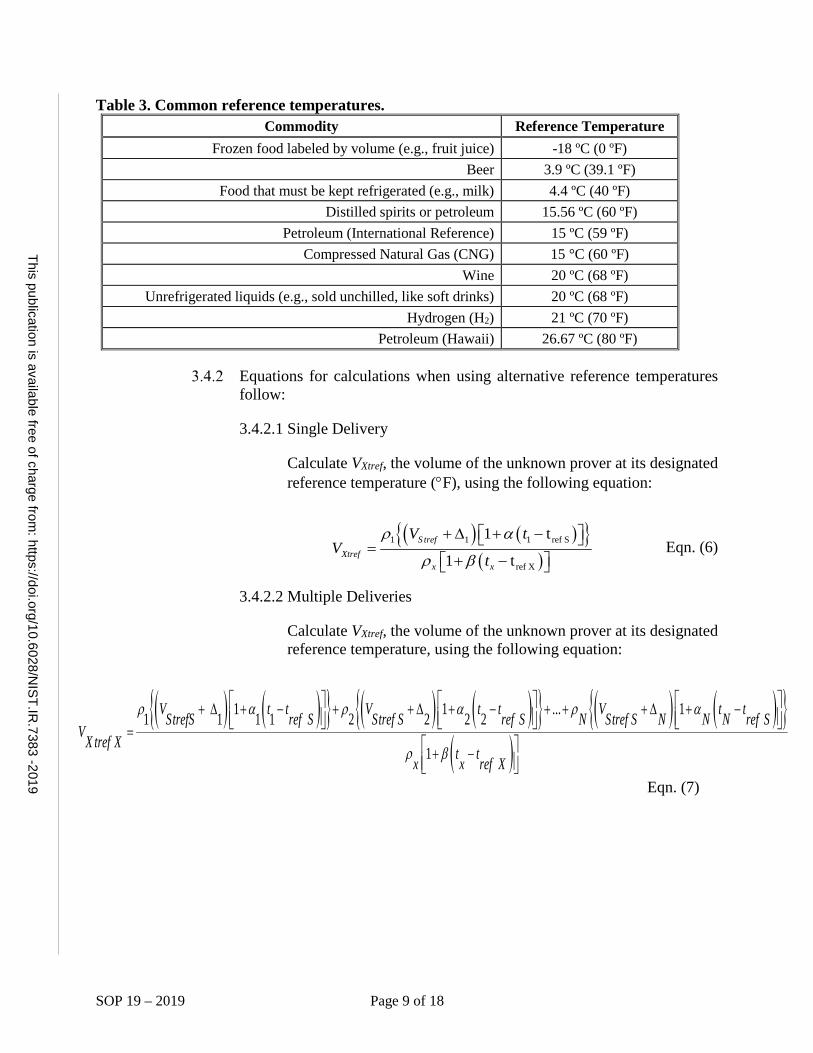
SOP 19 – 2019 Page 9 of 18
This publication is available free of charge from: https://doi.org/10.6028/N
IST.IR.7383 -2019
Table 3. Common reference temperatures. Commodity Reference Temperature
Frozen food labeled by volume (e.g., fruit juice) -18 ºC (0 ºF)Beer 3.9 ºC (39.1 ºF)
Food that must be kept refrigerated (e.g., milk) 4.4 ºC (40 ºF) Distilled spirits or petroleum 15.56 ºC (60 ºF)
Petroleum (International Reference) 15 ºC (59 ºF) Compressed Natural Gas (CNG) 15 °C (60 ºF)
Wine 20 ºC (68 ºF) Unrefrigerated liquids (e.g., sold unchilled, like soft drinks) 20 ºC (68 ºF)
Hydrogen (H2) 21 ºC (70 ºF) Petroleum (Hawaii) 26.67 ºC (80 ºF)
Equations for calculations when using alternative reference temperatures follow:
3.4.2.1 Single Delivery
Calculate VXtref, the volume of the unknown prover at its designated reference temperature (°F), using the following equation:
( ) ( ){ }( )
1 1 1 ref S
ref X
1 t
1 tS tref
Xtrefx x
V tV
t
ρ α
ρ β
+ ∆ + − = + −
Eqn. (6)
3.4.2.2 Multiple Deliveries
Calculate VXtref, the volume of the unknown prover at its designated reference temperature, using the following equation:
( ) ( ){ } ( ) ( ){ } ( ) ( ){ }( )
1 1 ... 11 1 1 1 2 2 2 2
1
V t t V t t V t tStrefS ref S Stref S ref S N Stref S N N N ref SVX tref X
t tx x ref X
ρ α ρ α ρ α
ρ β
+ ∆ + − + + ∆ + − + + + ∆ + −=
+ −
Eqn. (7)
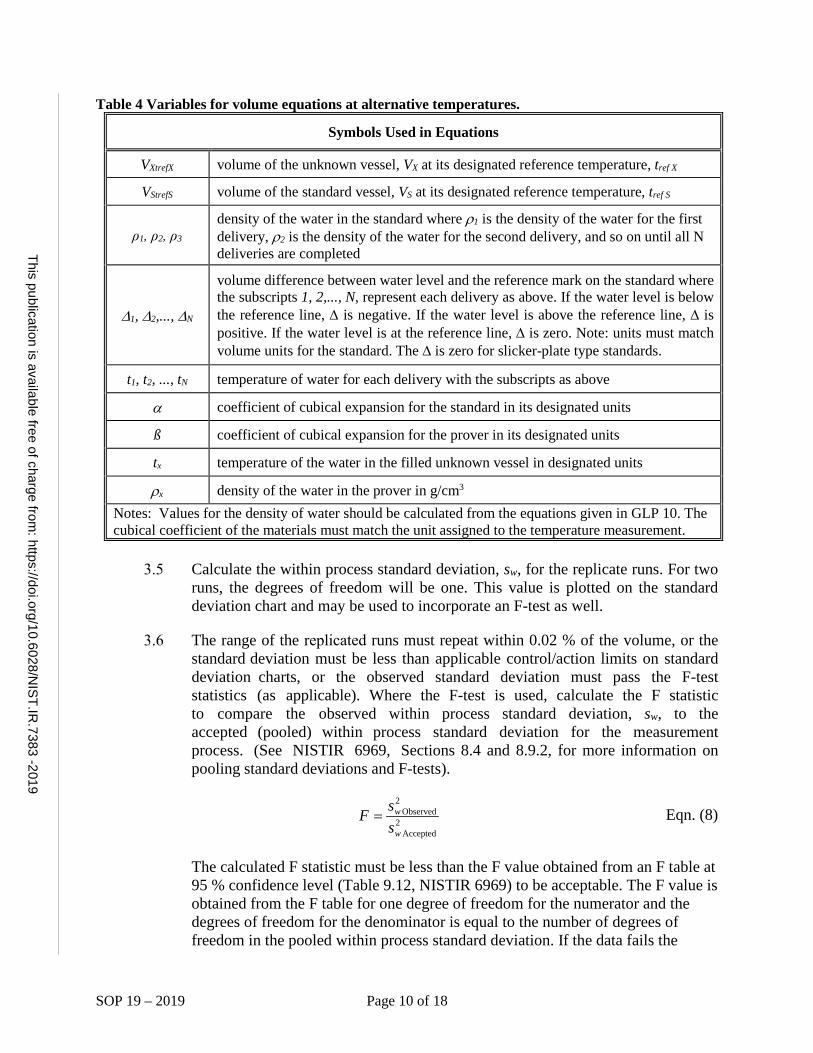
SOP 19 – 2019 Page 10 of 18
This publication is available free of charge from: https://doi.org/10.6028/N
IST.IR.7383 -2019
Table 4 Variables for volume equations at alternative temperatures.
Symbols Used in Equations
VXtrefX volume of the unknown vessel, VX at its designated reference temperature, tref X
VStrefS volume of the standard vessel, VS at its designated reference temperature, tref S
ρ1, ρ2, ρ3 density of the water in the standard where ρ1 is the density of the water for the first delivery, ρ2 is the density of the water for the second delivery, and so on until all N deliveries are completed
∆1, ∆2,..., ∆N
volume difference between water level and the reference mark on the standard where the subscripts 1, 2,..., N, represent each delivery as above. If the water level is below the reference line, ∆ is negative. If the water level is above the reference line, ∆ is positive. If the water level is at the reference line, ∆ is zero. Note: units must match volume units for the standard. The ∆ is zero for slicker-plate type standards.
t1, t2, ..., tN temperature of water for each delivery with the subscripts as above
α coefficient of cubical expansion for the standard in its designated units
ß coefficient of cubical expansion for the prover in its designated units
tx temperature of the water in the filled unknown vessel in designated units
ρx density of the water in the prover in g/cm3 Notes: Values for the density of water should be calculated from the equations given in GLP 10. The cubical coefficient of the materials must match the unit assigned to the temperature measurement.
Calculate the within process standard deviation, sw, for the replicate runs. For two runs, the degrees of freedom will be one. This value is plotted on the standard deviation chart and may be used to incorporate an F-test as well.
The range of the replicated runs must repeat within 0.02 % of the volume, or the standard deviation must be less than applicable control/action limits on standard deviation charts, or the observed standard deviation must pass the F-test statistics (as applicable). Where the F-test is used, calculate the F statistic to compare the observed within process standard deviation, sw, to the accepted (pooled) within process standard deviation for the measurement process. (See NISTIR 6969, Sections 8.4 and 8.9.2, for more information on pooling standard deviations and F-tests).
2Accepted
2Observed
w
w
ssF = Eqn. (8)
The calculated F statistic must be less than the F value obtained from an F table at 95 % confidence level (Table 9.12, NISTIR 6969) to be acceptable. The F value is obtained from the F table for one degree of freedom for the numerator and the degrees of freedom for the denominator is equal to the number of degrees of freedom in the pooled within process standard deviation. If the data fails the
SOP 19 – 2019 Page 11 of 18
This publication is available free of charge from: https://doi.org/10.6028/N
IST.IR.7383 -2019
repeatability assessments and the source of the error cannot be determined conclusively and corrected, the measurement must be repeated. All values must be entered in the standard deviation chart or control chart, even if failing the repeatability assessment to ensure the variability of the accepted measurement process is representative of the process and not unduly reduced over time.
Calculate and report the mean volume of the volumetric standard at its applicable reference temperature.
If adjustments were made during replicate runs, report the “as found” volume or the mean of “as found” volumes and the “as left” volume or mean of “as left” volumes, as applicable, at the appropriate reference temperature. (Do not calculate a mean value by combining “as found” and “as left” values when adjustments are made).
4 Measurement Assurance
Duplicate the process with a suitable check standard. See SOP 17 or SOP 30. Plot the check standard volume and verify that it is within established limits. The mean of the check standard observations may be used to evaluate bias and drift over time when a reference value for the check standard is available. Check standard observations are used to calculate the standard deviation of the measurement process which contributes to the Type A uncertainty components.
A t-test may be incorporated to check the observed value against an accepted value.
( )p
cc
sSS
t−
= Eqn. (9)
The t-statistic is evaluated using Eqn. 9 with a 95 % confidence level. All values must be entered in the control chart, even if failing this statistic to ensure the variability obtained for the process is truly representative of the process and not unduly reduced over time. The observed value of the check standard is compared to the accepted mean value of the check standard and divided by the standard deviation for the check standard observations over time. The limits for the t-test are based on applicable warning and action limits on the control chart (The applicable limits are shown in SOP 20 and based on the number of replicates).
SOP 19 – 2019 Page 12 of 18
This publication is available free of charge from: https://doi.org/10.6028/N
IST.IR.7383 -2019
A standard deviation chart is also used for measurement assurance through the evaluation of replicate measurements (See SOP 20). The standard deviation of each combination of Run 1 and Run 2 is calculated and the pooled standard deviation over time may be used to estimate the short-term variability in the measurement process. A standard deviation chart for unknown provers represents the variability in condition of test measures submitted for calibration as well as the short-term repeatability of the measurement process but does not monitor the stability of the reference standard or represent the variability or potential systematic errors associated with meniscus readings (See GMP 3). The range of the calculated measurement results must agree to within 0.02 % of the volume, or the standard deviation must be less than applicable control/action limits on standard deviation charts, or the observed standard deviation must pass the F-test statistics (as applicable).
For unknown standards that are adjusted, do not combine an “as found” value with an “as left” value for the two runs entered into the chart; use the adjusted value from Run 1 and the value from Run 2, both at the applicable reference temperature, when entering values in a standard deviation or range chart.
5 Assignment of Uncertainties
The limits of expanded uncertainty, U, include estimates of the standard uncertainty of the laboratory volumetric standards used, us, plus the standard deviation of the process, sp, and the additional items noted below and in the uncertainty budget table, Table 5, at the 95 % level of confidence. See NISTIR 6969, SOP 29 for the complete standard operating procedure for calculating the uncertainty.
The standard uncertainty for the standard, us, is obtained from the calibration certificate. The combined standard uncertainty, uc, is used and not the expanded uncertainty, U, therefore the reported uncertainty for the standard will usually need to be divided by the associated coverage factor k. See SOP 29 for the complete standard operating procedure for calculating the uncertainty when multiple deliveries or multiple standards are used to ensure correct handling of correlated uncertainties. Fifteen is the maximum recommended number of deliveries from a laboratory standard to a prover under test to minimize calibration uncertainties to the levels identified previously.
The standard deviation of the measurement process, sp, is taken from a control chart for a check standard or from standard deviation charts from provers of similar size. See SOP 17, SOP 20 and NISTIR 6969, SOP 30. The larger of the value from the standard deviation over time for a check standard or from the standard deviation chart should be used in the uncertainty calculations. If a check standard is available, it is possible to evaluate the presence of bias in the measurement process. Where multiple staff members perform this calibration and obtain values for the check standard, the standard deviation for a check standard may represent variability and systematic errors associated with the meniscus reading. When a standard deviation chart is used alone (i.e., a check standard is not used), the repeatability represents
SOP 19 – 2019 Page 13 of 18
This publication is available free of charge from: https://doi.org/10.6028/N
IST.IR.7383 -2019
the process only and does not represent potential systematic differences in meniscus readings. In a laboratory with only one staff member performing calibration and entering data for a check standard, additional uncertainties for meniscus readings are needed per Section 5.3 and GMP 3.
Neck calibration uncertainty should be estimated based on the uncertainty of standards used, errors observed during calibration, ability to read the meniscus of all standards involved (see GMP 3) and the repeatability of the neck calibration (see SOP 31).
Other standard uncertainties usually included at this calibration level primarily include 1) uncertainties associated with the ability to read the meniscus, only part of which is included in the process variability due to parallax and visual capabilities (unless multiple staff are represented with a check standard that demonstrates variability is meniscus readings), and 2) uncertainties associated with temperature corrections that include values for the cubical coefficient of expansion for the prover under test, the accuracy and gradients associated with temperature measurements in test measures or provers. Additional factors that might be included are: round robin or proficiency testing data showing reproducibility, environmental variations over time, and bias or drift of the standard as noted in control charts.
To properly evaluate uncertainties and user requirements (tolerances), assessment of additional user uncertainties may be required by laboratory staff. Through proper use of documented laboratory and field procedures, additional uncertainty factors may be minimized to a level that does not contribute significantly to the previously described factors. Additional standard uncertainties in the calibration of field standards and their use in meter verification may include: how the prover level is established, how delivery and drain times are determined, the use of a proper “wetted-down” prior to calibration or use, whether gravity drain is used during calibration or whether the volume of water is eliminated by pumping, the cleanliness of the prover and calibration medium, prover retention characteristics related to inside surface, contamination or corrosion, and total drain times, and possible air entrapment in the water, and connecting pipes. Systematic errors may be observed between laboratory calibration practices where a gravity drain is used and field use where the pumping system is used.
Example components to be considered for an uncertainty budget table are shown in Table 5. Multiple values of some items may need to be considered (e.g., multiple drops from the standard, multiple meniscus readings, and multiple temperature readings).
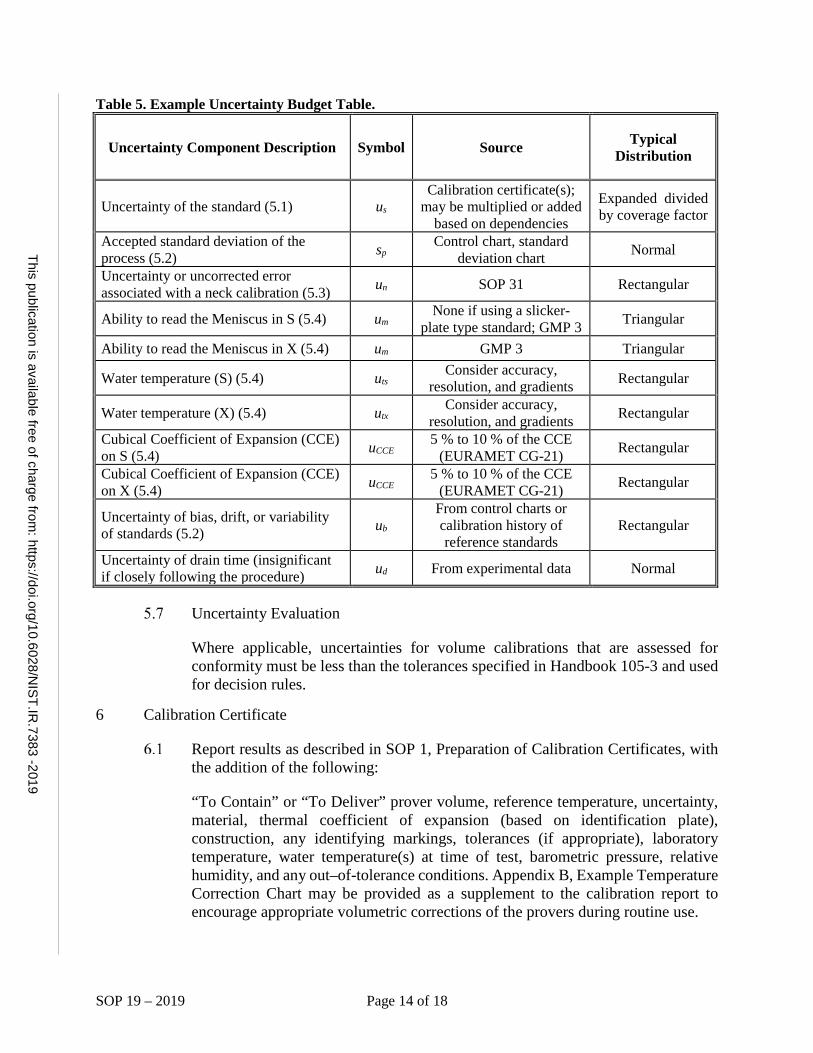
SOP 19 – 2019 Page 14 of 18
This publication is available free of charge from: https://doi.org/10.6028/N
IST.IR.7383 -2019
Table 5. Example Uncertainty Budget Table.
Uncertainty Component Description Symbol Source Typical Distribution
Uncertainty of the standard (5.1) us Calibration certificate(s);
may be multiplied or added based on dependencies
Expanded divided by coverage factor
Accepted standard deviation of the process (5.2) sp
Control chart, standard deviation chart Normal
Uncertainty or uncorrected error associated with a neck calibration (5.3) un SOP 31 Rectangular
Ability to read the Meniscus in S (5.4) um None if using a slicker-plate type standard; GMP 3 Triangular
Ability to read the Meniscus in X (5.4) um GMP 3 Triangular
Water temperature (S) (5.4) uts Consider accuracy,
resolution, and gradients Rectangular
Water temperature (X) (5.4) utx Consider accuracy,
resolution, and gradients Rectangular
Cubical Coefficient of Expansion (CCE) on S (5.4) uCCE 5 % to 10 % of the CCE
(EURAMET CG-21) Rectangular
Cubical Coefficient of Expansion (CCE) on X (5.4) uCCE 5 % to 10 % of the CCE
(EURAMET CG-21) Rectangular
Uncertainty of bias, drift, or variability of standards (5.2) ub
From control charts or calibration history of reference standards
Rectangular
Uncertainty of drain time (insignificant if closely following the procedure) ud From experimental data Normal
Uncertainty Evaluation
Where applicable, uncertainties for volume calibrations that are assessed for conformity must be less than the tolerances specified in Handbook 105-3 and used for decision rules.
6 Calibration Certificate
Report results as described in SOP 1, Preparation of Calibration Certificates, with the addition of the following:
“To Contain” or “To Deliver” prover volume, reference temperature, uncertainty, material, thermal coefficient of expansion (based on identification plate), construction, any identifying markings, tolerances (if appropriate), laboratory temperature, water temperature(s) at time of test, barometric pressure, relative humidity, and any out–of-tolerance conditions. Appendix B, Example Temperature Correction Chart may be provided as a supplement to the calibration report to encourage appropriate volumetric corrections of the provers during routine use.
SOP 19 – 2019 Page 15 of 18
This publication is available free of charge from: https://doi.org/10.6028/N
IST.IR.7383 -2019
Conformity Assessment
Evaluate compliance to applicable tolerances as needed or required by the customer or by legal metrology requirements. Compliance assessments must note the applicable documentary standard and which portions of the standard were or were not evaluated. The uncertainty for volume calibrations must be less than the tolerances published in the applicable documentary standards. For volume calibrations where the unknown standard can be adjusted, it is standard practice to adjust the standard or leave the scale plate in a position close enough to its nominal volume to ensure that the absolute value of the measurement result plus the uncertainty is less than the applicable tolerance. Where the unknown standard cannot be adjusted, and a portion of the uncertainty band from the error exceeds tolerance limits, it is not appropriate to state compliance with the tolerances unless additional decision rules are communicated with and agreed to by the end user. Correction values (measurement results) may need to be used by the end user in such cases.
7 Additional References:
Bean, V. E., Espina, P. I., Wright, J. D., Houser, J. F., Sheckels, S. D., and Johnson, A. N., NIST Calibration Services for Liquid Volume, NIST Special Publication 250-72, National Institute of Standards and Technology, Gaithersburg, MD, (2009).
EURAMET Calibration Guide 21, Guidelines on the Calibration of Standard Capacity Measures Using the Volumetric Method (Version 1.0, 04/2013).
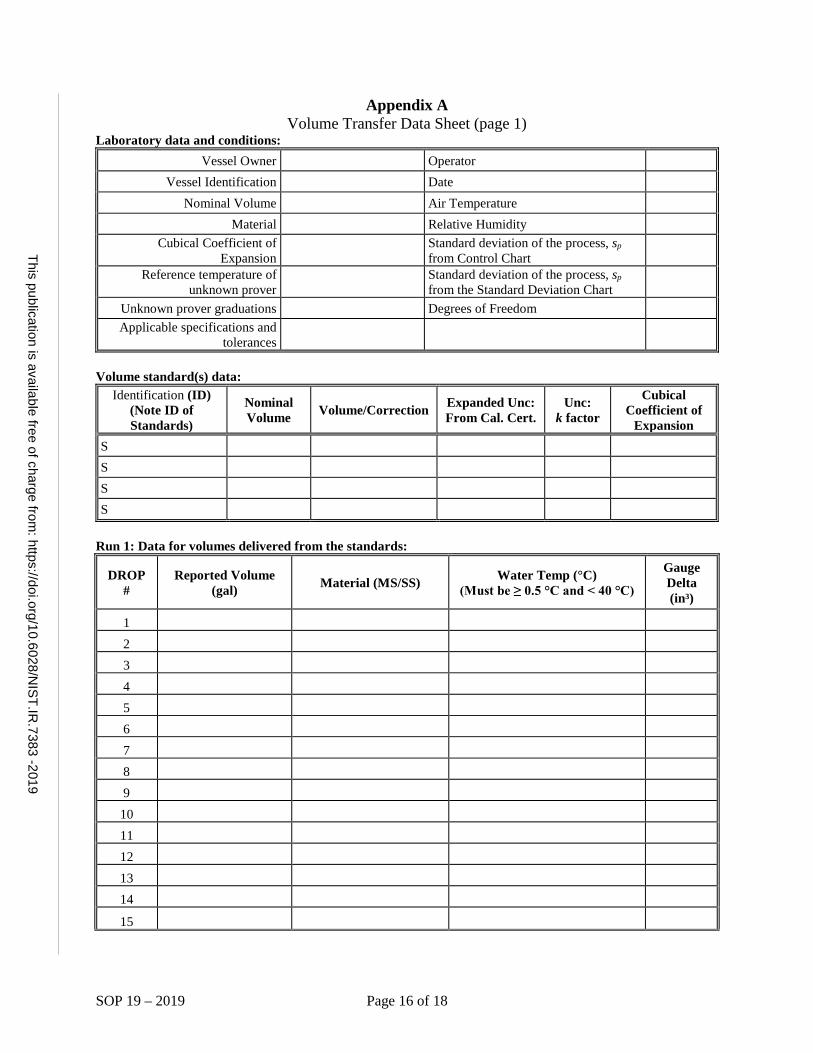
SOP 19 – 2019 Page 16 of 18
This publication is available free of charge from: https://doi.org/10.6028/N
IST.IR.7383 -2019
Appendix A Volume Transfer Data Sheet (page 1)
Laboratory data and conditions: Vessel Owner Operator
Vessel Identification Date Nominal Volume Air Temperature
Material Relative Humidity Cubical Coefficient of
Expansion Standard deviation of the process, sp from Control Chart
Reference temperature of unknown prover
Standard deviation of the process, sp from the Standard Deviation Chart
Unknown prover graduations Degrees of Freedom Applicable specifications and
tolerances
Volume standard(s) data: Identification (ID)
(Note ID of Standards)
Nominal Volume Volume/Correction Expanded Unc:
From Cal. Cert. Unc:
k factor
Cubical Coefficient of
ExpansionS
S
S S
Run 1: Data for volumes delivered from the standards:
DROP #
Reported Volume (gal) Material (MS/SS) Water Temp (°C)
(Must be ≥ 0.5 °C and < 40 °C)
Gauge Delta (in³)
1 2 3 4 5 6 7 8 9 10 11 12 13 14
15
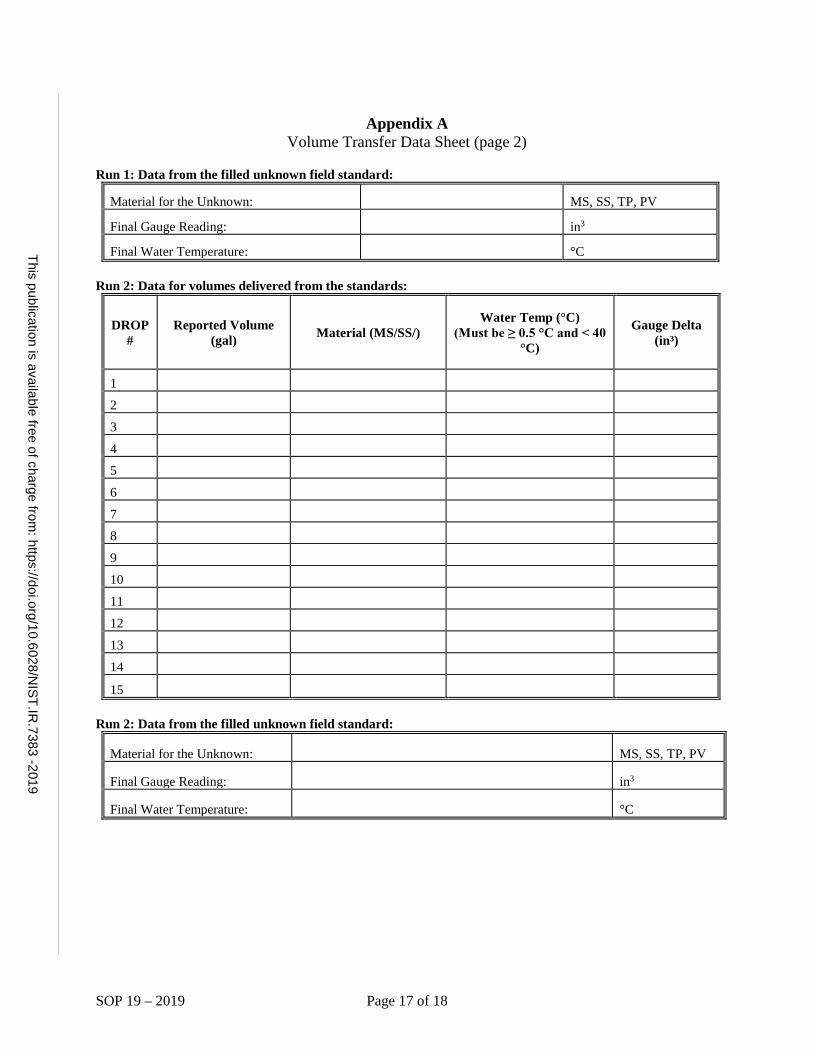
SOP 19 – 2019 Page 17 of 18
This publication is available free of charge from: https://doi.org/10.6028/N
IST.IR.7383 -2019
Appendix A Volume Transfer Data Sheet (page 2)
Run 1: Data from the filled unknown field standard:
Material for the Unknown: MS, SS, TP, PV
Final Gauge Reading: in3
Final Water Temperature: °C
Run 2: Data for volumes delivered from the standards:
DROP #
Reported Volume (gal) Material (MS/SS/)
Water Temp (°C) (Must be ≥ 0.5 °C and < 40
°C)
Gauge Delta (in³)
1 2 3 4 5 6 7 8 9 10 11 12 13 14
15
Run 2: Data from the filled unknown field standard:
Material for the Unknown: MS, SS, TP, PV
Final Gauge Reading: in3
Final Water Temperature: °C
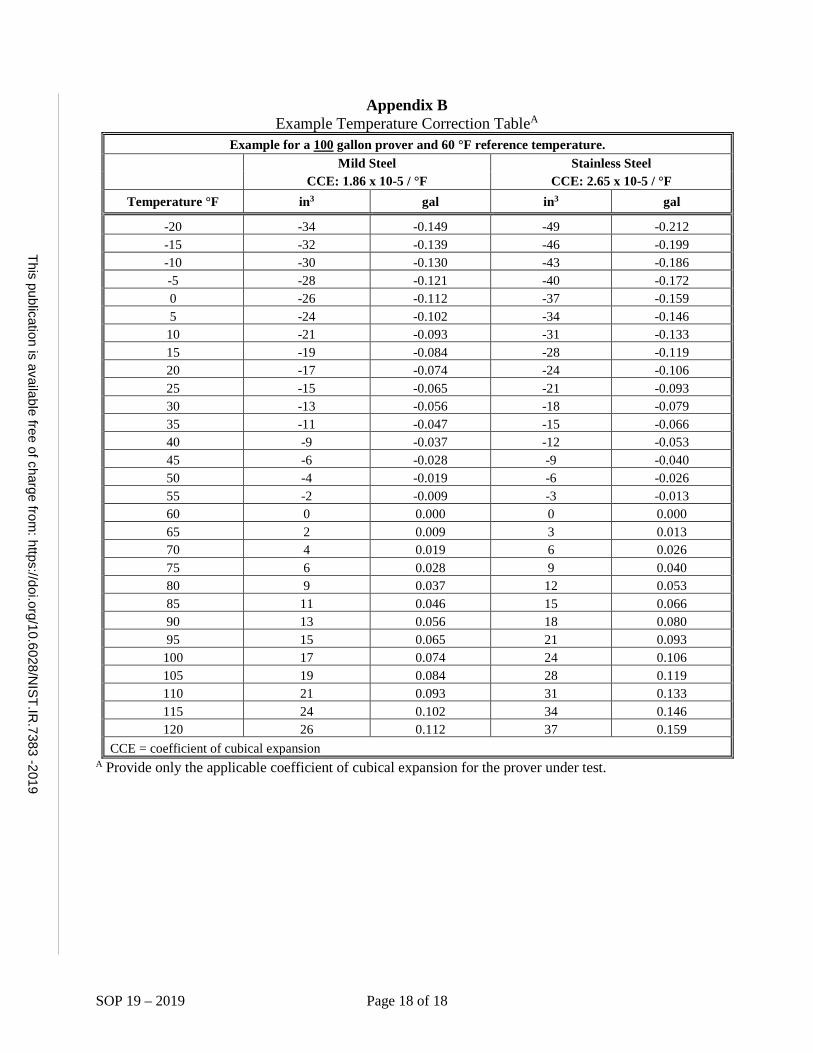
SOP 19 – 2019 Page 18 of 18
This publication is available free of charge from: https://doi.org/10.6028/N
IST.IR.7383 -2019
Appendix B Example Temperature Correction TableA
Example for a 100 gallon prover and 60 °F reference temperature.
Mild Steel Stainless Steel CCE: 1.86 x 10⁻⁵ / °F CCE: 2.65 x 10⁻⁵ / °F
Temperature °F in3 gal in3 gal
-20 -34 -0.149 -49 -0.212 -15 -32 -0.139 -46 -0.199 -10 -30 -0.130 -43 -0.186 -5 -28 -0.121 -40 -0.172 0 -26 -0.112 -37 -0.159 5 -24 -0.102 -34 -0.146
10 -21 -0.093 -31 -0.133 15 -19 -0.084 -28 -0.119 20 -17 -0.074 -24 -0.106 25 -15 -0.065 -21 -0.093 30 -13 -0.056 -18 -0.079 35 -11 -0.047 -15 -0.066 40 -9 -0.037 -12 -0.053 45 -6 -0.028 -9 -0.040 50 -4 -0.019 -6 -0.026 55 -2 -0.009 -3 -0.013 60 0 0.000 0 0.000 65 2 0.009 3 0.013 70 4 0.019 6 0.026 75 6 0.028 9 0.040 80 9 0.037 12 0.053 85 11 0.046 15 0.066 90 13 0.056 18 0.080 95 15 0.065 21 0.093
100 17 0.074 24 0.106 105 19 0.084 28 0.119 110 21 0.093 31 0.133 115 24 0.102 34 0.146 120 26 0.112 37 0.159
CCE = coefficient of cubical expansion A Provide only the applicable coefficient of cubical expansion for the prover under test.
SOP 20 – 2019 Page 1 of 5
This publication is available free of charge from: https://doi.org/10.6028/N
IST.IR.7383 -2019
SOP 20 Standard Operating Procedure
for Standard Deviation and Range Charts
1 Introduction
Purpose
This procedure describes a process to be followed to monitor the statistical control of a measurement process using standard deviation charts or range charts for any calibration method where replicate measurements are performed and where it is not practical or feasible to maintain laboratory check standards. Standard deviation charts are preferred to the use of range charts for monitoring and evaluating process standard deviations when replicate measurements are made.
Prerequisites
The procedure must match the calibration procedure that is being monitored.
2 Summary
Because of the size and cost of some laboratory standards, it is not always practical to have check standards remain in the laboratory for the purposes of measurement control. However, it is practical to maintain standard deviation (sp) charts or range (R) charts for each nominal size standard that is submitted to evaluate the standard deviation of replicate runs. Directions for preparing and using an R control chart that monitors the precision of the test procedure are given. It is assumed that standards of the same nominal capacity and design will have similar characteristics with respect to the repeatability of tests. Since it is not practical to run a sufficient number of tests on each unknown standard to determine the repeatability, the absolute difference between replicate tests are graphed on the same sp or R chart to reflect the repeatability of measurement of the unknown standards tested in the laboratory. Note: Provers of similar readability may be grouped together on the same chart as long as results from different sized provers pass an F-test (e.g., provers greater than and equal to 500 gal generally have 20 in3 graduations and equivalent repeatability).
3 Equipment
All equipment is designated in the respective calibration SOP.
4 Procedure
Define: Determine appropriate measurement assurance
The SOP used for calibration should contains instructions to define the type of measurement assurance and check standards to be measured and analyzed to ensure the process and standards are in control prior to reporting measurement values from calibrations.
SOP 20 – 2019 Page 2 of 5
This publication is available free of charge from: https://doi.org/10.6028/N
IST.IR.7383 -2019
Measure: Data Collection
Conduct the required number of replicates per test on the unknown test item per the designated SOP. A minimum of 12 sets of data must be available before a reasonably adequate data base is established. Note: 25 to 30 replicate sets of data are needed to determine valid uncertainties.
Tabulate the measured errors as determined by each of the two trials using a form such as the one contained in the Appendix. It is recommended that the data be maintained in a spreadsheet or other electronic program in lieu of a paper form. (If the unknown item is adjusted after the first run, the first trial reading after the adjustment is used in the evaluation).
Analyze: Calculate the standard deviation (recommended)
A standard deviation of the replicate runs, sp, may be calculated for each set of runs according to the appropriate SOP. An accepted standard deviation over time is calculated as the pooled standard deviation to represent the accepted standard deviation of the measurement process. This pooled standard deviation may be used to perform F-tests as part of the SOP to immediately determine pass/fail status of the runs.
Analyze: Calculate the range (optional)
Where the range is used, it represents is the absolute difference of two (or more) replicate runs. Be sure that only absolute values are used in the determination of the range and average range!
21 xxR −= Eqn. (1) Calculate the average range of the trials, R , for the n tests as follows:
nR
R ∑=Eqn. (2)
The estimated standard deviation may be calculated using the average range as follows (obtain values for *
2d from NISTIR 6969, Table 9.1 and see NISTIR 6969, Section 8.3 for additional notes). For one set of two runs, the
*2d value is 1.414; for one set of three runs the *
2d value is 1.91:
*2
pRsd
= Eqn. (3)
SOP 20 – 2019 Page 3 of 5
This publication is available free of charge from: https://doi.org/10.6028/N
IST.IR.7383 -2019
Analyze: Construct Appropriate Charts
Construct Standard Deviation Charts and Range Charts using the same approach. You may use 2 and 3 as the respective multipliers for the Upper Warning Limit and Upper Control Limits on standard deviation charts for replicates of two. See Table 1 for limits and replicate options based on a Warning Limit of 95 % and an Action Limit of 99.73 %. Note that there will be no negative numbers when calculating standard deviations or ranges. The formula for calculating alternative limits for standard deviations is given by:
, 1, ( 1)pooled J K JUCL s Fα − −= Eqn. (4)
Where the alpha is chosen based on the desired limits (e.g., 0.05 for 95 %); J-1 represents the degrees of freedom from the replicates used in the applicable SOP; and K(J-1) represents the degrees of freedom corresponding to the pooled standard deviation.
Table 1. Warning and Control Limits for Standard Deviation Charts. Replicates Upper Warning Limit Upper Action (Control) Limit
2 1.960 3.00 3 1.731 2.432 4 1.614 2.172 5 1.540 2.016 10 1.371 1.675
Construct an R control chart having the following limits based on the number of replicate measurements used in the process where the value in the table is multiplied by the average Range, R or Standard Deviation:
Table 2. Warning and Control Limit Multipliers for Range Charts. Replicates Upper Warning Limit Upper Action (Control) Limit
2 2.512 3.267 3 2.050 2.575 4 1.855 2.282 5 1.743 2.115 10 1.777
The lower control limit is zero. Note: Using subgroup standard deviations and pooled standard deviations is preferable.
Interpret the Data: Using Control Charts
Replicate trials are run on each standard submitted to the laboratory for calibration according to the specific SOP. The values for standard deviation or range are plotted on the appropriate control chart, preferably in

SOP 20 – 2019 Page 4 of 5
This publication is available free of charge from: https://doi.org/10.6028/N
IST.IR.7383 -2019
chronological order. The limits of the charts are such that 95 % of the values should fall within the warning limits and rarely should a value fall outside the control limits, provided that the system is in a state of statistical control.
If the values plotted on the standard deviation or range chart fall outside of the control limits, a decrease in precision is indicated. Problems with the standards or process will need to be investigated.
Even while the system is in an apparent state of control, incipient troubles may be indicated when the control data show short- or long-term trends, shifts, or runs.
Controlling the Process
No calibration data should be accepted when the system is out of control.
If a plotted value for standard deviation or range is outside of the warning limit but inside the control limit, a second set of replicate calibrations should be made. If the new value for the standard deviation or range is within the warning limit, the process may be considered in control. If it lies outside of the warning limit, lack of control is indicated. Investigation should be made, with suitable corrective action taken with demonstrated attainment of control before calibration measurements are considered acceptable.
Demonstration of "in control" indicates that the calibration process is consistent with the past experience of the laboratory. There is no reason to believe that excessive changes in precision have occurred.
The accuracy is inferred from a consideration of control of the sources of bias.
To the extent appropriate, the indicated measurement precision of the calibration of the measured type of standards may be extended to the calibration of other standards of similar type, capacity and design.
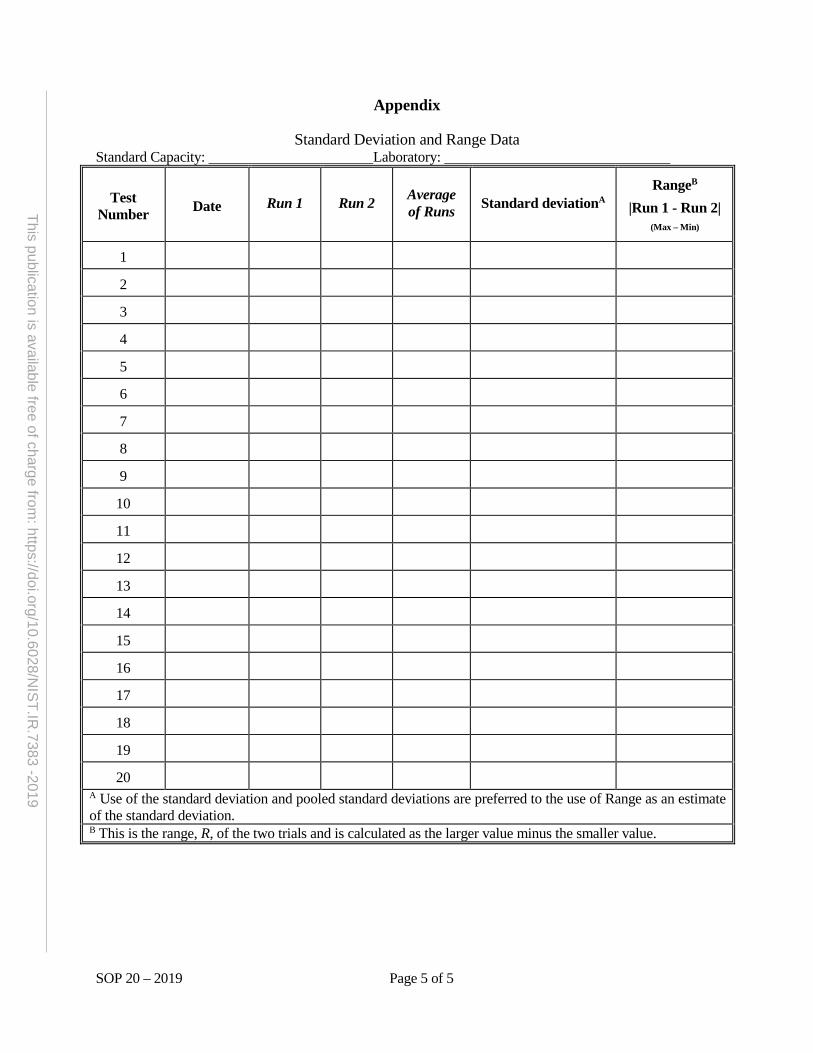
SOP 20 – 2019 Page 5 of 5
This publication is available free of charge from: https://doi.org/10.6028/N
IST.IR.7383 -2019
Appendix
Standard Deviation and Range Data Standard Capacity: Laboratory:
Test Number Date Run 1 Run 2 Average
of Runs Standard deviationA RangeB
|Run 1 - Run 2| (Max – Min)
1
2
3
4
5
6
7
8
9
10
11
12
13
14
15
16
17
18
19
20 A Use of the standard deviation and pooled standard deviations are preferred to the use of Range as an estimate of the standard deviation. B This is the range, R, of the two trials and is calculated as the larger value minus the smaller value.

This page is intentionally blank.
This publication is available free of charge from: https://doi.org/10.6028/N
IST.IR
.7383-2019
SOP 21 – 2019 Page 1 of 22
This publication is available free of charge from: https://doi.org/10.6028/N
IST.IR
.7383 -2019
SOP 21
Standard Operating Procedure for Calibration of LPG Provers1
1 Introduction
Purpose
This procedure is used to calibrate a volumetric field standard that is used to test systems designed to measure and deliver liquefied petroleum gas (LPG) in the liquid state by definite volume, whether installed in a permanent location or mounted on a vehicle. A schematic diagram of such a prover is shown in Figure 1, with the various system components numbered to clarify the various operations described in the procedure. Upon completion of this procedure the prover volume is reported to provide the correct volume at the reference temperature of 60 °F and reference pressure of 100 psig. Detailed measurement ranges, standards, equipment, and uncertainties for this SOP are generally compiled in a separate document in the laboratory.
Conformity Assessment
Standards that are calibrated for use in legal weights and measures applications should be evaluated for conformance to the appropriate specifications and tolerances that apply. LPG provers being calibrated should be evaluated for conformance using the checklist provided in NIST Handbook 105-4, Specifications and Tolerances for Liquefied Petroleum Gas and Anhydrous Ammonia Liquid Volumetric Provers, 2016. Where compliance is required by law, conformity evaluations should be conducted prior to performing calibrations. See Section 6.2 for reporting results.
Prerequisites
Verify the unknown prover has been properly cleaned and vented with all petroleum products removed prior to submission for calibration to ensure laboratory safety. The prover and/or pressure gauge must be visually inspected to determine that residual products are not present. Smell is not necessarily an adequate indicator of cleanliness.
Note: Many laboratories have a policy regarding cleanliness of submitted volumetric standards to minimize water contamination with flammable petroleum products. Be sure to follow laboratory safety policies for working with petroleum products and pressurized vessels.
Verify that valid current calibration certificates with measurement values and uncertainties are available for all the standards used in the calibration.
1 Non-SI units are predominately in common use in State legal metrology laboratories, and/or the petroleum industry for many volumetric measurements, therefore non-SI units have been used to reflect the practical needs of the laboratories performing these measurements as appropriate. Most LPG provers in use are 20 gal, 25 gal, and 100 gal nominal sizes. The volume of LPG provers is established at reference conditions of 60 ºF and 100 psig.
SOP 21 – 2019 Page 2 of 22
This publication is available free of charge from: https://doi.org/10.6028/N
IST.IR
.7383 -2019
All calibration values must have demonstrated metrological traceability to the International System of Units (SI). Metrological traceability may be to the SI through a National Metrology Institute such as NIST.
Verify that the standards to be used have sufficiently small standard uncertainties for the intended level of the calibration.
Verify the availability of an adequate supply of clean water complying with GLP 10. Conditioning the water to achieve equilibration with the laboratory environment, to achieve minimal air entrainment and filtering to ensure minimal suspended solids is recommended. Water does not need to be distilled or deionized for use in this procedure. The equations used in GLP 10 for the calculation of water density (air saturated) may be used without a significant impact on the measurement results because the density values are used as ratios.
Verify that the operator has had specific training in SOP 19, SOP 20, SOP 21, SOP 31, and GMP 3 and is familiar with the operating characteristics and conditioning of the standards and unknown test items being used and calibrated.
Ensure that a full cylinder of nitrogen or compressed air, or a regulated air source of at least 200 psig, and a proper pressure regulator, connection hose, pressure control valves and an appropriately sized pressure relief valve set to relieve at no more than 300 psig are available.
Ensure that proper safety procedures are followed for any installation requiring that the operator work from an elevated surface; that any fall restraints, handrails or other safety related items have been properly inspected and are used as required by laboratory policy.
Verify that the laboratory facilities meet the following minimum conditions to make possible the expected uncertainty achievable with this procedure:
Table 1. Laboratory environmental conditions.
Procedure Temperature Relative Humidity
Volume Transfer 18 °C to 27 °C Stable to ± 2.0 °C / 1 h
35 % to 65 % Stable to ± 20 % / 4 h
The care required for calibrations conducted outside of a permanent laboratory includes proper safety, a clean and bubble-free water supply, measurement control programs, minimal air movement and a stable temperature environment shaded from direct sunshine to allow the prover, field standard, and clean calibration liquid (water) to reach an equilibrium temperature with minimal evaporation. Environmental conditions must be selected to be within stated laboratory conditions during the measurements.
SOP 21 – 2019 Page 3 of 22
This publication is available free of charge from: https://doi.org/10.6028/N
IST.IR
.7383 -2019
All data and appropriate environmental conditions must be documented regardless of calibration location.
2 Methodology
Scope, Precision, Accuracy
This procedure is applicable for the calibration of LPG field standard provers with capacities of 100 L to 500 L (20 gal to 100 gal) or larger when appropriate. Provers of 20 gal, 25 gal, and 100 gal (with gal and in3 units) are encountered most frequently, thus the procedure is written with that in mind. The changes necessary for calibrating provers of other capacities will be obvious and are not described in this document. The agreement of duplicate measurements made within a short period of time on a given LPG field standard prover must agree within 0.02 % of the volume. Where the demonstrated standard deviation of the measurement process is less than 0.02 % of the volume, replicate values must agree within the limits on the standard deviation chart. The calibration accuracy will depend on the uncertainty in the volume of the standard, on the care exercised in making the various measurements and temperature readings, and on correct application of the corresponding corrections.
Summary
The procedure is a modification of one described by M.W. Jensen in NBS Handbook 99, "Examination of Liquefied Petroleum Gas Liquid- Measuring Devices." The LPG prover is calibrated with a known volume of water delivered into it from a standard prover of calibrated volume. Depending on the respective volumes, multiple transfers may be required. While multiple transfers should be minimized, a maximum of 15 transfers are permitted to ensure that final calibration uncertainties are sufficiently small to meet user applications. The temperature of the calibration medium (water) cannot be considered constant during transfers; thus, the temperature of the water for each transfer must be measured. Because of the large volumes, the difference in thermal expansion of the respective vessels must be considered. The LPG prover is pressurized and the liquid level is measured at each of several values of applied pressure. The calibration thus defines the capacity of the prover over its expected range of operational pressures. Upon completion of this procedure the prover volume is reported to provide the correct volume, Vref, at the reference temperature of 60 °F and reference pressure of 100 psig.
Standards and Equipment
The following are required to properly perform the calibration of a Field Standard LPG prover:
SOP 21 – 2019 Page 4 of 22
This publication is available free of charge from: https://doi.org/10.6028/N
IST.IR
.7383 -2019
A calibrated standard prover having a minimum volume of 5 gal is acceptable for 20 gal and 25 gal LPG provers. A 10 gal standard is acceptable for calibrating a 100 gal LPG prover, but a standard that is of the same volume as the LPG prover is preferable.
Note: Standard provers used for calibration may need to have an alternative calibration value based on restricted flow delivery as the opening of many LPG provers may not be adequate to receive the full flow delivery from the reference standard. The calibrated volume of all standards used in this procedure must be determined using the same outlet piping as is used for LPG prover calibrations.
A funnel to aid in transferring water from calibrated flasks into the unknown prover.
Calibrated standards, typically glassware, of suitable sizes to calibrate the neck of prover.
Thermometers (2) with resolution and uncertainty better than 0.1 °C.
Note regarding temperature measurements: A digital temperature sensing device having a long cable will allow insertion of the probe into the standard and the unknown to enable direct liquid temperature measurements at the bottom, middle, and top of the provers. If the prover thermometer wells are used, ensure that the prover has equalized with the temperature of the water.
Meniscus reading devices (See GMP 3).
Timing device (calibration is not required; the uncertainty of the measurement only needs to be less than 5 s for a 30 s pour time).
Sturdy platform, with appropriate safety conditions and complying with laboratory policies, with sufficient height to hold standard and to permit transfer of water from it to the prover by gravity flow.
Clean smoothbore pipe or tubing (hoses) to facilitate transfer of water from the laboratory standard to the LPG prover. Nearly all LPG provers require reducers to be used between normal laboratory piping and the top hole on the prover. Pipe and hose lengths must be minimized to reduce water retention errors. Care must be taken during wet-downs and calibration runs to ensure complete drainage and consistent retention in all hoses or pipes. Arrange all hoses so that there are no loops or low spots that can hold water.
Cylinder of compressed nitrogen or air with suitable regulator, as noted with prerequisites, and an appropriate pressure gauge.
Pressure Gauges
The accuracy of the prover calibration relies on the accuracy of the pressure gauge used to measure the internal prover pressure. When the gauge mounted on the prover is used for the measurement, it is assumed that
SOP 21 – 2019 Page 5 of 22
This publication is available free of charge from: https://doi.org/10.6028/N
IST.IR
.7383 -2019
systematic errors in the prover pressure gauge will be present in field application and use, thus calibration of the laboratory pressure gauge is not essential. However, the prover must be recalibrated if the pressure gauge is changed or repaired in the field.
When a laboratory pressure gauge is used to measure the internal prover pressure during the calibration, the laboratory gauge and the prover gauge must both have current calibration certificates.
Pipe plugs to seal unused prover ports, and piping and valves needed to facilitate gravity draining the prover in a time as similar as possible to the time taken to empty the prover using the LPG system pump.
Materials to seal all piping threads to permit pressurization to 200 psig. If thread tape is used in place of paste thread sealant, extra care must be exercised to ensure that no thread tape debris enters the prover under test.
Procedure
Preliminary Operations
2.4.1.1 Install and level the standard(s) on a raised platform with appropriate security and safety ensured for the prover(s) and operator(s). Provide pipe or tubing for delivery of water by the most direct route to the prover. Position and level the unknown prover where it can be reached from the elevated standard by the shortest feasible delivery system. Replace all valves and piping connected to the prover body below the nominal volume line with plugs and laboratory owned valves and fittings to eliminate errors that will result from leakage or expansion when the prover is pressurized to 200 psig or more during the calibration. These potential errors typically affect only the prover calibration process and have no effect during normal use because the prover zero indication is established under LPG system pressure. (If there is no significant change in system pressure once the zero setting is established during a meter test the change in system volume is minimal). Install in one lower port a fitting and valve for draining the prover. Plug all other ports with sealed plugs of suitable pressure ratings.
2.4.1.2 Remove the plug and/or relief valve (1) from the top of the LPG prover, and extend the drain pipe of the standard prover into the hole. This may require the use of a reducer and a short length of hose (about 1 inch in diameter). If this is a tight fit, open the vapor return line valve (connected to 12c) to provide an air bleed.
2.4.1.3 If the prover inlet hose (11) is to be used as a gravity drain, it must be disconnected from the bottom of the prover, any check valves (12a) installed during normal operations removed and a valve installed between the prover body and the hose to ensure isolation of the hose from the pressurized prover. Failure to insert this
SOP 21 – 2019 Page 6 of 22
This publication is available free of charge from: https://doi.org/10.6028/N
IST.IR
.7383 -2019
isolation valve will result in errors during the pressurized portion of the prover calibration. These errors will NOT be offset during use!
Cleanliness Check
Both the standard and the unknown prover must be internally clean. This should be verified by checking that water properly drains from them. If necessary, either or both should be cleaned with water and non-foaming detergent (see GMP No. 6) to attain good drainage characteristics. Additional effort may be required to eliminate scaling and contamination build-up from the inside of LPG provers. It is a good practice to remove the bottom drain plug (13) from the bottom of the prover lower neck to allow removal of any debris that may have accumulated in the lower neck of the prover.
Neck scale plate calibration
Neck scale plate calibrations are generally conducted only for new or damaged volumetric measures, those that have not been calibrated by the laboratory in the past, or those for which the calibration data is not available. See SOP 31 for the neck scale plate calibration procedure.
Body Calibration
2.4.4.1 Drain the unknown LPG prover through the drain valve installed during prover preparations and the connected hose. When the liquid reaches the top of the lower gauge glass, close the drain valve and adjust the liquid meniscus level to the lower neck zero graduation. Record the elapsed time required to drain the prover to the top of the neck, ti. Continue adjusting the liquid level until completion of the final drain time of 30 s. The liquid level should be exactly at the zero graduation and the drain valve closed simultaneously at the end of the 30 s drain time. (Final adjustment of the water level close to the zero mark should be started during the 30 s final drain period but should not be completed before the end of the 30 s drain period).
Alternatively, though not recommended because of resulting errors, the prover may be completely drained, given a 30 s final drain time and then refilled to the lower zero graduation with a funnel that has been wet down by adding the small volume of water needed to bring the level to the zero graduation. Errors will result from this process due to the extended time between closing the valve and setting the zero level and other factors associated with the process and should be considered in the uncertainty assessment. These errors can be minimized if the prover is refilled to the lower neck zero graduation within 30 s of cessation of main flow.
2.4.4.2 Once the zero indication has been properly established, transfer the nominal volume from the standard(s) into the LPG prover in the usual manner, recording the associated delta (offset of the water
SOP 21 – 2019 Page 7 of 22
This publication is available free of charge from: https://doi.org/10.6028/N
IST.IR
.7383 -2019
level in the standard from nominal) and water temperature reading in the standard. If multiple transfers are required, record the water temperature of the standard at the time of each transfer, but that of the LPG prover only after the final transfer. Verify that the LPG prover retained its level condition or adjust it to the level condition as noted earlier. "Rock" the prover to "bounce" the liquid in the upper sight gauge before reading. Record the final scale indication and prover temperature after the nominal volume has been transferred into the unknown LPG prover with 0 psig pressure applied, Run 1ATM.
2.4.4.3 Reinstall the plug and relief valve in the top of the prover using an appropriate sealant to create a leak free installation.
Caution: Ensure that all piping and fittings are rated for the pressures to which they will be exposed.
2.4.4.4 Pressurize the prover to 200 psig, hold that pressure for several minutes, then return the prover pressure to 0 psig and verify that the prover indication has not changed from that previously recorded as Run 1ATM. If the prover indication returns to the recorded value, pressurize the prover to 100 psig and record the prover indication and temperature, Run 1100.
Note: The prover indication at 0 psig must return to the value recorded as Run 1ATM. If it does not, corrective action must be taken to correct any causes, i.e., leaks, excessive air entrained in the water. Once corrective actions are completed repeat 2.4.1.1 through 2.4.4.3
2.4.4.5 Calculate the effective volume of water delivered into the prover using Eqn. 3 or Eqn. 4 as appropriate. Record that value, Run 1 Vref.
2.4.4.6 Calculate the prover volume for Run 1 using Eqn. 6 or Eqn. 7, as appropriate. Record the calculated prover volume, Run 1AsFound. The calculated prover volume must be within ± 0.2 % of the prover nominal volume.
2.4.4.7 If the indication is not within ± 0.2 % of the prover nominal volume the prover must be adjusted (whenever possible) to indicate the Vref value as described in 2.4.6 Prover Adjustment to Nominal.
2.4.4.8 After completing the prover adjustment process, repeat 2.4.4.1 through 2.4.4.6 as needed until the “As Left” prover volume is as near to the prover nominal as possible. Record the final prover volume, Run 1Final.
2.4.4.9 Repeat steps 2.4.4.1 through 2.4.4.6 for Run 2 recording Run 2ATM, and Run 2100.

SOP 21 – 2019 Page 8 of 22
This publication is available free of charge from: https://doi.org/10.6028/N
IST.IR
.7383 -2019
2.4.4.10 Calculate the effective volume of water delivered into the prover using Eqn. 3 or Eqn. 4 as appropriate. Record that value as Run 2 Vref.
2.4.4.11 Calculate the prover volume for Run 2 using Eqn. 6 or Eqn. 7. Record the calculated prover volume for Run 2Final. The calculated prover volume must be within ± 0.2 % of the prover nominal volume.
2.4.4.12 The calculated prover volume, Run 2Final, must agree with the Run 1Final value within ± 0.02 % of the prover nominal volume or pass the F-test as shown in Section 3 (use the more stringent limits for assessment of repeatability).
2.4.4.13 If the prover volumes do not repeat within 0.02 % of prover nominal volume, or pass the F-test (whichever limit is more stringent), corrective action must be initiated and the calibration runs repeated until two consecutive calibration runs repeat within 0.02 % of prover nominal volume or pass the F-test indicating that the accepted laboratory process limits are met.
Pressure Correction Curve Determination
2.4.5.1 The internal pressure and thus the volume of the prover may vary during use. Accordingly, a pressure correction must be made, using the Pressure Correction Calculations given in section 3.3.
2.4.5.2 The calibration status of the pressure gauge mounted on the prover MUST be assessed and documented on the calibration certificate.
It is a best practice to permanently mark the mounted pressure gauge with a unique identifier that can be included as the gauge identification on the prover calibration certificate.
Caution: Ensure that all piping and fittings are rated for the pressures to which they will be exposed.
2.4.5.3 Ensure that all valves are closed except the vapor return valve, if still installed and being used to apply pressure to the prover.
2.4.5.4 Verify that the final scale indication has not changed since it was recorded at the end of Run 2 (if it has changed it may signal a leak in one of the valves or fittings), and then bleed off pressure until the installed prover gauge reads 0 psig.
2.4.5.5 Apply pressure to the prover until the installed pressure gauge indicates 20 psig.
Note: As pressure is applied, the density of the water increases thus decreasing the water level inside the prover; the gas in the prover heats up and then cools; the prover shape begins to change due to
SOP 21 – 2019 Page 9 of 22
This publication is available free of charge from: https://doi.org/10.6028/N
IST.IR
.7383 -2019
pressure deformation; all resulting in a drifting pressure setting as the system comes to equilibrium. Continue adjusting the pressure until a stable pressure indication is obtained while lightly tapping the gauge to ensure that the gauge needle is not sticking. (Rotating the handle of a screwdriver against the side of the pressure gauge is a good alternative to tapping on the gauge).
2.4.5.6 "Bounce" the liquid in the neck, then read and record the liquid level at this applied pressure, sr20i.
2.4.5.7 Continue increasing the pressure in the prover, setting a stable pressure at 50 psig, 100 psig, 150 psig and 200 psig, recording the prover indication at each pressure, sr50i, sr100i, sr150i, and sr200i.
Note: The scale indication at 100 psig should be the same as was observed for Run 2100.
2.4.5.8 Slowly decrease the prover pressure, setting a stable pressure at 150 psig, 100 psig, 50 psig and 20 psig, recording the prover indication at each pressure, sr150d, sr100d, sr50d, and sr20d.
Note: As the pressure is released the components of the system ‘relax’ and the gas temperature cools, the pressure drifts as the system equilibrates with each pressure change.
2.4.5.9 The prover indication at each corresponding decreasing pressure must repeat the increasing pressure indication within 0.02 % of nominal prover volume.
2.4.5.10 If any decreasing pressure indication fails to repeat the corresponding increasing pressure indication within 0.02 % of nominal prover volume the cause for this failure must be determined and the calibration performed again until repeatability is obtained.
2.4.5.11 A plot of the scale indications versus the applied pressure should be relatively linear. If significant non-linearity is detected it may indicate either trapped air or significant deformation of the prover body with changes in pressure.
If the issue is determined to be trapped air, the cause of this air entrapment must be corrected and the prover calibration repeated.
If the problem is determined to be significant deformation of the prover body with changes in pressure, the prover must be taken out of service and a hydrostatic pressure test scheduled as it may indicate failure of the materials from which the prover is made. This will likely require replacement of the prover.
Prover Adjustment to Nominal
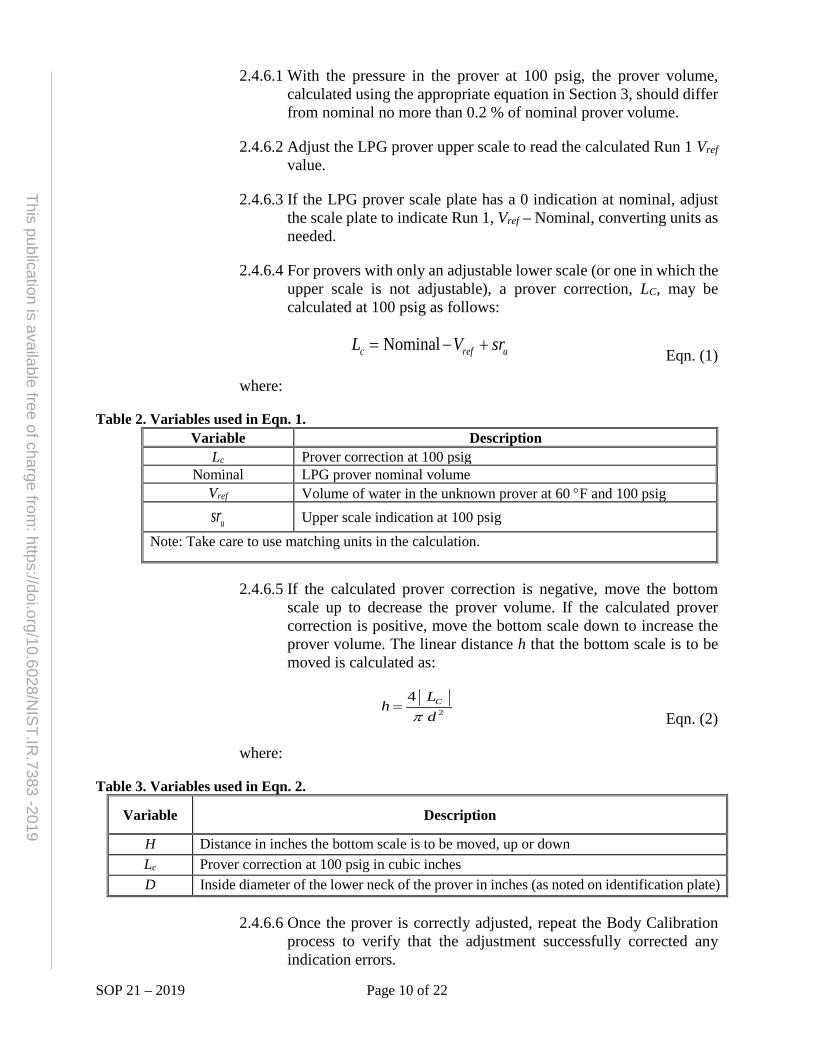
SOP 21 – 2019 Page 10 of 22
This publication is available free of charge from: https://doi.org/10.6028/N
IST.IR
.7383 -2019
2.4.6.1 With the pressure in the prover at 100 psig, the prover volume, calculated using the appropriate equation in Section 3, should differ from nominal no more than 0.2 % of nominal prover volume.
2.4.6.2 Adjust the LPG prover upper scale to read the calculated Run 1 Vref value.
2.4.6.3 If the LPG prover scale plate has a 0 indication at nominal, adjust the scale plate to indicate Run 1, Vref – Nominal, converting units as needed.
2.4.6.4 For provers with only an adjustable lower scale (or one in which the upper scale is not adjustable), a prover correction, LC, may be calculated at 100 psig as follows:
Nominalc ref uL V sr= − + Eqn. (1)
where:
Table 2. Variables used in Eqn. 1. Variable Description
Lc Prover correction at 100 psig Nominal LPG prover nominal volume
Vref Volume of water in the unknown prover at 60 °F and 100 psig
usr Upper scale indication at 100 psig Note: Take care to use matching units in the calculation.
2.4.6.5 If the calculated prover correction is negative, move the bottom scale up to decrease the prover volume. If the calculated prover correction is positive, move the bottom scale down to increase the prover volume. The linear distance h that the bottom scale is to be moved is calculated as:
2 4
dL
h C
π=
Eqn. (2)
where:
Table 3. Variables used in Eqn. 2.
Variable Description
H Distance in inches the bottom scale is to be moved, up or down Lc Prover correction at 100 psig in cubic inches D Inside diameter of the lower neck of the prover in inches (as noted on identification plate)
2.4.6.6 Once the prover is correctly adjusted, repeat the Body Calibration process to verify that the adjustment successfully corrected any indication errors.
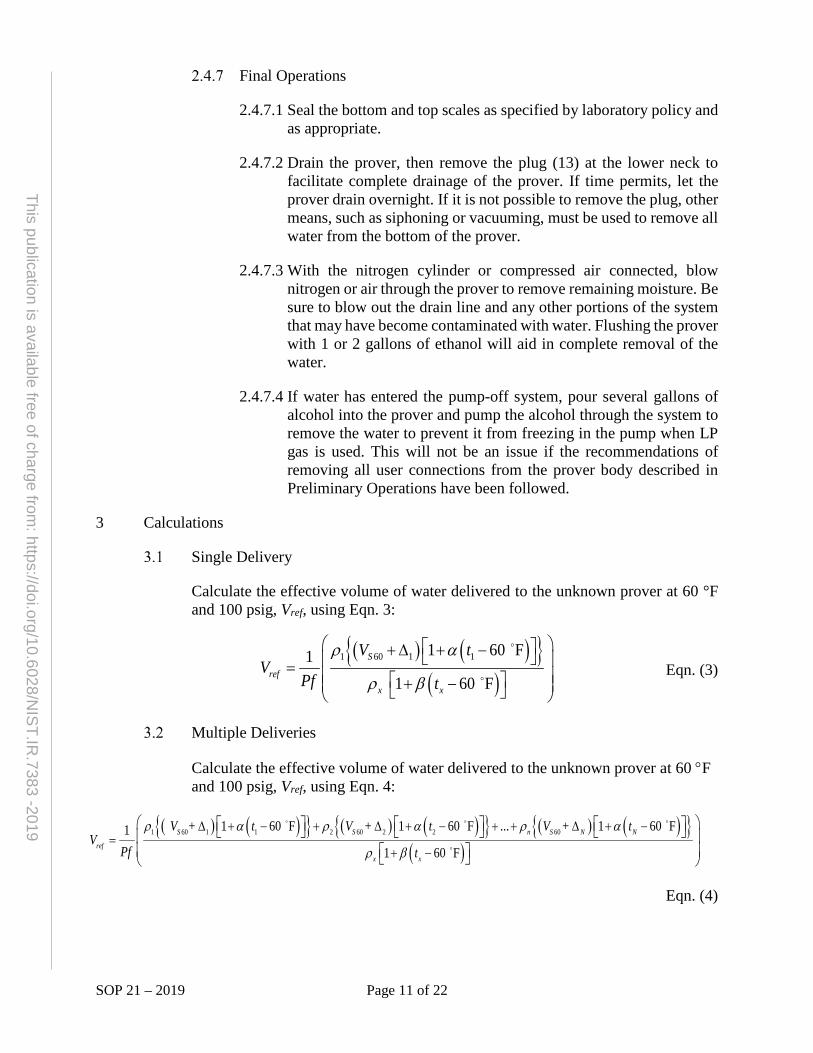
SOP 21 – 2019 Page 11 of 22
This publication is available free of charge from: https://doi.org/10.6028/N
IST.IR
.7383 -2019
Final Operations
2.4.7.1 Seal the bottom and top scales as specified by laboratory policy and as appropriate.
2.4.7.2 Drain the prover, then remove the plug (13) at the lower neck to facilitate complete drainage of the prover. If time permits, let the prover drain overnight. If it is not possible to remove the plug, other means, such as siphoning or vacuuming, must be used to remove all water from the bottom of the prover.
2.4.7.3 With the nitrogen cylinder or compressed air connected, blow nitrogen or air through the prover to remove remaining moisture. Be sure to blow out the drain line and any other portions of the system that may have become contaminated with water. Flushing the prover with 1 or 2 gallons of ethanol will aid in complete removal of the water.
2.4.7.4 If water has entered the pump-off system, pour several gallons of alcohol into the prover and pump the alcohol through the system to remove the water to prevent it from freezing in the pump when LP gas is used. This will not be an issue if the recommendations of removing all user connections from the prover body described in Preliminary Operations have been followed.
3 Calculations
Single Delivery
Calculate the effective volume of water delivered to the unknown prover at 60 °F and 100 psig, Vref, using Eqn. 3:
( ) ( ){ }( )
1 60 1 1
1 60 F11 60 F
S
refx x
V tV
Pf t
ρ α
ρ β
+ ∆ + − = + −
Eqn. (3)
Multiple Deliveries
Calculate the effective volume of water delivered to the unknown prover at 60 °F and 100 psig, Vref, using Eqn. 4:
( ) ( ){ } ( ) ( ){ } ( ) ( ){ }( )
1 60 1 1 2 60 2 2 60 + 1 60 F + 1 60 F ... + 1 60 F11 60 F
S S n S N N
ref
x x
V t V t V tV
Pf t
ρ α ρ α ρ α
ρ β
∆ + − + ∆ + − + + ∆ + −=
+ −
Eqn. (4)
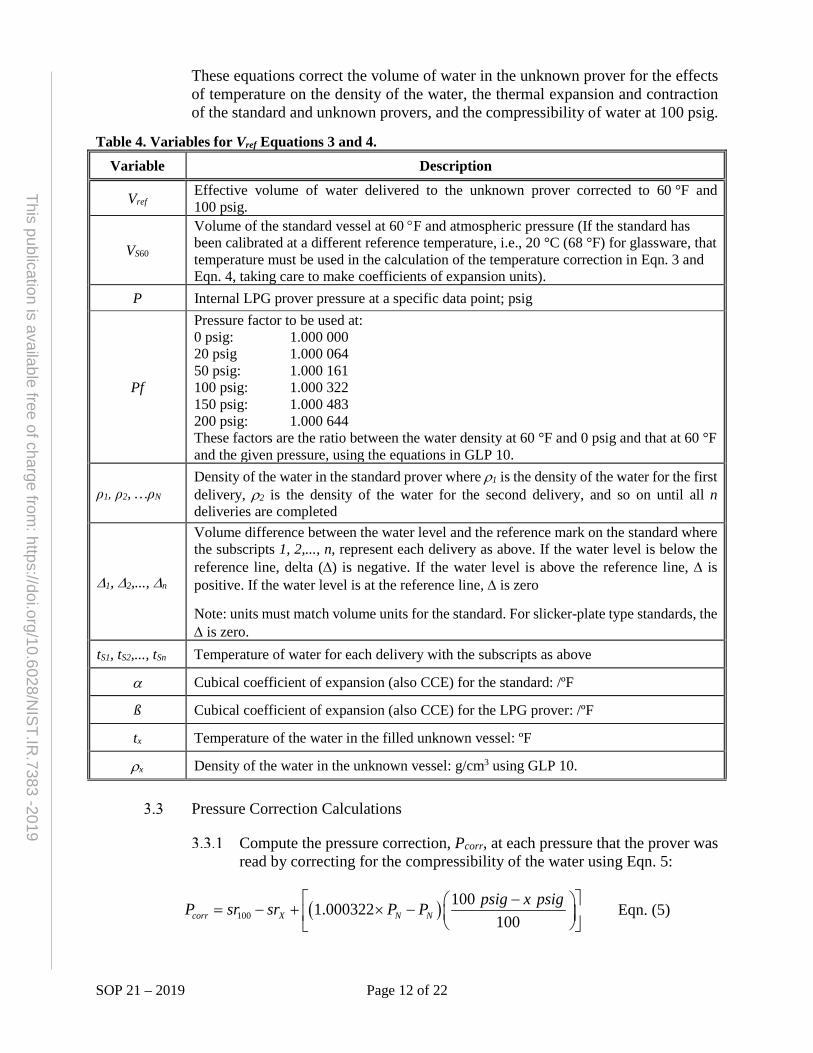
SOP 21 – 2019 Page 12 of 22
This publication is available free of charge from: https://doi.org/10.6028/N
IST.IR
.7383 -2019
These equations correct the volume of water in the unknown prover for the effects of temperature on the density of the water, the thermal expansion and contraction of the standard and unknown provers, and the compressibility of water at 100 psig.
Table 4. Variables for Vref Equations 3 and 4. Variable Description
Vref Effective volume of water delivered to the unknown prover corrected to 60 °F and 100 psig.
VS60
Volume of the standard vessel at 60 °F and atmospheric pressure (If the standard has been calibrated at a different reference temperature, i.e., 20 °C (68 °F) for glassware, that temperature must be used in the calculation of the temperature correction in Eqn. 3 and Eqn. 4, taking care to make coefficients of expansion units).
P Internal LPG prover pressure at a specific data point; psig
Pf
Pressure factor to be used at: 0 psig: 1.000 000 20 psig 1.000 064 50 psig: 1.000 161 100 psig: 1.000 322 150 psig: 1.000 483 200 psig: 1.000 644 These factors are the ratio between the water density at 60 °F and 0 psig and that at 60 °F and the given pressure, using the equations in GLP 10.
ρ1, ρ2, …ρN Density of the water in the standard prover where ρ1 is the density of the water for the first delivery, ρ2 is the density of the water for the second delivery, and so on until all n deliveries are completed
∆1, ∆2,..., ∆n
Volume difference between the water level and the reference mark on the standard where the subscripts 1, 2,..., n, represent each delivery as above. If the water level is below the reference line, delta (∆) is negative. If the water level is above the reference line, ∆ is positive. If the water level is at the reference line, ∆ is zero
Note: units must match volume units for the standard. For slicker-plate type standards, the ∆ is zero.
tS1, tS2,..., tSn Temperature of water for each delivery with the subscripts as above
α Cubical coefficient of expansion (also CCE) for the standard: /ºF
ß Cubical coefficient of expansion (also CCE) for the LPG prover: /ºF
tx Temperature of the water in the filled unknown vessel: ºF
ρx Density of the water in the unknown vessel: g/cm3 using GLP 10.
Pressure Correction Calculations
Compute the pressure correction, Pcorr, at each pressure that the prover was read by correcting for the compressibility of the water using Eqn. 5:
( )1001001.000322
100corr X N Npsig x psigP sr r P Ps − = × −
+
− Eqn. (5)
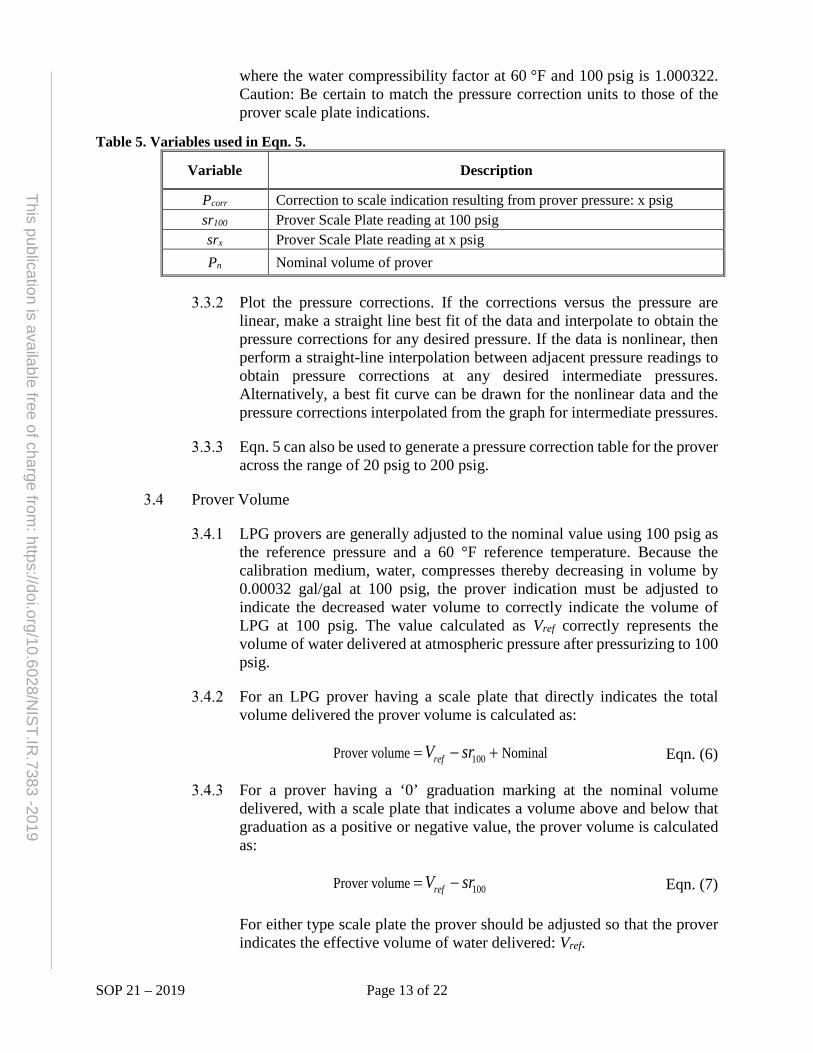
SOP 21 – 2019 Page 13 of 22
This publication is available free of charge from: https://doi.org/10.6028/N
IST.IR
.7383 -2019
where the water compressibility factor at 60 °F and 100 psig is 1.000322. Caution: Be certain to match the pressure correction units to those of the prover scale plate indications.
Table 5. Variables used in Eqn. 5.
Variable Description
Pcorr Correction to scale indication resulting from prover pressure: x psig sr100 Prover Scale Plate reading at 100 psig srx Prover Scale Plate reading at x psig Pn Nominal volume of prover
Plot the pressure corrections. If the corrections versus the pressure are linear, make a straight line best fit of the data and interpolate to obtain the pressure corrections for any desired pressure. If the data is nonlinear, then perform a straight-line interpolation between adjacent pressure readings to obtain pressure corrections at any desired intermediate pressures. Alternatively, a best fit curve can be drawn for the nonlinear data and the pressure corrections interpolated from the graph for intermediate pressures.
Eqn. 5 can also be used to generate a pressure correction table for the prover across the range of 20 psig to 200 psig.
Prover Volume
LPG provers are generally adjusted to the nominal value using 100 psig as the reference pressure and a 60 °F reference temperature. Because the calibration medium, water, compresses thereby decreasing in volume by 0.00032 gal/gal at 100 psig, the prover indication must be adjusted to indicate the decreased water volume to correctly indicate the volume of LPG at 100 psig. The value calculated as Vref correctly represents the volume of water delivered at atmospheric pressure after pressurizing to 100 psig.
For an LPG prover having a scale plate that directly indicates the total volume delivered the prover volume is calculated as:
100Prover volume Nominal refV sr= − + Eqn. (6)
For a prover having a ‘0’ graduation marking at the nominal volume delivered, with a scale plate that indicates a volume above and below that graduation as a positive or negative value, the prover volume is calculated as:
100Prover volume refV sr= − Eqn. (7)
For either type scale plate the prover should be adjusted so that the prover indicates the effective volume of water delivered: Vref.
SOP 21 – 2019 Page 14 of 22
This publication is available free of charge from: https://doi.org/10.6028/N
IST.IR
.7383 -2019
Calculate the within process standard deviation, sw, for the replicate runs. For two runs, the degrees of freedom will be one.
Calculate the F statistic to compare the observed within process standard deviation, sw, to the accepted (pooled) within process standard deviation for the measurement process. (See NISTIR 6969, Sections 8.4 and 8.9.2, for more information on pooling standard deviations and F-tests).
2Accepted
2Observed
w
w
ssF = Eqn. (8)
The calculated F statistic must be less than the F value obtained from an F table at 95 % confidence level (Table 9.12, NISTIR 6969) to be acceptable. The F value is obtained from the F table for one degrees of freedom for the numerator and the degrees of freedom for the denominator is equal to the number of degrees of freedom in the pooled within process standard deviation. If the data fails the F-test and the source of the error cannot be determined conclusively and corrected, the measurement must be repeated.
Calculate and report the mean volume of the volumetric standard at 60 °C and 100 psig.
If adjustments were made during replicate runs, report the “as found” volume or the mean of “as found” volumes and the “as left” volume or mean of “as left” volumes, as applicable, at 60 °F and 100 psig. (I.e., do not calculate a mean value by combining “as found” and “as left” values when adjustments are made).
4 Measurement Assurance
Due to the cost of obtaining an LPG prover for use as a check standard it will be unlikely that a laboratory will have one in place. Instead a standard deviation chart is used to monitor the within process standard deviation.
SOP 21 – 2019 Page 15 of 22
This publication is available free of charge from: https://doi.org/10.6028/N
IST.IR
.7383 -2019
A standard deviation chart is used for measurement assurance through the evaluation of replicate measurements. The standard deviation of each combination of Run 1 and Run 2 is calculated and the pooled standard deviation over time may be used to estimate the short-term variability in the measurement process. A standard deviation chart for unknown provers represents the variability in condition of test measures submitted for calibration as well as the short-term repeatability of the measurement process but does not monitor the stability of the reference standard or represent the variability or potential systematic errors associated with meniscus readings. The range of the calibration runs must repeat to within 0.02 % of the volume, or the standard deviation must be less than applicable control/action limits on standard deviation charts, or the observed standard deviation must pass the F-test statistics (as applicable).
For unknown standards that are adjusted, do not combine an “as found” value with an “as left” value for the two runs recorded in the chart; use the adjusted value from Run 1 and the value from Run 2, both at the applicable reference temperature and pressure, when entering values in a standard deviation or range chart.
5 Assignment of Uncertainties
The limits of expanded uncertainty, U, include estimates of the standard uncertainty of the laboratory volumetric standards used, us, plus the standard deviation of the process, sp, and the additional items noted below and in the uncertainty budget table, Table 4, at the 95 % level of confidence. See SOP 29 for the complete standard operating procedure for calculating the uncertainty.
The standard uncertainty for the standard, us, is obtained from the calibration certificate. The combined standard uncertainty, uc, is used and not the expanded uncertainty, U, therefore the reported uncertainty for the standard will usually need to be divided by the coverage factor k.
Note: See NISTIR 6969, SOP 29 for the complete standard operating procedure for calculating the uncertainty when multiple deliveries or multiple standards are used to correctly calculate correlated uncertainties. Fifteen is the maximum recommended number of deliveries from a laboratory standard to a prover under test to minimize calibration uncertainties to the levels identified previously.
SOP 21 – 2019 Page 16 of 22
This publication is available free of charge from: https://doi.org/10.6028/N
IST.IR
.7383 -2019
The standard deviation of the measurement process sp, is taken from a standard deviation chart for LPG provers (and not from charts for a refined fuel check standard) (See SOP 17, SOP 20 and SOP 30). Check standards are not normally available.
Neck calibration uncertainty should be estimated based on the uncertainty of standards used, errors observed during calibration, ability to read the meniscus of all standards involved (see GMP 3), and the repeatability of the neck calibration (See SOP 31).
Other standard uncertainties usually included at this calibration level are: 1) uncertainties associated with the ability to read the meniscus, only part of which is included in the process variability due to parallax and visual capabilities, and 2) uncertainties associated with temperature corrections that include values for the cubical coefficient of expansion for the prover under test, the accuracy and gradients associated with temperature measurements in the provers. Additional factors that might be included are: data showing reproducibility, environmental variations over time, and bias or drift of the standard as noted in control charts. Factors that are usually insignificant are uncertainties associated with viscosity of the water as a calibration medium and uncertainties associated with the compressibility of water.
To properly evaluate uncertainties and user requirements (tolerances), assessment of additional user uncertainties may be required by laboratory staff. Through proper use of documented laboratory and field procedures, additional uncertainty factors may be minimized to a level that does not contribute significantly to the previously described factors. Additional standard uncertainties in the calibration of field standards and their use in meter verification may include: how the prover level is established, how delivery and drain times are determined, the use of a proper “wet-down” prior to calibration or use, whether gravity drain is used during calibration or whether the volume of water is eliminated by pumping, the cleanliness of the prover and calibration medium, prover retention characteristics related to inside surface, contamination or corrosion, and total drain times, and possible air entrapment in the water. Systematic errors may be observed between laboratory calibration practices where a gravity drain is used and field use where the pumping system is used.
Example components to be considered for an uncertainty budget table are shown in the following table. Multiple values of some items may need to be considered (e.g., multiple drops from the standard, multiple meniscus readings, and multiple temperature readings).
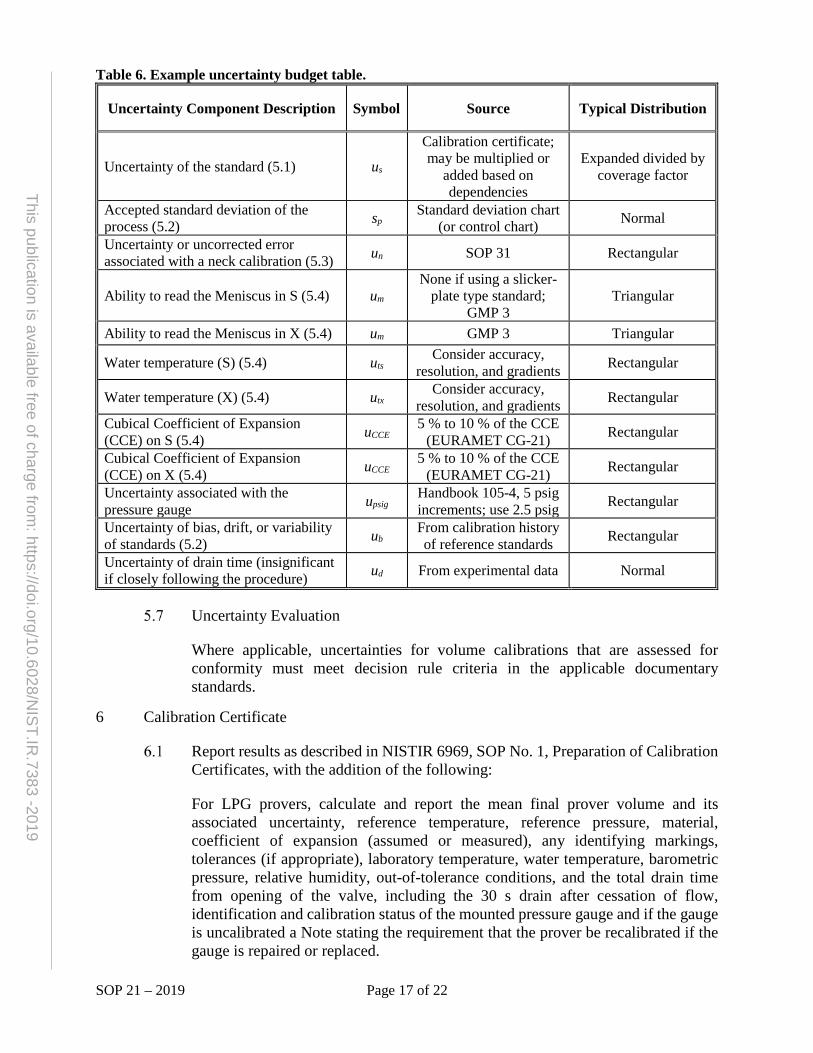
SOP 21 – 2019 Page 17 of 22
This publication is available free of charge from: https://doi.org/10.6028/N
IST.IR
.7383 -2019
Table 6. Example uncertainty budget table.
Uncertainty Component Description Symbol Source Typical Distribution
Uncertainty of the standard (5.1) us
Calibration certificate; may be multiplied or
added based on dependencies
Expanded divided by coverage factor
Accepted standard deviation of the process (5.2) sp Standard deviation chart
(or control chart) Normal
Uncertainty or uncorrected error associated with a neck calibration (5.3) un SOP 31 Rectangular
Ability to read the Meniscus in S (5.4) um None if using a slicker-
plate type standard; GMP 3
Triangular
Ability to read the Meniscus in X (5.4) um GMP 3 Triangular
Water temperature (S) (5.4) uts Consider accuracy,
resolution, and gradients Rectangular
Water temperature (X) (5.4) utx Consider accuracy,
resolution, and gradients Rectangular
Cubical Coefficient of Expansion (CCE) on S (5.4) uCCE 5 % to 10 % of the CCE
(EURAMET CG-21) Rectangular
Cubical Coefficient of Expansion (CCE) on X (5.4) uCCE 5 % to 10 % of the CCE
(EURAMET CG-21) Rectangular
Uncertainty associated with the pressure gauge upsig
Handbook 105-4, 5 psig increments; use 2.5 psig Rectangular
Uncertainty of bias, drift, or variability of standards (5.2) ub
From calibration history of reference standards Rectangular
Uncertainty of drain time (insignificant if closely following the procedure) ud From experimental data Normal
Uncertainty Evaluation
Where applicable, uncertainties for volume calibrations that are assessed for conformity must meet decision rule criteria in the applicable documentary standards.
6 Calibration Certificate
Report results as described in NISTIR 6969, SOP No. 1, Preparation of Calibration Certificates, with the addition of the following:
For LPG provers, calculate and report the mean final prover volume and its associated uncertainty, reference temperature, reference pressure, material, coefficient of expansion (assumed or measured), any identifying markings, tolerances (if appropriate), laboratory temperature, water temperature, barometric pressure, relative humidity, out-of-tolerance conditions, and the total drain time from opening of the valve, including the 30 s drain after cessation of flow, identification and calibration status of the mounted pressure gauge and if the gauge is uncalibrated a Note stating the requirement that the prover be recalibrated if the gauge is repaired or replaced.
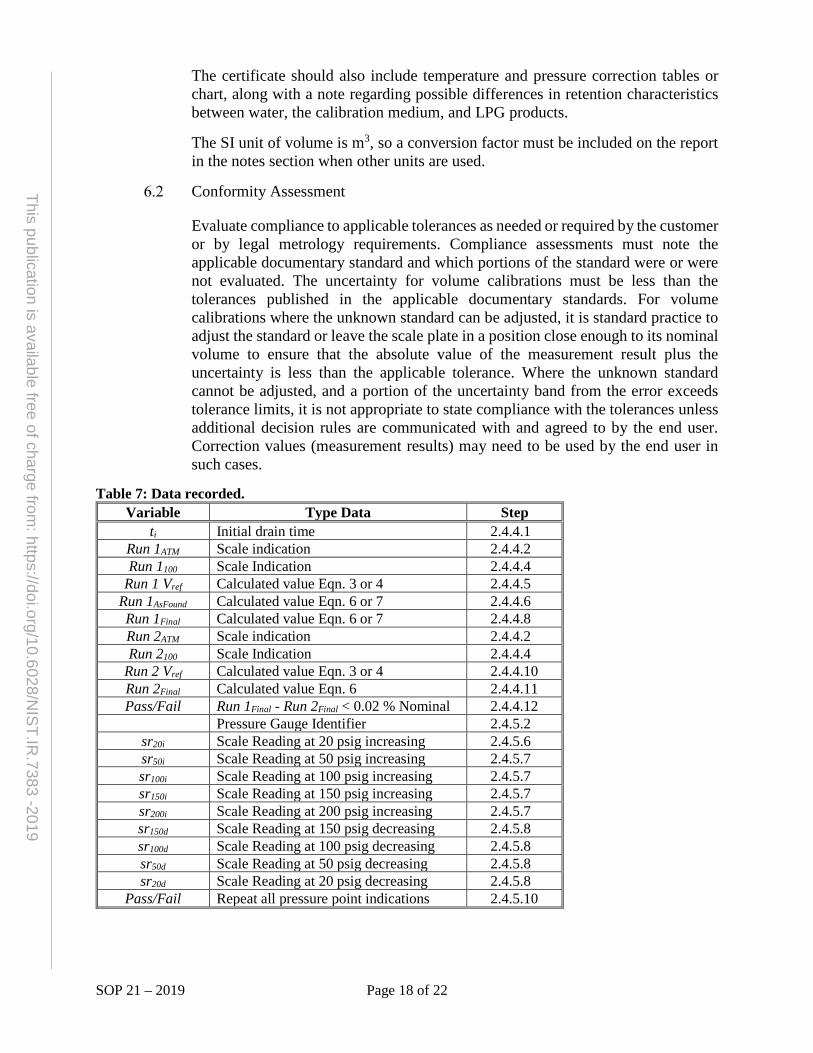
SOP 21 – 2019 Page 18 of 22
This publication is available free of charge from: https://doi.org/10.6028/N
IST.IR
.7383 -2019
The certificate should also include temperature and pressure correction tables or chart, along with a note regarding possible differences in retention characteristics between water, the calibration medium, and LPG products.
The SI unit of volume is m3, so a conversion factor must be included on the report in the notes section when other units are used.
Conformity Assessment
Evaluate compliance to applicable tolerances as needed or required by the customer or by legal metrology requirements. Compliance assessments must note the applicable documentary standard and which portions of the standard were or were not evaluated. The uncertainty for volume calibrations must be less than the tolerances published in the applicable documentary standards. For volume calibrations where the unknown standard can be adjusted, it is standard practice to adjust the standard or leave the scale plate in a position close enough to its nominal volume to ensure that the absolute value of the measurement result plus the uncertainty is less than the applicable tolerance. Where the unknown standard cannot be adjusted, and a portion of the uncertainty band from the error exceeds tolerance limits, it is not appropriate to state compliance with the tolerances unless additional decision rules are communicated with and agreed to by the end user. Correction values (measurement results) may need to be used by the end user in such cases.
Table 7: Data recorded. Variable Type Data Step
ti Initial drain time 2.4.4.1 Run 1ATM Scale indication 2.4.4.2 Run 1100 Scale Indication 2.4.4.4
Run 1 Vref Calculated value Eqn. 3 or 4 2.4.4.5 Run 1AsFound Calculated value Eqn. 6 or 7 2.4.4.6 Run 1Final Calculated value Eqn. 6 or 7 2.4.4.8 Run 2ATM Scale indication 2.4.4.2 Run 2100 Scale Indication 2.4.4.4
Run 2 Vref Calculated value Eqn. 3 or 4 2.4.4.10 Run 2Final Calculated value Eqn. 6 2.4.4.11 Pass/Fail Run 1Final - Run 2Final < 0.02 % Nominal 2.4.4.12
Pressure Gauge Identifier 2.4.5.2 sr20i Scale Reading at 20 psig increasing 2.4.5.6 sr50i Scale Reading at 50 psig increasing 2.4.5.7 sr100i Scale Reading at 100 psig increasing 2.4.5.7 sr150i Scale Reading at 150 psig increasing 2.4.5.7 sr200i Scale Reading at 200 psig increasing 2.4.5.7 sr150d Scale Reading at 150 psig decreasing 2.4.5.8 sr100d Scale Reading at 100 psig decreasing 2.4.5.8 sr50d Scale Reading at 50 psig decreasing 2.4.5.8 sr20d Scale Reading at 20 psig decreasing 2.4.5.8
Pass/Fail Repeat all pressure point indications 2.4.5.10
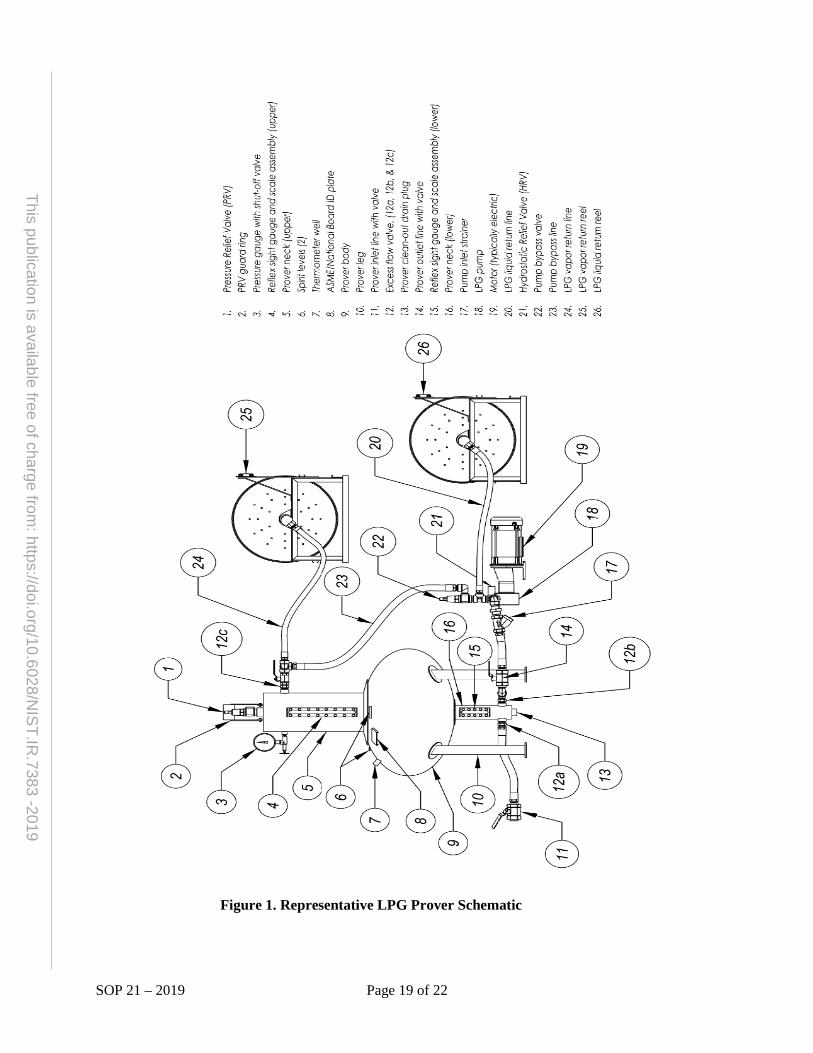
SOP 21 – 2019 Page 19 of 22
This publication is available free of charge from: https://doi.org/10.6028/N
IST.IR
.7383 -2019
Figure 1. Representative LPG Prover Schematic
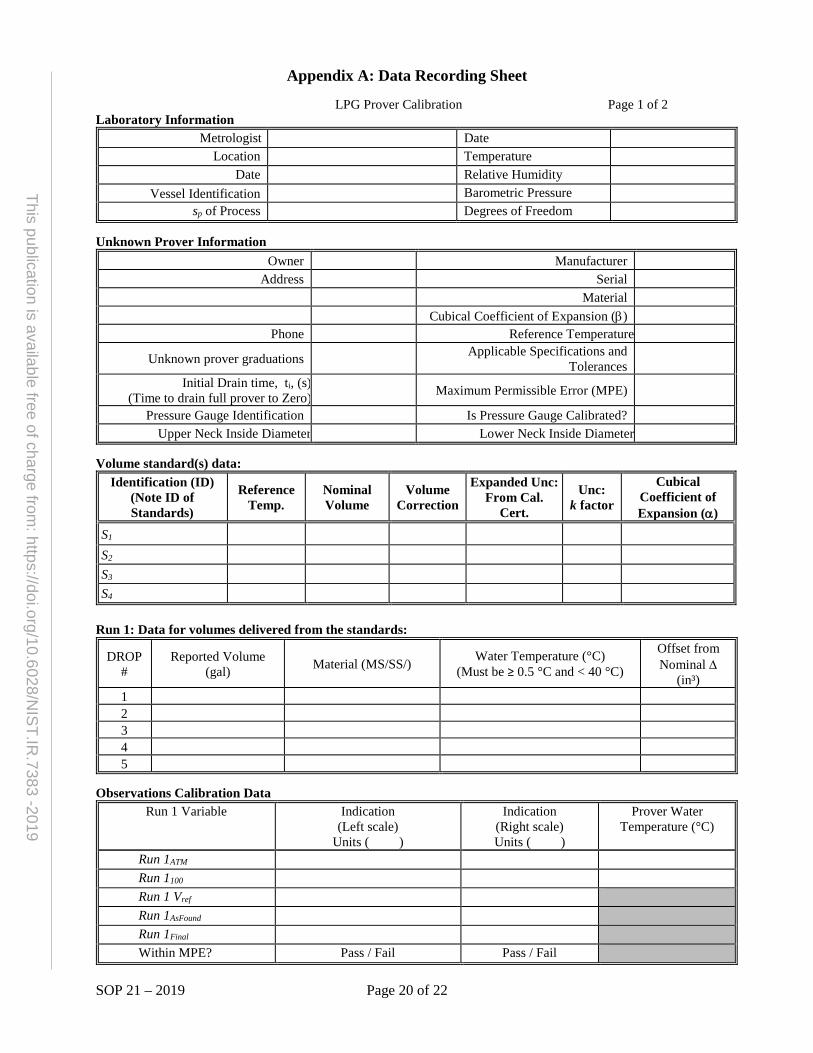
SOP 21 – 2019 Page 20 of 22
This publication is available free of charge from: https://doi.org/10.6028/N
IST.IR
.7383 -2019
Appendix A: Data Recording Sheet
LPG Prover Calibration Page 1 of 2 Laboratory Information
Metrologist Date Location Temperature
Date Relative Humidity Vessel Identification Barometric Pressure
sp of Process Degrees of Freedom
Unknown Prover Information Owner Manufacturer
Address Serial Material Cubical Coefficient of Expansion (β)
Phone Reference Temperature
Unknown prover graduations Applicable Specifications and Tolerances
Initial Drain time, ti, (s) (Time to drain full prover to Zero) Maximum Permissible Error (MPE)
Pressure Gauge Identification Is Pressure Gauge Calibrated? Upper Neck Inside Diameter Lower Neck Inside Diameter
Volume standard(s) data:
Identification (ID) (Note ID of Standards)
Reference Temp.
Nominal Volume
Volume Correction
Expanded Unc: From Cal.
Cert.
Unc: k factor
Cubical Coefficient of Expansion (α)
S1 S2 S3 S4
Run 1: Data for volumes delivered from the standards:
DROP #
Reported Volume (gal) Material (MS/SS/) Water Temperature (°C)
(Must be ≥ 0.5 °C and < 40 °C)
Offset from Nominal ∆
(in³) 1 2 3 4 5
Observations Calibration Data
Run 1 Variable Indication (Left scale)
Units ( )
Indication (Right scale) Units ( )
Prover Water Temperature (°C)
Run 1ATM Run 1100 Run 1 Vref Run 1AsFound Run 1Final Within MPE? Pass / Fail Pass / Fail
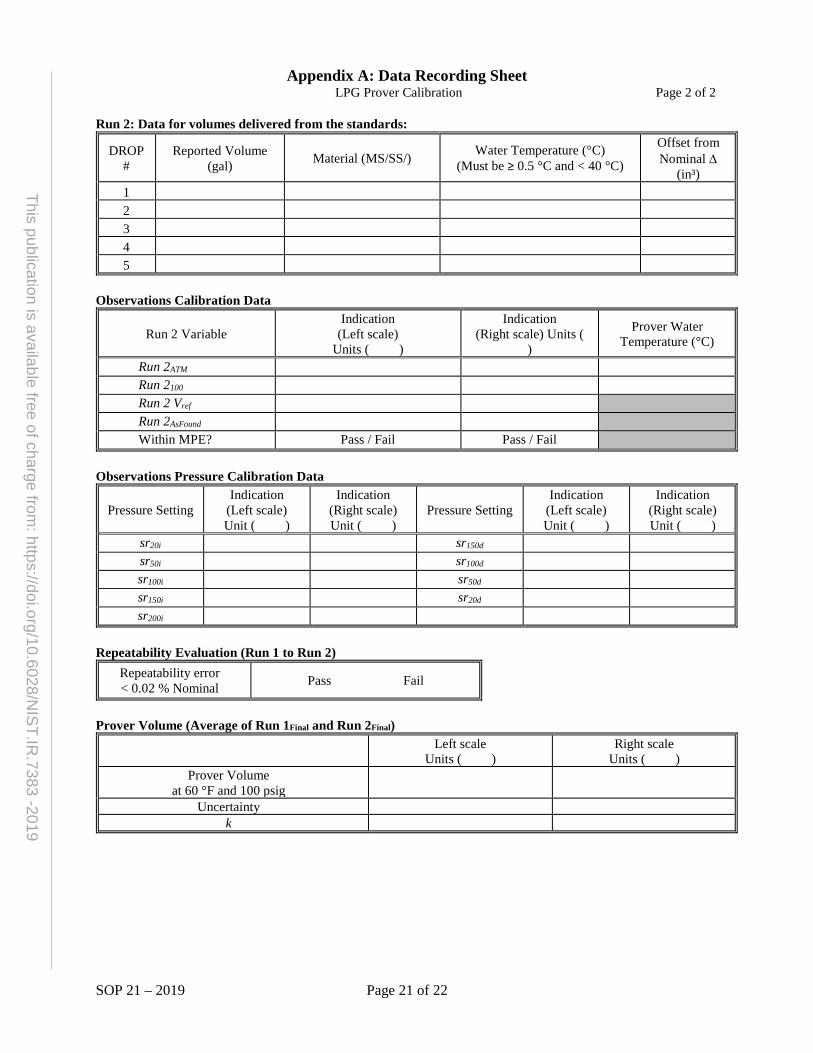
SOP 21 – 2019 Page 21 of 22
This publication is available free of charge from: https://doi.org/10.6028/N
IST.IR
.7383 -2019
Appendix A: Data Recording Sheet LPG Prover Calibration Page 2 of 2
Run 2: Data for volumes delivered from the standards:
DROP #
Reported Volume (gal) Material (MS/SS/) Water Temperature (°C)
(Must be ≥ 0.5 °C and < 40 °C)
Offset from Nominal ∆
(in³) 1 2 3 4 5
Observations Calibration Data
Run 2 Variable Indication
(Left scale) Units ( )
Indication (Right scale) Units (
)
Prover Water Temperature (°C)
Run 2ATM Run 2100 Run 2 Vref Run 2AsFound Within MPE? Pass / Fail Pass / Fail
Observations Pressure Calibration Data
Pressure Setting Indication
(Left scale) Unit ( )
Indication (Right scale) Unit ( )
Pressure Setting Indication
(Left scale) Unit ( )
Indication (Right scale) Unit ( )
sr20i sr150d sr50i sr100d sr100i sr50d sr150i sr20d sr200i
Repeatability Evaluation (Run 1 to Run 2)
Repeatability error < 0.02 % Nominal Pass Fail
Prover Volume (Average of Run 1Final and Run 2Final)
Left scale Units ( )
Right scale Units ( )
Prover Volume at 60 °F and 100 psig
Uncertainty k
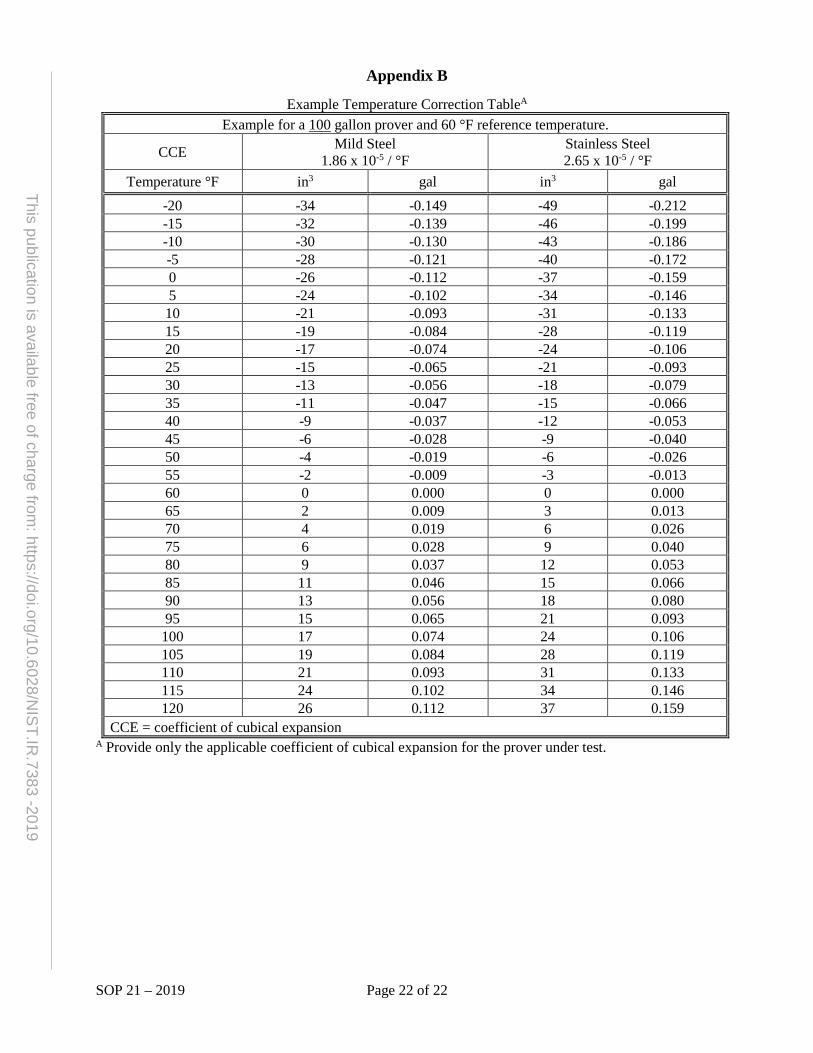
SOP 21 – 2019 Page 22 of 22
This publication is available free of charge from: https://doi.org/10.6028/N
IST.IR
.7383 -2019
Appendix B
Example Temperature Correction TableA Example for a 100 gallon prover and 60 °F reference temperature.
CCE Mild Steel 1.86 x 10⁻⁵ / °F
Stainless Steel 2.65 x 10⁻⁵ / °F
Temperature °F in3 gal in3 gal -20 -34 -0.149 -49 -0.212 -15 -32 -0.139 -46 -0.199 -10 -30 -0.130 -43 -0.186 -5 -28 -0.121 -40 -0.172 0 -26 -0.112 -37 -0.159 5 -24 -0.102 -34 -0.146
10 -21 -0.093 -31 -0.133 15 -19 -0.084 -28 -0.119 20 -17 -0.074 -24 -0.106 25 -15 -0.065 -21 -0.093 30 -13 -0.056 -18 -0.079 35 -11 -0.047 -15 -0.066 40 -9 -0.037 -12 -0.053 45 -6 -0.028 -9 -0.040 50 -4 -0.019 -6 -0.026 55 -2 -0.009 -3 -0.013 60 0 0.000 0 0.000 65 2 0.009 3 0.013 70 4 0.019 6 0.026 75 6 0.028 9 0.040 80 9 0.037 12 0.053 85 11 0.046 15 0.066 90 13 0.056 18 0.080 95 15 0.065 21 0.093 100 17 0.074 24 0.106 105 19 0.084 28 0.119 110 21 0.093 31 0.133 115 24 0.102 34 0.146 120 26 0.112 37 0.159
CCE = coefficient of cubical expansion A Provide only the applicable coefficient of cubical expansion for the prover under test.
SOP 26 – 2019 Page 1 of 19
This publication is available free of charge from: https://doi.org/10.6028/N
IST.IR.7383 -2019
SOP 26
Standard Operating Procedure For
Gravimetric Calibration of Dynamic Volumetric Systems used as Standards1 1 Introduction
Purpose of Test
This procedure describes the gravimetric calibration of volumetric systems that may be used as volumetric measuring standards. (Gravimetric calibration of fixed volume graduated-neck or slicker-plate type standards should be completed using SOP 14). This procedure uses gravimetric calibration principles with mass values and pure water sources to obtain calibration uncertainties that are generally less than those obtained during volume transfer procedures of similar standards. Alternative test liquids are not considered in this procedure. Accordingly, the procedure is especially useful for high accuracy calibrations. The procedure uses replicate testing to incorporate measurement assurance steps to ensure the validity of the measurement process; additional analyses must be performed to assess for bias (e.g., gravimetric calibration of other similar sized standards using the same methods, or interlaboratory comparisons with similar standards or provers). The procedure makes use of an electronic balance and is suitable for all sizes of gravimetric calibrations as limited by the capacity and resolution of the balance, available water source, mass standards, and handling capacity of the laboratory. Detailed measurement ranges, standards, equipment, and uncertainties for this SOP are generally compiled in a separate document in the laboratory.
This procedure can be used for single direction and bi-directional calibration of small volume provers, for calibration of volumes delivered through a master meter, for fixed volume delivery from alternative volumetric measuring systems, or other alternative test methods and standards where the gravimetric calibration provides a useful calibration result and measurement uncertainty. All steps in the procedure and calculations must be thoroughly reviewed and evaluated for appropriateness for the specific standards under test to ensure accurate measurement results are reported to the user.
Conformity Assessment
Standards that are calibrated for use in legal weights and measures applications should be evaluated for conformance to the appropriate specifications and tolerances that apply. Where compliance is required by law, conformity evaluations should be conducted prior to performing calibrations. See Section 6.2 for reporting results.
1 Non-SI units are predominately in common use in State legal metrology laboratories, and/or the petroleum industry for many volumetric measurements, therefore non-SI units are used to reflect the practical needs of the laboratories performing these measurements when appropriate.
SOP 26 – 2019 Page 2 of 19
This publication is available free of charge from: https://doi.org/10.6028/N
IST.IR.7383 -2019
Prerequisites
Verify that valid calibration certificates with appropriate values and uncertainties are available for all standards, instruments and sensors used in this procedure. Calibration values must have demonstrated metrological traceability to the International System of Units (SI), which may be to the SI, through a National Metrology Institute such as NIST.
Verify that all standards and instruments (e.g., mass standards, thermometer, barometer, and hygrometer) have sufficiently small standard uncertainties for the level of calibration. Reference standards that need special care and protection should not be used for gravimetric calibration where there is risk for contamination or damage from water.
Verify that the balance has sufficient capacity and is in good operating condition with sufficiently small process standard deviation. Process standard deviations need to be verified by a valid control chart or preliminary experiments to ascertain performance quality. The accuracy of the balance and weighing procedures should also be evaluated to minimize potential bias in the measurement process.
Verify that the operator is experienced and has demonstrated proficiency in precision weighing techniques and volumetric measurements and has had specific training in NISTIR 6969 SOP 2, SOP 4, and NISTIR 7383 SOP 19, SOP 29, GMP 10, and especially in gravimetric calibrations such as those used in SOP 14.
Verify that an adequate quality and supply of distilled or de-ionized water (see GLP 10) is available. Do not use tap or other impure water sources for this procedure! The laboratory must have a continuous flow of water available and may thermally equilibrate water in a large volumetric prover or a water tank provided purity is ensured. Note: Calibration of some systems may require other liquids due to viscosity or lubricity requirements and alternative procedures should be considered. Use of calibration liquids other than water is not considered in this SOP.
Verify that the laboratory facility is free of air currents and/or temperature fluctuations where the mass measurements will be performed. The volumetric proving system must also be calibrated in a thermally stable environment. Where the volume and weighing areas are not the same, movement of standards and transfer vessels must not negatively affect environmental stability. Stable temperatures, and thermal equilibration of water, are especially important to minimize possible convection currents on precision balances. Humidity control is essential for minimizing possible evaporation and/or condensation during the measurement process.
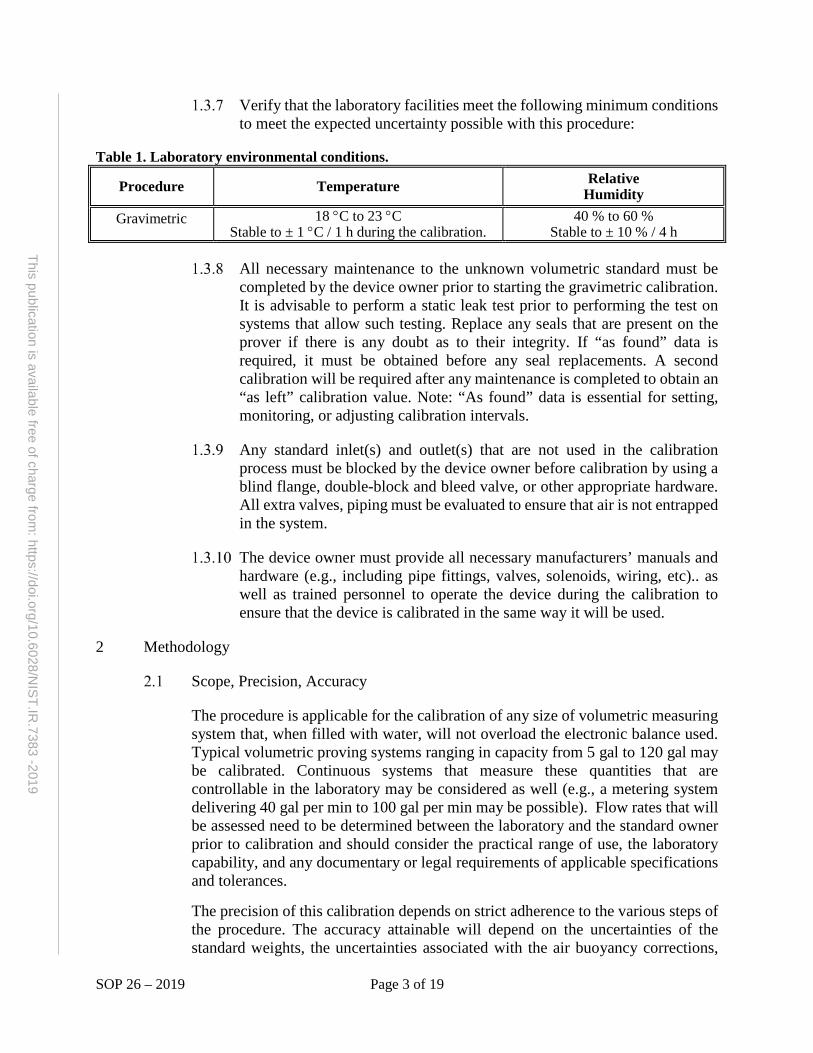
SOP 26 – 2019 Page 3 of 19
This publication is available free of charge from: https://doi.org/10.6028/N
IST.IR.7383 -2019
Verify that the laboratory facilities meet the following minimum conditions to meet the expected uncertainty possible with this procedure:
Table 1. Laboratory environmental conditions.
Procedure Temperature Relative Humidity
Gravimetric 18 °C to 23 °C Stable to ± 1 °C / 1 h during the calibration.
40 % to 60 % Stable to ± 10 % / 4 h
All necessary maintenance to the unknown volumetric standard must be
completed by the device owner prior to starting the gravimetric calibration. It is advisable to perform a static leak test prior to performing the test on systems that allow such testing. Replace any seals that are present on the prover if there is any doubt as to their integrity. If “as found” data is required, it must be obtained before any seal replacements. A second calibration will be required after any maintenance is completed to obtain an “as left” calibration value. Note: “As found” data is essential for setting, monitoring, or adjusting calibration intervals.
Any standard inlet(s) and outlet(s) that are not used in the calibration process must be blocked by the device owner before calibration by using a blind flange, double-block and bleed valve, or other appropriate hardware. All extra valves, piping must be evaluated to ensure that air is not entrapped in the system.
The device owner must provide all necessary manufacturers’ manuals and hardware (e.g., including pipe fittings, valves, solenoids, wiring, etc).. as well as trained personnel to operate the device during the calibration to ensure that the device is calibrated in the same way it will be used.
2 Methodology
Scope, Precision, Accuracy
The procedure is applicable for the calibration of any size of volumetric measuring system that, when filled with water, will not overload the electronic balance used. Typical volumetric proving systems ranging in capacity from 5 gal to 120 gal may be calibrated. Continuous systems that measure these quantities that are controllable in the laboratory may be considered as well (e.g., a metering system delivering 40 gal per min to 100 gal per min may be possible). Flow rates that will be assessed need to be determined between the laboratory and the standard owner prior to calibration and should consider the practical range of use, the laboratory capability, and any documentary or legal requirements of applicable specifications and tolerances.
The precision of this calibration depends on strict adherence to the various steps of the procedure. The accuracy attainable will depend on the uncertainties of the standard weights, the uncertainties associated with the air buoyancy corrections,
SOP 26 – 2019 Page 4 of 19
This publication is available free of charge from: https://doi.org/10.6028/N
IST.IR.7383 -2019
the accuracy of temperature measurements, the purity and density of the water, and the thermal expansion corrections that are made. Another important factor to consider is the repeatability of the procedure and the repeatability of the standard under test.
Summary
The mass of the water delivered by the volumetric proving system is determined by weighing the water on an electronic balance and comparing it to mass standards. Volume is derived from the mass of the mass standards, the density of pure water, appropriate air buoyancy corrections, and thermal and pressure expansion corrections, using the equations provided in Section 3.
Standards, Equipment, and Calibration Notes
An electronic balance having sufficient capacity to weigh the loaded vessel is required. The repeatability of the balance, measurement process, and standard under test are limiting factors in the accuracy of the measurement. The resolution of the balance and repeatability of the measurement process must be smaller than the expected uncertainty of the calibration. Note: Standard deviations obtained from precision mass calibrations do not reflect the process repeatability of this procedure; therefore, repeatability must be assessed using this procedure.
Mass standards of sufficient quantity and capacity are required. Ordinarily, standards of ASTM Class 2 or 3 or OIML Class F1 or F2 weight specifications are required. Working standards of other classes are generally not designed to maintain adequate stability needed; however, corrections obtained within a few days of the volume calibration may be used if the uncertainty is sufficiently small. Mass standards are selected so that they are slightly larger than the volume of water and container or transfer vessel to be weighed. Linearity errors or additional uncertainties may need to be considered when the mass standards are slightly less than the volume or container being measured. When summations of masses are used, the summation mass is used, and the “effective density” must be calculated, taking care not to use “average” density values.
Filter paper and padding for protection of mass standards when placed on the balance pan, stacked, or placed on the calibration item may be used. When all such materials are used, care must be taken to determine when and how the mass of these items are incorporated into the process (as tare weight, or as tared/zeroed off the balance readings).
A transfer vessel is required that is made of some inert and stable material with a volumetric capacity larger than the volume to be measured and a port large enough to fill the vessel on the top surface. The transfer vessel should be as small as possible to minimize its influence on the balance, but approximately 25 % larger than the volume to be measured to prevent water
SOP 26 – 2019 Page 5 of 19
This publication is available free of charge from: https://doi.org/10.6028/N
IST.IR.7383 -2019
loss due to splashing out of the top fill port. The transfer vessel may need to be suspended with a hoist or mounted to a pallet to be moved with a forklift or pallet jack.
Weight handling equipment is required for this procedure that has adequate capacity for handling the filled and empty transfer vessel. It must have the ability to be moved slowly and gently to minimize water sloshing and to gently set the empty or filled vessel on the balance pan.
Thermometers, with resolution and uncertainty less than 0.1 °C to determine water and volumetric proving system temperatures. Submersible thermometer probes and cables must be long enough to measure the temperature of the water near the center of the transfer vessel. Therefore, liquid-in-glass thermometers are not adequate.
Barometer with resolution and uncertainty less than 135 Pa (1 mmHg to determine barometric pressure (absolute).
Hygrometer with resolution and uncertainty less than 10 % to determine relative humidity.
Pressure gauge(s) with resolution and uncertainty less than 1 psig for determining the volumetric proving system pressure (where applicable).
If a proving system does not have operational temperature sensors and pressure gauges installed, the initial inspection should reveal that the proving system is not adequately prepared for calibration. If the calibration relies on the accuracy of the temperature sensors and pressure gauges installed on the prover, they must be installed prior to the volume calibration and have current calibration reports from an accredited calibration laboratory that are readily available for inspection. When laboratory pressure and temperature sensors are used during the calibration all laboratory sensors must all have current calibration reports.
Mechanical problems and sources of errors that may be encountered during a calibration and affect the ability of the system to repeat may include many possibilities, several of which are listed below. Mechanical problems with the volumetric standard must be corrected before calibration. Quantification of errors that cannot be eliminated must be evaluated and included in the uncertainty budget table.
- Proper operation of the system; - Air in the system; - Instability of the temperature of water or ambient conditions; - Pressure fluctuations in the system; - Error in reading the test measure(s); - Incorrect drain time for reading test measure(s); - Contamination of the systems;
SOP 26 – 2019 Page 6 of 19
This publication is available free of charge from: https://doi.org/10.6028/N
IST.IR.7383 -2019
- Damaged measures/system; - Error in reading temperature or pressure; - Displacer problems (when present); - Malfunction of switches (when present); - Damage, worn, or badly fitted seals; - Damage, scoring, or pitting on the inside of the proving system; - Damaged or misaligned detector switches (when present); - Light interference in optical switches (when present); - Malfunction of solenoid valve (when present); - Leaks in prover/system or bypass valves.
Errors that may be encountered in weighing steps of the calibration may include any of the items listed below. Quantification of errors that cannot be eliminated must be evaluated and included in the uncertainty budget table.
- Balance drift; - Off center loading of the balance; - Non-linearity of the balance and improper selection of the mass
standards to calibrate the weighing instrument in the range of use; - Air currents or convection currents when weighing is performed in a
large mass laboratory or when the temperature of the water, system, or laboratory are not adequately equilibrated;
- Care in placing items on the weighing instrument; - Inadequate water quality.
Procedure
Inspect the volumetric proving system to verify that it and associated piping are drained, clean, and safe for placement in the laboratory. For large volumetric proving systems, ensure that there is adequate space in the laboratory to safely position the system near the pure water source and that a drain is accessible and that the proximity of the mass calibration area is convenient. Direct the driver to position to system appropriately, taking appropriate precautions to prevent injury to anyone or damage to the laboratory and/or equipment and standards. Allow adequate time for the system under test to equilibrate with the laboratory environment. The time required will be dependent on the difference between inside and outside temperature and relative humidity.
Initial inspection. Record the data about the system being calibrated, taking care to record all applicable serial numbers, coefficients of cubical expansion, reference temperatures, flow rates, presence or lack of the calibration status of all auxiliary standards associated with the standard (such as pressure gauges and temperature sensors), and means for sealing the system after calibration.
SOP 26 – 2019 Page 7 of 19
This publication is available free of charge from: https://doi.org/10.6028/N
IST.IR.7383 -2019
Install, or have the owner install, volumetric proving system hardware per manufacturer’s instructions or have the owner provide this service. (Hardware must be provided by device owner).
Connect the water supply to the volumetric proving system.
2.4.4.1 In general, ensure that all air is bled from the system, suitable water supply is provided, and the device temperature is in equilibrium with that of the water supply. Several runs are generally required prior to the calibration to ensure that all air is out of the system and that all components are in thermal equilibrium with the water. Set device valves as appropriate for the test to be conducted.
2.4.4.2 Follow the operator’s guidance (and per manufacturer’s instructions) to become familiar with and to establish correct valve positions for each step of the calibration when applicable.
Install and/or use calibrated thermometers with evidence of current metrological traceability to record air temperature, water temperature, detector bar temperature (Td) (where present), volumetric proving system temperatures (Tp).
Install and/or use calibrated pressure gauge(s) to record prover pressure(s) (Pp) when present and appropriate.
Analyze the piping and valves to determine if the configuration needs to be changed to deliver water into the transfer vessel.
Record all the prover-specific variables on the data entry form.
Note: All references in the following weighing options to the empty transfer vessel assume that the empty transfer vessel has been placed in a “wetted-down” condition. This wet down condition is achieved when the vessel has been filled with water and then drained using the same process that will be used throughout this calibration. Several runs may be needed on the volumetric proving system to ensure proper wetting of all lines and drains before the measurement data is recorded.
Weighings (Option A)
2.4.9.1 Zero the balance. Place a standard mass, Ms1, on the balance platform. Ms1 should be slightly larger than the mass of the empty transfer vessel. Record the balance indication as O1.
2.4.9.2 Zero the balance and then place the empty transfer vessel on balance platform and record the balance indication as O2. Caution: the transfer vessel must be dry on the outside for all weighings.
SOP 26 – 2019 Page 8 of 19
This publication is available free of charge from: https://doi.org/10.6028/N
IST.IR.7383 -2019
2.4.9.3 Record air temperature, barometric pressure and relative humidity at the time of these measurements. Due to timing of this type of calibration, environmental conditions must be recorded for both the empty and full transfer vessel.
2.4.9.4 Zero the balance and then place a standard mass, Ms2, on the balance platform. Ms2 should be slightly larger than the mass of the filled vessel. Record the balance indication as O3. (This observation may be made before or after the weighing of the filled transfer vessel, depending on laboratory configurations and convenience).
2.4.9.5 Fill the transfer vessel through the volumetric proving system. Do not fill the transfer vessel while it is on a laboratory balance. Ensure that all the water from the volumetric standard or registered on a meter is captured in the transfer vessel. Verify that the water temperature in the system is uniform and stable throughout the filling process (± 0.2 °C). Read and record all pertinent volumetric standard temperatures and pressures during the calibration sequence. Place the lid on the transfer vessel to limit evaporation.
2.4.9.6 Zero the balance and then place the filled transfer vessel on the balance and record the balance indication as O4.
2.4.9.7 Read and record the temperature of the water in the transfer vessel immediately after weighing. It is critical to measure the temperature after weighing to ensure that water is not removed from the transfer vessel prior to obtaining the mass value.
2.4.9.8 Record the air temperature, barometric pressure and relative humidity at the time of these measurements.
2.4.9.9 Make at least five replicate runs with at least two runs at a flow rate differing from the others by at least 25 % The measured result (V60) of each of these calibration runs must agree within 0.02 % of the average volume, or the limits on the standard deviation or range charts (whichever is smaller) which may be evaluated through the use of an F-test, of all volume calibration runs (i.e., the maximum result minus the minimum result must be less than 0.02 % of the average measured volume).
2.4.9.10 Calculate the volume using Equation 1 in Section 3.1.1., (Option A).
Weighings (Option B)
2.4.10.1 Place mass standards that approximate the mass of the empty transfer vessel (with a lid) and adequate filter paper or other clean, lint-free padding material (to protect the standards being used) on
SOP 26 – 2019 Page 9 of 19
This publication is available free of charge from: https://doi.org/10.6028/N
IST.IR.7383 -2019
the electronic balance. With these items on the balance, zero the balance. Note: The padding materials must be included on all measurements or their mass treated as tare.
2.4.10.2 Place additional mass standards approximating the nominal mass of the water volume to be measured on the balance. Take care to place the weights on filter paper or other appropriate protective padding. Record this balance indication as O1.
2.4.10.3 Remove all mass standards. Record the air temperature, barometric pressure, and relative humidity readings.
2.4.10.4 Place the empty transfer vessel on the balance, with the padding material and zero the balance indication. Remove the transfer vessel, lid, and padding material and record the base empty vessel reading (B).
2.4.10.5 Fill the transfer vessel from the volumetric proving system. Read and record all pertinent volumetric standard temperatures and pressures during the calibration sequence. Place the lid on the transfer vessel to limit evaporation.
2.4.10.6 Immediately prior to weighing full vessel record balance reading as (d1). This reading will be used to calculate any balance drift that occurred while the transfer vessel was being filled.
2.4.10.7 Place the filled vessel and all padding material on the balance. If needed, add known mass standards as tare weights to bring the water mass up to the mass of the standards used for O1. This balance reading is recorded as O2. Record the mass of all tare weights.
2.4.10.8 Remove the filled transfer vessel and record the balance indication as (d2). This reading is used to calculate balance drift over the entire calibration process.
2.4.10.9 Immediately after removing the filled transfer vessel from the balance, record the temperature of water in the vessel.
2.4.10.10 Make at least five replicate runs with at least two runs at a flow rate differing from the others by at least 25 % when the system allows for varying flow rates. The range measured result (V60) of each of these calibration runs must agree within 0.02 % of the volume (i.e., the maximum result minus the minimum result must be less than 0.02 % of the volume being measured) or be less than the limits on the standard deviation or range charts (whichever is smaller).
SOP 26 – 2019 Page 10 of 19
This publication is available free of charge from: https://doi.org/10.6028/N
IST.IR.7383 -2019
2.4.10.11 Calculate the volume using Equations 2 and 3 in Section 3.1.1., (Option B).
3 Calculations
Compute the volume at the temperature of the measurement, Vt, for each determination using the equation:
Option A.
4 22 1
3 2 1 1
O O 11 1O O
a at s s
s s w a
V M Mρ ρρ ρ ρ ρ
= − − − −
Eqn. (1)
Table 2. Variables for volume equation. Variable Description
Ms, Ms1, Ms2 mass of standards Ms1, is the mass of the standards used with the empty transfer vessel Ms2, is the mass of the standards used with the transfer vessel after filling with delivered water
ρs density of MS standards
ρw density of water at the temperature of measurement
ρa density of air at the conditions of calibration – may be different for empty and filled weighing of the transfer vessel
Vt Volume at the temperature of the test for the unknown prover/system
Option B.
1
s a att 2c
s t w a
1M = 1 - - 1 - V O M - Oρ ρρ ρ ρ ρ
Eqn. (2)
( )1 22 2 2c
d dO O B
+ = + −
Eqn. (3)
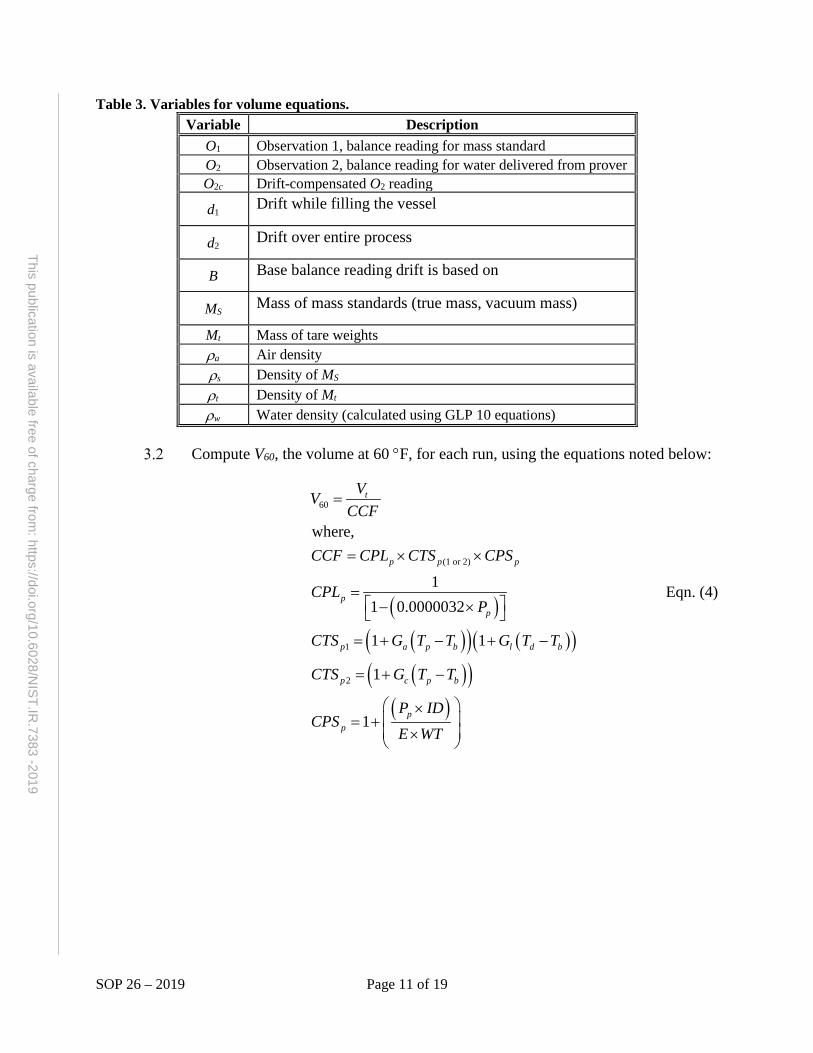
SOP 26 – 2019 Page 11 of 19
This publication is available free of charge from: https://doi.org/10.6028/N
IST.IR.7383 -2019
Table 3. Variables for volume equations. Variable Description
O1 Observation 1, balance reading for mass standard O2 Observation 2, balance reading for water delivered from prover O2c Drift-compensated O2 reading
d1 Drift while filling the vessel
d2 Drift over entire process
B Base balance reading drift is based on
MS Mass of mass standards (true mass, vacuum mass)
Mt Mass of tare weights ρa Air density ρs Density of MS ρt Density of Mt ρw Water density (calculated using GLP 10 equations)
Compute V60, the volume at 60 °F, for each run, using the equations noted below:
( )( )( ) ( )( )( )( )
( )
60
(1 or 2)
1
2
where,
11 0.0000032
1 1
1
1
t
p p p
pp
p a p b l d b
p c p b
pp
VVCCF
CCF CPL CTS CPS
CPLP
CTS G T T G T T
CTS G T T
P IDCPS
E WT
=
= × ×
= − ×
= + − + −
= + −
× = + ×
Eqn. (4)
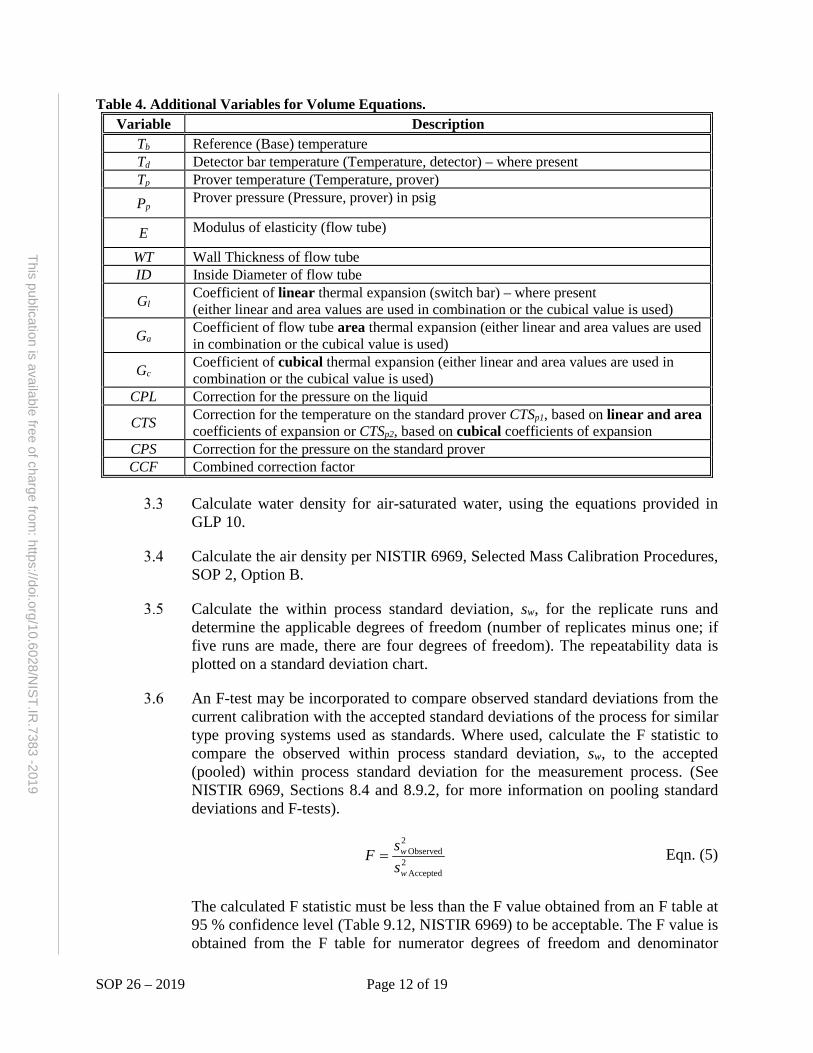
SOP 26 – 2019 Page 12 of 19
This publication is available free of charge from: https://doi.org/10.6028/N
IST.IR.7383 -2019
Table 4. Additional Variables for Volume Equations. Variable Description
Tb Reference (Base) temperature Td Detector bar temperature (Temperature, detector) – where present Tp Prover temperature (Temperature, prover) Pp Prover pressure (Pressure, prover) in psig
E Modulus of elasticity (flow tube)
WT Wall Thickness of flow tube ID Inside Diameter of flow tube
Gl Coefficient of linear thermal expansion (switch bar) – where present (either linear and area values are used in combination or the cubical value is used)
Ga Coefficient of flow tube area thermal expansion (either linear and area values are used in combination or the cubical value is used)
Gc Coefficient of cubical thermal expansion (either linear and area values are used in combination or the cubical value is used)
CPL Correction for the pressure on the liquid
CTS Correction for the temperature on the standard prover CTSp1, based on linear and area coefficients of expansion or CTSp2, based on cubical coefficients of expansion
CPS Correction for the pressure on the standard prover CCF Combined correction factor
Calculate water density for air-saturated water, using the equations provided in GLP 10.
Calculate the air density per NISTIR 6969, Selected Mass Calibration Procedures, SOP 2, Option B.
Calculate the within process standard deviation, sw, for the replicate runs and determine the applicable degrees of freedom (number of replicates minus one; if five runs are made, there are four degrees of freedom). The repeatability data is plotted on a standard deviation chart.
An F-test may be incorporated to compare observed standard deviations from the current calibration with the accepted standard deviations of the process for similar type proving systems used as standards. Where used, calculate the F statistic to compare the observed within process standard deviation, sw, to the accepted (pooled) within process standard deviation for the measurement process. (See NISTIR 6969, Sections 8.4 and 8.9.2, for more information on pooling standard deviations and F-tests).
2Accepted
2Observed
w
w
ssF = Eqn. (5)
The calculated F statistic must be less than the F value obtained from an F table at 95 % confidence level (Table 9.12, NISTIR 6969) to be acceptable. The F value is obtained from the F table for numerator degrees of freedom and denominator
SOP 26 – 2019 Page 13 of 19
This publication is available free of charge from: https://doi.org/10.6028/N
IST.IR.7383 -2019
degrees of freedom equal to the number of degrees of freedom in the pooled within process standard deviation. If the data fails the F-test and the source of the error cannot be determined conclusively and corrected, the measurement must be repeated.
Calculate and report the mean volume of the volumetric standard at its applicable reference temperature and reference pressure.
If adjustments were made during replicate runs, report the “as found” volume or the mean of “as found” volumes and the “as left” volume or mean of “as left” volumes, as applicable, at the appropriate reference temperature. (I.e., do not calculate a mean value by combining “as found” and “as left” values when adjustments are made). If the standard has bi-directional volumes, report the mean volume for each direction at its applicable reference temperature and reference pressure.
Calculate the uncertainty for the calibration using Section 5.
4 Measurement Assurance
Record and plot the values of the five runs and calculate the observed standard deviation to determine short-term repeatability of the measurement process, sw following SOP 20. The range of the five runs must repeat to within 0.02 % of the volume, or the standard deviation must be less than applicable control/action limits on standard deviation charts, or the observed standard deviation must pass the F-test statistics (as applicable).
For standards that may be and are adjusted, do not combine an “as found” value with an “as left” value for the replicate runs when entered a standard deviation chart; use the adjusted value from those runs with the as left value from remaining runs, all at the applicable reference temperature, when entering values in a standard deviation or range chart. A minimum of 12 replicate measurements are required to establish initial process limits and 25 to 30 points are required for reporting valid uncertainty values.
Perform applicable calibrations of check standards where available.
5 Assignment of Uncertainties
The limits of expanded uncertainty, U, include estimates of the standard uncertainty of the mass standards used, us, plus the uncertainty of measurement, sp, and the additional items noted below and in the uncertainty budget table, Table 4, at approximately a 95 % level of confidence. See SOP 29 for the complete standard operating procedure for calculating the uncertainty.
SOP 26 – 2019 Page 14 of 19
This publication is available free of charge from: https://doi.org/10.6028/N
IST.IR.7383 -2019
The standard uncertainty for the mass standards, us, is obtained from the calibration certificates for the standards used. The combined standard uncertainty, uc, is used and not the expanded uncertainty, U, therefore the reported uncertainty for the standard is usually divided by the coverage factor k.
The standard deviation of the measurement process is obtained from replicate measurements and standard deviation chart performance data. See SOP 17 or 20.
The value for sp is obtained from the standard deviation chart data and results for the current run must be compared to the standard deviations observed from replicate measurements over time. The standard deviation of the process determined from this approach incorporates a repeatability factor related to the precision of all weighings and need not be duplicated.
Other standard uncertainties usually included for this type of calibration level include uncertainties associated with water temperature measurements, thermometer accuracy, calculation of air density, pressure measurements and standard uncertainties associated with the density of the standards used or the lack of internal cleanliness.
An example uncertainty budget table is shown in Table 4. Additional components may need to be considered depending on the technology being calibrated.
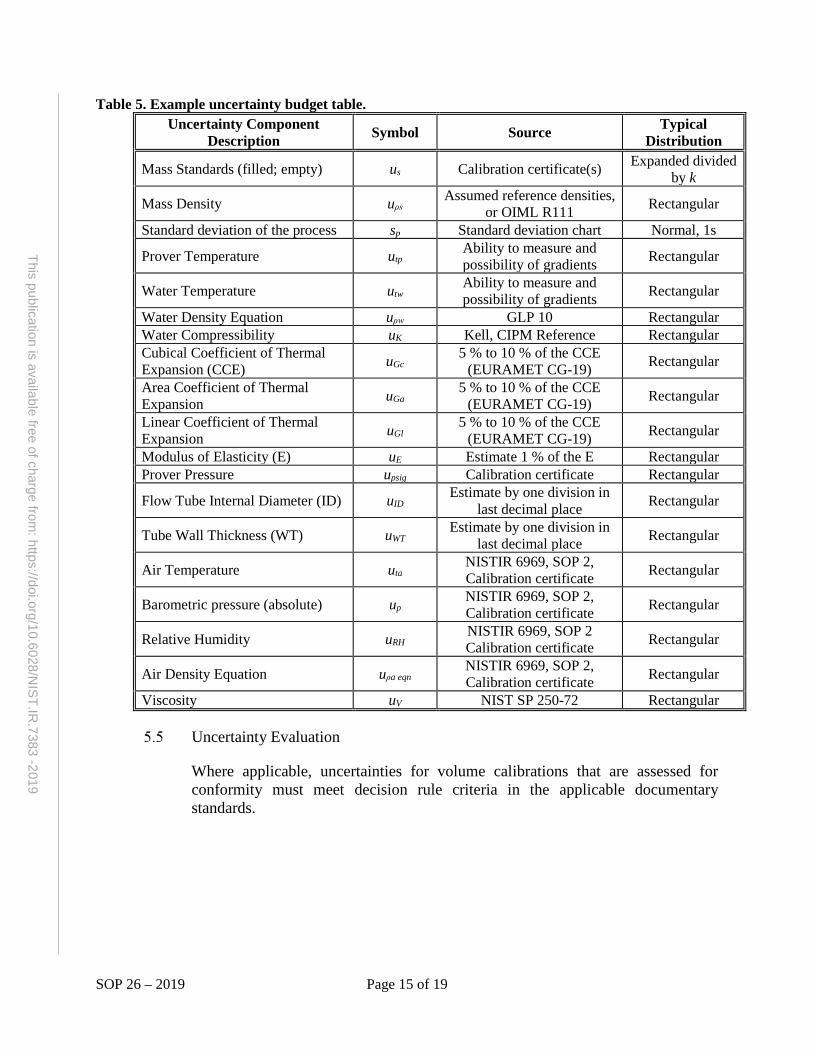
SOP 26 – 2019 Page 15 of 19
This publication is available free of charge from: https://doi.org/10.6028/N
IST.IR.7383 -2019
Table 5. Example uncertainty budget table. Uncertainty Component
Description Symbol Source Typical Distribution
Mass Standards (filled; empty) us Calibration certificate(s) Expanded divided by k
Mass Density uρs Assumed reference densities, or OIML R111 Rectangular
Standard deviation of the process sp Standard deviation chart Normal, 1s
Prover Temperature utp Ability to measure and possibility of gradients Rectangular
Water Temperature utw Ability to measure and possibility of gradients Rectangular
Water Density Equation uρw GLP 10 Rectangular Water Compressibility uK Kell, CIPM Reference Rectangular Cubical Coefficient of Thermal Expansion (CCE) uGc
5 % to 10 % of the CCE (EURAMET CG-19) Rectangular
Area Coefficient of Thermal Expansion uGa
5 % to 10 % of the CCE (EURAMET CG-19) Rectangular
Linear Coefficient of Thermal Expansion uGl
5 % to 10 % of the CCE (EURAMET CG-19) Rectangular
Modulus of Elasticity (E) uE Estimate 1 % of the E Rectangular Prover Pressure upsig Calibration certificate Rectangular
Flow Tube Internal Diameter (ID) uID Estimate by one division in last decimal place Rectangular
Tube Wall Thickness (WT) uWT Estimate by one division in last decimal place Rectangular
Air Temperature uta NISTIR 6969, SOP 2, Calibration certificate Rectangular
Barometric pressure (absolute) up NISTIR 6969, SOP 2, Calibration certificate Rectangular
Relative Humidity uRH NISTIR 6969, SOP 2 Calibration certificate Rectangular
Air Density Equation uρa eqn NISTIR 6969, SOP 2, Calibration certificate Rectangular
Viscosity uV NIST SP 250-72 Rectangular
Uncertainty Evaluation
Where applicable, uncertainties for volume calibrations that are assessed for conformity must meet decision rule criteria in the applicable documentary standards.
SOP 26 – 2019 Page 16 of 19
This publication is available free of charge from: https://doi.org/10.6028/N
IST.IR.7383 -2019
6 Calibration Certificates
Report results as described in NISTIR 6969, SOP 1, Preparation of Calibration Certificates, with the addition of the following:
Volume, reference temperature, uncertainty, material, thermal coefficient of expansion (assumed or measured), construction, any identifying markings, tolerances (if appropriate), laboratory temperature, water temperature(s) at time of test, barometric pressure, relative humidity, and any out–of-tolerance conditions. Volume may need to be reported as “up-stream” and “down-stream” volumes for bi-directional provers.
The status of items that are not calibrated by the laboratory but that may be used to perform measurements must be noted on the calibration report (e.g., temperature sensors, pressure gauges, or full flow rates that may be used in the field but that are not calibrated by the laboratory). A statement such as the following must be included on calibration reports: “Only items presented on this calibration report were tested under the conditions shown”. Any sensors or gauges that were not calibrated by the laboratory should be clearly identified on the report (e.g., “Calibration certificates for the system included temperature sensors and pressure gauges that were provided to the laboratory for evaluation prior to calibration and were found to be acceptable.”)
Conformity Assessment
Evaluate compliance to applicable tolerances as needed or required by the customer or by legal metrology requirements. Compliance assessments must note the applicable documentary standard and which portions of the standard were or were not evaluated. The uncertainty for volume calibrations must be less than the tolerances published in the applicable documentary standards. For volume calibrations where the unknown standard can be adjusted, it is standard practice to adjust the standard or leave the scale plate in a position close enough to its nominal volume to ensure that the absolute value of the measurement result plus the uncertainty is less than the applicable tolerance. Where the unknown standard cannot be adjusted, and a portion of the uncertainty band from the error exceeds tolerance limits, it is not appropriate to state compliance with the tolerances unless additional decision rules are communicated with and agreed to by the end user. Correction values (measurement results) may need to be used by the end user in such cases.
Where no specific documentary standards apply, or a laboratory does not perform an assessment, a notice should be included on the calibration certificate to the effect that a legal metrology assessment was not performed. (For example, “Conformity assessment was not completed as a part of this calibration. Accurate use in field testing requires assessment of repeatability in field applications as well as proper training of the operator, maintenance of the proving system, integrity of all seals
SOP 26 – 2019 Page 17 of 19
This publication is available free of charge from: https://doi.org/10.6028/N
IST.IR.7383 -2019
and sensors, and any other auxiliary mechanical or electronic components. The entire system has not been assessed for suitability as a field standard for weights and measures applications.”)
7 References
Chapter 4, Manual of Petroleum Measurement Standards, and the following Sections as applicable:
Section 1 – Introduction Section 2 – Conventional Pipe Provers Section 3 – Small Volume Provers Section 4 – Tank Provers Section 5 – Master-Meter Provers Section 6 – Pulse Interpolation Section 7 – Field Standard Test Measures Section 8 – Operation of Proving Systems
NIST Handbook 105-7: Specifications and Tolerances for Reference Standards and Field Standard Weights and Measures, 7. Specifications and Tolerances for Dynamic Small Volume Provers, 1996. Bean, V. E., Espina, P. I., Wright, J. D., Houser, J. F., Sheckels, S. D., and Johnson, A. N., NIST Calibration Services for Liquid Volume, NIST Special Publication 250-72, National Institute of Standards and Technology, Gaithersburg, MD, (2009). EURAMET Calibration Guide 19, Guidelines on the Determination of Uncertainty in Gravimetric Volume Calibration, (Version 2.1, 03/2012).
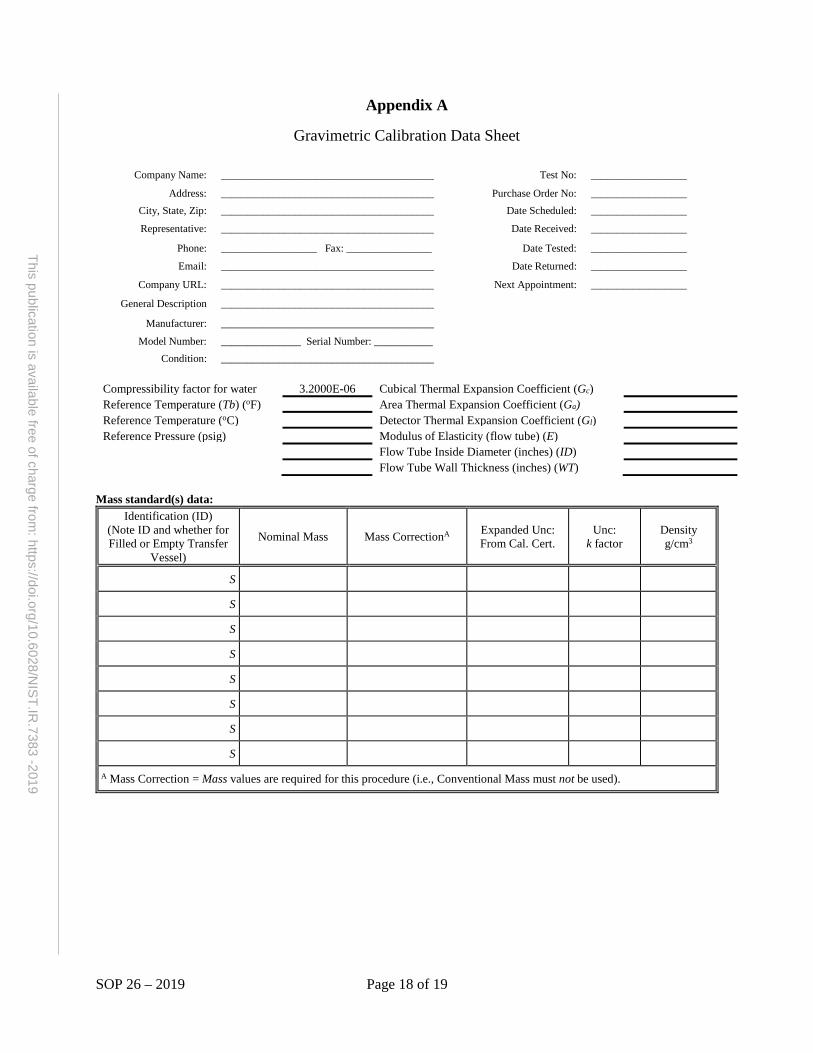
SOP 26 – 2019 Page 18 of 19
This publication is available free of charge from: https://doi.org/10.6028/N
IST.IR.7383 -2019
Appendix A
Gravimetric Calibration Data Sheet
Company Name: ________________________________________ Test No: __________________
Address: ________________________________________ Purchase Order No: __________________ City, State, Zip: ________________________________________ Date Scheduled: __________________
Representative: ________________________________________ Date Received: __________________
Phone: __________________ Fax: ________________ Date Tested: __________________
Email: ________________________________________ Date Returned: __________________
Company URL: ________________________________________ Next Appointment: __________________
General Description ________________________________________
Manufacturer: ________________________________________
Model Number: _______________ Serial Number: ___________ Condition: ________________________________________
Compressibility factor for water 3.2000E-06 Cubical Thermal Expansion Coefficient (Gc) Reference Temperature (Tb) (oF) Area Thermal Expansion Coefficient (Ga) Reference Temperature (oC) Detector Thermal Expansion Coefficient (Gl) Reference Pressure (psig) Modulus of Elasticity (flow tube) (E) Flow Tube Inside Diameter (inches) (ID) Flow Tube Wall Thickness (inches) (WT)
Mass standard(s) data: Identification (ID)
(Note ID and whether for Filled or Empty Transfer
Vessel)
Nominal Mass Mass CorrectionA Expanded Unc: From Cal. Cert.
Unc: k factor
Density g/cm3
S
S
S
S
S
S
S
S
A Mass Correction = Mass values are required for this procedure (i.e., Conventional Mass must not be used).
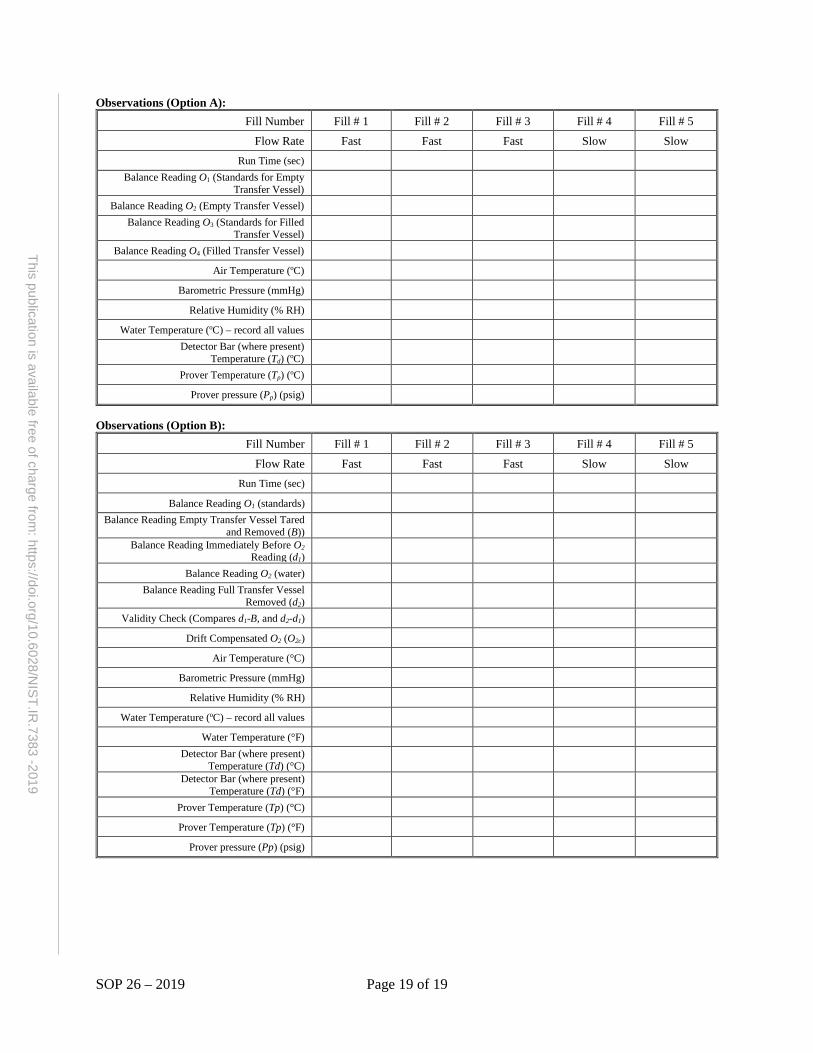
SOP 26 – 2019 Page 19 of 19
This publication is available free of charge from: https://doi.org/10.6028/N
IST.IR.7383 -2019
Observations (Option A):
Fill Number Fill # 1 Fill # 2 Fill # 3 Fill # 4 Fill # 5
Flow Rate Fast Fast Fast Slow Slow Run Time (sec)
Balance Reading O1 (Standards for Empty Transfer Vessel)
Balance Reading O2 (Empty Transfer Vessel) Balance Reading O3 (Standards for Filled
Transfer Vessel)
Balance Reading O4 (Filled Transfer Vessel)
Air Temperature (oC)
Barometric Pressure (mmHg)
Relative Humidity (% RH)
Water Temperature (oC) – record all values Detector Bar (where present)
Temperature (Td) (oC)
Prover Temperature (Tp) (oC)
Prover pressure (Pp) (psig)
Observations (Option B):
Fill Number Fill # 1 Fill # 2 Fill # 3 Fill # 4 Fill # 5
Flow Rate Fast Fast Fast Slow Slow Run Time (sec)
Balance Reading O1 (standards) Balance Reading Empty Transfer Vessel Tared
and Removed (B))
Balance Reading Immediately Before O2 Reading (d1)
Balance Reading O2 (water) Balance Reading Full Transfer Vessel
Removed (d2)
Validity Check (Compares d1-B, and d2-d1)
Drift Compensated O2 (O2c)
Air Temperature (°C)
Barometric Pressure (mmHg)
Relative Humidity (% RH)
Water Temperature (oC) – record all values
Water Temperature (°F) Detector Bar (where present)
Temperature (Td) (°C)
Detector Bar (where present) Temperature (Td) (°F)
Prover Temperature (Tp) (°C)
Prover Temperature (Tp) (°F)
Prover pressure (Pp) (psig)

This page is intentionally blank.
This publication is available free of charge from: https://doi.org/10.6028/N
IST.IR
.7383-2019
SOP 31 – 2019 Page 1 of 8
This publication is available free of charge from: https://doi.org/10.6028/N
IST.IR.7383 -2019
SOP 31
Standard Operating Procedure for Scale Plate Calibration for Volumetric Field Standards
1 Introduction
Purpose
This procedure is used for conformity assessment to verify the accuracy and linearity of scale plates used on volumetric field standards per NIST Handbook 105-3: Specifications and Tolerances for Graduated Neck Type Volumetric Field Standards (2010) and NIST Handbook 105-4: Specifications and Tolerances for Liquefied Petroleum Gas and Anhydrous Ammonia Liquid Volumetric Provers (2016). Neck scale plate calibrations are generally conducted only for new or damaged volumetric measures or those that have not been calibrated by the laboratory in the past.
Prerequisites
Verify that prerequisites listed in SOP 18, SOP 19, or SOP 21 (as applicable) are met prior to the scale plate calibration.
2 Methodology
Scope, Precision, Accuracy
This procedure is applicable for the calibration of scale plates on field standard test measures and provers. The scale plate is evaluated according to requirements published in Handbook 105-3 or Handbook 105-4 (as applicable) where the uncertainty of the calibration process is considered as a part of the compliance assessment.
Summary
The neck volume of the test measure or prover is evaluated across the range of the scale plate graduations using calibrated volumetric standards to assess accuracy and linearity of the scale plate for 4 to 6 calibration intervals. Temperature measurements and volumetric corrections are not performed during the neck calibration.
SOP 31 – 2019 Page 2 of 8
This publication is available free of charge from: https://doi.org/10.6028/N
IST.IR.7383 -2019
Required Standards and Equipment
The test measure or prover being evaluated.
A funnel to aid in transferring water from calibrated volumetric standards into the unknown prover.
Calibrated volumetric standards of suitable sizes to fill the prover body and neck to the nominal volume.
Calibrated volumetric standards of suitable sizes to verify the scale plate for
the test measure or prover. Volumetric standards used for this purpose must be calibrated to or corrected for the appropriate reference temperature. An ideal standard is approximately one-fourth of the volume of the scale plate on the test measure or prover (or reasonable sub-multiples).
Note: For example, per NIST Handbook 105-3, the minimum neck volume on the scale of a 100 gal prover is 1.5 gal (347 in3). For the sake of simplicity in an example, if the neck volume noted on the scale plate is 2.0 gal, four calibration points of 0.5 gal (115.5 in3) provides good calibration points with the nominal volume mid-range in the calibration process.
Meniscus reading devices (See GMP 3).
Procedure
Preliminary Operations
2.4.1.1 Prepare and level the test measure or prover according to the applicable calibration procedure.
2.4.1.2 Fill the unknown prover with water from the laboratory working standard that will be used to perform the calibration of the prover to nominal volume. The neck scale calibration is conducted during this prover wet-down run.
2.4.1.3 Check the prover level condition in the same way in which it will be used by placing a precision spirit or electronic digital level vertically on the neck on at least two locations, 90 degrees apart around the circumference of the neck and adjust the orientation of the unknown prover until the neck is as close to vertical (plumb or perpendicular to the horizontal plane) as possible. Adjust the prover orientation as necessary.
2.4.1.4 Check the prover system for leaks.
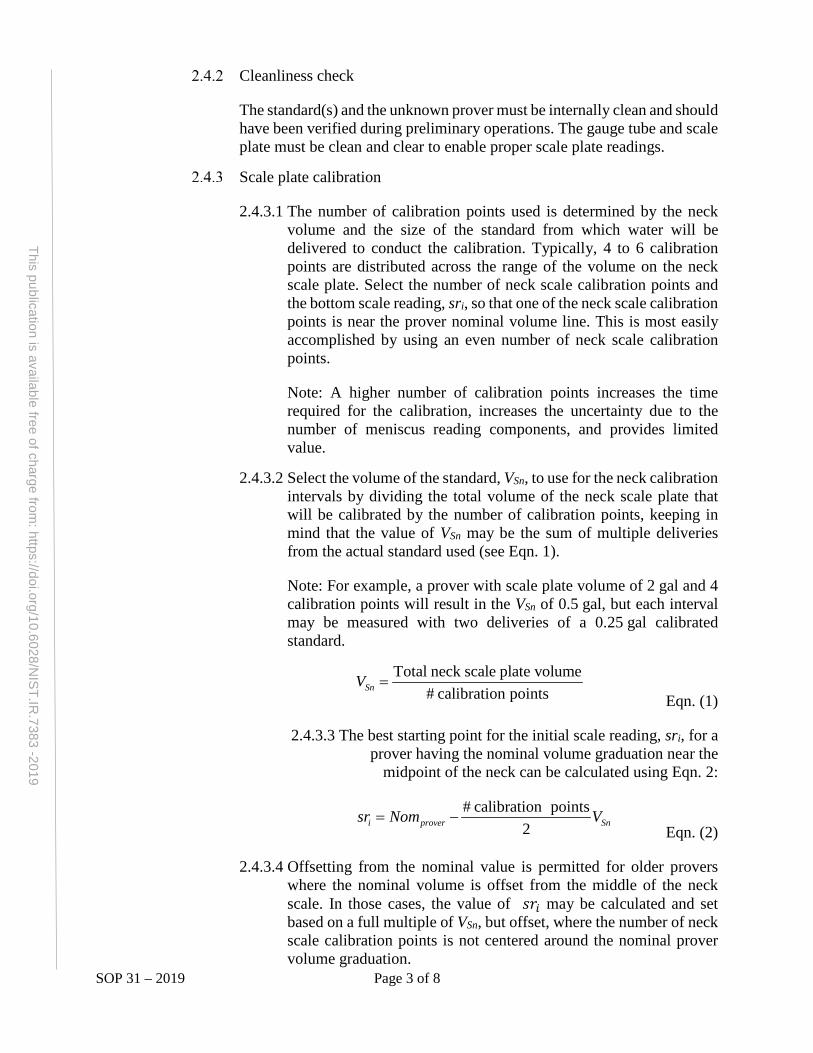
SOP 31 – 2019 Page 3 of 8
This publication is available free of charge from: https://doi.org/10.6028/N
IST.IR.7383 -2019
Cleanliness check
The standard(s) and the unknown prover must be internally clean and should have been verified during preliminary operations. The gauge tube and scale plate must be clean and clear to enable proper scale plate readings.
Scale plate calibration
2.4.3.1 The number of calibration points used is determined by the neck volume and the size of the standard from which water will be delivered to conduct the calibration. Typically, 4 to 6 calibration points are distributed across the range of the volume on the neck scale plate. Select the number of neck scale calibration points and the bottom scale reading, sri, so that one of the neck scale calibration points is near the prover nominal volume line. This is most easily accomplished by using an even number of neck scale calibration points.
Note: A higher number of calibration points increases the time required for the calibration, increases the uncertainty due to the number of meniscus reading components, and provides limited value.
2.4.3.2 Select the volume of the standard, VSn, to use for the neck calibration intervals by dividing the total volume of the neck scale plate that will be calibrated by the number of calibration points, keeping in mind that the value of VSn may be the sum of multiple deliveries from the actual standard used (see Eqn. 1).
Note: For example, a prover with scale plate volume of 2 gal and 4 calibration points will result in the VSn of 0.5 gal, but each interval may be measured with two deliveries of a 0.25 gal calibrated standard.
Total neck scale plate volumecalibration points#SnV =
Eqn. (1)
2.4.3.3 The best starting point for the initial scale reading, sri, for a prover having the nominal volume graduation near the
midpoint of the neck can be calculated using Eqn. 2:
o# calibration p ints
2i prover Snsr Nom V= − Eqn. (2)
2.4.3.4 Offsetting from the nominal value is permitted for older provers where the nominal volume is offset from the middle of the neck scale. In those cases, the value of 𝑠𝑠𝑠𝑠𝑖𝑖 may be calculated and set based on a full multiple of VSn, but offset, where the number of neck scale calibration points is not centered around the nominal prover volume graduation.
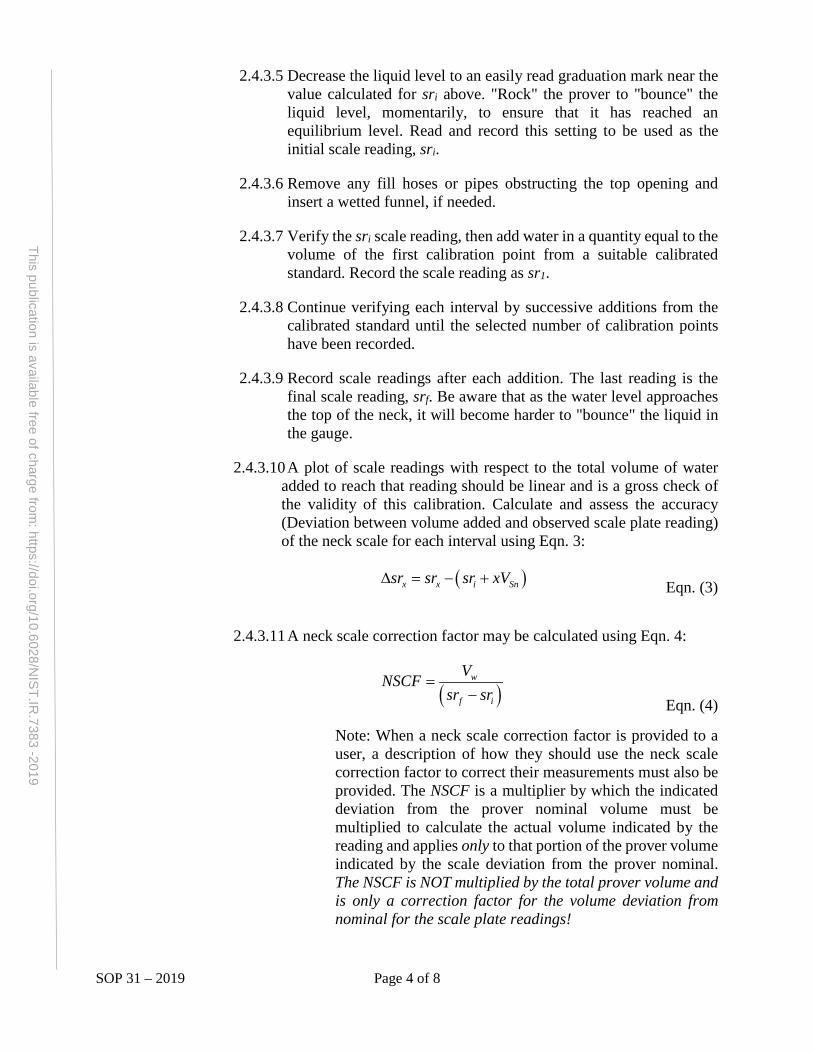
SOP 31 – 2019 Page 4 of 8
This publication is available free of charge from: https://doi.org/10.6028/N
IST.IR.7383 -2019
2.4.3.5 Decrease the liquid level to an easily read graduation mark near the value calculated for sri above. "Rock" the prover to "bounce" the liquid level, momentarily, to ensure that it has reached an equilibrium level. Read and record this setting to be used as the initial scale reading, sri.
2.4.3.6 Remove any fill hoses or pipes obstructing the top opening and insert a wetted funnel, if needed.
2.4.3.7 Verify the sri scale reading, then add water in a quantity equal to the volume of the first calibration point from a suitable calibrated standard. Record the scale reading as sr1.
2.4.3.8 Continue verifying each interval by successive additions from the calibrated standard until the selected number of calibration points have been recorded.
2.4.3.9 Record scale readings after each addition. The last reading is the final scale reading, srf. Be aware that as the water level approaches the top of the neck, it will become harder to "bounce" the liquid in the gauge.
2.4.3.10 A plot of scale readings with respect to the total volume of water added to reach that reading should be linear and is a gross check of the validity of this calibration. Calculate and assess the accuracy (Deviation between volume added and observed scale plate reading) of the neck scale for each interval using Eqn. 3:
( )x x i Snsr sr sr xV∆ = − + Eqn. (3)
2.4.3.11 A neck scale correction factor may be calculated using Eqn. 4:
( )w
f i
VNSCFsr sr
=−
Eqn. (4)
Note: When a neck scale correction factor is provided to a user, a description of how they should use the neck scale correction factor to correct their measurements must also be provided. The NSCF is a multiplier by which the indicated deviation from the prover nominal volume must be multiplied to calculate the actual volume indicated by the reading and applies only to that portion of the prover volume indicated by the scale deviation from the prover nominal. The NSCF is NOT multiplied by the total prover volume and is only a correction factor for the volume deviation from nominal for the scale plate readings!
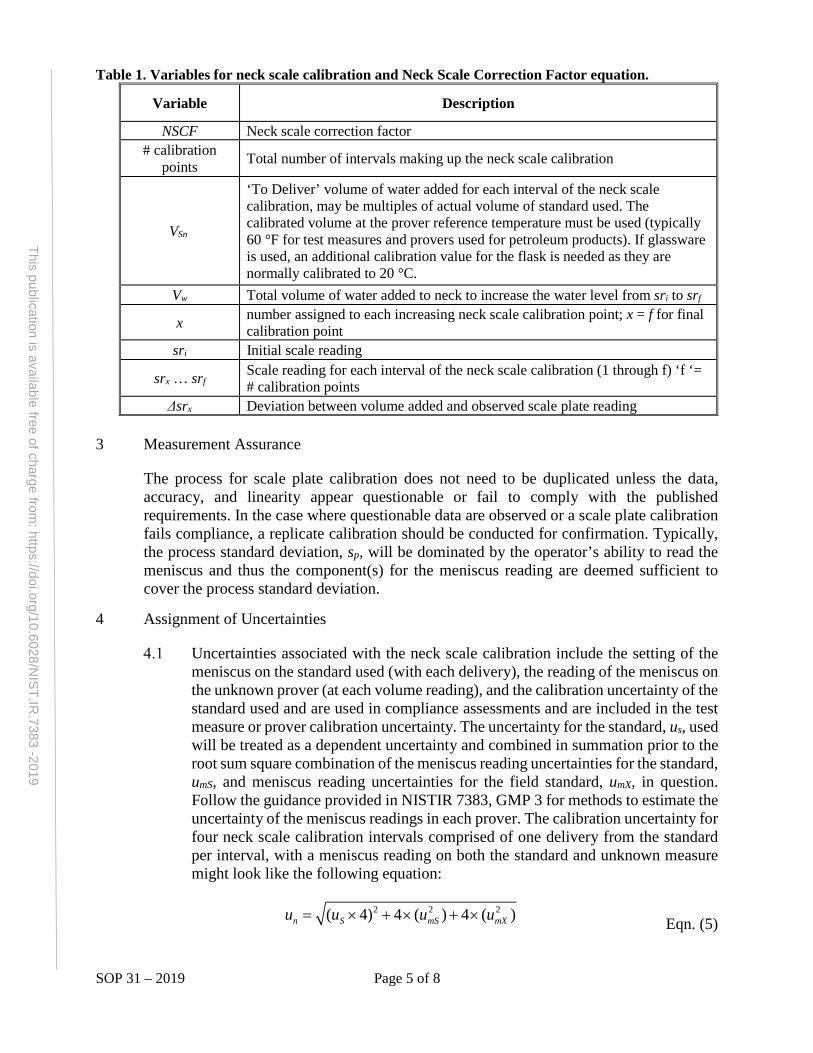
SOP 31 – 2019 Page 5 of 8
This publication is available free of charge from: https://doi.org/10.6028/N
IST.IR.7383 -2019
Table 1. Variables for neck scale calibration and Neck Scale Correction Factor equation.
Variable Description
NSCF Neck scale correction factor # calibration
points Total number of intervals making up the neck scale calibration
VSn
‘To Deliver’ volume of water added for each interval of the neck scale calibration, may be multiples of actual volume of standard used. The calibrated volume at the prover reference temperature must be used (typically 60 °F for test measures and provers used for petroleum products). If glassware is used, an additional calibration value for the flask is needed as they are normally calibrated to 20 °C.
Vw Total volume of water added to neck to increase the water level from sri to srf
x number assigned to each increasing neck scale calibration point; x = f for final calibration point
sri Initial scale reading
srx … srf Scale reading for each interval of the neck scale calibration (1 through f) ‘f ‘= # calibration points
Δsrx Deviation between volume added and observed scale plate reading
3 Measurement Assurance
The process for scale plate calibration does not need to be duplicated unless the data, accuracy, and linearity appear questionable or fail to comply with the published requirements. In the case where questionable data are observed or a scale plate calibration fails compliance, a replicate calibration should be conducted for confirmation. Typically, the process standard deviation, sp, will be dominated by the operator’s ability to read the meniscus and thus the component(s) for the meniscus reading are deemed sufficient to cover the process standard deviation.
4 Assignment of Uncertainties
Uncertainties associated with the neck scale calibration include the setting of the meniscus on the standard used (with each delivery), the reading of the meniscus on the unknown prover (at each volume reading), and the calibration uncertainty of the standard used and are used in compliance assessments and are included in the test measure or prover calibration uncertainty. The uncertainty for the standard, us, used will be treated as a dependent uncertainty and combined in summation prior to the root sum square combination of the meniscus reading uncertainties for the standard, umS, and meniscus reading uncertainties for the field standard, umX, in question. Follow the guidance provided in NISTIR 7383, GMP 3 for methods to estimate the uncertainty of the meniscus readings in each prover. The calibration uncertainty for four neck scale calibration intervals comprised of one delivery from the standard per interval, with a meniscus reading on both the standard and unknown measure might look like the following equation:
2 2 2( 4) 4 ( ) 4 ( )n S mS mXu u u u× + × ×= + Eqn. (5)
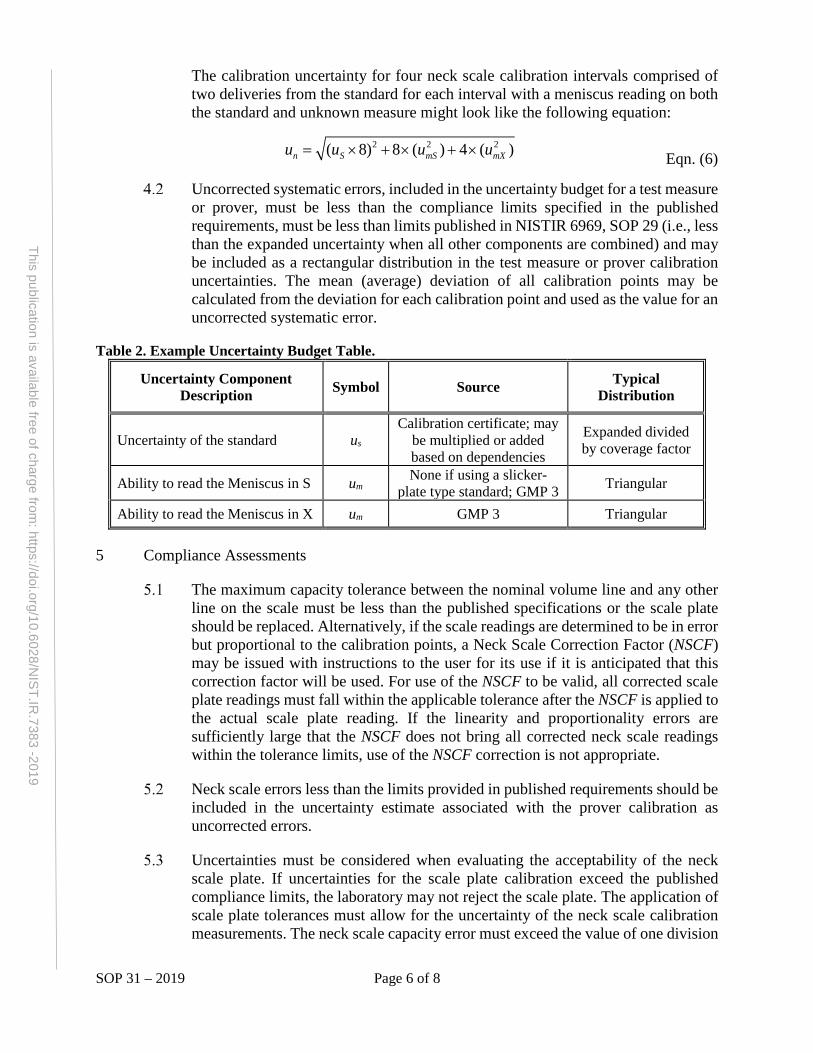
SOP 31 – 2019 Page 6 of 8
This publication is available free of charge from: https://doi.org/10.6028/N
IST.IR.7383 -2019
The calibration uncertainty for four neck scale calibration intervals comprised of two deliveries from the standard for each interval with a meniscus reading on both the standard and unknown measure might look like the following equation:
2 2 2( 8) 8 ( ) 4 ( )n S mS mXu u u u= × + × + × Eqn. (6)
Uncorrected systematic errors, included in the uncertainty budget for a test measure or prover, must be less than the compliance limits specified in the published requirements, must be less than limits published in NISTIR 6969, SOP 29 (i.e., less than the expanded uncertainty when all other components are combined) and may be included as a rectangular distribution in the test measure or prover calibration uncertainties. The mean (average) deviation of all calibration points may be calculated from the deviation for each calibration point and used as the value for an uncorrected systematic error.
Table 2. Example Uncertainty Budget Table.
Uncertainty Component Description Symbol Source Typical
Distribution
Uncertainty of the standard us Calibration certificate; may
be multiplied or added based on dependencies
Expanded divided by coverage factor
Ability to read the Meniscus in S um None if using a slicker-plate type standard; GMP 3 Triangular
Ability to read the Meniscus in X um GMP 3 Triangular
5 Compliance Assessments
The maximum capacity tolerance between the nominal volume line and any other line on the scale must be less than the published specifications or the scale plate should be replaced. Alternatively, if the scale readings are determined to be in error but proportional to the calibration points, a Neck Scale Correction Factor (NSCF) may be issued with instructions to the user for its use if it is anticipated that this correction factor will be used. For use of the NSCF to be valid, all corrected scale plate readings must fall within the applicable tolerance after the NSCF is applied to the actual scale plate reading. If the linearity and proportionality errors are sufficiently large that the NSCF does not bring all corrected neck scale readings within the tolerance limits, use of the NSCF correction is not appropriate.
Neck scale errors less than the limits provided in published requirements should be included in the uncertainty estimate associated with the prover calibration as uncorrected errors.
Uncertainties must be considered when evaluating the acceptability of the neck scale plate. If uncertainties for the scale plate calibration exceed the published compliance limits, the laboratory may not reject the scale plate. The application of scale plate tolerances must allow for the uncertainty of the neck scale calibration measurements. The neck scale capacity error must exceed the value of one division
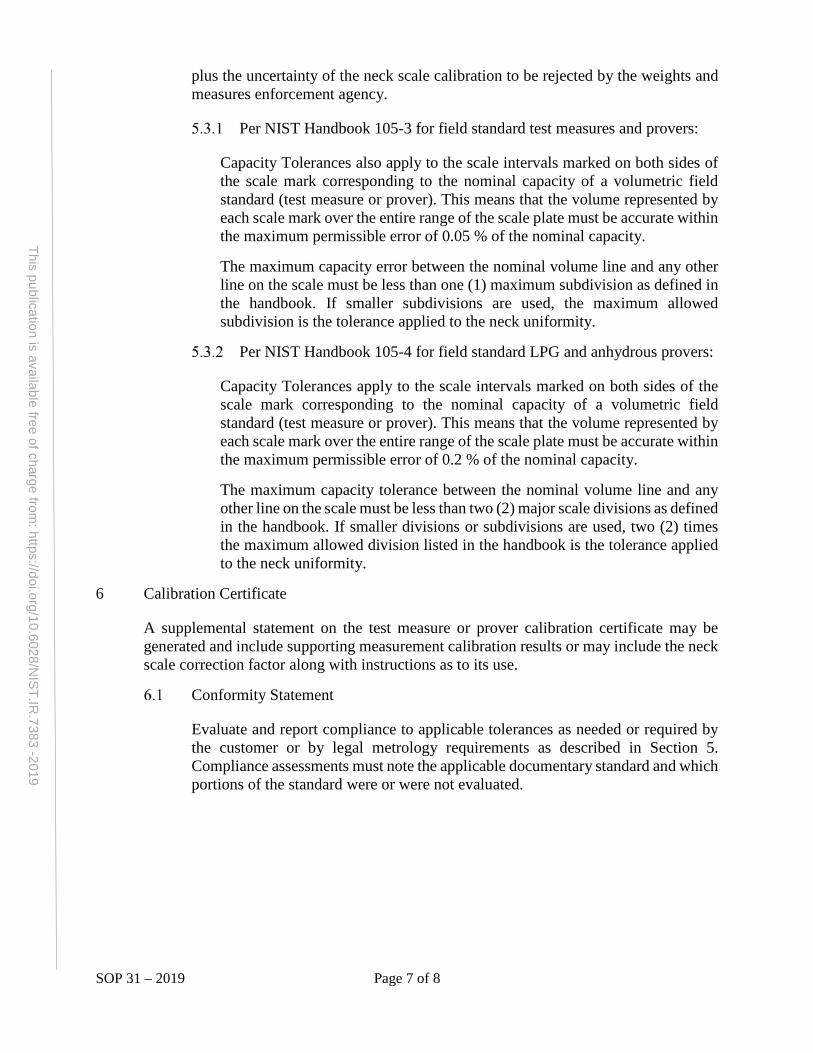
SOP 31 – 2019 Page 7 of 8
This publication is available free of charge from: https://doi.org/10.6028/N
IST.IR.7383 -2019
plus the uncertainty of the neck scale calibration to be rejected by the weights and measures enforcement agency.
Per NIST Handbook 105-3 for field standard test measures and provers:
Capacity Tolerances also apply to the scale intervals marked on both sides of the scale mark corresponding to the nominal capacity of a volumetric field standard (test measure or prover). This means that the volume represented by each scale mark over the entire range of the scale plate must be accurate within the maximum permissible error of 0.05 % of the nominal capacity.
The maximum capacity error between the nominal volume line and any other line on the scale must be less than one (1) maximum subdivision as defined in the handbook. If smaller subdivisions are used, the maximum allowed subdivision is the tolerance applied to the neck uniformity.
Per NIST Handbook 105-4 for field standard LPG and anhydrous provers:
Capacity Tolerances apply to the scale intervals marked on both sides of the scale mark corresponding to the nominal capacity of a volumetric field standard (test measure or prover). This means that the volume represented by each scale mark over the entire range of the scale plate must be accurate within the maximum permissible error of 0.2 % of the nominal capacity.
The maximum capacity tolerance between the nominal volume line and any other line on the scale must be less than two (2) major scale divisions as defined in the handbook. If smaller divisions or subdivisions are used, two (2) times the maximum allowed division listed in the handbook is the tolerance applied to the neck uniformity.
6 Calibration Certificate
A supplemental statement on the test measure or prover calibration certificate may be generated and include supporting measurement calibration results or may include the neck scale correction factor along with instructions as to its use.
Conformity Statement
Evaluate and report compliance to applicable tolerances as needed or required by the customer or by legal metrology requirements as described in Section 5. Compliance assessments must note the applicable documentary standard and which portions of the standard were or were not evaluated.
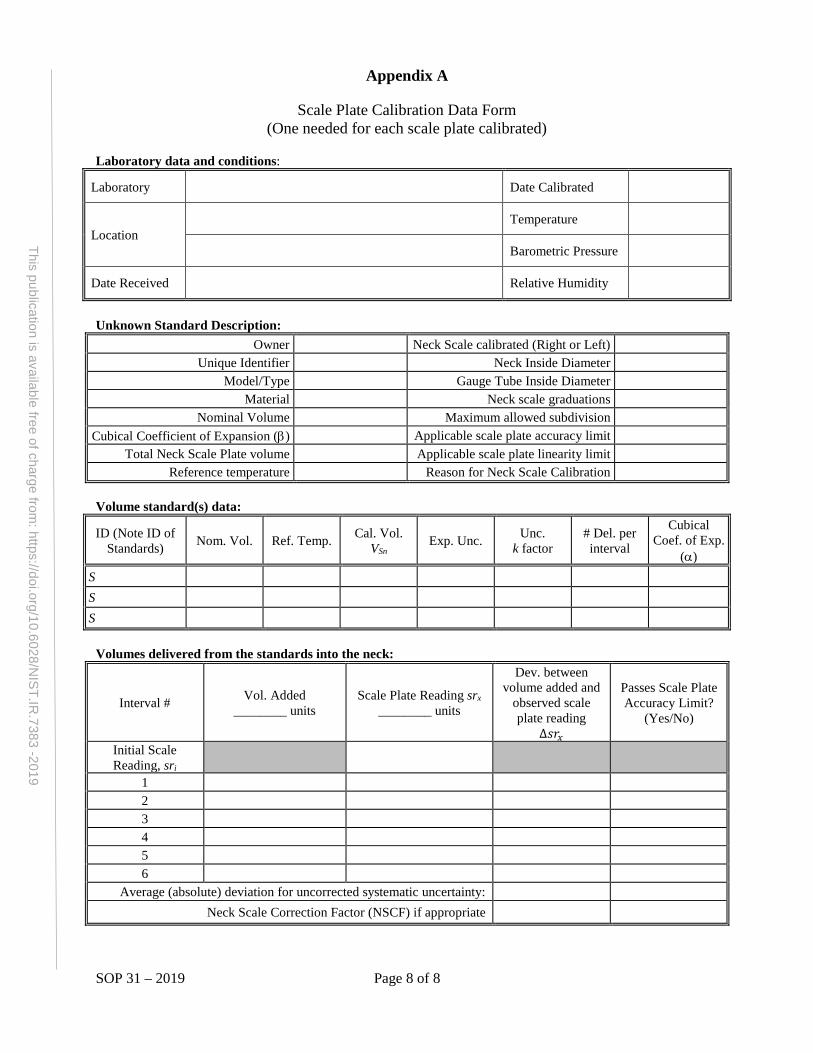
SOP 31 – 2019 Page 8 of 8
This publication is available free of charge from: https://doi.org/10.6028/N
IST.IR.7383 -2019
Appendix A
Scale Plate Calibration Data Form (One needed for each scale plate calibrated)
Laboratory data and conditions:
Laboratory Date Calibrated
Location Temperature
Barometric Pressure
Date Received Relative Humidity
Unknown Standard Description: Owner Neck Scale calibrated (Right or Left)
Unique Identifier Neck Inside Diameter Model/Type Gauge Tube Inside Diameter
Material Neck scale graduations Nominal Volume Maximum allowed subdivision
Cubical Coefficient of Expansion (β) Applicable scale plate accuracy limit Total Neck Scale Plate volume Applicable scale plate linearity limit
Reference temperature Reason for Neck Scale Calibration
Volume standard(s) data:
ID (Note ID of Standards) Nom. Vol. Ref. Temp. Cal. Vol.
VSn Exp. Unc. Unc.
k factor # Del. per interval
Cubical Coef. of Exp.
(α)SS S
Volumes delivered from the standards into the neck:
Interval # Vol. Added ________ units
Scale Plate Reading srx ________ units
Dev. between volume added and
observed scale plate reading
∆𝑠𝑠𝑠𝑠𝑥𝑥
Passes Scale Plate Accuracy Limit?
(Yes/No)
Initial Scale Reading, sri
1 2 3 4 5 6
Average (absolute) deviation for uncorrected systematic uncertainty: Neck Scale Correction Factor (NSCF) if appropriate