selected notes to the condensed interim financial information · commission to dealers (100,708)...
TRANSCRIPT

Selected Notes to the Condensed Interim Financial Information
1st Quarter Report June 30, 2012 11
for the quarter ended June 30, 2012 (Un-audited)
Honda Atlas Cars (Pakistan) Limited12
Selected Notes to the Condensed Interim Financial Informationfor the quarter ended June 30, 2012 (Un-audited)
5. Contingencies and commitments
June 30, March 31,2012 2012(Rupees in thousand)
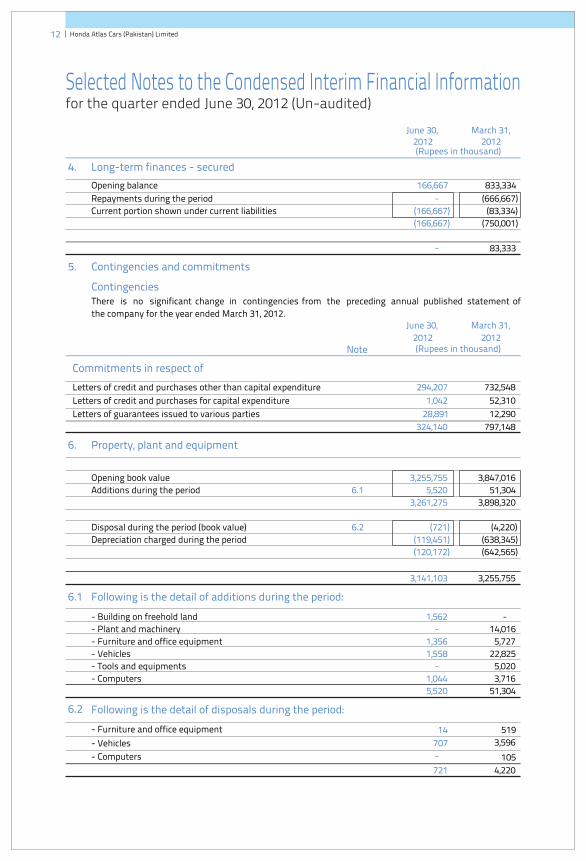
4. Long-term finances - secured
Opening balance
Repayments during the period
Current portion shown under current liabilities
166,667
833,334
- (666,667)
(166,667)
(83,334)
(166,667) (750,001)
- 83,333
6. Property, plant and equipment
Opening book value 3,255,755 3,847,016
Additions during the period 6.1 5,520 51,304
3,261,275
3,898,320
Disposal during the period (book value) 6.2 (721)
(4,220)
Depreciation charged during the period (119,451) (638,345)
(120,172)
(642,565)
3,141,103
3,255,755
6.1 Following is the detail of additions during the period:
- Building on freehold land 1,562
-
- Plant and machinery -
14,016
- Furniture and office equipment 1,356
5,727
- Vehicles 1,558
22,825
- Tools and equipments -
5,020
- Computers 1,044
3,716
5,520
51,304
6.2 Following is the detail of disposals during the period:
- Furniture and office equipment 14 519
- Vehicles 707 3,596
- Computers - 105
721 4,220
Commitments in respect of
Letters of credit and purchases other than capital expenditure 294,207 732,548
Letters of credit and purchases for capital expenditure 1,042 52,310
Letters of guarantees issued to various parties 28,891 12,290
324,140 797,148
June 30, March 31,
2012 2012(Rupees in thousand)
ContingenciesThere is no significant change in contingencies from the preceding annual published statement of
the company for the year ended March 31, 2012.
Note
1st Quarter Report June 30, 2012 13
April - June
2012 2011
(Rupees in thousand)
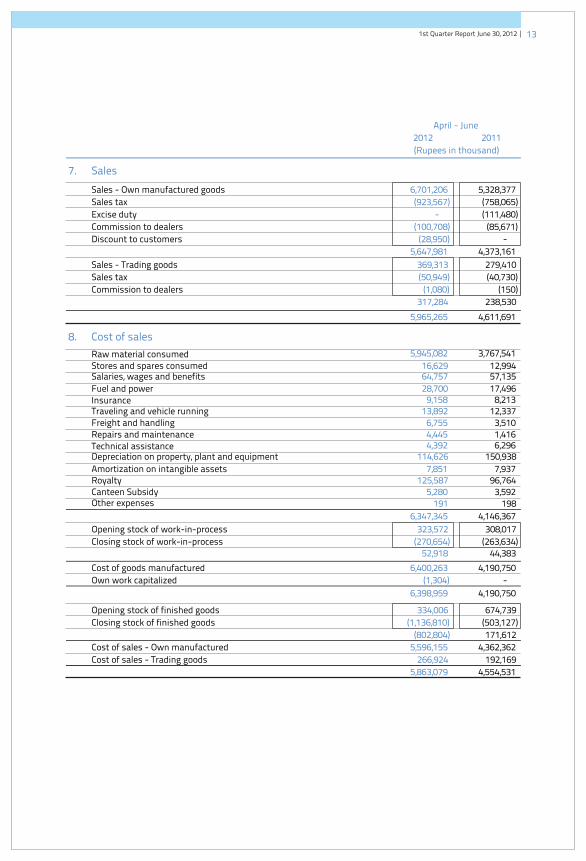
7. Sales
Sales - Own manufactured goods 6,701,206 5,328,377
Sales tax (923,567)
(758,065)
Excise duty -
(111,480)
Commission to dealers (100,708) (85,671)
Discount to customers (28,950) -
5,647,981 4,373,161 Sales - Trading goods 369,313 279,410
Sales tax (50,949)
(40,730)
Commission to dealers (1,080)
(150)
317,284
238,530
5,965,265 4,611,691
8. Cost of sales
Raw material consumed 5,945,082 3,767,541
Stores and spares consumed 16,629 12,994Salaries, wages and benefits 64,757 57,135
Fuel and power 28,700
17,496
Insurance 9,158
8,213Traveling and vehicle running 13,892
12,337
Freight and handling 6,755
3,510
Repairs and maintenance 4,445
1,416
Technical assistance 4,392
6,296Depreciation on property, plant and equipment 114,626
150,938
Amortization on intangible assets 7,851
7,937Royalty 125,587 96,764Canteen Subsidy 5,280 3,592Other expenses 191 198
6,347,345 4,146,367
52,918
44,383
Cost of goods manufactured 6,400,263 4,190,750
Own work capitalized (1,304)
-
6,398,959
4,190,750
Opening stock of finished goods 334,006 674,739
Closing stock of finished goods (1,136,810)
(503,127)
(802,804) 171,612
Cost of sales - Own manufactured 5,596,155 4,362,362
Cost of sales - Trading goods 266,924 192,169
5,863,079 4,554,531
Opening stock of work-in-process 323,572 308,017
Closing stock of work-in-process (270,654) (263,634)
Honda Atlas Cars (Pakistan) Limited14
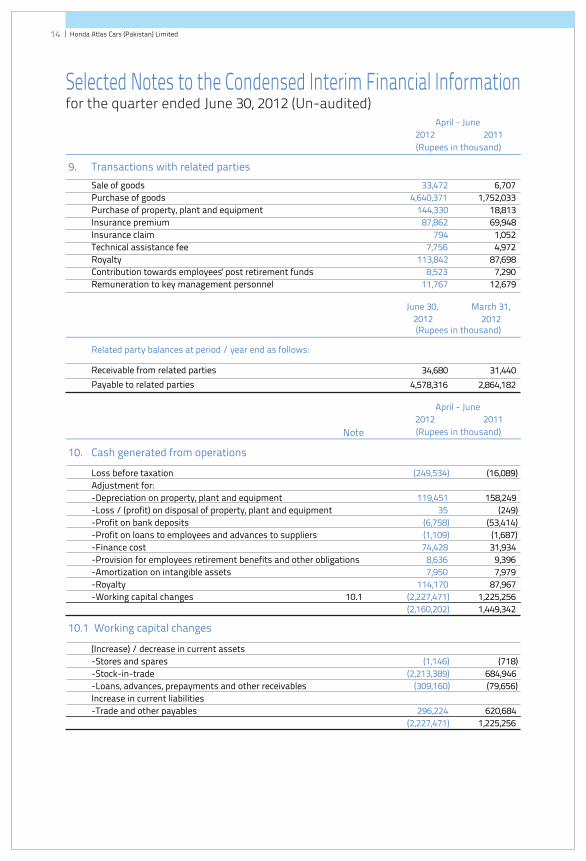
10. Cash generated from operations
Loss before taxation (249,534) (16,089)
Adjustment for:
-Depreciation on property, plant and equipment 119,451 158,249
-Loss / (profit) on disposal of property, plant and equipment 35 (249)
-Profit on bank deposits (6,758)
(53,414)
-Profit on loans to employees and advances to suppliers (1,109)
(1,687)
-Finance cost 74,428
31,934
-Provision for employees retirement benefits and other obligations 8,636
9,396
-Amortization on intangible assets 7,950
7,979
-Royalty 114,170
87,967
-Working capital changes 10.1 (2,227,471)
1,225,256
(2,160,202)
1,449,342
10.1 Working capital changes
(Increase) / decrease in current assets
-Stores and spares (1,146)
(718)
-Stock-in-trade (2,213,389)
684,946
-Loans, advances, prepayments and other receivables (309,160)
(79,656)
Increase in current liabilities
-Trade and other payables 296,224
620,684
(2,227,471)
1,225,256
April - June
2012 2011
(Rupees in thousand)
9. Transactions with related parties
Sale of goods 33,472 6,707
Purchase of goods 4,640,371
1,752,033
Purchase of property, plant and equipment 144,330
18,813
Insurance premium 87,862
69,948
Insurance claim 794
1,052
Technical assistance fee 7,756
4,972
Royalty 113,842 87,698
Contribution towards employees' post retirement funds 8,523 7,290
Remuneration to key management personnel 11,767 12,679
Related party balances at period / year end as follows:
Receivable from related parties 34,680 31,440
Payable to related parties 4,578,316 2,864,182
June 30, March 31,
2012 2012(Rupees in thousand)
April - June
2012 2011
(Rupees in thousand)Note
Selected Notes to the Condensed Interim Financial Informationfor the quarter ended June 30, 2012 (Un-audited)
Yusuf H. ShiraziChairman Chief Executive
Takeharu Aoki
1st Quarter Report June 30, 2012 15
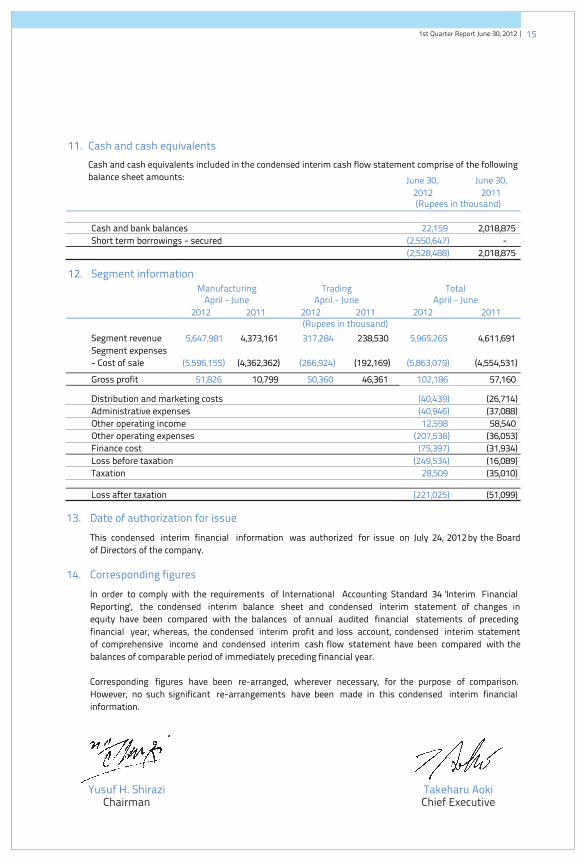
11. Cash and cash equivalents
Cash and bank balances 22,159
2,018,875
Short term borrowings - secured (2,550,647) -
(2,528,488) 2,018,875
Cash and cash equivalents included in the condensed interim cash flow statement comprise of the following
balance sheet amounts: June 30, June 30,
2012 2011(Rupees in thousand)
13. Date of authorization for issue
14. Corresponding figures
This condensed interim financial information was authorized for issue on July 24, 2012 by the Board
of Directors of the company.
In order to comply with the requirements of International Accounting Standard 34 'Interim Financial
Reporting', the condensed interim balance sheet and condensed interim statement of changes in
equity have been compared with the balances of annual audited financial statements of preceding
financial year, whereas, the condensed interim profit and loss account, condensed interim statement
of comprehensive income and condensed interim cash flow statement have been compared with the
balances of comparable period of immediately preceding financial year.
Corresponding figures have been re-arranged, wherever necessary, for the purpose of comparison.
However, no such significant re-arrangements have been made in this condensed interim financial
information.
12. Segment information
Manufacturing Trading TotalApril - June April - June April - June
2012 2011 2012 2011 2012 2011(Rupees in thousand)
Segment revenue 5,647,981
4,373,161
317,284
238,530
5,965,265
4,611,691
Segment expenses
- Cost of sale (5,596,155)
(4,362,362)
(266,924)
(192,169)
(5,863,079)
(4,554,531)
Gross profit 51,826
10,799
50,360
46,361
102,186
57,160
Distribution and marketing costs (40,439)
(26,714)
Administrative expenses (40,946)
(37,088)
Other operating income 12,598
58,540
Other operating expenses (207,536) (36,053)
Finance cost (75,397) (31,934)
Loss before taxation (249,534) (16,089)
Taxation 28,509 (35,010)
Loss after taxation (221,025) (51,099)