selected annual information - softchoicem.softchoice.com/files/pdf/about/softchoice_mda_2004.pdf ·...
TRANSCRIPT

Softchoice Corporation 2004 Management’s Discussion and Analysis
1
MANAGEMENT’S DISCUSSION AND ANALYSIS
Feb 15, 2005
This document has been prepared to help investors understand the financial performance of the Company in the broader context of the Company’s strategic direction, the risks and opportunities as understood by management and the key metrics that are relevant to the Company’s performance. Management has prepared this document in conjunction with its broader responsibilities for the accuracy and reliability of the financial statements, as well as the development and maintenance of appropriate information systems and internal controls to ensure that the financial information is complete and reliable. The audit committee of the Board of Directors has reviewed this document and all other publicly reported financial information for integrity, usefulness, reliability and consistency. The following discussion should be read in conjunction with the audited consolidated financial statements for the year ended December 31, 2004. This discussion contains certain forward-looking statements based on current expectations. The words “expect,” “intend,” “anticipate” and similar expressions generally identify forward-looking statements. These forward-looking statements entail various risks and uncertainties that could cause actual results to differ materially from those reflected in those forward-looking statements. Certain of these risks are described under the heading “Risks” below. This document and the related financial statements can also be viewed on the Company’s website at www.softchoice.com and at www.sedar.com. The Company’s latest Annual Information Form is also available on these websites.
Selected Annual Information The following information is provided to give a context to the broader comments elsewhere in this report.
December 31, 2004 December 31, 2003 December 31, 2002 (in Canadian $000s except per share amounts) Total imputed revenue * $868,460 $675,700 $733,900 Revenue 630,310 548,669 665,487 Gross Profit 83,974 66,170 79,354 Gross Profit as a % of revenue 13.3% 12.1% 11.9% Operating Income 20,597 6,444 25,636 Net Income 12,837 3,523 15,081 Earnings per Share: Basic $0.75 $ 0.21 $0.89 Earning per Share: Diluted $0.75 $0.20 $0.89 Total Assets 128,492 152,645 169,503 Shareholders’ Equity 40,836 29,638 27,634
* For a description of imputed revenue see “Use of Non-GAAP measures.”
Softchoice Corporation 2004 Management’s Discussion and Analysis
2
Business Operations Softchoice provides information technology products to North American businesses and organizations of all sizes. The services we provide make it easy and more cost-effective for customers to select, acquire and manage their technology assets. These services include the following three steps:
• Select – Softchoice helps customers find the best products to solve their business problems through our proprietary database and advanced product searching and comparative tools.
• Acquire – Softchoice helps customers identify the most effective way for them to acquire the technology through our expertise in software licensing programs, digital download of software, efficient Internet-based purchase transactions and leasing arrangements.
• Manage – Softchoice provides information and tools that help customers manage their technology assets over the course of the technology life span. These include reporting, training and online asset identification and tracking software.
Our Products Softchoice was founded in 1989 to sell software to corporate customers. We became experts in software volume licensing - a form of purchasing that developed throughout the 1990s. In late 2002, we added hardware products to our suite of product offerings. In the Small and Medium Business (“SMB”) market, the same individuals buy both hardware and software assets, and we are able to leverage our customer relationships by increasing our product base for these customers. The hardware market is much larger than the software market so this increased product base offers Softchoice an opportunity for significant growth. Most of our public competitors sell both hardware and software products, with hardware products accounting for about 75 percent of total sales in the marketplace. Industry Overview The information technology distribution channel includes four main players.
1. The software publisher or hardware manufacturer creates and builds the products. These organizations elect to sell product directly to the customer, as is the case with Dell Computers, or they sell through the distribution channel or they may elect to do a combination of both, depending on the specific products. The more complex the product or the earlier that the product is in the adoption cycle, the more likely the manufacturer is to sell it directly. Approximately 50 percent of all technology products sold are sold through the distribution channel.
Softchoice Corporation 2004 Management’s Discussion and Analysis
3
2. The distributor buys product from the manufacturer and sells it to the reseller or
direct marketer. The distributor does not sell to end users. Distributors generally maintain massive warehouses and specialize in providing logistical services. Ingram Micro, Synnex and Tech Data are the largest examples of technology distributors in the North American market.
3. The reseller or direct marketer buys product from either distributors or the
manufacturer and sells them to the end user. Resellers are usually prohibited from selling to other resellers and typically sell to end users only. Resellers have agreements with the manufacturers that generally are not exclusive but may describe a geographical territory, such as Canada or North America. Resellers may focus on specific customer segments, defined either by the size of the customer, the industry or their geography. In the past few years, there has been considerable consolidation in the reseller channel and the mid-sized or regional players are being acquired by national resellers. The industry is bifurcating into small local players and larger national or international participants.
4. Local VARs (Value-Added Resellers) provide local integration services to their
customers and will sell product as well. They generally source product from distributors and do not have agreements with the large manufacturers. While there are some larger VARs, the majority of the players in this segment are small local firms.
Softchoice, as a reseller, buys product from both distributors and manufacturers. Our designation as a Microsoft Large Account Reseller is an example of the type of contractual relationship that resellers have with manufacturers or publishers. This agreement gives us certain pricing advantages and access to Select and EA 6.0 licenses (see “Microsoft and Softchoice”). Distributors and VARs are not able to purchase these products. We will also partner with local VARs in specific areas so that our customers can benefit from these local services provided by the VAR, in addition to the pricing and asset management advantages that Softchoice offers when executing technology purchases. Competitive Landscape Softchoice provides local service through our branch network, primarily to the small and mid-sized customer (the SMB market). We define mid-sized as less than 2000 personal computers (“PCs”) (see “Our Customers”). Most competitors who have local presence focus their sales on the enterprise customers while most competitors who focus on the SMB market service their customers through a call centre environment. It is our use of proprietary information technology systems and the integration between our inside and outbound sales representatives and effective marketing campaigns that enable Softchoice to provide this local service to the SMB market on a profitable basis.

Softchoice Corporation 2004 Management’s Discussion and Analysis
4
Corporate Strategy During 2004, management developed a long-term strategic plan for Softchoice based on identifying the core activities in the organization that interconnect to drive the overall direction of the Company. Independently, each of these activities could be considered as incidental and irrelevant; the strength is in the congruity of the overall model. The strategy map is linked to a balanced scorecard that measures the goals and achievements of the Company in each of these strategic circles. The most important of these metrics are provided below, under “Key Performance Measures.” The Company’s strategy comprises five key elements:
• Customer focus • Local branches • Partnerships • Integrated sales and marketing • Proprietary IT systems
Customer Focus The focus of the company is on customer service, and all activities of the organization are linked to this one central operating principle.
Our Customers
Softchoice customers range from large multinational banks to small home offices. In 2004, 48 percent of sales were made to customers with fewer than 2,000 PCs. We define this customer group as the SMB. Enterprise clients are defined as those with more than 2,000 PCs. The Company’s revenues can be segmented by customer size as follows: 2004 2003 2002Small-Medium 48% 45% 54%Enterprise (>2000 PCs) 25% 19% 16%Government 27% 36% 30%
The distortion in the Company’s business in 2003 can be seen in these statistics. The relative strength of the government business during 2003 was partially as a result of the weakness in the enterprise sector caused by the sales of two-year agreements of Microsoft products in 2002. (see “Microsoft and Softchoice”) In 1995, Softchoice began selling software in the U.S. market. Today, U.S. customers make up 68.5 percent of our total customer base.

Softchoice Corporation 2004 Management’s Discussion and Analysis
5
Since our acquisition of the Government Services Group of Beyond.com in July 2002, Softchoice has become established in the provision of technology products to the U.S. federal government. This acquisition served to complement the relationship we have had with the Canadian federal government for many years. In early January 2004, we announced a marketing partnership with PC-Ware of Leipzig, Germany, to enable both organizations to offer complete technology acquisition and management solutions in both Europe and North America. This initiative has been structured to help us increase our penetration of the large enterprise account base in North America. Local Branches It is the blend of local relationships and call centre sales that enables us to provide cost-effective services to the mid-market. We believe that it is the local presence that gives customers the confidence to spend more of their budget with Softchoice. Due to the complexity of the software licenses being sold, particularly the Microsoft EA 6.0 license, the face-to-face explanation of the costs and benefits of the purchase decision builds trust and confidence with the customer. In our experience, there is a direct correlation between the level of customer spending and the customer’s level of confidence in Softchoice’s service and capabilities.
Our Sales Model Softchoice has 32 offices across North America with 136 outbound sales representatives. These sales representatives meet customers face to face to identify their technology requirements and purchasing preferences. This group is supported by 134 inside sales representatives, sales account managers and technical supporting staff. We operate four call centres in Montreal, Toronto, Chicago and Seattle and can service customers in English, French and Spanish across all North American time zones. In 2004, Ipsos-Reid named the Toronto call centre “Call Centre of the Year in Canada.” In 2004, we conducted our second consecutive customer satisfaction survey. Both surveys show customer satisfaction levels with Softchoice as a technology supplier in excess of 80 percent. Our customers also indicate that we save them time (81 percent) and money (78 percent) during the process of purchasing and managing their technology resources. Customer satisfaction with the service provided by both inside sales and outbound sales (81 percent for both) was also consistent with the findings of the call centre study conducted by Ipsos-Reid. Partnerships Local branches are also able to engage with local vendors and Value Added Resellers. Softchoice provides pre-sales advice and consulting but we do not provide integration,
Softchoice Corporation 2004 Management’s Discussion and Analysis
6
help desk or installation services. By partnering with local service providers, we can provide more cost-effective purchasing power for their customers and better local support for those customers who need it. In addition, partnering with local vendor sales representatives allows us to give additional product-specific technical advice to our customers by bringing that product representative into the customers’ facilities. Integrated Sales and Marketing Our marketing campaigns are structured to provide national marketing activities that include sales execution at the local level. This approach appeals to the manufacturers since we are providing national exposure for their products. It is also consistent with our focus on the mid-market. It is our belief that marketing requirements depend on the size of the customer targeted. The small customer can be reached most effectively with broad-based advertising; the large enterprise customer has different requirements and a differing level of technical sophistication and can be most easily targeted with an outbound sales force. Our focus on the mid-sized customer means that a mix between the marketing campaigns and an outbound sales approach is required. We partner with the vendors to provide direct mail and other advertising and augment this approach with the local sales force. Market development funds received from vendors are often directed at specific product and market opportunities.
Our Vendors We offer the publishers and manufacturers of technology products access to more than 14,000 customers across North America through our outbound sales force of 136 people. We prepare and execute collaborative marketing campaigns aimed at providing our vendors increased exposure to the customer base. Our vendor certifications are extensive, enabling Softchoice to represent their products well. Proprietary IT Systems Softchoice processed more than 150,000 transactions last year. The ability to do so cost-effectively requires state-of-the-art technology systems. One of our commitments to our customers is the ability to provide them with historical purchase records for as long as we have been their supplier. For some customers, this requires that we maintain 15 years worth of purchasing data. Our promise to the vendors is that we will follow up on all leads and provide them with the necessary reporting that is appropriate for their business needs. To meet these promises cost-effectively an integrated data base and high levels of automation in the sales process are required. Our ratio of costs as a percentage of sales indicates that we are able to provide these services at cost levels that rival any in the reseller industry.

Softchoice Corporation 2004 Management’s Discussion and Analysis
7
Growth Strategies Our growth strategies comprise four elements:
1. To expand our customer base; 2. To expand our product line; 3. To support both expansions with stronger, more robust and more
innovative IT infrastructure; and 4. To expand through acquisitions, where appropriate.
1. Expand our customer base Our focus has and will continue to be the SMB market. One of our major attractions to the vendor community is our ability to approach this market face to face. However, in Canada, we have also had a strong presence with Enterprise accounts and we expect to strengthen our position with other Enterprise customers in both Canada and the U.S. through our partnership with European-based reseller, PC-Ware. In 2003, we expanded our inside sales group to provide customers with dedicated coverage in order to increase the percentage of repeat customers. In 2003, the percentage of customers who did repeat business with Softchoice increased by 12 percent over the previous year; in 2004, this retention rate increased again by another 1.1 percent. We believe that some of this retention is due to the account managers’ efforts, and some is because customers can now buy hardware products from us as well. Our experience indicates that customers who buy more products buy more frequently and therefore are more likely to buy from us again. In 2005, we are again expanding our sales coverage with the deployment of a new telesales group aimed at increasing the number of customers in certain metropolitan areas where we would like to increase our market penetration. 2. Expand our product lined In the last quarter of 2002 Softchoice began to leverage its sales infrastructure by selling hardware products. Hardware sales increased from $1.2 million in 2002 to $40.3 million in 2003 and to $85.9 million in 2004. The expansion of our product line increases the total size of our addressable market by about three times. Adding hardware to our product mix also meets several other strategic objectives:
• Hardware is purchased more frequently than software, so the Company has an opportunity to interact with its customers more often. This exposure is expected to increase customer loyalty and to expand the overall customer base. Our customer survey data show a direct correlation between the number of vendors sold to a customer and their loyalty.

Softchoice Corporation 2004 Management’s Discussion and Analysis
8
• Since it is often the same person purchasing both hardware and software, particularly in the SMB market, adding hardware enables us to efficiently leverage our sales infrastructure to capture additional revenue. The hardware sales cycle is similar to the software cycle so that while sales employees need to be trained on the new product offerings, their selling skills are easily adapted to selling hardware.
• Most of our major competitors offer hardware products to their customers. The introduction of hardware products reduces our vulnerability to these more diversified competitors, particularly as the general trend for customers to seek single-source suppliers continues to be manifested in the marketplace.
• The increase in product offerings reduces risk by increasing product and supplier diversification.
• Our hardware strategy is based on shipping products to customers directly from our partners. Therefore, the Company does not incur the risks and costs associated with building significant inventory levels to support this initiative.
Hardware sales represented 13.6 percent of total consolidated sales for fiscal 2004. Hardware sales may be segregated as follows:
Hardware Sales by Category - CY04
47%
22%
12%
11%
4% 2%2%
Systems
Output Devices
Networking
Storage Devices
Memory
Input Devices
Others
3. Expand our infrastructure As we expand our product offerings and grow our customer base, we must also invest in our infrastructure to support this growth.
In January 2004, Softchoice announced that Kevin Wright had joined the management team as Vice President and Chief Information Officer. His responsibilities include the

Softchoice Corporation 2004 Management’s Discussion and Analysis
9
effective operation and development of all internal technology systems. Kevin comes to Softchoice with more than 10 years of industry experience in operations and IT management, most recently with General Electric IT Solutions. We are delighted to be able to take advantage of his expertise in expanding our internal infrastructures to support our growth strategies more effectively. As a company, we believe that innovation in our systems is a key element in cost-effective growth.
In 2004 we made significant investments to improve our technology environment, including the following efforts:
• Significant steps were taken to strengthen our order processing system. We replaced the existing hardware with current technology, upgraded the database application and platform to current supported levels and improved functionality for processing hardware transactions and for managing an increasingly recurring software revenue stream.
• Our Oracle human resources and finance ERP applications were upgraded, which resulted in increased stability and improved functionality in both areas.
• We are currently in the process of consolidating the provision of all voice and data for our call centre and branch telephony network, including the movement of the call centre network to a more current technology base. This consolidation will enable significant cost savings, as well as improved network stability and performance. This project is under way, and we expect to conclude it by the end of the first quarter. We have also upgraded major portions of the telephony infrastructure.
• We implemented a full scale disaster recovery plan and business continuity plan for our head office and our four call centres. This includes redundancy for key systems, resources and facilities.
• The Company expanded its use of electronic purchasing; in 2004 more than 70 percent of all purchase orders and 80 percent of accounts payable invoices were processed electronically. This technology has allowed for significant savings and productivity improvements on the vendor side of the Softchoice supply chain.
4. Expand through acquisitions Over the past two or three years, there has been a trend toward consolidation in the reseller community. Management believes that this trend has not yet been exhausted and that further consolidations are to come. We intend to participate in this process, and our acquisition criteria are designed to support one of the three growth trends outlined above. For example, the acquisition of a smaller regional company in Canada or the United States could provide Softchoice with an expanded customer base. Specific technology could be acquired to enhance the infrastructure, and the acquisition of a strong hardware reseller could provide an opportunity to expand our hardware segment more aggressively. In prior years, management’s commitment to a growth strategy based on building out our
Softchoice Corporation 2004 Management’s Discussion and Analysis
10
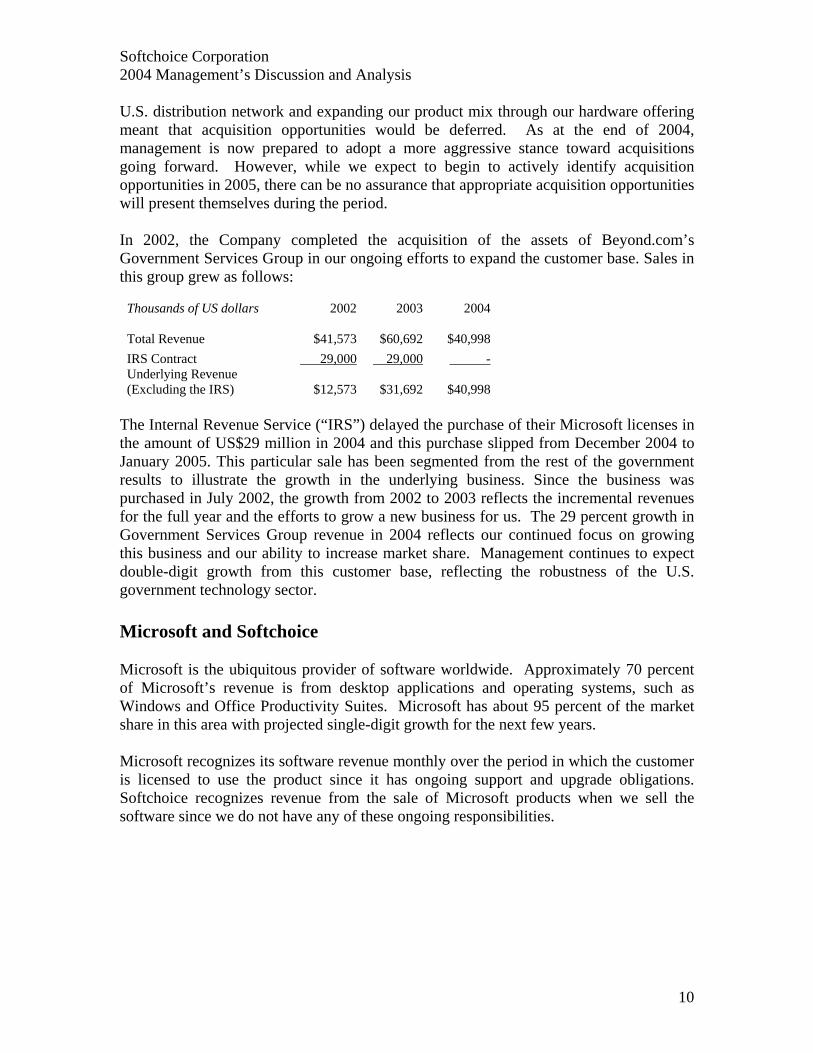
U.S. distribution network and expanding our product mix through our hardware offering meant that acquisition opportunities would be deferred. As at the end of 2004, management is now prepared to adopt a more aggressive stance toward acquisitions going forward. However, while we expect to begin to actively identify acquisition opportunities in 2005, there can be no assurance that appropriate acquisition opportunities will present themselves during the period. In 2002, the Company completed the acquisition of the assets of Beyond.com’s Government Services Group in our ongoing efforts to expand the customer base. Sales in this group grew as follows:
Thousands of US dollars 2002 2003 2004
Total Revenue
$41,573
$60,692
$40,998 IRS Contract 29,000 29,000 - Underlying Revenue (Excluding the IRS)
$12,573
$31,692
$40,998
The Internal Revenue Service (“IRS”) delayed the purchase of their Microsoft licenses in the amount of US$29 million in 2004 and this purchase slipped from December 2004 to January 2005. This particular sale has been segmented from the rest of the government results to illustrate the growth in the underlying business. Since the business was purchased in July 2002, the growth from 2002 to 2003 reflects the incremental revenues for the full year and the efforts to grow a new business for us. The 29 percent growth in Government Services Group revenue in 2004 reflects our continued focus on growing this business and our ability to increase market share. Management continues to expect double-digit growth from this customer base, reflecting the robustness of the U.S. government technology sector. Microsoft and Softchoice Microsoft is the ubiquitous provider of software worldwide. Approximately 70 percent of Microsoft’s revenue is from desktop applications and operating systems, such as Windows and Office Productivity Suites. Microsoft has about 95 percent of the market share in this area with projected single-digit growth for the next few years. Microsoft recognizes its software revenue monthly over the period in which the customer is licensed to use the product since it has ongoing support and upgrade obligations. Softchoice recognizes revenue from the sale of Microsoft products when we sell the software since we do not have any of these ongoing responsibilities.

Softchoice Corporation 2004 Management’s Discussion and Analysis
11
Microsoft sells its products to a small number of distributors and Large Account Resellers (LARs), like Softchoice, which, in turn, resell the products. There are 23 LARs in North America. When Softchoice entered the U.S. market in 1995, we ranked 23rd of 23 LARs. Our U.S. growth has been such that at the end of 2004, we ranked sixth out of 23 LARs, indicating our ability to gain market share rapidly in this fragmented field.
In Canada, Softchoice has ranked either first or second in LAR position for several years. The actual ranking varies by quarter, depending primarily on the timing of certain large orders serviced by our competitors and us. In Microsoft’s fiscal year 2004 we ranked number one as a Microsoft LAR and received the Microsoft “LAR of the Year” award.
In the past, Microsoft sold products to its customers on an as-needed basis. That is, when a new PC was purchased, the customer purchased additional licenses for the applications that the user required. This process created asset management challenges for many customers. Therefore, an enterprise licensing model evolved that allows customers to identify the number of users in their organization and pay annually for all of the licenses they needed. The effect for Softchoice has been a shift from a day-to-day sales model to a model that requires annual planning and invoicing. This reduces the number of Microsoft transactions and increases the average order size. It also intensifies competition for the customers’ business around the renewal dates for their enterprise licenses.
Software Licenses Software licenses are used across the industry to regulate the use and ownership of all types of software products. For Microsoft products, the customer is able to buy the license alone, or with an “insurance”-type product that allows the customer to obtain, free of charge, the most recent versions of the software for the term of the “insurance” product. Microsoft sells, or sold, this type of product through Upgrade Advantage, Software Assurance and Enterprise Agreements. Customers are also able to purchase the license agreement on its own, but this gives them no rights or access to later versions of the product. To upgrade, they must repurchase the software license.
Upgrade Advantage In an attempt to provide a compelling incentive for customers to move to current technology, Microsoft sold a product called Upgrade Advantage (UA). This product allowed a customer to upgrade to the latest technology and continue to upgrade to current technology for a period of two years. The pricing proved to be advantageous to customers, and Softchoice was successful at helping customers take advantage of this offer. Microsoft stopped offering this product on July 31, 2002. As a result, Softchoice experienced a large increase in sales in July 2002, with sales of $119 million in that month alone. The record sales of UA before the July 31, 2002, deadline meant that a significant number of customers had minimal requirements to purchase any Microsoft products during 2003. In 2004, the two-year UA contracts expired and these customers needed to replace their UA protection with either Software Assurance contracts or Enterprise Agreements, if they wished to retain their “insurance”-type advantages.

Softchoice Corporation 2004 Management’s Discussion and Analysis
12
Software Assurance The UA product has been replaced with a product called Software Assurance (SA). It has many of the same “insurance” features as UA and allows the customer to upgrade to the most current version of the software at any time. However, SA is generally purchased for a one year-term, whereas UA offered two-year coverage.
Enterprise Agreements 6.0 (EA 6.0) In October 2001, Microsoft began offering Enterprise Agreements (EA) to customers directly, paying resellers such as Softchoice an agency fee or commission on these sales. The result of these transactions is that the revenue recorded by Softchoice is reduced but the gross profit remains. Therefore, the Company’s margin on these deals is 100 percent and, as a result, they increase the Company’s overall gross margin. Microsoft does not pay rebates on sales of EA 6.0 agreements. The proportion of sales of this product has risen in the last year. Meaningful year-over-year comparison of Softchoice’s revenue requires an adjustment to the EA sales that Microsoft obtains and on which Softchoice is paid an agency fee. Softchoice refers to this revenue line as Imputed Revenue. (see “Use of Non-GAAP Measures”) Imputed Revenue is defined as the price paid by the customer for EA 6.0 license agreements. Total Imputed Revenue is defined as total revenue reported by the Company plus Imputed Revenue less the agency fees included in reported revenue. The chart below shows the Total Imputed Revenue tracked by the Company over the last three years.
EA 6.0 Imputed Revenue 2002 Q1 Q2 Q3 Q4 Annual
Revenue $ 126.6 $ 152.4 $ 198.2 $ 188.3 $ 665.5 Agency Fees (1.5) (2.2) (2.3) (1.0) (7.0) Imputed Revenue 21.6 26.8 13.3 13.7 75.4 Total Imputed Revenue $ 146.7 $ 176.9 $ 209.2 $ 201.0 $ 733.9
2003 Q1 Q2 Q3 Q4 Annual
Revenue $ 121.6 $ 132.8 $ 125.3 $ 169.1 $ 548.7 Y/Y Growth (4%) (13%) (37%) (10%) (18%) Agency Fees (2.9) (3.4) (1.9) (3.2) (11.4) Imputed Revenue 40.4 40.3 23.7 34.0 138.4 Total Imputed Revenue $ 159.1 $ 169.7 $ 147.1 $ 199.8 $ 675.7 Y/Y Growth 8% (4%) (30%) (1%) (8%)
2004 Q1 Q2 Q3 Q4 Annual
Revenue $ 150.3 $ 169.8 $ 145.6 $ 164.5 $ 630.3 Y/Y Growth 24% 28% 16% (3%) 15% Agency Fees (5.0) (9.0) (3.6) (5.8) (23.4) Imputed Revenue 67.6 96.3 40.8 57.0 261.7 Total Imputed Revenue $ 212.9 $ 257.1 $ 182.8 $ 215.7 $ 868.6 Y/Y Growth 34% 52% 24% 8% 29%
Softchoice Corporation 2004 Management’s Discussion and Analysis
13
Microsoft Revenue
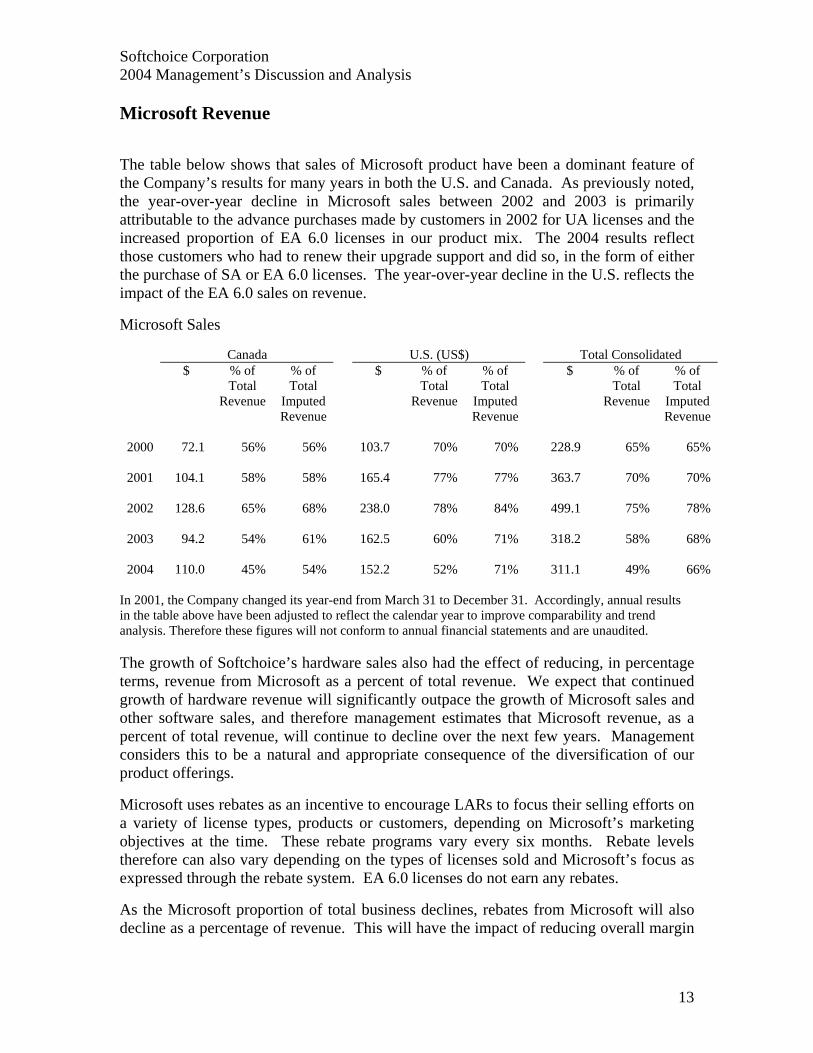
The table below shows that sales of Microsoft product have been a dominant feature of the Company’s results for many years in both the U.S. and Canada. As previously noted, the year-over-year decline in Microsoft sales between 2002 and 2003 is primarily attributable to the advance purchases made by customers in 2002 for UA licenses and the increased proportion of EA 6.0 licenses in our product mix. The 2004 results reflect those customers who had to renew their upgrade support and did so, in the form of either the purchase of SA or EA 6.0 licenses. The year-over-year decline in the U.S. reflects the impact of the EA 6.0 sales on revenue.
Microsoft Sales
Canada U.S. (US$) Total Consolidated $ % of
Total Revenue
% of Total
Imputed Revenue
$ % of Total
Revenue
% of Total
Imputed Revenue
$ % of Total
Revenue
% of Total
Imputed Revenue
2000
72.1 56% 56% 103.7 70% 70%
228.9 65% 65%
2001
104.1 58% 58% 165.4 77% 77%
363.7 70% 70%
2002
128.6 65% 68% 238.0 78% 84%
499.1 75% 78%
2003
94.2 54% 61% 162.5 60% 71%
318.2 58% 68%
2004
110.0 45% 54% 152.2 52% 71%
311.1 49% 66%
In 2001, the Company changed its year-end from March 31 to December 31. Accordingly, annual results in the table above have been adjusted to reflect the calendar year to improve comparability and trend analysis. Therefore these figures will not conform to annual financial statements and are unaudited. The growth of Softchoice’s hardware sales also had the effect of reducing, in percentage terms, revenue from Microsoft as a percent of total revenue. We expect that continued growth of hardware revenue will significantly outpace the growth of Microsoft sales and other software sales, and therefore management estimates that Microsoft revenue, as a percent of total revenue, will continue to decline over the next few years. Management considers this to be a natural and appropriate consequence of the diversification of our product offerings.
Microsoft uses rebates as an incentive to encourage LARs to focus their selling efforts on a variety of license types, products or customers, depending on Microsoft’s marketing objectives at the time. These rebate programs vary every six months. Rebate levels therefore can also vary depending on the types of licenses sold and Microsoft’s focus as expressed through the rebate system. EA 6.0 licenses do not earn any rebates.
As the Microsoft proportion of total business declines, rebates from Microsoft will also decline as a percentage of revenue. This will have the impact of reducing overall margin

Softchoice Corporation 2004 Management’s Discussion and Analysis
14
levels and must be compensated with higher product margin levels and with the mix of products including EA 6.0 license sales.
Historically, rebates have been larger than the overall profit margin for the Company and, therefore, we have had to rely on achieving rebate targets to ensure profitability. It has been an ongoing focus of the management team for the past two or three years to reduce the expense base such that the Company will be profitable even if no rebates are achieved. As rebates decline as a percentage of revenue, we will continue to manage our cost base as a percentage of gross margins before rebates so that Softchoice is not reliant on rebate achievement for profitability.
Current Trends In addition to the impact of the changes in Microsoft’s business, Softchoice has been affected by two other trends over the last year. We expect that these will continue to affect the Company over the next year. Technology Industry Spending Just prior to 2000, many companies invested considerably in the technical resources necessary to ensure that their computer infrastructure was Y2K-compliant. Refresh rates - the time period over which a company replaces older equipment - used to be about three years; however, monitoring institutions, such as International Data Corporation (IDC) now estimate that typical refresh rates have stretched to four and five years. Certainly the technology industry has not seen a significant rise in spending in the last year or two and the general consensus seems to be that there is some pent-up demand among IT managers. Management believes that companies are spreading their refresh schedules over multiple time periods so that we will see only a gradual improvement in technology spending in the next year. Softchoice’s growth is expected to come more from increased market share than from significant increases in technology spending. The exception to the general gradual increase in technology spending is in corporate spending on software for security and storage, which has shown strong growth levels over the last year. Viruses and worms have increased corporate awareness of their vulnerabilities, causing this aggressive growth. Software vendors specializing in security, such as Symantec, Trend Micro and McAfee, have increased revenue over the past year by about 20 percent. Softchoice revenues from these product areas have increased even faster as we take market share for these vendors, and we expect continued double-digit growth for sales of these software products.

Softchoice Corporation 2004 Management’s Discussion and Analysis
15
Strengthening Canadian Dollar There are four areas in which the strength of the Canadian dollar affects our financial results and risk profile:
1. Our net position in U.S.-dollar-denominated assets and liabilities;
2. Transactions where there are two currencies and time lags, or transaction risk;
3. The translation of the results of the U.S. subsidiary, or translation risk; and
4. The erosion of our economic advantage of having operational costs in the Canadian marketplace.
1. U.S.-dollar-denominated assets and liabilities In the Canadian Company there is usually a net liability position of U.S.-dollar-denominated assets and liabilities since the Company’s line of credit is in U.S. dollars. When we expect the Canadian-U.S. exchange rate to fluctuate significantly and when the net position is sizable, Softchoice typically hedges this exposure with forward exchange contracts. This type of contract was in place for the fourth quarter of 2004 in the amount of US$10.5 million, but expired on December 31, 2004. We expect to continue to protect the income exposure from these fluctuations through the use of forward exchange contracts. During 2004, the company benefited with a net foreign exchange gain in this area in the amount of $0.6 million. Future gains are not expected since we will continue to hedge our foreign currency risks, or the U.S. credit facility will be replaced with a Canadian dollar line of credit for the Canadian entity.
2. Transaction risk This type of risk occurs due to currency fluctuations that take place when we buy and sell in different currencies over different time frames. For example, if a Canadian customer buys a product in Canadian dollars but we source the product in U.S. dollars, our margin on the transaction can vary depending on the exchange rate that we assume when we quote the product, when the product is purchased and when we pay for it. Generally, both sides of most transactions are in the same currency so this risk is minimal, but is monitored.
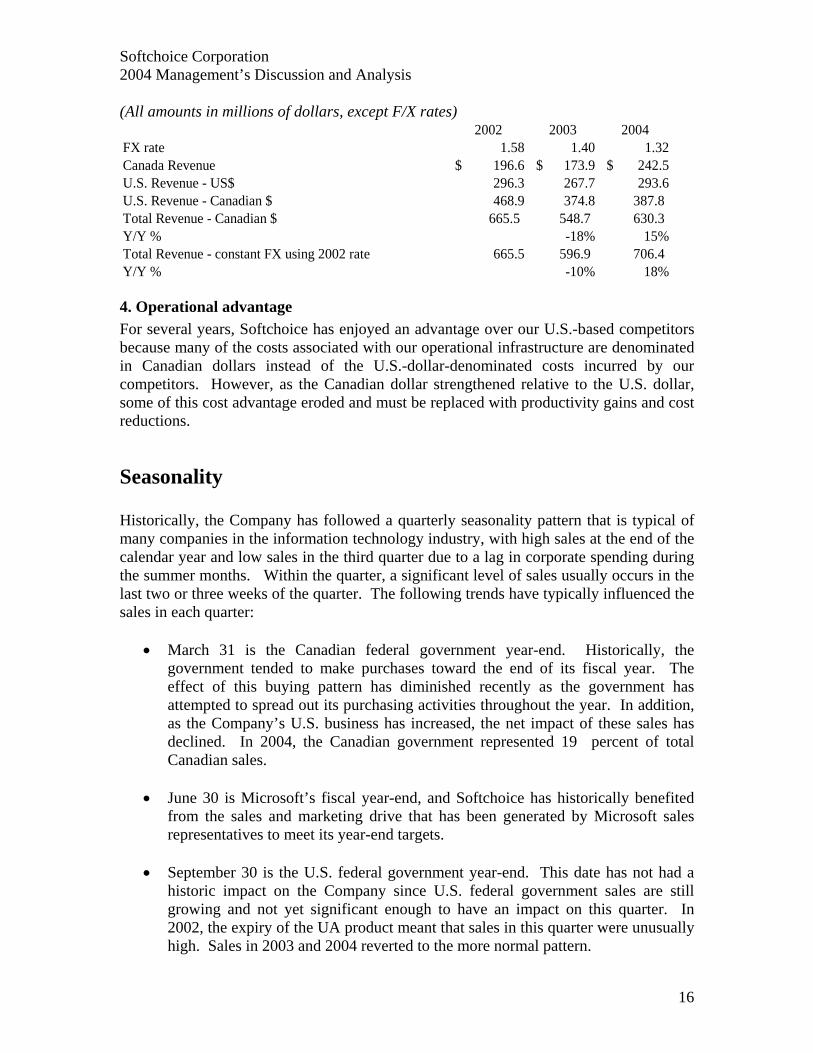
3. Translation risk This occurs when the results of the U.S. subsidiary are translated into Canadian dollars at the average rate for the period. In 2004, the Canadian dollar increased by 7 percent from US$0.71 to US$0.76. Therefore, for U.S. revenues to appear constant over the time period in Canadian dollars, sales in local currency would have had to increase by 7 percent. This has a significant impact on revenue and gross margin levels, but less of an impact on net income since most costs related to a transaction are incurred in the local currency. The chart below summarizes the impact of the strengthening Canadian dollar on reported revenue.
Softchoice Corporation 2004 Management’s Discussion and Analysis
16
(All amounts in millions of dollars, except F/X rates) 2002 2003 2004
FX rate 1.58 1.40 1.32Canada Revenue 196.6$ 173.9$ 242.5$ U.S. Revenue - US$ 296.3 267.7 293.6U.S. Revenue - Canadian $ 468.9 374.8 387.8 Total Revenue - Canadian $ 665.5 548.7 630.3 Y/Y % -18% 15%Total Revenue - constant FX using 2002 rate 665.5 596.9 706.4 Y/Y % -10% 18%
4. Operational advantage For several years, Softchoice has enjoyed an advantage over our U.S.-based competitors because many of the costs associated with our operational infrastructure are denominated in Canadian dollars instead of the U.S.-dollar-denominated costs incurred by our competitors. However, as the Canadian dollar strengthened relative to the U.S. dollar, some of this cost advantage eroded and must be replaced with productivity gains and cost reductions.
Seasonality Historically, the Company has followed a quarterly seasonality pattern that is typical of many companies in the information technology industry, with high sales at the end of the calendar year and low sales in the third quarter due to a lag in corporate spending during the summer months. Within the quarter, a significant level of sales usually occurs in the last two or three weeks of the quarter. The following trends have typically influenced the sales in each quarter:
• March 31 is the Canadian federal government year-end. Historically, the government tended to make purchases toward the end of its fiscal year. The effect of this buying pattern has diminished recently as the government has attempted to spread out its purchasing activities throughout the year. In addition, as the Company’s U.S. business has increased, the net impact of these sales has declined. In 2004, the Canadian government represented 19 percent of total Canadian sales.
• June 30 is Microsoft’s fiscal year-end, and Softchoice has historically benefited
from the sales and marketing drive that has been generated by Microsoft sales representatives to meet its year-end targets.
• September 30 is the U.S. federal government year-end. This date has not had a
historic impact on the Company since U.S. federal government sales are still growing and not yet significant enough to have an impact on this quarter. In 2002, the expiry of the UA product meant that sales in this quarter were unusually high. Sales in 2003 and 2004 reverted to the more normal pattern.
Softchoice Corporation 2004 Management’s Discussion and Analysis
17
• December 31 marks the fiscal year-end of much of corporate North America. Historically there have been increases in software revenue as our customers complete their asset purchases to meet their internal year-end requirements. In the fourth quarters of 2002 and 2003 Softchoice sold Microsoft licenses to the Internal Revenue Service (IRS) for US$29 million per year. In 2004, this contract was not recorded since the renewal slipped into early 2005.
Therefore, net income for the Company has historically been lowest in the third quarter and highest in the fourth quarter.
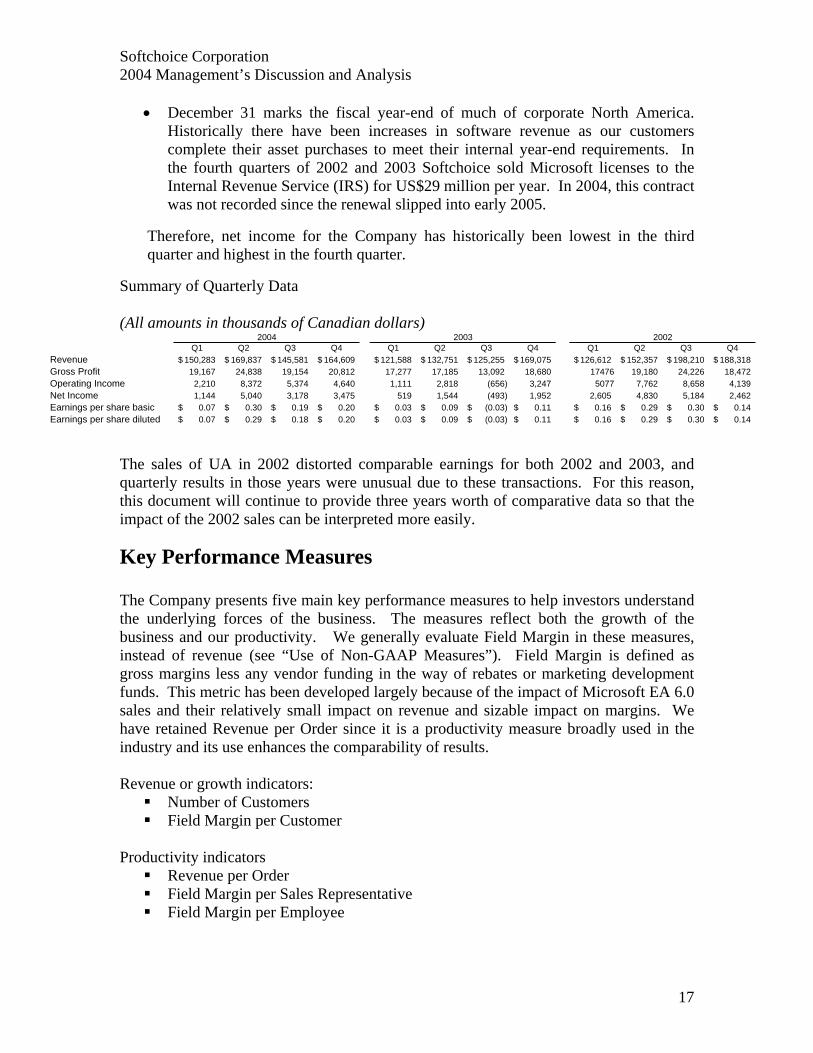
Summary of Quarterly Data (All amounts in thousands of Canadian dollars)
Q1 Q2 Q3 Q4 Q1 Q2 Q3 Q4 Q1 Q2 Q3 Q4Revenue 150,283$ 169,837$ 145,581$ 164,609$ 121,588$ 132,751$ 125,255$ 169,075$ 126,612$ 152,357$ 198,210$ 188,318$ Gross Profit 19,167 24,838 19,154 20,812 17,277 17,185 13,092 18,680 17476 19,180 24,226 18,472 Operating Income 2,210 8,372 5,374 4,640 1,111 2,818 (656) 3,247 5077 7,762 8,658 4,139 Net Income 1,144 5,040 3,178 3,475 519 1,544 (493) 1,952 2,605 4,830 5,184 2,462 Earnings per share basic 0.07$ 0.30$ 0.19$ 0.20$ 0.03$ 0.09$ (0.03)$ 0.11$ 0.16$ 0.29$ 0.30$ 0.14$ Earnings per share diluted 0.07$ 0.29$ 0.18$ 0.20$ 0.03$ 0.09$ (0.03)$ 0.11$ 0.16$ 0.29$ 0.30$ 0.14$
2004 2003 2002
The sales of UA in 2002 distorted comparable earnings for both 2002 and 2003, and quarterly results in those years were unusual due to these transactions. For this reason, this document will continue to provide three years worth of comparative data so that the impact of the 2002 sales can be interpreted more easily.
Key Performance Measures The Company presents five main key performance measures to help investors understand the underlying forces of the business. The measures reflect both the growth of the business and our productivity. We generally evaluate Field Margin in these measures, instead of revenue (see “Use of Non-GAAP Measures”). Field Margin is defined as gross margins less any vendor funding in the way of rebates or marketing development funds. This metric has been developed largely because of the impact of Microsoft EA 6.0 sales and their relatively small impact on revenue and sizable impact on margins. We have retained Revenue per Order since it is a productivity measure broadly used in the industry and its use enhances the comparability of results. Revenue or growth indicators:
Number of Customers Field Margin per Customer
Productivity indicators
Revenue per Order Field Margin per Sales Representative Field Margin per Employee

Softchoice Corporation 2004 Management’s Discussion and Analysis
18
Number of Customers
Softchoice Customers
-
2,000
4,000
6,000
8,000
10,000
12,000
14,000
16,000
1998 1999 2000 2001 2002 2003 2004
Calender Year
Cust
omer
s
Canada U.S. Consolidated
In 2004, the number of customers in Canada grew by 10 percent and in the U.S. by 14 percent. In the fourth quarter of the year, the number of customers in Canada grew by 3 percent and in the U.S. by 8 percent. The increase in customers in 2004 reflects the Company’s focus on the outbound sales team acquiring new customers and the inside sales team retaining existing customers. In 2003, the inside sales account team was strengthened with the goal that these salespeople would focus on customer transactions and improve retention with increased customer contact. The plan also envisaged that the increased support from the inside sales team would free up time for the outbound sales force and allow them to increase their customer acquisition efforts. The results of 2004 are a testament to the success that we have had with this model this year. In both the fourth quarter and the full year, about 27 percent of total customers purchased hardware. This percentage is increasing steadily and is used by the management team as a predictor of potential hardware sales. It is clearly our goal that a majority of customers would purchase both hardware and software products from Softchoice.

Softchoice Corporation 2004 Management’s Discussion and Analysis
19
Field Margin per Customer
Field Margin per Customer
-
1,000
2,000
3,000
4,000
5,000
6,000
1998 1999 2000 2001 2002 2003 2004Calendar Year
Fiel
d M
argi
n pe
r Ac
coun
t
Canada U.S. Consolidated
Following the decline in Field Margin per Customer in 2003, caused by the decline in Microsoft sales as a result of the two-year UA license sales in 2002, Field Margin per Customer has strengthened. Field Margin per Customer in the U.S. continues to rise, and it is now at the same level as that for Canadian customers, after converting the currency. It is management’s belief that the Field Margin for U.S. customers should be equal to or greater than that for Canadian customers, ignoring the currency effect. Generally, as the number of new customers rises, the Field Margin per Customer will fall since a customer’s expenditures with Softchoice tend to rise over time. Canadian Field Margin per Customer has been relatively consistent for the past several years, indicating that the growth in amounts sold to existing customers is offset in roughly equal proportions with lower sales to new customers.

Softchoice Corporation 2004 Management’s Discussion and Analysis
20
Revenue per Order
Revenue per Order
$-
$500
$1,000
$1,500
$2,000
$2,500
$3,000
$3,500
$4,000
$4,500
$5,000
1998 1999 2000 2001 2002 2003 2004Calendar Year
Rev
enue
per
Ord
er
Canada US Consolidated
In Canada, Revenue per Order has increased by 17 percent over 2003, reflecting a number of larger deals in the Canadian marketplace – particularly for IBM product sales to customers. In the U.S., Revenue per Order has declined by 12.5 percent, reflecting the strength of the EA 6.0 sales into that market. Revenue per Order is expected to decline gradually over time as the proportion of hardware orders increases. Average hardware orders are smaller than software license orders, and therefore an increase in hardware sales will reduce the average overall size of the order. This measure is monitored by management because it reflects the number of operational staff required to service the revenue. Field Margin per Sales Representative
Field Margin per Sales Representative
$-
$50,000
$100,000
$150,000
$200,000
$250,000
$300,000
$350,000
1998 1999 2000 2001 2002 2003 2004
Calendar Year
Fiel
d M
argi
n ($
)
GP/Rep

Softchoice Corporation 2004 Management’s Discussion and Analysis
21
Field Margin per Sales Representative shows a steady increase in productivity after smoothing the unusual activities of 2002 and 2003 (see “Microsoft and Softchoice”). In 2002, many customers purchased two years of Microsoft products in one year and then exited the market for 2003. Field Margin per Employee
Field Margin per Employee
$-
$20,000
$40,000
$60,000
$80,000
$100,000
$120,000
$140,000
$160,000
1998 1999 2000 2001 2002 2003 2004
Calendar Year
Fied
l mar
gin
($)
The average number of employees in 2004 was 450, compared to an average in 2003 of 463. The increase in Field Margin per Employee reflects the continued focus on efficiency, productivity improvement and systems improvement. It is this increased productivity that accounts for the reduction in expenses as a percentage of Field Margin or Imputed Revenue. In 2005, we intend to increase inside sales staff again in an effort to increase the number of active customers. Since it will take a period of time for the field margin from these new customers to grow, management expects that Field Margin per Sales Employee and Field Margin per Employee will decline in 2005. As these new customers increase the amount that they buy from us, this productivity metric is expected to improve.
Resources We rely on three main resources to deliver continued growth and value to shareholders: 1. People Continued growth is dependent upon improved employee retention and continued employee development. In selecting and managing people, it is Softchoice’s practice to:
• Recruit recent university graduates;

Softchoice Corporation 2004 Management’s Discussion and Analysis
22
• Provide significant levels of ongoing training and performance-based advancement opportunities;
• Apply rigorous coaching to meet clearly defined performance standards; and • Provide incentives for sales productivity and order-process efficiency.
Softchoice management believes that encouraging our employees to develop their full potential will ensure the continued growth of the Company. During the year, we hired a new Director of Human Resources with a mandate to increase the emphasis on training of all kinds, reduce employee attrition and improve the recruiting process. 2. Information Systems We believe that leading-edge information technologies provide Softchoice with a cost advantage in a highly competitive market. The productivity capabilities created by Softchoice’s IT infrastructure also contribute to improved levels of customer service. These systems integrate and automate processes across all areas of the Company. Advances in these systems are outlined in “Growth Strategies – Expand our infrastructure,” above. 3. Financial Resources
On May 15, 2002, the Company went public by means of a reverse takeover (RTO) through an amalgamation with Ukraine Enterprise Corporation (UEC). The Company’s common shares began trading on the TSX Venture Exchange under the stock symbol “SO” on June 17, 2002. The amalgamated company adopted the name and continued the business of Softchoice. On October 1, 2002, the Company’s stock moved its listing from the TSX Venture Exchange to the Toronto Stock Exchange. This series of steps provided Softchoice with the flexibility to access public capital markets.
To expand and finance ongoing growth initiatives, a credit facility of US$30 million is available to the Company through a major U.S. bank. A total of US$2.6 million of this balance was drawn at the end of the year. This credit facility is available until March 31, 2005. As at the date of this MD&A, management is renegotiating the credit facility for the purpose of extending its term once again. We do not anticipate any difficulties or increased costs related to the extension of this line. Management anticipates that the available cash and bank credit facilities will be sufficient to meet the Company’s currently planned operating, capital and investing activities for at least the next 12 months. There can be no assurance that these funds will be sufficient to satisfy Softchoice's ongoing requirements. In addition, the continuing availability of funds under Softchoice's credit facilities is subject to the terms and conditions of Softchoice's credit agreements. To the extent that opportunities arise to acquire or invest in complementary businesses, Softchoice may fund such acquisitions or investments through additional equity or debt financing, if available on acceptable terms.
A foreign exchange contract facility is also available to the Company. When appropriate, this facility is used to purchase foreign exchange futures to protect the Company from

Softchoice Corporation 2004 Management’s Discussion and Analysis
23
fluctuations in the Canadian-U.S. dollar exchange rate. A forward contract for US$10.5 million expired on December 31, 2004.
Critical Accounting Policies The Company’s accounting policies are described in the “Notes to the Consolidated Financial Statements.” These policies are subject to management’s judgment in several areas, including the allowance for doubtful accounts, sales returns allowances, the accrual for rebates earned in the period and various other reserves and accruals for costs incurred in the period. In all cases, these areas of judgment represent management’s best estimate. These judgmental areas are similar for most businesses in this industry and should not expose the shareholders to unusual or unexpected trends. In particular, the Company’s accounts receivable are not concentrated in any specific industry, and the top 10 customers in 2004 accounted for 13 percent of total revenues. The Company recognizes revenue when the products are shipped to a customer or when the customer acquires the right to use or copy software under a license agreement. Management estimates the level of returns of product that would normally occur after the end of the period using historical trends to predict future levels of returns. The Company recognizes revenue on a gross basis rather than a net basis. This revenue recognition policy means that we recognize as revenue the total cost of the product sold and invoiced to our customer and we recognize our cost from the publisher or manufacturer as cost of sales. There are three distinct reasons to support this treatment:
1. Softchoice incurs the risk of physical inventory loss once the customer has placed the order with us and we have placed the purchase order with the supplier.
2. Softchoice establishes pricing with its customers.
3. Softchoice incurs the credit risk on its accounts receivable once the product has been shipped.
If we were to record revenue on a net basis, after deducting the cost of the product, the financial statements would indicate revenue at much lower levels, but there would be no impact on net income or earnings per share. The recognition of gross revenue is consistent with the Company’s public competitors.
The exception to the recognition of revenue on a gross basis is for Microsoft EA 6.0 license agreements. In this instance, Microsoft sells the software directly to the end user and pays Softchoice an agency fee, or commission. In this case, Softchoice does not incur credit risk and it does not have a direct contractual relationship with the customer.

Softchoice Corporation 2004 Management’s Discussion and Analysis
24
Changes in Accounting Policies Accounting for Stock-Based Compensation In September 2003, the Canadian Institute of Chartered Accountants (CICA) released adjustments to accounting standard 3870, Stock-Based Compensation and Other Stock-Based Payments. This standard requires companies to include the cost of granting stock options to employees in the statement of earnings as compensation expense. The standard provides guidance as to how these expenses are to be measured and calculated. Softchoice elected to adopt the standard in the first quarter of 2004 and to retroactively restate the comparable periods in the prior year. The additional expense for 2004 was $0.2 million. Expenses in 2003 were restated by $0.5 million, and therefore net income for the prior year was decreased from $4.0 million to $3.5 million. Asset Retirement Obligations and the Impairment of Long-Lived Assets Effective January 1, 2004 the Company adopted the CICA standards for asset retirement obligations and impairment of long-lived assets. The asset retirement obligation standard requires that the Company estimate any costs that it might incur at the end of the life of the asset. The specific application to Softchoice is when there are requirements in our leases that the facility be returned to its original condition. We have made estimates of our obligations under these leases and they are not material. The impairment of long-lived assets standard requires that the carrying value of the asset be written down if that amount exceeds the projected undiscounted future cash flows expected from its use. The Company has determined that the adoption of this standard has no impact on the carrying value of its long-lived assets.
Critical Accounting Estimates Financial statements prepared in accordance with Canadian generally accepted accounting principles (“GAAP”) require us to make estimates and assumptions that affect the reported amount of assets and liabilities at the date of the financial statements, disclosure of contingent assets and liabilities and reported amounts of revenue and expenses during the reporting period. Significant accounting policies and methods used in preparation of the financial statements are described in Note 2 to the consolidated financial statements. We evaluate our estimates and assumptions on a regular basis, based on historical experience and other relevant factors. Included in our consolidated financial statements are estimates used in determining doubtful accounts, sales returns allowances and rebates receivable. These estimates are made with management’s best judgment given the information available at the time and as much relevant historical data as is available. Actual results could differ from these estimates and assumptions. At the date of this report, Softchoice did not have any contingent liabilities or large or unusual reserve items that would expose these financial statements to unusual risk regarding estimates.

Softchoice Corporation 2004 Management’s Discussion and Analysis
25
Use of Non-GAAP Measures In this MD&A two non-GAAP measures are used from time to time: Imputed Revenue and Field Margins. Neither of these measures has any standardized meaning under GAAP and is therefore unlikely to be comparable to similar measures by other users. In both cases, we believe that a reconciliation between the non-GAAP measure and the GAAP measure is clearly evident each time the term is used throughout this document.
Imputed Revenue is defined as the price paid by the customer to Microsoft for EA 6.0 license agreements that are transacted with Softchoice sales representatives (see “Microsoft and Softchoice”). Microsoft pays Softchoice an agency fee or commission on this particular license type, and therefore Softchoice does not record the total revenue for this transaction. Imputed Revenue allows for better comparability between fiscal periods since an increase in the product mix of EA 6.0s would make it appear that Softchoice is selling less, when that would not be the case. This measure is not likely to be used by any competitors in the industry for two reasons:
1. Public competitors all sell hardware as well as software and typically, software revenue is only about 20 percent of total revenue. The impact of the EA 6.0 license is therefore much less significant.
2. Softchoice has sold a greater portion of EA 6.0 license agreements than our competitors since we believe that the agreement often provides a more cost-effective solution for our customers, particularly in the SMB market.
Field Margins are defined as gross margins without the impact of funding received from vendors, either in the form of rebates or marketing funding.
Financial Statement Analysis Revenue Revenue for the year was $630,310 - an increase of 14.9 percent from the revenue of $548,669 reported in 2003. There are several factors that affected the revenue growth:
• The impact of Microsoft customers who purchased two years of UA product in 2002 and returned to the market in 2004;
• The increases in revenue from hardware sales and sales of other software products, primarily in the areas of security and storage;
• The increased mix of EA 6.0 sales; and • The strengthening of the Canadian dollar relative to the U.S. dollar.

Softchoice Corporation 2004 Management’s Discussion and Analysis
26
The table below outlines the impact of the Canadian dollar and the EA 6.0 fees over the last three years.
(In thousands of Canadian dollars) 2002 2003 2004 Reported Revenue $ 665,487 $ 548,669 $ 630,310 Agency Fees (7,048) (11,420) (23,374) Imputed Revenue 75,400 138,414 261,670 Canadian Dollar - 61,533 115,102 Total Imputed Revenue, Adjusted to 2002 Exchange Rates $ 733,839 $ 737,196 $ 983,708
*Agency fees are included in reported revenue. The Canadian dollar impact is calculated on Total Imputed Revenue.
When the comparative results are adjusted for the strengthening Canadian dollar and the impact of Imputed Revenue, the result is relatively flat on a year-over-year basis in 2003 and increased by 33 percent in 2004. All analysis below will deal with the variance in reported revenue only. Management analyzes revenue growth in the following ways:
• By number of customers and revenue per customer (outlined above); • By transaction size: Big Deals versus Run Rate; and • By product mix: hardware, Microsoft software, EA 6.0 and other software.
Transaction Size Big Deals are defined by the Company as any transaction of more than $10,000 in local currency. Run Rate transactions are defined as all other revenue. In Canada, the revenue increase for the year, compared with the previous 12-month period, was 39 percent, reflecting increases of 21 percent in Run Rate and 47 percent in Big Deal revenue. The increase in Run Rate business is largely due to sales of hardware products. The increase in Big Deals is primarily due to large sales of IBM software. For the 12-month period, reported revenue in the U.S. increased by 10 percent comprising increases of 30 percent in Run Rate revenue and 1 percent in Big Deal revenue. As in Canada, the growth in Run Rate business is largely due to the sale of hardware products. The flat nature of the Big Deal revenue reflects the product switch of enterprise customers from Select Microsoft license purchases to EA 6.0 purchases. The Select purchases would have been Big Deals in prior years but are replaced with agency fees this year.

Softchoice Corporation 2004 Management’s Discussion and Analysis
27
Product Mix
Hardware Sales In the fourth quarter of 2002, Softchoice began the sale of hardware products to its customers. The table below outlines the growth in revenue in the new product line.
2002 2003 2004 Hardware Revenue 1.2 40.3 85.9 Growth 3,258% 113% % of Total Revenue 7.3% 13.6%
In addition, more than 27 percent of the Company’s customers have purchased hardware products from the Company this year.
Microsoft Sales ( See “Microsoft and Softchoice” for definitions of license types.) Softchoice sales of Microsoft products, excluding EA 6.0 licenses, increased in Canada by $24.1 million or 29 percent, and decreased in the U.S. by US$18.5 million, or 12 percent, on a year-over-year bases. On a consolidated basis these sales decreased by $12.7 million, or 4 percent. This decline is due to the product switch in Microsoft products since fees from EA 6.0 sales doubled in Canada and increased by 119 percent in the U.S. The sales of other Microsoft products are the product lines that historically have generated the rebates recorded by the Company.
Sales of Other Software Sales of other software include products by such publishers as Symantec, MacAfee (or NAI), Adobe, Novell, IBM, etc. Sales of these products rose by $35.0 million, or 50 percent, in Canada; $17.9 million, or 23 percent, in the U.S. and $52.5 million, or 30 percent, on a consolidated basis. In Canada, growth was partially due to large sales of IBM software. In both countries, the increased focus on security has had an impact on these software sales. In 2005, IBM has announced its intention of selling large enterprise software packages directly to the customer, and therefore Canadian sales of other software will decline or remain flat as the growth of security and storage sales will have to compensate for the loss in IBM revenue. The impact on margins will be less relevant since the large IBM software sales are made at margins that are much lower than most other software sales.
Softchoice Corporation 2004 Management’s Discussion and Analysis
28
Gross Margin
Gross margins include reductions in product costs due to volume rebates and marketing development funds earned in the period. Field Margins are defined as the gross margin earned before considering the impact of rebates and other payments from vendors. Gross margins for the year ended December 31, 2004, were 13.3 percent compared to 12.1 percent for the year ended December 31, 2003. The increase in gross margins is due to the increase in Field Margins outlined below.
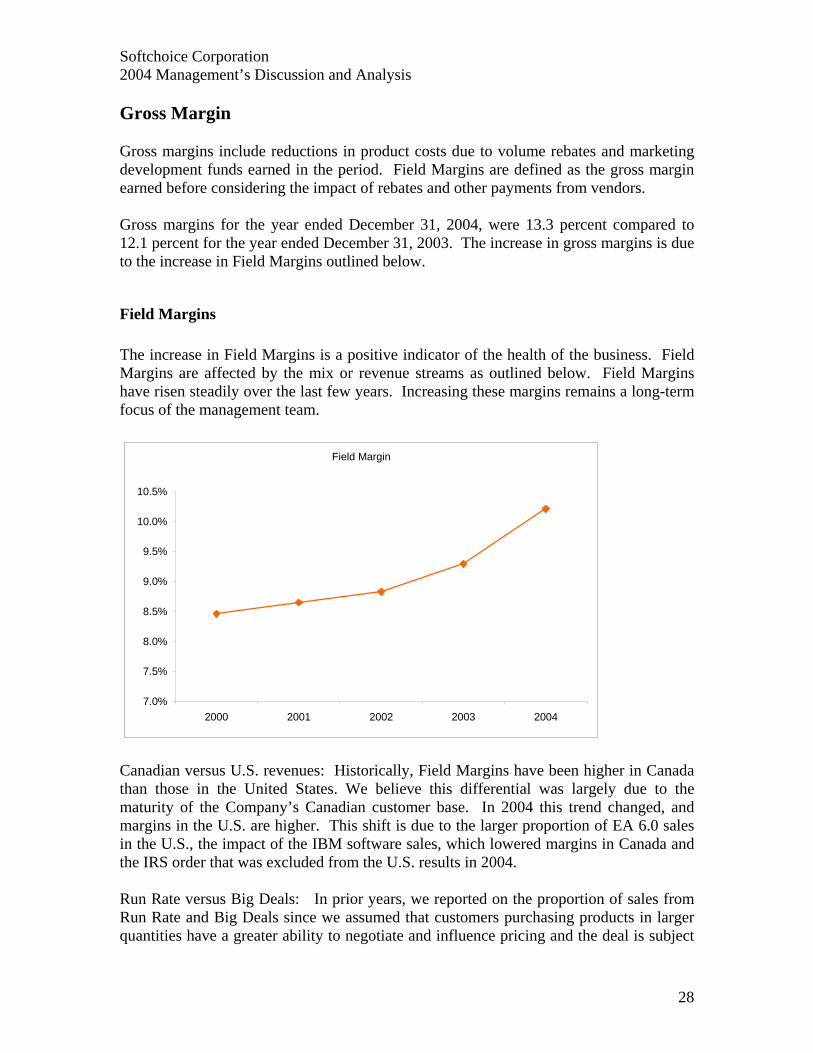
Field Margins The increase in Field Margins is a positive indicator of the health of the business. Field Margins are affected by the mix or revenue streams as outlined below. Field Margins have risen steadily over the last few years. Increasing these margins remains a long-term focus of the management team.
Field Margin
7.0%
7.5%
8.0%
8.5%
9.0%
9.5%
10.0%
10.5%
2000 2001 2002 2003 2004
Canadian versus U.S. revenues: Historically, Field Margins have been higher in Canada than those in the United States. We believe this differential was largely due to the maturity of the Company’s Canadian customer base. In 2004 this trend changed, and margins in the U.S. are higher. This shift is due to the larger proportion of EA 6.0 sales in the U.S., the impact of the IBM software sales, which lowered margins in Canada and the IRS order that was excluded from the U.S. results in 2004. Run Rate versus Big Deals: In prior years, we reported on the proportion of sales from Run Rate and Big Deals since we assumed that customers purchasing products in larger quantities have a greater ability to negotiate and influence pricing and the deal is subject

Softchoice Corporation 2004 Management’s Discussion and Analysis
29
to greater competitive pressures. This analysis has become much less relevant since Run Rate revenue and Run Rate revenue growth reflect the increased focus on hardware sales. Most hardware sales become Run Rate revenue since customers generally prefer to receive their hardware orders in smaller delivery units and larger orders are therefore split into smaller ones. Run Rate margin therefore no longer reflects customers’ ability to negotiate and, as a result, this analysis is less relevant than it used to be. Microsoft EA 6.0 licenses: The sale of these products returns a Field Margin of 100 percent since the Company receives only an agency fee on the sale of these products. As these sales increase, the overall gross margin will also increase. Approximately 36 percent of the Field Margin this year was derived from Microsoft EA 6.0 fees, compared to 22 percent in the previous year.
Rebates and Marketing Development Funds Gross margins are increased by vendor financing received in the form of rebates and marketing development funds (“MDF”). Rebates for the year increased by $3.8 million from 2.0 percent of revenue last year to 2.3 percent of revenue this year. Throughout most of 2003, Softchoice achieved minimum rebate threshold levels and therefore only qualified for reduced rebate payments. In 2004, we achieved a higher proportion of the rebate quota set by Microsoft and therefore the rebate achievement was also higher. In 2002, rebates were 3 percent of revenue. Although reported revenue levels for 2002 and 2004 are comparable (and Total Imputed Revenue grew by 18 percent over 2002) rebate achievement in 2004 was about $6 million below that of 2002. EA 6.0 license sales do not qualify for rebates, so as the revenue mix continues to migrate to a larger percentage of EA 6.0 licenses, rebates as a percentage of revenue will continue to fall. In addition, as Microsoft revenue decreases as a percentage of total revenue (even though it is expected to increase in dollar terms), rebates as a percentage of total revenue will continue to decrease as well. The decrease in rebates as a percentage of revenue is expected to be offset by the impact of EA 6.0 sales, so that the overall effect on gross margins is mitigated. As a result, gross margin levels are expected to remain relatively stable over the next year. MDF are provided by vendors to fund certain marketing activities such as advertising or direct mail campaigns and training sessions. Prior to 2003, these costs were netted against the sales and marketing expenses that the funds were raised to support. For 2003 and 2004, MDF are recorded as a reduction of cost of sales. MDF increased by 20 percent over the prior year. Hardware vendors generally provide more MDF than do software vendors; therefore our MDF as a proportion of revenue is lower than that for our competitors who sell a greater portion of hardware than we do. Our MDF revenues are likely to rise both in dollars and as a percentage of revenue as our hardware revenues increase.

Softchoice Corporation 2004 Management’s Discussion and Analysis
30
Expenses Expenses in 2004 have increased by $3.6 million or 6.1 percent. This increase includes the write-down of software that the Company took in the first quarter of 2004. The strengthening of the Canadian dollar over the year means that U.S. expenses translated into Canadian dollars are below what they would have been a year ago. The impact of the stronger Canadian dollar is to reduce expenses by $1.1 million. (thousands of Canadian dollars)
$ % of Field Margin
$ % of Field Margin
Salaries and benefits 37,828 58.8% 35,059 68.6%Selling, general and administrative 20,562 32.0% 19,418 38.0%Amortization of property plant and equipment 3,525 5.5% 4,394 8.6%Amortization of intangible assets 215 0.3% 855 1.7%Write-down of software 1,247 1.9% - 0.0%
63,377 98.6% 59,726 116.9%
2004 2003
If expenses exceed the Field Margin, then the profit of the company is solely determined by the strength of the rebate achievement. Since rebate terms can change with little notice and involvement by the Company, we believe that it is important to manage our cost base below the Field Margin level. This use of expense as a percent of Field Margin also eliminates any distortion in the expense analysis that might have been caused by the product switch to EA 6.0. We also analyze expenses as a percentage of Imputed Revenue to eliminate the impact of EA 6.0 sales and to provide data that are more comparable to our competitors. In 2004, expenses as a percentage of Total Imputed Revenue fell from 8.8 percent in 2003 to 7.3 percent. We believe that the improvement in this expense ratio reflects the productivity improvements that have been achieved as a result of our Inside Sales Account Managers. In 2003, we introduced this new position within our call centres. These inside sales representatives provide dedicated sales support to the customer and work closely with the outbound sales force. We believe that this structure enhances the strength of the local field sales team while driving a more cost-effective model when transactional support is managed by the call centre.
Salaries and Benefits Salaries and benefits increased in the year by $2.8 million, or 7.9 percent. This increase includes a foreign exchange reduction of $1.2 million. In constant dollars, salaries and benefits increased by $4.0 million. The year-over-year impact includes the expenses for stock options that are reflected in both periods.

Softchoice Corporation 2004 Management’s Discussion and Analysis
31
Total compensation in Canada increased by $1.5 million, including increases of $2.0 million in bonuses and commissions paid. These increases reflect the improved results for the year compared to 2003. Canadian costs also include $0.2 million in stock option expenses. These increases were offset by reductions in salaries by about $0.8 million and other small increases. The number of employees in Canada at the end of the year was 276, compared to 259 at the end of 2003. Total compensation in the U.S. increased by US$ 2.2 million or 17 percent. Of this increase, $1.9 million is accounted for by sales commissions paid as a result of the improved performance of the company in 2004. There were 187 employees in the U.S. at the end of the year compared to 177 at the end of 2003.
Selling, General and Administrative Expenses Selling, general and administrative expenses (“SG&A”) have increased in the year by $0.9 million or 4.8 percent. This increase includes a foreign exchange reduction of $0.7 million. In constant dollars, SG&A expenses increased by $1.6 million. SG&A costs also include MDF costs and foreign exchange gains. The table below outlines these component costs. Thousands of Canadian $ 2004 2003 SG&A $ 18,007 $17,169 MDF 3,112 2,930 Foreign Exchange Gains (557) (681)
$ 20,562 $19,418 SG&A costs increased in Canada by $0.6 million compared to the prior year. This balance is a combination of increases in rent expense, bank fees, credit card processing fees and insurance costs, offset by declines in bad debt expense, repair costs and other miscellaneous expenses. Credit card fees are expected to continue to increase in future years as a greater proportion of hardware customers conduct their purchases with credit cards compared to software customers. In general, the Company prefers to sell to customers with credit terms because the cost of the credit card fees outweighs the savings on bad debt costs and the increased speed of the cash collection cycle. SG&A costs in the U.S. increased by $0.7 million, reflecting increases in bad debt costs and credit card fees. MDF costs are those expenses that we incur to provide the marketing services to vendors. These costs increased by $0.2 million and are offset by increases in MDF of $0.8 million. Foreign exchange gains were realized in both 2003 and 2004 on U.S.-denominated-debt in the Canadian company. Generally these gains are hedged and are not expected in future years. The gains realized in 2004 were $0.1 million lower than those in the prior year.

Softchoice Corporation 2004 Management’s Discussion and Analysis
32
Amortization of Property, Plant and Equipment Amortization of property, plant and equipment decreased by $0.9 million or 20 percent. This decrease is primarily caused by the decline in assets purchased in the year and the aging of some of the computer equipment. Like many of our customers, we continue to use our computer equipment beyond its original expected life. Capital expenditures will increase over the next few years as we replace some of the older equipment.
Amortization of Intangible Assets The intangible assets arose upon the acquisition of Beyond.com in 2002. The intangibles were related to specific contracts that had almost run their course by the end of 2004. The $0.1 million remaining on the balance sheet is expected to be fully amortized by the end of the second quarter of 2005. The goodwill on the balance sheet can be identified as follows: Purchase price of the U.S. subsidiary $7,853 Goodwill arising on the purchase of Beyond.com 3,141 Impact of foreign exchange, 2003 (334) Impact of foreign exchange, 2004 (327) Balance as at December 31, 2004 $10,333 In 2000, the U.S. subsidiary was 90 percent owned by the Canadian parent. Over 2001 and 2002, the Company purchased the remaining 10 percent of the shares in exchange for common shares of the Canadian parent. The purchase consideration for these step acquisitions was determined using the fair market value of the Softchoice common shares given as purchase consideration. As the liabilities acquired were in excess of the assets acquired, the full amount of the purchase consideration was allocated to goodwill. Goodwill balances related to Beyond.com’s Government Systems Group and the U.S. subsidiary are examined at the end of each reporting period for any deterioration in the value of the underlying business. As at December 31, 2004, management believes that no such deterioration exists.
Write-Down of Software In the first quarter of 2004, the Company wrote off software costs in the amount of $1.2 million. In 2002 Softchoice purchased licenses to use an Oracle ERP system to replace the legacy system designed for the Company. We implemented the human resources and finance modules. In 2003, we conducted a study to identify the modifications required for the remaining ERP modules to ensure that legacy functionality was not lost but improved upon. In January, 2004 the Company hired a new Chief Information Officer with experience with the Oracle ERP. In his view, the legacy system is more suited to our business than the ERP system, and he has recommended smaller modifications to the legacy system to enhance its functionality rather than the implementation of a new

Softchoice Corporation 2004 Management’s Discussion and Analysis
33
system. This approach will be less disruptive and less risky than the implementation of a new system. Accordingly, in the first quarter, we abandoned the implementation of the remaining modules of the ERP and have therefore written off the costs of both the license and the study regarding its implementation. The incremental modifications that have been made over the year to the legacy system are described above in “Growth Strategy – Expand our infrastructure.” Operating Income Operating income has increased to 3.2 percent of total revenues from 1.2 percent in the prior year. This increase in profitability reflects the return of Microsoft customers to the market place and the introduction of hardware sales as well as the productivity enhancements that the Company has made over the last two years. Interest expense declined compared to the prior year as the Company generated profits and cash and reduced its reliance on the credit facility. Other income includes a gain on the realization of an amount receivable from Electron Bank JSC in the amount of $0.5 million. This receivable was acquired by the Company as part of the reverse takeover transaction completed in 2002. The receivable had been discounted by the Company due to potential collection risks. This balance has now been collected in full and no further amount remains receivable. Earnings Earnings for the year of $12.8 million have increased significantly from the earnings of $3.5 million reported for the 12-month period ended December 31, 2003. The Company’s income is fully taxable in both Canada and the U.S. Tax rates in Canada are about 36 percent and in the U.S. are about 39 percent. A larger portion of the Company’s taxable income is earned in the United States and is therefore taxed at the higher rates. The weighted average tax rate would normally be 38.5 percent but has been reduced by the gain on the amount receivable from the Electron bank that was recorded in the third quarter and some additional deductions available in the U.S.

Softchoice Corporation 2004 Management’s Discussion and Analysis
34
Fourth Quarter (thousands of Canadian dollars)
$ % $ %Revenue 164,609 169,075 Gross Profit 20,812 12.6% 18,618 11.0%
Expenses Salaries and benefits 9,675 5.9% 8,571 5.1% Selling, general and administrative 5,624 3.4% 5,294 3.1% Amortization of property, plant and equipment 821 0.5% 984 0.6% Amortization of goodwill 52 0.0% 598 0.4%
16,172 9.8% 15,447 9.1%
Operating Income 4,640 2.8% 3,171 1.9%Earnings before taxes 4,769 2.9% 3,132 1.9%Net Income for the period 3,475 2.1% 1,953 1.2%EPS 0.20$ 0.11$
2004 2003
The revenue in the quarter declined compared to the prior year due to the slippage of the IRS contract to January 2005 in the amount of US$29 million. When these results are adjusted for the strengthening Canadian dollar and the impact of Imputed Revenue, revenues for the quarter grew by 14.4 percent. (See “Use of Non- GAAP measures.”) Hardware revenue was $26.8 million, or 16.3 percent, of total revenue for the quarter.
2004 2003Reported Revenue 164,609$ 169,075$ Agency Fees (5,899) (3,227)Imputed Revenue 60,407 33,630 Canadian Dollar 9,020 - Total 228,137$ 199,478$ Field Margins in Canada increased by $1.7 million, or 44 percent. Field Margins in the U.S. grew by $1.4 million, or 19 percent. The increase in Canada reflects the overall strength of the business and some large orders for IBM software. Rebates in the fourth quarter declined by about $0.6 million compared to the same period in the prior year. This decline reflects the continued shift of product sales away from Microsoft Select licenses toward EA 6.0 licenses. Expenses during the quarter increased by $0.7 million or 4.7 percent, over the same period in the prior year. This increase includes a foreign exchange reduction of $1.3 million. In constant dollars, expenses increased by $2.0. Expenses in Canada increased by $0.4 million, primarily in commissions and bonuses paid; SG&A costs in Canada increased by $0.4 million over the fourth quarter of 2003, primarily as a result of increased rent expenses. Expenses in the U.S. increased by US$0.9 million, or 12 percent. These increases reflect higher compensation costs in commission and bonus payments and slightly higher bad debt costs. These increases are offset by a reduction in

Softchoice Corporation 2004 Management’s Discussion and Analysis
35
amortization of intangibles of US$0.4 million. The amortization of the contracts acquired with the Beyond.com assets was reduced due to the expiration of the acquired contracts. This amortization will be nominal in the first half of 2005 as these intangible balances are fully amortized.
Liquidity and Capital Resources The Company has available to it a credit facility of US$30 million with availability under this facility subject to a formula based on eligible accounts receivable. The interest charged on the facility fluctuates with the bank prime rate, plus or minus 0.5 percent. The term of the facility expires on March 31, 2005. We expect this facility to be renewed prior to that date without significant changes to the terms of the facility. The Company’s cash and loan balances fluctuate dramatically during a typical month, with the cycle of vendor payments concentrated at month-end. At the end of the year, the Company had outstanding $2.6 million of the available US$30 million credit facility. Additional needs for cash are not foreseen by management, and the Company has no immediate plans to raise capital in the equity markets. Accounts receivable balances reflect days sales outstanding (DSO) of 43 days as at December 31, 2004, compared with 45 days outstanding as at December 31, 2003. In a typical quarter, a larger percentage of sales for the quarter are recognized in the last two weeks of the quarter. This causes DSO to decline at month-end and quarter-end, compared with the rest of the intervening periods. Days payable outstanding (DPO) decreased in 2004 from 51 days to 45 days. Payables to Microsoft typically lag other payables by up to 15 days due to our payment terms with Microsoft. As Microsoft sales decline as a percentage of overall revenue, the positive influence on DPO will also decline. In previous years, the Company has been able to cite the positive gap between payables and receivables as evidence that the Company could continue to expand without the need of additional capital to finance working capital. This gap has narrowed, but during 2004 we were able to maintain an average gap of two days between payables and receivables. Management expects this spread to be maintained, but there is no assurance that days payable will not continue to decline and put capital pressure on the Company’s forecasted growth. Management believes that the existing credit facility will be sufficient to handle increases in cash requirements caused by these changes. Softchoice earns revenue and incurs expenses in U.S. dollars in its U.S. subsidiary and in Canadian dollars in the parent Company. The expansion costs in the U.S. have been financed by U.S.-dollar-denominated debt, thereby reducing Softchoice's exposure to foreign exchange losses on this debt. Softchoice has available to it a foreign exchange facility of $4 million. This facility is used to purchase foreign currency forward contracts to protect the Company against currency fluctuations on U.S.-dollar-denominated assets and liabilities and against transaction risk when appropriate. During the fourth quarter of 2004, the Company purchased a U.S. dollar forward contract in the amount of $10.5 million to protect the value of U.S.-dollar-denominated assets and liabilities. The

Softchoice Corporation 2004 Management’s Discussion and Analysis
36
contract expired at the end of December 2004. Management will continue to use such financial instruments when appropriate.
Softchoice has the following contractual obligations outstanding as at the end of December 2004.
Contractual Obligations
(In thousands of Canadian dollars.) Less than 1 year 1-3 years After 4 years
Operating Leases $ 3,812 $7,141 $5,458
The Company has no long-term debt, capital lease obligations, purchase obligations or off-balance-sheet arrangements. Annual expenditures on capital assets were $1.6 million in the year compared with $5.4 million in 2003. On the recommendation of our new Chief Information Officer, who started with the Company early in 2004, the Company put a moratorium on capital expenditures as he evaluated the system and our future requirements. This evaluation is now complete, and expenditure levels are expected to climb in 2005.
The 2003 balance sheet included an amount receivable from Electron Bank JSC that was due to be paid on January 31, 2004. This receivable was acquired by the Company as part of the reverse takeover completed in 2002. Notes receivable also includes a receivable from a customer that is due in January 2005.
Share Capital In 2003, the Company initiated a normal course issuer bid and purchased shares for cancellation in the marketplace. A total of 13,000 shares were repurchased by the Company during 2004. In addition, a number of employees have stock options outstanding totalling 606,394 options that are exercisable into common shares for prices ranging between $2.50 and $8.10. Of these options 482,245 were vested as of December 31, 2004. During 2004, 32,416 options were exercised. Total shares outstanding at the end of the year were 17,098,879. The total shares outstanding as of January 31, 2005 were 17,101,237. The continuity of shares and an explanation of the weighted average number of common shares outstanding in the year are included in note 10 to the consolidated financial statements.
Facilities Softchoice has 32 offices in North America with operating leases that run between three and 10 years in length. The Company is obligated to make future minimum annual lease payments under operating leases for office equipment and premises as follows:

Softchoice Corporation 2004 Management’s Discussion and Analysis
37
Operating Lease Commitment Schedule
Amount 2005 $ 3,812 2006 3,517 2007 3,624 2008 3,148 2009 2,310
Thereafter 1,539 Total $ 17,950
Cash Flow During the year ended December 31, 2004, cash on hand increased by $1.2 million to $8.1 million. In addition, the Company reduced its borrowings under the credit facility in the amount of $9.9 million. These changes reflect cash available from operations in the amount of $11.8 million. As long as the Company is in a net borrowing position, it is our practice to minimize cash balances as much as is practical. This objective is balanced by the need to have available cash in both U.S. and Canadian currencies to meet short-term payment obligations.
Related-Party Transactions There were no related-party transactions in the year with the exception of directors fees paid to directors who are also shareholders of the Company in connection with their remuneration as directors.
Risks The identification and management of risk is the overall responsibility of management, reporting to the Audit Committee. The mandate of the Audit Committee gives it specific responsibility to review, at least annually, significant risk-management strategies and exposure. At this time, the Company does not follow a specific risk model, but rather includes risk-management analysis in all levels of strategic and operational planning. Management has identified the risks below as those specific risks to the Company in the upcoming year. Dependence Upon Microsoft For the year ended December 31, 2004, 59 percent of the Company’s gross profits were of Microsoft products, compared with 67 percent for the previous year. A loss or significant change to the relationship with Microsoft could have a materially adverse effect upon the Company.

Softchoice Corporation 2004 Management’s Discussion and Analysis
38
Hardware Initiative
In the second half of 2002, we began selling hardware to our customers. During 2003 and 2004 we made significant progress in understanding and implementing the many different requirements of this business segment. The risks from the introduction of this line of business are significantly reduced from the position the Company was in at the beginning of the venture. However, there remain several areas of risk in this initiative. Operational risk: The logistics of selling hardware, including freight charges, returns management and fraud protection are complex operational considerations that do not exist in the software sales business. There is no assurance that the Company will be able to identify and manage these risks on a timely basis. The Company has enlisted the support and assistance of several distribution partners to reduce its exposure in this area. Financial risk: Hardware pricing, manufacturer relations, promotional pricing and rebate management are all different among the various manufacturers of hardware and different from software publishers. There is no assurance that the Company will identify the available programs offered by the manufacturer. If the Company is unable to do so, either it will not succeed in meeting its hardware sales targets because it is unable to identify competitive pricing strategies or it will make its sales, meet competitive pricing pressures and lose money. Often, manufacturers’ promotional pricing offers have specific system requirements to enable the reseller to identify the promotion, to correctly apply it to a specific customer circumstance, to track the promotions and to collect the discounts. There is no assurance that the Company will be able to correctly manage this process. Customer risk: There is a risk that the Company will lose software sales if an existing software customer is unhappy with the experience in purchasing hardware from us and therefore elects to take all its business elsewhere. Information Systems The Company’s information systems are internally developed. They contain external applications that are linked to the proprietary core. These external applications include the Oracle ERP system modules for finance and HR that were implemented in 2003. There are continued risks since various departments in the Company operate on different systems and the Company must rely on developed interfaces between these systems. There can be no assurance that these systems will continue to expand to meet the needs of the growth of the Company or that the interfaces will be robust enough as the Company grows. Reliance on Vendor Rebates Rebates are designed by vendors to encourage certain selling behaviour by the resellers. The terms of the rebate change every quarter or six months. Resellers such as Softchoice have little or no input into either the form of the rebate or the revenue targets required to

Softchoice Corporation 2004 Management’s Discussion and Analysis
39
achieve rebates. Reliance on rebates is a business risk that Softchoice is attempting to diffuse in two ways: (1) by diversifying the product mix so that changes by one vendor will have a less dramatic impact on the Company and (2) by structuring costs to ensure that the Company is profitable in a rebate-independent model. This latter objective requires us to examine our cost structure and focus on productivity and efficiencies. Customer Attrition There is a risk that existing customers will not continue to buy from the Company and that management will not be able to increase the customer base effectively. If the Company is not able to retain an increasing number of its customers, then sales growth cannot be maintained at historical levels. The introduction of the new account manager position in 2002 and the new business telesales team in 2005 are direct responses to this risk factor. Compliance with U.S. Government Procurement Processes In 2002, Softchoice purchased the Government Services Group of Beyond.com, which enabled the Company to sell products to the U.S. federal government. The success of this business unit is contingent upon our ability to identify and manage the government procurement processes. There can be no assurances that Softchoice has identified all the required processes or that we will be able to meet all such requirements. Throughout 2004 we deployed significant internal operational resources to map the government acquisition process and to ensure our compliance with their requirements. These efforts are expected to be maintained in 2005. Competition in the Canadian Market In 2003, a major competitor acquired a Canadian business. With this competitor’s superior financial resources, there is no assurance that it will not be able to market effectively to our Canadian customers and cause us to lose market share in Canada. Sales Model Risks The Softchoice sales model includes outbound sales staff that visit customers face to face and are supported by a variety of inside sales personnel. The face to face model requires that we have facilities across North America, with the resulting increased cost base for such items as travel, training, data communication and systems. Management believes that this model will be more cost-effective in the long run since the face to face model allows for greater penetration of the customer account and greater revenue per customer. As the hardware business grows so that the Softchoice results are more comparable to those of our competitors, the validity of this assumption will become evident. There is no

Softchoice Corporation 2004 Management’s Discussion and Analysis
40
assurance that the increased costs of the diversified model will lead to greater customer penetration and a better return for investors. Productivity The entry into the hardware market has reduced the size of the average order since hardware orders tend to be smaller than software orders, which include large licensing contracts. Small order sizes mean that the Company is less productive, over all. There is no assurance that the Company will increase its productivity to compensate for the decrease in average order size to be able to generate an appropriate level of return to shareholders. The Company continues to focus on innovative technology to improve productivity. Multilateral Instrument 52-109 The Ontario Securities Commission has issued Multilateral Instrument 52-109, which will in the future require Softchoice’s Chief Executive Officer and Chief Financial Officer to certify as to the design and effectiveness of disclosure controls and procedures and internal controls over financial reporting. There is no assurance that the Company will be able to generate a sufficient level of process documentation to enable it to comply with this legislation. Other Risks In the Company’s Annual Information Form the Company identified several additional risks under the headings of: Risks Related to the Software Direct Marketing Industry; Risks Related to the Management of Softchoice’s Business; and Risks Related to the Value of the Share Price. Readers are referred to this document for an outline of these risks, that are more generic in nature and less specific to the upcoming year. The Annual Information Form is available on the Company’s website, www.softchoice.com, or on SEDAR at www.sedar.com.