seismic design and analysis of hybrid masonry with …
TRANSCRIPT
1
SEISMIC DESIGN AND ANALYSIS OF HYBRID MASONRY WITH FUSE CONNECTORS
BY
ROBERT ASSELIN
THESIS
Submitted in partial fulfillment of the requirements
for the degree of Master of Science in Civil Engineering
in the Graduate College of the
University of Illinois at Urbana-Champaign, 2013
Urbana, Illinois
Adviser:
Assistant Professor Larry Fahnestock

ii
ABSTRACT
Hybrid masonry is a new structural system that is composed of reinforced masonry
panels within a steel frame; currently, the application of this system has been limited to low
seismic regions where wind loads tend to control the design of the lateral force resisting
elements. To establish a fundamental understanding of seismic behavior for hybrid masonry
structural systems, simple analytical models are developed to predict the ultimate strength of
hybrid masonry systems and to illuminate fundamental aspects of system behavior.
The inelastic behavior of hybrid masonry is of great interest when considering the
structural response of buildings located in areas dominated by high seismic activity, and it is
dictated by the relative capacities of its system components. Thus, two design approaches may
be used depending on whether the engineer decides to concentrate yielding in the masonry panels
or in the steel connector elements that attach the masonry panels to the steel frame. Typical
capacity design principles may be applied to the design of a hybrid masonry system in which the
critical yielding elements are detailed to provide adequate ductility while the remaining structural
elements are proportioned to remain elastic throughout the duration of a seismic event.
The analytical models that are developed are also used as a basis for designing a suite of
representative prototype buildings to help evaluate the feasibility of application of the hybrid
masonry structural system for a range of seismic hazard. Numerical models are used to conduct
a more detailed study of the inelastic behavior of the Type I system where focus is placed on
modeling the inelastic response of the fuse type connectors. The results from the analytical and
numerical models are used to understand the sequence of inelastic behavior and discuss
implications for seismic performance and system feasibility.
A great deal of effort is then put into further developing the design procedure for this new
system. As interest in hybrid masonry grows, the need for an accurate design procedure will
increase, especially because no such procedure currently exists. A capacity-based design
procedure will be described using simple design examples to explain the major concepts and
design methodology. The completion of a full design procedure should serve as a beneficial tool
iii
which will further the development of the hybrid masonry system and the range of its
application.
It is the hope of the author that the findings summarized in this report help to inspire
future research as well as encourage the use of the hybrid masonry system by industry
practitioners. Certainly future research efforts are required to further explore the limits of hybrid
masonry application and to determine the necessary system response coefficients before this new
system can be fully integrated into existing building codes and design specifications.

iv
ACKNOWLEDGEMENTS
I would like to express profound appreciation to my advisor Dr. Larry Fahnestock for
providing me with this opportunity to be part of the hybrid masonry project, and for all of the
guidance and support he has given me along the way. I was frequently inspired by his extreme
dedication, attention to detail, and his intense commitment to his numerous projects and all of his
students. I have thoroughly enjoyed working with him and believe that I have learned a lot in
my time at the University of Illinois Urbana-Champaign.
I would like to give special thanks to the project’s primary investigator, Dr. Daniel
Abrams, and practicing structural engineer, David Biggs, as they both provided continual support
and feedback throughout my research experience. I appreciate their patience and willingness to
share their ideas as we worked together throughout the many phases of the hybrid masonry
research project.
I would also like to recognize and thank Tim Gregor for his ongoing support and
assistance throughout the project. As a fellow research assistant, he provided valuable feedback
and on numerous occasions made contributions that assisted me in accomplishing my assigned
tasks.
This material is based upon work supported by the National Science Foundation under
Grant No. CMMI 0936464; the author would also like to thank the International Masonry
Institute, the National Concrete Masonry Association, and the American Institute of Steel
Construction for their continued support of hybrid masonry research.
Any opinions, findings and conclusions or recommendations expressed in this material
are those of the author and do not necessarily reflect the views of the National Science
Foundation or other sponsors.
v
TABLE OF CONTENTS
LIST OF FIGURES .................................................................................................................... VI
LIST OF TABLES ................................................................................................................... VIII
LIST OF SYMBOLS .................................................................................................................. IX
CHAPTER 1: INTRODUCTION ................................................................................................ 1
CHAPTER 2: PROTOTYPE BUILDING DEVELOPMENT ............................................... 10
CHAPTER 3: FEASIBILITY ANALYSIS ............................................................................... 16
CHAPTER 4: NONLINEAR SYSTEM RESPONSE .............................................................. 37
CHAPTER 5: DESIGN PROCEDURE .................................................................................... 45
CHAPTER 6: SUMMARY AND CONCLUSIONS ................................................................ 60
REFERENCES ............................................................................................................................ 64
APPENDIX A – POSSIBLE MASONRY PANEL LOCATIONS ......................................... 67
APPENDIX B – SIMPLE PUSHOVER CURVES AND NUMERICAL RESULTS ........... 79
APPENDIX C – DETAILED NONLINEAR PUSHOVER CURVES AND DRIFT
DISTRIBUTION RESULTS ...................................................................................................... 91
APPENDIX D – DESIGN EXAMPLE CALCULATIONS .................................................... 99
vi
LIST OF FIGURES
Figure 1.1: Type I Hybrid Wall with Fuse Connectors ............................................................. 3
Figure 1.2: Type I Force Distribution (adapted from NCMA TEK 14-9A) ............................ 3
Figure 1.3: Type II Hybrid Wall ................................................................................................. 4
Figure 1.4: Type IIa Force Distribution (adapted from NCMA TEK 14-9A) ........................ 5
Figure 1.5: Type IIb Force Distribution (adapted from NCMA TEK 14-9A) ........................ 6
Figure 1.6: Type III Hybrid Wall ................................................................................................ 7
Figure 1.7: Type IIIa Force Distribution (adapted from NCMA TEK 14-9A) ....................... 7
Figure 1.8: Type IIIb Force Distribution (adapted from NCMA TEK 14-9A) ....................... 8
Figure 2.1: SAC Model Building Plans and Elevations ........................................................... 11
Figure 2.2: Prototype Building Plans and Elevations .............................................................. 15
Figure 3.1: Type I Connectors (a) Fuse (b) Link Plate ............................................................ 17
Figure 3.2: Design Response Spectra with Approximate Periods of Prototype Buildings ... 18
Figure 3.3: Building Elevation Showing Sample Fuse Connector Distribution .................... 21
Figure 3.4: Fuse Connector Distribution Options (a) Allowing Interior Passage (b)
Allowing Exterior Window ........................................................................................................ 22
Figure 3.5: Los Angeles Prototype Building Plans with Masonry Panel Locations for (a)
R=5 (b) R=6 (c) R=7 .................................................................................................................... 23
Figure 3.6: Typical Failure Mechanisms (a) Uniform Global (b) Soft Story Level 1 (c) Soft
Story Level 2 (d) Soft Story Level 3 .......................................................................................... 25
Figure 3.7: Mechanism Analysis (a) Frame and Load Profile (b) Geometrical Parameters
(c) Fuse Detail .............................................................................................................................. 26
Figure 3.8: Hysteretic Response for Single Pair of Tapered Fuses with Load Deflection
Backbone ...................................................................................................................................... 27
Figure 3.9: Pushover Analysis Load Profiles (a) Design (b) Uniform (c) Triangular (d)
Parabolic ...................................................................................................................................... 28
Figure 3.10: Pushover Curves for 3-Story Prototypes with Design Load Profiles ............... 29
Figure 3.11: Pushover Curves for 6-Story Prototypes with Design Load Profiles ............... 29
Figure 3.12: Pushover Curves for 9-Story Prototypes with Design Load Profiles ............... 30
Figure 3.13: Pushover Curve for 12-Story Prototype with Design Load Profile .................. 30
vii
Figure 3.14: Los Angeles 3-Story Pushover Curves for Various Load Profiles .................... 32
Figure 4.1: Hysteretic Response for Single Pair of Tapered Fuses with Load Deflection
Backbones .................................................................................................................................... 38
Figure 4.2: OpenSees Frame Definition (a) Schematic (b) Simplified Model (c) Steel-
Masonry Interface ....................................................................................................................... 39
Figure 4.3: Los Angeles 3-Story Pushover Analysis Comparison .......................................... 40
Figure 4.4: Relative Roof Drift Distribution for Los Angeles 3-Story ................................... 41
Figure 5.1: External Loads on Three-Story Type I System .................................................... 47
Figure 5.2: Typical Applied Loads for Type I First Story Steel Beam .................................. 48
Figure 5.3: Typical Applied Loads for Type I First Story Steel Girder ................................ 49
Figure 5.4: Tapered Fuse Connector Properties Diagram (Adapted from Ozaki-Train et al.
2011) ............................................................................................................................................. 51
Figure 5.5: Masonry Panel Flexural Requirements for Vertical Reinforcement ................. 52
Figure 5.6: Typical Type I Hybrid Masonry Panel Base-Welded Reinforcement Connection
....................................................................................................................................................... 53
Figure 5.7: 3-Story Prototype (a) Framing Plan (b) Type I Panel Locations (c) Diagonal
Brace Locations ........................................................................................................................... 54
Figure 5.8: Critical Design Forces in Energy Dissipating Elements for Type I Hybrid
Masonry ....................................................................................................................................... 55
Figure 5.9: Critical Design Forces in Energy Dissipating Elements for Braced Frame....... 56
viii
LIST OF TABLES
Table 2.1: SAC Model Building Loading Information ............................................................ 12
Table 2.2: Archetype Defining Parameters .............................................................................. 13
Table 3.1: Equivalent Lateral Force Procedure Selective Results Summary ....................... 19
Table 3.2: Fuse Connector Requirements Selective Results Summary ................................. 20
Table 3.3: Los Angeles 3-Story Pushover Analysis Selective Results Summary................... 31
Table 3.4: Pushover Analysis Comparative Results Summary .............................................. 33
Table 4.1: Nonlinear Analysis Prototype Building Roof Drift Ductility Selective Results
Summary ...................................................................................................................................... 42
Table 4.2: Prototype Building Fuse Distribution Modifications at Each Story .................... 44
Table 5.1: Type I Hybrid Masonry Steel Frame Sizing Summary......................................... 56
Table 5.2: Special Concentrically Braced Steel Frame Sizing Summary .............................. 57
ix
List of Symbols
B = frame width
Cbot = resultant compressive force at bottom of masonry wall
Cleft = resultant compressive force on left side of masonry wall
Cright = resultant compressive force on right side of masonry wall
Cs = seismic response coefficient
Ct = structural coefficient
Ctop = resultant compressive force at top of masonry wall
D = dead load
d1 = fuse width at top of fuse
d2 = fuse width at bottom of fuse
d3 = fuse width at middle of fuse
Fi = force applied at level i
Fj = force applied at level j
Hi = total height of story i measured from the point of rotation
hcp = eccentricity of a connector plate
hf = height of fuse connector
hi = individual story height of story i
hj = height of story j
hn = height in feet above the base to the highest level of the structure
L = live load
L1 = length to top of fuse
L2 = length to bottom of fuse
L3 = length to middle of fuse
Lc = critical fuse connector length
Lr = roof live load
M = maximum moment at section under consideration
Mp = plastic flexural capacity of given cross-section
P = axial force transferred from steel frame into masonry wall
Paxial = applied axial force representing weight of roof or floors above
x
Pcr = critical buckling strength of axially loaded member
Py = design tensile strength of axially loaded member
QE = effects of horizontal seismic forces
R = response modification coefficient
Rcomp = compressive column base reaction force
Rten = tension column base reaction force
S = spacing between vertical steel reinforcement
SDS = design spectral response acceleration parameter
T = tension force in steel reinforcement
Ta = approximate fundamental period
t = fuse connector thickness
tbeam = depth of steel beam
tslab = thickness of concrete slab
Vbase = design base shear force applied to hybrid masonry frame
Vcr = critical shear capacity for a single pair of fuse connectors
W = seismic weight
Wexternal = external work
Winternal = internal work
∆i = lateral deflection at story i
δi = lateral deflection of fuses at story i
µroof = roof drift ductility ratio
Φ = angle of rotation at base of steel frame
Өi = angle of rotation of fuse connectors at story i
ρ = redundancy factor

1
CHAPTER 1: INTRODUCTION
1.1 Definition of Hybrid Masonry
The word “hybrid” is rarely associated with structural systems; in fact it is more commonly
linked with high efficiency automobiles or the genetic crosspollination of unrelated plant species.
However, a more general definition of the word “hybrid” includes anything of mixed
composition where unrelated components are combined to form a unique product (Webster’s
1995). This definition outlines the general concept of the hybrid masonry structural system.
Hybrid masonry is a new and developing structural system that combines conventional steel
framing techniques with reinforced concrete masonry walls. The combination of these elements
creates a system capable of resisting both gravity and lateral loads, including both wind and
seismic, and the addition of the concrete masonry panels as a substitute to a typical bracing
member increases the systems’ overall stiffness, strength and ductility (Abrams 2011).
The active research being conducted on hybrid masonry represents the first attempt at
exploring the possible benefits of using reinforced masonry panels to improve the lateral
stiffness and strength of typical structural frames. Nearly all of the literature available on the
topic is linked with the current project and its associated collaborators; however, the original idea
was proposed by David Biggs. The two main catalysts that Biggs cites as primary reasons for
the development of the hybrid masonry system are the simplified constructability of framed
buildings with masonry shear walls as well as the added structural redundancy which is valuable
in resisting progressive collapse (Biggs 2007). More recently the National Concrete Masonry
Association (NCMA) has developed documents to define the basic structural design concepts, in
TEK 14-9A (2009), and construction practices, in TEK 3-3B (2009), that are currently being
considered for this new system. As part of this TEK series the NCMA has made information
available about the basic concepts, but these documents still lack the true technical findings,
which the active research project aims to provide. Through prototype design studies, small scale
and large scale testing, computational simulation modeling, trial designs, and public outreach
and education, the project objective is to establish the viability of the hybrid masonry system
while helping to better define system requirements and limitations.
2
In the earliest stages of research, work was done by Eidini, Abrams, and Fahnestock to
characterize the inelastic behavior of the hybrid masonry system and to begin to develop a design
method so that the system could be used in areas of high seismic activity (Eidini et al. 2012).
Major contributions were made in the development of simplified formulas for system design and
analysis, and it is the aim of the author that this report will provide a more extensive definition of
system feasibility as well as further development of a design methodology which should advance
the overall understanding of the hybrid masonry system from what is introduced in Eidini et al.
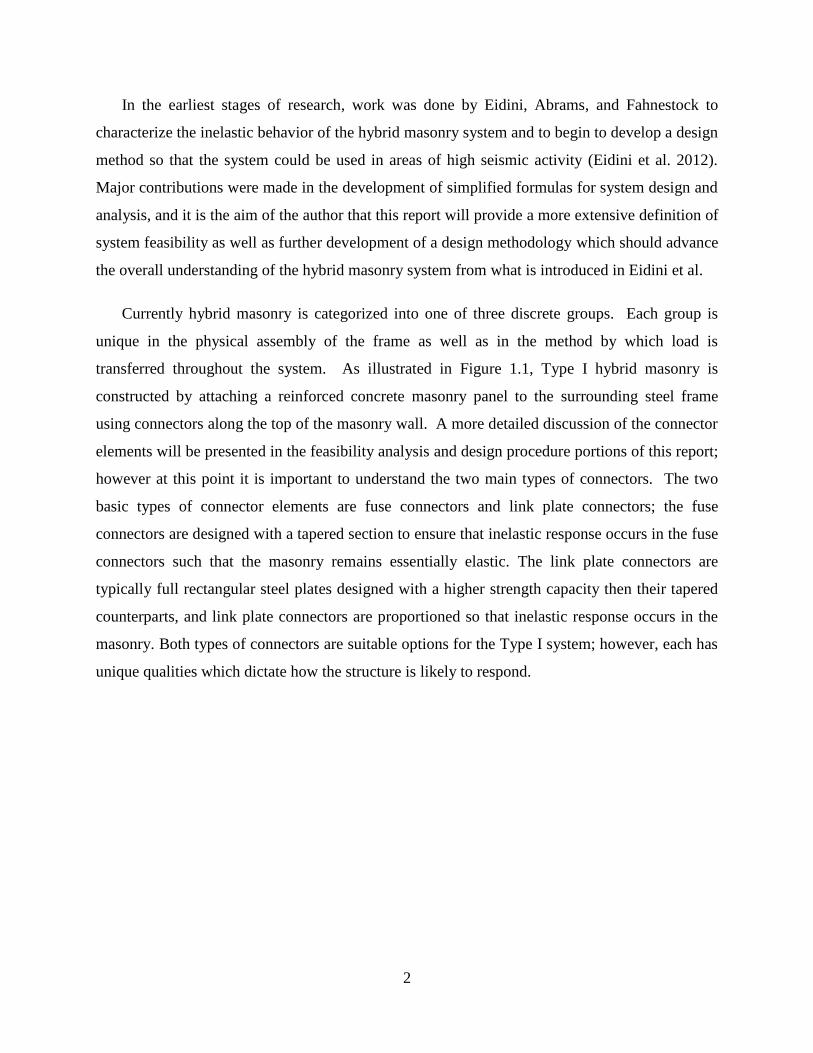
Currently hybrid masonry is categorized into one of three discrete groups. Each group is
unique in the physical assembly of the frame as well as in the method by which load is
transferred throughout the system. As illustrated in Figure 1.1, Type I hybrid masonry is
constructed by attaching a reinforced concrete masonry panel to the surrounding steel frame
using connectors along the top of the masonry wall. A more detailed discussion of the connector
elements will be presented in the feasibility analysis and design procedure portions of this report;
however at this point it is important to understand the two main types of connectors. The two
basic types of connector elements are fuse connectors and link plate connectors; the fuse
connectors are designed with a tapered section to ensure that inelastic response occurs in the fuse
connectors such that the masonry remains essentially elastic. The link plate connectors are
typically full rectangular steel plates designed with a higher strength capacity then their tapered
counterparts, and link plate connectors are proportioned so that inelastic response occurs in the
masonry. Both types of connectors are suitable options for the Type I system; however, each has
unique qualities which dictate how the structure is likely to respond.
3
Figure 1.1: Type I Hybrid Wall with Fuse Connectors
This type of wall transfers all out-of-plane loads as well as in-plane shear forces; the
transfer of all other types of forces is limited by the slotted-hole, thru-bolt connection between
the masonry wall and connectors. The slotted-hole prevents the transfer of any vertical forces
which effectively means that the masonry wall acts as a non-loadbearing shear wall (NCMA
TEK 14-9A 2009). The gaps between the steel frame and masonry panel should be large enough
to prevent any contact between the frame and masonry at maximum deformation of the system.
Thus the connectors serve as the only mode of force transfer between the steel and masonry; the
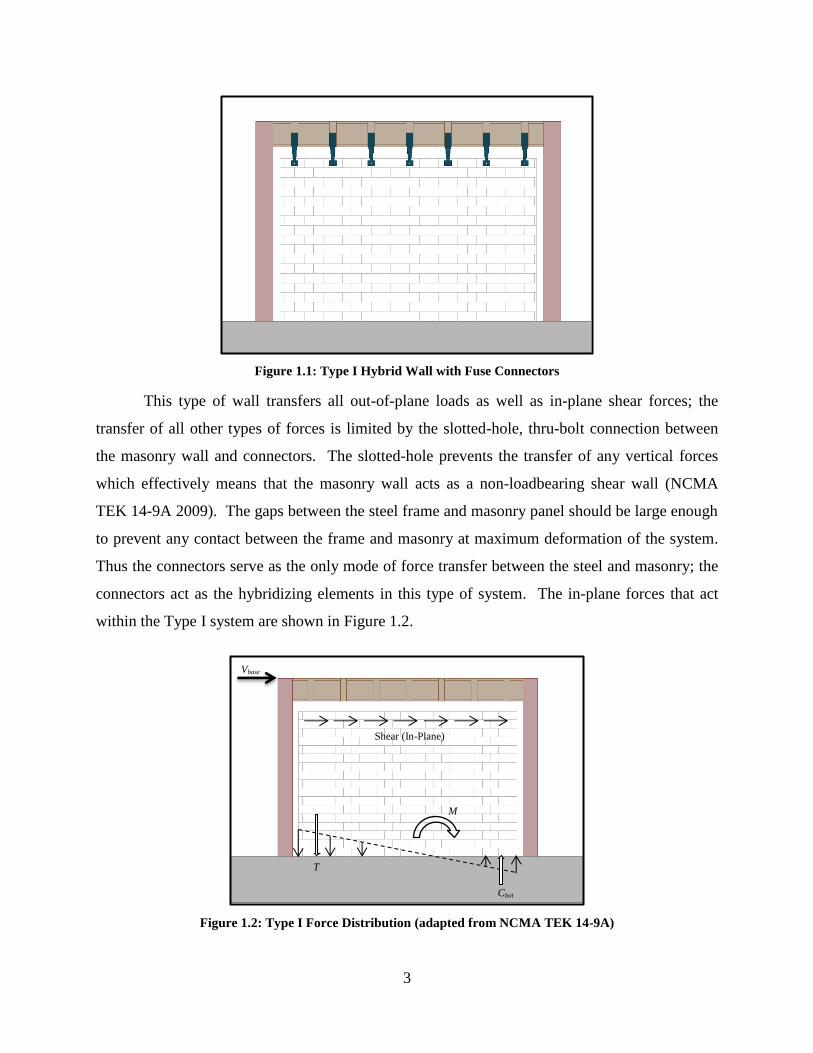
connectors act as the hybridizing elements in this type of system. The in-plane forces that act
within the Type I system are shown in Figure 1.2.
Figure 1.2: Type I Force Distribution (adapted from NCMA TEK 14-9A)
T
Cbot
Shear (In-Plane)
Vbase
M
4
The lateral force applied to the frame is transferred from the steel beam into the masonry wall by
the connectors, not displayed in Figure 1.2, and this shear force causes an overturning moment
(M) at the base of the wall in Figure 1.2. The tensile and compressive forces created by this
overturning moment may be accommodated by the vertical reinforcement distributed throughout
the wall and the compressive strength of the concrete masonry, respectively.
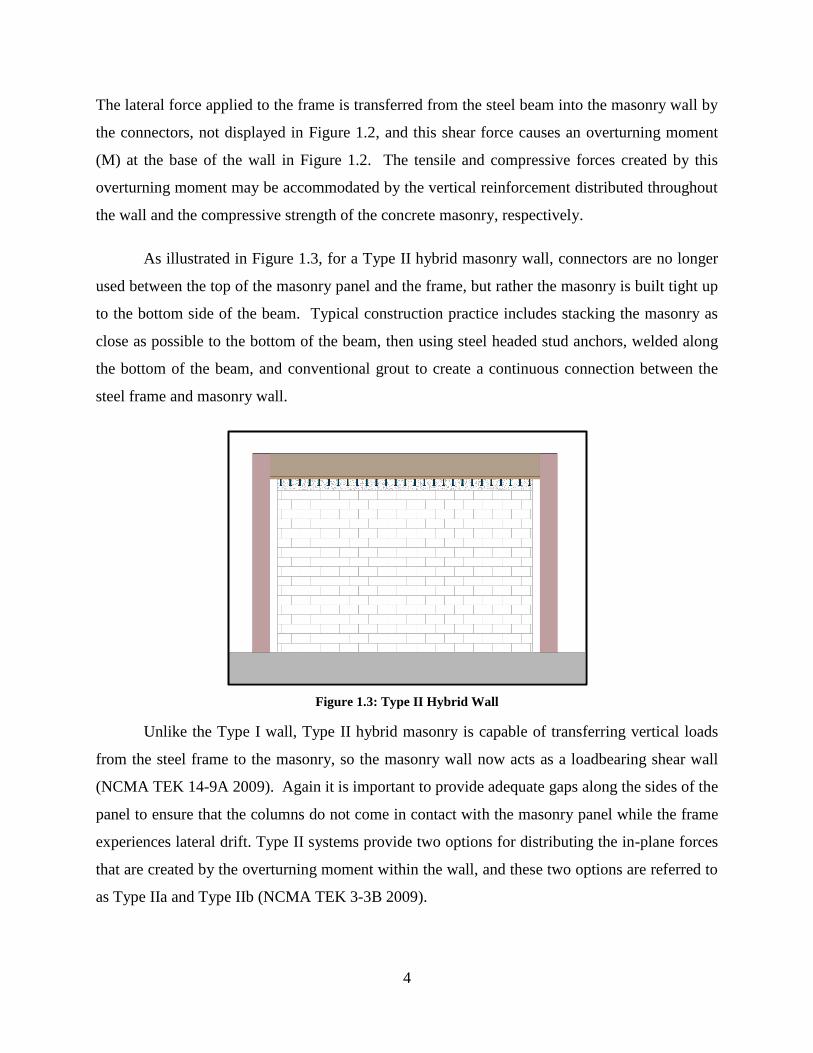
As illustrated in Figure 1.3, for a Type II hybrid masonry wall, connectors are no longer
used between the top of the masonry panel and the frame, but rather the masonry is built tight up
to the bottom side of the beam. Typical construction practice includes stacking the masonry as
close as possible to the bottom of the beam, then using steel headed stud anchors, welded along
the bottom of the beam, and conventional grout to create a continuous connection between the
steel frame and masonry wall.
Figure 1.3: Type II Hybrid Wall
Unlike the Type I wall, Type II hybrid masonry is capable of transferring vertical loads
from the steel frame to the masonry, so the masonry wall now acts as a loadbearing shear wall
(NCMA TEK 14-9A 2009). Again it is important to provide adequate gaps along the sides of the
panel to ensure that the columns do not come in contact with the masonry panel while the frame
experiences lateral drift. Type II systems provide two options for distributing the in-plane forces
that are created by the overturning moment within the wall, and these two options are referred to
as Type IIa and Type IIb (NCMA TEK 3-3B 2009).
5
In Type IIa the vertical reinforcement within the walls must be welded to the steel frame,
as is the practice with Type I walls. These steel reinforcement bars will aid in the
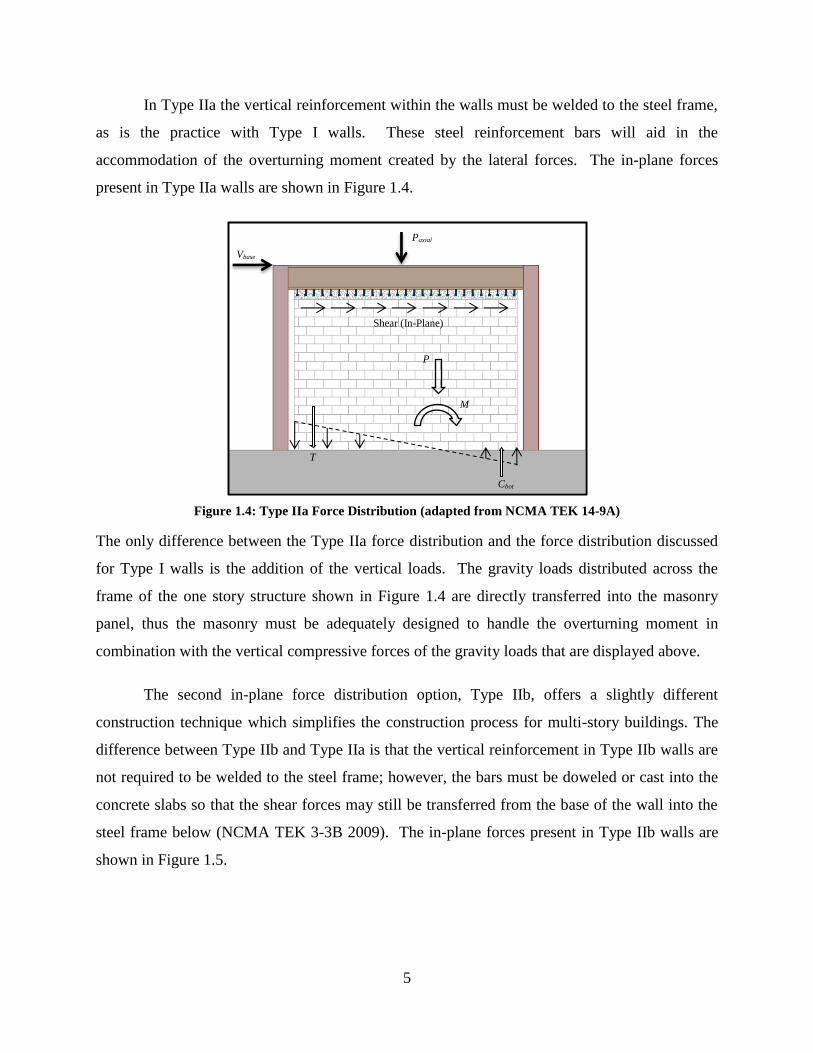
accommodation of the overturning moment created by the lateral forces. The in-plane forces
present in Type IIa walls are shown in Figure 1.4.
Figure 1.4: Type IIa Force Distribution (adapted from NCMA TEK 14-9A)
The only difference between the Type IIa force distribution and the force distribution discussed
for Type I walls is the addition of the vertical loads. The gravity loads distributed across the
frame of the one story structure shown in Figure 1.4 are directly transferred into the masonry
panel, thus the masonry must be adequately designed to handle the overturning moment in
combination with the vertical compressive forces of the gravity loads that are displayed above.
The second in-plane force distribution option, Type IIb, offers a slightly different
construction technique which simplifies the construction process for multi-story buildings. The
difference between Type IIb and Type IIa is that the vertical reinforcement in Type IIb walls are
not required to be welded to the steel frame; however, the bars must be doweled or cast into the
concrete slabs so that the shear forces may still be transferred from the base of the wall into the
steel frame below (NCMA TEK 3-3B 2009). The in-plane forces present in Type IIb walls are
shown in Figure 1.5.
T
Cbot
Shear (In-Plane)
Vbase
M
Paxial
P
6
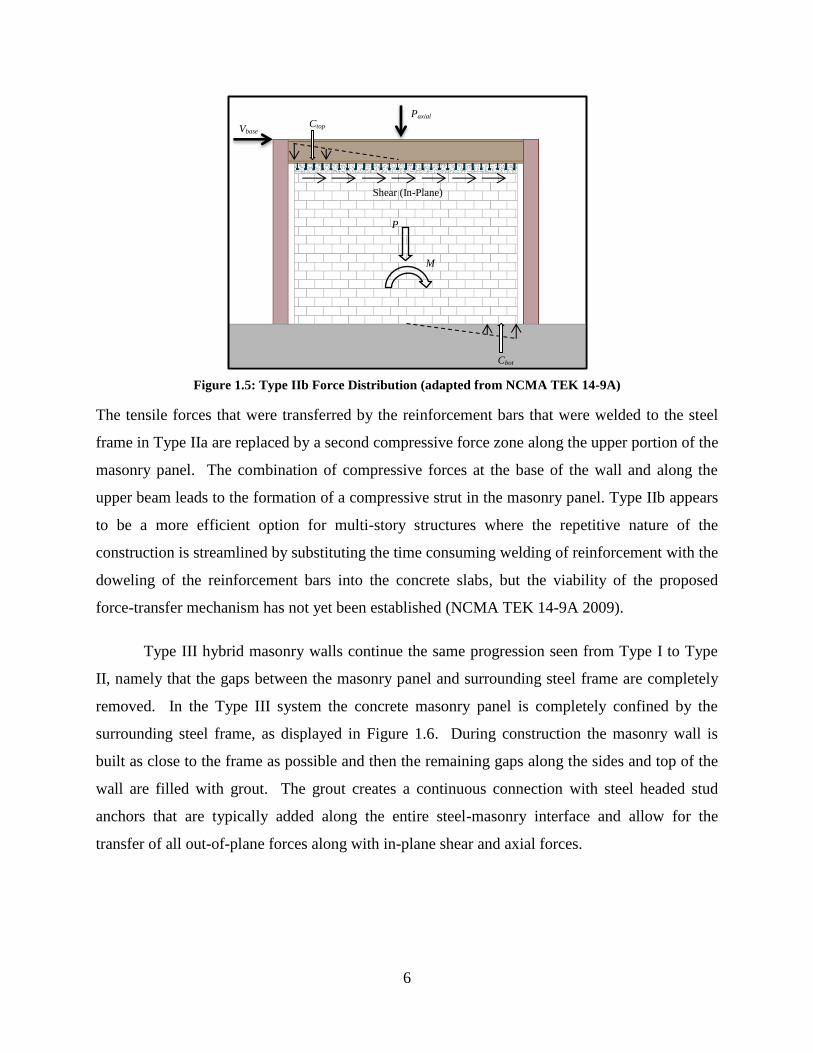
Figure 1.5: Type IIb Force Distribution (adapted from NCMA TEK 14-9A)
The tensile forces that were transferred by the reinforcement bars that were welded to the steel
frame in Type IIa are replaced by a second compressive force zone along the upper portion of the
masonry panel. The combination of compressive forces at the base of the wall and along the
upper beam leads to the formation of a compressive strut in the masonry panel. Type IIb appears
to be a more efficient option for multi-story structures where the repetitive nature of the
construction is streamlined by substituting the time consuming welding of reinforcement with the
doweling of the reinforcement bars into the concrete slabs, but the viability of the proposed
force-transfer mechanism has not yet been established (NCMA TEK 14-9A 2009).
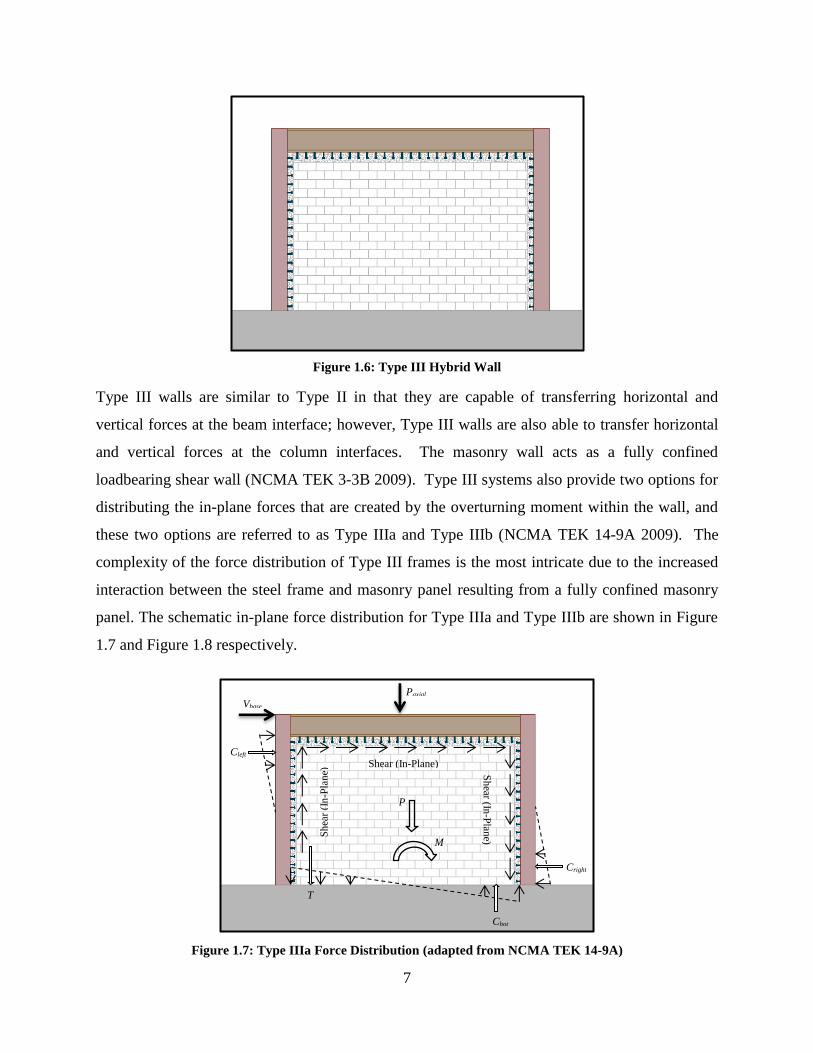
Type III hybrid masonry walls continue the same progression seen from Type I to Type
II, namely that the gaps between the masonry panel and surrounding steel frame are completely
removed. In the Type III system the concrete masonry panel is completely confined by the
surrounding steel frame, as displayed in Figure 1.6. During construction the masonry wall is
built as close to the frame as possible and then the remaining gaps along the sides and top of the
wall are filled with grout. The grout creates a continuous connection with steel headed stud
anchors that are typically added along the entire steel-masonry interface and allow for the
transfer of all out-of-plane forces along with in-plane shear and axial forces.
Cbot
Shear (In-Plane)
Vbase
M
Paxial
P
Ctop
7
Figure 1.6: Type III Hybrid Wall
Type III walls are similar to Type II in that they are capable of transferring horizontal and
vertical forces at the beam interface; however, Type III walls are also able to transfer horizontal
and vertical forces at the column interfaces. The masonry wall acts as a fully confined
loadbearing shear wall (NCMA TEK 3-3B 2009). Type III systems also provide two options for
distributing the in-plane forces that are created by the overturning moment within the wall, and
these two options are referred to as Type IIIa and Type IIIb (NCMA TEK 14-9A 2009). The
complexity of the force distribution of Type III frames is the most intricate due to the increased
interaction between the steel frame and masonry panel resulting from a fully confined masonry
panel. The schematic in-plane force distribution for Type IIIa and Type IIIb are shown in Figure
1.7 and Figure 1.8 respectively.
Figure 1.7: Type IIIa Force Distribution (adapted from NCMA TEK 14-9A)
Sh
ear (In-P
lane)
Sh
ear
(In
-Pla
ne)
T
Cbot
Shear (In-Plane)
Vbase
M
Paxial
P
Cleft
Cright
8
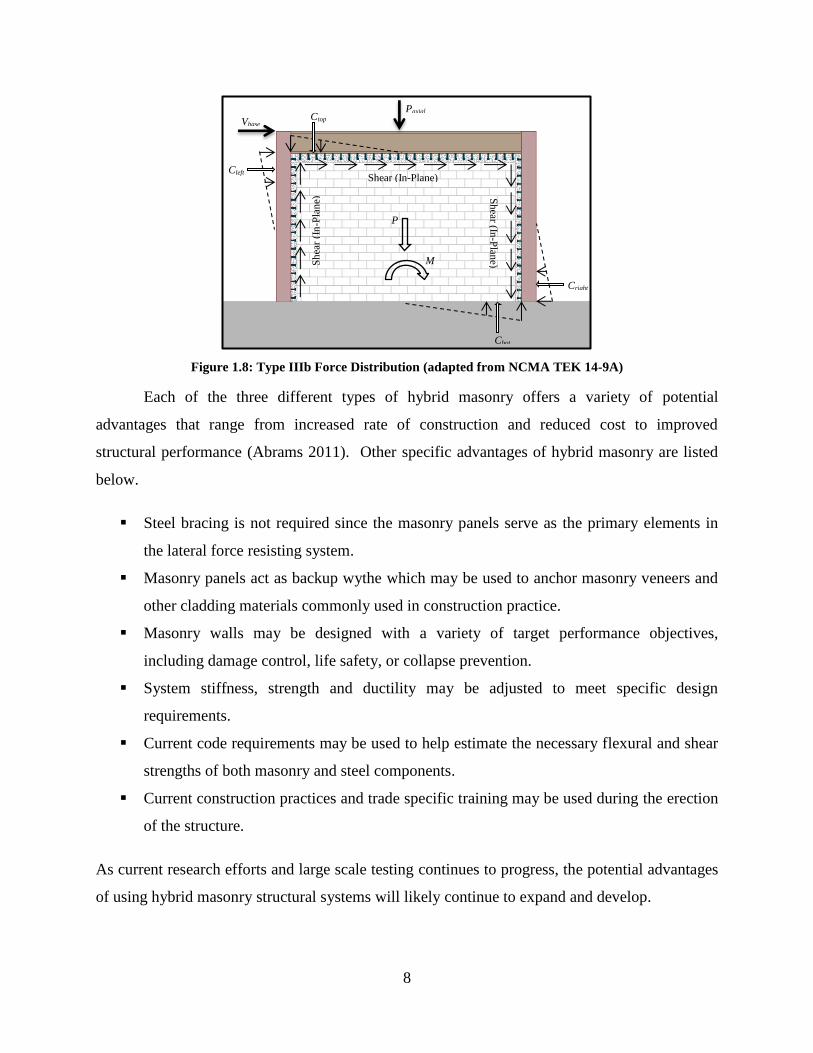
Figure 1.8: Type IIIb Force Distribution (adapted from NCMA TEK 14-9A)
Each of the three different types of hybrid masonry offers a variety of potential
advantages that range from increased rate of construction and reduced cost to improved
structural performance (Abrams 2011). Other specific advantages of hybrid masonry are listed
below.
Steel bracing is not required since the masonry panels serve as the primary elements in
the lateral force resisting system.
Masonry panels act as backup wythe which may be used to anchor masonry veneers and
other cladding materials commonly used in construction practice.
Masonry walls may be designed with a variety of target performance objectives,
including damage control, life safety, or collapse prevention.
System stiffness, strength and ductility may be adjusted to meet specific design
requirements.
Current code requirements may be used to help estimate the necessary flexural and shear
strengths of both masonry and steel components.
Current construction practices and trade specific training may be used during the erection
of the structure.
As current research efforts and large scale testing continues to progress, the potential advantages
of using hybrid masonry structural systems will likely continue to expand and develop.
Sh
ear
(In
-Pla
ne)
Cbot
Shear (In-Plane)
Vbase
M
Paxial
P
Cleft
Cright
Sh
ear (In-P
lane)
Ctop
9
1.2 Research Objectives
All of the potential promise linked with hybrid masonry as a new and innovative
structural system served as a guide in helping to create an interesting scope for research
development. The general focus throughout this thesis is on Type I hybrid masonry systems that
utilize fuse type connectors. Based on current industry practice in low-seismic regions, Type I
systems are much more popular for their simplified design requirements and construction
methods. The force transfer mechanisms and inelastic behavior of Type I hybrid masonry are
straightforward and promote a good context for initial study while testing of the more
complicated Type II or Type III systems is conducted. The primary objectives of this research
were:
Conduct a system feasibility analysis to define the practical limitations to the application
of the Type I system in regions varying in seismic hazard.
Develop non-linear models to conduct analysis of the hybrid masonry structural system to
determine if the connectors are capable of providing adequate ductility to ensure that
undesirable failure mechanisms can be avoided.
Outline a set of design procedures to be used in the design of hybrid masonry structural
members.
Improve industry understanding of this new and innovative system while better defining
the practical limitations and design steps necessary for implementation.

10
CHAPTER 2: PROTOTYPE BUILDING DEVELOPMENT
2.1 The SAC Prototype Buildings
For years, the main goal of seismic building codes has been to ensure that buildings are
capable of withstanding intense ground shaking without suffering a major structural collapse.
Satisfying this condition requires that the building layout, selected structural system, and
construction materials all provide adequate ductility, where ductility is the ability of a structure
to withstand large inelastic deformations without serious reductions in overall strength capacity
or the development of localized instabilities (Elnashai 2008).
In the second half of the 20th
Century it was common belief among engineers that steel
moment-frame buildings were one of the most ductile structural systems available. The high
system ductility of moment-frames offered the greatest resistance to earthquake-induced damage
which made them a popular option for a variety of structures that were designed and built in the
western half of the United States. This trend continued until January 17, 1994 when a number of
steel moment-frame buildings experienced brittle type failures, or fractures at the beam-column
connections following the Northridge earthquake (FEMA 355C).
Overall, the steel moment-frame buildings did not collapse and suffered only minimal
structural damage; therefore the structures met the basic building code requirements with regards
to seismic design. The most troubling aspect was that the structures did not behave as engineers
anticipated because moment-frame buildings were designed based on assumptions that they
would provide extensive yielding and plastic deformation without brittle fracture. Theoretically
the plastic deformation would be concentrated within the beams at the locations of beam-column
connections which results in large amounts of energy dissipation while also reducing the
potential for a global collapse mechanism. The unexpected structural response of the steel
moment-frames in the Northridge earthquake led to the development of a research initiative that
was tasked with the further exploration of the critical performance issues of steel moment-
resisting frame structures for various seismic hazards (FEMA 355C).
11
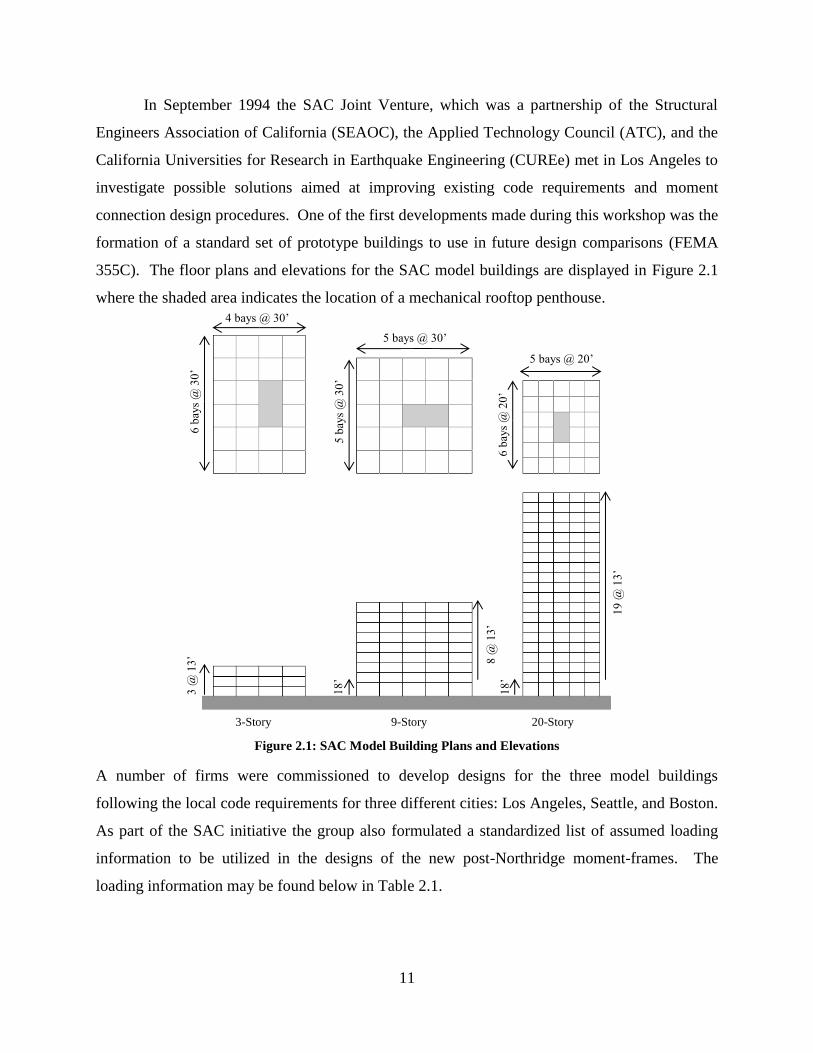
In September 1994 the SAC Joint Venture, which was a partnership of the Structural
Engineers Association of California (SEAOC), the Applied Technology Council (ATC), and the
California Universities for Research in Earthquake Engineering (CUREe) met in Los Angeles to
investigate possible solutions aimed at improving existing code requirements and moment
connection design procedures. One of the first developments made during this workshop was the
formation of a standard set of prototype buildings to use in future design comparisons (FEMA
355C). The floor plans and elevations for the SAC model buildings are displayed in Figure 2.1
where the shaded area indicates the location of a mechanical rooftop penthouse.
Figure 2.1: SAC Model Building Plans and Elevations
A number of firms were commissioned to develop designs for the three model buildings
following the local code requirements for three different cities: Los Angeles, Seattle, and Boston.
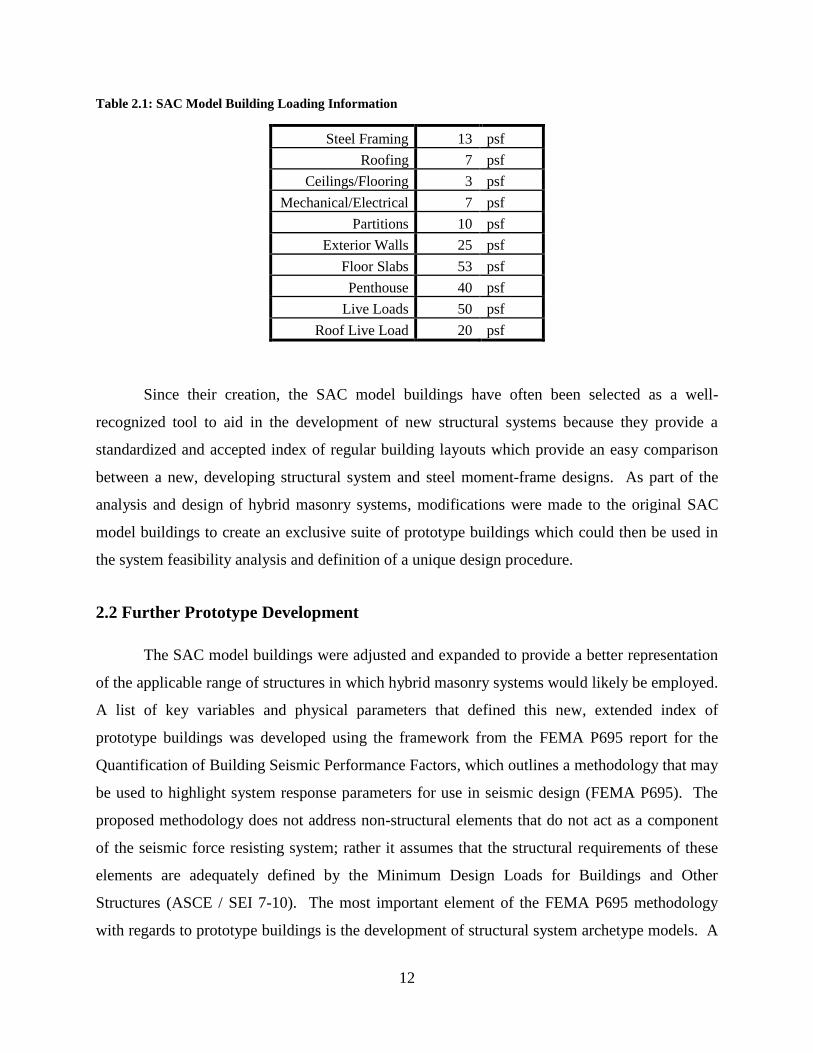
As part of the SAC initiative the group also formulated a standardized list of assumed loading
information to be utilized in the designs of the new post-Northridge moment-frames. The
loading information may be found below in Table 2.1.
19
@ 1
3’
8 @
13
’
6 b
ays
@ 3
0’
4 bays @ 30’
5 b
ays
@ 3
0’
5 bays @ 30’
6 b
ays
@ 2
0’
5 bays @ 20’
3-Story 9-Story 20-Story
3 @
13
’
18
’
18
’
12
Table 2.1: SAC Model Building Loading Information
Steel Framing 13 psf
Roofing 7 psf
Ceilings/Flooring 3 psf
Mechanical/Electrical 7 psf
Partitions 10 psf
Exterior Walls 25 psf
Floor Slabs 53 psf
Penthouse 40 psf
Live Loads 50 psf
Roof Live Load 20 psf
Since their creation, the SAC model buildings have often been selected as a well-
recognized tool to aid in the development of new structural systems because they provide a
standardized and accepted index of regular building layouts which provide an easy comparison
between a new, developing structural system and steel moment-frame designs. As part of the
analysis and design of hybrid masonry systems, modifications were made to the original SAC
model buildings to create an exclusive suite of prototype buildings which could then be used in
the system feasibility analysis and definition of a unique design procedure.
2.2 Further Prototype Development
The SAC model buildings were adjusted and expanded to provide a better representation
of the applicable range of structures in which hybrid masonry systems would likely be employed.
A list of key variables and physical parameters that defined this new, extended index of
prototype buildings was developed using the framework from the FEMA P695 report for the
Quantification of Building Seismic Performance Factors, which outlines a methodology that may
be used to highlight system response parameters for use in seismic design (FEMA P695). The
proposed methodology does not address non-structural elements that do not act as a component
of the seismic force resisting system; rather it assumes that the structural requirements of these
elements are adequately defined by the Minimum Design Loads for Buildings and Other
Structures (ASCE / SEI 7-10). The most important element of the FEMA P695 methodology
with regards to prototype buildings is the development of structural system archetype models. A
13
structural archetype is defined as a systematic method for characterizing all of the feasible
building configurations for a unique structural system based on the intended range of application
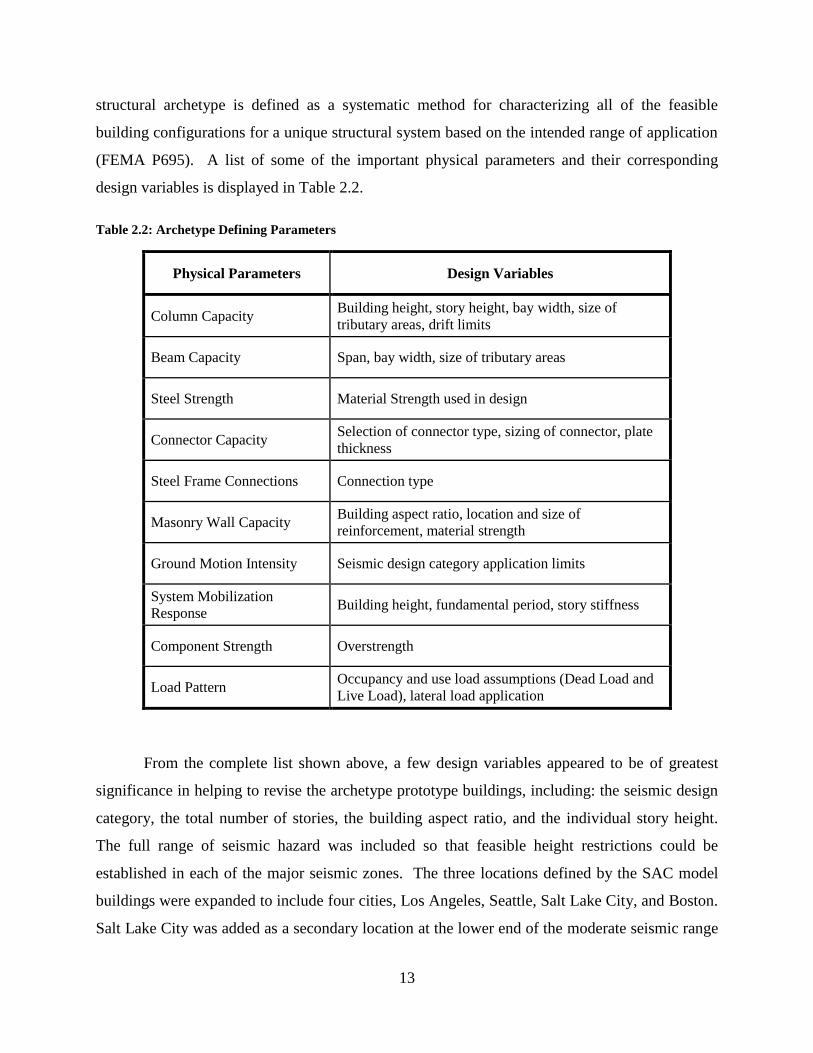
(FEMA P695). A list of some of the important physical parameters and their corresponding
design variables is displayed in Table 2.2.
Table 2.2: Archetype Defining Parameters
Physical Parameters Design Variables
Column Capacity Building height, story height, bay width, size of
tributary areas, drift limits
Beam Capacity Span, bay width, size of tributary areas
Steel Strength Material Strength used in design
Connector Capacity Selection of connector type, sizing of connector, plate
thickness
Steel Frame Connections Connection type
Masonry Wall Capacity Building aspect ratio, location and size of
reinforcement, material strength
Ground Motion Intensity Seismic design category application limits
System Mobilization
Response Building height, fundamental period, story stiffness
Component Strength Overstrength
Load Pattern Occupancy and use load assumptions (Dead Load and
Live Load), lateral load application
From the complete list shown above, a few design variables appeared to be of greatest
significance in helping to revise the archetype prototype buildings, including: the seismic design
category, the total number of stories, the building aspect ratio, and the individual story height.
The full range of seismic hazard was included so that feasible height restrictions could be
established in each of the major seismic zones. The three locations defined by the SAC model
buildings were expanded to include four cities, Los Angeles, Seattle, Salt Lake City, and Boston.
Salt Lake City was added as a secondary location at the lower end of the moderate seismic range
14
since Seattle represented a moderate seismic site at the higher end of the seismic scale for a
moderate seismic zone.
It seemed unlikely, based on current practice and advice from practicing engineers, that
the hybrid masonry structural system would be employed in high rise structures, but rather the
range of its application was better suited for low to moderate rise structures. Therefore the range
of height of the prototype buildings was adjusted so that four different building heights would be
examined. A rectangular, three story structure, and a six, a nine and a twelve story square
building were developed to evaluate the feasibility of each structure in the different seismic
regions discussed above.
One key feature that the SAC model buildings did not adequately address was building
aspect ratio. The majority of the SAC buildings have square or nearly square footprints with low
aspect ratios (building length to building width), and thus they do not adequately represent the
complete range of probable hybrid masonry applications. Based on current experience and
expectations (Biggs 2013), hybrid masonry systems will be a popular structural option for
academic institutions where buildings or wings of buildings tend to be much more rectangular
with high aspect ratios. A second three story building plan was created, with an aspect ratio of
3.0 to better model the expected feasible limits of low rise structures with large building aspect
ratios.
Finally, the individual story heights were evaluated in a similar manner to what was
defined by the SAC model buildings. Uniform 13 foot story heights were used for each
prototype building, and then a larger 18 foot first story was employed for the six, nine and twelve
story structures. An 18 foot first level more accurately represented the increased floor to ceiling
height necessary for an office building lobby or ground level commercial space; the increased
first story height could also affect the seismic design forces experienced at ground level. The
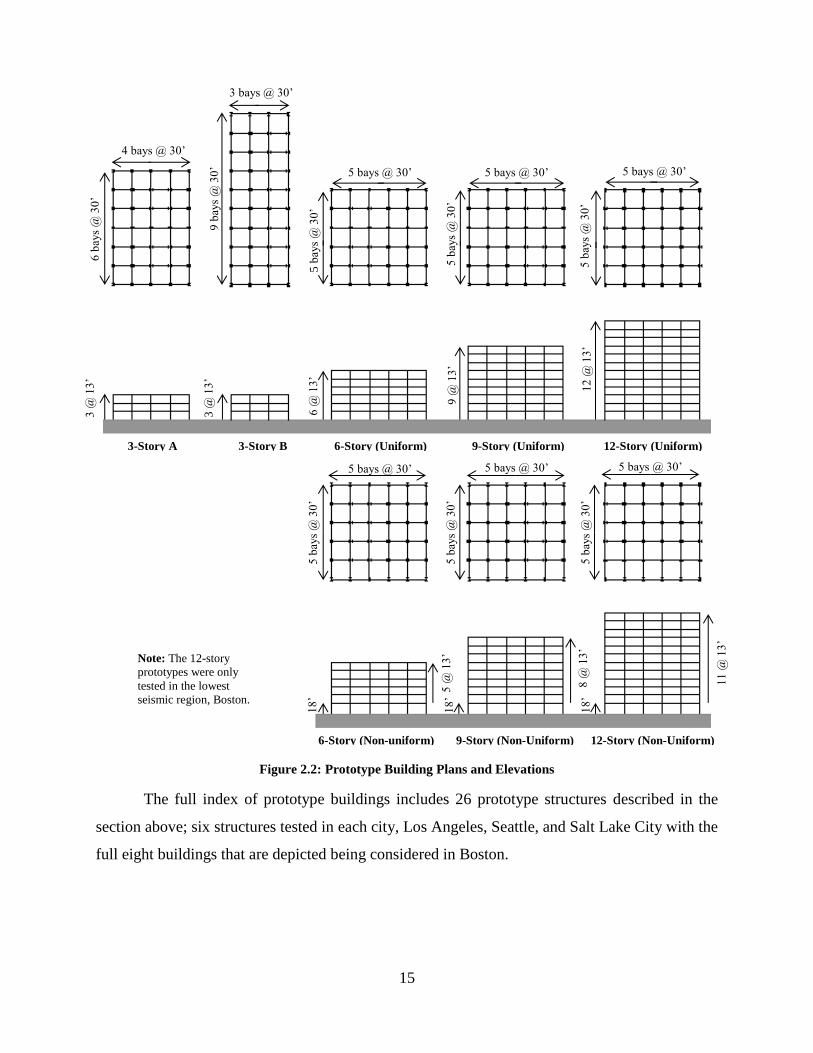
generic prototype building plans and elevations are illustrated in Figure 2.2.
15
Figure 2.2: Prototype Building Plans and Elevations
The full index of prototype buildings includes 26 prototype structures described in the
section above; six structures tested in each city, Los Angeles, Seattle, and Salt Lake City with the
full eight buildings that are depicted being considered in Boston.
5 @
13
’
8 @
13
’
18
’
18
’
5 bays @ 30’ 5 bays @ 30’
5 b
ays
@ 3
0’
5 b
ays
@ 3
0’
3 @
13
’
3 @
13
’
6 @
13
’
9 @
13
’
9 b
ays
@ 3
0’
3-Story A 3-Story B 6-Story (Uniform) 9-Story (Uniform) 12-Story (Uniform)
4 bays @ 30’
3 bays @ 30’
5 bays @ 30’ 5 bays @ 30’ 5 bays @ 30’
5 b
ays
@ 3
0’
5 b
ays
@ 3
0’
5 b
ays
@ 3
0’
6 b
ays
@ 3
0’
6-Story (Non-uniform) 9-Story (Non-Uniform) 12-Story (Non-Uniform)
12
@ 1
3’
5 b
ays
@ 3
0’
5 bays @ 30’
18
’
11
@ 1
3’
Note: The 12-story
prototypes were only
tested in the lowest
seismic region, Boston.

16
CHAPTER 3: FEASIBILITY ANALYSIS
The goal of the system feasibility analysis is to define a reasonable range for the
application of the hybrid masonry system. Established techniques and seismic design procedures
will be used to help evaluate the feasibility of each of the prototype buildings in each of the four
cities highlighted above, namely Los Angeles, Seattle, Salt Lake City, and Boston.
3.1 Overview of Structural System Design Approach
Type I hybrid masonry systems may be developed using one of two distinct
methodologies as described in Chapter 1: Introduction. The two approaches are dependent on
the type of connectors that are selected and whether the designer prefers to have the connectors
or the masonry panels serve as the primary yielding components of the system.
One approach employs fuse connectors, and as their name suggests these connectors
serve as the structural “fuse” within the system. Fuse connectors are designed with a tapered
section where the cross-sectional area is reduced to induce yielding and the formation of plastic
hinges in the connector elements (Johnson et al 2011). Thus fuse connectors are considered the
“weak” element within the system, relative to the “strong” reinforced masonry panels which are
designed to remain elastic throughout a given seismic event. Small-scale component tests done at
the University of Hawaii at Manoa (Robertson 2013, Johnson et al 2011) suggest that the fuse
connector is an excellent energy dissipater, which makes it an excellent option for providing the
necessary ductility to resist seismic loads.
A second approach utilizes link plate connectors, where link plate connectors are simply
rectangular plates which are selected for their increased strength capacity. In this case the plate
connectors are the “strong” element in the hybrid masonry system with respect to the relatively
“weak” masonry. The fact that the link plate connector is much more rigid and is designed to
have a higher strength capacity than the fuse connector leads to the concentration of yielding in
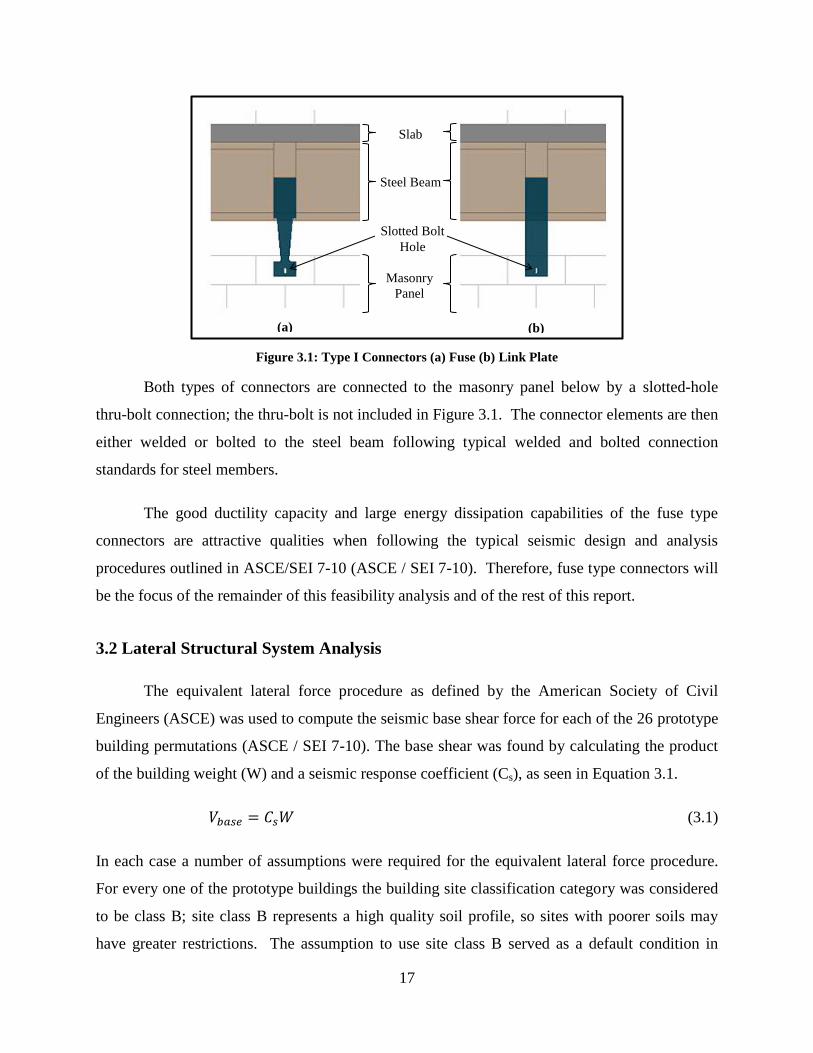
the masonry panel. A fuse connector and a link plate connector are displayed in Figure 3.1, and
these diagrams help portray the major geometrical differences between the two Type I connector
options.
17
Figure 3.1: Type I Connectors (a) Fuse (b) Link Plate
Both types of connectors are connected to the masonry panel below by a slotted-hole
thru-bolt connection; the thru-bolt is not included in Figure 3.1. The connector elements are then
either welded or bolted to the steel beam following typical welded and bolted connection
standards for steel members.
The good ductility capacity and large energy dissipation capabilities of the fuse type
connectors are attractive qualities when following the typical seismic design and analysis
procedures outlined in ASCE/SEI 7-10 (ASCE / SEI 7-10). Therefore, fuse type connectors will
be the focus of the remainder of this feasibility analysis and of the rest of this report.
3.2 Lateral Structural System Analysis
The equivalent lateral force procedure as defined by the American Society of Civil
Engineers (ASCE) was used to compute the seismic base shear force for each of the 26 prototype
building permutations (ASCE / SEI 7-10). The base shear was found by calculating the product
of the building weight (W) and a seismic response coefficient (Cs), as seen in Equation 3.1.
(3.1)
In each case a number of assumptions were required for the equivalent lateral force procedure.
For every one of the prototype buildings the building site classification category was considered
to be class B; site class B represents a high quality soil profile, so sites with poorer soils may
have greater restrictions. The assumption to use site class B served as a default condition in
(a) (b)
Steel Beam
Slab
Masonry
Panel
Slotted Bolt
Hole
18
which the corresponding site coefficients, Fa and Fv, were always 1.0 for all of the mapped
spectral response acceleration parameters being considered.
The computation of the seismic response coefficient (Cs) also requires the calculation of
the approximate fundamental period of the building, thus the approximate period for each
prototype was estimated based on the total height of the structure. Using Equation 3.2, the
approximate fundamental period (Ta) was found by multiplying the coefficient Ct, taken to be
0.02 for any non-moment-resisting or eccentrically braced frame, with the height of the highest
level of the structure above the base (hn).
(3.2)
The height (hn) is raised to the power of x, taken to be 0.75 for a non-moment-resisting or
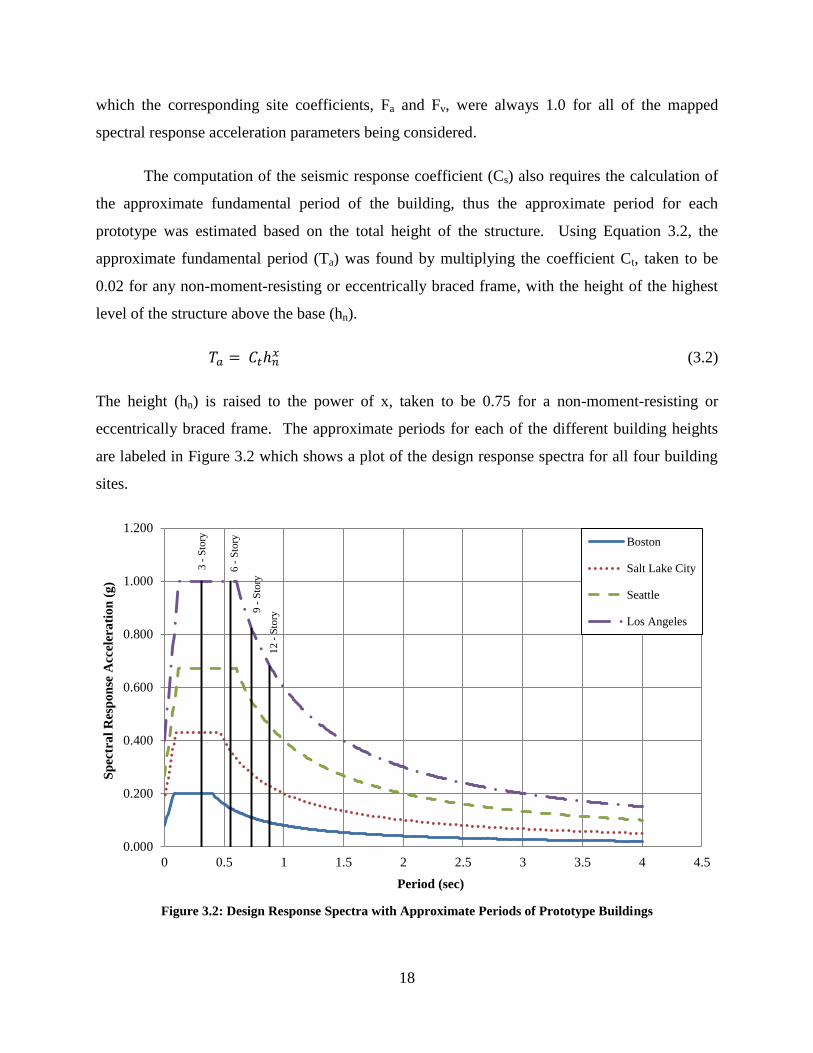
eccentrically braced frame. The approximate periods for each of the different building heights
are labeled in Figure 3.2 which shows a plot of the design response spectra for all four building
sites.
Figure 3.2: Design Response Spectra with Approximate Periods of Prototype Buildings
0.000
0.200
0.400
0.600
0.800
1.000
1.200
0 0.5 1 1.5 2 2.5 3 3.5 4 4.5
Sp
ectr
al
Res
po
nse
Acc
eler
ati
on
(g
)
Period (sec)
Boston
Salt Lake City
Seattle
Los Angeles
3 -
Sto
ry
6 -
Sto
ry
9 -
Sto
ry
12
- S
tory
19
It is clear that as the height of the building is increased, the estimate for the approximate period
also increases. Therefore the spectral response acceleration may be greatly reduced for taller
buildings, depending on the geographical location of the building site.
Another key assumption that had to be made was with regards to the response
modification coefficient (R). Without any previously completed full system test results to use as
a reference, the response modification coefficient was assumed to be in the range of 5 to 7 based
on coefficients currently used for similar ductile masonry and steel seismic force resisting
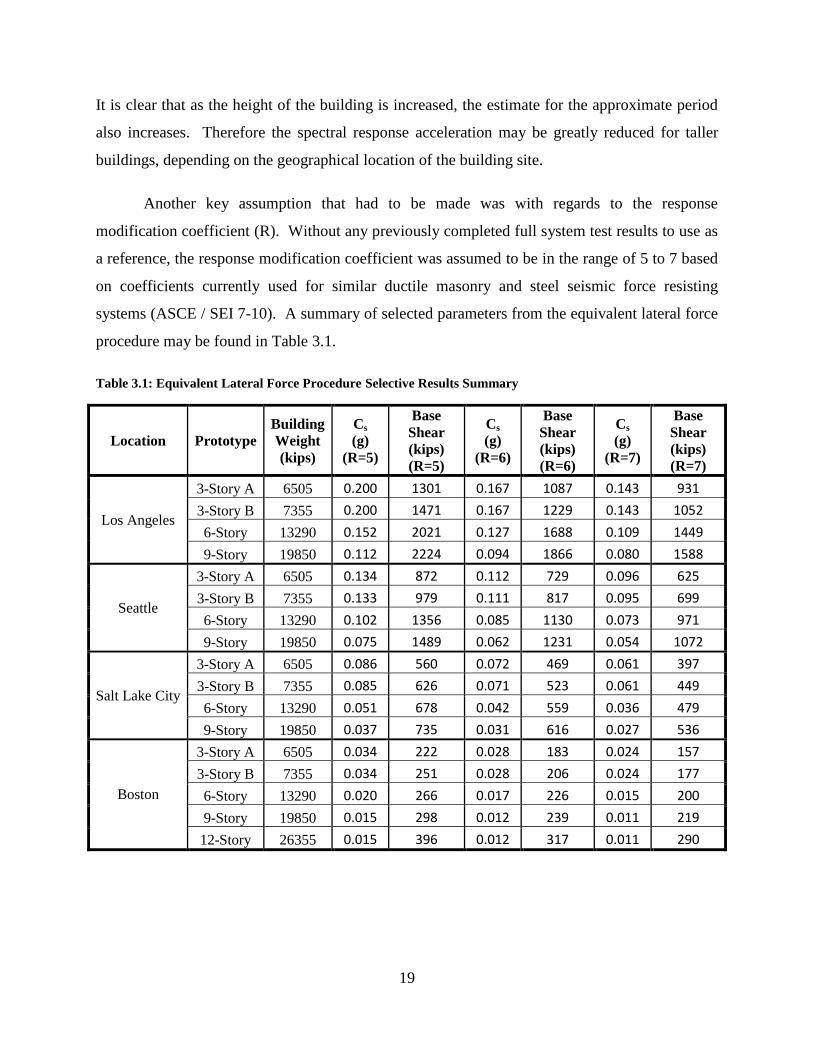
systems (ASCE / SEI 7-10). A summary of selected parameters from the equivalent lateral force
procedure may be found in Table 3.1.
Table 3.1: Equivalent Lateral Force Procedure Selective Results Summary
Location Prototype
Building
Weight
(kips)
Cs
(g)
(R=5)
Base
Shear
(kips)
(R=5)
Cs
(g)
(R=6)
Base
Shear
(kips)
(R=6)
Cs
(g)
(R=7)
Base
Shear
(kips)
(R=7)
Los Angeles
3-Story A 6505 0.200 1301 0.167 1087 0.143 931
3-Story B 7355 0.200 1471 0.167 1229 0.143 1052
6-Story 13290 0.152 2021 0.127 1688 0.109 1449
9-Story 19850 0.112 2224 0.094 1866 0.080 1588
Seattle
3-Story A 6505 0.134 872 0.112 729 0.096 625
3-Story B 7355 0.133 979 0.111 817 0.095 699
6-Story 13290 0.102 1356 0.085 1130 0.073 971
9-Story 19850 0.075 1489 0.062 1231 0.054 1072
Salt Lake City
3-Story A 6505 0.086 560 0.072 469 0.061 397
3-Story B 7355 0.085 626 0.071 523 0.061 449
6-Story 13290 0.051 678 0.042 559 0.036 479
9-Story 19850 0.037 735 0.031 616 0.027 536
Boston
3-Story A 6505 0.034 222 0.028 183 0.024 157
3-Story B 7355 0.034 251 0.028 206 0.024 177
6-Story 13290 0.020 266 0.017 226 0.015 200
9-Story 19850 0.015 298 0.012 239 0.011 219
12-Story 26355 0.015 396 0.012 317 0.011 290
20
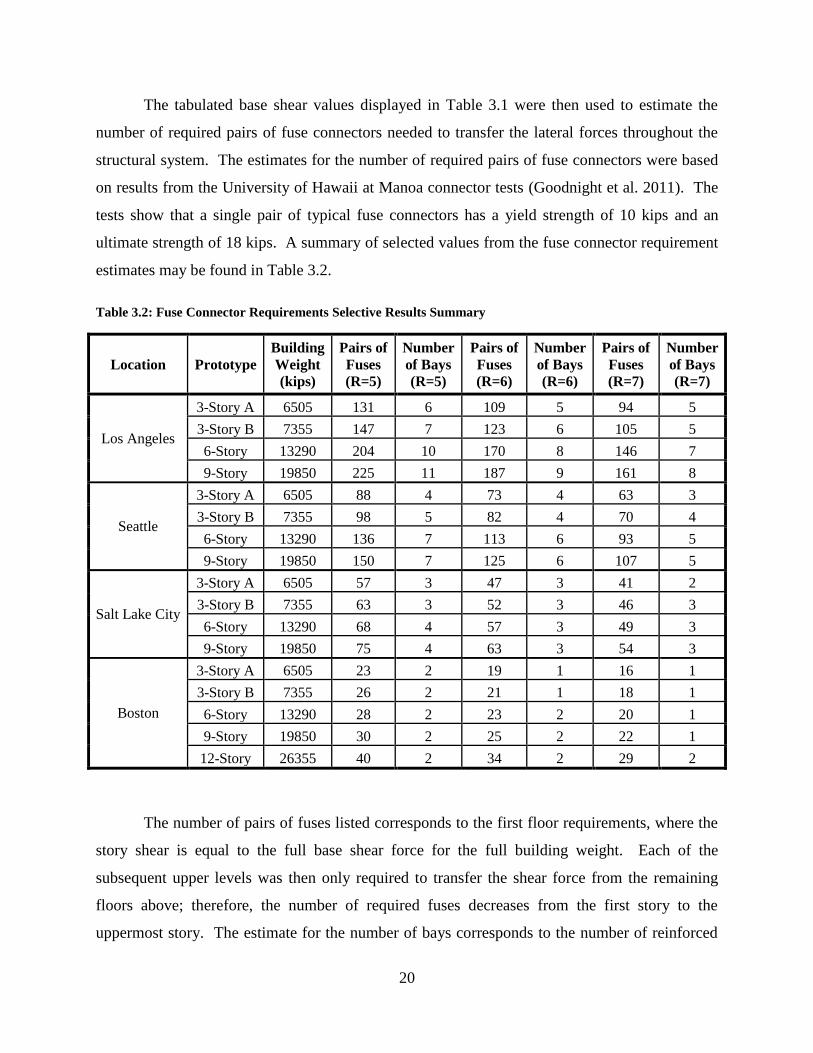
The tabulated base shear values displayed in Table 3.1 were then used to estimate the
number of required pairs of fuse connectors needed to transfer the lateral forces throughout the
structural system. The estimates for the number of required pairs of fuse connectors were based
on results from the University of Hawaii at Manoa connector tests (Goodnight et al. 2011). The
tests show that a single pair of typical fuse connectors has a yield strength of 10 kips and an
ultimate strength of 18 kips. A summary of selected values from the fuse connector requirement
estimates may be found in Table 3.2.
Table 3.2: Fuse Connector Requirements Selective Results Summary
Location Prototype
Building
Weight
(kips)
Pairs of
Fuses
(R=5)
Number
of Bays
(R=5)
Pairs of
Fuses
(R=6)
Number
of Bays
(R=6)
Pairs of
Fuses
(R=7)
Number
of Bays
(R=7)
Los Angeles
3-Story A 6505 131 6 109 5 94 5
3-Story B 7355 147 7 123 6 105 5
6-Story 13290 204 10 170 8 146 7
9-Story 19850 225 11 187 9 161 8
Seattle
3-Story A 6505 88 4 73 4 63 3
3-Story B 7355 98 5 82 4 70 4
6-Story 13290 136 7 113 6 93 5
9-Story 19850 150 7 125 6 107 5
Salt Lake City
3-Story A 6505 57 3 47 3 41 2
3-Story B 7355 63 3 52 3 46 3
6-Story 13290 68 4 57 3 49 3
9-Story 19850 75 4 63 3 54 3
Boston
3-Story A 6505 23 2 19 1 16 1
3-Story B 7355 26 2 21 1 18 1
6-Story 13290 28 2 23 2 20 1
9-Story 19850 30 2 25 2 22 1
12-Story 26355 40 2 34 2 29 2
The number of pairs of fuses listed corresponds to the first floor requirements, where the
story shear is equal to the full base shear force for the full building weight. Each of the
subsequent upper levels was then only required to transfer the shear force from the remaining
floors above; therefore, the number of required fuses decreases from the first story to the
uppermost story. The estimate for the number of bays corresponds to the number of reinforced
21
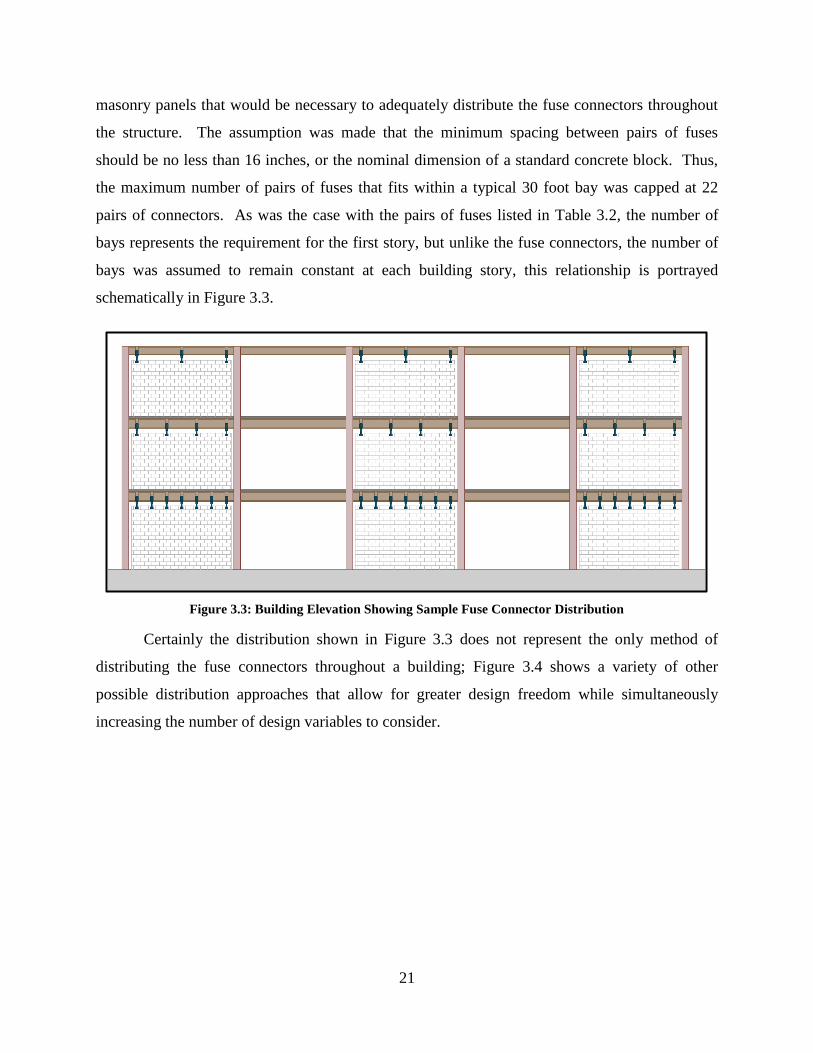
masonry panels that would be necessary to adequately distribute the fuse connectors throughout
the structure. The assumption was made that the minimum spacing between pairs of fuses
should be no less than 16 inches, or the nominal dimension of a standard concrete block. Thus,
the maximum number of pairs of fuses that fits within a typical 30 foot bay was capped at 22
pairs of connectors. As was the case with the pairs of fuses listed in Table 3.2, the number of
bays represents the requirement for the first story, but unlike the fuse connectors, the number of
bays was assumed to remain constant at each building story, this relationship is portrayed
schematically in Figure 3.3.
Figure 3.3: Building Elevation Showing Sample Fuse Connector Distribution
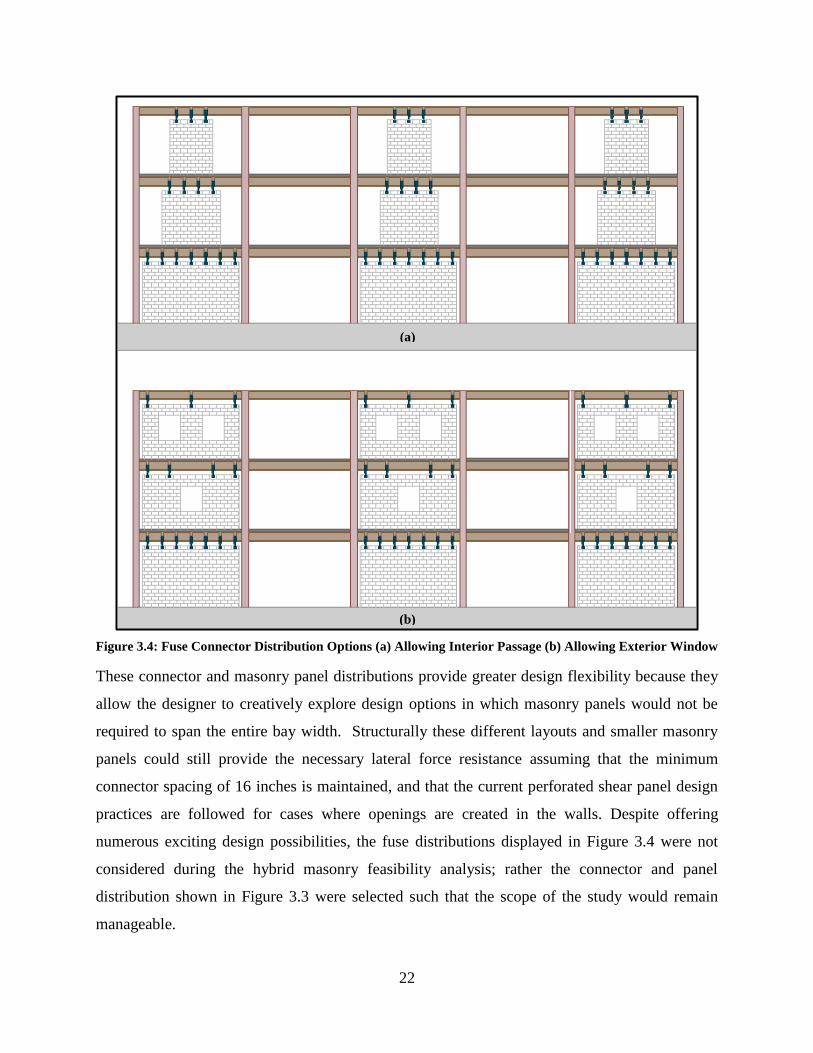
Certainly the distribution shown in Figure 3.3 does not represent the only method of
distributing the fuse connectors throughout a building; Figure 3.4 shows a variety of other
possible distribution approaches that allow for greater design freedom while simultaneously
increasing the number of design variables to consider.
22
Figure 3.4: Fuse Connector Distribution Options (a) Allowing Interior Passage (b) Allowing Exterior Window
These connector and masonry panel distributions provide greater design flexibility because they
allow the designer to creatively explore design options in which masonry panels would not be
required to span the entire bay width. Structurally these different layouts and smaller masonry
panels could still provide the necessary lateral force resistance assuming that the minimum
connector spacing of 16 inches is maintained, and that the current perforated shear panel design
practices are followed for cases where openings are created in the walls. Despite offering
numerous exciting design possibilities, the fuse distributions displayed in Figure 3.4 were not
considered during the hybrid masonry feasibility analysis; rather the connector and panel
distribution shown in Figure 3.3 were selected such that the scope of the study would remain
manageable.
(a)
(b)
23
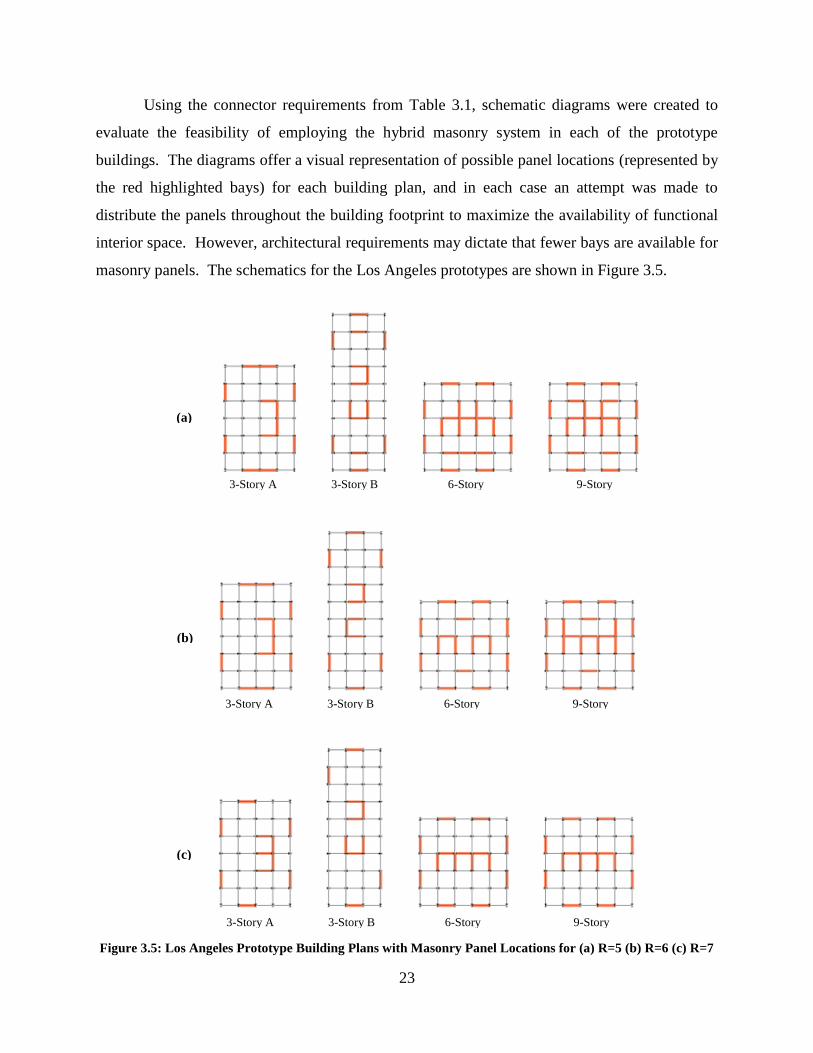
Using the connector requirements from Table 3.1, schematic diagrams were created to
evaluate the feasibility of employing the hybrid masonry system in each of the prototype
buildings. The diagrams offer a visual representation of possible panel locations (represented by
the red highlighted bays) for each building plan, and in each case an attempt was made to
distribute the panels throughout the building footprint to maximize the availability of functional
interior space. However, architectural requirements may dictate that fewer bays are available for
masonry panels. The schematics for the Los Angeles prototypes are shown in Figure 3.5.
Figure 3.5: Los Angeles Prototype Building Plans with Masonry Panel Locations for (a) R=5 (b) R=6 (c) R=7
(a)
(b)
(c)
3-Story A 3-Story B 6-Story 9-Story
3-Story A 3-Story B 6-Story 9-Story
3-Story A 3-Story B 6-Story 9-Story
24
Clearly, the overall feasibility of the hybrid masonry system is highly dependent on the
system response modification coefficient (R), which must ultimately be validated through large-
scale testing and more extensive analysis. An effort to provide a preliminary estimate for the
ductility capacity of the Type I hybrid masonry system will be discussed in Chapter 4: Nonlinear
Analysis, and should help to reduce the range of possible response modification coefficients (R)
for hybrid masonry.
The panel distributions within each of the prototypes helped to expose certain system
limitations. The increasing base shear force demands for the taller buildings required that more
fuse connectors and masonry panels be used to transfer the lateral force throughout the system.
Each schematic diagram was rated based on the apparent panel density and functionality of the
remaining interior space. Engineering judgment was used to determine the maximum height that
a building could be built to in each of the four prototype cities because the admissibility of the
masonry panel distribution and functionality of the interior space were considered to be
subjective questions heavily dependent on the preferred practice of the designer and the unique
requirements of the building project. Using the average response modification coefficient, an R
of 6, for the range considered, approximate height restrictions may be estimated for each seismic
zone. Considering all of the schematic diagrams that were developed it appeared reasonable to
limit the Type I system to buildings of six stories or less in high seismic zones, nine stories or
less in moderate seismic zones, and in low seismic zones the hybrid masonry system proved to
be a practical solution for all of the prototype buildings considered, including the tallest twelve
story structure.
The full set of schematic diagrams is displayed in Appendix A which includes the
possible masonry panel distribution for each of the 26 prototype structures defined in Chapter 2:
Prototype Building Development, the full range of expected R values are included as well to
show how the response modification coefficient affects system feasibility.
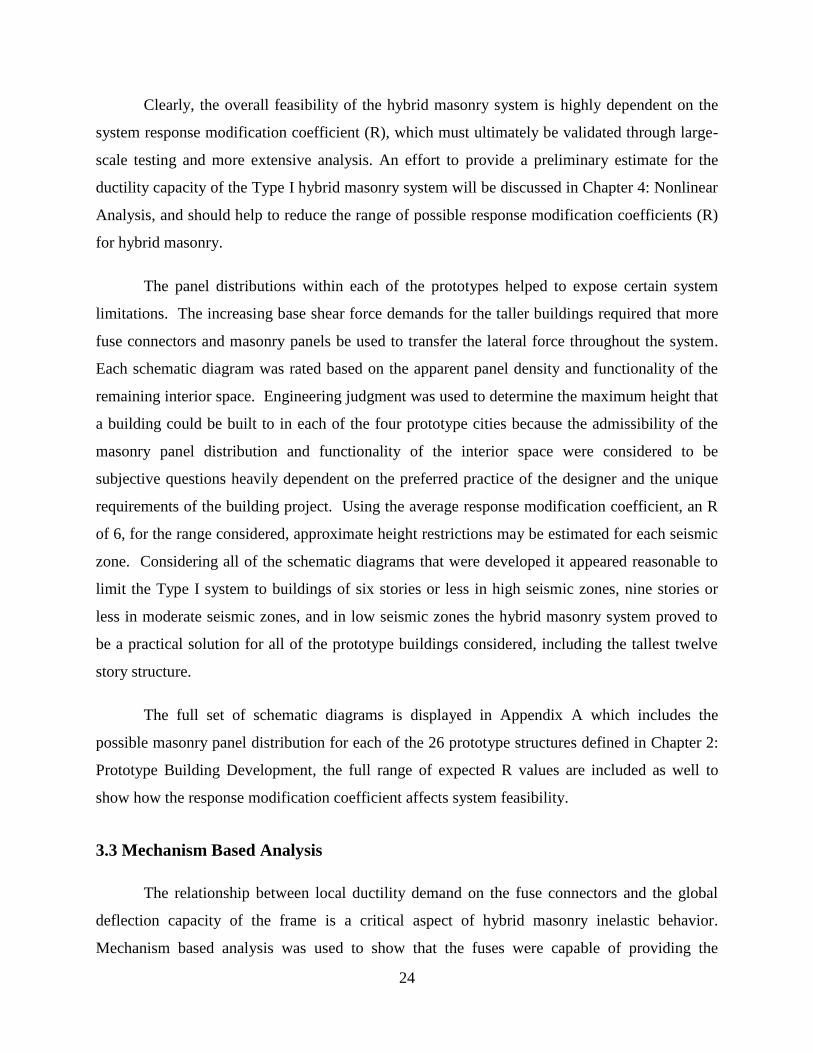
3.3 Mechanism Based Analysis
The relationship between local ductility demand on the fuse connectors and the global
deflection capacity of the frame is a critical aspect of hybrid masonry inelastic behavior.
Mechanism based analysis was used to show that the fuses were capable of providing the
25
necessary ductility to ensure that all of the fuse connectors began to yield prior to any single pair
of fuses reaching their ultimate deflection capacity, and to verify that the steel column sizes
could be selected to efficiently resist the formation of undesirable failure mechanisms. Two
common failure modes were considered; a uniform global failure mechanism and a soft story
mechanism, both of which are displayed in Figure 3.6. Soft story failure mechanisms are
generally considered less desirable because they lead to the formation of plastic hinges in
columns which can ultimately reduce overall frame stability and lead to collapse of the entire
structure.
Figure 3.6: Typical Failure Mechanisms (a) Uniform Global (b) Soft Story Level 1 (c) Soft Story Level 2 (d)
Soft Story Level 3
The failure mechanism analysis made use of the Plastic Limit Load-Energy Method
(Salmon et al. 2009) which defines the collapse mechanism as the plastic limit load that is
reached when a member moves some virtual displacement. To maintain overall system
equilibrium, the external work done by this load must be equal to the internal strain energy
created by the corresponding plastic moment of that same member rotating through a small angle
of rotation. Therefore acceptable ranges of column sizes were determined to reduce the
possibility of plastic hinge formation within the critical structural frame elements (columns).
Ultimately, the mechanism analysis provided an upper bound to the flexural capacity of the
columns, so it does not ensure that a soft story mechanism will be prevented. The equilibrium
condition used to estimate the flexural capacity requirements of the steel columns is worked out
in Equation 3.3 through Equation 3.7. The estimate for the minimum required plastic flexural
capacity of the steel columns found in Equation 3.7 allows the designer to select the most
Plastic Hinge
(a) (b) (c) (d)
26
economical cross-section capable of providing the necessary flexural capacity to encourage the
formation of a global failure mechanism.
(3.3)
∑ ∑( ) ∑ (3.4)
∑ ∑ (
) ∑ (3.5)
∑ ∑ (
) ∑ (3.6)
∑ ∑ (
) (3.7)
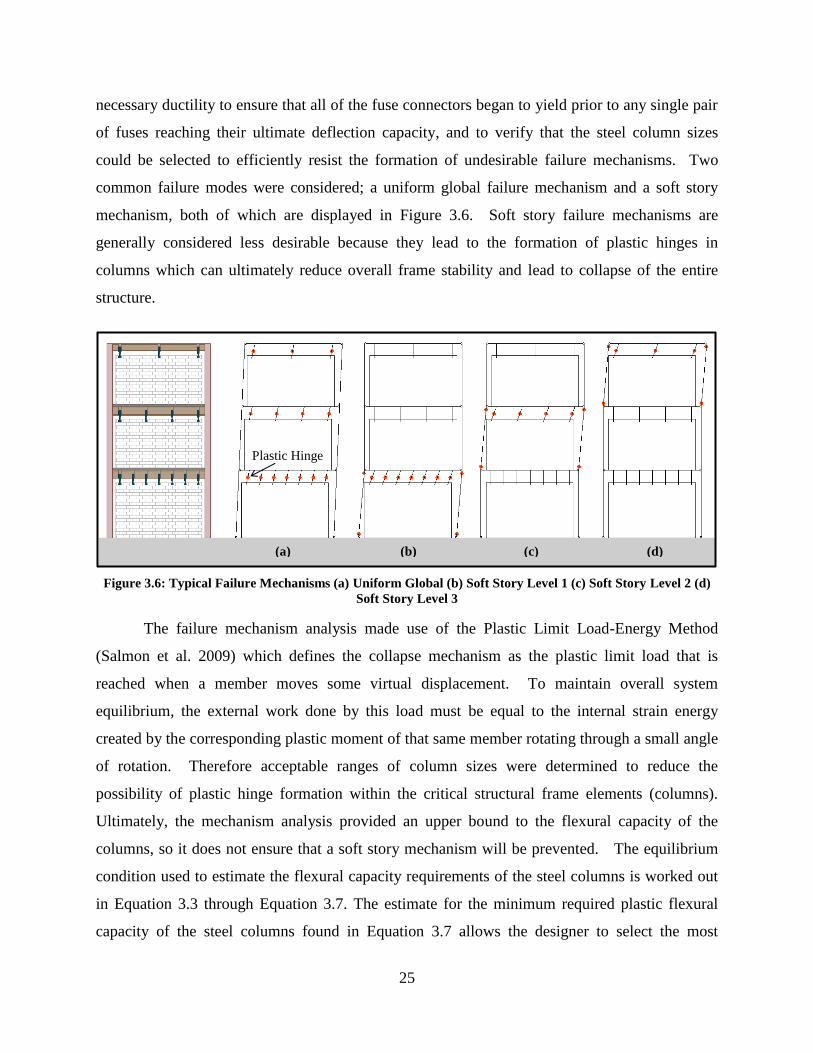
The load pattern that was used throughout the mechanism analysis was the typical design load
pattern shown in Figure 3.7.
Figure 3.7: Mechanism Analysis (a) Frame and Load Profile (b) Geometrical Parameters (c) Fuse Detail
Figure 3.7 also helps to define the geometric parameters introduced in Equation 3.4 through
Equation 3.7 above. For this analysis Fi represents the lateral force applied at level i, Δi is the
lateral deflection at level i, Mpfuse is the plastic flexural capacity of the fuse connector, ϴi is the
(a) (b) (c)
27
angle of rotation of the fuse connectors at story i, Mpcol is the plastic flexural capacity of the
column, φ is the angle of rotation at the base of the steel frame, Hi is the total height of level i
measured from the point of rotation, δi is the lateral deflection of the fuses at level i, and hf is the
height of the fuse connector.
3.4 Pushover Analysis
The ductility demand on the fuse connectors was studied by conducting simple static
pushover analyses. The intention was to verify that the fuse connectors could be adequately
distributed across the full building height to provide the necessary ductility to allow for the
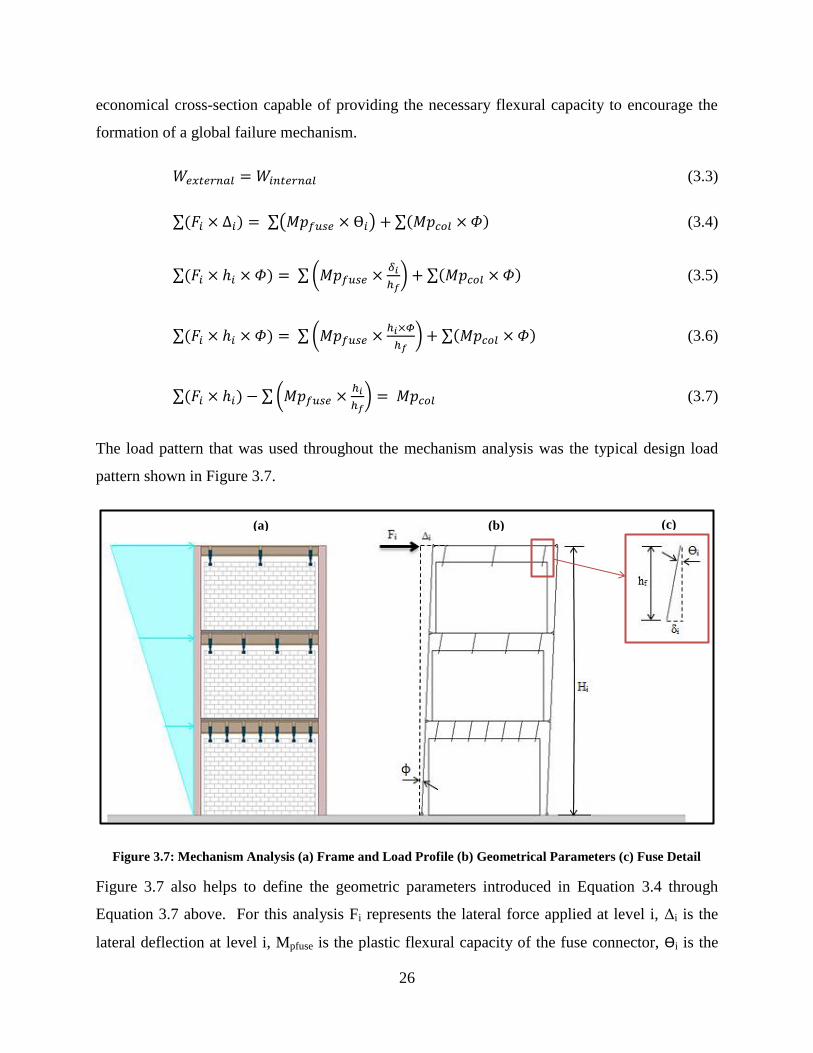
formation of a uniform global failure mechanism. This initial analysis made use of the cyclic
load-deflection data from a single pair of fuse plates tested at the University of Hawaii at Manoa
(Goodnight et al. 2011). The hysteretic loops were used to create an approximate bi-linear
backbone curve which represented the elastic and inelastic response of the fuse connectors, seen
in Figure 3.8.
Figure 3.8: Hysteretic Response for Single Pair of Tapered Fuses with Load Deflection Backbone
A summative force-deflection curve was developed for each individual building story by
multiplying the yield and ultimate force capacities of a single pair of fuses by the number of
Displacement (in)
Bi-Linear Backbone
Lo
ad
(k
ips)
28
pairs of fuse connectors located at each corresponding level. It was assumed that the entire
structural system would act as the collective sum of its parts, thus the total shear capacity for any
given floor was estimated based on the number of connectors distributed across the entire
building story. The stiffness of the masonry panels and steel frame were also included in the
analysis; however, since the fuses are much more flexible and account for a much greater portion
of the lateral deflection of the building, the resulting pushover curves closely resemble the bi-
linear backbone defined in Figure 3.8.
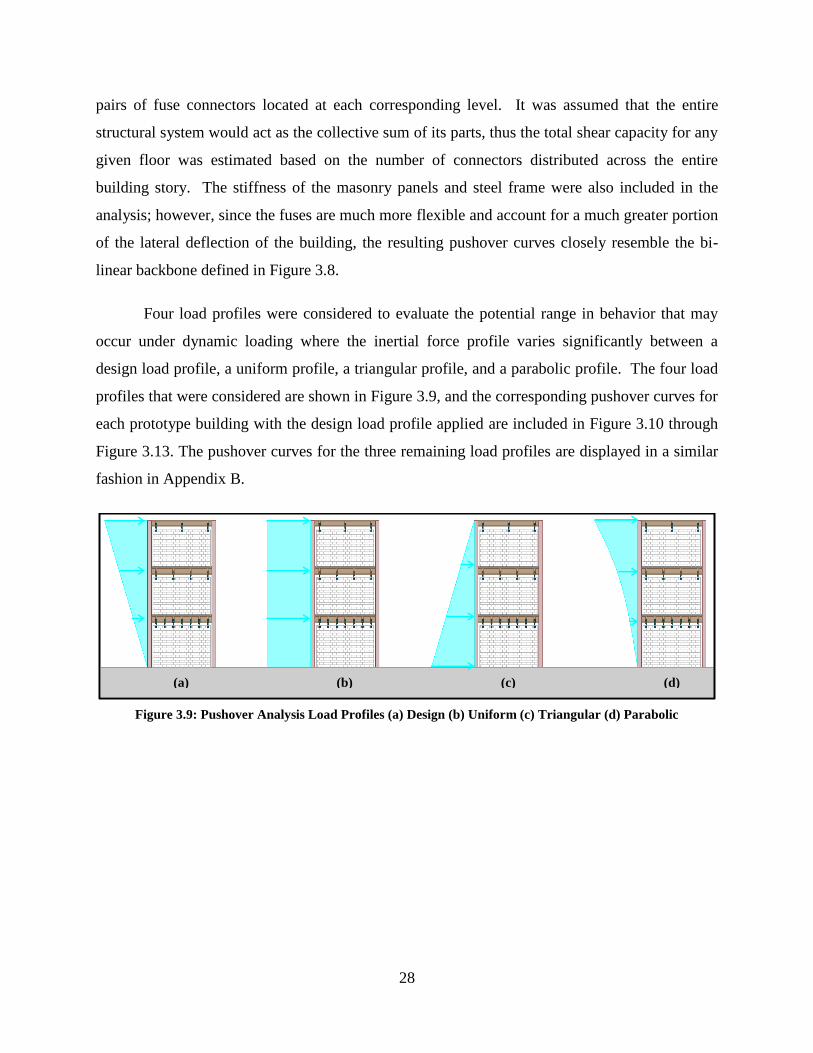
Four load profiles were considered to evaluate the potential range in behavior that may
occur under dynamic loading where the inertial force profile varies significantly between a
design load profile, a uniform profile, a triangular profile, and a parabolic profile. The four load
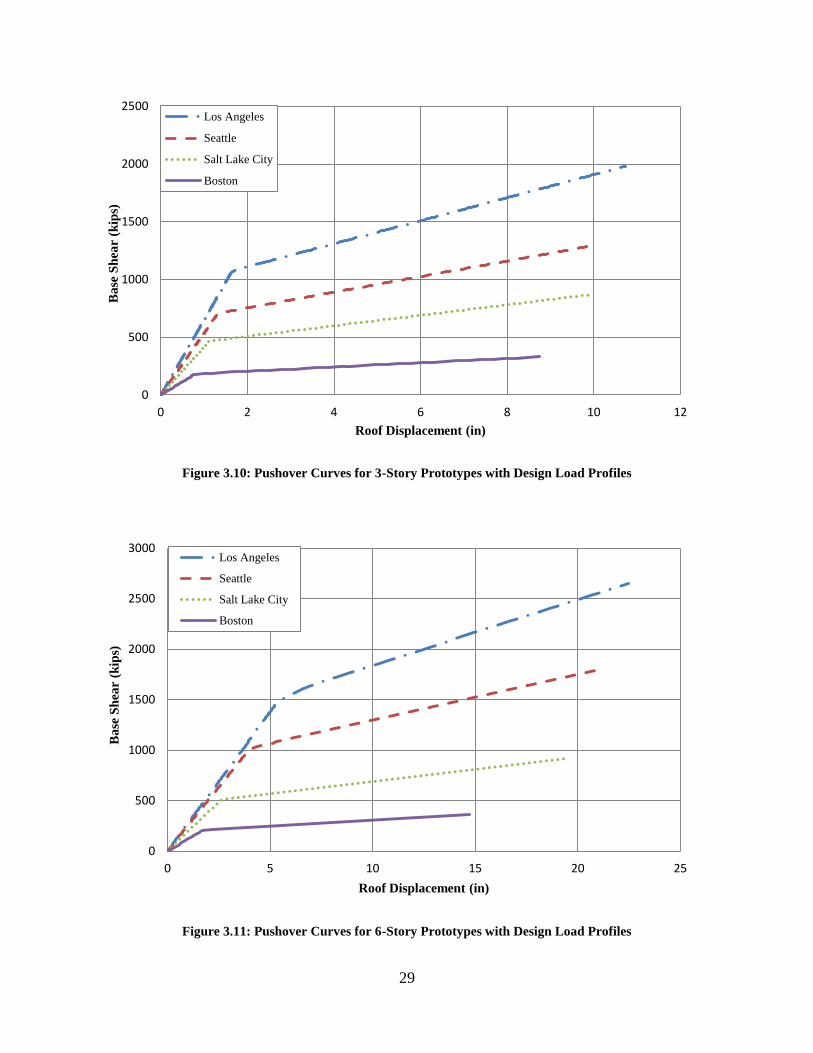
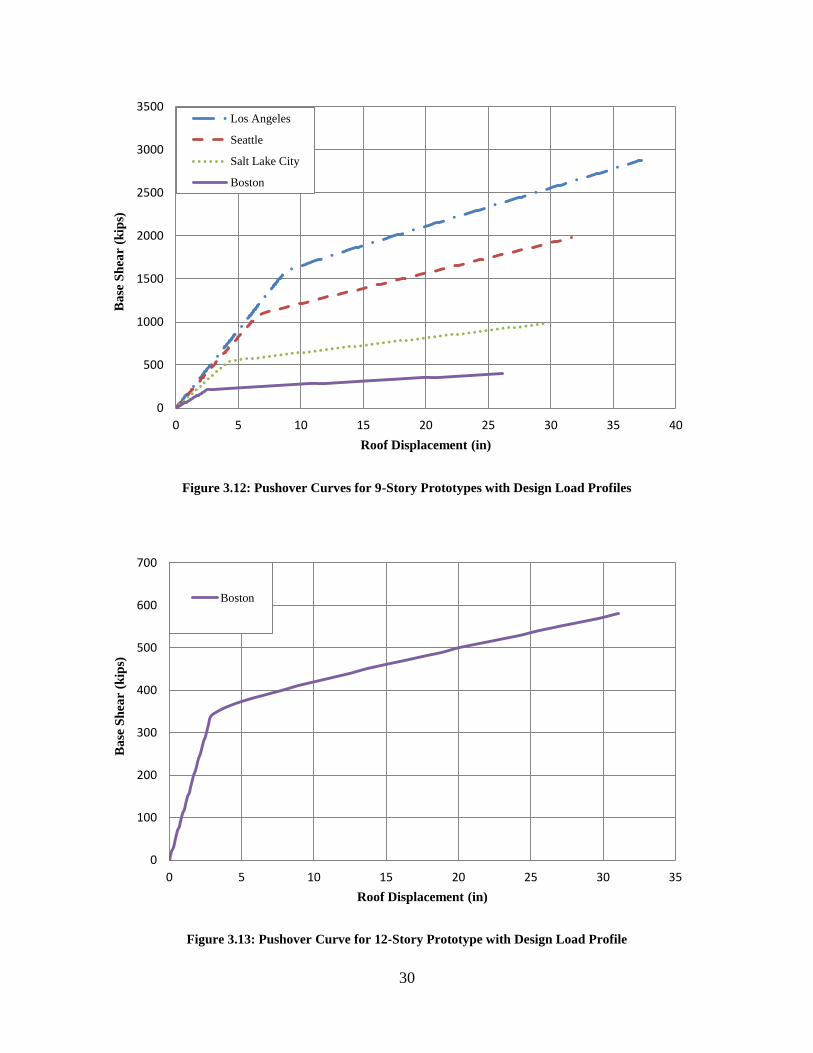
profiles that were considered are shown in Figure 3.9, and the corresponding pushover curves for
each prototype building with the design load profile applied are included in Figure 3.10 through
Figure 3.13. The pushover curves for the three remaining load profiles are displayed in a similar
fashion in Appendix B.
Figure 3.9: Pushover Analysis Load Profiles (a) Design (b) Uniform (c) Triangular (d) Parabolic
(a) (b) (c) (d)
29
Figure 3.10: Pushover Curves for 3-Story Prototypes with Design Load Profiles
Figure 3.11: Pushover Curves for 6-Story Prototypes with Design Load Profiles
0
500
1000
1500
2000
2500
0 2 4 6 8 10 12
Ba
se S
hea
r (k
ips)
Roof Displacement (in)
Los Angeles
Seattle
Salt Lake City
Boston
0
500
1000
1500
2000
2500
3000
0 5 10 15 20 25
Ba
se S
hea
r (k
ips)
Roof Displacement (in)
Los Angeles
Seattle
Salt Lake City
Boston
30
Figure 3.12: Pushover Curves for 9-Story Prototypes with Design Load Profiles
Figure 3.13: Pushover Curve for 12-Story Prototype with Design Load Profile
0
500
1000
1500
2000
2500
3000
3500
0 5 10 15 20 25 30 35 40
Ba
se S
hea
r (k
ips)
Roof Displacement (in)
Los Angeles
Seattle
Salt Lake City
Boston
0
100
200
300
400
500
600
700
0 5 10 15 20 25 30 35
Ba
se S
hea
r (k
ips)
Roof Displacement (in)
Boston
31
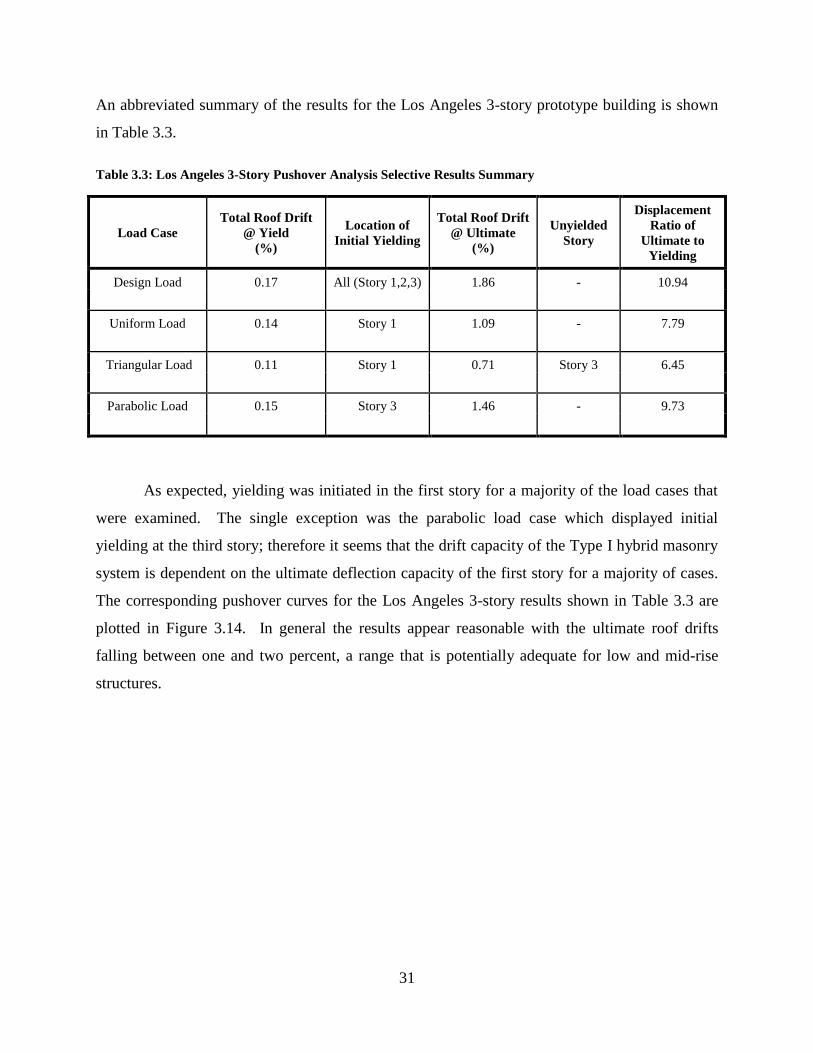
An abbreviated summary of the results for the Los Angeles 3-story prototype building is shown
in Table 3.3.
Table 3.3: Los Angeles 3-Story Pushover Analysis Selective Results Summary
Load Case
Total Roof Drift
@ Yield
(%)
Location of
Initial Yielding
Total Roof Drift
@ Ultimate
(%)
Unyielded
Story
Displacement
Ratio of
Ultimate to
Yielding
Design Load 0.17 All (Story 1,2,3) 1.86 - 10.94
Uniform Load 0.14 Story 1 1.09 - 7.79
Triangular Load 0.11 Story 1 0.71 Story 3 6.45
Parabolic Load 0.15 Story 3 1.46 - 9.73
As expected, yielding was initiated in the first story for a majority of the load cases that
were examined. The single exception was the parabolic load case which displayed initial
yielding at the third story; therefore it seems that the drift capacity of the Type I hybrid masonry
system is dependent on the ultimate deflection capacity of the first story for a majority of cases.
The corresponding pushover curves for the Los Angeles 3-story results shown in Table 3.3 are
plotted in Figure 3.14. In general the results appear reasonable with the ultimate roof drifts
falling between one and two percent, a range that is potentially adequate for low and mid-rise
structures.
32
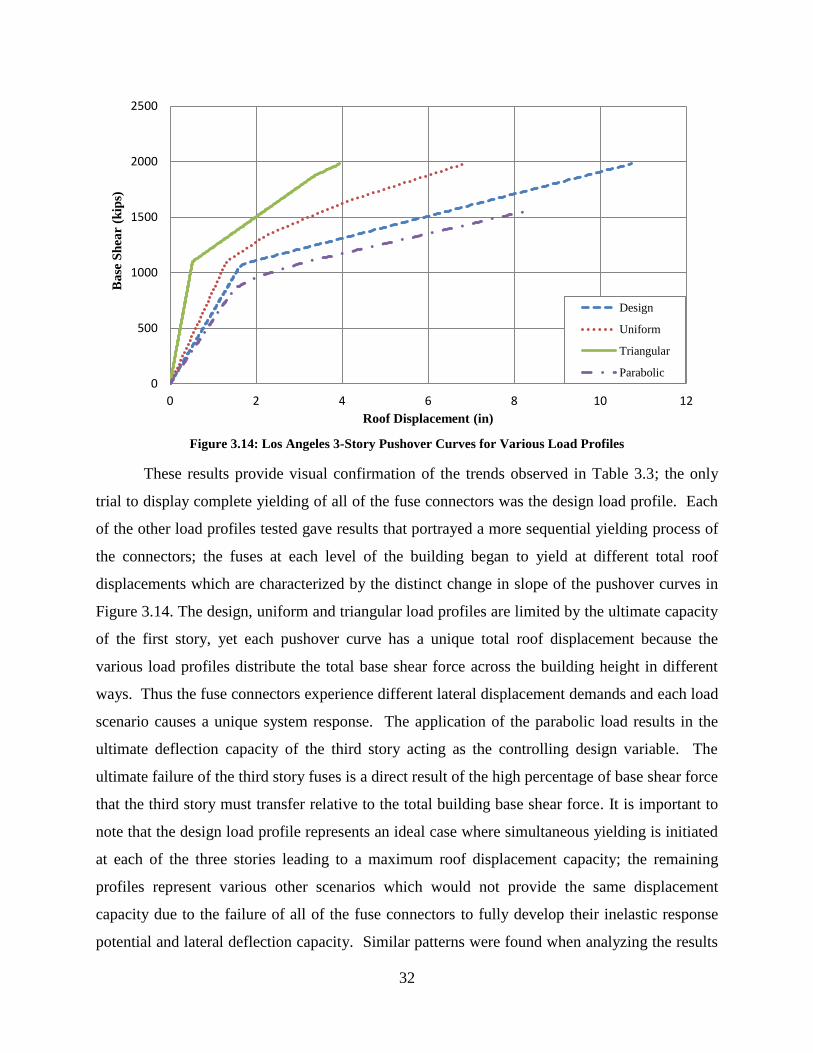
Figure 3.14: Los Angeles 3-Story Pushover Curves for Various Load Profiles
These results provide visual confirmation of the trends observed in Table 3.3; the only
trial to display complete yielding of all of the fuse connectors was the design load profile. Each
of the other load profiles tested gave results that portrayed a more sequential yielding process of
the connectors; the fuses at each level of the building began to yield at different total roof
displacements which are characterized by the distinct change in slope of the pushover curves in
Figure 3.14. The design, uniform and triangular load profiles are limited by the ultimate capacity
of the first story, yet each pushover curve has a unique total roof displacement because the
various load profiles distribute the total base shear force across the building height in different
ways. Thus the fuse connectors experience different lateral displacement demands and each load
scenario causes a unique system response. The application of the parabolic load results in the
ultimate deflection capacity of the third story acting as the controlling design variable. The
ultimate failure of the third story fuses is a direct result of the high percentage of base shear force
that the third story must transfer relative to the total building base shear force. It is important to
note that the design load profile represents an ideal case where simultaneous yielding is initiated
at each of the three stories leading to a maximum roof displacement capacity; the remaining
profiles represent various other scenarios which would not provide the same displacement
capacity due to the failure of all of the fuse connectors to fully develop their inelastic response
potential and lateral deflection capacity. Similar patterns were found when analyzing the results
0
500
1000
1500
2000
2500
0 2 4 6 8 10 12
Ba
se S
hea
r (k
ips)
Roof Displacement (in)
Design
Uniform
Triangular
Parabolic
33
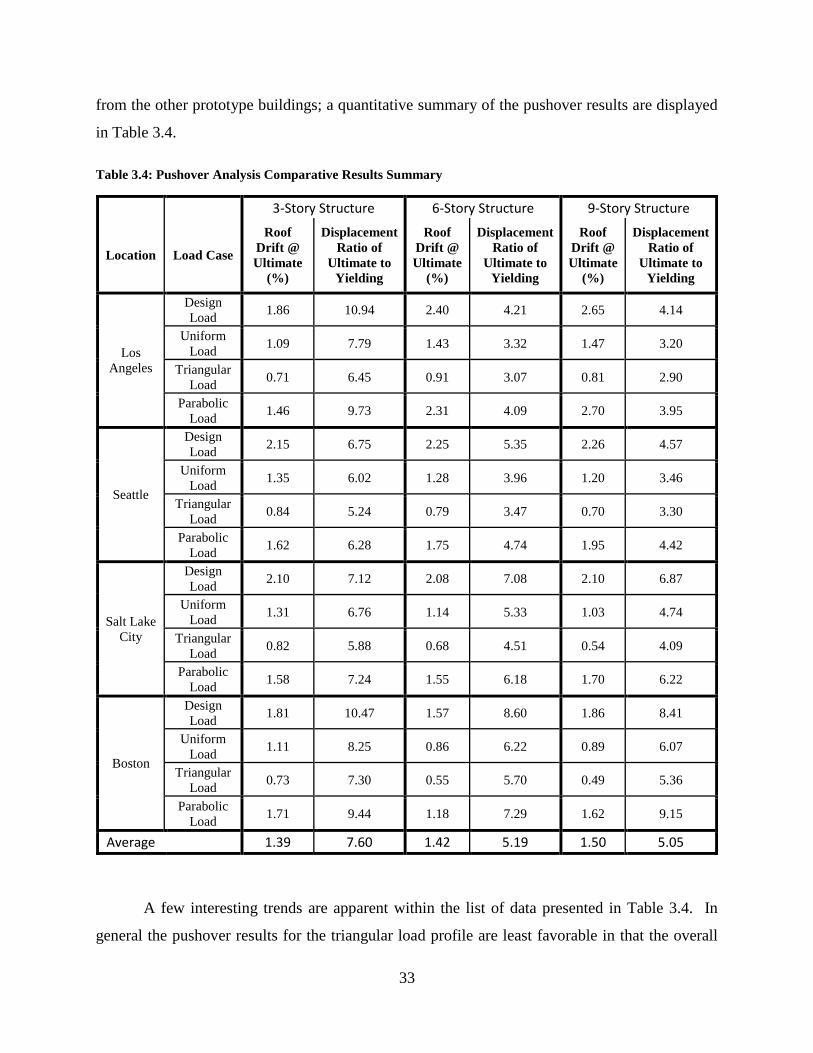
from the other prototype buildings; a quantitative summary of the pushover results are displayed
in Table 3.4.
Table 3.4: Pushover Analysis Comparative Results Summary
3-Story Structure 6-Story Structure 9-Story Structure
Location Load Case
Roof
Drift @
Ultimate
(%)
Displacement
Ratio of
Ultimate to
Yielding
Roof
Drift @
Ultimate
(%)
Displacement
Ratio of
Ultimate to
Yielding
Roof
Drift @
Ultimate
(%)
Displacement
Ratio of
Ultimate to
Yielding
Los
Angeles
Design
Load 1.86 10.94 2.40 4.21 2.65 4.14
Uniform
Load 1.09 7.79 1.43 3.32 1.47 3.20
Triangular
Load 0.71 6.45 0.91 3.07 0.81 2.90
Parabolic
Load 1.46 9.73 2.31 4.09 2.70 3.95
Seattle
Design
Load 2.15 6.75 2.25 5.35 2.26 4.57
Uniform
Load 1.35 6.02 1.28 3.96 1.20 3.46
Triangular
Load 0.84 5.24 0.79 3.47 0.70 3.30
Parabolic
Load 1.62 6.28 1.75 4.74 1.95 4.42
Salt Lake
City
Design
Load 2.10 7.12 2.08 7.08 2.10 6.87
Uniform
Load 1.31 6.76 1.14 5.33 1.03 4.74
Triangular
Load 0.82 5.88 0.68 4.51 0.54 4.09
Parabolic
Load 1.58 7.24 1.55 6.18 1.70 6.22
Boston
Design
Load 1.81 10.47 1.57 8.60 1.86 8.41
Uniform
Load 1.11 8.25 0.86 6.22 0.89 6.07
Triangular
Load 0.73 7.30 0.55 5.70 0.49 5.36
Parabolic
Load 1.71 9.44 1.18 7.29 1.62 9.15
Average
1.39 7.60 1.42 5.19 1.50 5.05
A few interesting trends are apparent within the list of data presented in Table 3.4. In
general the pushover results for the triangular load profile are least favorable in that the overall
34
system ductility and total roof drift at failure are the lowest computed values compared to all of
the other load profiles tested. The cities located in the low and moderate seismic zones, Boston,
Salt Lake City, and Seattle, performed best because nearly all of the prototype buildings
analyzed in these regions provided greater ductility than the average displacement ratio of
ultimate to yielding for the full range of seismic hazard considered. The single exception to this
pattern is seen in the Los Angeles 3-story building which did actually provide large levels of
ductility. The Los Angeles 3-story prototype was used extensively throughout the analysis
process, and ultimately this additional commitment to optimizing the distribution of strength
between the three levels likely led to the increased levels of ductility. In general, all of the 3-
story structures performed quite well, offering high structural system ductility, and as the height
of the prototype buildings increased the magnitude of the calculated ductility decreased. This
suggests that the location of the fuse connectors in the taller buildings were not adequately
distributed amongst the various levels to optimize the inelastic response of all connectors at each
story. Certainly these simple pushover analyses are useful tools that aid in understanding the
hybrid masonry system response; however, the analysis could be improved by either increasing
the level of detail used to model the inelastic response of the fuse connectors or by running
dynamic analyses. The latter option is outside the scope of this report, but improved modeling
techniques used to increase the accuracy of the inelastic response of the fuse connectors is
discussed in Chapter 4: Nonlinear System Response. An extended collection of pushover curves
and numerical results for the various load profiles discussed above are included in Appendix B.
3.5 Summary of Results
Current industry practice has limited hybrid masonry structures to low-rise construction
in the eastern half of the United States where wind loading tends to govern the structural system
design (Biggs 2013). However, based on the results from the feasibility analysis discussed
above, the application of Type I hybrid masonry systems appear to provide a practical option for
much taller buildings and may be used in areas of greater seismic activity. A number of
assumptions were made and have been previously introduced which allowed for the completion
of the entire equivalent lateral force procedure and feasibility analysis. Arguably the most
critical assumption made was the range of response modification coefficients to test; the
feasibility results collected over this range of scenarios were averaged to provide height
35
restrictions for typical buildings in the variety of seismic regions considered assuming a response
modification coefficient of 6 for the Type I hybrid masonry system.
Type I hybrid masonry buildings in high seismic zones, like Los Angeles, appear viable
for shorter buildings less than six stories.
Buildings in zones of less severe but still appreciable seismic activity, similar to Seattle
or Salt Lake City, appear viable for buildings up to nine stories, if Type I hybrid masonry
is to be employed.
The full set of prototype buildings considered in this study, up to twelve stories, appears
to be viable for Type I hybrid masonry buildings in low to moderate seismic zones, like
Boston.
These heights correspond to practical arrangements of hybrid panels that are admissible for
architectural layouts and occupancy types. The height limitations are not absolute values, and
they may not be applicable for every situation. Rather, they provide a target maximum height
which may need to be adjusted on a per case basis depending on unique site conditions and the
level of understanding the designer has with the structural mechanics of the hybrid masonry
system.
The completion of the mechanism based analysis shows that the hybrid masonry system
is capable of providing the ductility and design flexibility needed to reduce the chances of the
formation of unwanted soft story mechanisms. It also provided a starting point for further
analysis and development of a steel column design procedure. The development of the numerous
pushover curves for each of the prototype buildings provided visual verification that Type I
hybrid masonry systems with fuse connectors offer the necessary ductility to allow for roof drifts
of one to two percent. These simple models will be useful tools for comparison in the future
when more intricate, non-linear pushover analyses are run to better capture the inelastic behavior
of the fuse connectors in Type I systems.
Overall the Type I hybrid masonry system with fuse type connectors offers a great deal of
promise based on the simple feasibility analyses completed and summarized in this section. The
current limits in application may be expanded beyond contemporary practice in low seismic

36
areas, and the hybrid masonry structural system also provides a practical alternative for both
moderate and high seismic regions where it is not currently being considered.
37
CHAPTER 4: NONLINEAR SYSTEM RESPONSE
Nonlinear pushover analysis was used to study the distribution of ductility demands
considering more realistic inelastic behavior of the fuse connectors. The Open System for
Earthquake Engineering Simulation (OpenSees) software platform was used for the nonlinear
pushover analysis and the results were compared to those from the simplified pushover analysis
that was previously discussed (McKenna et al. 2006).
4.1 OpenSees Nonlinear Inelastic Modeling
The inelastic response of the hybrid masonry system is a key component which must be
considered before development of a performance-based capacity design procedure. The location
of the inelastic response and the corresponding system ductility is dictated by the relative
strengths of the masonry panels and steel connectors. When considering the case where fuse
connectors are employed to join the steel frame and concrete masonry walls, the overall design
objective is to induce a uniform, global failure mechanism. To achieve this goal, the lateral
strength of the system must be appropriately proportioned between each of the building’s stories,
and because the distribution of system strength is related to the distribution of fuse connectors it
is vital to confirm that the preliminary design distribution of connectors used in the feasibility
analysis is adequate.
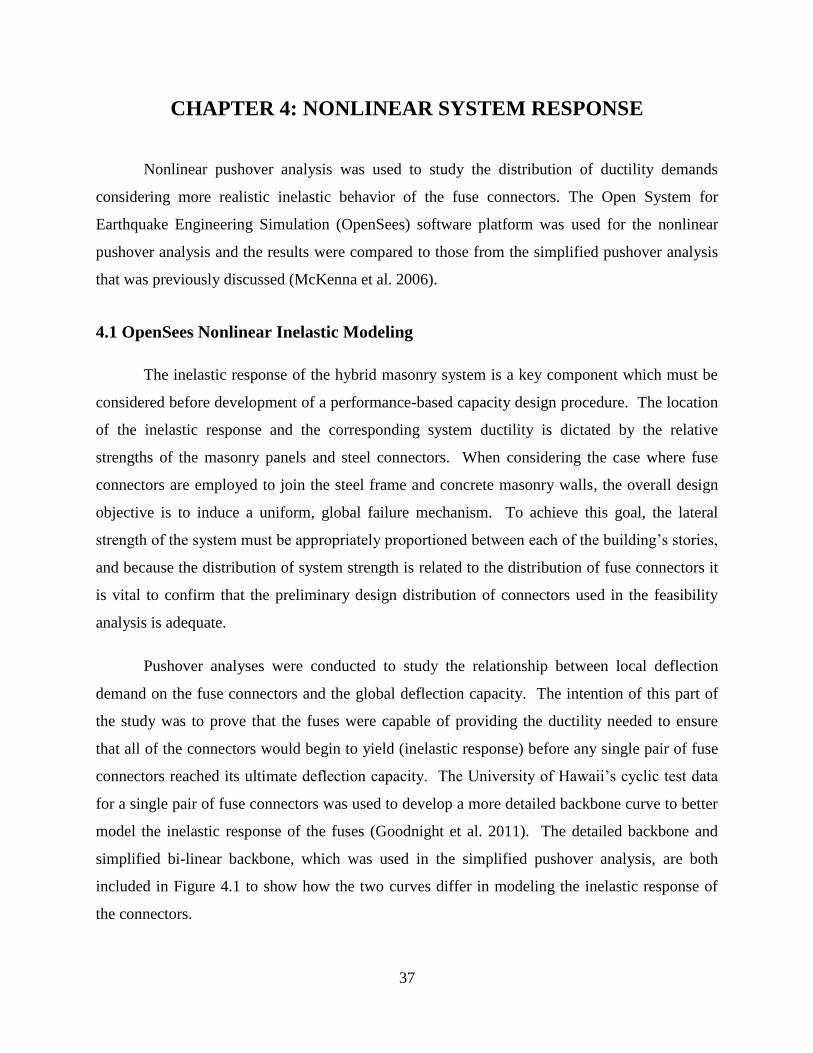
Pushover analyses were conducted to study the relationship between local deflection
demand on the fuse connectors and the global deflection capacity. The intention of this part of
the study was to prove that the fuses were capable of providing the ductility needed to ensure
that all of the connectors would begin to yield (inelastic response) before any single pair of fuse
connectors reached its ultimate deflection capacity. The University of Hawaii’s cyclic test data
for a single pair of fuse connectors was used to develop a more detailed backbone curve to better
model the inelastic response of the fuses (Goodnight et al. 2011). The detailed backbone and
simplified bi-linear backbone, which was used in the simplified pushover analysis, are both
included in Figure 4.1 to show how the two curves differ in modeling the inelastic response of
the connectors.
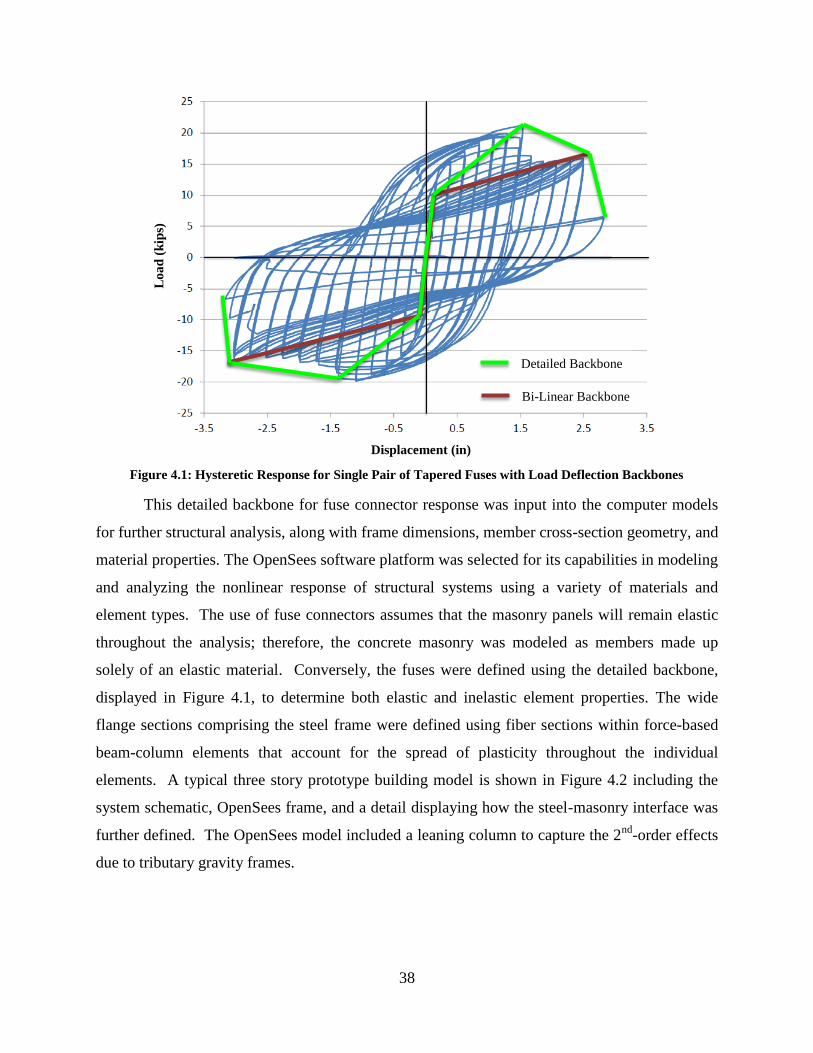
38
Figure 4.1: Hysteretic Response for Single Pair of Tapered Fuses with Load Deflection Backbones
This detailed backbone for fuse connector response was input into the computer models
for further structural analysis, along with frame dimensions, member cross-section geometry, and
material properties. The OpenSees software platform was selected for its capabilities in modeling
and analyzing the nonlinear response of structural systems using a variety of materials and
element types. The use of fuse connectors assumes that the masonry panels will remain elastic
throughout the analysis; therefore, the concrete masonry was modeled as members made up
solely of an elastic material. Conversely, the fuses were defined using the detailed backbone,
displayed in Figure 4.1, to determine both elastic and inelastic element properties. The wide
flange sections comprising the steel frame were defined using fiber sections within force-based
beam-column elements that account for the spread of plasticity throughout the individual
elements. A typical three story prototype building model is shown in Figure 4.2 including the
system schematic, OpenSees frame, and a detail displaying how the steel-masonry interface was
further defined. The OpenSees model included a leaning column to capture the 2nd
-order effects
due to tributary gravity frames.
Displacement (in)
Bi-Linear Backbone
Lo
ad
(k
ips)
Detailed Backbone
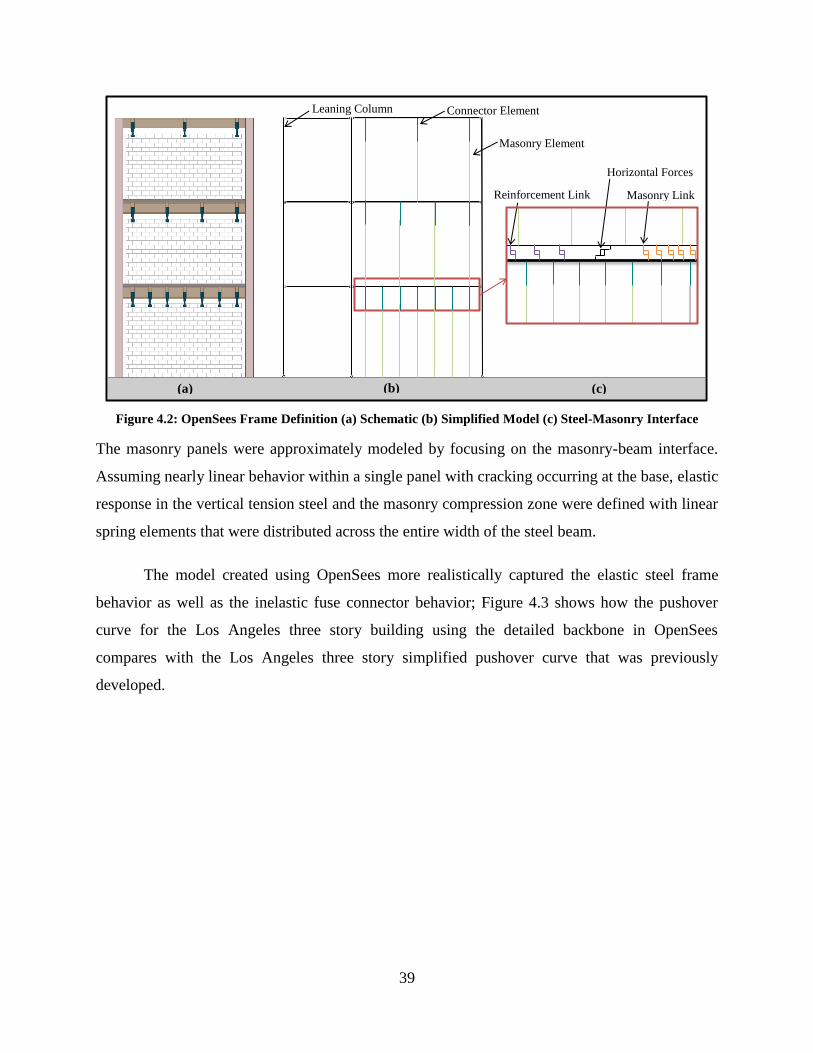
39
Figure 4.2: OpenSees Frame Definition (a) Schematic (b) Simplified Model (c) Steel-Masonry Interface
The masonry panels were approximately modeled by focusing on the masonry-beam interface.
Assuming nearly linear behavior within a single panel with cracking occurring at the base, elastic
response in the vertical tension steel and the masonry compression zone were defined with linear
spring elements that were distributed across the entire width of the steel beam.
The model created using OpenSees more realistically captured the elastic steel frame
behavior as well as the inelastic fuse connector behavior; Figure 4.3 shows how the pushover
curve for the Los Angeles three story building using the detailed backbone in OpenSees
compares with the Los Angeles three story simplified pushover curve that was previously
developed.
Leaning Column Connector Element
Masonry Element
Reinforcement Link Masonry Link
(a) (b) (c)
Horizontal Forces
40
Figure 4.3: Los Angeles 3-Story Pushover Analysis Comparison
The two analyses converge to the same ultimate displacement and strength, although the
path taken to that final point is quite different. The OpenSees analysis using the detailed
backbone curve has a lower initial stiffness since the model includes flexibilities that were not
considered in the simplified model. Comparisons between the more detailed nonlinear OpenSees
pushover analyses and the simplified pushover analyses that were previously conducted may be
found in Appendix C which includes direct comparisons between the two curves for each
prototype building.
The OpenSees models also provided a tool to further examine the possible formation of
soft story mechanisms within the structure. An initial trial was run for each of the prototype
buildings, and if it appeared that the distribution of fuse connectors was inadequate or if the
lateral displacement was concentrated within a single story, then the distribution of fuses was
altered and the model was reanalyzed. Cases with demand concentrated in a single story
typically had yielding in the steel columns, which should be avoided. By altering the distribution
of connectors and by adjusting the steel column cross section sizes, the overall inelastic response
of the building could be improved so that a uniform global failure mechanism was more likely to
control system response. These connector distributions were developed using the typical design
load profile that is based on first mode response, which is expected to govern for low-rise
0
500
1000
1500
2000
2500
0 2 4 6 8 10 12 14
Ba
se S
hea
r (k
ips)
Roof Displacement (in)
SimplifiedPushover
DetailedPushover
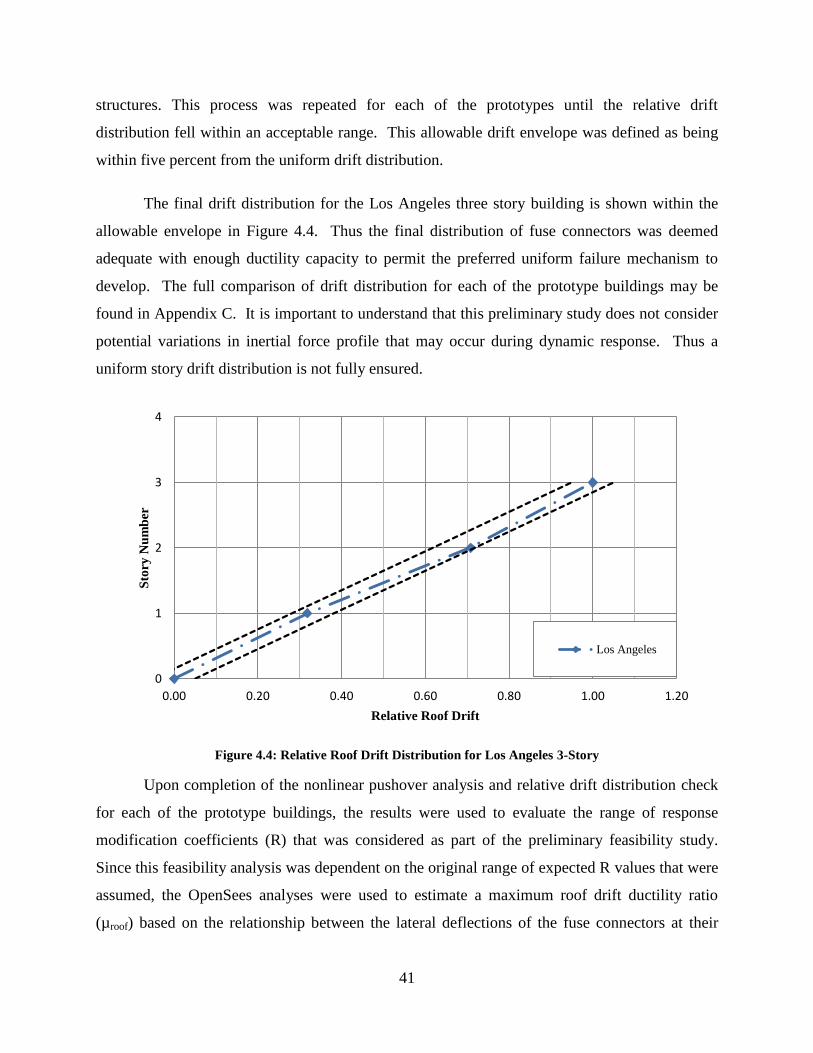
41
structures. This process was repeated for each of the prototypes until the relative drift
distribution fell within an acceptable range. This allowable drift envelope was defined as being
within five percent from the uniform drift distribution.
The final drift distribution for the Los Angeles three story building is shown within the
allowable envelope in Figure 4.4. Thus the final distribution of fuse connectors was deemed
adequate with enough ductility capacity to permit the preferred uniform failure mechanism to
develop. The full comparison of drift distribution for each of the prototype buildings may be
found in Appendix C. It is important to understand that this preliminary study does not consider
potential variations in inertial force profile that may occur during dynamic response. Thus a
uniform story drift distribution is not fully ensured.
Figure 4.4: Relative Roof Drift Distribution for Los Angeles 3-Story
Upon completion of the nonlinear pushover analysis and relative drift distribution check
for each of the prototype buildings, the results were used to evaluate the range of response
modification coefficients (R) that was considered as part of the preliminary feasibility study.
Since this feasibility analysis was dependent on the original range of expected R values that were
assumed, the OpenSees analyses were used to estimate a maximum roof drift ductility ratio
(µroof) based on the relationship between the lateral deflections of the fuse connectors at their
0
1
2
3
4
0.00 0.20 0.40 0.60 0.80 1.00 1.20
Sto
ry N
um
ber
Relative Roof Drift
Los Angeles
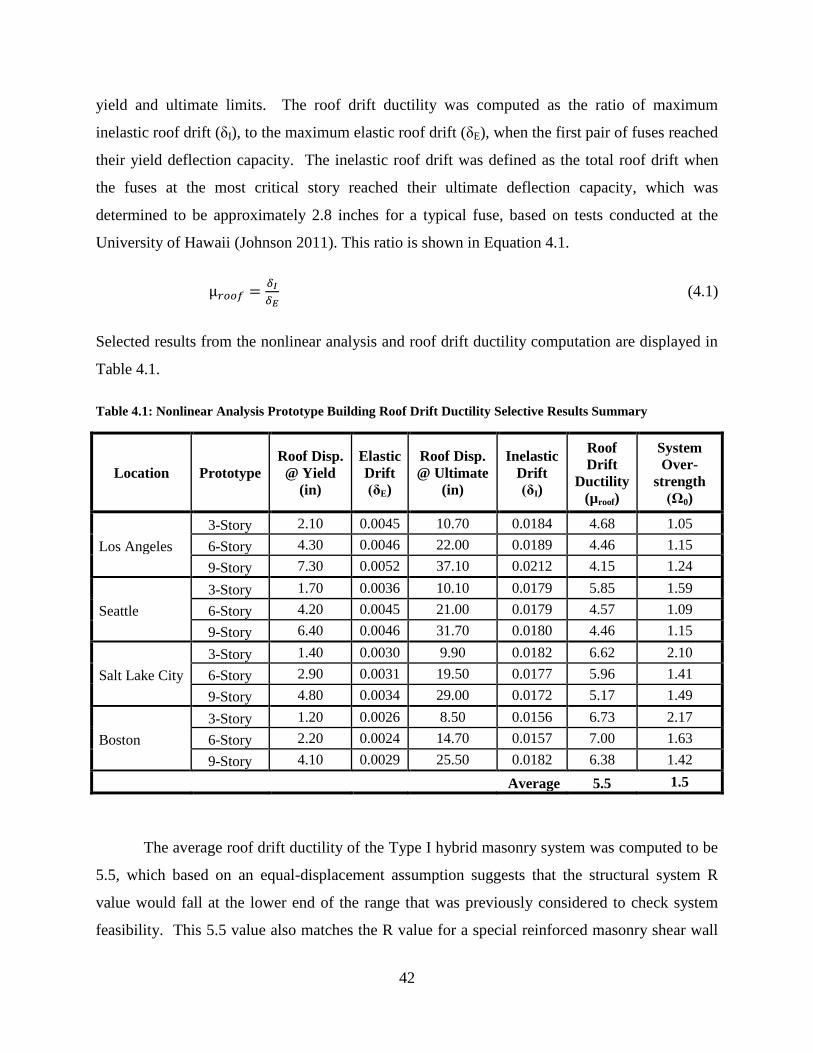
42
yield and ultimate limits. The roof drift ductility was computed as the ratio of maximum
inelastic roof drift (δI), to the maximum elastic roof drift (δE), when the first pair of fuses reached
their yield deflection capacity. The inelastic roof drift was defined as the total roof drift when
the fuses at the most critical story reached their ultimate deflection capacity, which was
determined to be approximately 2.8 inches for a typical fuse, based on tests conducted at the
University of Hawaii (Johnson 2011). This ratio is shown in Equation 4.1.
(4.1)
Selected results from the nonlinear analysis and roof drift ductility computation are displayed in
Table 4.1.
Table 4.1: Nonlinear Analysis Prototype Building Roof Drift Ductility Selective Results Summary
Location Prototype
Roof Disp.
@ Yield
(in)
Elastic
Drift
(δE)
Roof Disp.
@ Ultimate
(in)
Inelastic
Drift
(δI)
Roof
Drift
Ductility
(µroof)
System
Over-
strength
(Ω0)
3-Story 2.10 0.0045 10.70 0.0184 4.68 1.05
Los Angeles 6-Story 4.30 0.0046 22.00 0.0189 4.46 1.15
9-Story 7.30 0.0052 37.10 0.0212 4.15 1.24
3-Story 1.70 0.0036 10.10 0.0179 5.85 1.59
Seattle 6-Story 4.20 0.0045 21.00 0.0179 4.57 1.09
9-Story 6.40 0.0046 31.70 0.0180 4.46 1.15
3-Story 1.40 0.0030 9.90 0.0182 6.62 2.10
Salt Lake City 6-Story 2.90 0.0031 19.50 0.0177 5.96 1.41
9-Story 4.80 0.0034 29.00 0.0172 5.17 1.49
3-Story 1.20 0.0026 8.50 0.0156 6.73 2.17
Boston 6-Story 2.20 0.0024 14.70 0.0157 7.00 1.63
9-Story 4.10 0.0029 25.50 0.0182 6.38 1.42
Average 5.5 1.5
The average roof drift ductility of the Type I hybrid masonry system was computed to be
5.5, which based on an equal-displacement assumption suggests that the structural system R
value would fall at the lower end of the range that was previously considered to check system
feasibility. This 5.5 value also matches the R value for a special reinforced masonry shear wall
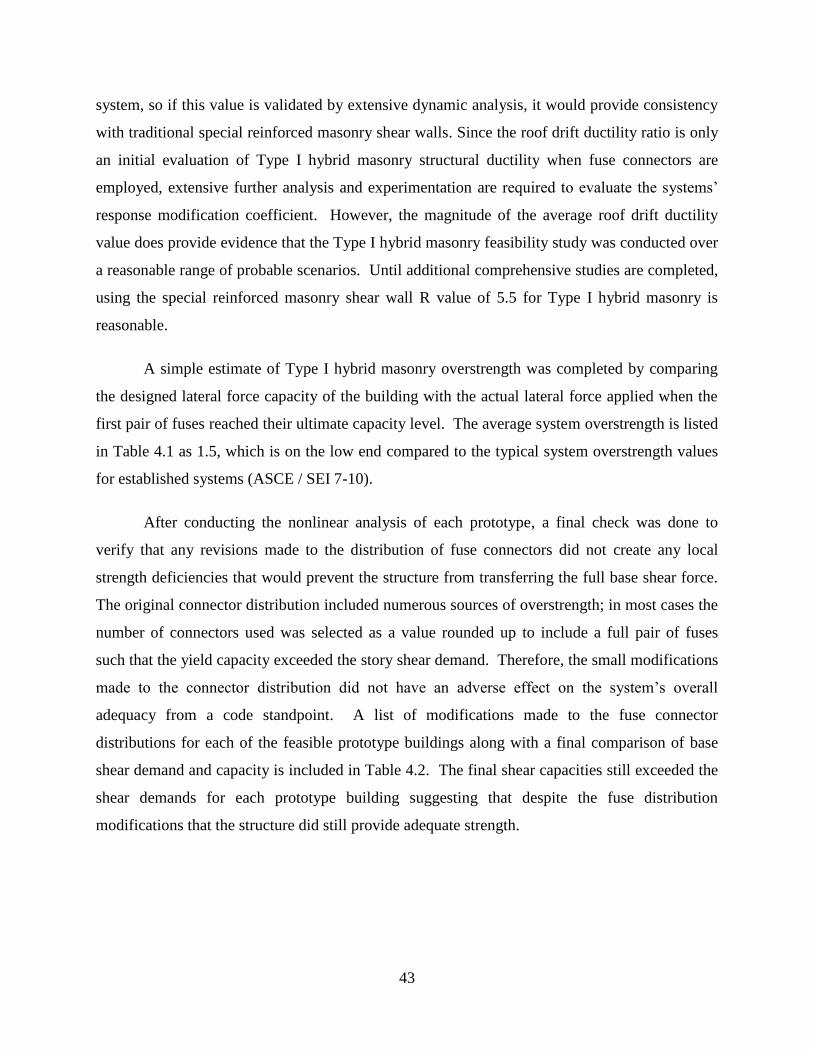
43
system, so if this value is validated by extensive dynamic analysis, it would provide consistency
with traditional special reinforced masonry shear walls. Since the roof drift ductility ratio is only
an initial evaluation of Type I hybrid masonry structural ductility when fuse connectors are
employed, extensive further analysis and experimentation are required to evaluate the systems’
response modification coefficient. However, the magnitude of the average roof drift ductility
value does provide evidence that the Type I hybrid masonry feasibility study was conducted over
a reasonable range of probable scenarios. Until additional comprehensive studies are completed,
using the special reinforced masonry shear wall R value of 5.5 for Type I hybrid masonry is
reasonable.
A simple estimate of Type I hybrid masonry overstrength was completed by comparing
the designed lateral force capacity of the building with the actual lateral force applied when the
first pair of fuses reached their ultimate capacity level. The average system overstrength is listed
in Table 4.1 as 1.5, which is on the low end compared to the typical system overstrength values
for established systems (ASCE / SEI 7-10).
After conducting the nonlinear analysis of each prototype, a final check was done to
verify that any revisions made to the distribution of fuse connectors did not create any local
strength deficiencies that would prevent the structure from transferring the full base shear force.
The original connector distribution included numerous sources of overstrength; in most cases the
number of connectors used was selected as a value rounded up to include a full pair of fuses
such that the yield capacity exceeded the story shear demand. Therefore, the small modifications
made to the connector distribution did not have an adverse effect on the system’s overall
adequacy from a code standpoint. A list of modifications made to the fuse connector
distributions for each of the feasible prototype buildings along with a final comparison of base
shear demand and capacity is included in Table 4.2. The final shear capacities still exceeded the
shear demands for each prototype building suggesting that despite the fuse distribution
modifications that the structure did still provide adequate strength.
44
Table 4.2: Prototype Building Fuse Distribution Modifications at Each Story
Fuse Distribution Modifications per Story
Location Prototype 1 2 3 4 5 6 7 8 9
Base Shear
Demand
(kips)
Base Shear
Capacity
(kips)
3-Story -2 2 0 1950 2045
Los Angeles 6-Story -2 -1 -2 0 1 0 2600 3000
9-Story -1 0 0 -3 0 0 0 0 0 2800 3475
3-Story -1 0 0 1250 1990
Seattle 6-Story 0 1 2 0 -1 0 1700 1850
9-Story 1 0 0 0 1 1 2 2 3 1965 2250
3-Story 1 0 0 815 1710
Salt Lake City 6-Story 1 2 0 0 1 0 900 1265
9-Story -1 0 0 0 0 0 0 0 0 940 1400
3-Story 0 0 0 300 650
Boston 6-Story -1 -1 -2 0 -2 0 325 530
9-Story 0 0 0 0 0 1 1 1 2 310 440
45
CHAPTER 5: DESIGN PROCEDURE
The following discussion will provide an overview of the current design procedures for
the Type I hybrid masonry system. The initial design concepts were originally presented in 2007
(Biggs 2007); however, since then research efforts have helped to create a more specific design
procedure. The essential parts of the hybrid masonry system design include the steel frame (the
beams, girders and columns), the steel frame connections, the fuse connectors, and the masonry
panels. In general, the design procedure will be modeled after typical capacity design approaches
where yielding elements are selected to allow for the formation of preferred failure mechanisms
and the remaining elements are then sized to ensure that they remain elastic. The focus of a
majority of this section will be on providing an overview of the unique design considerations that
are significant for the main hybrid masonry structural members. A complete design example
was conducted and is documented in Appendix D. The results of this design example are
included at the end of this chapter and include a comparison between a Type I hybrid masonry
system and a special concentrically braced frame for a three story prototype building located in
Los Angeles.
5.1 Capacity Design Approach
The first step of any capacity-based design procedure is to determine an ideal failure
mechanism and the corresponding locations that plastic hinges need to develop for the desired
mechanism to be achieved. The critical members where plastic hinges form must be detailed to
provide adequate ductility capacity in their inelastic response; the remaining elements are then
designed, based on the capacity of the yielding components, to remain elastic. Special moment-
resisting frames use a strong column weak beam (SCWB) approach where the system is designed
such that the plastic hinges form in the beam and girder members. Figure 3.6 shows a number of
common failure mechanisms as well as the locations of plastic hinge development. If plastic
hinges develop in the columns, then the stability of the structure may be compromised due to the
formation of a soft story mechanism, which may also be referred to as a weak column strong
beam (WCSB) case. Typically soft story mechanisms are considered undesirable modes of
failure due to their increased potential for causing a sidesway collapse. As was previously
46
discussed, it is important for the designer to not merely consider how each member will resist the
forces that are applied to it, but rather that the entire structure is proportioned so that the flexural
and shear strengths of the non-yielding members exceed the forces in the system that correspond
to the failure of the critical elements.
These common capacity-based design procedures lend themselves well to the design of
Type I hybrid masonry systems. The design intent must include evenly distributing the inelastic
system response over the full height of the building. Thus column hinging can be avoided and a
greater inelastic deflection capacity may be achieved with yielding at multiple levels. The goal
for Type I systems is to design the fuse connectors as the critical yielding elements. The fuses
provide the critical link between the steel frame and concrete masonry panels, allowing for the
transfer of shear forces between the frame and masonry while preventing the transfer of vertical
forces.
The following sections provide an overview of key design considerations, with focus on
load distribution and force transfer, which have been developed specifically for hybrid masonry
structural systems. Emphasis is placed on the components that make up the hybrid frames,
assuming that the remaining members would act much like traditional gravity frame systems for
which detailed design procedures are well established.
5.2 Design Considerations of Steel Frame Members
The design approach for the steel frame members that make up the hybrid masonry bays
must take into account all of the typical LRFD design load combinations, which in the context of
ASCE/SEI 7-10 (ASCE / SEI 7-10) are displayed in Equation 5.1 through Equation 5.5.
(5.1)
(5.2)
(5.3)
(5.4)
(5.5)
Note that the typical load combinations that include wind loads were not considered because one
of the goals of this research was to evaluate, through design and analysis, the seismic feasibility
of hybrid masonry structural systems.
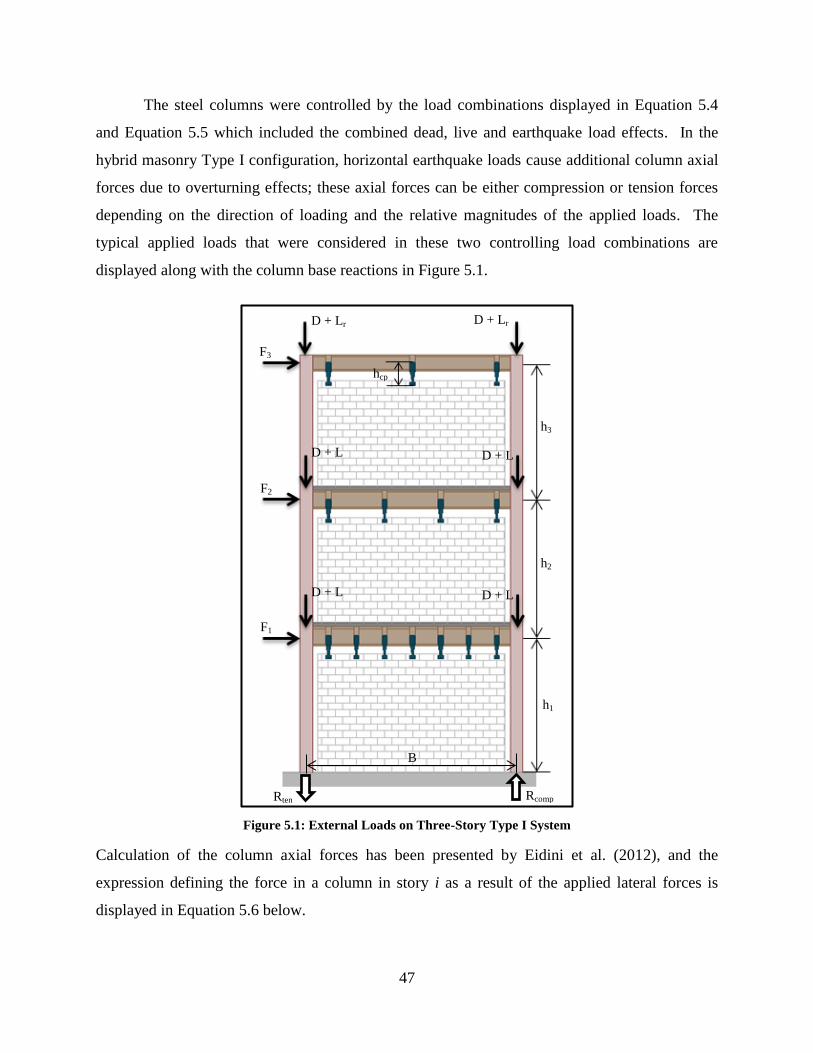
47
The steel columns were controlled by the load combinations displayed in Equation 5.4
and Equation 5.5 which included the combined dead, live and earthquake load effects. In the
hybrid masonry Type I configuration, horizontal earthquake loads cause additional column axial
forces due to overturning effects; these axial forces can be either compression or tension forces
depending on the direction of loading and the relative magnitudes of the applied loads. The
typical applied loads that were considered in these two controlling load combinations are
displayed along with the column base reactions in Figure 5.1.
Figure 5.1: External Loads on Three-Story Type I System
Calculation of the column axial forces has been presented by Eidini et al. (2012), and the
expression defining the force in a column in story i as a result of the applied lateral forces is
displayed in Equation 5.6 below.
h3
h2
h1
hcp
D + Lr D + Lr
D + L D + L
D + L D + L
F3
F2
F1
Rcomp Rten
B
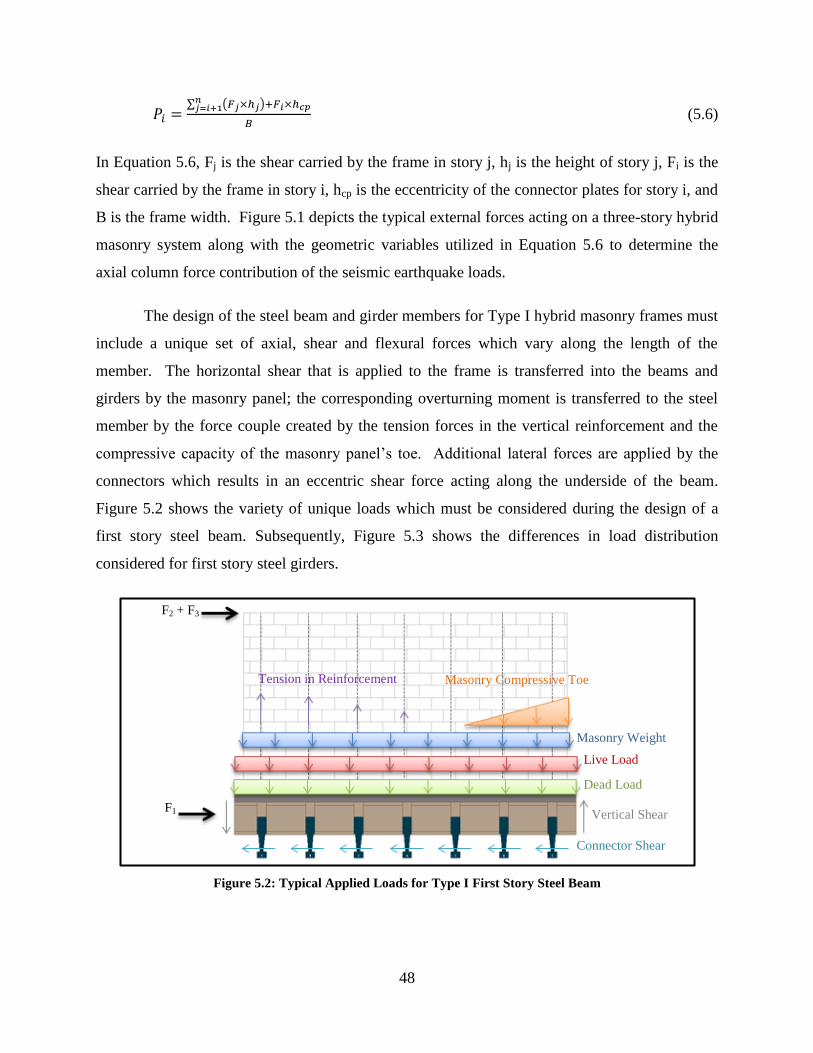
48
∑ ( )
(5.6)
In Equation 5.6, Fj is the shear carried by the frame in story j, hj is the height of story j, Fi is the
shear carried by the frame in story i, hcp is the eccentricity of the connector plates for story i, and
B is the frame width. Figure 5.1 depicts the typical external forces acting on a three-story hybrid
masonry system along with the geometric variables utilized in Equation 5.6 to determine the
axial column force contribution of the seismic earthquake loads.
The design of the steel beam and girder members for Type I hybrid masonry frames must
include a unique set of axial, shear and flexural forces which vary along the length of the
member. The horizontal shear that is applied to the frame is transferred into the beams and
girders by the masonry panel; the corresponding overturning moment is transferred to the steel
member by the force couple created by the tension forces in the vertical reinforcement and the
compressive capacity of the masonry panel’s toe. Additional lateral forces are applied by the
connectors which results in an eccentric shear force acting along the underside of the beam.
Figure 5.2 shows the variety of unique loads which must be considered during the design of a
first story steel beam. Subsequently, Figure 5.3 shows the differences in load distribution
considered for first story steel girders.
Figure 5.2: Typical Applied Loads for Type I First Story Steel Beam
F2 + F3
F1
Masonry Compressive Toe Tension in Reinforcement
Masonry Weight
Live Load
Live Load
Dead Load
Live Load
Vertical Shear
Live Load
Connector Shear
Live Load
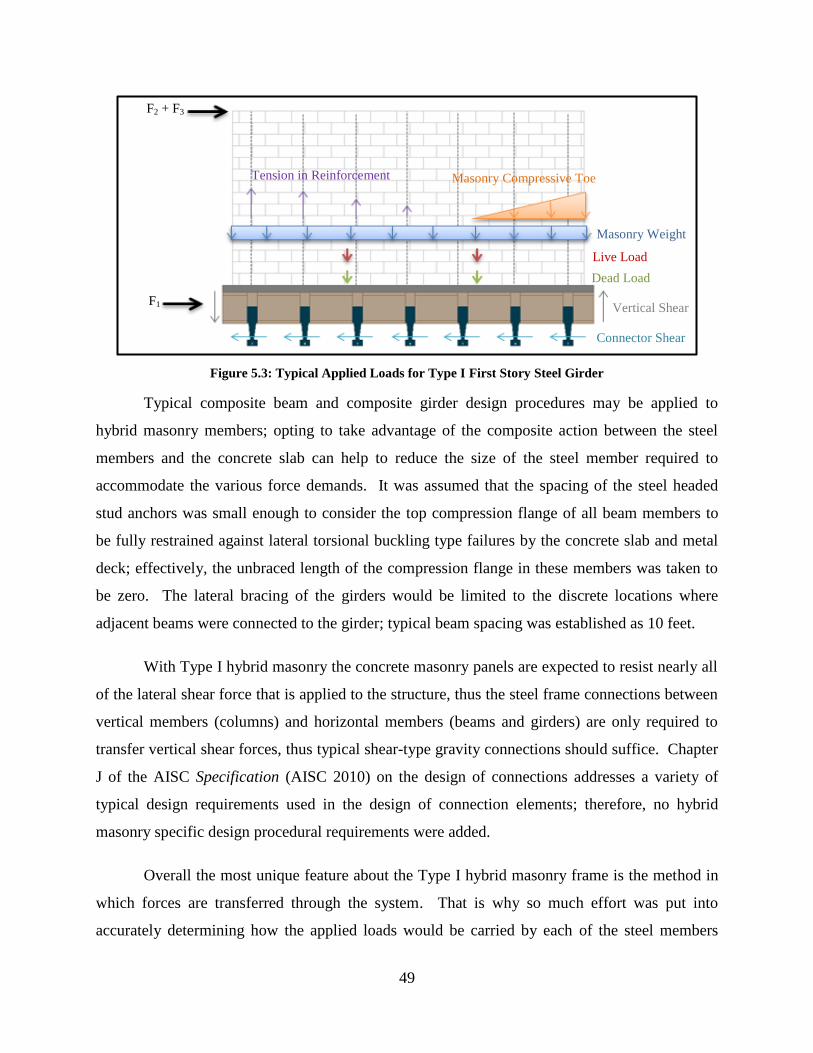
49
Figure 5.3: Typical Applied Loads for Type I First Story Steel Girder
Typical composite beam and composite girder design procedures may be applied to
hybrid masonry members; opting to take advantage of the composite action between the steel
members and the concrete slab can help to reduce the size of the steel member required to
accommodate the various force demands. It was assumed that the spacing of the steel headed
stud anchors was small enough to consider the top compression flange of all beam members to
be fully restrained against lateral torsional buckling type failures by the concrete slab and metal
deck; effectively, the unbraced length of the compression flange in these members was taken to
be zero. The lateral bracing of the girders would be limited to the discrete locations where
adjacent beams were connected to the girder; typical beam spacing was established as 10 feet.
With Type I hybrid masonry the concrete masonry panels are expected to resist nearly all
of the lateral shear force that is applied to the structure, thus the steel frame connections between
vertical members (columns) and horizontal members (beams and girders) are only required to
transfer vertical shear forces, thus typical shear-type gravity connections should suffice. Chapter
J of the AISC Specification (AISC 2010) on the design of connections addresses a variety of
typical design requirements used in the design of connection elements; therefore, no hybrid
masonry specific design procedural requirements were added.
Overall the most unique feature about the Type I hybrid masonry frame is the method in
which forces are transferred through the system. That is why so much effort was put into
accurately determining how the applied loads would be carried by each of the steel members
F2 + F3
F1
Connector Shear
Live Load
Vertical Shear
Live Load
Dead Load
Live Load
Live Load
Live Load
Masonry Weight
Live Load
Masonry Compressive Toe
Live Load
Tension in Reinforcement
Live Load
50
within a hybrid structural bay. The only component of the Type I hybrid masonry system that
could arguably be more important in the design is the fuse connectors. A brief summary of the
most critical fuse connector design considerations is presented in the following section.
5.3 Design Considerations for Fuse Connectors
Much of the work done to determine the critical design requirements for the fuse type
connectors has been completed at the University of Hawaii at Manoa by Reef Ozaki-Train and
Ian Robertson (Ozaki-Train et al. 2011). A brief summary of their proposed procedure and
suggested connector features have been included here; however, for a full description of the
small scale testing and analysis that was conducted, Ozaki-Train’s report should be reviewed.
One of the first variables that the designer must determine is the desired shear capacity of
a single connector. Both a target ultimate ductility capacity and a desired yield force capacity
must be selected to ensure that the fuse connectors will provide adequate strength for design
wind and seismic loading while still providing enough ductility to withstand seismic events. The
connector geometry must be determined by selecting the distance between the masonry thru-bolt
and the connector joint, Lc, which should be chosen based on practical limits to the connection of
the fuse. Once the Lc length is established, L1 should be selected such that the connector length
Lc is at least 2 in. longer where the 2 in. requirement serves as a conservative minimum. In
general L1 should be large enough to ensure that the connection zone does not become a critical
weak point for the connector. Similarly, L2 should be selected to ensure the slotted hole for the
thru-bolt does not become a critical weak location; the conservative minimum that L2 must
exceed is 2.5 in. A schematic diagram of a tapered fuse connector may be found in Figure 5.4,
which shows the locations of the key design variables introduced above. The widths of the
tapered “fuse” section of the connector, d1 and d2 are determined by calculating the preferred
stresses at the top and bottom of the fuse respectively. These computations are done with the
goal being to induce distributed yielding along the entire fuse length which provides the
following relationship between geometric properties:
√
(5.7)

51
In Equation 5.7 either d1 or d2 can be selected, then the remaining fuse width is calculated to
encourage distributed yielding along the full fuse length.
Figure 5.4: Tapered Fuse Connector Properties Diagram (Adapted from Ozaki-Train et al. 2011)
There are a number of design checks that are required for typical fuse connectors that are
attached to the sides of the hybrid masonry steel beams, the primary failure mode being lateral-
torsional buckling. However, the connector experiences a complex combination of stress which
makes it difficult to estimate the lateral torsional buckling failure mode. The cyclic nature of
seismic loading also contributes metal fatigue, further complicating the situation. The plate
thickness, t, must be selected to resist these types of failure, and a minimum thickness of ½ in.
was established as the recommended plate thickness that provided effective lateral-torsional
buckling resistance (Ozaki-Train et al. 2011).
The design considerations discussed in this section represent a brief synopsis of the work
done by Reef Ozaki-Train and Ian Robertson at the University of Hawaii. It was important to
d1
d3
d2
L1
L2
L3
Lc
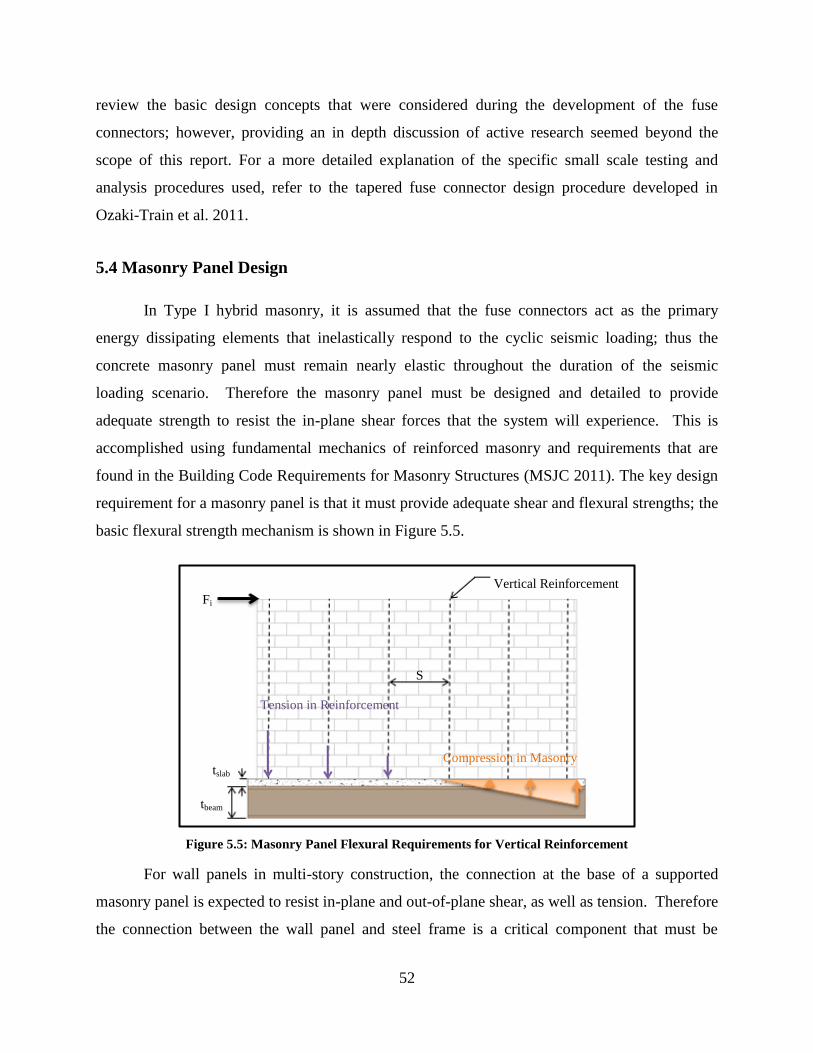
52
review the basic design concepts that were considered during the development of the fuse
connectors; however, providing an in depth discussion of active research seemed beyond the
scope of this report. For a more detailed explanation of the specific small scale testing and
analysis procedures used, refer to the tapered fuse connector design procedure developed in
Ozaki-Train et al. 2011.
5.4 Masonry Panel Design
In Type I hybrid masonry, it is assumed that the fuse connectors act as the primary
energy dissipating elements that inelastically respond to the cyclic seismic loading; thus the
concrete masonry panel must remain nearly elastic throughout the duration of the seismic
loading scenario. Therefore the masonry panel must be designed and detailed to provide
adequate strength to resist the in-plane shear forces that the system will experience. This is
accomplished using fundamental mechanics of reinforced masonry and requirements that are
found in the Building Code Requirements for Masonry Structures (MSJC 2011). The key design
requirement for a masonry panel is that it must provide adequate shear and flexural strengths; the
basic flexural strength mechanism is shown in Figure 5.5.
Figure 5.5: Masonry Panel Flexural Requirements for Vertical Reinforcement
For wall panels in multi-story construction, the connection at the base of a supported
masonry panel is expected to resist in-plane and out-of-plane shear, as well as tension. Therefore
the connection between the wall panel and steel frame is a critical component that must be
Fi
tslab
tbeam
Vertical Reinforcement
S
Compression in Masonry
Tension in Reinforcement
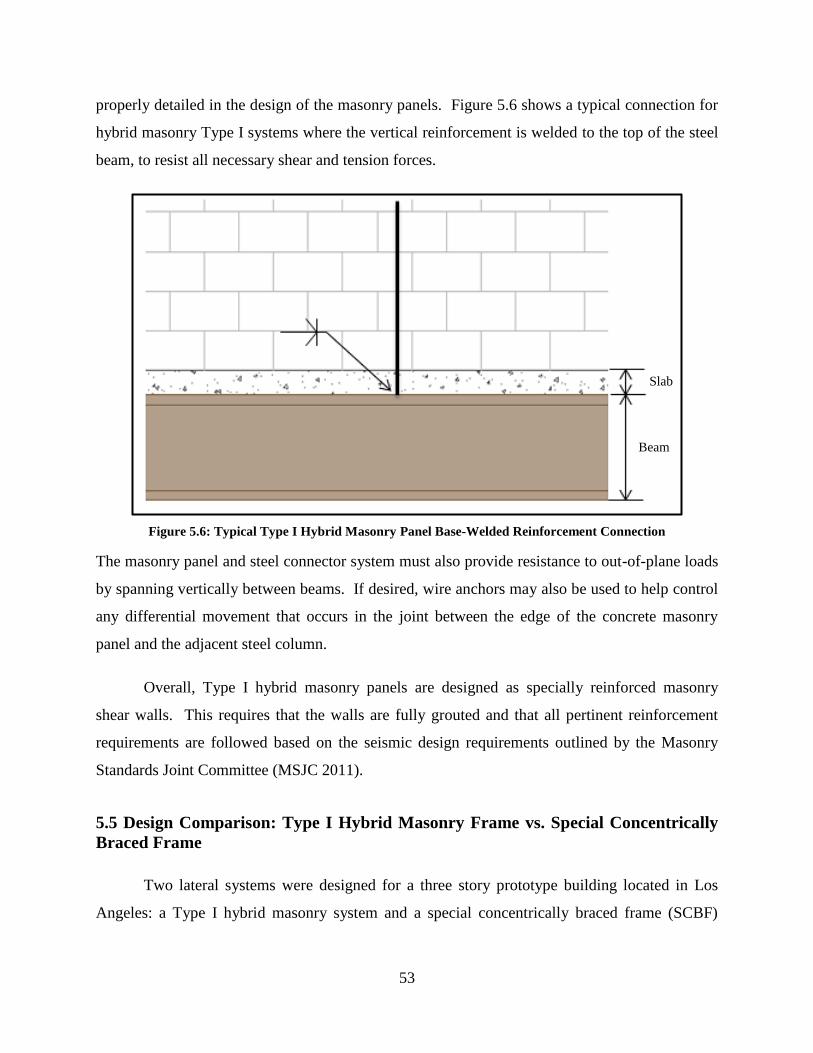
53
properly detailed in the design of the masonry panels. Figure 5.6 shows a typical connection for
hybrid masonry Type I systems where the vertical reinforcement is welded to the top of the steel
beam, to resist all necessary shear and tension forces.
Figure 5.6: Typical Type I Hybrid Masonry Panel Base-Welded Reinforcement Connection
The masonry panel and steel connector system must also provide resistance to out-of-plane loads
by spanning vertically between beams. If desired, wire anchors may also be used to help control
any differential movement that occurs in the joint between the edge of the concrete masonry
panel and the adjacent steel column.
Overall, Type I hybrid masonry panels are designed as specially reinforced masonry
shear walls. This requires that the walls are fully grouted and that all pertinent reinforcement
requirements are followed based on the seismic design requirements outlined by the Masonry
Standards Joint Committee (MSJC 2011).
5.5 Design Comparison: Type I Hybrid Masonry Frame vs. Special Concentrically
Braced Frame
Two lateral systems were designed for a three story prototype building located in Los
Angeles: a Type I hybrid masonry system and a special concentrically braced frame (SCBF)
Beam
Slab
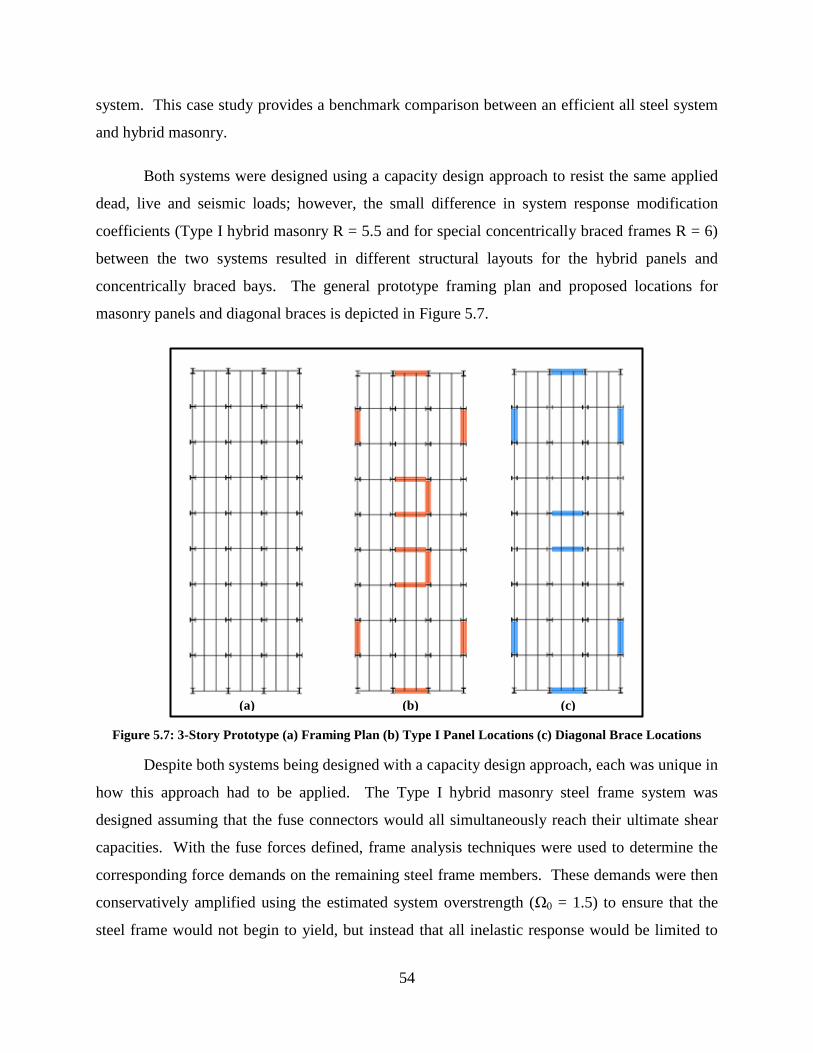
54
system. This case study provides a benchmark comparison between an efficient all steel system
and hybrid masonry.
Both systems were designed using a capacity design approach to resist the same applied
dead, live and seismic loads; however, the small difference in system response modification
coefficients (Type I hybrid masonry R = 5.5 and for special concentrically braced frames R = 6)
between the two systems resulted in different structural layouts for the hybrid panels and
concentrically braced bays. The general prototype framing plan and proposed locations for
masonry panels and diagonal braces is depicted in Figure 5.7.
Figure 5.7: 3-Story Prototype (a) Framing Plan (b) Type I Panel Locations (c) Diagonal Brace Locations
Despite both systems being designed with a capacity design approach, each was unique in
how this approach had to be applied. The Type I hybrid masonry steel frame system was
designed assuming that the fuse connectors would all simultaneously reach their ultimate shear
capacities. With the fuse forces defined, frame analysis techniques were used to determine the
corresponding force demands on the remaining steel frame members. These demands were then
conservatively amplified using the estimated system overstrength (Ω0 = 1.5) to ensure that the
steel frame would not begin to yield, but instead that all inelastic response would be limited to
(a) (b) (c)

55
the fuses. Figure 5.8 shows the critical forces considered in the design of the Type I hybrid
masonry system based on the designed connector shear strength.
Figure 5.8: Critical Design Forces in Energy Dissipating Elements for Type I Hybrid Masonry
The concentrically braced frame approach began in a similar fashion in that the inelastic
response and energy dissipation was concentrated in a single element, the diagonal braces. Once
the braces were sized to resist the appropriate base shear force then the design tensile strength
(Py) and critical buckling strength (Pcr) were computed using Equation 5.8 and Equation 5.9
respectively.
(5.8)
(5.9)
Where Ry is the ratio of the expected yield stress to the specified minimum yield stress (Fy) of
the material, Fcre is the critical post buckling stress, and Ag is the gross cross sectional area as
defined by the AISC Seismic Provisions for Structural Steel Buildings (AISC 2010).
The remaining members in the steel frame were designed assuming that the diagonal
braces were at their ultimate capacity either in tension or compression. Again frame analysis
techniques were used to estimate the force demands in each beam, girder and column assuming
F3
F2
F1
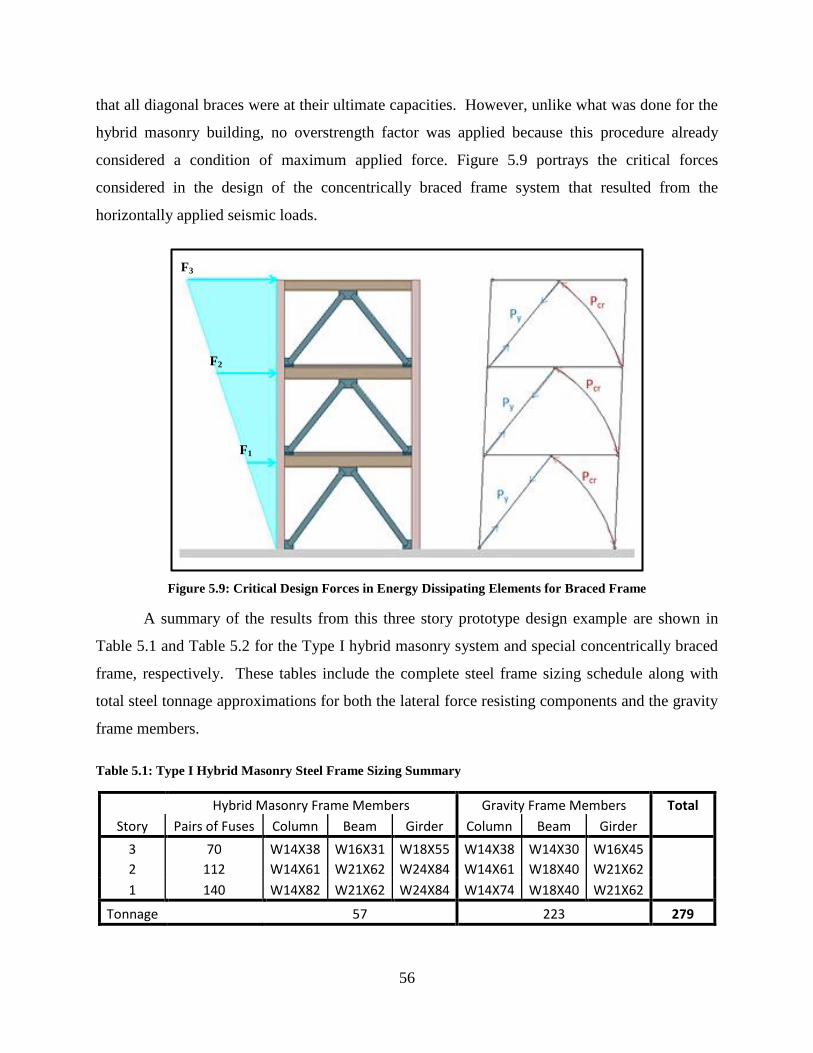
56
that all diagonal braces were at their ultimate capacities. However, unlike what was done for the
hybrid masonry building, no overstrength factor was applied because this procedure already
considered a condition of maximum applied force. Figure 5.9 portrays the critical forces
considered in the design of the concentrically braced frame system that resulted from the
horizontally applied seismic loads.
Figure 5.9: Critical Design Forces in Energy Dissipating Elements for Braced Frame
A summary of the results from this three story prototype design example are shown in
Table 5.1 and Table 5.2 for the Type I hybrid masonry system and special concentrically braced
frame, respectively. These tables include the complete steel frame sizing schedule along with
total steel tonnage approximations for both the lateral force resisting components and the gravity
frame members.
Table 5.1: Type I Hybrid Masonry Steel Frame Sizing Summary
Hybrid Masonry Frame Members Gravity Frame Members Total
Story Pairs of Fuses Column Beam Girder Column Beam Girder
3 70 W14X38 W16X31 W18X55 W14X38 W14X30 W16X45
2 112 W14X61 W21X62 W24X84 W14X61 W18X40 W21X62
1 140 W14X82 W21X62 W24X84 W14X74 W18X40 W21X62
Tonnage 57 223 279
F1
F2
F3
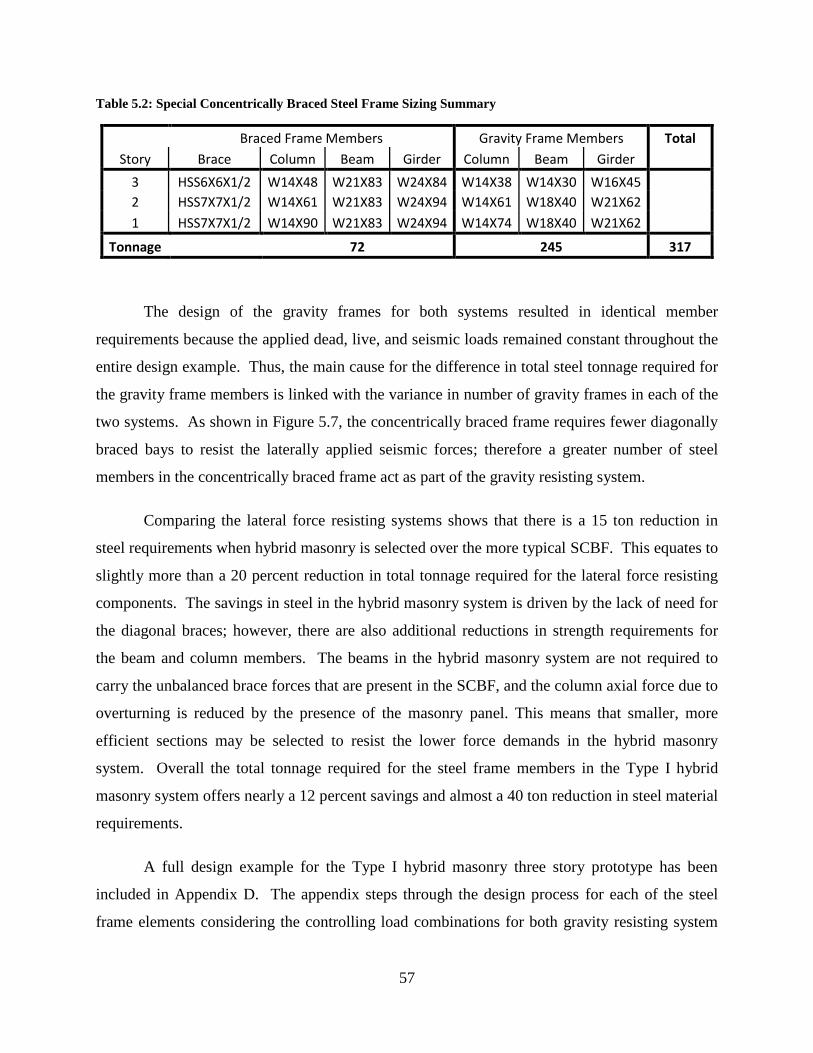
57
Table 5.2: Special Concentrically Braced Steel Frame Sizing Summary
Braced Frame Members Gravity Frame Members Total
Story Brace Column Beam Girder Column Beam Girder
3 HSS6X6X1/2 W14X48 W21X83 W24X84 W14X38 W14X30 W16X45
2 HSS7X7X1/2 W14X61 W21X83 W24X94 W14X61 W18X40 W21X62
1 HSS7X7X1/2 W14X90 W21X83 W24X94 W14X74 W18X40 W21X62
Tonnage 72 245 317
The design of the gravity frames for both systems resulted in identical member
requirements because the applied dead, live, and seismic loads remained constant throughout the
entire design example. Thus, the main cause for the difference in total steel tonnage required for
the gravity frame members is linked with the variance in number of gravity frames in each of the
two systems. As shown in Figure 5.7, the concentrically braced frame requires fewer diagonally
braced bays to resist the laterally applied seismic forces; therefore a greater number of steel
members in the concentrically braced frame act as part of the gravity resisting system.
Comparing the lateral force resisting systems shows that there is a 15 ton reduction in
steel requirements when hybrid masonry is selected over the more typical SCBF. This equates to
slightly more than a 20 percent reduction in total tonnage required for the lateral force resisting
components. The savings in steel in the hybrid masonry system is driven by the lack of need for
the diagonal braces; however, there are also additional reductions in strength requirements for
the beam and column members. The beams in the hybrid masonry system are not required to
carry the unbalanced brace forces that are present in the SCBF, and the column axial force due to
overturning is reduced by the presence of the masonry panel. This means that smaller, more
efficient sections may be selected to resist the lower force demands in the hybrid masonry
system. Overall the total tonnage required for the steel frame members in the Type I hybrid
masonry system offers nearly a 12 percent savings and almost a 40 ton reduction in steel material
requirements.
A full design example for the Type I hybrid masonry three story prototype has been
included in Appendix D. The appendix steps through the design process for each of the steel
frame elements considering the controlling load combinations for both gravity resisting system
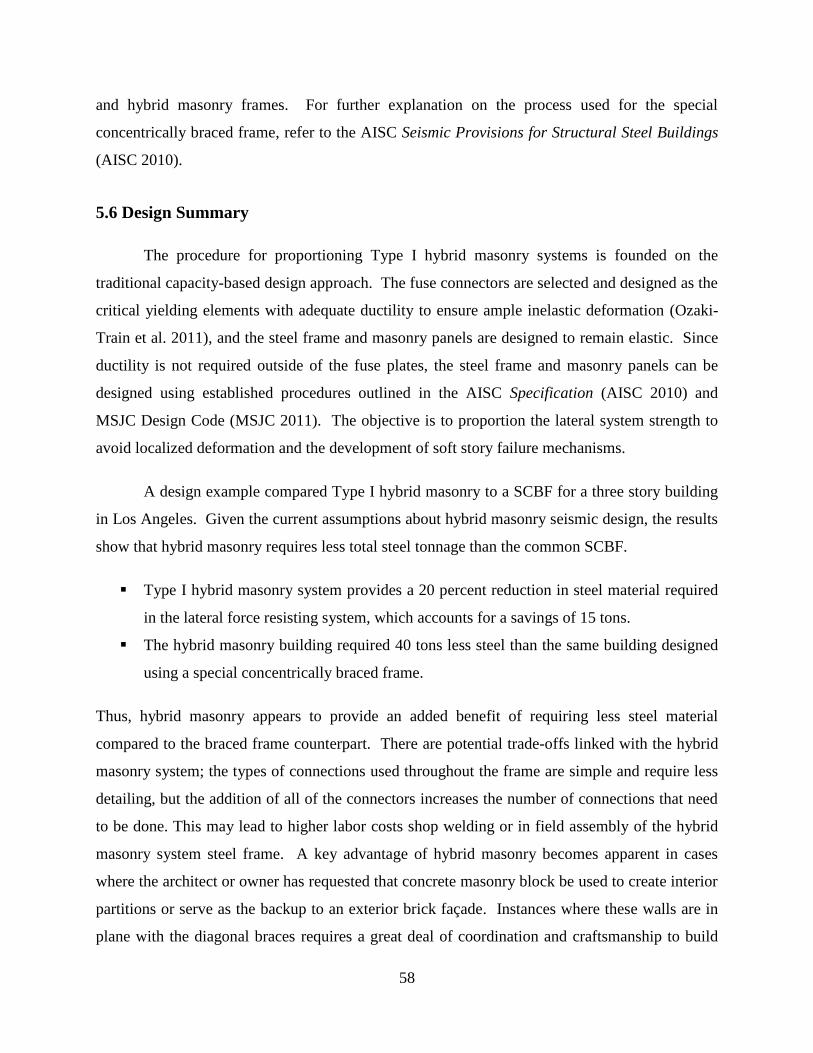
58
and hybrid masonry frames. For further explanation on the process used for the special
concentrically braced frame, refer to the AISC Seismic Provisions for Structural Steel Buildings
(AISC 2010).
5.6 Design Summary
The procedure for proportioning Type I hybrid masonry systems is founded on the
traditional capacity-based design approach. The fuse connectors are selected and designed as the
critical yielding elements with adequate ductility to ensure ample inelastic deformation (Ozaki-
Train et al. 2011), and the steel frame and masonry panels are designed to remain elastic. Since
ductility is not required outside of the fuse plates, the steel frame and masonry panels can be
designed using established procedures outlined in the AISC Specification (AISC 2010) and
MSJC Design Code (MSJC 2011). The objective is to proportion the lateral system strength to
avoid localized deformation and the development of soft story failure mechanisms.
A design example compared Type I hybrid masonry to a SCBF for a three story building
in Los Angeles. Given the current assumptions about hybrid masonry seismic design, the results
show that hybrid masonry requires less total steel tonnage than the common SCBF.
Type I hybrid masonry system provides a 20 percent reduction in steel material required
in the lateral force resisting system, which accounts for a savings of 15 tons.
The hybrid masonry building required 40 tons less steel than the same building designed
using a special concentrically braced frame.
Thus, hybrid masonry appears to provide an added benefit of requiring less steel material
compared to the braced frame counterpart. There are potential trade-offs linked with the hybrid
masonry system; the types of connections used throughout the frame are simple and require less
detailing, but the addition of all of the connectors increases the number of connections that need
to be done. This may lead to higher labor costs shop welding or in field assembly of the hybrid
masonry system steel frame. A key advantage of hybrid masonry becomes apparent in cases
where the architect or owner has requested that concrete masonry block be used to create interior
partitions or serve as the backup to an exterior brick façade. Instances where these walls are in
plane with the diagonal braces requires a great deal of coordination and craftsmanship to build
59
the wall around the existing steel members; however, hybrid masonry allows for fewer obstacles
and simpler masonry construction in unimpeded structural bays, ultimately leading to possible
reductions in time required to construct the building.
The current design procedure offers a reasonable starting point for continued
development. Based on the design example comparing Type I hybrid masonry with a special
concentrically braced frame, there are potential advantages and efficiencies offered by the hybrid
masonry system, which should help to drive the future development of the hybrid masonry
design procedure.
60
CHAPTER 6: SUMMARY AND CONCLUSIONS
Hybrid masonry is a structural system that is currently under development with support
from the National Science Foundation, and both the steel and masonry industries. There are
three broad classifications which are distinguished mainly by the connectivity at the steel-
masonry interface. Type I hybrid masonry is a non-loadbearing masonry shear wall connected to
a steel gravity frame using either fuse connectors or link plate connectors. In Type II hybrid
masonry systems the connectors are replaced by steel headed stud anchors attached along the
bottom of beams and girders and imbedded in a course of grout along the top of the wall, thus
changing the masonry panel into a loadbearing shear wall. In the final type of hybrid masonry,
Type III, the masonry panel is connected with studs and grout along the top and each side to the
surrounding frame. The masonry panel is a fully confined loadbearing shear wall capable of
transferring forces directly from columns, beams, or girders. The goal in combining the steel
frame with concrete masonry panels is to create an efficient structural system with a diverse
range of feasible application. Hybrid masonry is particularly targeted for buildings that are
currently designed with steel frames and nonstructural masonry infills.
Current practice has limited hybrid masonry application to low-rise structures in low
seismic regions. Even in these limited cases, hybrid masonry has displayed advantages including
efficient frame design, improved constructability, and it may be designed and built using current
codes and trade-specific construction practices. The goal of the current research is to further
advance understanding of this innovative system for seismic applications by assessing system
feasibility, and by improving current design and analysis procedures through the use of simple
examples and a suite of prototype buildings.
The suite of prototype buildings was adapted from the SAC model buildings, which were
developed in 1994 as part of the SAC joint venture in response to the unexpected damage caused
by the Northridge earthquake. The prototype buildings utilized in this study were modified
based on the most critical building design parameters and the insight of practicing engineers.
The analysis of the full set of prototype buildings included four different cities: Los Angeles,
Seattle, Salt Lake City, and Boston, representing a wide range of seismic hazard within the
61
United States. The array of building aspect ratios was expanded to include a prototype building
that had a much larger plan aspect ratio than any of the SAC buildings.
The results from the system feasibility analysis suggest that Type I hybrid masonry may
be used in any of the seismic regions considered. The proposed height limitations that have been
suggested are approximate guidelines that are dependent on the assumptions made throughout
the equivalent lateral force procedure that was used to conduct the feasibility study. The
approximate height ranges for each of the different seismic regions, judged based on plan
configuration viability for typical architectural layouts and occupancy types are as follows:
Type I hybrid masonry buildings in high seismic zones, like Los Angeles, appear viable
for shorter buildings less than six stories.
Buildings in zones of less severe but still appreciable seismic activity, similar to Seattle
or Salt Lake City, appear viable for buildings up to nine stories, if Type I hybrid masonry
is to be employed.
The full set of prototype buildings considered in this study, up to twelve stories, appears
to be viable for Type I hybrid masonry buildings in low to moderate seismic zones, like
Boston.
These proposed height limitations provide a target maximum height which may need to be
adjusted on a per case basis depending on unique site conditions and the level of understanding
the designer has with the structural mechanics of the hybrid masonry system.
The most critical assumption made in this study was the range of response modification
coefficients (R): R = 5 to 7. Designs based on this range produce reasonable relationships
between local and global ductility. The average roof drift ductility ratio from nonlinear pushover
analysis was 5.5, which based on an equal-displacement assumption suggests that the structural
system R value would fall at the lower end of the range that was considered in the feasibility
analysis.
The Open System for Earthquake Engineering Simulation (OpenSees) software platform
was used to perform nonlinear pushover analysis. The cumulative results for each of the
prototype buildings suggest that Type I hybrid masonry systems have the capability to offer
62
adequate ductility to promote the formation of a global failure mechanism with a relatively
uniform distribution of total drift across the full height of the building. Only minor
modifications were made to the original fuse distribution that had been determined based solely
on providing the necessary shear capacity to transfer the loads applied using the typical design
profile that was developed during the equivalent lateral force procedure.
The various system level studies and structural response analyses run for each of the
prototype buildings helped to provide a better understanding of Type I hybrid masonry response,
and ultimately served to provide a foundation for further development of a Type I design
procedure. The major concepts of the Type I design procedure share a number of similarities
with a traditional capacity-based design approach. The fuse connectors are selected as the
critical yielding elements; therefore they must be designed with adequate ductility while the
remaining members in the frame are then designed to remain elastic.
The final design procedure that was developed was used to perform a design comparison
which examined whether Type I hybrid masonry would offer any material savings in the design
of a three story building compared to a special concentrically braced frame. Ultimately the
hybrid masonry system did offer material savings in the form of reduced total tonnage of
required steel.
Type I hybrid masonry saw a 20 percent reduction (more than 15 tons) in required steel
used in the lateral force resisting frames compared to a special concentrically braced
frame.
An overall comparison of the full building requirements showed that the hybrid masonry
building could be constructed using 40 tons less steel than the same building designed
using a special concentrically braced frame.
Thus the hybrid masonry system appears to provide an added benefit of requiring less steel
material and thus a reduced material cost compared to its braced frame counterpart. Another key
advantage of hybrid masonry is highlighted when the architect or owner has requested that
concrete masonry block be used to create interior partitions or to provide a backup wythe to an
exterior brick façade; the partitions and brick backup walls can be designed as hybrid panels and
serve a dual purpose of lateral force resisting element as well as architectural element. The
63
design procedures discussed in this report are meant to serve as a basis for further development
and ultimately as an aid in establishing a complete design procedure for all types of hybrid
masonry structural systems.
The variety of studies completed to date helps to provide a better understanding of the
expected capabilities of hybrid masonry as a developing structural system. It is a new system
that holds promise as a primary seismic structural system option; however, its continued growth
and development is dependent on the sustained efforts of academic researchers and industry
professionals focused on validating the economic benefits and structural performance of hybrid
masonry. On-going full-scale testing at the University of Illinois at Urbana-Champaign will
create an extensive experimental database for hybrid masonry to establish a basis for validation
of models that can be used to conduct nonlinear response history analyses. The combination of
design studies, large-scale test results and earthquake simulation will rigorously establish the
basis for hybrid masonry seismic design.

64
REFERENCES
Abrams, D.P., (2011). “NSF NEESR Research on Hybrid Masonry Seismic Structural Systems,”
Proceedings of the Eleventh North American Masonry Conference, Minneapolis, MN,
USA.
AISC (2011). Design Examples Version 14.0, American Institute of Steel Construction (AISC),
Chicago, IL.
ANSI / AISC 341-10 (2010). Seismic Provisions for Structural Steel Buildings, American
Institute of Steel Construction (AISC), Chicago, IL.
ANSI / AISC 360-10 (2010). Specification for Structural Steel Buildings, American Institute of
Steel Construction (AISC), Chicago, IL.
ASCE / SEI 7-10 (2010). Minimum Design Loads for Buildings and other Structures, American
Society of Civil Engineers (ASCE), Reston, VA.
Asselin, R.E., Fahnestock, L.A., Abrams, D.P., (2013). “Feasibility of Hybrid Masonry in
Seismic Regions,” Proceedings of the 12th
Canadian Masonry Symposium, Vancouver,
British Columbia, June 2013.
Asselin, R.E., Fahnestock, L.A., Abrams, D.P., Robertson, I.N., Ozaki-Train, R., and Mitsuyuki,
S., (2012). “Behavior and Design of Fuse-Based Hybrid Masonry Seismic Structural
Systems,” Proceedings of the 15th
World Conference of Earthquake Engineering, Lisbon,
Portugal, September 2012.
Asselin, R.E., Fahnestock, L.A., Biggs, D.T., (2013). “Design of Hybrid Masonry Systems,”
Proceedings of Structures Congress 2013, Pittsburg, PA, May 2013.
Bertero, V., and Brokken, S., (1983). “Infills in Seismic Resistant Building,” Journal of
Structural Engineering, 109: 1337-1361, June 1983.
Biggs, D.T., (2007). “Hybrid Masonry Structures,” Proceedings of the 10th
North American
Masonry Conference, St. Louis, MO, June 2007.
Biggs, D.T., (2011). “Using Hybrid Masonry Bracing for Steel Frames,” Proceedings of the
Eleventh North American Masonry Conference, Minneapolis, MN, USA.
Biggs, D.T., (2013). “Hybrid Masonry Design and Construction Practices,” Proceedings of 12th
Canadian masonry Symposium, University of British Columbia, Vancouver, Canada.
Elnashai, A. S., and Di Sarno, L. (2008). Fundamentals of Earthquake Engineering. John Wiley
and Sons, United Kingdom.

65
Eidini, M., D.P. Abrams and L.A. Fahnestock (2012), “Seismic Design and Viability of Hybrid
Masonry Building Systems,” accepted for publication, ASCE Journal of Structural
Engineering
FEMA 355C (2000). State of the Art Report on Systems Performance of Steel Moment Frames
Subject to Earthquake Ground Shaking, Federal Emergency Management Agency.
FEMA P695 (2009). Quantification of Building Seismic Performance Factors, Federal
Emergency Management Agency.
FEMA P795 (2011). Quantification of Building Seismic Performance Factors: Component
Equivalency Methodology, Federal Emergency Management Agency.
Goodnight, S.R., Johnson, G.P., and Robertson, I.N., (2011). Connector Development for Hybrid
Masonry Seismic Structural Systems, Research Report UHM/CEE/11-03, University of
Hawaii at Manoa.
Gregor, T. A., Fahnestock, L. A., and Abrams, D. P., (2011). “Experimental Evaluation of
Seismic Performance for Hybrid Masonry,” Proceedings of the Eleventh North American
Masonry Conference, Minneapolis, MN, USA.
IMI Technology Brief 02.14.01, “Hybrid Masonry Design,” International Masonry Institute,
Annapolis, MD, 2009.
IMI Technology Brief 02.13.02, “Hybrid Masonry Construction,” International Masonry
Institute, Annapolis, MD, 2010.
Johnson, G., Robertson, I. N., Goodnight, S., and Ozaki-Train, R., (2011). “Behavior of Energy
Dissipating Connectors and Fuses,” Proceedings of the Eleventh North American
Masonry Conference, Minneapolis, MN, USA.
McKenna, F., and Fenves, G.L. (2006). Open System for Earthquake Engineering Simulation
Version: 2.4.0. Created at the NSF sponsored Pacific Earthquake Engineering Center.
MSJC (2011). Building Code Requirements and Specification for Masonry Structures, Masonry
Standards Joint Committee, Boulder, CO.
NCMA TEK 3-3B (2009). “Hybrid Concrete Masonry Construction Details,” National Concrete
Masonry Association.
NCMA TEK 14-9A (2009). “Hybrid Concrete Masonry Design,” National Concrete Masonry
Association.
Ozaki-Train, R., Robertson, I.N., (2011). Hybrid Masonry Connector Development and Design,
Research Report UHM/CEE/11-04, University of Hawaii at Manoa.
66
Paulay, T., and Priestley, M. J. N. (1992). Seismic Design of Reinforced Concrete and Masonry
Buildings. John Wiley and Sons, New York.
Robertson, I.N. (2013). “Fusible Ductile Links for Hybrid Masonry Bracing,” Proceedings of the
2013 Structures Congress, Pittsburg, PA, USA.
Salmon, C.G., Johnson, J.E., and Malhas, F.A. (2009). Steel Structures Design and Behavior.
Pearson Prentice Hall, Upper Saddle River, NJ.
Webster’s Comprehensive Dictionary of the English Language. J.G. Ferguson Publishing,
Chicago, IL, 1995.
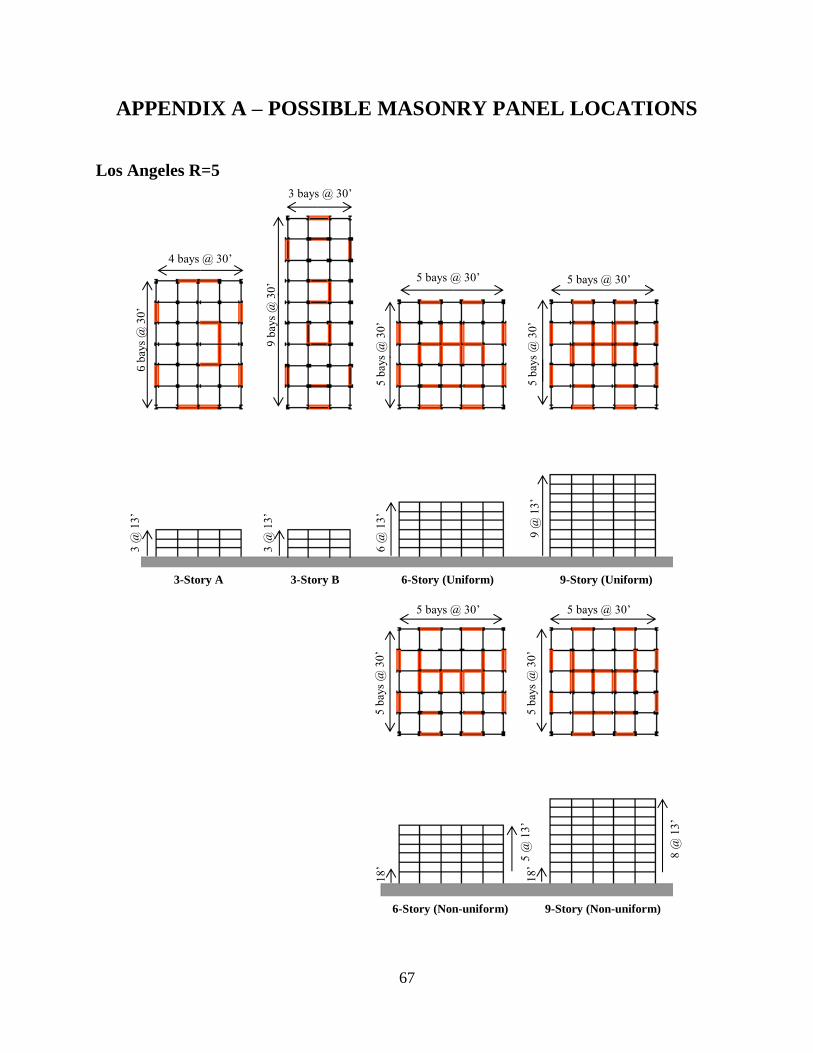
67
APPENDIX A – POSSIBLE MASONRY PANEL LOCATIONS
Los Angeles R=5
5 b
ays
@ 3
0’
9 b
ays
@ 3
0’
3-Story A 3-Story B 6-Story (Uniform) 9-Story (Uniform)
4 bays @ 30’
3 bays @ 30’
5 bays @ 30’ 5 bays @ 30’
5 b
ays
@ 3
0’
5 b
ays
@ 3
0’
6 b
ays
@ 3
0’
3 @
13
’
3 @
13
’
6 @
13
’
9 @
13
’
6-Story (Non-uniform) 9-Story (Non-uniform)
5 b
ays
@ 3
0’
5 bays @ 30’ 5 bays @ 30’
18
’
18
’ 5
@ 1
3’
8 @
13
’
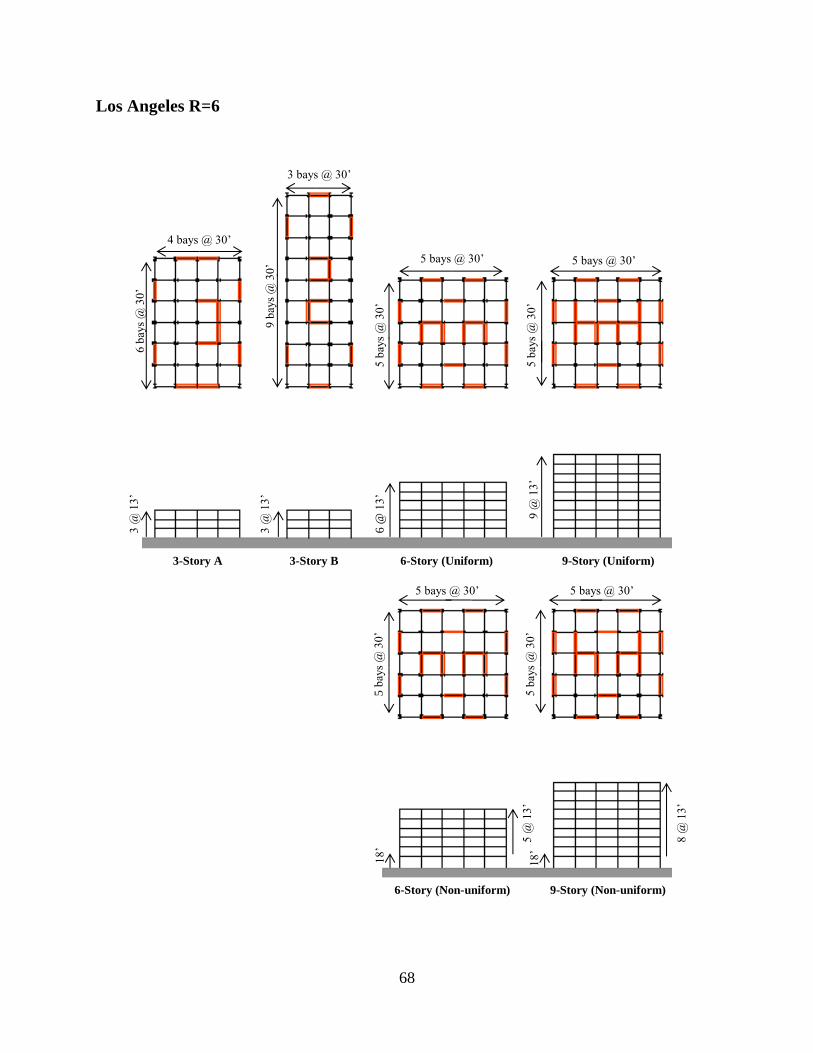
68
Los Angeles R=6
5 b
ays
@ 3
0’
9 b
ays
@ 3
0’
3-Story A 3-Story B 6-Story (Uniform) 9-Story (Uniform)
4 bays @ 30’
3 bays @ 30’
5 bays @ 30’ 5 bays @ 30’
5 b
ays
@ 3
0’
5 b
ays
@ 3
0’
6 b
ays
@ 3
0’
3 @
13
’
3 @
13
’
6 @
13
’
9 @
13
’
6-Story (Non-uniform) 9-Story (Non-uniform)
5 b
ays
@ 3
0’
5 bays @ 30’ 5 bays @ 30’
18
’
18
’ 5
@ 1
3’
8 @
13
’
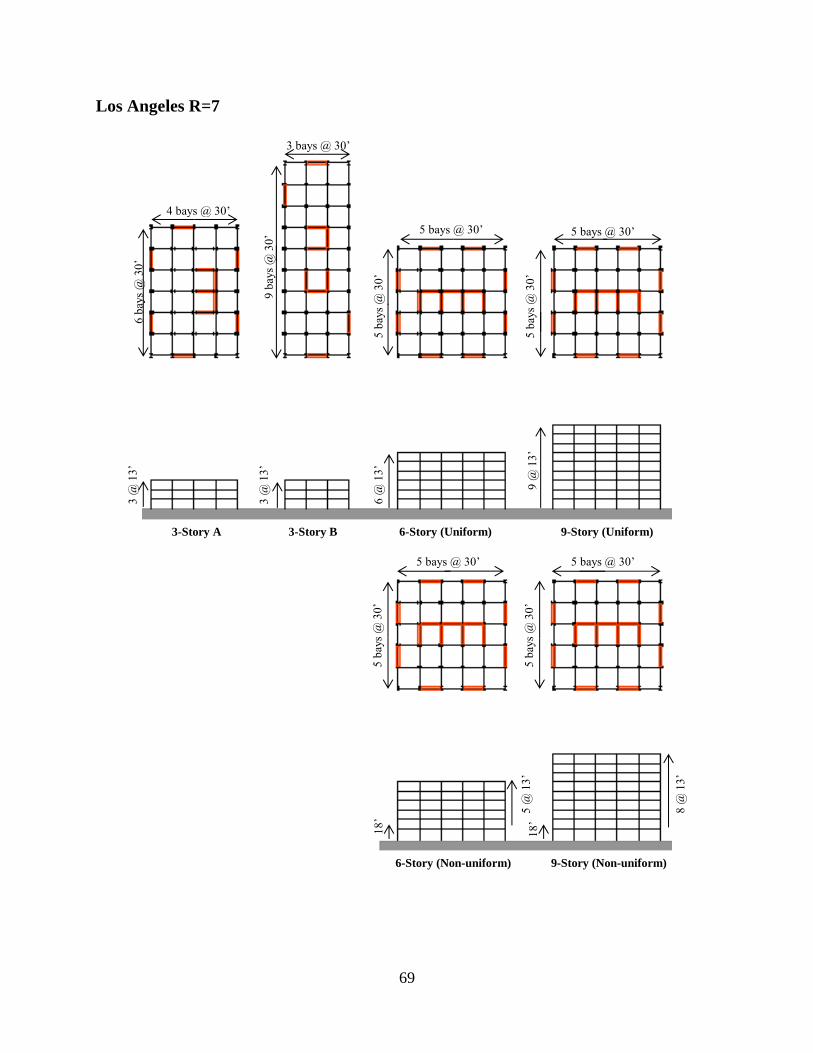
69
Los Angeles R=7
5 b
ays
@ 3
0’
9 b
ays
@ 3
0’
3-Story A 3-Story B 6-Story (Uniform) 9-Story (Uniform)
4 bays @ 30’
3 bays @ 30’
5 bays @ 30’ 5 bays @ 30’
5 b
ays
@ 3
0’
5 b
ays
@ 3
0’
6 b
ays
@ 3
0’
3 @
13
’
3 @
13
’
6 @
13
’
9 @
13
’
6-Story (Non-uniform) 9-Story (Non-uniform)
5 b
ays
@ 3
0’
5 bays @ 30’ 5 bays @ 30’
18
’
18
’ 5
@ 1
3’
8 @
13
’
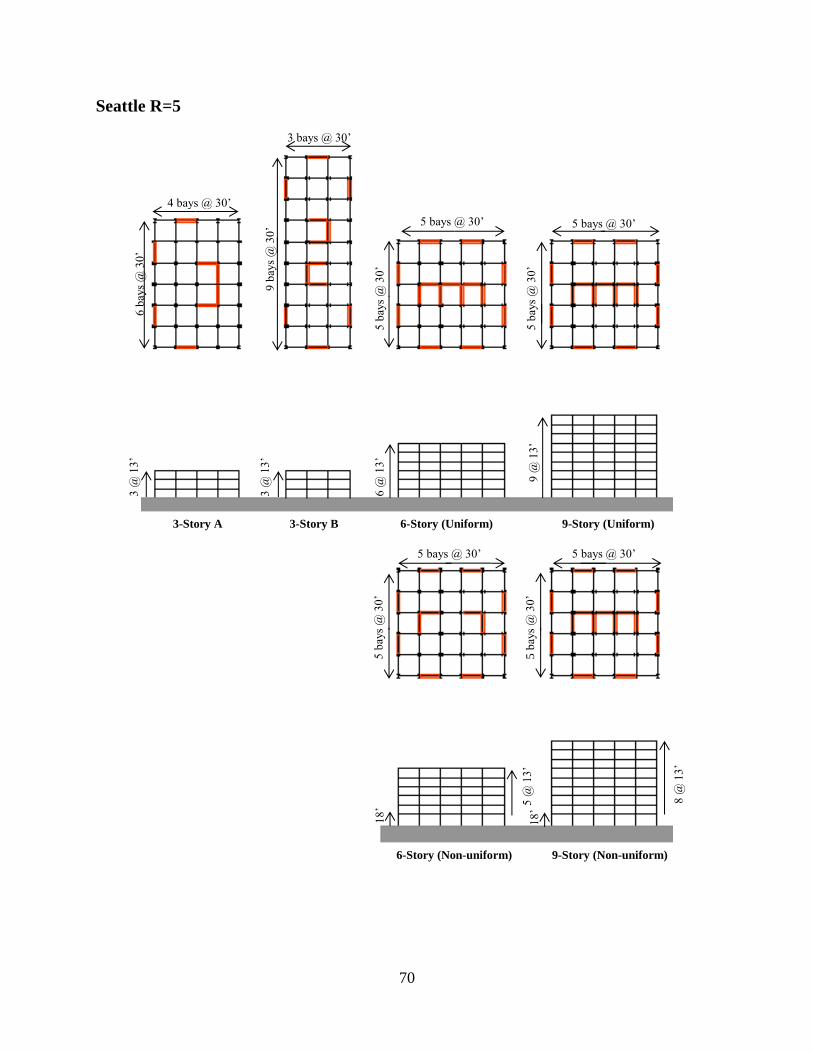
70
Seattle R=5
5 b
ays
@ 3
0’
9 b
ays
@ 3
0’
3-Story A 3-Story B 6-Story (Uniform) 9-Story (Uniform)
4 bays @ 30’
3 bays @ 30’
5 bays @ 30’ 5 bays @ 30’
5 b
ays
@ 3
0’
5 b
ays
@ 3
0’
6 b
ays
@ 3
0’
3 @
13
’
3 @
13
’
6 @
13
’
9 @
13
’
6-Story (Non-uniform) 9-Story (Non-uniform)
5 b
ays
@ 3
0’
5 bays @ 30’ 5 bays @ 30’
18
’
18
’ 5
@ 1
3’
8 @
13
’

71
Seattle R=6
5 b
ays
@ 3
0’
9 b
ays
@ 3
0’
3-Story A 3-Story B 6-Story (Uniform) 9-Story (Uniform)
4 bays @ 30’
3 bays @ 30’
5 bays @ 30’ 5 bays @ 30’
5 b
ays
@ 3
0’
5 b
ays
@ 3
0’
6 b
ays
@ 3
0’
3 @
13
’
3 @
13
’
6 @
13
’
9 @
13
’
6-Story (Non-uniform) 9-Story (Non-uniform)
5 b
ays
@ 3
0’
5 bays @ 30’ 5 bays @ 30’
18
’
18
’ 5
@ 1
3’
8 @
13
’
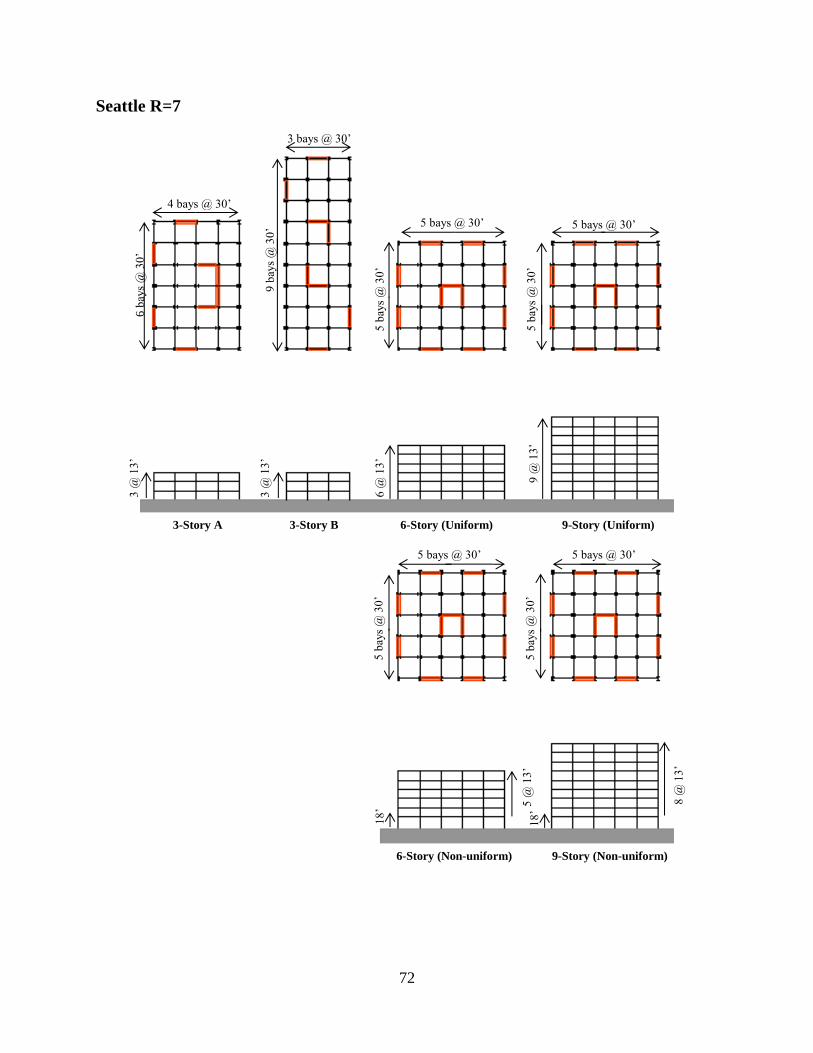
72
Seattle R=7
5 b
ays
@ 3
0’
9 b
ays
@ 3
0’
3-Story A 3-Story B 6-Story (Uniform) 9-Story (Uniform)
4 bays @ 30’
3 bays @ 30’
5 bays @ 30’ 5 bays @ 30’
5 b
ays
@ 3
0’
5 b
ays
@ 3
0’
6 b
ays
@ 3
0’
3 @
13
’
3 @
13
’
6 @
13
’
9 @
13
’
6-Story (Non-uniform) 9-Story (Non-uniform)
5 b
ays
@ 3
0’
5 bays @ 30’ 5 bays @ 30’
18
’
18
’ 5
@ 1
3’
8 @
13
’
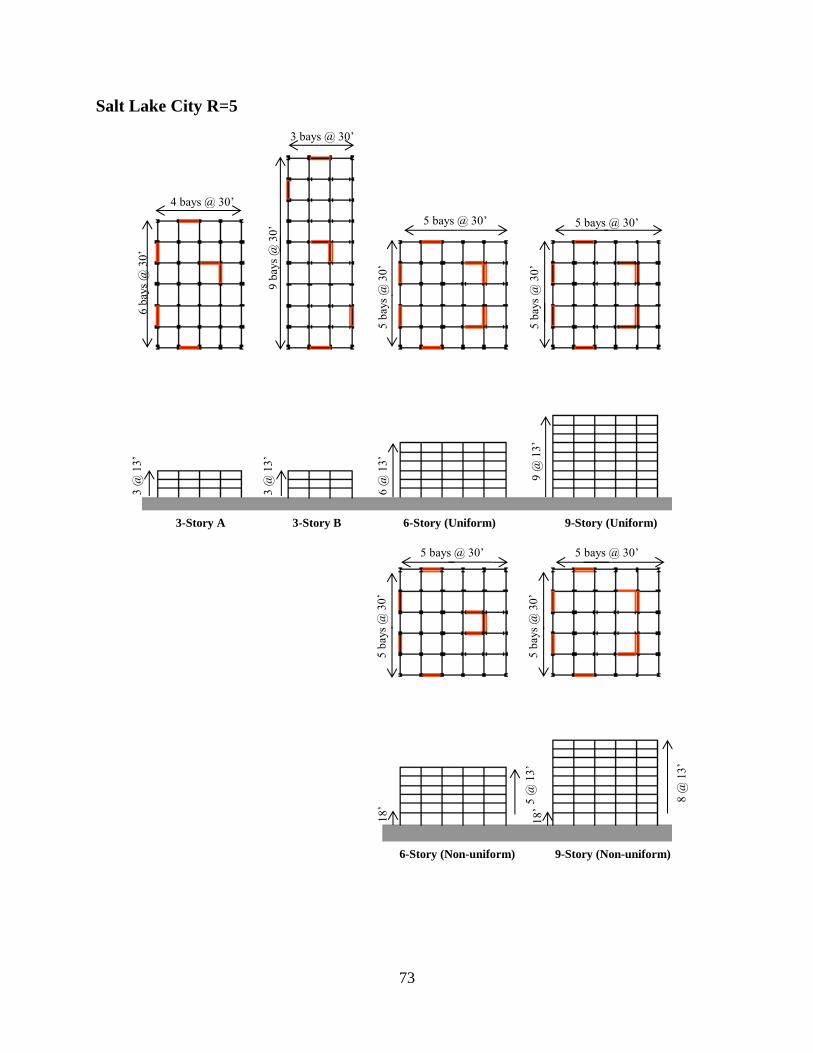
73
Salt Lake City R=5
5 b
ays
@ 3
0’
9 b
ays
@ 3
0’
3-Story A 3-Story B 6-Story (Uniform) 9-Story (Uniform)
4 bays @ 30’
3 bays @ 30’
5 bays @ 30’ 5 bays @ 30’
5 b
ays
@ 3
0’
5 b
ays
@ 3
0’
6 b
ays
@ 3
0’
3 @
13
’
3 @
13
’
6 @
13
’
9 @
13
’
6-Story (Non-uniform) 9-Story (Non-uniform)
5 b
ays
@ 3
0’
5 bays @ 30’ 5 bays @ 30’
18
’
18
’ 5
@ 1
3’
8 @
13
’
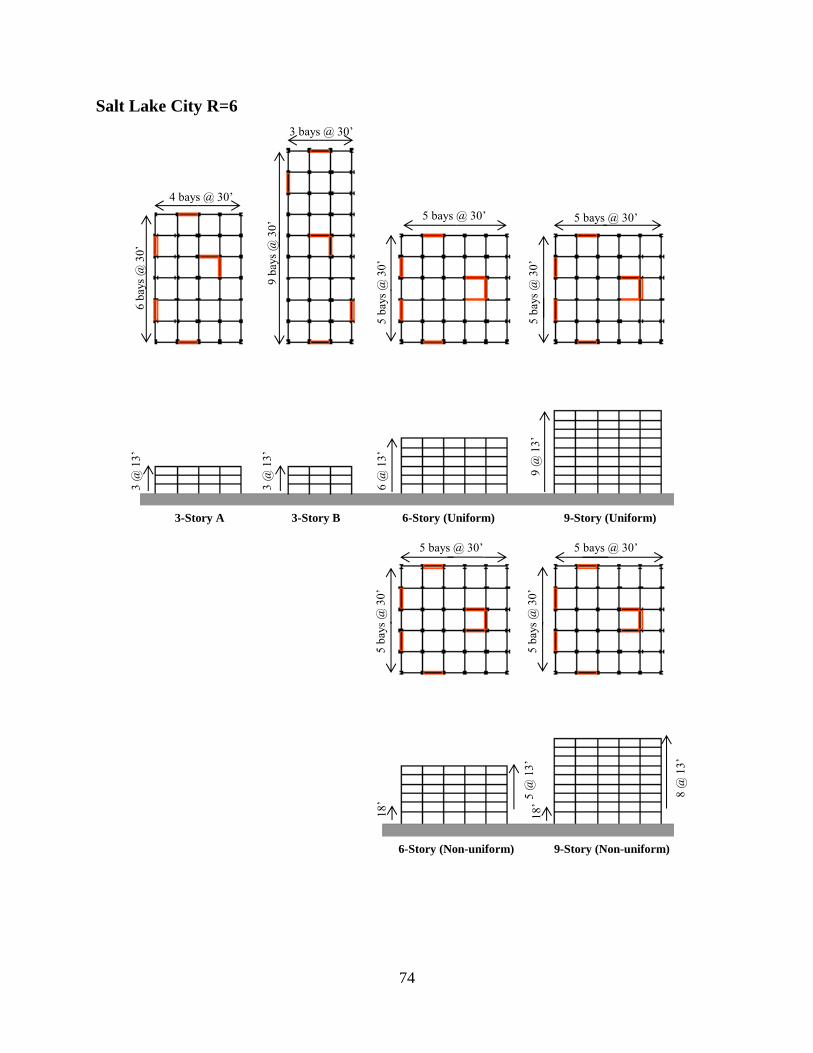
74
Salt Lake City R=6
5 b
ays
@ 3
0’
9 b
ays
@ 3
0’
3-Story A 3-Story B 6-Story (Uniform) 9-Story (Uniform)
4 bays @ 30’
3 bays @ 30’
5 bays @ 30’ 5 bays @ 30’
5 b
ays
@ 3
0’
5 b
ays
@ 3
0’
6 b
ays
@ 3
0’
3 @
13
’
3 @
13
’
6 @
13
’
9 @
13
’
6-Story (Non-uniform) 9-Story (Non-uniform)
5 b
ays
@ 3
0’
5 bays @ 30’ 5 bays @ 30’
18
’
18
’ 5
@ 1
3’
8 @
13
’
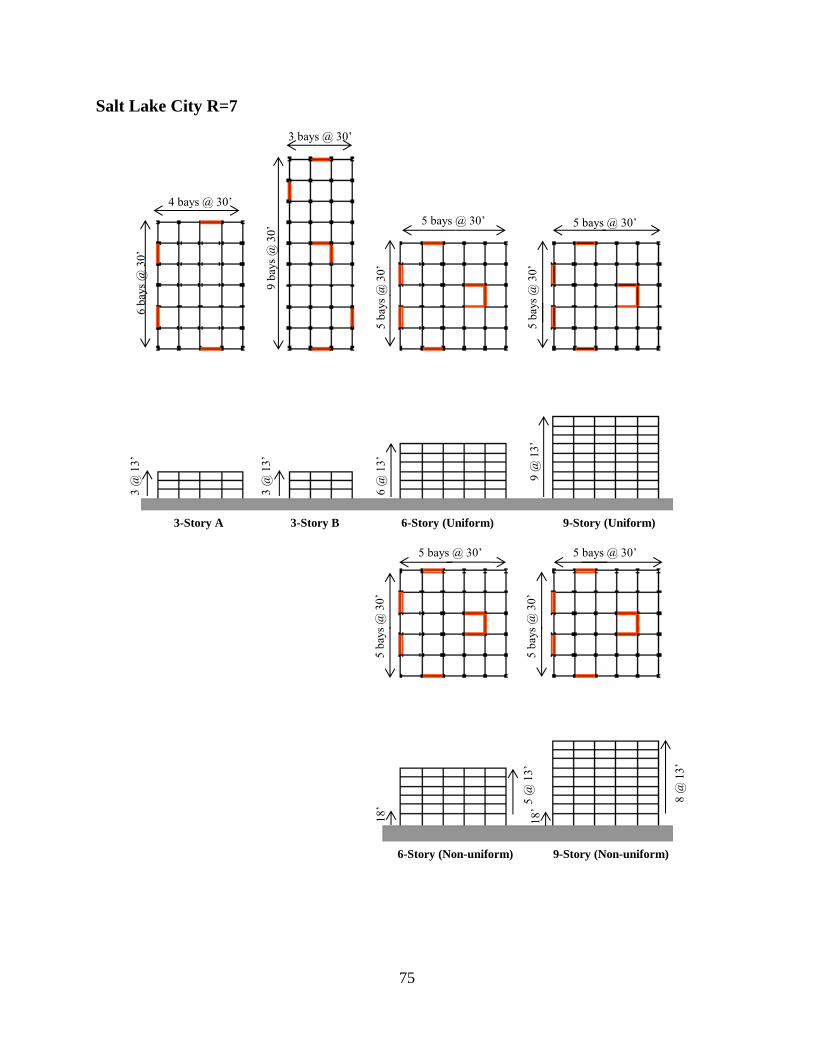
75
Salt Lake City R=7
5 b
ays
@ 3
0’
9 b
ays
@ 3
0’
3-Story A 3-Story B 6-Story (Uniform) 9-Story (Uniform)
4 bays @ 30’
3 bays @ 30’
5 bays @ 30’ 5 bays @ 30’
5 b
ays
@ 3
0’
5 b
ays
@ 3
0’
6 b
ays
@ 3
0’
3 @
13
’
3 @
13
’
6 @
13
’
9 @
13
’
6-Story (Non-uniform) 9-Story (Non-uniform)
5 b
ays
@ 3
0’
5 bays @ 30’ 5 bays @ 30’
18
’
18
’ 5
@ 1
3’
8 @
13
’
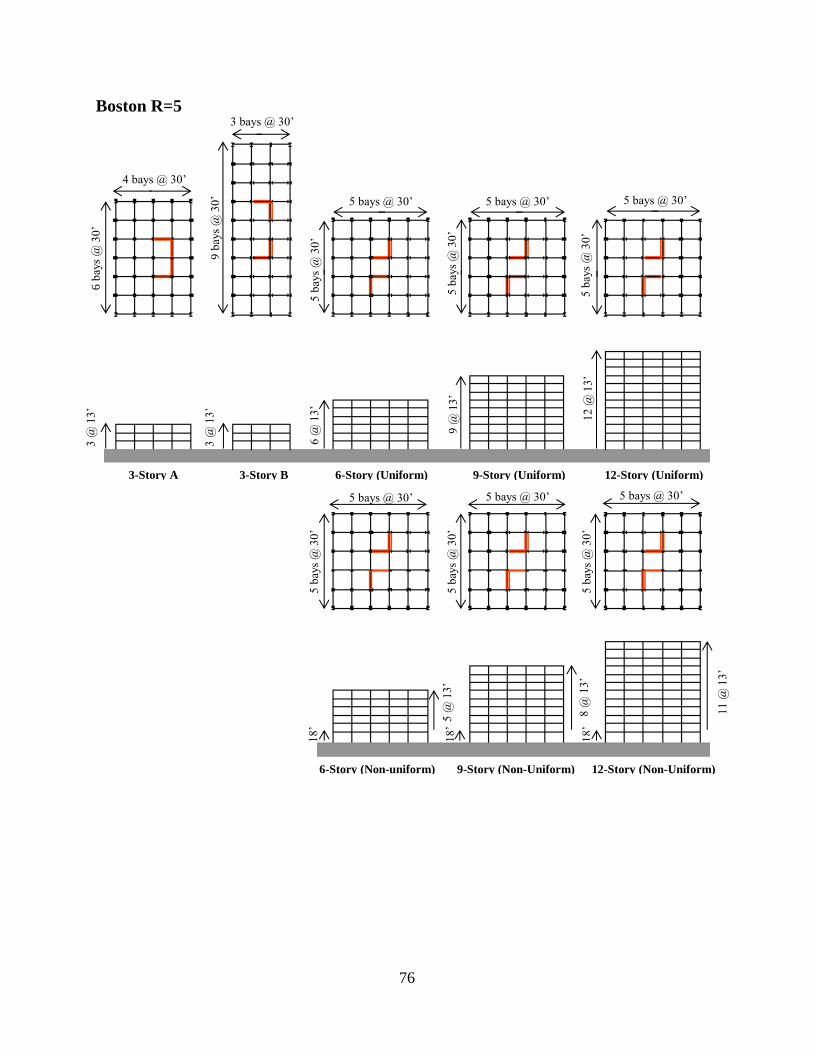
76
Boston R=5
5 @
13
’
8 @
13
’
18
’
18
’
5 bays @ 30’ 5 bays @ 30’
5 b
ays
@ 3
0’
5 b
ays
@ 3
0’
3 @
13
’
3 @
13
’
6 @
13
’
9 @
13
’
9 b
ays
@ 3
0’
3-Story A 3-Story B 6-Story (Uniform) 9-Story (Uniform) 12-Story (Uniform)
4 bays @ 30’
3 bays @ 30’
5 bays @ 30’ 5 bays @ 30’ 5 bays @ 30’
5 b
ays
@ 3
0’
5 b
ays
@ 3
0’
5 b
ays
@ 3
0’
6 b
ays
@ 3
0’
6-Story (Non-uniform) 9-Story (Non-Uniform) 12-Story (Non-Uniform)
12
@ 1
3’
5 b
ays
@ 3
0’
5 bays @ 30’
18
’
11
@ 1
3’
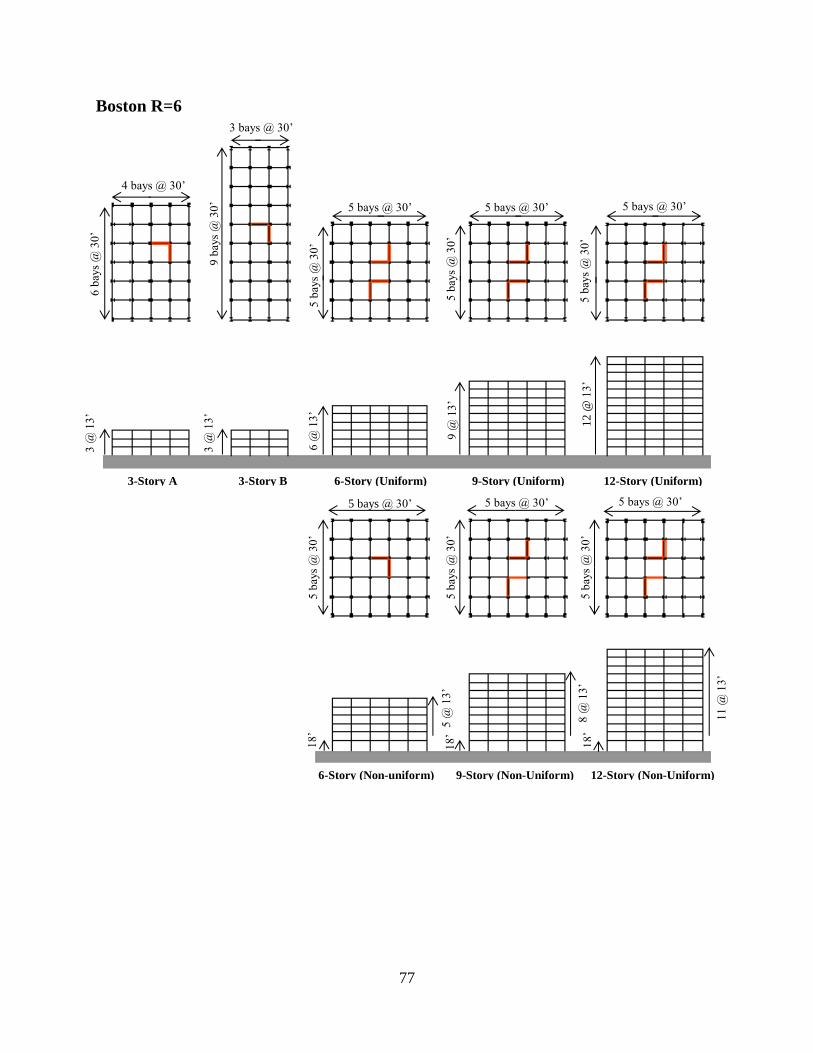
77
Boston R=6
5 @
13
’
8 @
13
’
18
’
18
’
5 bays @ 30’ 5 bays @ 30’
5 b
ays
@ 3
0’
5 b
ays
@ 3
0’
3 @
13
’
3 @
13
’
6 @
13
’
9 @
13
’
9 b
ays
@ 3
0’
3-Story A 3-Story B 6-Story (Uniform) 9-Story (Uniform) 12-Story (Uniform)
4 bays @ 30’
3 bays @ 30’
5 bays @ 30’ 5 bays @ 30’ 5 bays @ 30’
5 b
ays
@ 3
0’
5 b
ays
@ 3
0’
5 b
ays
@ 3
0’
6 b
ays
@ 3
0’
6-Story (Non-uniform) 9-Story (Non-Uniform) 12-Story (Non-Uniform)
12
@ 1
3’
5 b
ays
@ 3
0’
5 bays @ 30’
18
’
11
@ 1
3’
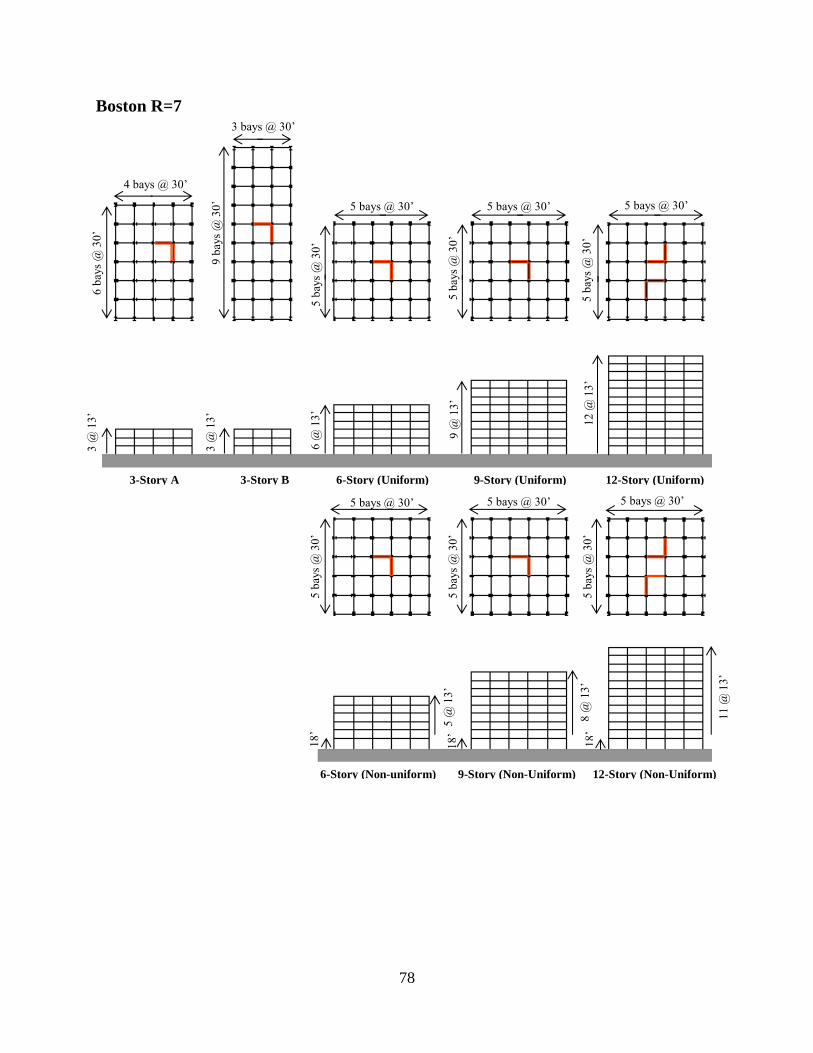
78
Boston R=7
5 @
13
’
8 @
13
’
18
’
18
’
5 bays @ 30’ 5 bays @ 30’
5 b
ays
@ 3
0’
5 b
ays
@ 3
0’
3 @
13
’
3 @
13
’
6 @
13
’
9 @
13
’
9 b
ays
@ 3
0’
3-Story A 3-Story B 6-Story (Uniform) 9-Story (Uniform) 12-Story (Uniform)
4 bays @ 30’
3 bays @ 30’
5 bays @ 30’ 5 bays @ 30’ 5 bays @ 30’
5 b
ays
@ 3
0’
5 b
ays
@ 3
0’
5 b
ays
@ 3
0’
6 b
ays
@ 3
0’
6-Story (Non-uniform) 9-Story (Non-Uniform) 12-Story (Non-Uniform)
12
@ 1
3’
5 b
ays
@ 3
0’
5 bays @ 30’
18
’
11
@ 1
3’
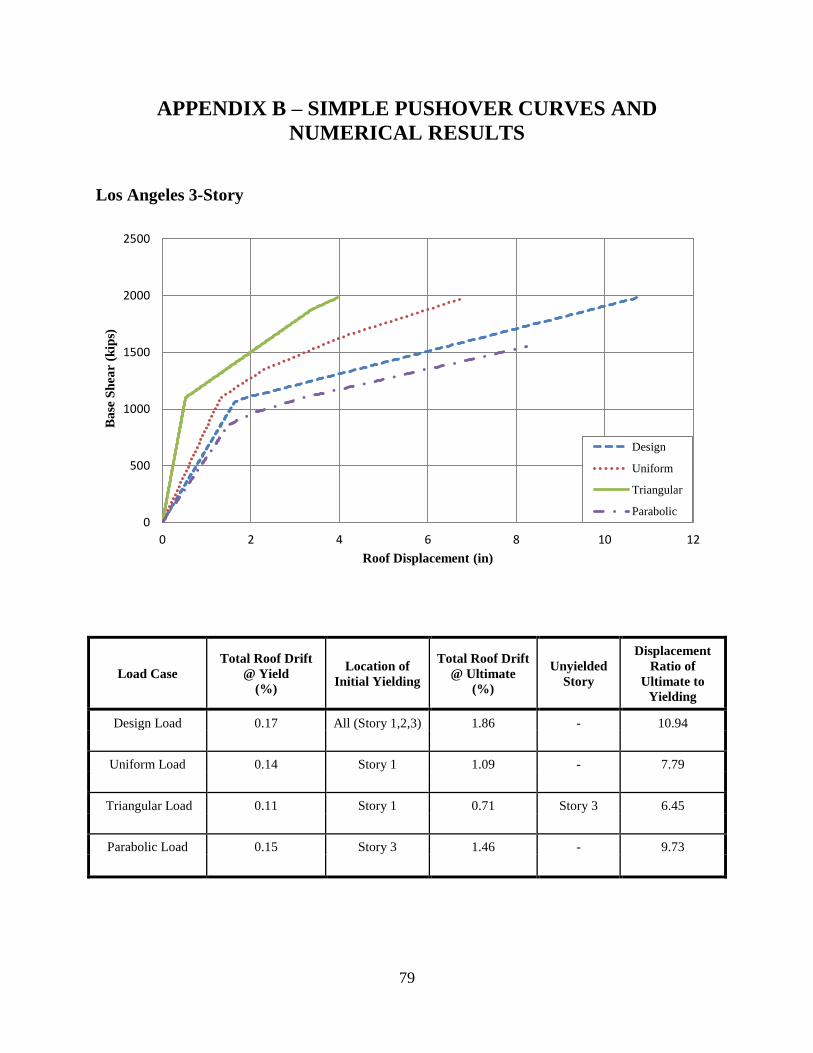
79
APPENDIX B – SIMPLE PUSHOVER CURVES AND
NUMERICAL RESULTS
Los Angeles 3-Story
Load Case
Total Roof Drift
@ Yield
(%)
Location of
Initial Yielding
Total Roof Drift
@ Ultimate
(%)
Unyielded
Story
Displacement
Ratio of
Ultimate to
Yielding
Design Load 0.17 All (Story 1,2,3) 1.86 - 10.94
Uniform Load 0.14 Story 1 1.09 - 7.79
Triangular Load 0.11 Story 1 0.71 Story 3 6.45
Parabolic Load 0.15 Story 3 1.46 - 9.73
0
500
1000
1500
2000
2500
0 2 4 6 8 10 12
Ba
se S
hea
r (k
ips)
Roof Displacement (in)
Design
Uniform
Triangular
Parabolic
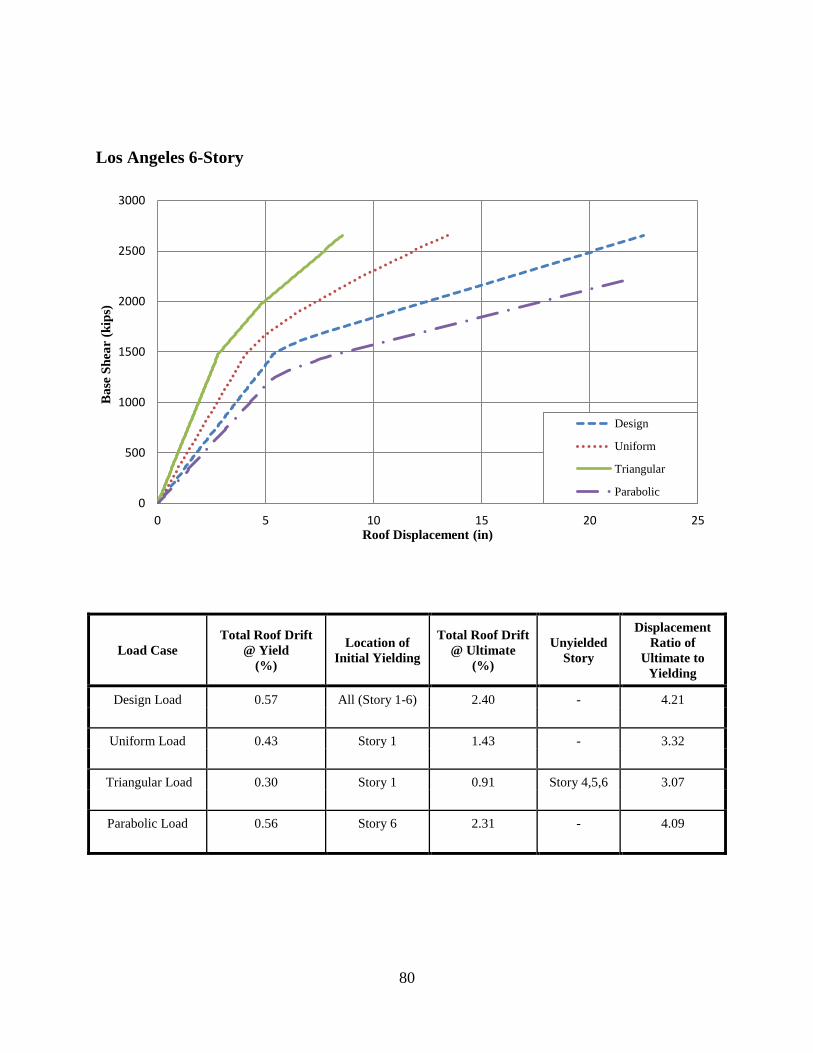
80
Los Angeles 6-Story
Load Case
Total Roof Drift
@ Yield
(%)
Location of
Initial Yielding
Total Roof Drift
@ Ultimate
(%)
Unyielded
Story
Displacement
Ratio of
Ultimate to
Yielding
Design Load 0.57 All (Story 1-6) 2.40 - 4.21
Uniform Load 0.43 Story 1 1.43 - 3.32
Triangular Load 0.30 Story 1 0.91 Story 4,5,6 3.07
Parabolic Load 0.56 Story 6 2.31 - 4.09
0
500
1000
1500
2000
2500
3000
0 5 10 15 20 25
Ba
se S
hea
r (k
ips)
Roof Displacement (in)
Design
Uniform
Triangular
Parabolic

81
Los Angeles 9-Story
Load Case
Total Roof Drift
@ Yield
(%)
Location of Initial
Yielding
Total Roof Drift
@ Ultimate
(%)
Unyielded
Story
Displacement
Ratio of
Ultimate to
Yielding
Design Load 0.64 All (Story 1-9) 2.65 - 4.14
Uniform Load 0.46 Story 1 1.47 - 3.20
Triangular Load 0.28 Story 1 0.81 Story 4-9 2.90
Parabolic Load 0.68 Story 9 2.70 - 3.95
0
500
1000
1500
2000
2500
3000
3500
0 5 10 15 20 25 30 35 40
Ba
se S
hea
r (k
ips)
Roof Displacement (in)
Design
Uniform
Triangular
Parabolic
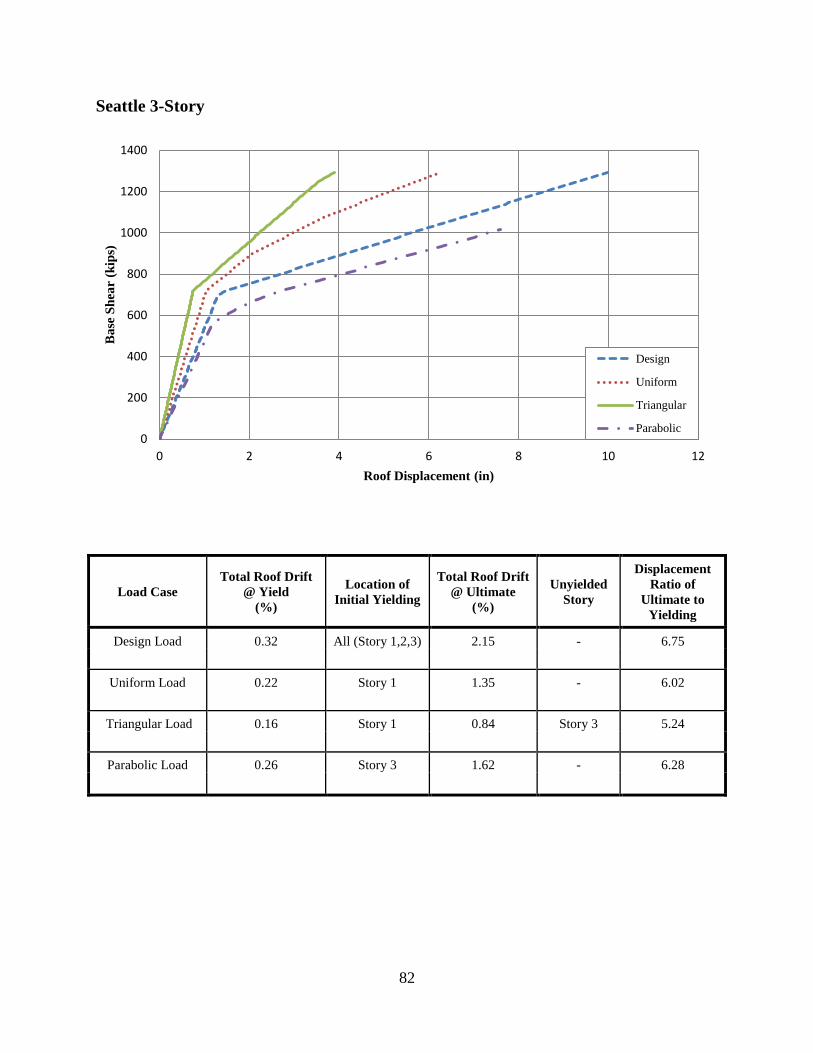
82
Seattle 3-Story
Load Case
Total Roof Drift
@ Yield
(%)
Location of
Initial Yielding
Total Roof Drift
@ Ultimate
(%)
Unyielded
Story
Displacement
Ratio of
Ultimate to
Yielding
Design Load 0.32 All (Story 1,2,3) 2.15 - 6.75
Uniform Load 0.22 Story 1 1.35 - 6.02
Triangular Load 0.16 Story 1 0.84 Story 3 5.24
Parabolic Load 0.26 Story 3 1.62 - 6.28
0
200
400
600
800
1000
1200
1400
0 2 4 6 8 10 12
Ba
se S
hea
r (k
ips)
Roof Displacement (in)
Design
Uniform
Triangular
Parabolic
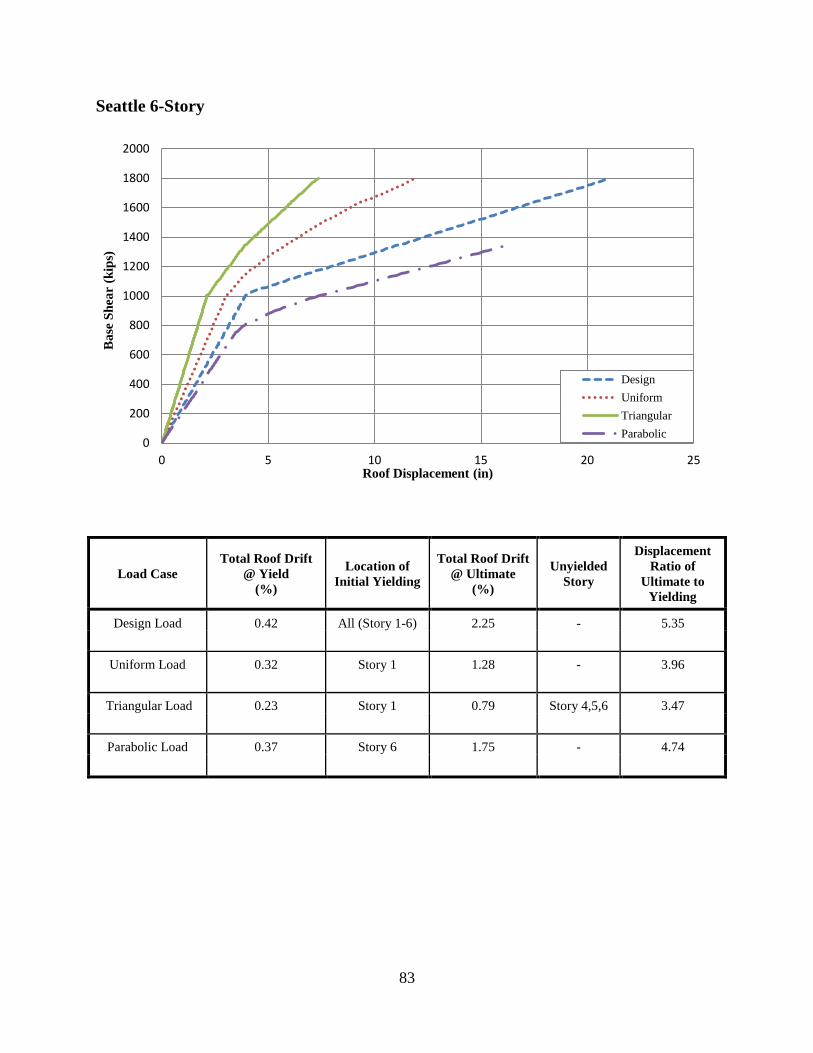
83
Seattle 6-Story
Load Case
Total Roof Drift
@ Yield
(%)
Location of
Initial Yielding
Total Roof Drift
@ Ultimate
(%)
Unyielded
Story
Displacement
Ratio of
Ultimate to
Yielding
Design Load 0.42 All (Story 1-6) 2.25 - 5.35
Uniform Load 0.32 Story 1 1.28 - 3.96
Triangular Load 0.23 Story 1 0.79 Story 4,5,6 3.47
Parabolic Load 0.37 Story 6 1.75 - 4.74
0
200
400
600
800
1000
1200
1400
1600
1800
2000
0 5 10 15 20 25
Ba
se S
hea
r (k
ips)
Roof Displacement (in)
Design
Uniform
Triangular
Parabolic
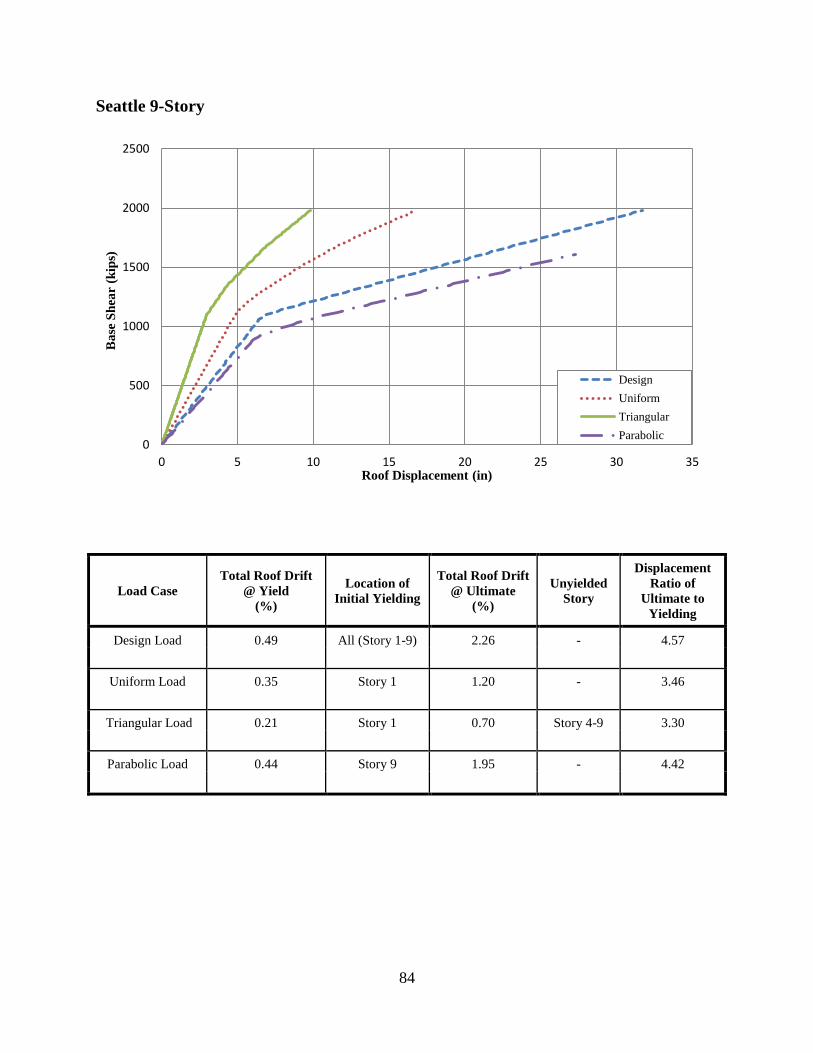
84
Seattle 9-Story
Load Case
Total Roof Drift
@ Yield
(%)
Location of
Initial Yielding
Total Roof Drift
@ Ultimate
(%)
Unyielded
Story
Displacement
Ratio of
Ultimate to
Yielding
Design Load 0.49 All (Story 1-9) 2.26 - 4.57
Uniform Load 0.35 Story 1 1.20 - 3.46
Triangular Load 0.21 Story 1 0.70 Story 4-9 3.30
Parabolic Load 0.44 Story 9 1.95 - 4.42
0
500
1000
1500
2000
2500
0 5 10 15 20 25 30 35
Ba
se S
hea
r (k
ips)
Roof Displacement (in)
Design
Uniform
Triangular
Parabolic
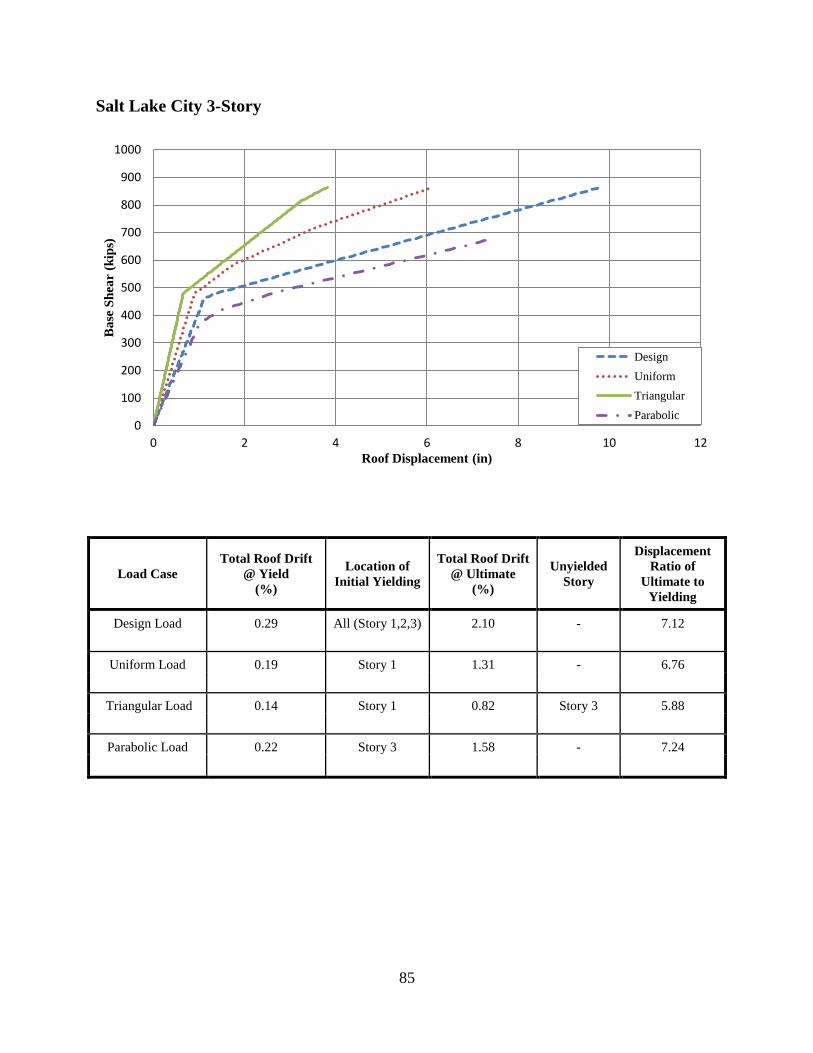
85
Salt Lake City 3-Story
Load Case
Total Roof Drift
@ Yield
(%)
Location of
Initial Yielding
Total Roof Drift
@ Ultimate
(%)
Unyielded
Story
Displacement
Ratio of
Ultimate to
Yielding
Design Load 0.29 All (Story 1,2,3) 2.10 - 7.12
Uniform Load 0.19 Story 1 1.31 - 6.76
Triangular Load 0.14 Story 1 0.82 Story 3 5.88
Parabolic Load 0.22 Story 3 1.58 - 7.24
0
100
200
300
400
500
600
700
800
900
1000
0 2 4 6 8 10 12
Ba
se S
hea
r (k
ips)
Roof Displacement (in)
Design
Uniform
Triangular
Parabolic
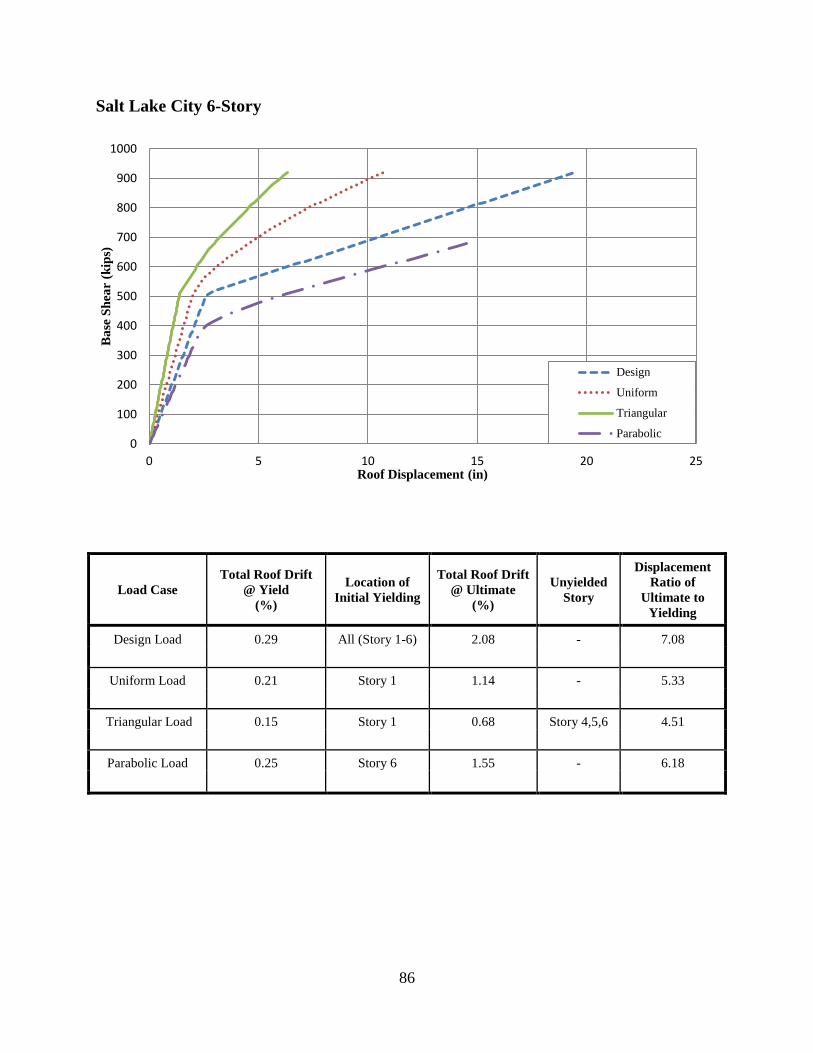
86
Salt Lake City 6-Story
Load Case
Total Roof Drift
@ Yield
(%)
Location of
Initial Yielding
Total Roof Drift
@ Ultimate
(%)
Unyielded
Story
Displacement
Ratio of
Ultimate to
Yielding
Design Load 0.29 All (Story 1-6) 2.08 - 7.08
Uniform Load 0.21 Story 1 1.14 - 5.33
Triangular Load 0.15 Story 1 0.68 Story 4,5,6 4.51
Parabolic Load 0.25 Story 6 1.55 - 6.18
0
100
200
300
400
500
600
700
800
900
1000
0 5 10 15 20 25
Ba
se S
hea
r (k
ips)
Roof Displacement (in)
Design
Uniform
Triangular
Parabolic
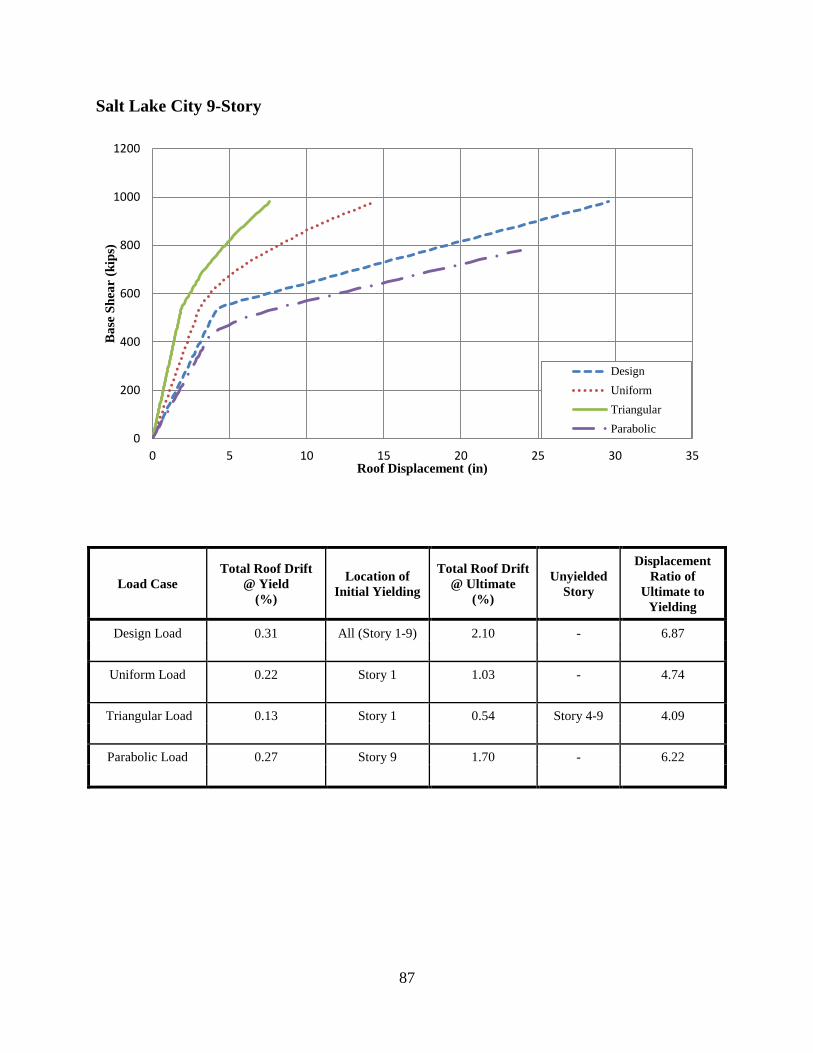
87
Salt Lake City 9-Story
Load Case
Total Roof Drift
@ Yield
(%)
Location of
Initial Yielding
Total Roof Drift
@ Ultimate
(%)
Unyielded
Story
Displacement
Ratio of
Ultimate to
Yielding
Design Load 0.31 All (Story 1-9) 2.10 - 6.87
Uniform Load 0.22 Story 1 1.03 - 4.74
Triangular Load 0.13 Story 1 0.54 Story 4-9 4.09
Parabolic Load 0.27 Story 9 1.70 - 6.22
0
200
400
600
800
1000
1200
0 5 10 15 20 25 30 35
Ba
se S
hea
r (k
ips)
Roof Displacement (in)
Design
Uniform
Triangular
Parabolic
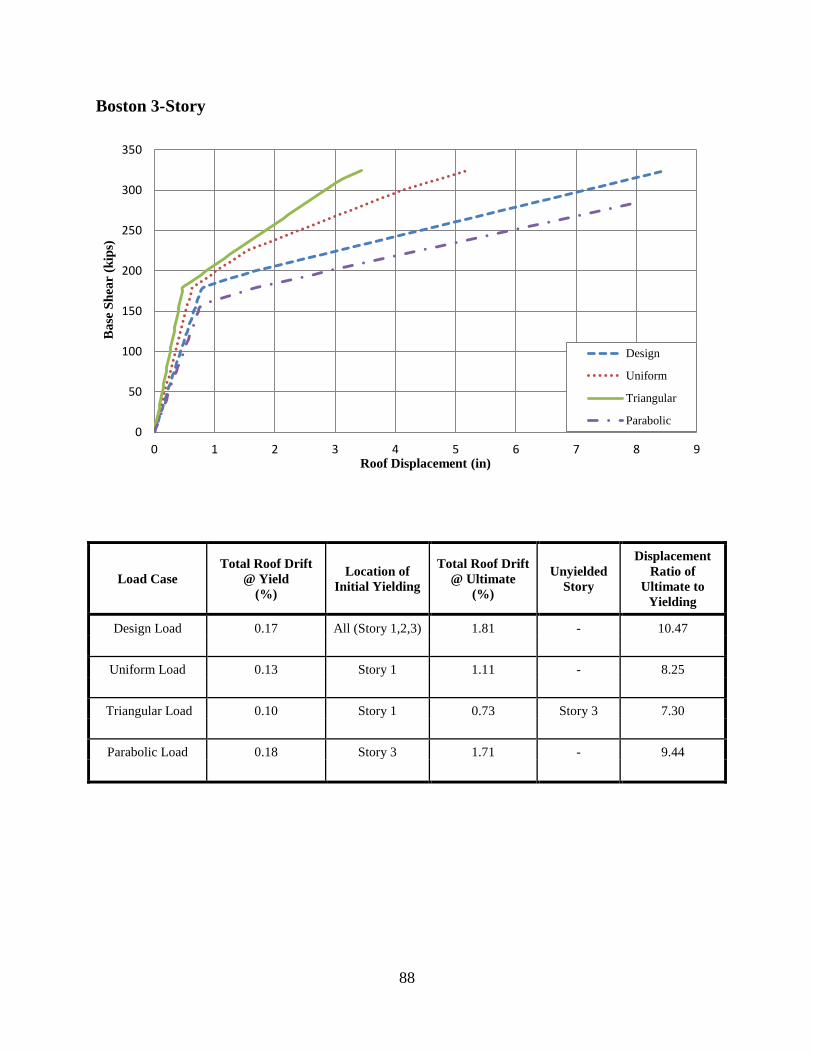
88
Boston 3-Story
Load Case
Total Roof Drift
@ Yield
(%)
Location of
Initial Yielding
Total Roof Drift
@ Ultimate
(%)
Unyielded
Story
Displacement
Ratio of
Ultimate to
Yielding
Design Load 0.17 All (Story 1,2,3) 1.81 - 10.47
Uniform Load 0.13 Story 1 1.11 - 8.25
Triangular Load 0.10 Story 1 0.73 Story 3 7.30
Parabolic Load 0.18 Story 3 1.71 - 9.44
0
50
100
150
200
250
300
350
0 1 2 3 4 5 6 7 8 9
Ba
se S
hea
r (k
ips)
Roof Displacement (in)
Design
Uniform
Triangular
Parabolic
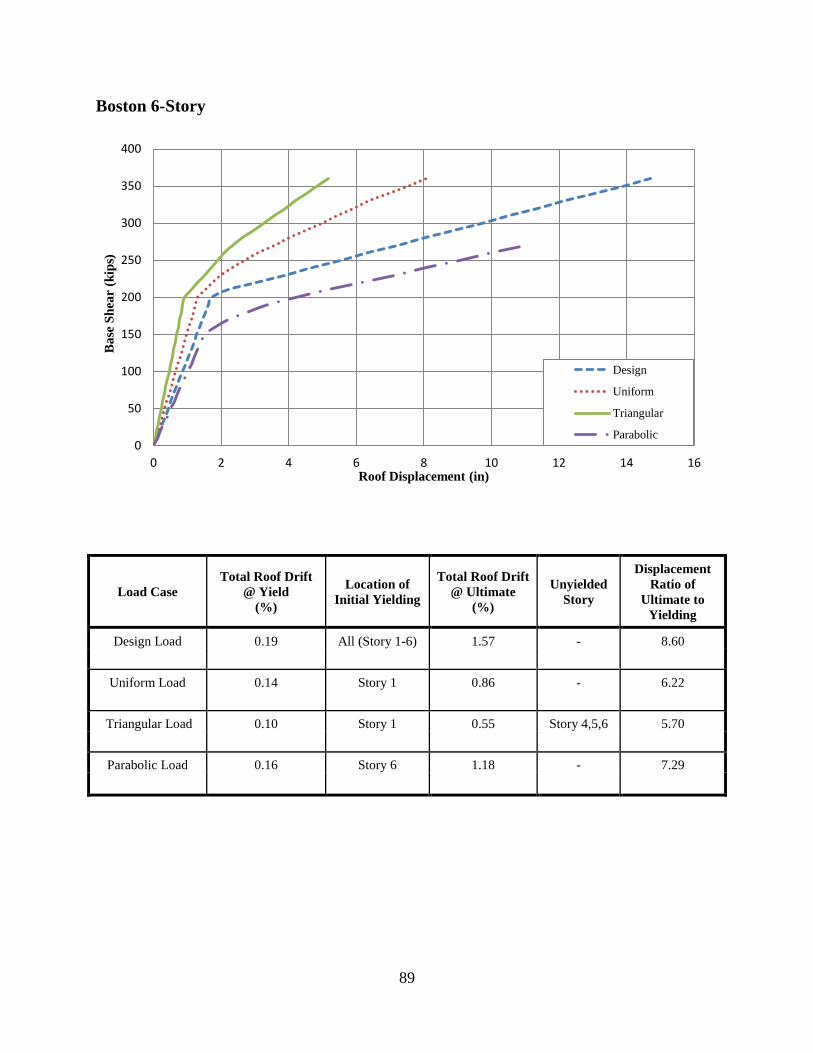
89
Boston 6-Story
Load Case
Total Roof Drift
@ Yield
(%)
Location of
Initial Yielding
Total Roof Drift
@ Ultimate
(%)
Unyielded
Story
Displacement
Ratio of
Ultimate to
Yielding
Design Load 0.19 All (Story 1-6) 1.57 - 8.60
Uniform Load 0.14 Story 1 0.86 - 6.22
Triangular Load 0.10 Story 1 0.55 Story 4,5,6 5.70
Parabolic Load 0.16 Story 6 1.18 - 7.29
0
50
100
150
200
250
300
350
400
0 2 4 6 8 10 12 14 16
Ba
se S
hea
r (k
ips)
Roof Displacement (in)
Design
Uniform
Triangular
Parabolic
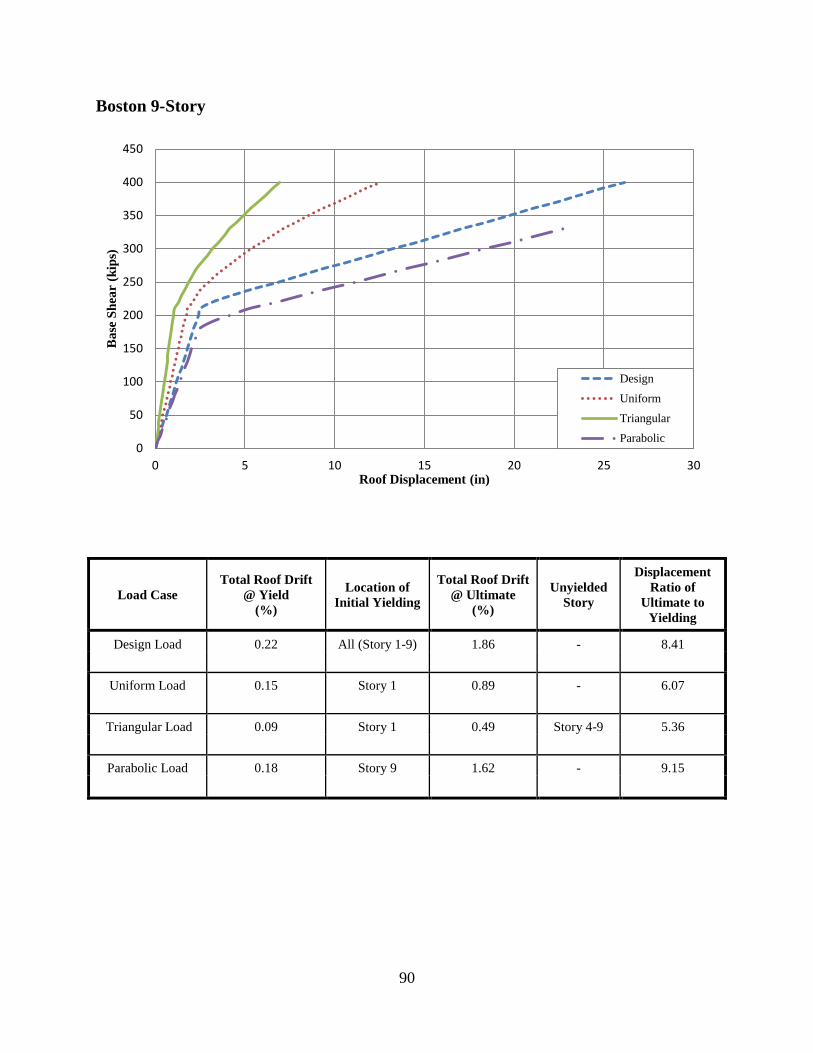
90
Boston 9-Story
Load Case
Total Roof Drift
@ Yield
(%)
Location of
Initial Yielding
Total Roof Drift
@ Ultimate
(%)
Unyielded
Story
Displacement
Ratio of
Ultimate to
Yielding
Design Load 0.22 All (Story 1-9) 1.86 - 8.41
Uniform Load 0.15 Story 1 0.89 - 6.07
Triangular Load 0.09 Story 1 0.49 Story 4-9 5.36
Parabolic Load 0.18 Story 9 1.62 - 9.15
0
50
100
150
200
250
300
350
400
450
0 5 10 15 20 25 30
Ba
se S
hea
r (k
ips)
Roof Displacement (in)
Design
Uniform
Triangular
Parabolic
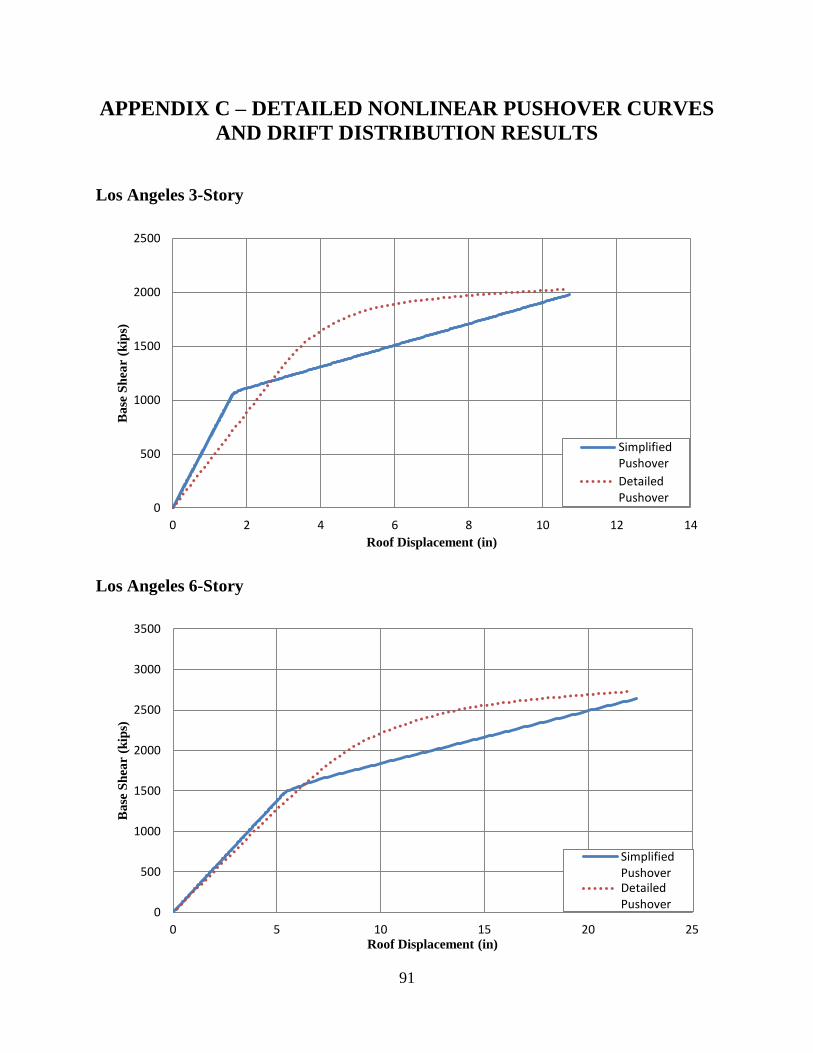
91
APPENDIX C – DETAILED NONLINEAR PUSHOVER CURVES
AND DRIFT DISTRIBUTION RESULTS
Los Angeles 3-Story
Los Angeles 6-Story
0
500
1000
1500
2000
2500
0 2 4 6 8 10 12 14
Ba
se S
hea
r (k
ips)
Roof Displacement (in)
SimplifiedPushover
DetailedPushover
0
500
1000
1500
2000
2500
3000
3500
0 5 10 15 20 25
Ba
se S
hea
r (k
ips)
Roof Displacement (in)
SimplifiedPushoverDetailedPushover
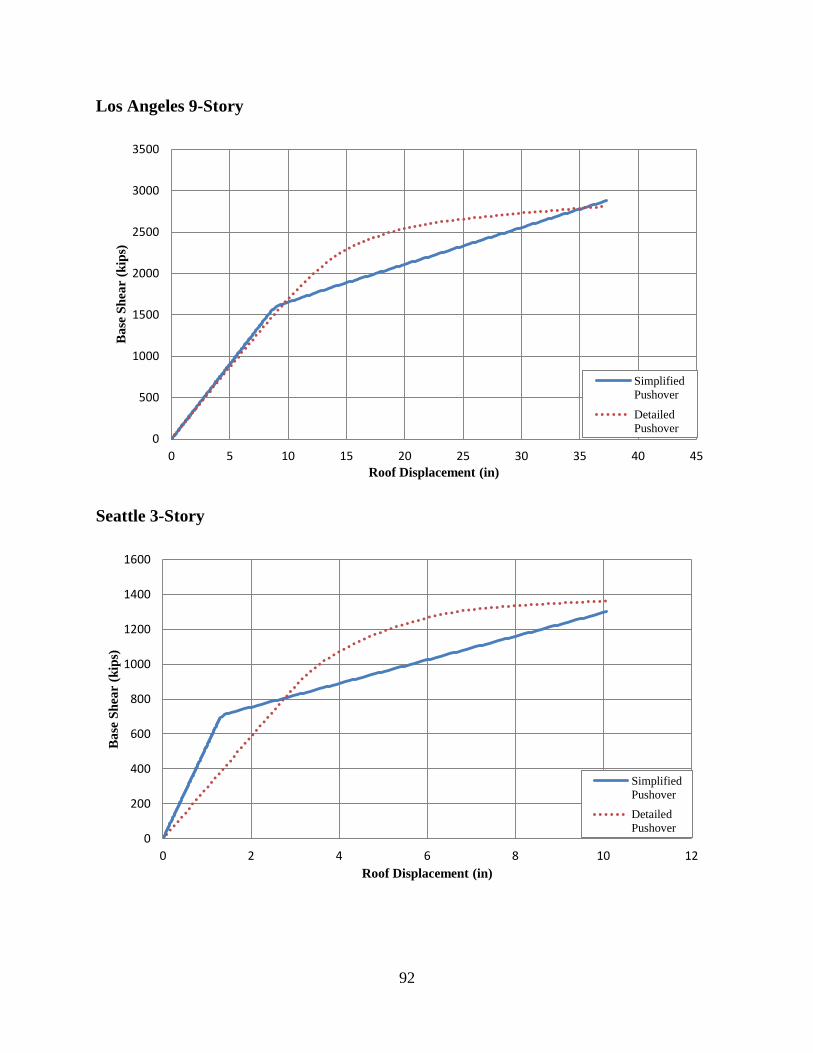
92
Los Angeles 9-Story
Seattle 3-Story
0
500
1000
1500
2000
2500
3000
3500
0 5 10 15 20 25 30 35 40 45
Ba
se S
hea
r (k
ips)
Roof Displacement (in)
Simplified
Pushover
Detailed
Pushover
0
200
400
600
800
1000
1200
1400
1600
0 2 4 6 8 10 12
Ba
se S
hea
r (k
ips)
Roof Displacement (in)
Simplified
Pushover
Detailed
Pushover
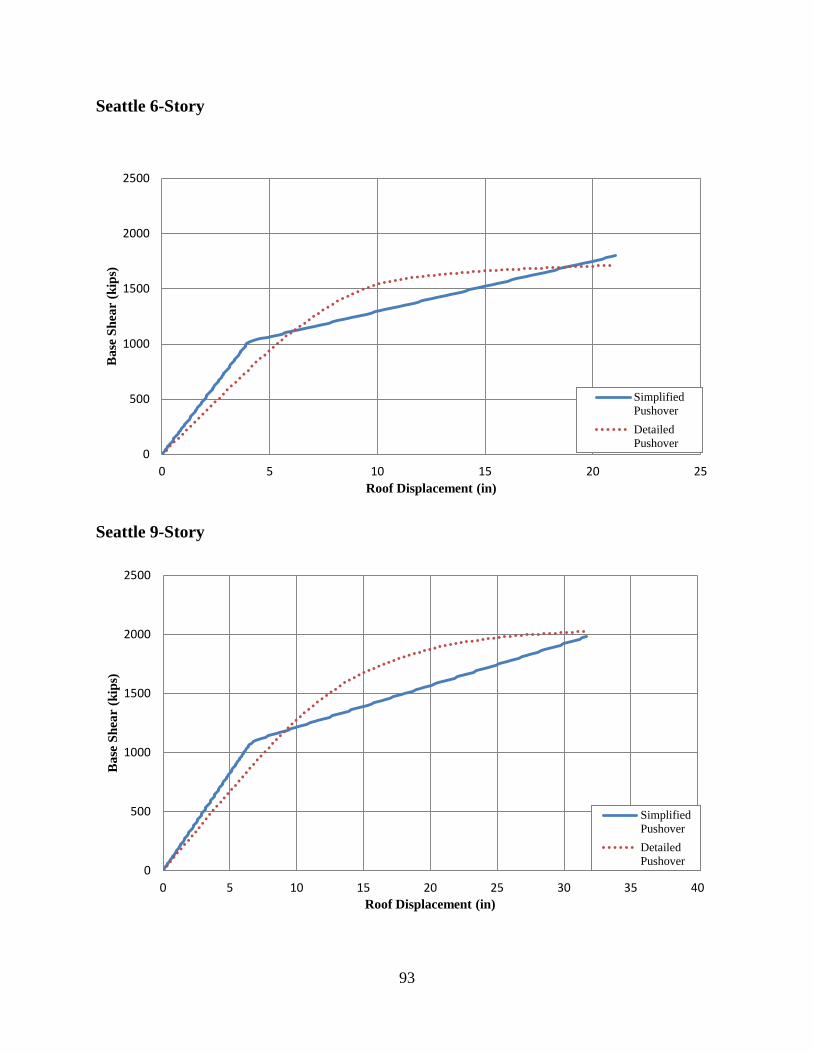
93
Seattle 6-Story
Seattle 9-Story
0
500
1000
1500
2000
2500
0 5 10 15 20 25
Ba
se S
hea
r (k
ips)
Roof Displacement (in)
Simplified
Pushover
Detailed
Pushover
0
500
1000
1500
2000
2500
0 5 10 15 20 25 30 35 40
Ba
se S
hea
r (k
ips)
Roof Displacement (in)
Simplified
Pushover
Detailed
Pushover
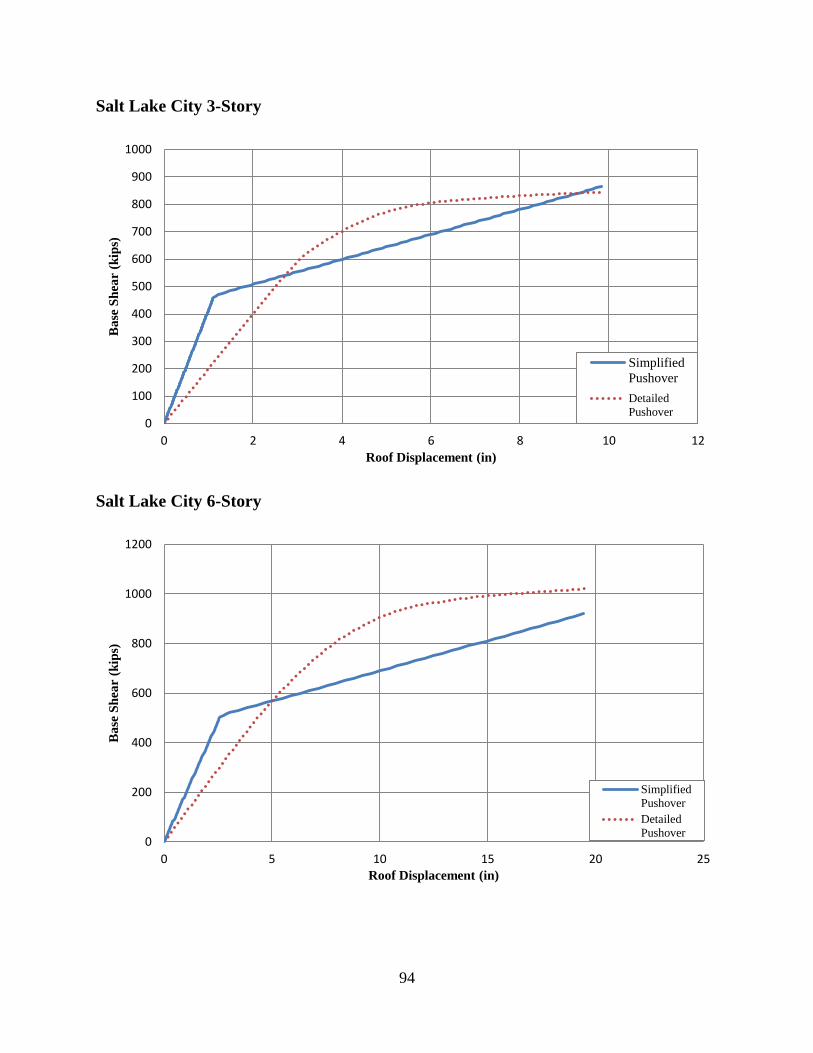
94
Salt Lake City 3-Story
Salt Lake City 6-Story
0
100
200
300
400
500
600
700
800
900
1000
0 2 4 6 8 10 12
Ba
se S
hea
r (k
ips)
Roof Displacement (in)
Simplified
Pushover
Detailed
Pushover
0
200
400
600
800
1000
1200
0 5 10 15 20 25
Ba
se S
hea
r (k
ips)
Roof Displacement (in)
Simplified
Pushover
Detailed
Pushover
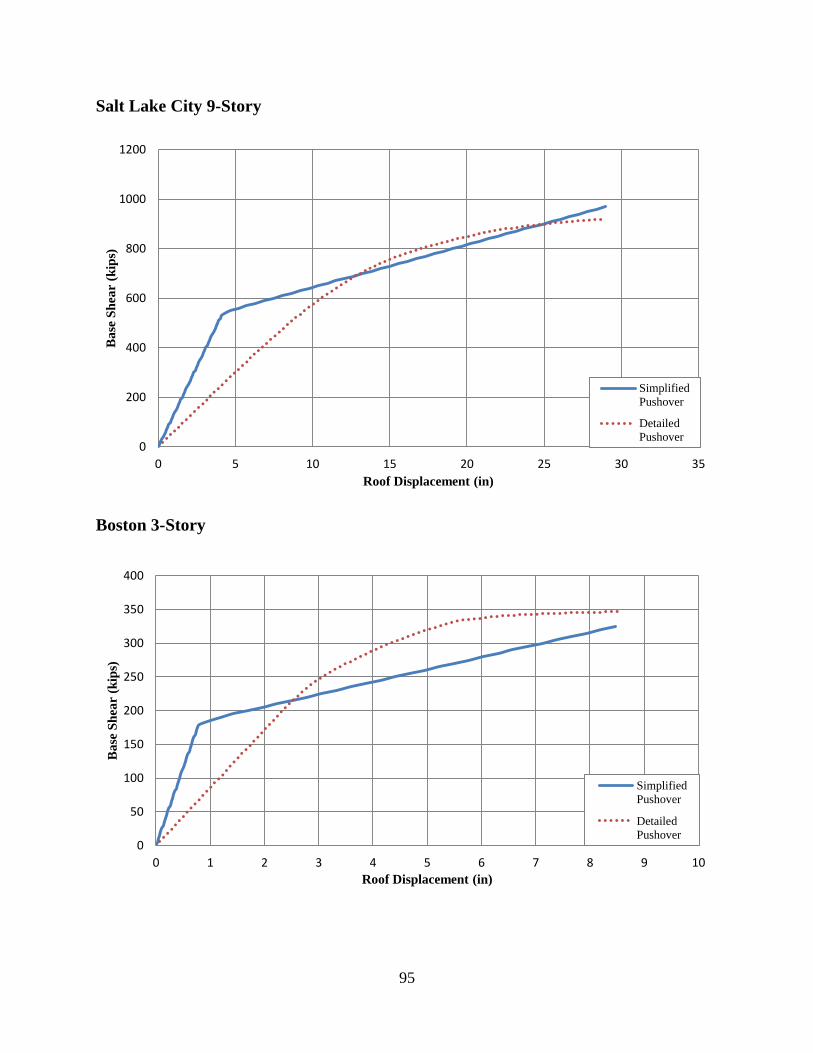
95
Salt Lake City 9-Story
Boston 3-Story
0
200
400
600
800
1000
1200
0 5 10 15 20 25 30 35
Ba
se S
hea
r (k
ips)
Roof Displacement (in)
Simplified
Pushover
Detailed
Pushover
0
50
100
150
200
250
300
350
400
0 1 2 3 4 5 6 7 8 9 10
Ba
se S
hea
r (k
ips)
Roof Displacement (in)
Simplified
Pushover
Detailed
Pushover
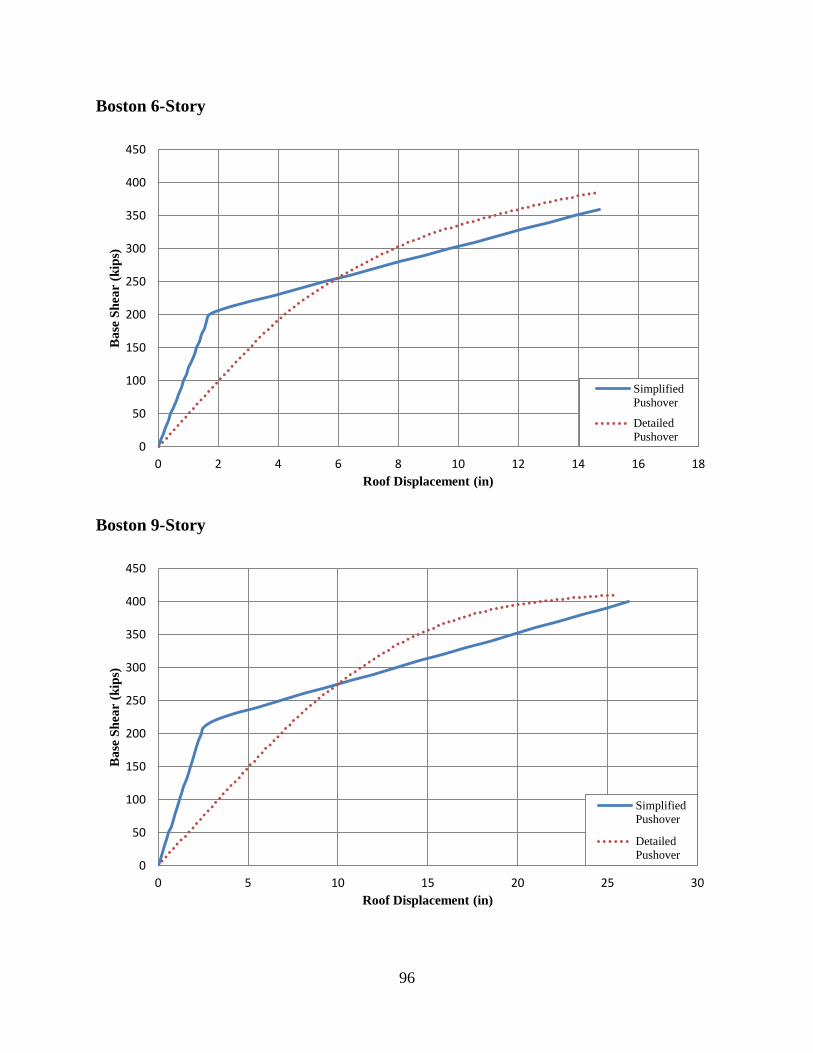
96
Boston 6-Story
Boston 9-Story
0
50
100
150
200
250
300
350
400
450
0 2 4 6 8 10 12 14 16 18
Ba
se S
hea
r (k
ips)
Roof Displacement (in)
Simplified
Pushover
Detailed
Pushover
0
50
100
150
200
250
300
350
400
450
0 5 10 15 20 25 30
Ba
se S
hea
r (k
ips)
Roof Displacement (in)
Simplified
Pushover
Detailed
Pushover
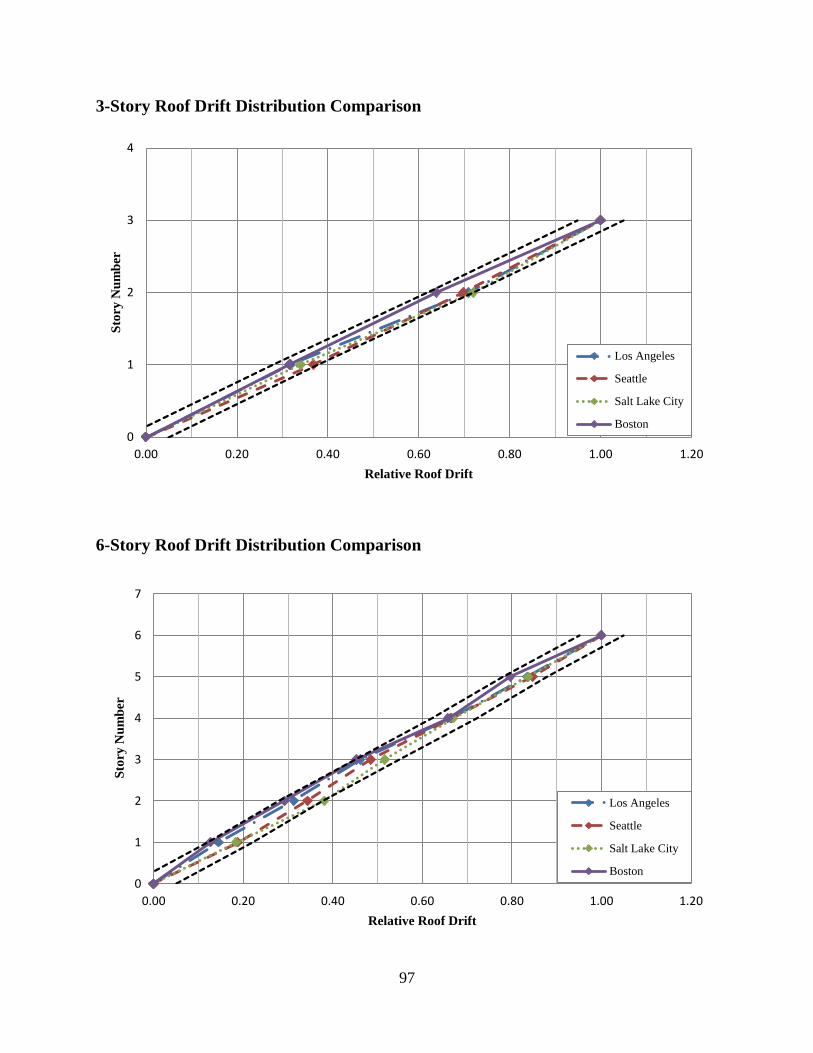
97
3-Story Roof Drift Distribution Comparison
6-Story Roof Drift Distribution Comparison
0
1
2
3
4
0.00 0.20 0.40 0.60 0.80 1.00 1.20
Sto
ry N
um
ber
Relative Roof Drift
Los Angeles
Seattle
Salt Lake City
Boston
0
1
2
3
4
5
6
7
0.00 0.20 0.40 0.60 0.80 1.00 1.20
Sto
ry N
um
ber
Relative Roof Drift
Los Angeles
Seattle
Salt Lake City
Boston
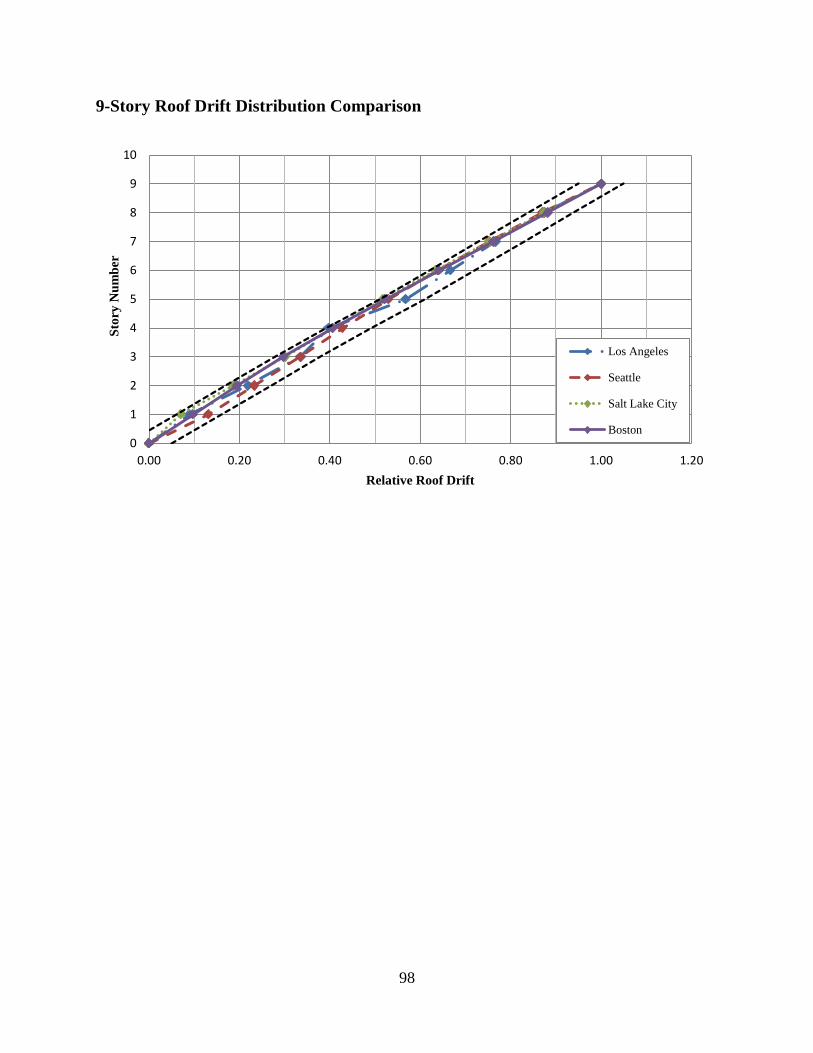
98
9-Story Roof Drift Distribution Comparison
0
1
2
3
4
5
6
7
8
9
10
0.00 0.20 0.40 0.60 0.80 1.00 1.20
Sto
ry N
um
ber
Relative Roof Drift
Los Angeles
Seattle
Salt Lake City
Boston
99
APPENDIX D – DESIGN EXAMPLE CALCULATIONS
INTRODUCTION
This section illustrates the load determination and selection of representative members that are
part of the gravity and lateral force resisting frame of a typical three-story building. The design
framework used throughout this example is modeled after the 2011 AISC Design Examples for
structural system design (AISC 2011). The design is completed in accordance with the 2010
AISC Specification for Structural Steel Buildings, the 14th
Edition AISC Steel Construction
Manual (AISC 2010), and the 2011 MSJC Building Code Requirements and Specification for
Masonry Structures (MSJC 2011). Loading criteria are based on ASCE/SEI 7-10 (ASCE, 2010).
This section includes:
Analysis and design of a typical Type I hybrid masonry frame for gravity loads
Analysis and design of a typical Type I hybrid masonry frame for lateral loads
The building being analyzed in this design example is located in a city in the western United
States in which the building design is controlled by the high seismic loads. The specific loads
considered are given in the description of the design example. All members are ASTM A992
steel unless otherwise defined.
CONVENTIONS
The following conventions are used throughout this example:
1. Beams, girders and columns that have similar, but not necessarily identical loads are
grouped together. This is done because such grouping is generally a more economical
practice for design, fabrication and erection.
2. Certain calculations, such as design loads for snow drift, which might typically be
determined using a spreadsheet or structural analysis program, are left out of the analysis
because it was assumed that snow would not be a relevant factor in the design of the
building.
3. Two commonly used deflection calculations, for uniform loads and equally distributed
point loads, have been rearranged so that the conventional units in the problem can be
directly inserted into the equation for steel member design.
Uniform Load: ⁄
⁄
Point Loads:
100
DESIGN SEQUENCE
The design sequence is presented as follows:
1. General description of the building including geometry and gravity loads
2. Seismic load determination
3. Fuse connector and concrete masonry panel distribution
4. Roof member design and selection for gravity loads
5. Floor member design and selection for gravity loads
6. Column design and selection for gravity loads
7. Stability (P-∆) analysis
8. Roof member design and selection for gravity and seismic loads
9. Floor member design and selection for gravity and seismic loads
10. Column design and selection for gravity and seismic loads
11. Design of masonry panels
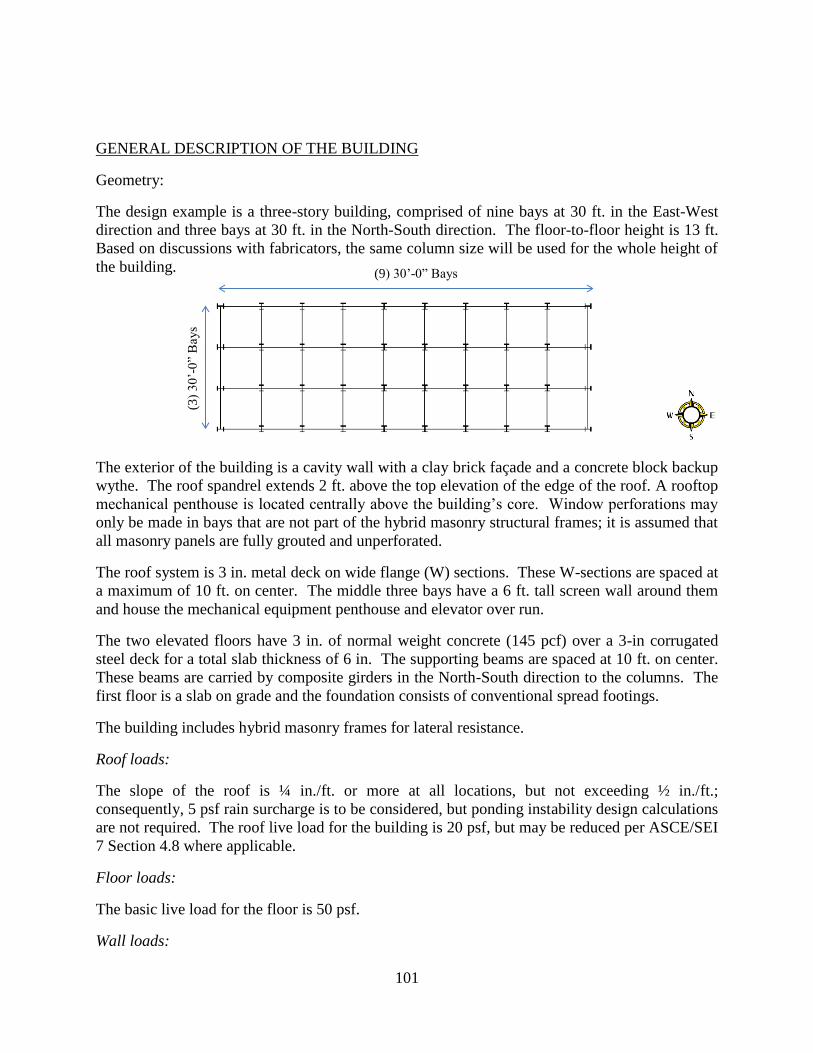
101
GENERAL DESCRIPTION OF THE BUILDING
Geometry:
The design example is a three-story building, comprised of nine bays at 30 ft. in the East-West
direction and three bays at 30 ft. in the North-South direction. The floor-to-floor height is 13 ft.
Based on discussions with fabricators, the same column size will be used for the whole height of
the building.
The exterior of the building is a cavity wall with a clay brick façade and a concrete block backup
wythe. The roof spandrel extends 2 ft. above the top elevation of the edge of the roof. A rooftop
mechanical penthouse is located centrally above the building’s core. Window perforations may
only be made in bays that are not part of the hybrid masonry structural frames; it is assumed that
all masonry panels are fully grouted and unperforated.
The roof system is 3 in. metal deck on wide flange (W) sections. These W-sections are spaced at
a maximum of 10 ft. on center. The middle three bays have a 6 ft. tall screen wall around them
and house the mechanical equipment penthouse and elevator over run.
The two elevated floors have 3 in. of normal weight concrete (145 pcf) over a 3-in corrugated
steel deck for a total slab thickness of 6 in. The supporting beams are spaced at 10 ft. on center.
These beams are carried by composite girders in the North-South direction to the columns. The
first floor is a slab on grade and the foundation consists of conventional spread footings.
The building includes hybrid masonry frames for lateral resistance.
Roof loads:
The slope of the roof is ¼ in./ft. or more at all locations, but not exceeding ½ in./ft.;
consequently, 5 psf rain surcharge is to be considered, but ponding instability design calculations
are not required. The roof live load for the building is 20 psf, but may be reduced per ASCE/SEI
7 Section 4.8 where applicable.
Floor loads:
The basic live load for the floor is 50 psf.
Wall loads:
(9) 30’-0” Bays
(3)
30
’-0
” B
ays
102
A wall load of 55 psf will be used for the brick façade and supporting elements.
SEISMIC LOAD DETERMINATION
The floor plan area: 270 ft., column center line to column center line, by 90 ft., column centerline
to column center line, with the edge of floor slab or roof deck 6 in. beyond the column center
line.
Area = (271 ft.) (91 ft.) = 24661 ft2
The perimeter cladding system length:
Length = (2) (271 ft.) + (2) (91 ft.) = 724 ft.
The perimeter cladding weight at floors:
Brick façade with concrete block backup
(13 ft.) (0.055 ksf) = 0.715 klf
Typical roof dead load:
Roof Area = (24661 ft2) (0.04 ksf) = 987 kips
Wall Perimeter = (724 ft.) (0.358 klf) = 260 kips
Mechanical Area = (2700 ft2) (0.04 ksf) = 108 kips
Total 1400 kips
Typical third and second floor dead load:
Floor Area = (24661 ft2) (0.084 ksf) = 2080 kips
Wall Perimeter = (724 ft.) (0.715 klf) = 518 kips
Total 2600 kips
Total dead load of the building:
Roof 1355 kips
Third Floor 2590 kips
Second Floor 2590 kips
Total 6600 kips
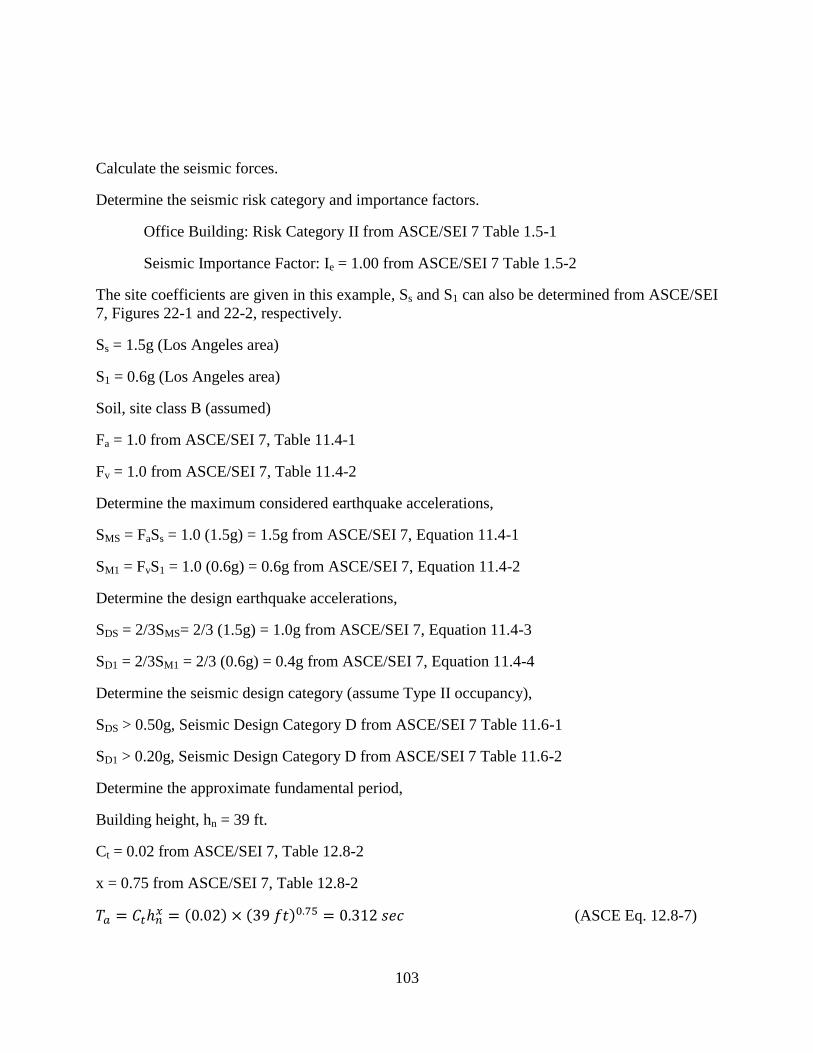
103
Calculate the seismic forces.
Determine the seismic risk category and importance factors.
Office Building: Risk Category II from ASCE/SEI 7 Table 1.5-1
Seismic Importance Factor: Ie = 1.00 from ASCE/SEI 7 Table 1.5-2
The site coefficients are given in this example, Ss and S1 can also be determined from ASCE/SEI
7, Figures 22-1 and 22-2, respectively.
Ss = 1.5g (Los Angeles area)
S1 = 0.6g (Los Angeles area)
Soil, site class B (assumed)
Fa = 1.0 from ASCE/SEI 7, Table 11.4-1
Fv = 1.0 from ASCE/SEI 7, Table 11.4-2
Determine the maximum considered earthquake accelerations,
SMS = FaSs = 1.0 (1.5g) = 1.5g from ASCE/SEI 7, Equation 11.4-1
SM1 = FvS1 = 1.0 (0.6g) = 0.6g from ASCE/SEI 7, Equation 11.4-2
Determine the design earthquake accelerations,
SDS = 2/3SMS= 2/3 (1.5g) = 1.0g from ASCE/SEI 7, Equation 11.4-3
SD1 = 2/3SM1 = 2/3 (0.6g) = 0.4g from ASCE/SEI 7, Equation 11.4-4
Determine the seismic design category (assume Type II occupancy),
SDS > 0.50g, Seismic Design Category D from ASCE/SEI 7 Table 11.6-1
SD1 > 0.20g, Seismic Design Category D from ASCE/SEI 7 Table 11.6-2
Determine the approximate fundamental period,
Building height, hn = 39 ft.
Ct = 0.02 from ASCE/SEI 7, Table 12.8-2
x = 0.75 from ASCE/SEI 7, Table 12.8-2
(ASCE Eq. 12.8-7)
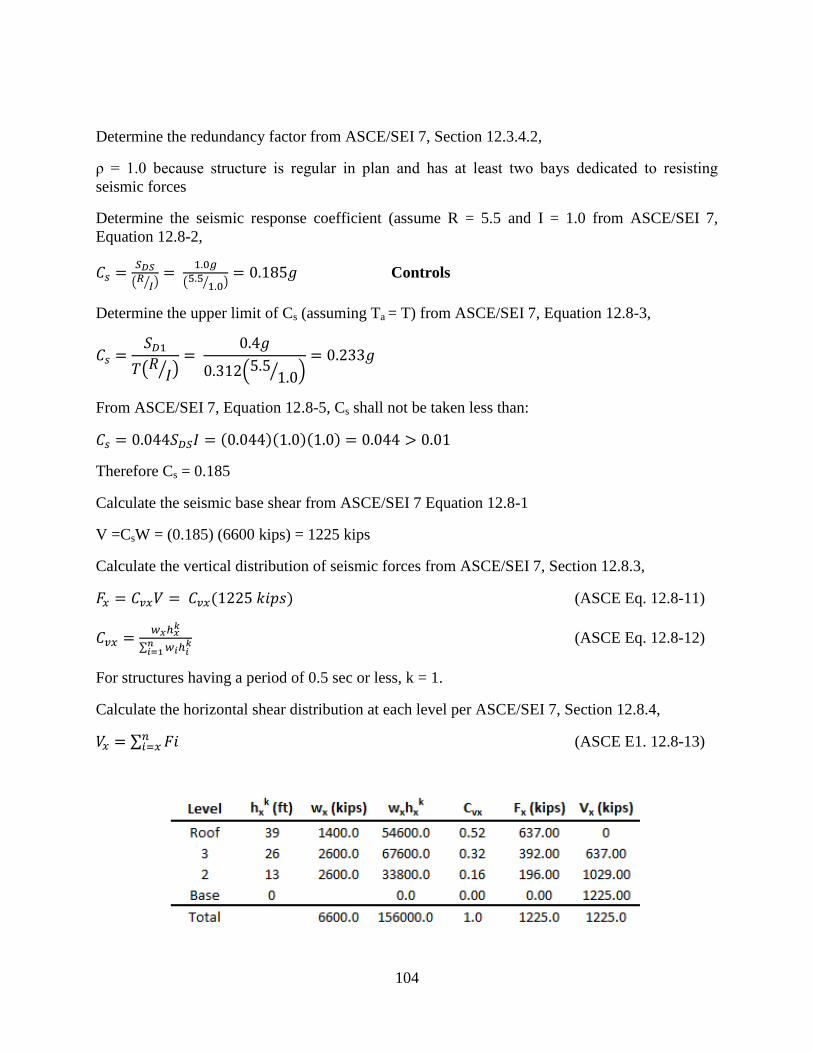
104
Determine the redundancy factor from ASCE/SEI 7, Section 12.3.4.2,
ρ = 1.0 because structure is regular in plan and has at least two bays dedicated to resisting
seismic forces
Determine the seismic response coefficient (assume R = 5.5 and I = 1.0 from ASCE/SEI 7,
Equation 12.8-2,
( ⁄ )
( ⁄ ) Controls
Determine the upper limit of Cs (assuming Ta = T) from ASCE/SEI 7, Equation 12.8-3,
( ⁄ )
( ⁄ )
From ASCE/SEI 7, Equation 12.8-5, Cs shall not be taken less than:
Therefore Cs = 0.185
Calculate the seismic base shear from ASCE/SEI 7 Equation 12.8-1
V =CsW = (0.185) (6600 kips) = 1225 kips
Calculate the vertical distribution of seismic forces from ASCE/SEI 7, Section 12.8.3,
(ASCE Eq. 12.8-11)
∑
(ASCE Eq. 12.8-12)
For structures having a period of 0.5 sec or less, k = 1.
Calculate the horizontal shear distribution at each level per ASCE/SEI 7, Section 12.8.4,
∑ (ASCE E1. 12.8-13)
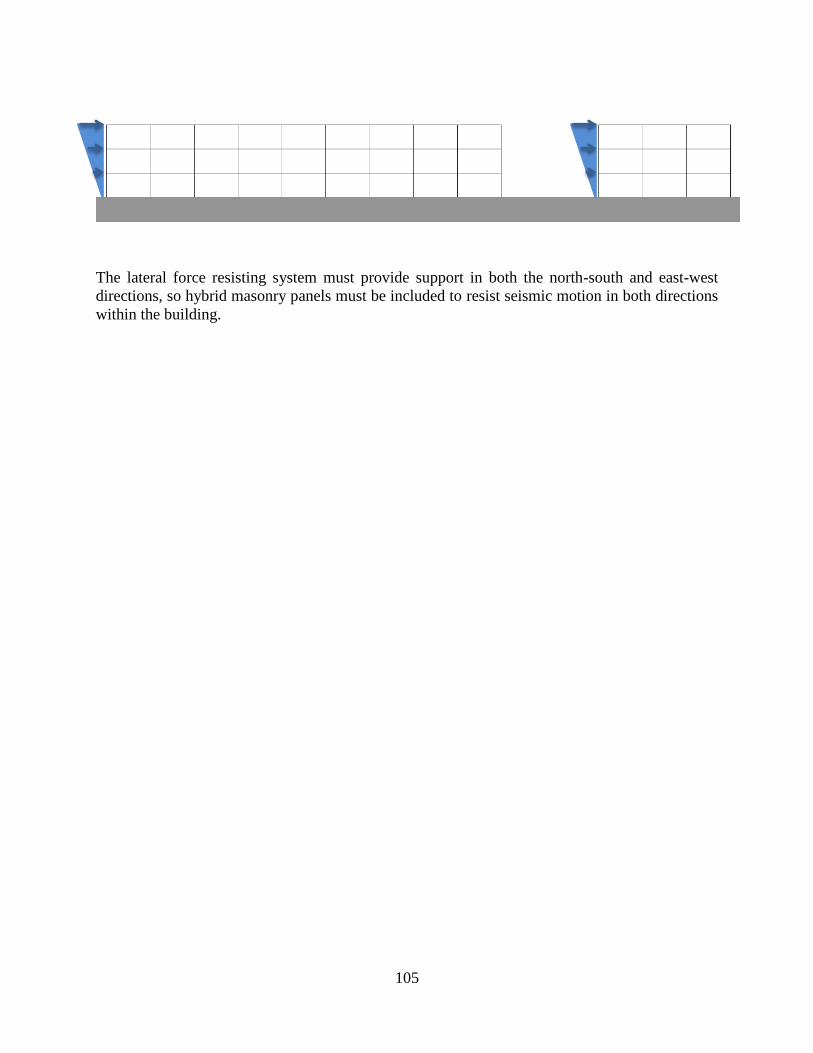
105
The lateral force resisting system must provide support in both the north-south and east-west
directions, so hybrid masonry panels must be included to resist seismic motion in both directions
within the building.
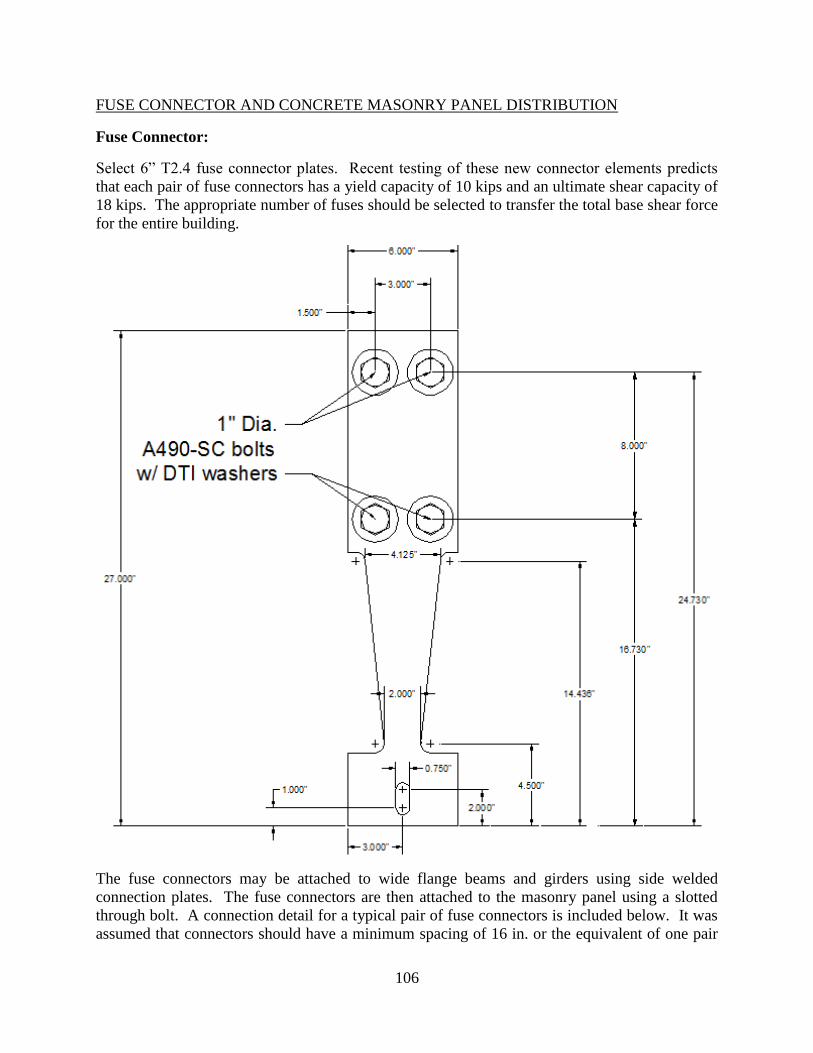
106
FUSE CONNECTOR AND CONCRETE MASONRY PANEL DISTRIBUTION
Fuse Connector:
Select 6” T2.4 fuse connector plates. Recent testing of these new connector elements predicts
that each pair of fuse connectors has a yield capacity of 10 kips and an ultimate shear capacity of
18 kips. The appropriate number of fuses should be selected to transfer the total base shear force
for the entire building.
The fuse connectors may be attached to wide flange beams and girders using side welded
connection plates. The fuse connectors are then attached to the masonry panel using a slotted
through bolt. A connection detail for a typical pair of fuse connectors is included below. It was
assumed that connectors should have a minimum spacing of 16 in. or the equivalent of one pair
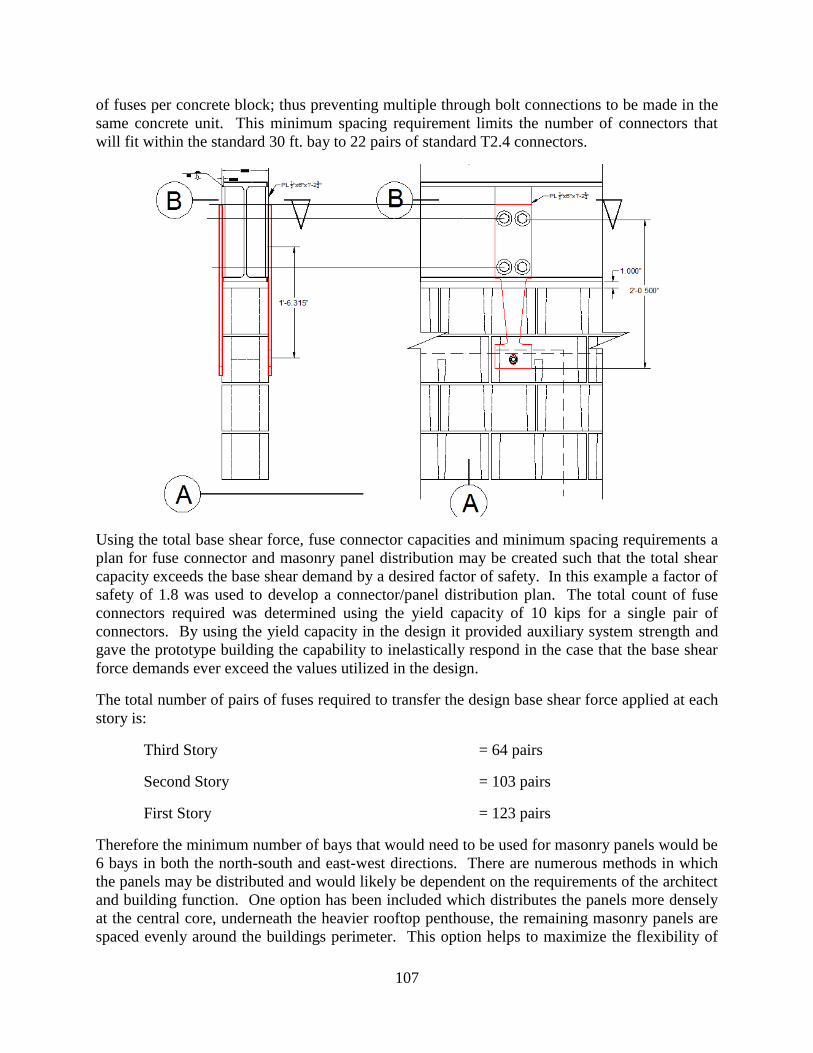
107
of fuses per concrete block; thus preventing multiple through bolt connections to be made in the
same concrete unit. This minimum spacing requirement limits the number of connectors that
will fit within the standard 30 ft. bay to 22 pairs of standard T2.4 connectors.
Using the total base shear force, fuse connector capacities and minimum spacing requirements a
plan for fuse connector and masonry panel distribution may be created such that the total shear
capacity exceeds the base shear demand by a desired factor of safety. In this example a factor of
safety of 1.8 was used to develop a connector/panel distribution plan. The total count of fuse
connectors required was determined using the yield capacity of 10 kips for a single pair of
connectors. By using the yield capacity in the design it provided auxiliary system strength and
gave the prototype building the capability to inelastically respond in the case that the base shear
force demands ever exceed the values utilized in the design.
The total number of pairs of fuses required to transfer the design base shear force applied at each
story is:
Third Story = 64 pairs
Second Story = 103 pairs
First Story = 123 pairs
Therefore the minimum number of bays that would need to be used for masonry panels would be
6 bays in both the north-south and east-west directions. There are numerous methods in which
the panels may be distributed and would likely be dependent on the requirements of the architect
and building function. One option has been included which distributes the panels more densely
at the central core, underneath the heavier rooftop penthouse, the remaining masonry panels are
spaced evenly around the buildings perimeter. This option helps to maximize the flexibility of
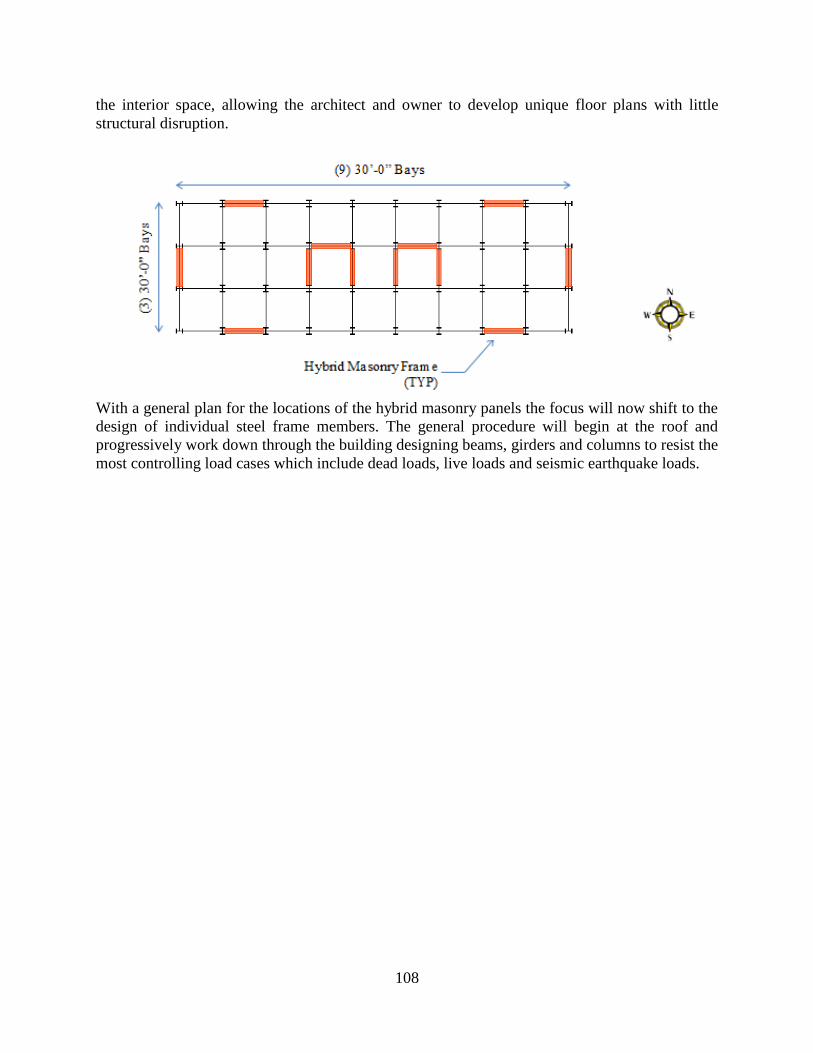
108
the interior space, allowing the architect and owner to develop unique floor plans with little
structural disruption.
With a general plan for the locations of the hybrid masonry panels the focus will now shift to the
design of individual steel frame members. The general procedure will begin at the roof and
progressively work down through the building designing beams, girders and columns to resist the
most controlling load cases which include dead loads, live loads and seismic earthquake loads.
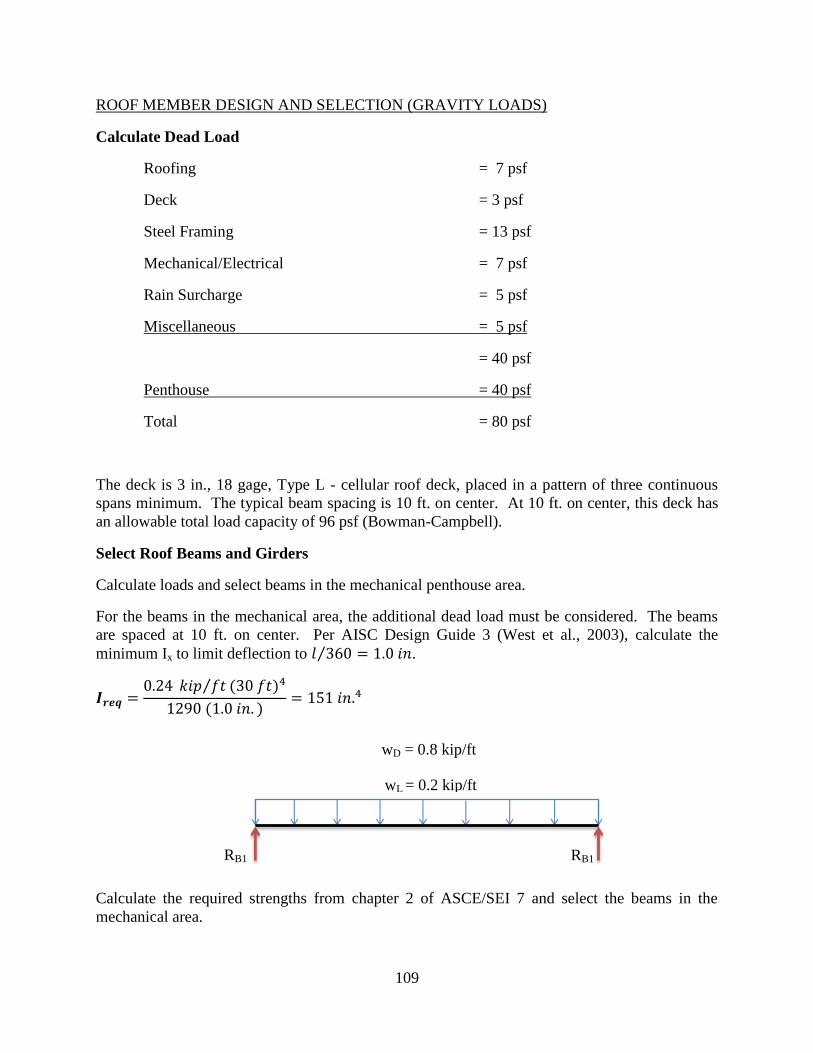
109
ROOF MEMBER DESIGN AND SELECTION (GRAVITY LOADS)
Calculate Dead Load
Roofing = 7 psf
Deck = 3 psf
Steel Framing = 13 psf
Mechanical/Electrical = 7 psf
Rain Surcharge = 5 psf
Miscellaneous = 5 psf
= 40 psf
Penthouse = 40 psf
Total = 80 psf
The deck is 3 in., 18 gage, Type L - cellular roof deck, placed in a pattern of three continuous
spans minimum. The typical beam spacing is 10 ft. on center. At 10 ft. on center, this deck has
an allowable total load capacity of 96 psf (Bowman-Campbell).
Select Roof Beams and Girders
Calculate loads and select beams in the mechanical penthouse area.
For the beams in the mechanical area, the additional dead load must be considered. The beams
are spaced at 10 ft. on center. Per AISC Design Guide 3 (West et al., 2003), calculate the
minimum Ix to limit deflection to ⁄ .
⁄
Calculate the required strengths from chapter 2 of ASCE/SEI 7 and select the beams in the
mechanical area.
wD = 0.8 kip/ft
wL = 0.2 kip/ft
RB1 RB1
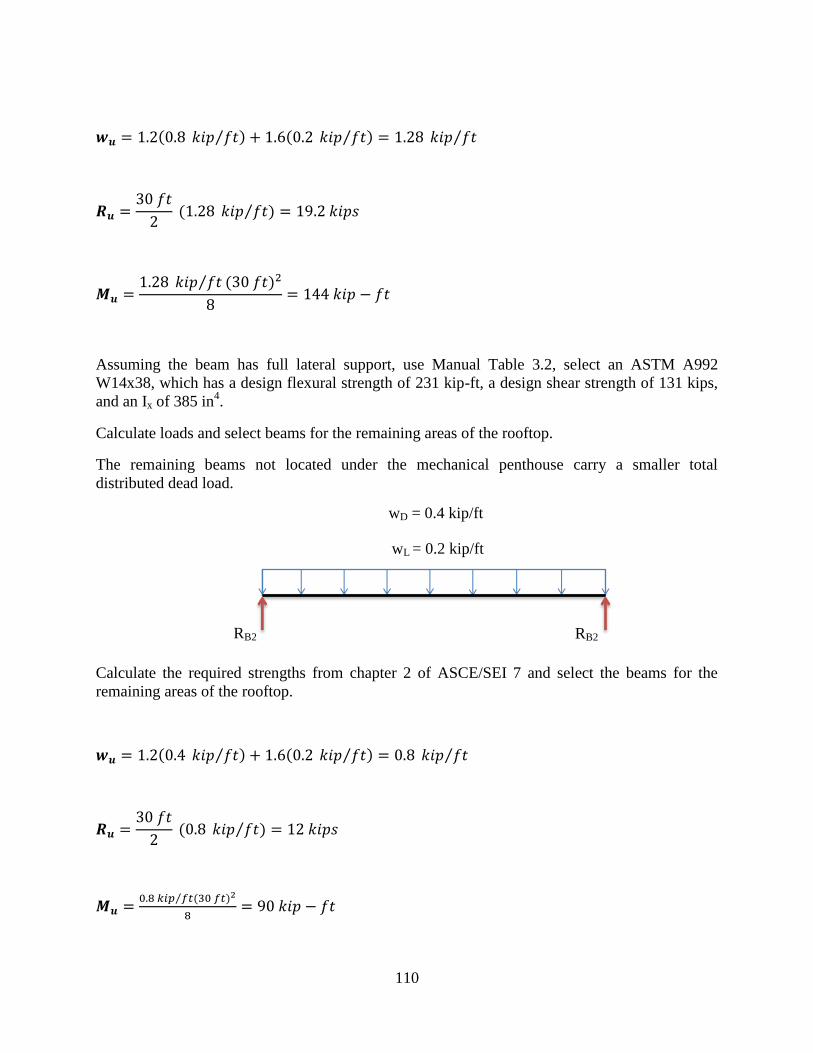
110
⁄ ⁄ ⁄
⁄
⁄
Assuming the beam has full lateral support, use Manual Table 3.2, select an ASTM A992
W14x38, which has a design flexural strength of 231 kip-ft, a design shear strength of 131 kips,
and an Ix of 385 in4.
Calculate loads and select beams for the remaining areas of the rooftop.
The remaining beams not located under the mechanical penthouse carry a smaller total
distributed dead load.
Calculate the required strengths from chapter 2 of ASCE/SEI 7 and select the beams for the
remaining areas of the rooftop.
⁄ ⁄ ⁄
⁄
⁄
wD = 0.4 kip/ft
wL = 0.2 kip/ft
RB2 RB2
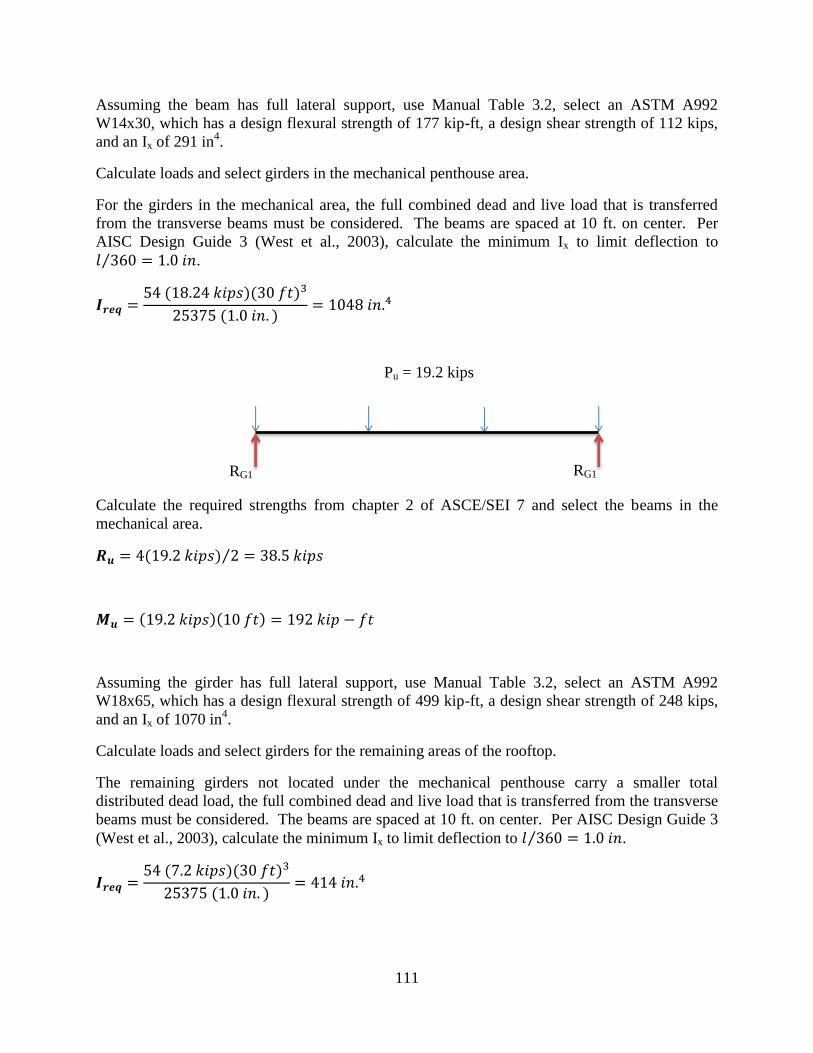
111
Assuming the beam has full lateral support, use Manual Table 3.2, select an ASTM A992
W14x30, which has a design flexural strength of 177 kip-ft, a design shear strength of 112 kips,
and an Ix of 291 in4.
Calculate loads and select girders in the mechanical penthouse area.
For the girders in the mechanical area, the full combined dead and live load that is transferred
from the transverse beams must be considered. The beams are spaced at 10 ft. on center. Per
AISC Design Guide 3 (West et al., 2003), calculate the minimum Ix to limit deflection to
⁄ .
Calculate the required strengths from chapter 2 of ASCE/SEI 7 and select the beams in the
mechanical area.
⁄
Assuming the girder has full lateral support, use Manual Table 3.2, select an ASTM A992
W18x65, which has a design flexural strength of 499 kip-ft, a design shear strength of 248 kips,
and an Ix of 1070 in4.
Calculate loads and select girders for the remaining areas of the rooftop.
The remaining girders not located under the mechanical penthouse carry a smaller total
distributed dead load, the full combined dead and live load that is transferred from the transverse
beams must be considered. The beams are spaced at 10 ft. on center. Per AISC Design Guide 3
(West et al., 2003), calculate the minimum Ix to limit deflection to ⁄ .
Pu = 19.2 kips
RG1 RG1
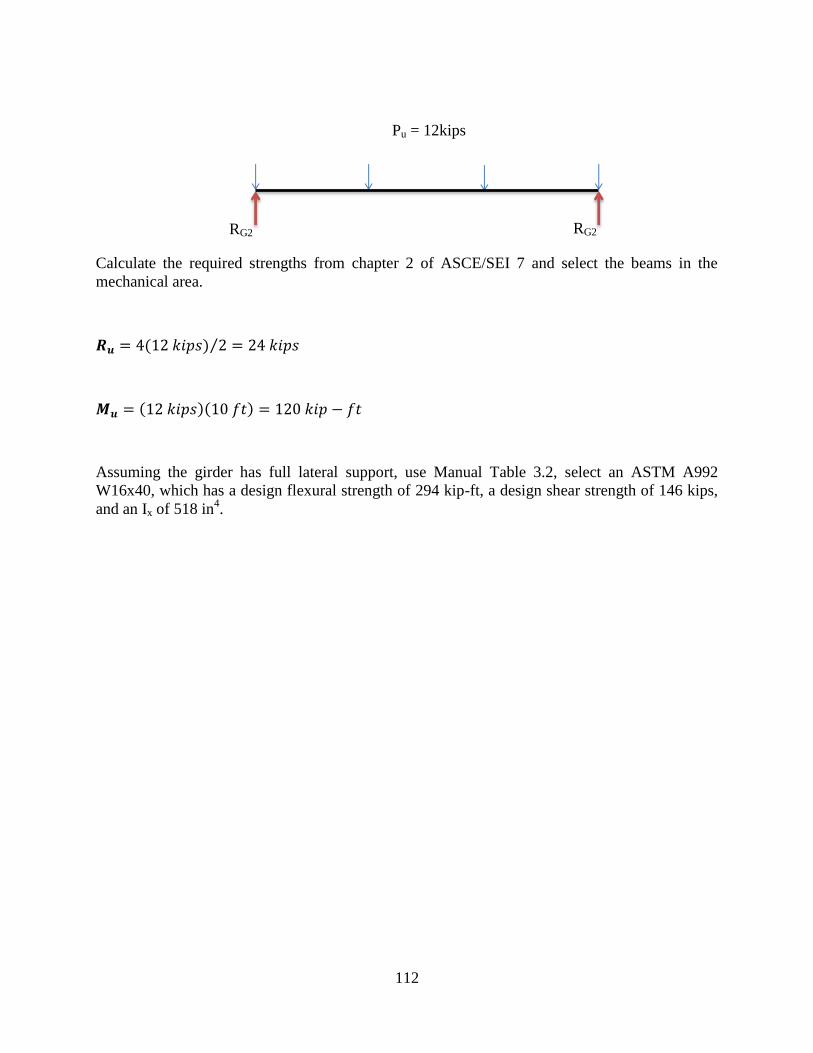
112
Calculate the required strengths from chapter 2 of ASCE/SEI 7 and select the beams in the
mechanical area.
⁄
Assuming the girder has full lateral support, use Manual Table 3.2, select an ASTM A992
W16x40, which has a design flexural strength of 294 kip-ft, a design shear strength of 146 kips,
and an Ix of 518 in4.
Pu = 12kips
RG2 RG2
113
FLOOR MEMBER DESIGN AND SELECTION (GRAVITY LOADS)
Note: There are two early and important checks in the design of composite beams. First, select a
beam that either does not require camber, or establish a target camber and moment of inertia at
the star of the design process. A reasonable approximation of the camber is between ⁄
minimum and ⁄ maximum.
Second, check that the beam is strong enough to safely carry the wet concrete and a 20 psf
construction live load (per ASCE 37-05), when designed by the ASCE/SEI 7 load combinations
and the provisions of Chapter F of the AISC Specification.
Calculate Dead Load
Ceiling/Flooring = 3 psf
Deck = 3 psf
Steel Framing = 13 psf
Mechanical/Electrical = 7 psf
Floor Slab = 53 psf
Miscellaneous = 5 psf
Total = 84 psf
Live Load
Total (can be reduced by area per ASCE/SEI 7) = 50 psf
Select Floor Beams
Find a target moment of inertia for an unshored beam.
Hold deflection to 2 in. maximum to facilitate concrete placement.
The beams are spaced at 10 ft. on center, and the total superimposed service loads shall be
considered.
⁄⁄ ⁄
⁄
114
Determine the required strength to carry wet concrete and construction live load.
⁄
⁄
Determine the required flexural strength due to wet concrete only.
⁄
⁄
Determine the required flexural strength due to wet concrete and construction live load.
⁄⁄
⁄
Use AISC Manual Table 3-2 to select a beam with . Select W18x40 which has Ix =
612 in.4, close to our target value, and has available flexural strengths of 294 kip-ft.
Check for possible live load reduction in accordance with Section 4.7.2 of ASCE/SEI 7.
For interior beams, KLL = 2
The beams are at 10 ft. on center, therefore the area AT = (30 ft.) (10 ft.) = 300 ft2.
Since KLLAT = 2(300 ft2) = 600 ft
2 > 400 ft
2, a reduced live load can be used.
From ASCE/SEI 7, Equation 4.7-1:
(
√ ) (
√ )
Therefore use 44 psf.
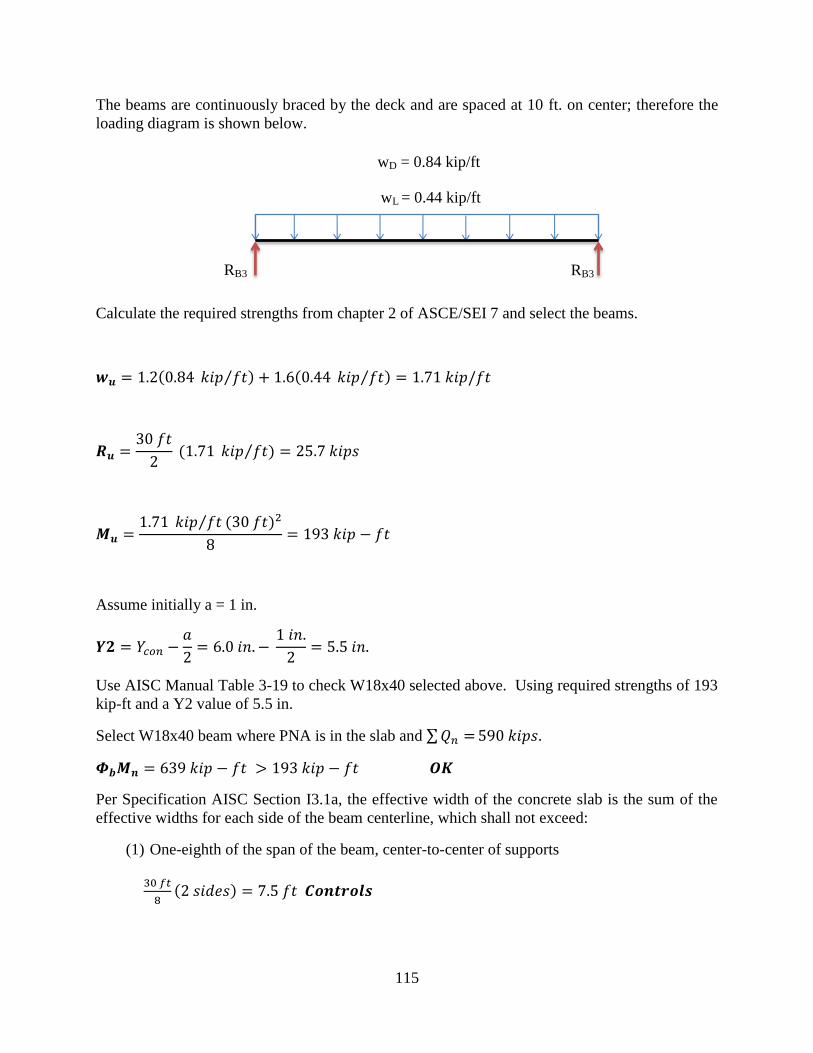
115
The beams are continuously braced by the deck and are spaced at 10 ft. on center; therefore the
loading diagram is shown below.
Calculate the required strengths from chapter 2 of ASCE/SEI 7 and select the beams.
⁄ ⁄
⁄
⁄
Assume initially a = 1 in.
Use AISC Manual Table 3-19 to check W18x40 selected above. Using required strengths of 193
kip-ft and a Y2 value of 5.5 in.
Select W18x40 beam where PNA is in the slab and ∑
Per Specification AISC Section I3.1a, the effective width of the concrete slab is the sum of the
effective widths for each side of the beam centerline, which shall not exceed:
(1) One-eighth of the span of the beam, center-to-center of supports
wD = 0.84 kip/ft
wL = 0.44 kip/ft
RB3 RB3
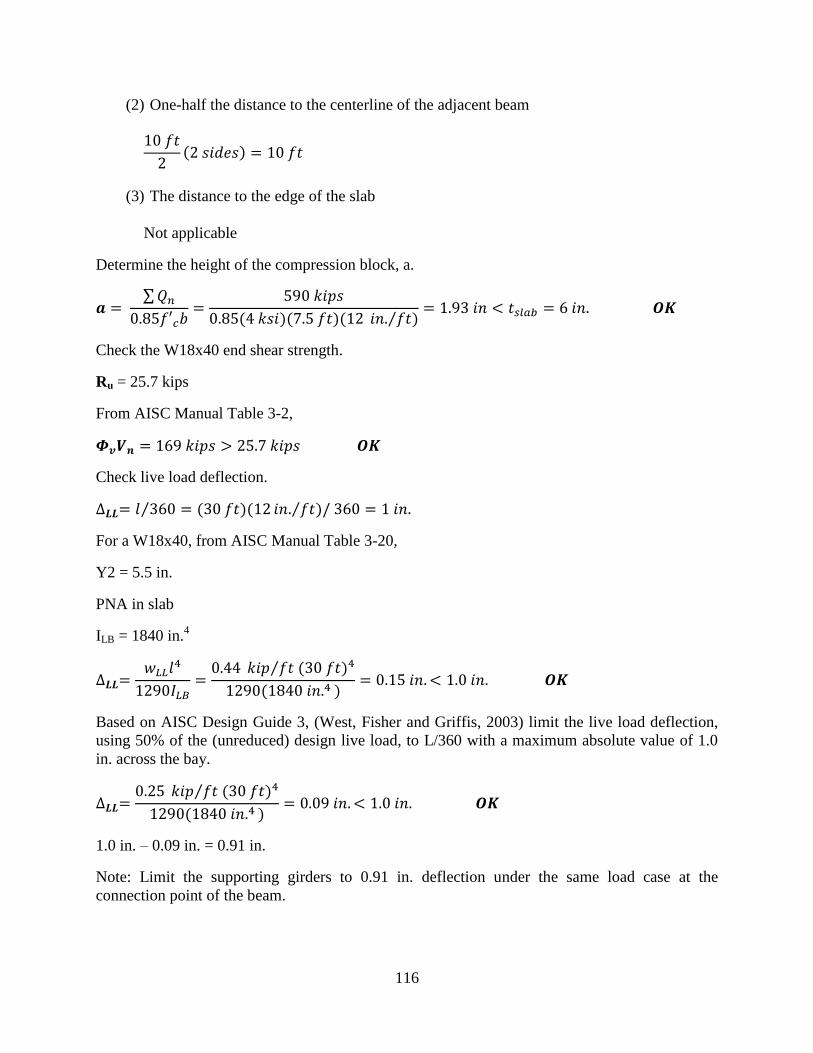
116
(2) One-half the distance to the centerline of the adjacent beam
(3) The distance to the edge of the slab
Not applicable
Determine the height of the compression block, a.
∑
⁄
Check the W18x40 end shear strength.
Ru = 25.7 kips
From AISC Manual Table 3-2,
Check live load deflection.
⁄⁄
For a W18x40, from AISC Manual Table 3-20,
Y2 = 5.5 in.
PNA in slab
ILB = 1840 in.4
⁄
Based on AISC Design Guide 3, (West, Fisher and Griffis, 2003) limit the live load deflection,
using 50% of the (unreduced) design live load, to L/360 with a maximum absolute value of 1.0
in. across the bay.
⁄
1.0 in. – 0.09 in. = 0.91 in.
Note: Limit the supporting girders to 0.91 in. deflection under the same load case at the
connection point of the beam.
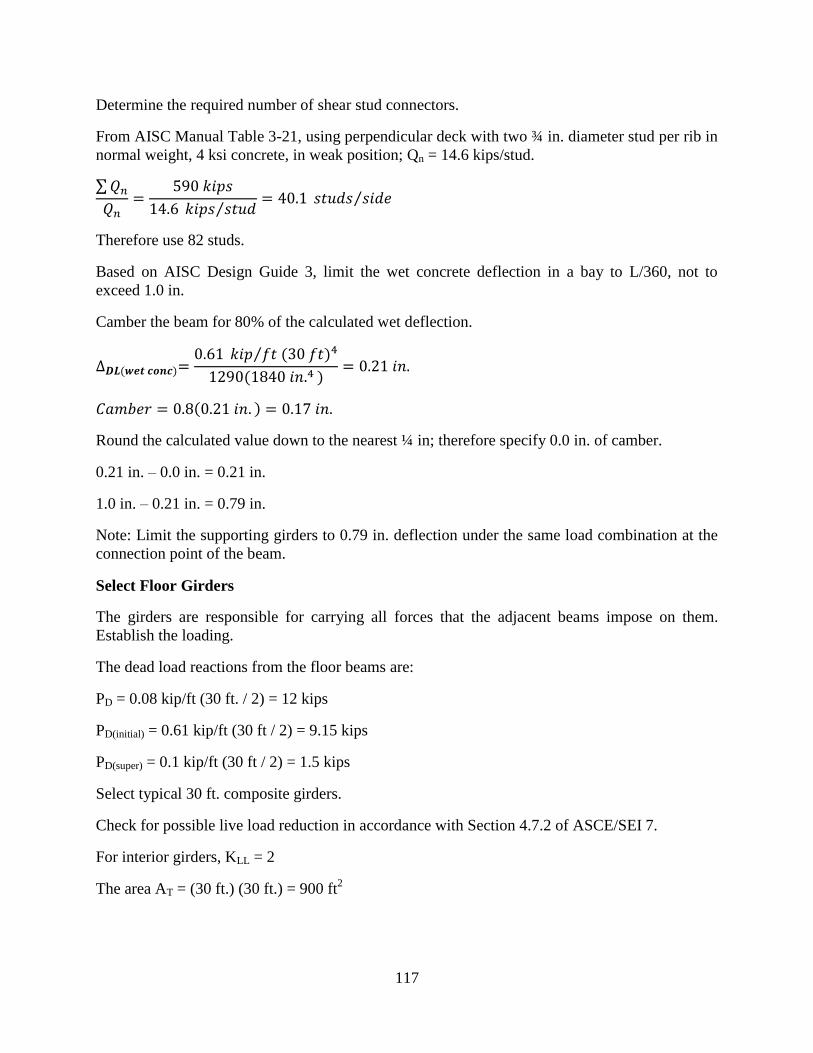
117
Determine the required number of shear stud connectors.
From AISC Manual Table 3-21, using perpendicular deck with two ¾ in. diameter stud per rib in
normal weight, 4 ksi concrete, in weak position; Qn = 14.6 kips/stud.
∑
⁄ ⁄
Therefore use 82 studs.
Based on AISC Design Guide 3, limit the wet concrete deflection in a bay to L/360, not to
exceed 1.0 in.
Camber the beam for 80% of the calculated wet deflection.
⁄
Round the calculated value down to the nearest ¼ in; therefore specify 0.0 in. of camber.
0.21 in. – 0.0 in. = 0.21 in.
1.0 in. – 0.21 in. = 0.79 in.
Note: Limit the supporting girders to 0.79 in. deflection under the same load combination at the
connection point of the beam.
Select Floor Girders
The girders are responsible for carrying all forces that the adjacent beams impose on them.
Establish the loading.
The dead load reactions from the floor beams are:
PD = 0.08 kip/ft (30 ft. / 2) = 12 kips
PD(initial) = 0.61 kip/ft (30 ft / 2) = 9.15 kips
PD(super) = 0.1 kip/ft (30 ft / 2) = 1.5 kips
Select typical 30 ft. composite girders.
Check for possible live load reduction in accordance with Section 4.7.2 of ASCE/SEI 7.
For interior girders, KLL = 2
The area AT = (30 ft.) (30 ft.) = 900 ft2
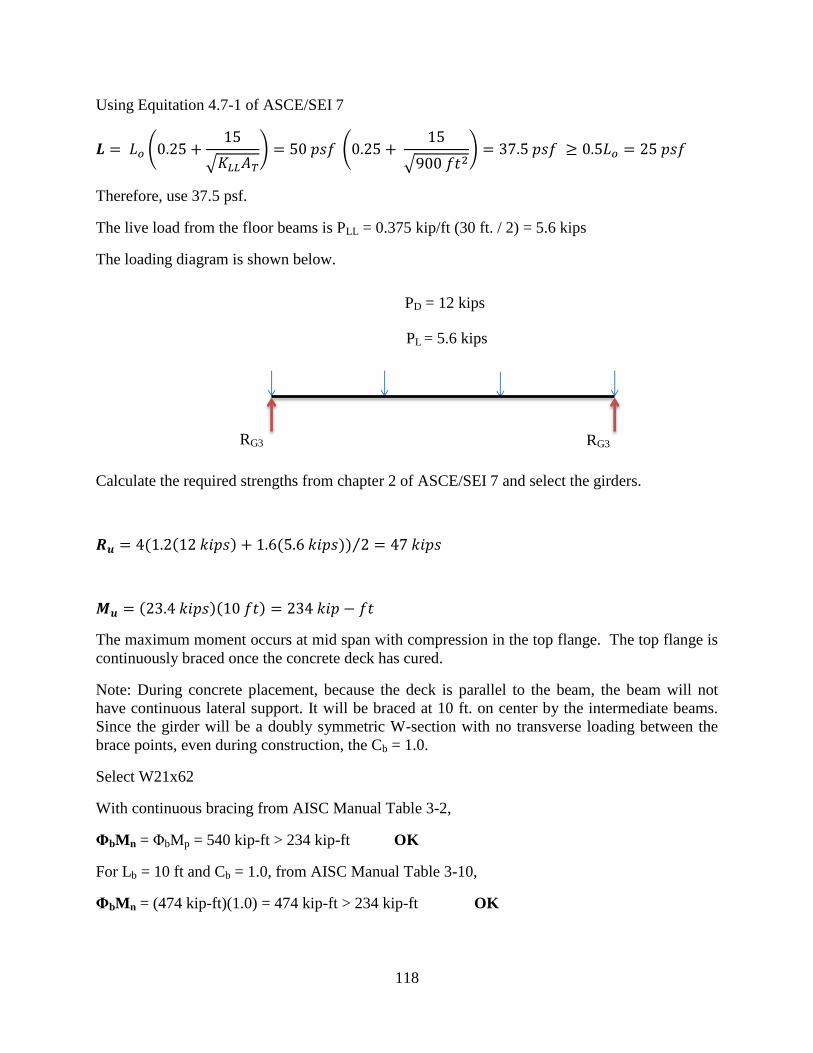
118
Using Equitation 4.7-1 of ASCE/SEI 7
(
√ ) (
√ )
Therefore, use 37.5 psf.
The live load from the floor beams is PLL = 0.375 kip/ft (30 ft. / 2) = 5.6 kips
The loading diagram is shown below.
Calculate the required strengths from chapter 2 of ASCE/SEI 7 and select the girders.
⁄
The maximum moment occurs at mid span with compression in the top flange. The top flange is
continuously braced once the concrete deck has cured.
Note: During concrete placement, because the deck is parallel to the beam, the beam will not
have continuous lateral support. It will be braced at 10 ft. on center by the intermediate beams.
Since the girder will be a doubly symmetric W-section with no transverse loading between the
brace points, even during construction, the Cb = 1.0.
Select W21x62
With continuous bracing from AISC Manual Table 3-2,
ΦbMn = ΦbMp = 540 kip-ft > 234 kip-ft OK
For Lb = 10 ft and Cb = 1.0, from AISC Manual Table 3-10,
ΦbMn = (474 kip-ft)(1.0) = 474 kip-ft > 234 kip-ft OK
PD = 12 kips
PL = 5.6 kips
RG3 RG3
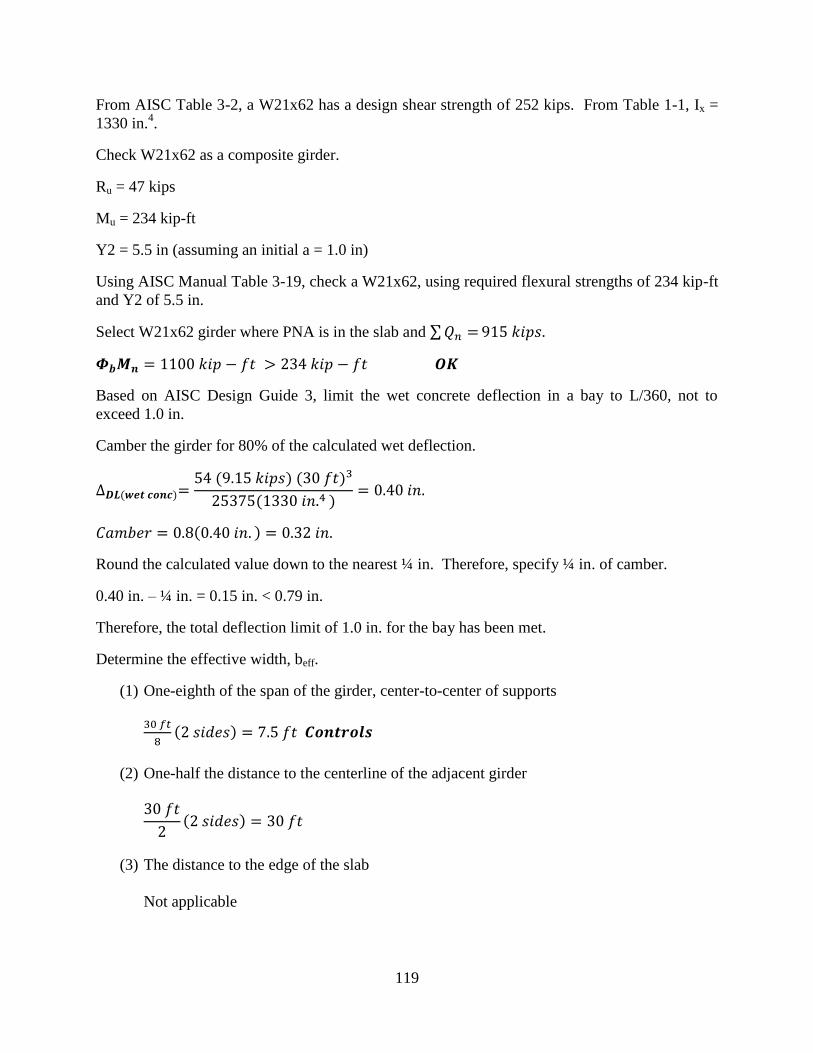
119
From AISC Table 3-2, a W21x62 has a design shear strength of 252 kips. From Table 1-1, Ix =
1330 in.4.
Check W21x62 as a composite girder.
Ru = 47 kips
Mu = 234 kip-ft
Y2 = 5.5 in (assuming an initial a = 1.0 in)
Using AISC Manual Table 3-19, check a W21x62, using required flexural strengths of 234 kip-ft
and Y2 of 5.5 in.
Select W21x62 girder where PNA is in the slab and ∑
Based on AISC Design Guide 3, limit the wet concrete deflection in a bay to L/360, not to
exceed 1.0 in.
Camber the girder for 80% of the calculated wet deflection.
Round the calculated value down to the nearest ¼ in. Therefore, specify ¼ in. of camber.
0.40 in. – ¼ in. = 0.15 in. < 0.79 in.
Therefore, the total deflection limit of 1.0 in. for the bay has been met.
Determine the effective width, beff.
(1) One-eighth of the span of the girder, center-to-center of supports
(2) One-half the distance to the centerline of the adjacent girder
(3) The distance to the edge of the slab
Not applicable
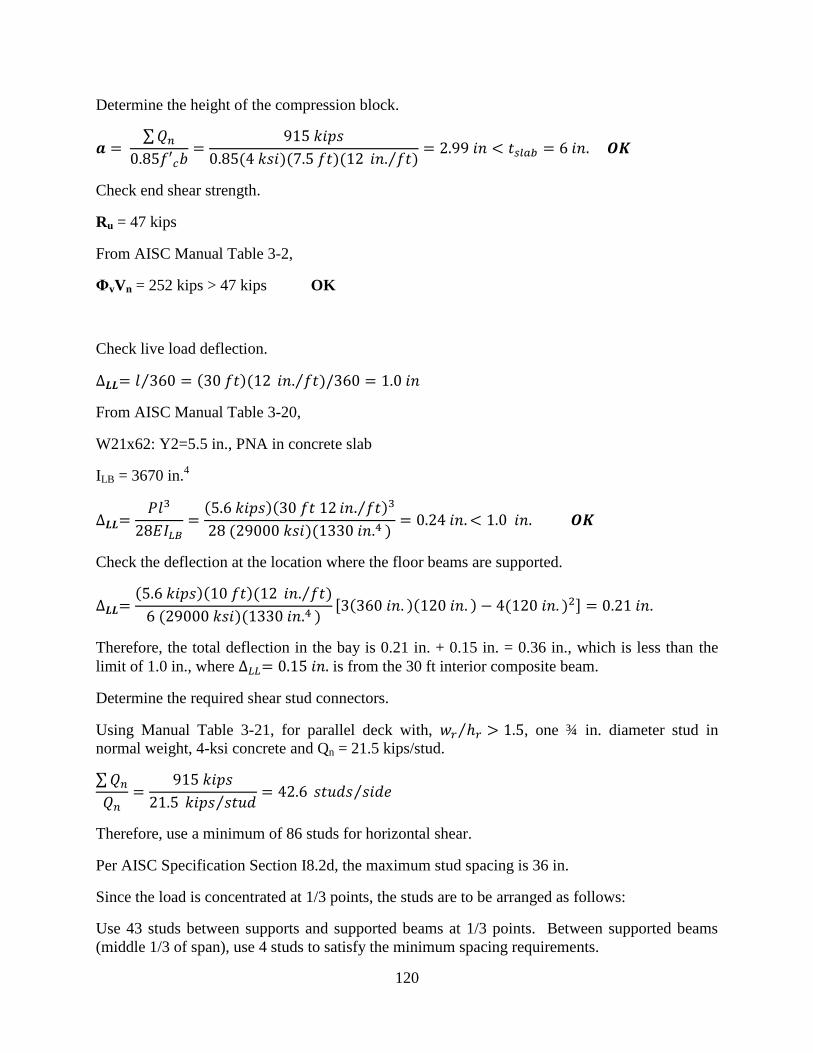
120
Determine the height of the compression block.
∑
⁄
Check end shear strength.
Ru = 47 kips
From AISC Manual Table 3-2,
ΦvVn = 252 kips > 47 kips OK
Check live load deflection.
⁄⁄
From AISC Manual Table 3-20,
W21x62: Y2=5.5 in., PNA in concrete slab
ILB = 3670 in.4
⁄
Check the deflection at the location where the floor beams are supported.
⁄
[ ]
Therefore, the total deflection in the bay is 0.21 in. + 0.15 in. = 0.36 in., which is less than the
limit of 1.0 in., where is from the 30 ft interior composite beam.
Determine the required shear stud connectors.
Using Manual Table 3-21, for parallel deck with, ⁄ , one ¾ in. diameter stud in
normal weight, 4-ksi concrete and Qn = 21.5 kips/stud.
∑
⁄ ⁄
Therefore, use a minimum of 86 studs for horizontal shear.
Per AISC Specification Section I8.2d, the maximum stud spacing is 36 in.
Since the load is concentrated at 1/3 points, the studs are to be arranged as follows:
Use 43 studs between supports and supported beams at 1/3 points. Between supported beams
(middle 1/3 of span), use 4 studs to satisfy the minimum spacing requirements.

121
Thus, 90 studs are required in a 43:4:43 arrangement.
Notes: Although the studs may be placed up to 3’-0” on center the steel deck must still be
anchored to be supporting member at a spacing not to exceed 18 in. in accordance with AISC
Specification Section I3.2c.
This W21x62 girder, with full lateral support, is very close to having sufficient available strength
to support the imposed loads without composite action. A larger noncomposite girder might be a
better solution.
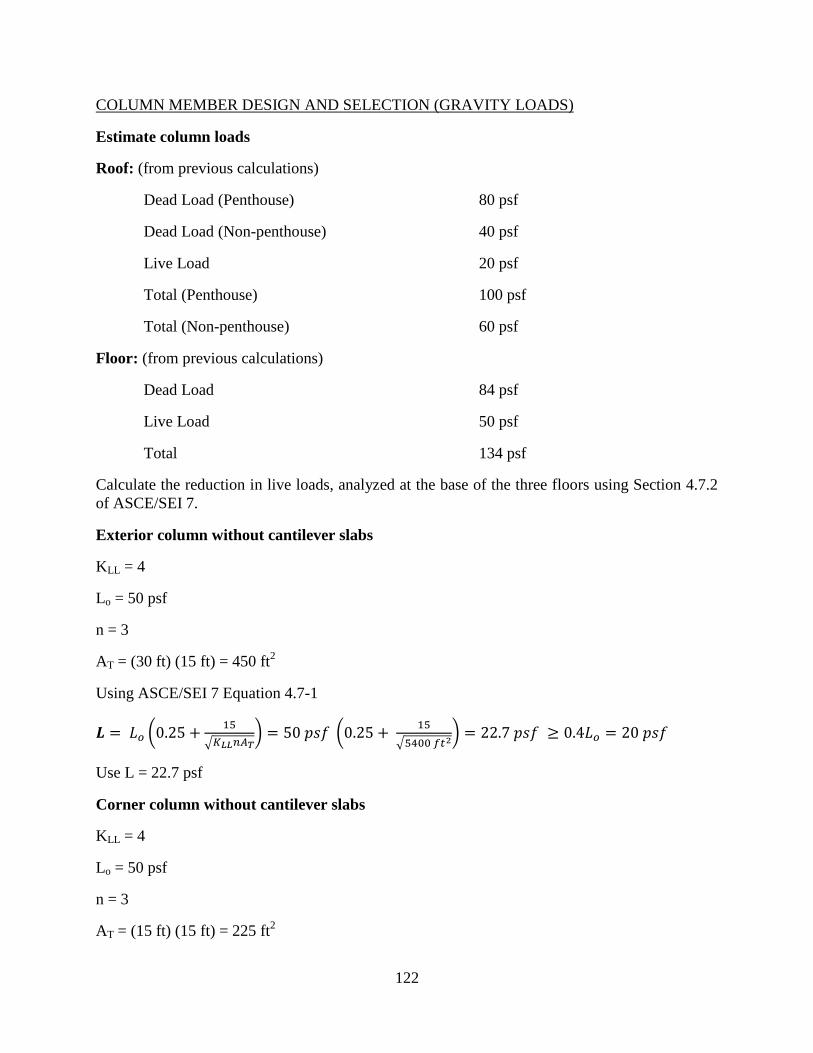
122
COLUMN MEMBER DESIGN AND SELECTION (GRAVITY LOADS)
Estimate column loads
Roof: (from previous calculations)
Dead Load (Penthouse) 80 psf
Dead Load (Non-penthouse) 40 psf
Live Load 20 psf
Total (Penthouse) 100 psf
Total (Non-penthouse) 60 psf
Floor: (from previous calculations)
Dead Load 84 psf
Live Load 50 psf
Total 134 psf
Calculate the reduction in live loads, analyzed at the base of the three floors using Section 4.7.2
of ASCE/SEI 7.
Exterior column without cantilever slabs
KLL = 4
Lo = 50 psf
n = 3
AT = (30 ft) (15 ft) = 450 ft2
Using ASCE/SEI 7 Equation 4.7-1
(
√ ) (
√ )
Use L = 22.7 psf
Corner column without cantilever slabs
KLL = 4
Lo = 50 psf
n = 3
AT = (15 ft) (15 ft) = 225 ft2

123
(
√ ) (
√ )
Use L = 26.9 psf
Interior column
KLL = 4
Lo = 50 psf
n = 3
AT = (30 ft) (30 ft) = 900 ft2
(
√ ) (
√ )
Use L = 20 psf
Column load summary:
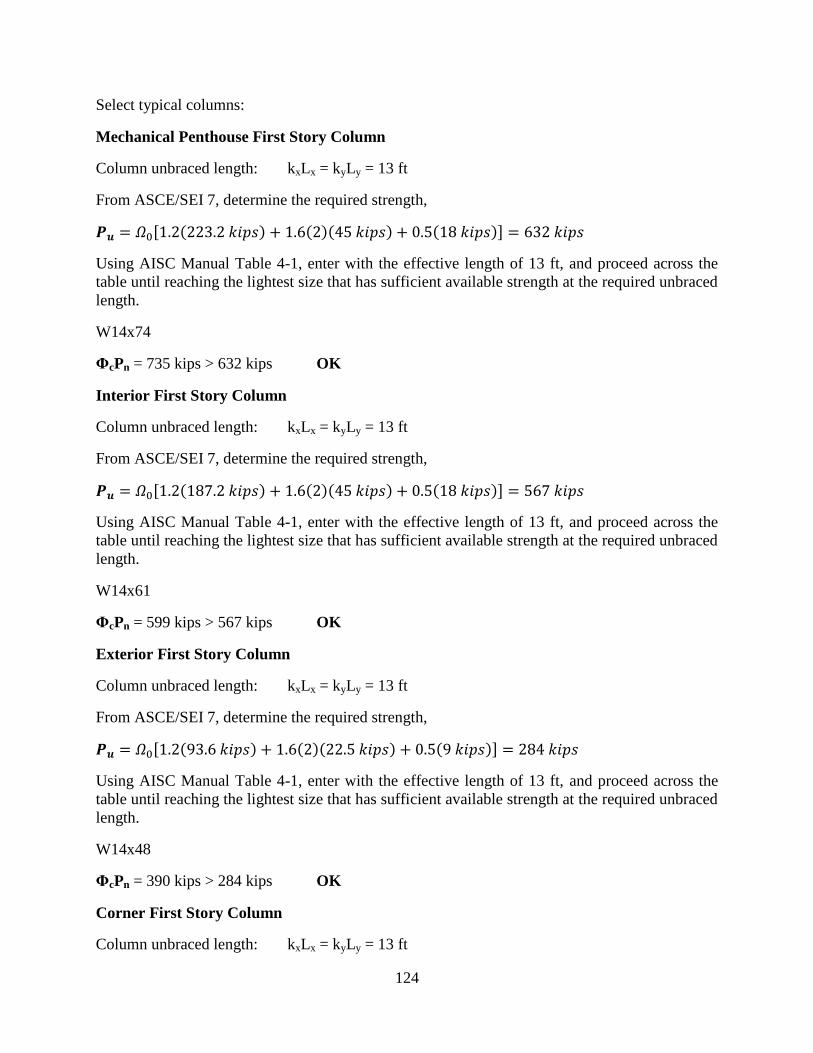
124
Select typical columns:
Mechanical Penthouse First Story Column
Column unbraced length: kxLx = kyLy = 13 ft
From ASCE/SEI 7, determine the required strength,
[ ]
Using AISC Manual Table 4-1, enter with the effective length of 13 ft, and proceed across the
table until reaching the lightest size that has sufficient available strength at the required unbraced
length.
W14x74
ΦcPn = 735 kips > 632 kips OK
Interior First Story Column
Column unbraced length: kxLx = kyLy = 13 ft
From ASCE/SEI 7, determine the required strength,
[ ]
Using AISC Manual Table 4-1, enter with the effective length of 13 ft, and proceed across the
table until reaching the lightest size that has sufficient available strength at the required unbraced
length.
W14x61
ΦcPn = 599 kips > 567 kips OK
Exterior First Story Column
Column unbraced length: kxLx = kyLy = 13 ft
From ASCE/SEI 7, determine the required strength,
[ ]
Using AISC Manual Table 4-1, enter with the effective length of 13 ft, and proceed across the
table until reaching the lightest size that has sufficient available strength at the required unbraced
length.
W14x48
ΦcPn = 390 kips > 284 kips OK
Corner First Story Column
Column unbraced length: kxLx = kyLy = 13 ft
125
From ASCE/SEI 7, determine the required strength,
[ ]
Using AISC Manual Table 4-1, enter with the effective length of 13 ft, and proceed across the
table until reaching the lightest size that has sufficient available strength at the required unbraced
length.
W14x48
ΦcPn = 390 kips > 142 kips OK
126
STABILITY (P-Δ) ANALYSIS
Direct Analysis Method:
Design for stability by the direct analysis method is found in Chapter C of the AISC
Specification. This method requires that both the flexural and axial stiffness are reduced and that
0.2% notional lateral loads are applied in the analysis to account for geometric imperfections and
inelasticity. Any general second-order analysis method that considers both P-δ and P-Δ effects is
permitted. The amplified first-order analysis method of AISC Specification Appendix 8 is also
permitted provided that the B1 and B2 factors are based on the reduced flexural and axial
stiffnesses. A summary of the axial loads, moments and 1st floor drifts from first-order analysis
is shown below. Second-order member forces are determined using the amplified first-order
procedure of AISC Specification Appendix 8.
It was assumed, subject to verification that B2 is less than 1.7 for each load combination;
therefore, per AISC Specification Section C2.2b (4), the notional loads were applied to the
gravity-only load combinations. The required seismic load combinations are given in ASCE/SEI
7, Section 12.4.2.3.
Controls for columns, beams and girders.
From a first-order analysis with notional loads where appropriate reduced stiffnesses:
For interior column design:
Pu = 340 kips
M1u = 160 kip-ft (from first-order analysis)
M2u = 275 kip-ft (from first order analysis)
First story drift with reduced stiffnesses = 0.92 in.
The required second-order flexural strength, Mr, and axial strength, Pr, are determined as follows.
For typical interior columns, the gravity-load moments are approximately balanced, therefore,
Mnt = 0.0 kip-ft.
Calculate the amplified forces and moments in accordance with AISC Specification Appendix 8.
Determine B1
Pr = required second-order axial strength using LRFD load combinations, kips.
Note that for members subject to axial compression, B1 may be calculated based on the first-
order estimate Pr = Pnt + Plt.
Therefore, Pr = 340 kips (from the first-order computer analysis)
Ix = 881 in.4 (W14x82)
127
τb = 1.0
[ ]⁄
⁄ ⁄
α = 1.0
Determine B2
where
α = 1.0
Pstory = 4550 kips (from computer output)
Pe story may be taken as:
where
Pmf = 0 kips (gravity load in moment frame)
⁄
Because B2 < 1.7, it is verified that it was unnecessary to add the notional loads to the lateral
loads for this load combination.
Calculate the amplified moment
128
From AISC Specification Equation A-8-1,
Calculate amplified axial load
Pnt = 340 kips (from computer analysis)
For a long frame, such as this one, the change in load in the interior columns associated with
lateral load is negligible.
The flexural and axial stiffness of all members in the frame were reduced using 0.8E in the
computer analysis.
Check that the flexural stiffness was adequately reduced for the analysis per AISC Specification
Section C2.3(2).
α = 1.0
Pr = 340 kips
Therefore,
Note: By inspection τb = 1.0 for all of the beams in the hybrid masonry frame.
For the direct analysis method, K = 1.0.
From AISC Manual Table 4-1
From AISC Manual Table 302
Because
Interaction equation H1-1a
129
(
)
(
)
This process was then repeated for each of the steel frame members to ensure that the second-
order effects would not reduce overall system stability.
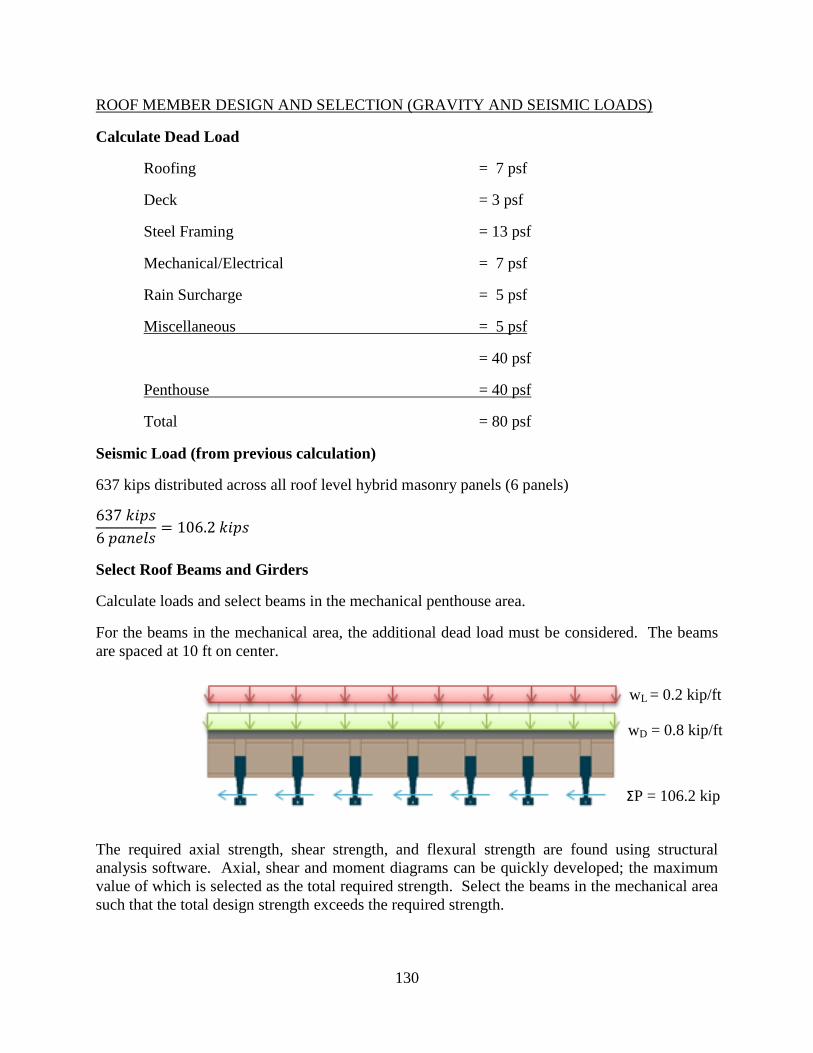
130
ROOF MEMBER DESIGN AND SELECTION (GRAVITY AND SEISMIC LOADS)
Calculate Dead Load
Roofing = 7 psf
Deck = 3 psf
Steel Framing = 13 psf
Mechanical/Electrical = 7 psf
Rain Surcharge = 5 psf
Miscellaneous = 5 psf
= 40 psf
Penthouse = 40 psf
Total = 80 psf
Seismic Load (from previous calculation)
637 kips distributed across all roof level hybrid masonry panels (6 panels)
Select Roof Beams and Girders
Calculate loads and select beams in the mechanical penthouse area.
For the beams in the mechanical area, the additional dead load must be considered. The beams
are spaced at 10 ft on center.
The required axial strength, shear strength, and flexural strength are found using structural
analysis software. Axial, shear and moment diagrams can be quickly developed; the maximum
value of which is selected as the total required strength. Select the beams in the mechanical area
such that the total design strength exceeds the required strength.
wL = 0.2 kip/ft
wD = 0.8 kip/ft
ΣP = 106.2 kip
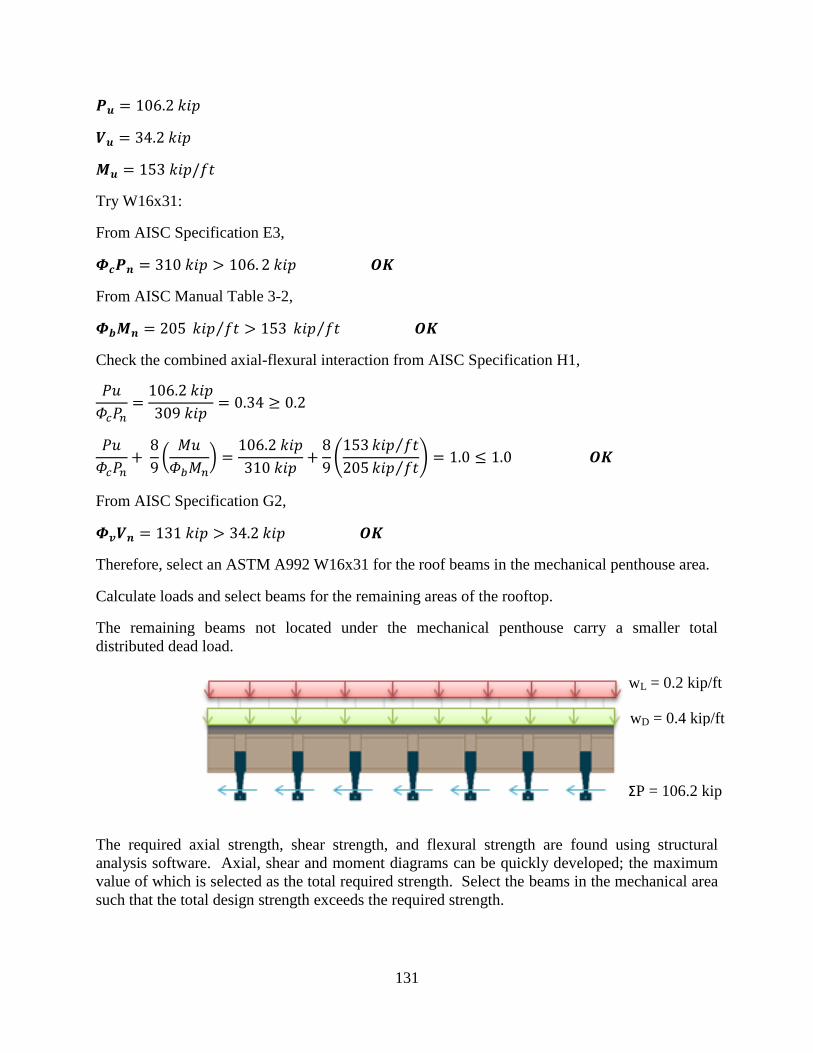
131
Try W16x31:
From AISC Specification E3,
From AISC Manual Table 3-2,
⁄ ⁄
Check the combined axial-flexural interaction from AISC Specification H1,
(
)
( ⁄
⁄)
From AISC Specification G2,
Therefore, select an ASTM A992 W16x31 for the roof beams in the mechanical penthouse area.
Calculate loads and select beams for the remaining areas of the rooftop.
The remaining beams not located under the mechanical penthouse carry a smaller total
distributed dead load.
The required axial strength, shear strength, and flexural strength are found using structural
analysis software. Axial, shear and moment diagrams can be quickly developed; the maximum
value of which is selected as the total required strength. Select the beams in the mechanical area
such that the total design strength exceeds the required strength.
wL = 0.2 kip/ft
wD = 0.4 kip/ft
ΣP = 106.2 kip
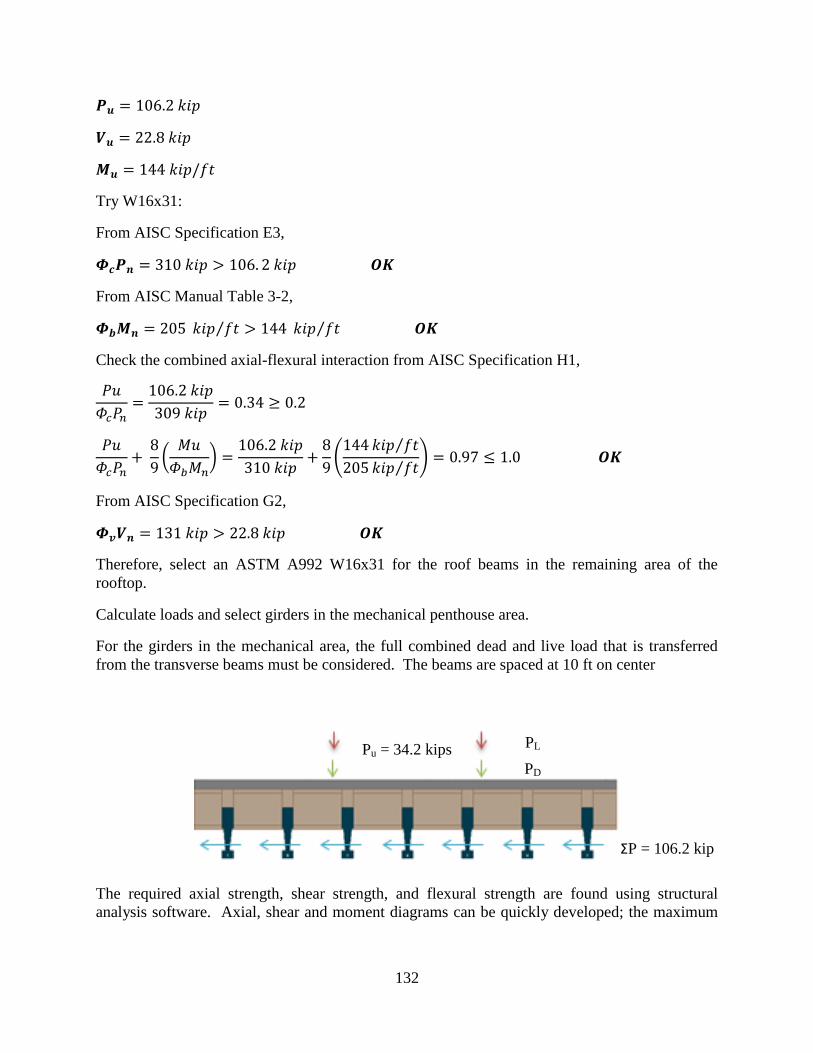
132
Try W16x31:
From AISC Specification E3,
From AISC Manual Table 3-2,
⁄ ⁄
Check the combined axial-flexural interaction from AISC Specification H1,
(
)
( ⁄
⁄)
From AISC Specification G2,
Therefore, select an ASTM A992 W16x31 for the roof beams in the remaining area of the
rooftop.
Calculate loads and select girders in the mechanical penthouse area.
For the girders in the mechanical area, the full combined dead and live load that is transferred
from the transverse beams must be considered. The beams are spaced at 10 ft on center
The required axial strength, shear strength, and flexural strength are found using structural
analysis software. Axial, shear and moment diagrams can be quickly developed; the maximum
Pu = 34.2 kips
PL
PD
ΣP = 106.2 kip
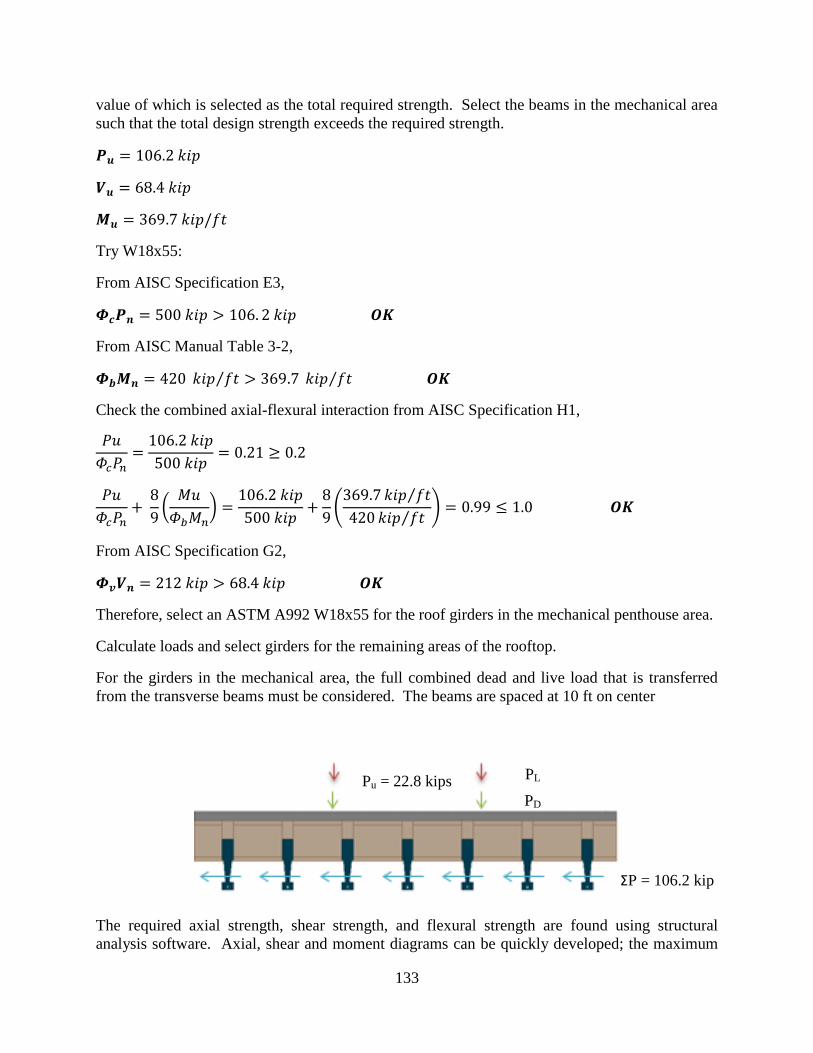
133
value of which is selected as the total required strength. Select the beams in the mechanical area
such that the total design strength exceeds the required strength.
Try W18x55:
From AISC Specification E3,
From AISC Manual Table 3-2,
⁄ ⁄
Check the combined axial-flexural interaction from AISC Specification H1,
(
)
( ⁄
⁄)
From AISC Specification G2,
Therefore, select an ASTM A992 W18x55 for the roof girders in the mechanical penthouse area.
Calculate loads and select girders for the remaining areas of the rooftop.
For the girders in the mechanical area, the full combined dead and live load that is transferred
from the transverse beams must be considered. The beams are spaced at 10 ft on center
The required axial strength, shear strength, and flexural strength are found using structural
analysis software. Axial, shear and moment diagrams can be quickly developed; the maximum
Pu = 22.8 kips
PL
PD
ΣP = 106.2 kip
134
value of which is selected as the total required strength. Select the beams in the mechanical area
such that the total design strength exceeds the required strength.
Try W18x55:
From AISC Specification E3,
From AISC Manual Table 3-2,
⁄ ⁄
Check the combined axial-flexural interaction from AISC Specification H1,
(
)
( ⁄
⁄)
From AISC Specification G2,
Therefore, select an ASTM A992 W18x55 for the roof girders in the remaining area of the
rooftop.
135
FLOOR MEMBER DESIGN AND SELECTION (GRAVITY AND SEISMIC LOADS)
Note: There are two early and important checks in the design of composite beams. First, select a
beam that either does not require camber, or establish a target camber and moment of inertia at
the star of the design process. A reasonable approximation of the camber is between ⁄
minimum and ⁄ maximum.
Second, check that the beam is strong enough to safely carry the wet concrete and a 20 psf
construction live load (per ASCE 37-05), when designed by the ASCE/SEI 7 load combinations
and the provisions of Chapter F of the AISC Specification.
Calculate Dead Load
Ceiling/Flooring = 3 psf
Deck = 3 psf
Steel Framing = 13 psf
Mechanical/Electrical = 7 psf
Floor Slab = 53 psf
Miscellaneous = 5 psf
Total = 84 psf
Live Load
Total (can be reduced by area per ASCE/SEI 7) = 50 psf
Seismic Load (from previous calculation)
1029 kips distributed across all level 3 hybrid masonry panels (6 panels)
1225 kips distributed across all level 2 hybrid masonry panels (6 panels)
Select Floor Beams
Find a target moment of inertia for an unshored beam.
Hold deflection to 2 in. maximum to facilitate concrete placement.
The beams are spaced at 10 ft on center, and the total superimposed service loads shall be
considered.
136
⁄⁄
⁄
Determine the required strength to carry wet concrete and construction live load.
⁄
⁄
Determine the required flexural strength due to wet concrete only.
⁄
⁄
Determine the required flexural strength due to wet concrete and construction live load.
⁄⁄
⁄
Use AISC Manual Table 3-2 to select a beam with Select W21x62 which has Ix =
1330 in.4, close to our target value, and has available flexural strengths of 294 kip-ft.
Check for possible live load reduction due to are in accordance with Section 4.7.2 of ASCE/SEI
7.
For interior beams, KLL = 2
The beams are at 10 ft on center, therefore the area AT = (30 ft) (10 ft) = 300 ft2.
Since KLLAT = 2(300 ft2) = 600 ft
2 > 400 ft
2, a reduced live load can be used.
From ASCE/SEI 7, Equation 4.7-1:
(
√ ) (
√ )
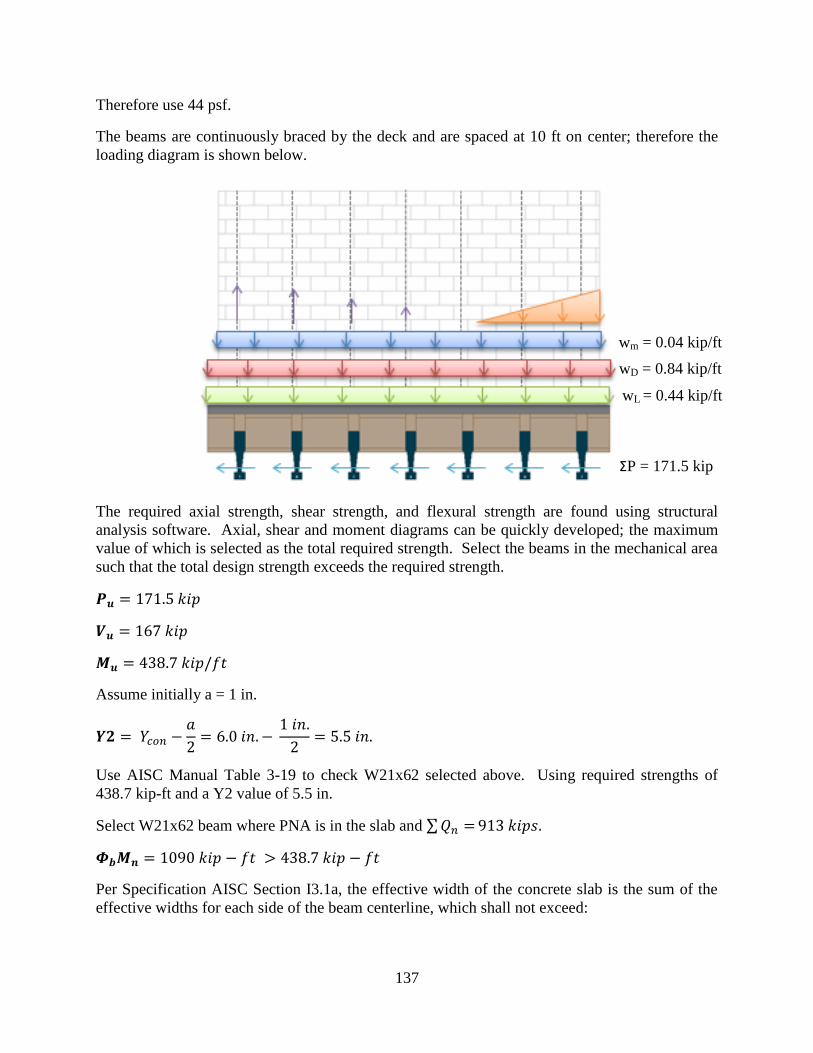
137
Therefore use 44 psf.
The beams are continuously braced by the deck and are spaced at 10 ft on center; therefore the
loading diagram is shown below.
The required axial strength, shear strength, and flexural strength are found using structural
analysis software. Axial, shear and moment diagrams can be quickly developed; the maximum
value of which is selected as the total required strength. Select the beams in the mechanical area
such that the total design strength exceeds the required strength.
Assume initially a = 1 in.
Use AISC Manual Table 3-19 to check W21x62 selected above. Using required strengths of
438.7 kip-ft and a Y2 value of 5.5 in.
Select W21x62 beam where PNA is in the slab and ∑
Per Specification AISC Section I3.1a, the effective width of the concrete slab is the sum of the
effective widths for each side of the beam centerline, which shall not exceed:
wm = 0.04 kip/ft
wD = 0.84 kip/ft
wL = 0.44 kip/ft
ΣP = 171.5 kip
138
(1) One-eighth of the span of the beam, center-to-center of supports
(2) One-half the distance to the centerline of the adjacent beam
(3) The distance to the edge of the slab
Not applicable
Determine the height of the compression block, a.
∑
⁄
Check the W21x62 end shear strength.
Vu = 167 kips
From AISC Manual Table 3-2,
Check live load deflection.
⁄⁄
For a W21x62, from AISC Manual Table 3-20,
Y2 = 5.5 in.
PNA in slab
ILB = 3670 in.4
⁄
Based on AISC Design Guide 3, (West, Fisher and Griffis, 2003) limit the live load deflection,
using 50% of the (unreduced) design live load, to L/360 with a maximum absolute value of 1.0
in. across the bay.
⁄
2.0 in. – 0.04 in. = 0.96 in.
139
Note: Limit the supporting girders to 0.96 in. deflection under the same load case at the
connection point of the beam.
Determine the required number of shear stud connectors.
From AISC Manual Table 3-21, using perpendicular deck with two ¾ in. diameter stud per rib in
normal weight, 4 ksi concrete, in weak position; Qn = 14.6 kips/stud.
∑
⁄ ⁄
Therefore use 128 studs.
Based on AISC Design Guide 3, limit the wet concrete deflection in a bay to L/360, not to
exceed 1.0 in.
Camber the beam for 80% of the calculated wet deflection.
⁄
Round the calculated value down to the nearest ¼ in; therefore specify 0.0 in. of camber.
0.10 in. – 0.0 in. = 0.10 in.
1.0 in. – 0.10 in. = 0.90 in.
Note: Limit the supporting girders to 0.90 in. deflection under the same load combination at the
connection point of the beam.
Note: The same beam works for level 2 as well, so select W21x62 for the level 3 and level 2
beams that support hybrid masonry.
Select Floor Girders
The girders are responsible for carrying all forces that the adjacent beams impose on them.
Establish the loading.
The dead load reactions from the floor beams are:
PD = 0.08 kip/ft (30 ft / 2) = 12 kips
PD(initial) = 0.61 kip/ft (30 ft / 2) = 9.15 kips
PD(super) = 0.1 kip/ft (30 ft / 2) = 1.5 kips
Select typical 30 ft composite girders.
Check for possible live load reduction in accordance with Section 4.7.2 of ASCE/SEI 7.
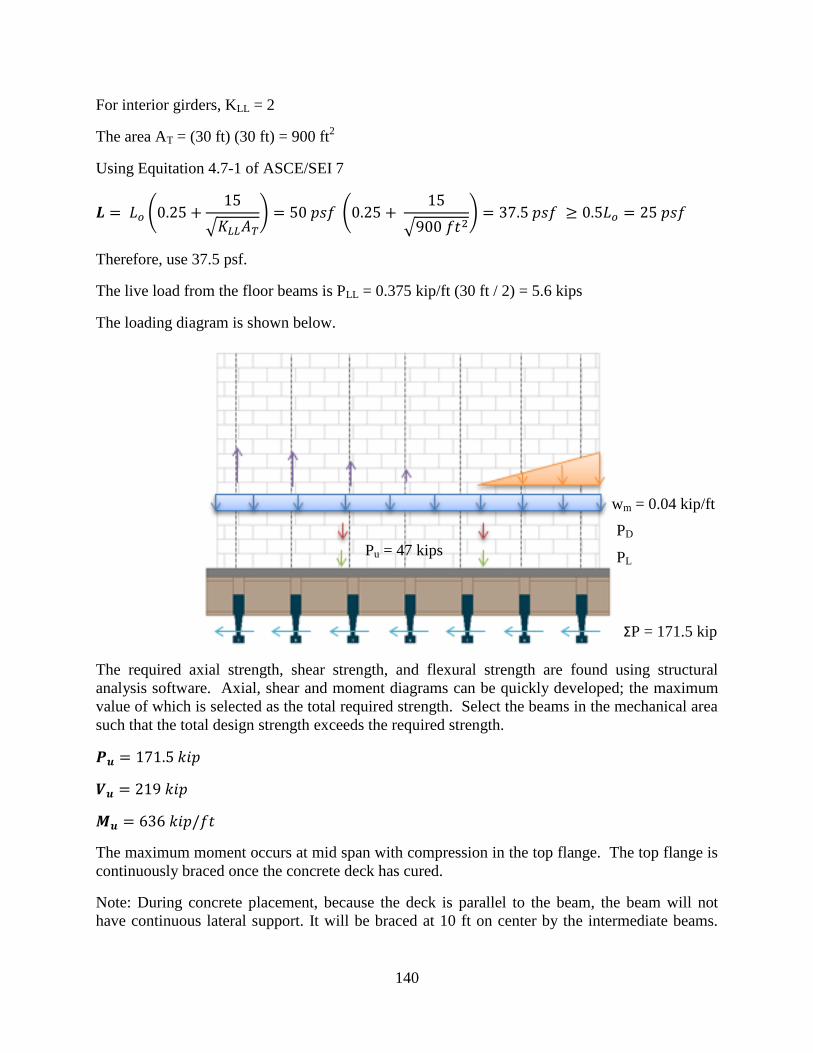
140
For interior girders, KLL = 2
The area AT = (30 ft) (30 ft) = 900 ft2
Using Equitation 4.7-1 of ASCE/SEI 7
(
√ ) (
√ )
Therefore, use 37.5 psf.
The live load from the floor beams is PLL = 0.375 kip/ft (30 ft / 2) = 5.6 kips
The loading diagram is shown below.
The required axial strength, shear strength, and flexural strength are found using structural
analysis software. Axial, shear and moment diagrams can be quickly developed; the maximum
value of which is selected as the total required strength. Select the beams in the mechanical area
such that the total design strength exceeds the required strength.
The maximum moment occurs at mid span with compression in the top flange. The top flange is
continuously braced once the concrete deck has cured.
Note: During concrete placement, because the deck is parallel to the beam, the beam will not
have continuous lateral support. It will be braced at 10 ft on center by the intermediate beams.
Pu = 47 kips
wm = 0.04 kip/ft
PD
PL
ΣP = 171.5 kip
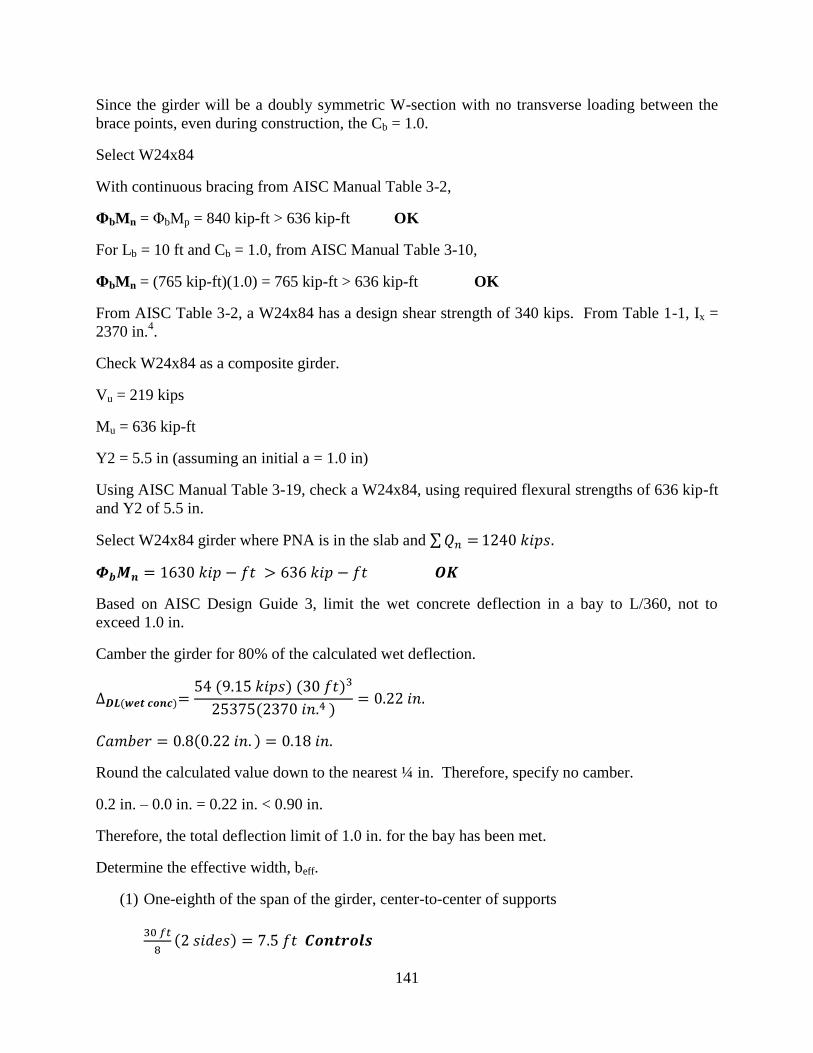
141
Since the girder will be a doubly symmetric W-section with no transverse loading between the
brace points, even during construction, the Cb = 1.0.
Select W24x84
With continuous bracing from AISC Manual Table 3-2,
ΦbMn = ΦbMp = 840 kip-ft > 636 kip-ft OK
For Lb = 10 ft and Cb = 1.0, from AISC Manual Table 3-10,
ΦbMn = (765 kip-ft)(1.0) = 765 kip-ft > 636 kip-ft OK
From AISC Table 3-2, a W24x84 has a design shear strength of 340 kips. From Table 1-1, Ix =
2370 in.4.
Check W24x84 as a composite girder.
Vu = 219 kips
Mu = 636 kip-ft
Y2 = 5.5 in (assuming an initial a = 1.0 in)
Using AISC Manual Table 3-19, check a W24x84, using required flexural strengths of 636 kip-ft
and Y2 of 5.5 in.
Select W24x84 girder where PNA is in the slab and ∑
Based on AISC Design Guide 3, limit the wet concrete deflection in a bay to L/360, not to
exceed 1.0 in.
Camber the girder for 80% of the calculated wet deflection.
Round the calculated value down to the nearest ¼ in. Therefore, specify no camber.
0.2 in. – 0.0 in. = 0.22 in. < 0.90 in.
Therefore, the total deflection limit of 1.0 in. for the bay has been met.
Determine the effective width, beff.
(1) One-eighth of the span of the girder, center-to-center of supports
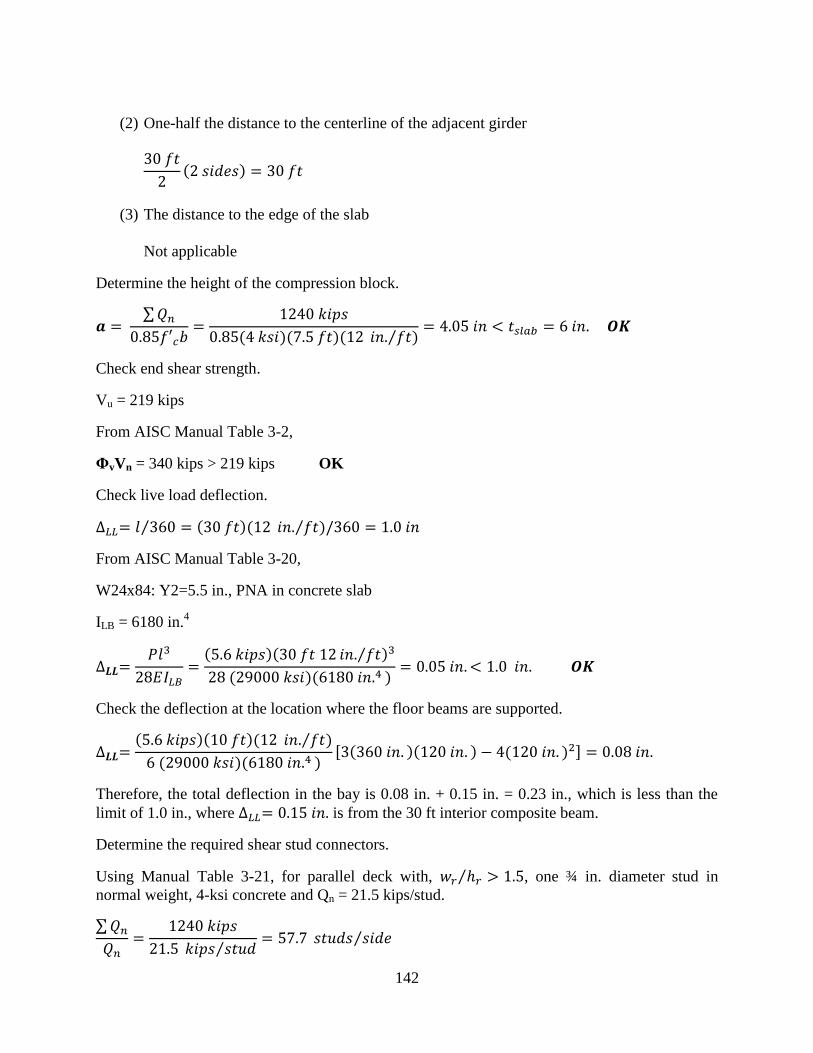
142
(2) One-half the distance to the centerline of the adjacent girder
(3) The distance to the edge of the slab
Not applicable
Determine the height of the compression block.
∑
⁄
Check end shear strength.
Vu = 219 kips
From AISC Manual Table 3-2,
ΦvVn = 340 kips > 219 kips OK
Check live load deflection.
⁄⁄
From AISC Manual Table 3-20,
W24x84: Y2=5.5 in., PNA in concrete slab
ILB = 6180 in.4
⁄
Check the deflection at the location where the floor beams are supported.
⁄
[ ]
Therefore, the total deflection in the bay is 0.08 in. + 0.15 in. = 0.23 in., which is less than the
limit of 1.0 in., where is from the 30 ft interior composite beam.
Determine the required shear stud connectors.
Using Manual Table 3-21, for parallel deck with, ⁄ , one ¾ in. diameter stud in
normal weight, 4-ksi concrete and Qn = 21.5 kips/stud.
∑
⁄ ⁄
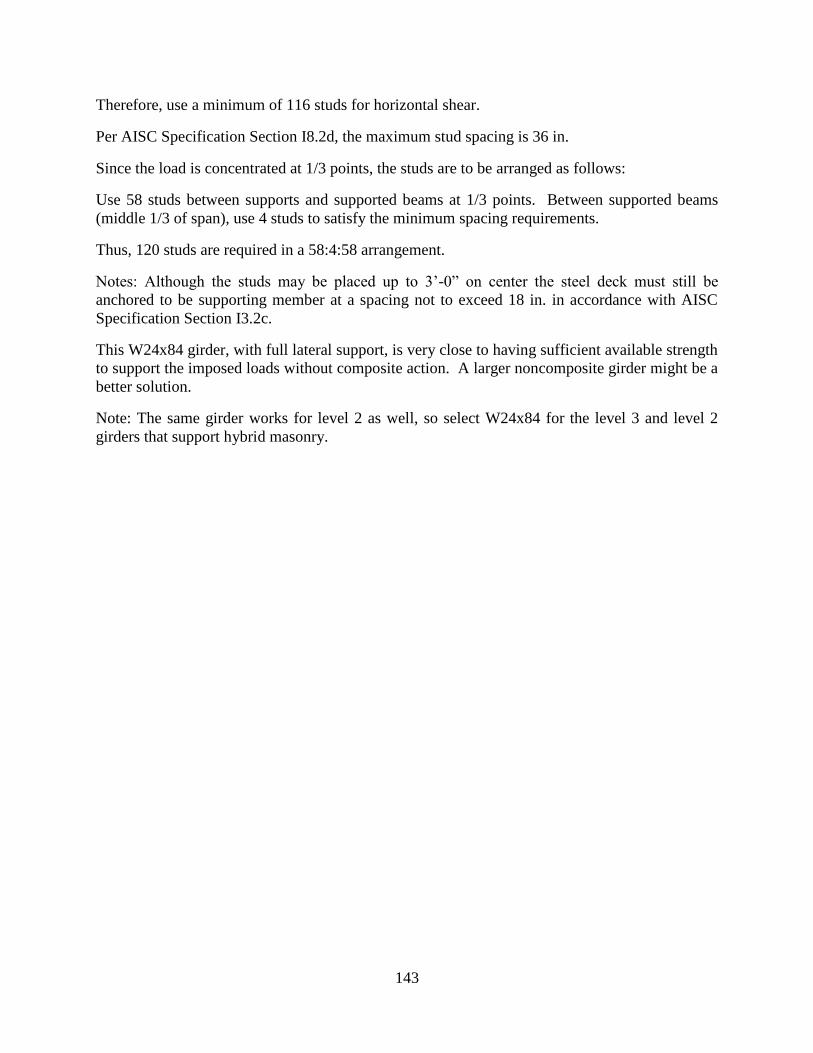
143
Therefore, use a minimum of 116 studs for horizontal shear.
Per AISC Specification Section I8.2d, the maximum stud spacing is 36 in.
Since the load is concentrated at 1/3 points, the studs are to be arranged as follows:
Use 58 studs between supports and supported beams at 1/3 points. Between supported beams
(middle 1/3 of span), use 4 studs to satisfy the minimum spacing requirements.
Thus, 120 studs are required in a 58:4:58 arrangement.
Notes: Although the studs may be placed up to 3’-0” on center the steel deck must still be
anchored to be supporting member at a spacing not to exceed 18 in. in accordance with AISC
Specification Section I3.2c.
This W24x84 girder, with full lateral support, is very close to having sufficient available strength
to support the imposed loads without composite action. A larger noncomposite girder might be a
better solution.
Note: The same girder works for level 2 as well, so select W24x84 for the level 3 and level 2
girders that support hybrid masonry.
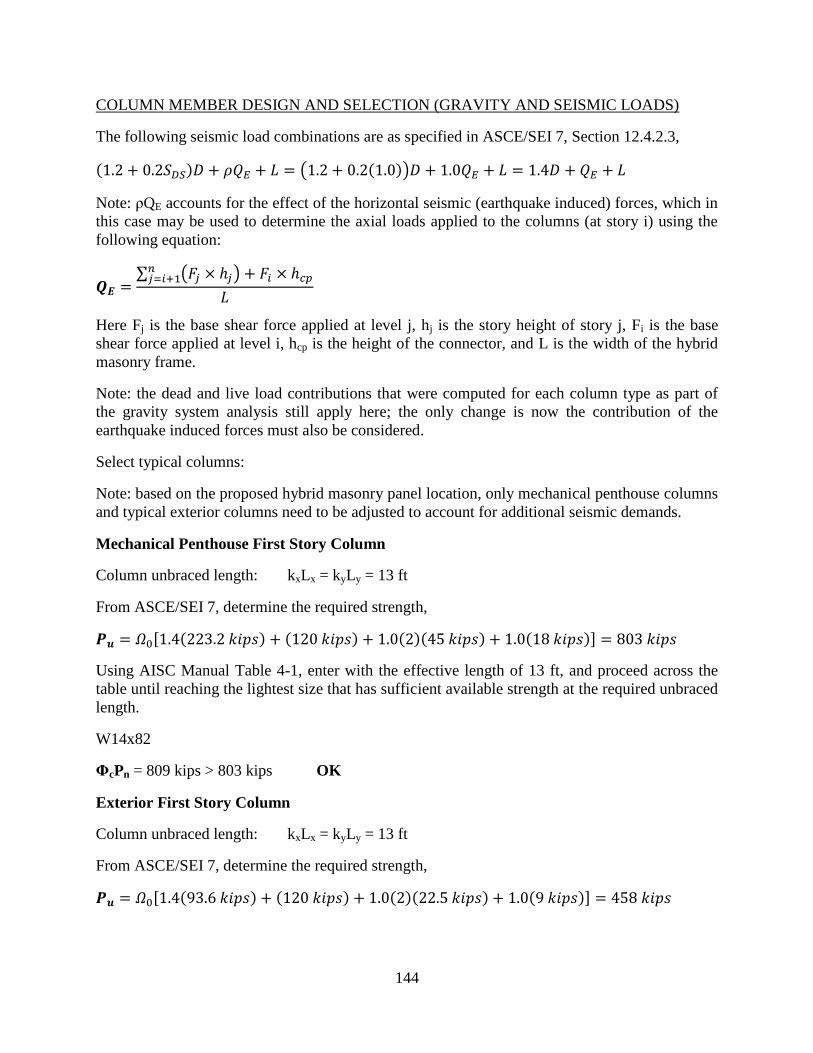
144
COLUMN MEMBER DESIGN AND SELECTION (GRAVITY AND SEISMIC LOADS)
The following seismic load combinations are as specified in ASCE/SEI 7, Section 12.4.2.3,
( )
Note: ρQE accounts for the effect of the horizontal seismic (earthquake induced) forces, which in
this case may be used to determine the axial loads applied to the columns (at story i) using the
following equation:
∑ ( )
Here Fj is the base shear force applied at level j, hj is the story height of story j, Fi is the base
shear force applied at level i, hcp is the height of the connector, and L is the width of the hybrid
masonry frame.
Note: the dead and live load contributions that were computed for each column type as part of
the gravity system analysis still apply here; the only change is now the contribution of the
earthquake induced forces must also be considered.
Select typical columns:
Note: based on the proposed hybrid masonry panel location, only mechanical penthouse columns
and typical exterior columns need to be adjusted to account for additional seismic demands.
Mechanical Penthouse First Story Column
Column unbraced length: kxLx = kyLy = 13 ft
From ASCE/SEI 7, determine the required strength,
[ ]
Using AISC Manual Table 4-1, enter with the effective length of 13 ft, and proceed across the
table until reaching the lightest size that has sufficient available strength at the required unbraced
length.
W14x82
ΦcPn = 809 kips > 803 kips OK
Exterior First Story Column
Column unbraced length: kxLx = kyLy = 13 ft
From ASCE/SEI 7, determine the required strength,
[ ]

145
Using AISC Manual Table 4-1, enter with the effective length of 13 ft, and proceed across the
table until reaching the lightest size that has sufficient available strength at the required unbraced
length.
W14x82
ΦcPn = 809 kips > 458 kips OK

146
DESIGN OF MASONRY PANELS
Typical masonry panel properties:
Wall Width (b) = 352.0 in.
Wall Thickness (t) = 7.63 in.
Wall Height (h) = 152.0 in.
Area (An) = 2686 in.2
Moment of Inertia (I) = 2.77E7 in.4
Section Modulus (S) = 1.57E5 in.3
Radius of Gyration (r) = 2.21 in.
Prism Compressive Strength (f’m) = 1500 psi
Type M Portland Cement
Fully Grouted
Modulus of Rupture (fr) = 163 psi
Young’s Modulus (Em) = 1350 ksi
Density of Masonry (γm) = 150 lb/ft3
Grade 60 Reinforcement (Fy) = 60 ksi
Young’s Modulus (Es) = 29000 ksi
Design of the first story masonry panel involves determining the necessary vertical and
horizontal reinforcement to provide the necessary flexural strength and shear strength
respectively. A reinforcement plan with the specific locations and spacing of reinforcement
throughout the panel will also be developed.
Vu = 204 kips (from seismic base shear determination)
The design flexural strength of each of the reinforced masonry panels may be determined using
static analysis of the full panel cross section. The goal is to determine the location of the neutral
axis such that the summation of compressive forces acting in both the masonry and the steel
reinforcement at the toe of the wall equals the tensile forces acting in the steel rebar at the heel of
the wall. The total moment capacity of the wall which is the moment caused by the combination
of each of these force components about the neutral axis should exceed the flexural demands for
the base of the wall.
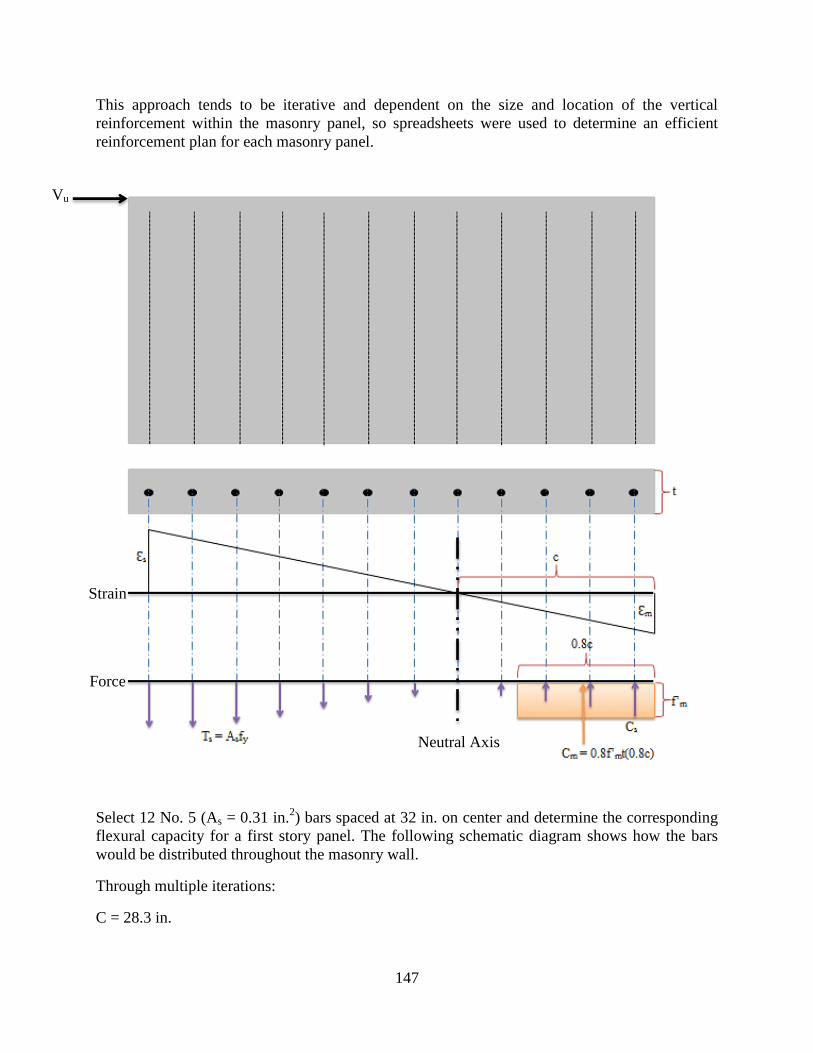
147
This approach tends to be iterative and dependent on the size and location of the vertical
reinforcement within the masonry panel, so spreadsheets were used to determine an efficient
reinforcement plan for each masonry panel.
Select 12 No. 5 (As = 0.31 in.2) bars spaced at 32 in. on center and determine the corresponding
flexural capacity for a first story panel. The following schematic diagram shows how the bars
would be distributed throughout the masonry wall.
Through multiple iterations:
C = 28.3 in.
Strain
Force
Vu
Neutral Axis
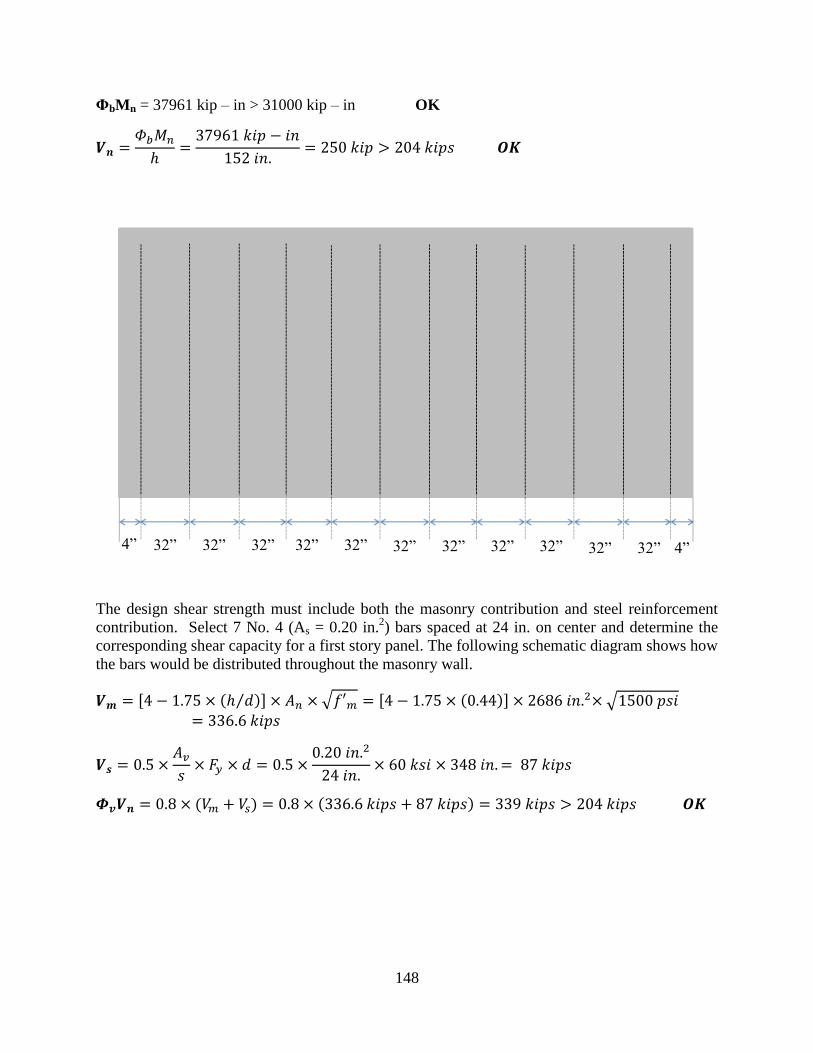
148
ΦbMn = 37961 kip – in > 31000 kip – in OK
The design shear strength must include both the masonry contribution and steel reinforcement
contribution. Select 7 No. 4 (As = 0.20 in.2) bars spaced at 24 in. on center and determine the
corresponding shear capacity for a first story panel. The following schematic diagram shows how
the bars would be distributed throughout the masonry wall.
[ ⁄ ] √ [ ] √
32” 32” 32” 32” 32” 32” 32” 32” 32” 32” 32” 4” 4”

149
Design of the second story masonry panel involves determining the necessary vertical and
horizontal reinforcement to provide the necessary flexural strength and shear strength
respectively. A reinforcement plan with the specific locations and spacing of reinforcement
throughout the panel will also be developed.
Vu = 171.5 kips (from seismic base shear determination)
The design flexural strength of each of the reinforced masonry panels may be determined using
static analysis of the full panel cross section. The goal is to determine the location of the neutral
axis such that the summation of compressive forces acting in both the masonry and the steel
reinforcement at the toe of the wall equals the tensile forces acting in the steel rebar at the heel of
the wall. The total moment capacity of the wall which is the moment caused by the combination
of each of these force components about the neutral axis should exceed the flexural demands for
the base of the wall.
This approach tends to be iterative and dependent on the size and location of the vertical
reinforcement within the masonry panel, so spreadsheets were used to determine an efficient
reinforcement plan for each masonry panel.
24”
24”
24”
24”
24”
24”
4”
4”

150
Select 12 No. 4 (As = 0.20 in.2) bars spaced at 32 in. on center and determine the corresponding
flexural capacity for a first story panel. The following schematic diagram shows how the bars
would be distributed throughout the masonry wall.
Through multiple iterations:
C = 20.8 in.
ΦbMn = 26741 kip – in > 26100 kip – in OK
Strain
Force
Vu
Neutral Axis
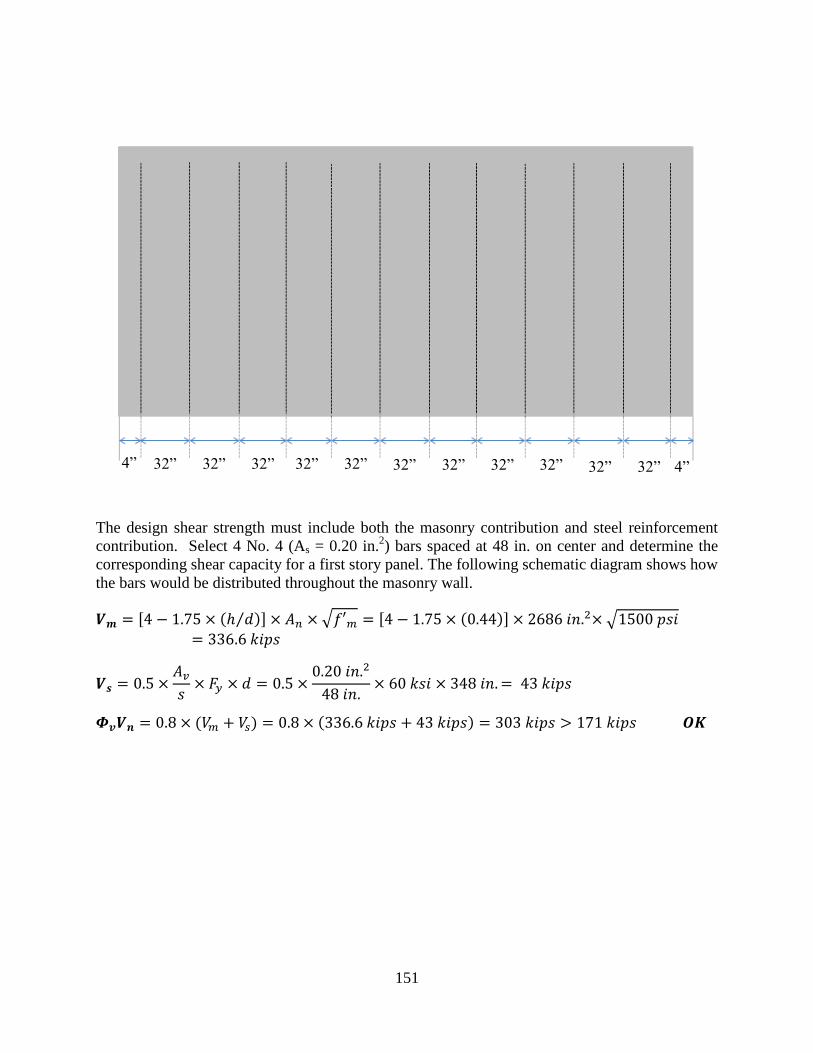
151
The design shear strength must include both the masonry contribution and steel reinforcement
contribution. Select 4 No. 4 (As = 0.20 in.2) bars spaced at 48 in. on center and determine the
corresponding shear capacity for a first story panel. The following schematic diagram shows how
the bars would be distributed throughout the masonry wall.
[ ⁄ ] √ [ ] √
32” 32” 32” 32” 32” 32” 32” 32” 32” 32” 32” 4” 4”
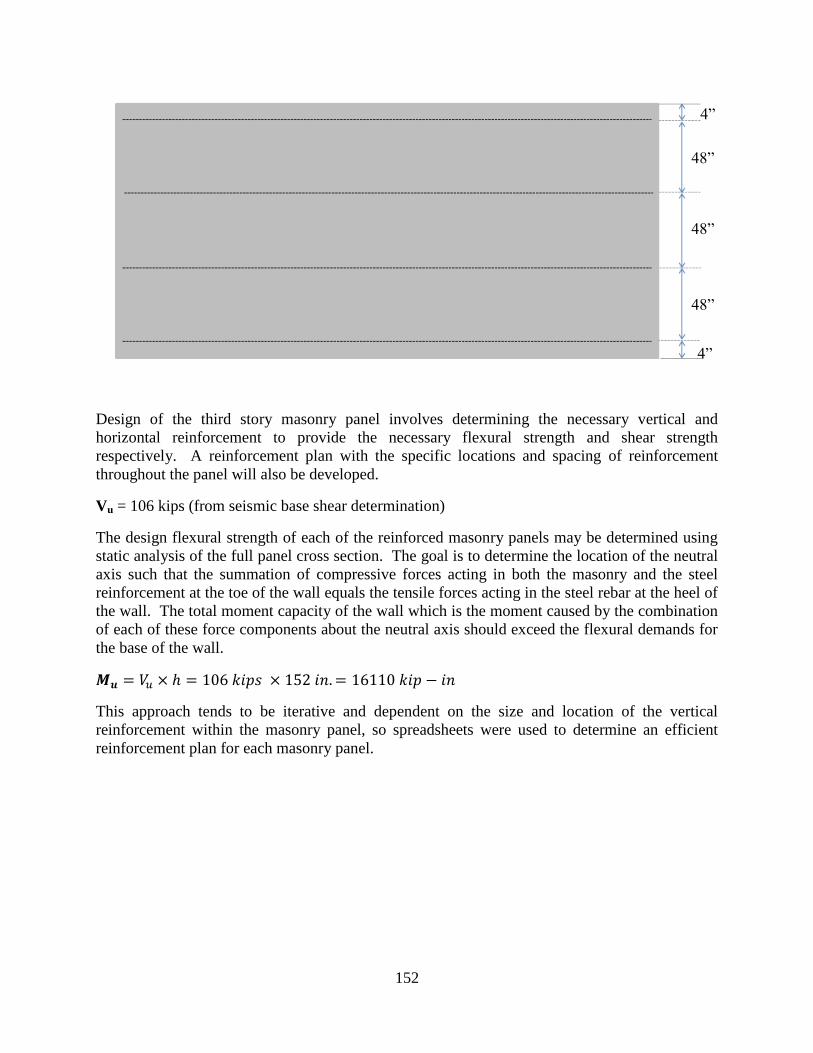
152
Design of the third story masonry panel involves determining the necessary vertical and
horizontal reinforcement to provide the necessary flexural strength and shear strength
respectively. A reinforcement plan with the specific locations and spacing of reinforcement
throughout the panel will also be developed.
Vu = 106 kips (from seismic base shear determination)
The design flexural strength of each of the reinforced masonry panels may be determined using
static analysis of the full panel cross section. The goal is to determine the location of the neutral
axis such that the summation of compressive forces acting in both the masonry and the steel
reinforcement at the toe of the wall equals the tensile forces acting in the steel rebar at the heel of
the wall. The total moment capacity of the wall which is the moment caused by the combination
of each of these force components about the neutral axis should exceed the flexural demands for
the base of the wall.
This approach tends to be iterative and dependent on the size and location of the vertical
reinforcement within the masonry panel, so spreadsheets were used to determine an efficient
reinforcement plan for each masonry panel.
48”
48”
48”
4”
4”
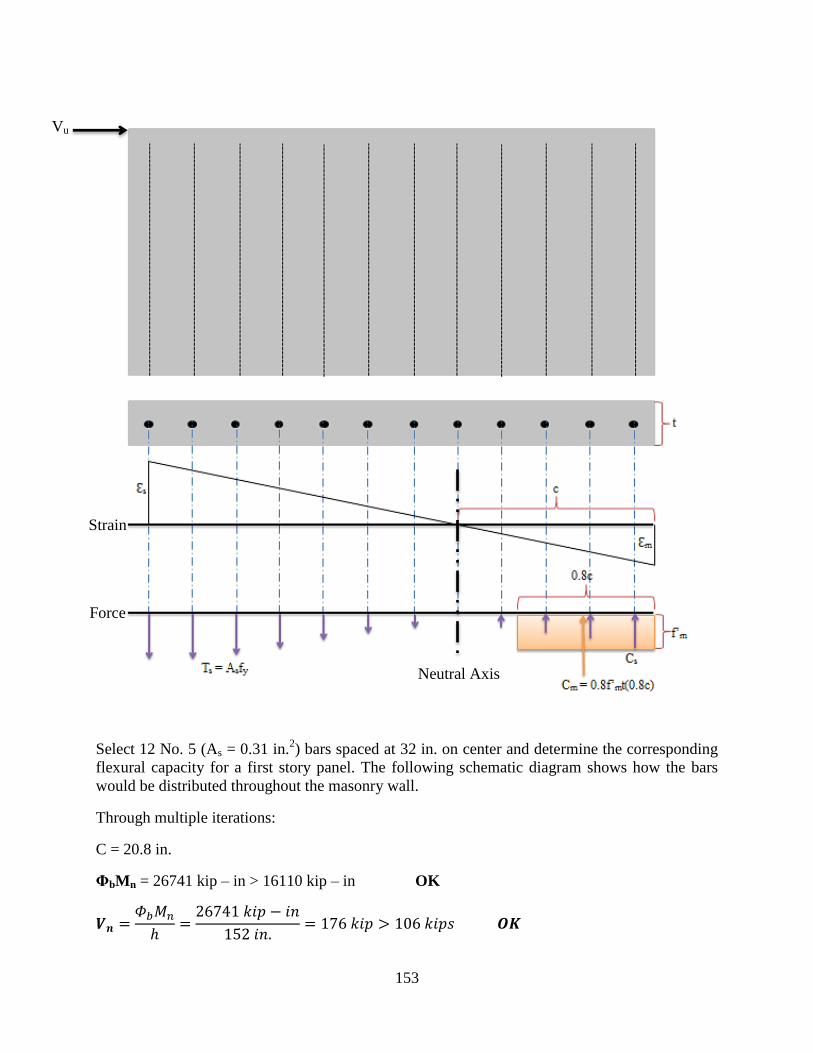
153
Select 12 No. 5 (As = 0.31 in.2) bars spaced at 32 in. on center and determine the corresponding
flexural capacity for a first story panel. The following schematic diagram shows how the bars
would be distributed throughout the masonry wall.
Through multiple iterations:
C = 20.8 in.
ΦbMn = 26741 kip – in > 16110 kip – in OK
Strain
Force
Vu
Neutral Axis

154
The design shear strength must include both the masonry contribution and steel reinforcement
contribution. Select 4 No. 4 (As = 0.20 in.2) bars spaced at 48 in. on center and determine the
corresponding shear capacity for a first story panel. The following schematic diagram shows how
the bars would be distributed throughout the masonry wall.
[ ⁄ ] √ [ ] √
32” 32” 32” 32” 32” 32” 32” 32” 32” 32” 32” 4” 4”
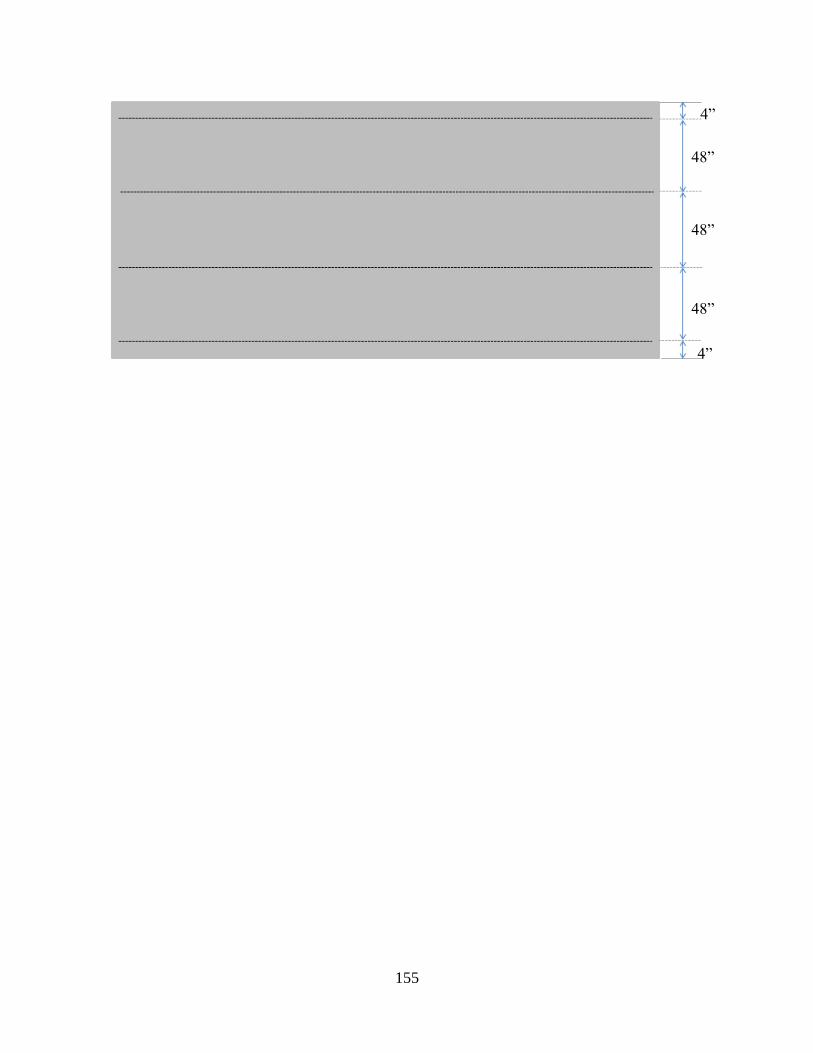
155
48”
48”
48”
4”
4”