seiaa karnataka checklist for building & … · checklist for building & construction...
TRANSCRIPT

SEIAA – KARNATAKA
CHECKLIST FOR BUILDING & CONSTRUCTION PROJECTS
Name of the Project: “Development of Residential Apartment and a Club House”
Sl.
No. DOCUMENTS /
1. Form -1
2. Form -1 A
3. Environmental management plan [EMP]
4. Conceptual Plan [Site Plan]
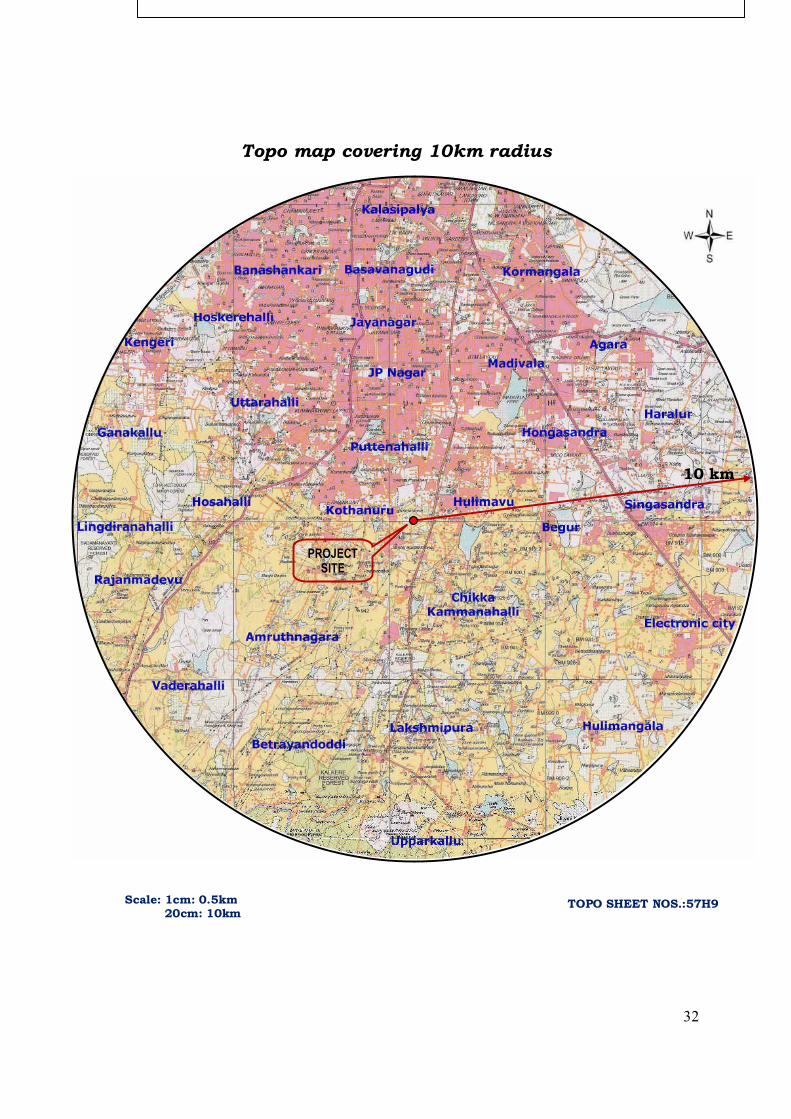
5. Topo sheet Duly marking the project site with 10Km Radius
6. Original Village Maps duly marking project site. Adjacent village maps of the project
site is located at vicinity of the village boundary
7. Latest Google Map Duly marking the project site
8. CDP Duly marking the project site
9. Latest Site Photographs
10. Land Documents
a. Sale Deed
b. Khatha Certificate
c. Mutation Copy
d. Land allotment Letter in case of KIADB/SEZ -
e. Survey Sketch, Podi etc.,
f. R.T.C
g. Joint development agreement if Applicable
h. Other- Gift deed, Land conversion copy
i. Gazette Notification regarding land acquisition under section 4(1) & 4 (6) of the
Karnataka Land revenue Act in case of Area development/ Township Projects
NA
j. List of Survey No's and Extent in case of Area development/ Township Projects NA
k. Disputes if any and copy of documents/ orders there off
11. Copy of earlier E.C/Sanction Plan in case of Expansion and Modification Projects NA
12. Certified report of the status of compliance of the conditions stipulated in the E.C from
the regional office of MoEF& CC
NA
13. Latest Traffic study Report
14. Copy of Clearance obtained from other Regulatory Authority
a. NOC regarding water supply from the competent Authority -Acknowledgment
b. NOC from Airport Authority
c. NOC from Fire and Emergency Department
d.
MOU regarding supply of treated water for construction a per FEE 188 ENV
2003 dated 14.08.2003 and As per NGT Direction in O.A 222 of 2014 dated
04.05.2016 with the prospective supplier and water quality analysis report
e. MoU Letter/Approval letter from GAIL regarding supply of CNG for Generator
set
f. Applicability of CRZ Notification and Clearance /recommendations from the
competent Authority
NA
g. Other Specify

SEIAA – KARNATAKA
CHECK LIST FOR BUILDING & CONSTRUCTION PROJECTS
File No:
Sl. No. PARTICULARS INFORMATION
1. Name & Address of the Project
Proponent
Mr. Prasanna Venkatesh G
Sr. Vice President
M/s. Sobha Limited,
“Sobha”, Sarjapur-Marthahalli ORR,
Devarabeesanahalli, Bellandur Post,
Bengaluru -560 103.
2. Name & Location of the Project
Development of Residential Apartment and a Club
house
Sy. No. 87/2 & 87/3
Kothanur Village,
Uttarahalli Hobli,
Bengaluru South Taluk,
Bengaluru
3. Co-ordinates of the Project Site Latitude : 12 Deg 52 Min 35.10 Sec N
Longitude : 77 Deg 35 Min 17.19 Sec E
4. ENVIRONMENTAL SENSITIVITY
a.
Distance from periphery of nearest
Lake and other water bodies (Lake,
Rajakaluve, Nala etc.,)
Kothanur lake is around 600 m away from the project
site boundary.
b.
Type of water body at the vicinity of
the project site and Details of Buffer
provided as per NGT Direction in
O.A 222 of 2014 dated 04.05.2016,
if Applicable.
Kothanur lake is around 600 m away from the project
site boundary.
5. TYPE OF DEVELOPMENT
a.
Residential Apartment / Villas /
Row Houses / Vertical Development
/ Office / IT/ ITES/ Mall/ Hotel/
Hospital /other
Residential Apartment
b. Residential Township/ Area
Development Projects
NA
6. Plot Area (Sqm) 23,548.39 Sqm (5A 32.5G)
7. Built Up area (Sqm) 76,374.38 Sqm
8.
Building Configuration [ Number of
Blocks / Towers / Wings etc., with
Numbers of Basements and Upper
Floors]
Proposed project comprising of 280 No. of residential
units in Block 1 & 2 distributed over 2B+G+ 35UF &
Club house with G+1UF
9. Number of units in case of
Construction Projects
280 Nos. of Residential Units
10.
Number of Plots in case of
Residential Township/ Area
Development Projects
NA
11. Project Cost (Rs. In Crores) Rs. 187.98 Crores
12. Recreational Area in case of
Residential Projects / Townships
-
13. DETAILS OF LAND USE (SQM)

a. Ground Coverage Area 2404.10 Sqm
b. Kharab Land -
c.
Total Green belt on Mother Earth
for projects under 8(a) of the
schedule of the EIA notification,
2006
8,654.26 Sqm
d. Internal Roads & others 6,212.19 Sqm
e. Paved area -
f. Others Specify
Landscape on podium- 4,691.63 Sqm
Ramps – 408.79 Sqm
CA area – 1,177.42 Sqm
g.
Parks and Open space in case of
Residential Township/ Area
Development Projects
-
h. Total site area 23,548.39 Sqm
14. DETAILS OF DEMOLITION DEBRIS AND / OR EXCAVATED EARTH
a.
Details of Debris (in cubic
meter/MT) if it involves Demolition
of existing structure and Plan for re
use as per Construction and
Demolition waste management
Rules 2016, If Applicable
There is no demolition work
b.
Total quantity of Excavated earth
(in cubic meter)
79,266 m3
c.
Quantity of Excavated earth propose
to be used in the Project site (in
cubic meter)
59,862 m3
d. Excess excavated earth (in cubic
meter)
19,404 m3
e.
Plan for scientific disposal of excess
excavated earth along with
Coordinate of the site proposed for
such disposal
Excess excavated earth is carted out from the site
15. WATER
I. Construction Phase
a. Source of water
The domestic water requirement will be met by
external agencies and water requirement for
construction purpose will be met by STP tertiary
treated water.
b. Quantity of water for Construction
in KLD
27 KLD
c. Quantity of water for Domestic
Purpose in KLD
19 KLD
d. Waste water generation in KLD 17.1 KLD
e. Treatment facility proposed and
scheme of disposal of treated water
Domestic sewage generated during construction phase
will be treated in mobile STP.
II. Operational Phase
a. Total Requirement of Water in
KLD
Fresh 133 KLD
Recycled 69 KLD
Total 202 KLD

b. Source of water BWSSB/External tankers
c. Waste water generation in KLD 182 KLD
d. STP capacity STP Capacity –210 KLD
e. Technology employed for Treatment Extended Aeration with Ultra Filtration
f. Scheme of disposal of excess treated
water if any
Excess 11KLD will be discharged to UGD
16. INFRASTRUCTURE FOR RAINWATER HARVESTING
a.
Capacity of sump tank to store Roof
run off
165 cum
b. No's of Ground water recharge pits 15 Nos.
17. Storm water management plan
Internal garland drains will be provided within the site
in order to carry out the storm water into the recharge
pits and will be managed within the site, excess runoff
will be routed in to the external storm water drain on
northeastern side of project site.
18. WASTE MANAGEMENT
I. Construction Phase
a. Quantity of Solid waste generation
and mode of Disposal as per norms
Total solid waste generation during construction phase
from labour colony will be 314 kg/day which will be
handed over to BBMP.
Construction debris 76 m3
This will be reused within the site for road and
pavement formation.
II. Operational Phase
a.
Quantity of Biodegradable waste
generation and mode of Disposal as
per norms
428 kg/day
This will be segregated at household levels and will be
processed in proposed organic waste converter.
b.
Quantity of Non- Biodegradable
waste generation and mode of
Disposal as per norms
286 kg/day
Recyclable wastes will be handed over to authorized
waste recyclers
c.
Quantity of Hazardous Waste
generation and mode of Disposal as
per norms
Waste Oil Generation : 1.215 L/ running hour of DG
Hazardous wastes like waste oil from DG sets, used
batteries etc. will be handed over to the authorized
hazardous waste recyclers.
d.
Quantity of E waste generation
waste generation and mode of
Disposal as per norms
E-Wastes will be collected separately & it will be
handed over to authorized E-waste recyclers for
further processing.
19. POWER
a.
Total Power Requirement -
Operational Phase
3,203 kW
b. Numbers of DG set and capacity in
KVA for Standby Power Supply
500kVA – 5 Nos.
c. Details of Fuel used for DG Set 523.8 l/hr
d.
Energy conservation plan and
Percentage of savings including plan
for utilization of solar energy as per
ECBC 2007
Solar Lights & water heaters ,LED, PHE pumps
etc
The overall energy savings is around 23.55%
20. PARKING
a. Parking Requirement as per norms
338 Nos. (provided -495nos)

b.
Level of Service (LOS) of the
connecting Roads as per the Traffic
Study Report
Existing LOS Changed LOS
6th
Main Rd A A
Kothanur Main
Rd
C B
Bannerghatta
main Rd
D A
c. Internal Road width (RoW) 8m

29
Annexure – 1(a): Land use details
Existing land use:
The land use pattern planned for the Planning District 3.21 Anjanapura map
(b) for the planning year 2015 is as enumerated in the following table. It is observed
that the proposed project site is located in Residential (main) zone. The overall land
use proposed for the contained planning district as per the Revised Master plan (RMP)-
2015, is shown in the above fig.
PROJECT
SITE

30
Land use Allocation as per RMP - 2015
Land Use Area in Hectare % of Total
Residential (main) 2941.17 55.50
Residential (Mixed) 640.93 12.10
Commercial (Central) - -
Commercial (Business) 9.52 0.18
Mutation Corridor 69.98 1.32
Commercial Axes 62.77 1.18
Industrial 75.54 1.43
High Tech 54.60 1.03
Public and Semi Public 136.25 2.57
Green (Parks & Open Spaces) 548.83 10.36
Traffic & Transportation 668.40 12.61
Public utilities 91.06 1.72
Unclassified - -
Total 5299.05 100.00

31
Aerial view covering 500 m radius
Latitude : 12 Deg 52 Min 35.10 Sec N Longitude : 77 Deg 35 Min 17.19 Sec E
32
Topo map covering 10km radius
10 km
PROJECT
SITE
Scale: 1cm: 0.5km 20cm: 10km
TOPO SHEET NOS.:57H9

33
Table: Land Use within the site
Sl. No. Land use Area in Sqmt In %
I Total Site area 23,548.39
CA area 1,177.42
II Net Site area 22,370.97 100
Land use Breakup in Percentage (%)
1. Ground coverage area 2,404.10 10.75
2. Landscape on ground 8,654.26 38.69
Landscape on podium 4,691.63 20.97
3. Road, surface parking &
Hard paved area 6,212.19 27.77
4. Ramps 408.79 1.82
Annexure 1(b): Views of the project site

34
Annexure 1(d): Floor wise distribution of Residential Apartment
Sl. No. Floors No. of units
1. Basement 1 00
2. Basement 2 00
3. Ground floor 00
4. 1st floor 8
5. 2nd floor 8
6. 3rd floor 8
7. 4th floor 8
8. 5th floor 8
9. 6th floor 8
10. 7th floor 8
11. 8th floor 8
12. 9th floor 8
13. 10th floor 8
14. 11th floor 8
15. 12th floor 8
16. 13th floor 8
17. 14th floor 8
18. 15th floor 8
19. 16th floor 8
20. 17th floor 8
21. 18th floor 8
22. 19th floor 8
23. 20th floor 8
24. 21st floor 8
25. 22nd floor 8
26. 23rd floor 8
27. 24th floor 8
28. 25th floor 8
29. 26th floor 8
30. 27th floor 8
31. 28th floor 8
32. 29th floor 8
33. 30th floor 8
34. 31st floor 8
35. 32nd floor 8
36. 33rd floor 8
37. 34th floor 8
38. 35th floor 8
39. Terrace floor --
Total 280

35
Annexure 1(e): Waste Management
CONSTRUCTION PHASE:
1. SOLID WASTE GENERATION
Construction waste is generated during construction works. It mainly consists
of earth, stones, bricks, inert and non-biodegradable material such as concrete,
plaster, metal, wood, plastics etc & small quantity of domestic solid waste. The
retrievable items such as bricks, wood, metals are recycled; the domestic waste will be
segregated and will not be allowed to mix with construction waste. The construction
earth and other wastes will be used for landscaping within the site premises.
2. DOMESTIC SEWAGE
The domestic sewage generated would be is about 17.1 KLD during
construction; which will be collected and treated in Mobile Sewage Treatment Plant.
OPERATION PHASE:
1. SOLID WASTE GENERATION
The solid wastes generated during operation phase can be categorized under
three groups:
Wet Garbage like Food waste, Lawn mowing wastes etc.
Dry Garbage such as Paper, Plastic, Bottles, etc.
Sludge from Sewage Treatment Plant (STP)
Domestic/Residential Waste:
This category of waste comprises the solid wastes that originate from single and
multi – family household units. These wastes are generated as a consequence of
household activities such as cooking, cleaning, repairs, hobbies, redecoration, empty
containers, packaging, clothing, old books, writing/new paper, and old furnishings.
Households also discard bulky wastes such as furniture and large appliances which
cannot be repaired and used.
36
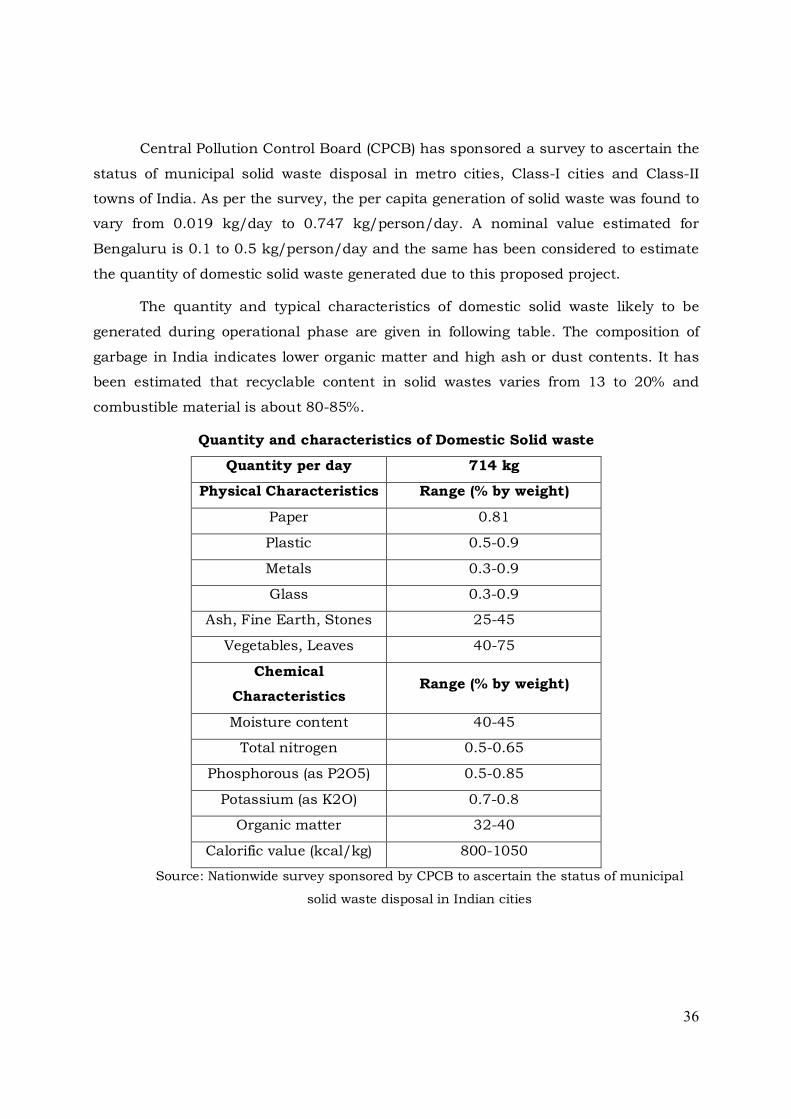
Central Pollution Control Board (CPCB) has sponsored a survey to ascertain the
status of municipal solid waste disposal in metro cities, Class-I cities and Class-II
towns of India. As per the survey, the per capita generation of solid waste was found to
vary from 0.019 kg/day to 0.747 kg/person/day. A nominal value estimated for
Bengaluru is 0.1 to 0.5 kg/person/day and the same has been considered to estimate
the quantity of domestic solid waste generated due to this proposed project.
The quantity and typical characteristics of domestic solid waste likely to be
generated during operational phase are given in following table. The composition of
garbage in India indicates lower organic matter and high ash or dust contents. It has
been estimated that recyclable content in solid wastes varies from 13 to 20% and
combustible material is about 80-85%.
Quantity and characteristics of Domestic Solid waste
Quantity per day 714 kg
Physical Characteristics Range (% by weight)
Paper 0.81
Plastic 0.5-0.9
Metals 0.3-0.9
Glass 0.3-0.9
Ash, Fine Earth, Stones 25-45
Vegetables, Leaves 40-75
Chemical
Characteristics Range (% by weight)
Moisture content 40-45
Total nitrogen 0.5-0.65
Phosphorous (as P2O5) 0.5-0.85
Potassium (as K2O) 0.7-0.8
Organic matter 32-40
Calorific value (kcal/kg) 800-1050
Source: Nationwide survey sponsored by CPCB to ascertain the status of municipal
solid waste disposal in Indian cities

37
GENERATION:
Sl. No.
Description Population Per capita
considered in kg/Day
Total Waste kg/day
Organic Waste kg/day
In-Organic Waste kg/day
Residential & Club house
1. Residential Apartment
1400
(280 units *5persons)
0.5 kg/day/person
700 420 280
2. For club House
140 (Considering 10% of total population)
0.1 kg/day/person
14 8 6
Total 714 428 286
STP Sludge 9
The total quantity of solid wastes generated from the proposed project will be
714kg/day, which will be disposed off safely.
Management:
Biodegradable wastes:
Biodegradable wastes will be segregated at household levels and will be
processed in proposed organic waste converter.
Non-biodegradable Wastes:
The recyclable portion like plastics, glass, metals etc. will be given to the waste
recyclers.
Hazardous wastes like waste oil from DG sets, used batteries etc. will be
handed over to the authorized hazardous waste recyclers.
E-Wastes will be collected separately & it will be handed over to authorized E-
waste recyclers for further processing.
38
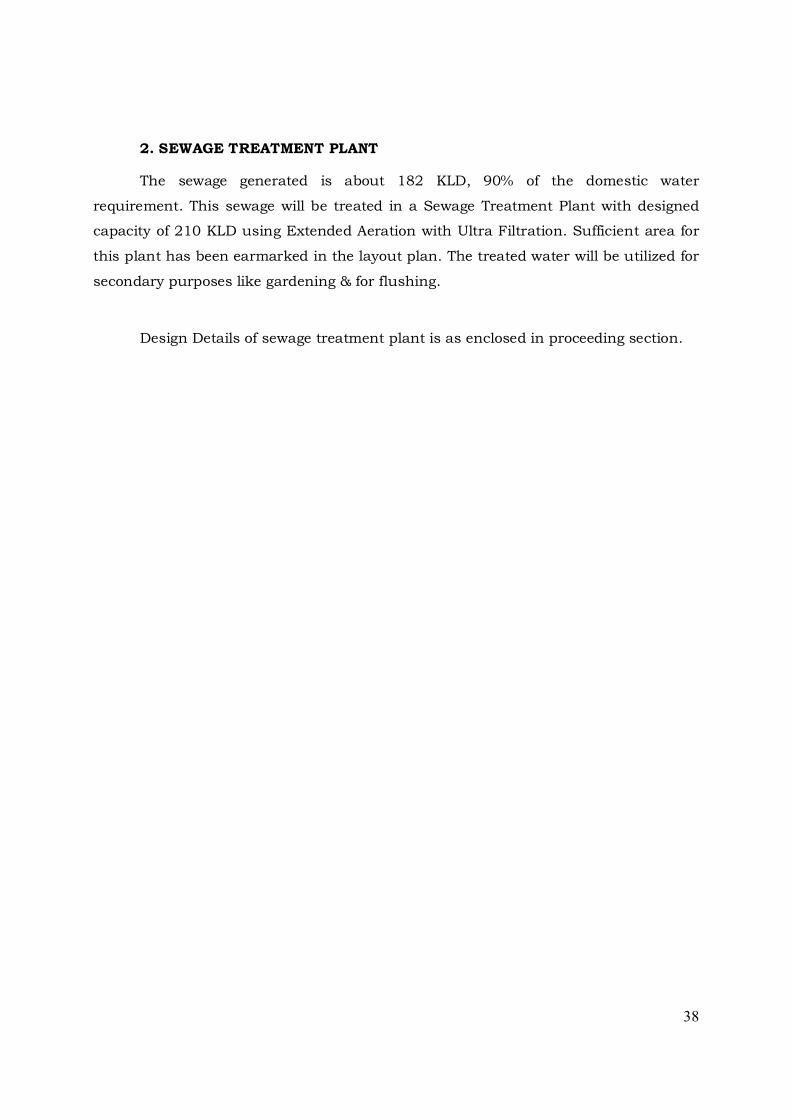
2. SEWAGE TREATMENT PLANT
The sewage generated is about 182 KLD, 90% of the domestic water
requirement. This sewage will be treated in a Sewage Treatment Plant with designed
capacity of 210 KLD using Extended Aeration with Ultra Filtration. Sufficient area for
this plant has been earmarked in the layout plan. The treated water will be utilized for
secondary purposes like gardening & for flushing.
Design Details of sewage treatment plant is as enclosed in proceeding section.

STP TECHNICAL WRITE-UP: 210 KLD
For
“PROPOSED RESIDENTIAL DEVELOPMENT”
LOCATED AT
KOTHNUR VILLAGE, BANGALORE
DEVELOPED BY
SOBHA LIMITED
Regd and Corporate Office,
Sarjapur-Marthahalli Outer Ring Road (ORR)
Devarabisanahalli, Bellandur Post, Bangalore – 560 103.
Telephone No: 080-49320000,
~~~*~~~

Kothnur Property STP Technical Write Up
Sobha Limited. Page 2 of 11
SEWAGE TREATMENT PLANT
Sewage Treatment plant is provided for treating all kinds of wastewater generated due to various domestic
activities involved in the project. This facility is not only installed for conforming to the statutory
requirement of Pollution Control Board, but also to ensure that the treated water is utilized for gardening
and flushing activities.
The treatment Process / system is designed on the principle of Extended aeration system, which ensures
the aerobic decomposition of organic matter in presence of active microbial growth in the aeration tank
followed by ultra-filtration.
Water Demand Calculation:
Particulars No. of Units
Occupancy (nos.)
Water Demand
(lpcd)
Domestic Water
Demand (KLD)
Flush Water
Demand (KLD)
Apartment 280 1,400 135 126,000 63,000
Club House -- 140 45 3,500 2,800
Maintenance Staff (10% of Population) --
140
45 3,500 2,800
TOTAL 133,000 68,600 say
69
Total water requirement in KLD 202
Sewage generation (Considering 90% of total water demand) in KLD 182
Sewage generation (Considering design peak factor @ 1.2) in KLD 218
Proposed STP Capacity in KLD 210

Kothnur Property STP Technical Write Up
Sobha Limited. Page 3 of 11
Total Water Requirement 202 KLD
For Flushing 69 KLD
For Domestic Purposes 133 KLD
Total Quantity of wastewater 182 KLD
At 90% discharge
Sewage Treatment Plant (STP) 210 KLD
STP treated water @ 95% of
Total wastewater quantity= 173 KLD
For Flushing 69 KLD
Excess to UGD 11KLD
For Landscaping 93 KLD
Water Balance Chart

Kothnur Property STP Technical Write Up
Sobha Limited. Page 4 of 11
PROCESS DESIGN BASIS
Basis of Design
Sewage treatment plant is designed for hybrid technology i.e. extended aeration system with Ultra filtration
technology for enhancing final treated sewage quality.
Sewage generated from domestic activities is considered at a maximum of 182 m3/day with design peak
factor 1.2, the capacity of STP provided is 210 KLD. The Sewage treatment plant is designed taking the
following parameters into account.
Sewage Quality Parameters (Raw & Treated)
Sl.No Description Unit Influent Treated Effluent
1. pH - 6.5 – 8.5 6.5 - 9
2. COD mg/l 200 - 600 <50
3. BOD (3 days at 27 deg C) mg/l 150 - 450 < 10
4. TSS mg/l 70 – 400 <20
5. Ammonical Nitrogen mg/l 20 <5
6. Total Nitrogen mg/l 30 <10
7. Fecal Coliforms MPN/100ml 105 – 108 <100
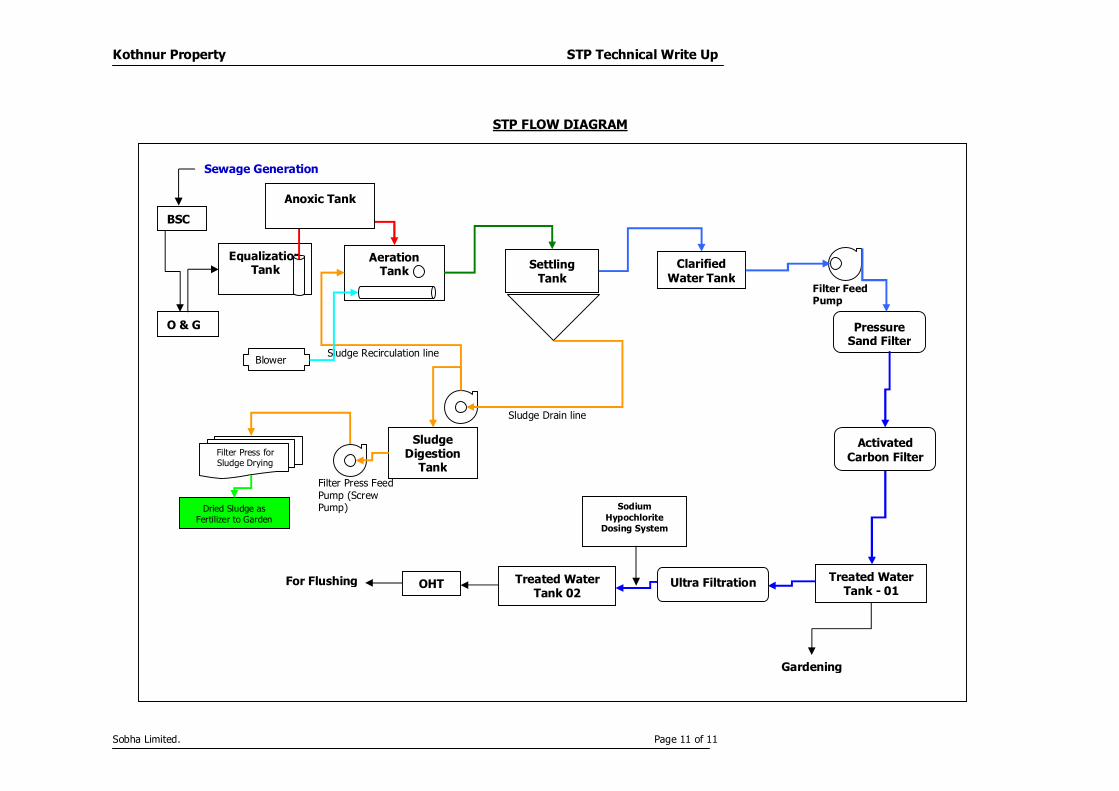
PROCESS DETAILS
In the sewage treatment plant (S.T.P.), extended aeration followed by ultra-filtration treatment is given.
The treatment chambers in the plant consists of
Bar Screen Chamber
Oil & Grease Trap
Equalization Tank
Anoxic Tank
Aeration Tank
Secondary Settling Tank
Clarified Water Tank
Pressure sand filter
Activated carbon filter
Treated Water Tank – I
Ultra filtration system
Treated water tank – II
Sludge holding tank
Filter press

Kothnur Property STP Technical Write Up
Sobha Limited. Page 5 of 11
Collection Pit
1. Pre treatment system
Raw sewage generated from various sources is collected in the Equalization Tank, after passing through a
manually operated Bar Screen that screens the large, floating matter. The collected screenings are disposed
off manually. In the equalization tank, sufficient retention time is provided to equalize and homogenize the
variations in the flow and pollutant concentration. A Coarse Bubble Air Mixing System is provided to mix,
and keep the sewage in an aerobic condition.
2. De-nitrification Process- Anoxic Zone Tank
From Equalization Tank sewage flows into Anoxic Zone Tank. Here removal of nitrogen in the form of
nitrate by conversion to nitrogen gas will be accomplished biologically under anoxic (without oxygen)
conditions. The process is known as de-nitrification.
4. Secondary Treatment System - Aeration Tank
From the Anoxic Zone tank, sewage is pumped into the Aeration tank. In aeration tank sufficient amount
of air is supplied to oxidize the organics absorbed by the bacterial biomass.
5. Secondary Settling Tank
It helps in removing suspended solids and the biomass. Hopper bottom is provided because when sewage
after bacterial activity rests for a given time bio-mass and suspended impurities being heavier tend to settle
at the bottom of Secondary settling tank. Conical bottom helps this mass (called sludge) to slide down the
slope and accumulate near the pit which is connected to the sludge sump.
6. Clarified water Tank
The clarified water is collected in clarified water tank which is the overflow of secondary Settling tank.
7. Filtration
Clarified water is pumped through the Pressure Sand Filter & then to Activated Carbon Filter to remove the
traces of suspended solids, organics, colour and odour present in the treated sewage.
This filtered water is collected in Treated Water Tank-I which will be used for landscaping after disinfection
using hypo solution.
6. Ultra filtration (UF) Treatment

Kothnur Property STP Technical Write Up
Sobha Limited. Page 6 of 11
The treated water from Treated Water Tank –I is pumped to UF. It removes the fouling materials like
particulate matter, suspended solids, bacteria and viruses, colloidal materials (non-reactive silica, iron,
aluminum, slit etc.,), high molecular weight organic compounds. Ultra filtration is to treat 30% of filtered
water at a recovery of 90-95%. This is collected in Treated Water Tank –II which is used for flushing.
7. Sludge Dewatering/Handling
Excess sludge from Aeration tank is stored in Sludge Holding tank & then pumped to Filter Press for
dewatering of sludge. Filter press is a mechanical device which removes moisture content of the sludge &
forms in to sludge cakes. After the formation of sludge cakes the sludge has to be disposed off suitably.
The filtrate water from the filter press is again recycled to equalization tank by means of a sump pump.
DESIGN DETAILS
A. BAR SCREEN
In the incoming channel, a chamber with bar screen of stainless screen shall be fitted, the purpose of which
is to filter out coarse trashy matter from introducing into succeeding units of the treatment plant.
Flow to Bar Screen Chamber = 8.75 cum/hr
Peak flow to Bar Screen Chamber (PF -2.5) = 22 cum/hr
Velocity through Screen = 0.6 m/s
Net Area of Screen = 22 / (3600 X velocity through screen)
= 22 / (3600 X 0.6)
= 0.0102 m2
Adopting screens with flats of 5 mm thick and 10 mm opening,
Gross area = (0.0102 X 10)/5= 0.0204 m2.
Assuming that the inclination of screen to horizontal is at 60 degrees the gross area of screen needed
= (0.0204)/ Sin 60
Screen area will be = 0.0235 m2
Tank of dimension to be provided = 1.8 m x 0.5 m x 0.5 m (SWD)
B. OIL & GREASE CHAMBER
Peak flow to the chamber = 22 cum/hr
Retention Time = 0.104 Hr= 6.2 min
Volume of the tank to be provided = 2.3 m3
Tank of dimension to be provided = 3.65 m x 0.5 m x 1.3 m, SWD.

Kothnur Property STP Technical Write Up
Sobha Limited. Page 7 of 11
C. EQUALIZATION TANK
Peak flow to the Tank = 22 cum/hr
Detention Time = 4.7 hrs
Volume of the tank to be provided = 105 m3
Tank of dimension to be provided = 5.55 m x 6.35 m x 3.0 m, SWD.
D. ANOXIC TANK (Providing 2 Streams of flow)
Flow to Anoxic Zone Tank = 8.75 m3/hr
Detention Time = 2 hrs
Volume of the tank provided = 15.0 m3
Dimension of the Tank provided = 2.6 m X 1.6 m X 3.8 m, SWD.
E. AERATION TANK
Flow to Aeration Tank = 8.75 m3/hr
Detention Time = 14.4 hrs
Volume of the Tank provided = 126 m3
Dimension of the tank = 10.0 m X 3.60 m x 3.6 m, SWD.
Air Requirement:
Flow : 210 m3/ day
Inlet BOD : 350 mg/l or 350 g/cum or 0.35 kg/cum
BOD Load : 210 cum/d X 0.35 kg/cum
Total BOD : 73.5 kg/day
O2 required : 1.8 kg/kg of BOD
Total O2 required : 132.3 kg/day
: 5.5 Kgs/hr
Air required : 5.5 kg of Oxygen/ hr
1.2* x 0.232 ** x 0.65 *** x 0.95 **** 0.23 *****
: 139.10 m3/hr
Air Requirement in Equalization Tank = 0.015 m3/ min * Volume of Equalization Tank
= 0.015 * 105
= 94.5 m3/hr
Air Requirement in Sludge Holding Tank = 0.015 m3/ min * Volume of SHT
= 0.015 m3/min * 35
= 31.5 m3/hr

Kothnur Property STP Technical Write Up
Sobha Limited. Page 8 of 11
F. SECONDARY SETTLING TANK
Flow to Tank = 8.75 m3/hr
Detention time = 4.11 hrs
Volume of the tank provided = 36 m3
Dimension of the tank = 3.5 m X 3.5 m X 3.0 m, SWD.
G. CLARIFIED WATER TANK
Flow = 22 m3/hr
Detention time = 4 hrs
Volume of the tank provided = 85 m3
Dimension of the tank = 5.55 m X 6.375 m x 2.4 m, SWD
H. PRESSURE SAND FILTER Design Flow = 22 m3/hr
Velocity of percolation through Filter = 15 m2/ m3/hr
Size of PSF = 1.0 m dia X 2.0 m HOS
Quantity = 1 No.
I. ACTIVATED CARBON FILTER
Design Flow = 22 m3/hr
Velocity of percolation through Filter = 15 m2/ m3/hr
Size of PSF = 1.0 m dia X 2.0 m HOS
Quantity = 1 No.
J. HYPO DOSING
Hypo dosing pump = 0-6 lph
Capacity = 100 Lts.
K. SLUDGE HOLDING TANK
Sludge Volume = 2 % of total flow
= 4.2 m3/day
Detention Time = 5.2 Days ≈ 5 Days
Volume of the tank = 22 m3
Dimension of the tank = 3.5 m x 1.75 m X 3.6 m, SWD

Kothnur Property STP Technical Write Up
Sobha Limited. Page 9 of 11
L.TREATED WATER TANK - 01
Flow = 22 m3/hr
Detention Time = 7 hrs
Volume of the Tank = 158 m3
Dimension of the tank provided = 7.0 m X 6.3 m x 3.6 m, SWD
M. ULTRA FILTRATION
Flow = 63 m3/d (30% of total flow)
Hours of operation = 20 hrs
Filtration Rate = 3.15 m3/ hr
N. TREATED WATER TANK - 02
Flow = 63 m3/hr
Detention Time = 1 hrs
Volume of the Tank = 69 m3
Dimension of the tank provided = 7.0 m X 2.75 m x 3.6 m, SWD
O. COLLECTION PIT
Volume of the tank = 1 m3
Tank Size = 1 m X1.0 m x 1.0 m, SWD
Quantity = 1 No.

Kothnur Property STP Technical Write Up
Sobha Limited. Page 10 of 11
STP SPECIFICATIONS ARE SUMMARIZED AS FOLLOWS
SL.
No.
Description
Qty
Dimension MOC
1 Bar Screen Chamber 1 1.8 m x 0.5 m x 0.5 m, SWD RCC
2 Oil & Grease Chamber 1 3.65 m x 0.5 m x 1.3 m, SWD RCC
3 Equalization Tank 1 5.55 m x 6.35 m x 3.0 m, SWD RCC
4 Anoxic zone tank 2 2.6 m X 1.6 m X 3.8 m, SWD RCC
5 Aeration tank 1 10.0 m X 3.60 m x 3.6 m, SWD RCC
6 Secondary Settling Tank
1 3.5 m X 3.5 m X 3.0 m, SWD RCC
7 Clarified Water Tank 1 5.55 m X 6.375 m x 2.4 m, SWD RCC
8 Sludge Holding Tank 1 3.5 m x 1.75 m X 3.6 m, SWD RCC
9 Treated Water Tank – I 1 7.0 m X 6.3 m x 3.6 m, SWD RCC
10 Treated Water Tank - II 1 7.0 m X 2.75 m x 3.6 m, SWD RCC
11 Collection Pit 1 1 m X1.0 m x 1.0 m, SWD RCC
Kothnur Property STP Technical Write Up
Sobha Limited. Page 11 of 11
Equalization Tank
Sewage Generation
Aeration Tank
Settling Tank
Clarified
Water Tank
Activated
Carbon Filter
Pressure Sand Filter
Sludge Digestion
Tank
Filter Press for Sludge Drying
Dried Sludge as Fertilizer to Garden
Sludge Recirculation line
Sludge Drain line
Filter Press Feed
Pump (Screw Pump)
Filter Feed Pump
Blower
BSC
Treated Water Tank - 01
Treated Water Tank 02
O & G
Gardening
Sodium
Hypochlorite Dosing System
For Flushing OHT
Anoxic Tank
Ultra Filtration
STP FLOW DIAGRAM

39
Annexure 1(f): Traffic volume

PREPARED BY,
M/s. CONSORTIA OF INFRASTRUCTURE ENGINEERS
VIJAYANAGAR, BENGALURU-40
EMAIL: [email protected]
TRAFFIC IMPACT ASSESSMENT STUDIESFOR
PROPOSED
RESIDENTIAL DEVELOPMENT
AT
KOTHANUR VILLAGE, BANGALORE.
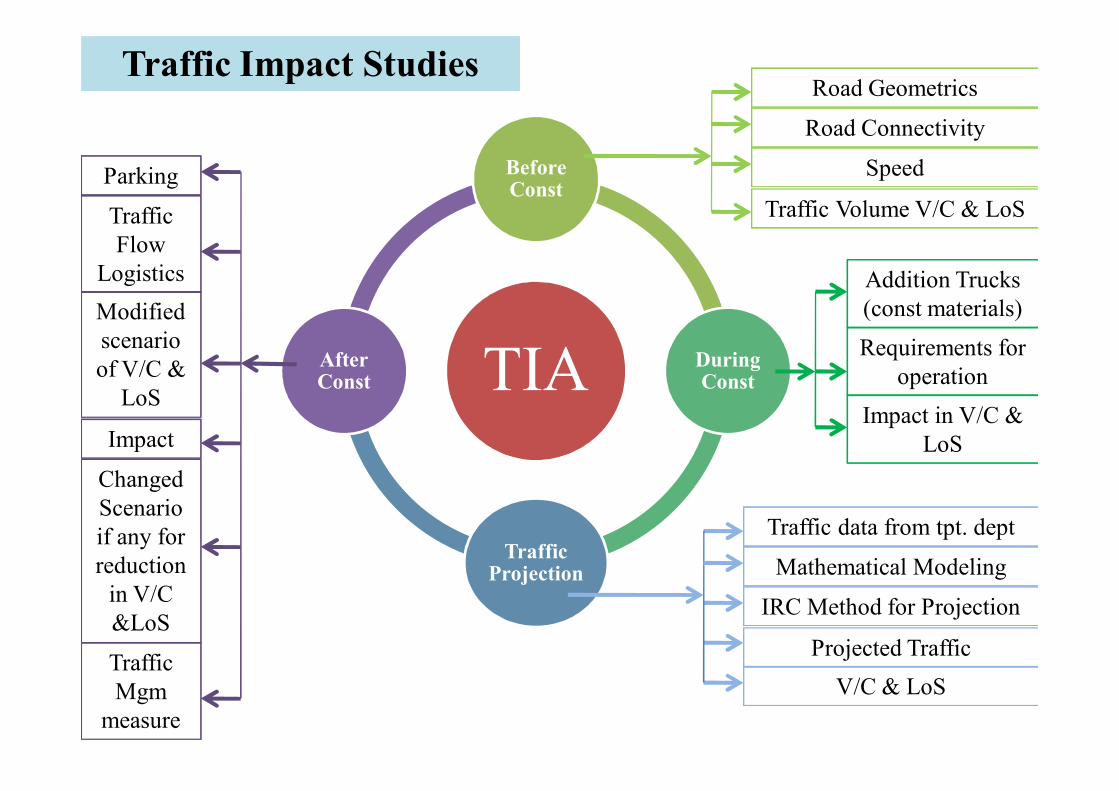
TIA
Before Const
During Const
Traffic Projection
After Const
Road Geometrics
Road Connectivity
Speed
Impact in V/C &
LoS
Addition Trucks
(const materials)
Requirements for
operation
Traffic data from tpt. dept
Mathematical Modeling
IRC Method for Projection
Projected Traffic
V/C & LoS
Modified
scenario
of V/C &
LoS
Parking
Traffic
Flow
Logistics
Impact
Changed
Scenario
if any for
reduction
in V/C
&LoS
Traffic
Mgm
measure
Traffic Impact Studies
Traffic Volume V/C & LoS

GOOGLE IMAGE

Ko
tha
nu
r M
ain
Rd
(2 l
an
es
un
div
ided
)
LOCATION MAP
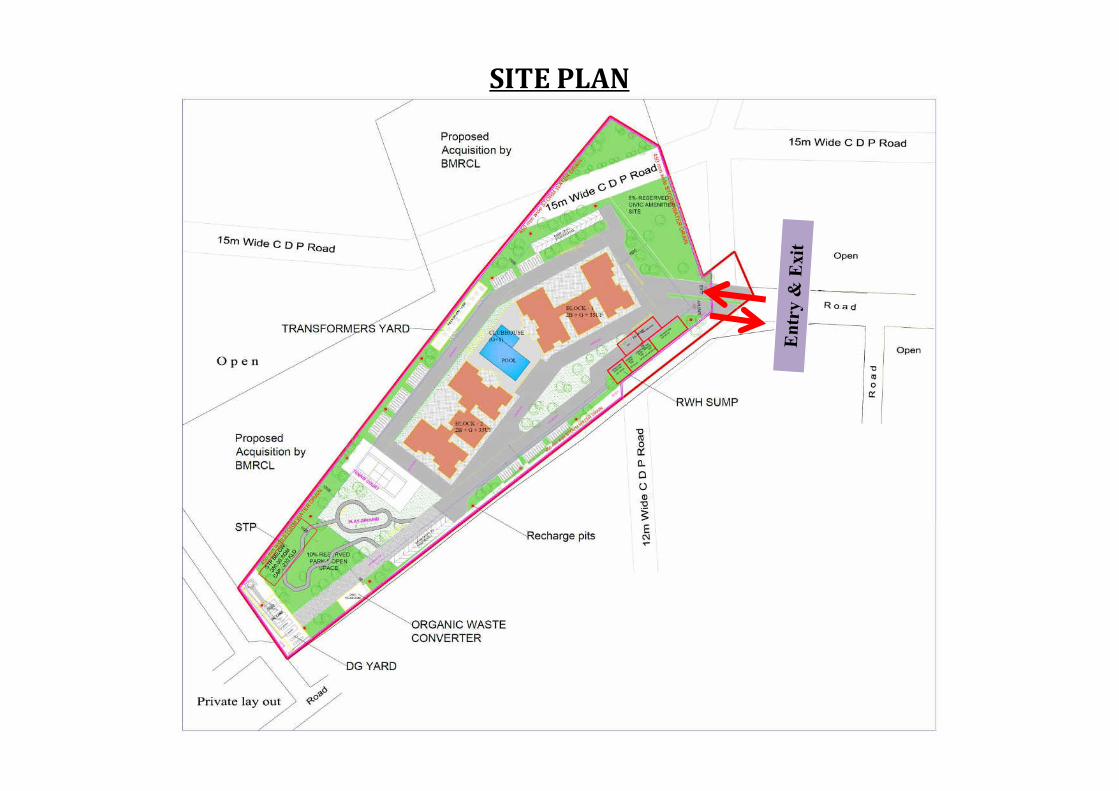
SITE PLAN

ROAD GEOMETRIC, CONNECTIVITY & TRAFFIC SCENARIO
The Project is located along 12 m Wide road and 6th main road.
The Entry/ Exit is given to 12 wide road. This road is yet to be formed at exist ing
location to12m wide road. This road is connected to 6th main road.
6th main is 2 lanes with 12m RoW undivided WBM road which connects to Kothanur
main road on one side and Bannerghattamain road on other side.
Bannerghatta main road is 24 m wide (2+2) lanes divided traffic flow which connects to
Jayanagar on one side and Gott igereon other side of the road.
Kothanur main road is having 13.5 m wide 2 lanes undivided road is connected to
Gott igereon one side and JP Nagar on other side of the road.
As per BDA-CDP, Bannerghatta main road is gett ing widened from 24m to 45 m, (3+3)
lanes MCW & (2+2) lanes SR, Foot path, Median etc...
As per BDA-CDP, Kothanur main road is gett ing widened from 13.5 m to 24 m, (2+2)
lanes CW, Foot path, Median etc...
All types of vehicles will move along the road as it is an ar ter ial road which connects
later to Yelahanka and Airpor t Road.
The project can also be accessed from other places of Bangalore city such as Jayanagar, J
P Nagar, Gott igere,Kothanur,Bannerghattaetc.,
Hence pressure will not develop to any one part icular road and traffic gets distr ibuted to
var ious roads as stated above.
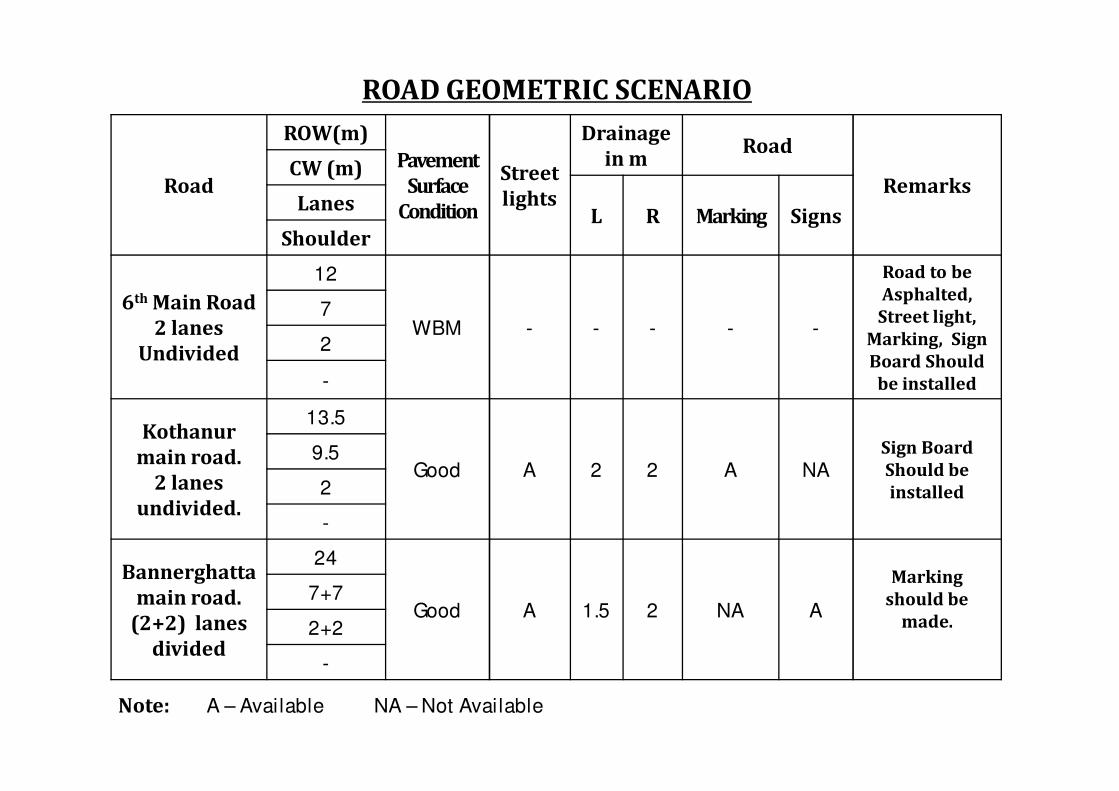
Note: A – Available NA – Not Available
Road
ROW(m)
Pavement
Surface
Condition
Street
lights
Drainage
in mRoad
RemarksCW (m)
L R Marking SignsLanes
Shoulder
6th Main Road
2 lanes
Undivided
12
WBM - - - - -
Road to be
Asphalted,
Street light,
Marking, Sign
Board Should
be installed
7
2
-
Kothanur
main road.
2 lanes
undivided.
13.5
Good A 2 2 A NASign Board
Should be
installed
9.5
2
-
Bannerghatta
main road.
(2+2) lanes
divided
24
Good A 1.5 2 NA A
Marking
should be
made.
7+7
2+2
-
ROAD GEOMETRIC SCENARIO

Photos of Study Road Date: 02.05.2018
Additional land for widening
Project Site
6th main road
Kothanur Rd. Bannerghatta
Rd.
Kothanur main road
Gottigere. J P Nagar.
6th main road
Kothanur Rd. Bannerghatta
Rd.
Kothanur main road
Gottigere. J P Nagar.
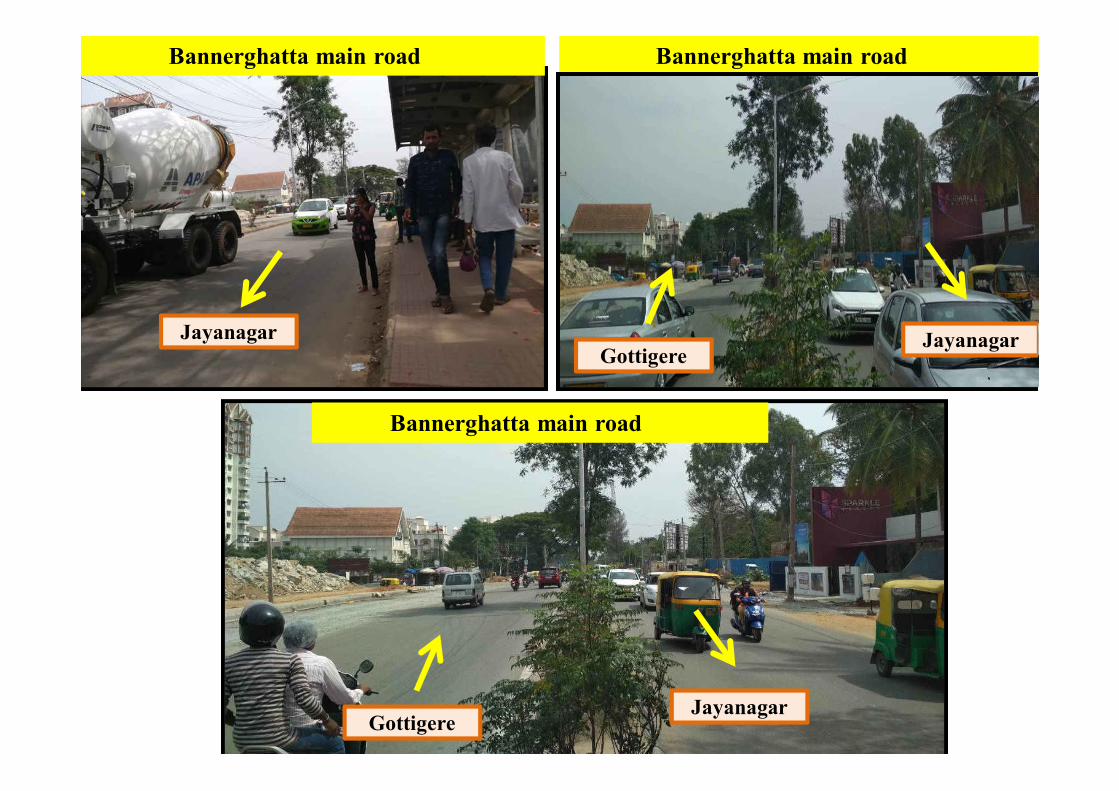
Bannerghatta main road Bannerghatta main road
Bannerghatta main road
GottigereJayanagar
GottigereJayanagarJayanagar

Road Towards2-Wh 3-Wh 4 Wh (C,J,V)
Buses/
Lorries
Max Min Max Min Max Min Max Min
6th main road 18 10 11 09 19 12 -
Kothanur road 32 23 20 17 36 21 26 16
Bannerghatta
Main Road
(2+2) lanes
divided
Jayanagar 39 18 23 15 41 18 29 12
Gottigere 42 20 25 13 42 22 31 17
The observed speed indicates that the vehicles are well within the speed limits and
hence the road safety is ensured par t icular ly in the case of highways.
SPEED SPECTRUM MEASURED IN (KMPH) FOR THE STUDY ROAD

REAL TIME TRAFFIC SCENARIO ALONG 6TH MAIN ROAD.(2 LANES)
Note: The highest peak observed is 288 PCU’s/hr as per IRC-106:1990 dur ing 6:00 pm to 7:00pm.
Time 2Wh 3Wh 4Wh B/L Total V/C
7:00-8:00am 83(42) 8(6) 67(67) 5(15) 163(130) 0.04
8:00-9:00 143(72) 11(8) 146(146) 7(21) 307(247) 0.07
9:00-10:00 237(119) 17(13) 103(103) 10(30) 367(264) 0.08
10:00-11:00 190(95) 8(6) 89(89) 9(27) 296(217) 0.07
4:00-5:00pm 116(58) 9(7) 64(64) 8(24) 197(153) 0.05
5:00-6:00 173(87) 18(14) 110(110) 10(30) 311(240) 0.07
6:00-7:00 204(102) 15(11) 127(127) 16(48) 362(288) 0.09
7:00-8:00 152(76) 11(8) 95(95) 12(36) 270(215) 0.07
The traffic projections are made as per IRC consider ing the vehicular growth taking place
from past 5 years.
The Socio-economic development that are taking place in the study area based on the
likelihood of land use activit iesand changes in transpor tat ion systems.
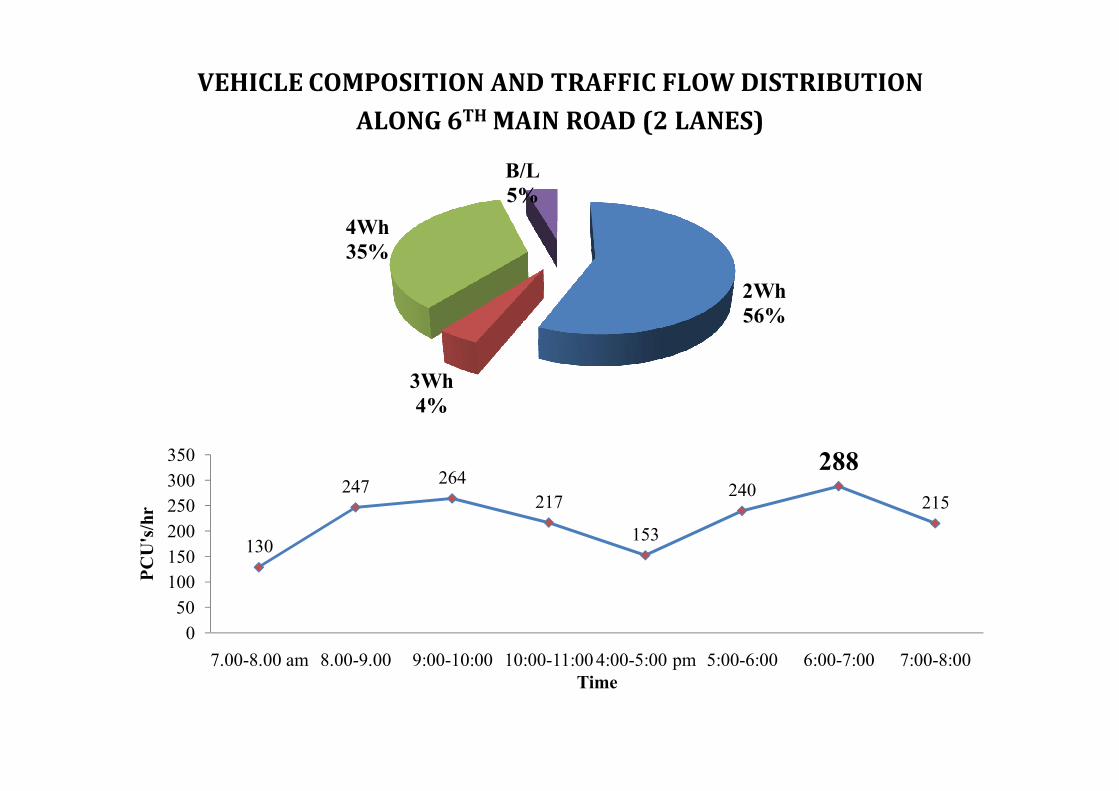
VEHICLE COMPOSITION AND TRAFFIC FLOW DISTRIBUTION
ALONG 6TH MAIN ROAD (2 LANES)
130
247264
217
153
240
288
215
0
50
100
150
200
250
300
350
7.00-8.00 am 8.00-9.00 9:00-10:00 10:00-11:00 4:00-5:00 pm 5:00-6:00 6:00-7:00 7:00-8:00
PC
U's
/hr
Time
2Wh
56%
3Wh
4%
4Wh
35%
B/L
5%

VARIATION OF V/C OVER STUDY PERIOD
0.04
0.070.08
0.07
0.05
0.07
0.09
0.07
0.00
0.01
0.02
0.03
0.04
0.05
0.06
0.07
0.08
0.09
0.10
7.00-8.00 am 8.00-9.00 9:00-10:00 10:00-11:00 4:00-5:00 pm 5:00-6:00 6:00-7:00 7:00-8:00
V/C
Time

REAL TIME TRAFFIC SCENARIO ALONG KOTHANUR MAIN ROAD (2 LANES)
Time 2Wh 3Wh 4Wh B/L Total V/C
7:00-8:00am 284(142) 19(14) 319(319) 26(78) 648(553) 0.25
8:00-9:00 345(173) 30(23) 438(438) 40(120) 853(753) 0.34
9:00-10:00 574(287) 43(32) 516(516) 51(153) 1184(988) 0.45
10:00-11:00 462(231) 35(26) 467(138) 46(138) 1010(862) 0.39
4:00-5:00pm 315(158) 21(16) 365(365) 27(81) 728(619) 0.28
5:00-6:00 427(214) 46(35) 419(419) 38(114) 930(781) 0.36
6:00-7:00 485(243) 24(18) 452(452) 63(189) 1024(902) 0.41
7:00-8:00 386(193) 27(20) 384(384) 33(99) 830(696) 0.32
Note: The highest peak observed is 988 PCU’s/hr as per IRC-106:1990 dur ing 9:00 am to 10:00 am.
The traffic projections are made as per IRC consider ing the vehicular growth taking place
from past 5 years.
The Socio-economic development that are taking place in the study area based on the
likelihood of land use activit iesand changes in transpor tat ion systems.

VEHICLE COMPOSITION AND TRAFFIC FLOW DISTRIBUTION ALONG
KOTHANUR MAIN ROAD. (2 LANES)
553
753
988862
619781
902
696
0
200
400
600
800
1000
1200
7.00-8.00 am 8.00-9.00 9:00-10:00 10:00-11:00 4:00-5:00 pm 5:00-6:00 6:00-7:00 7:00-8:00
PC
U's
/hr
Time
2Wh
48%
3Wh
4%
4Wh
44%
B/L
4%

VARIATION OF V/C OVER STUDY PERIOD
0.25
0.34
0.450.39
0.280.36
0.41
0.32
0.00
0.05
0.10
0.15
0.20
0.25
0.30
0.35
0.40
0.45
0.50
7.00-8.00 am 8.00-9.00 9:00-10:00 10:00-11:00 4:00-5:00 pm 5:00-6:00 6:00-7:00 7:00-8:00
V/C
Time
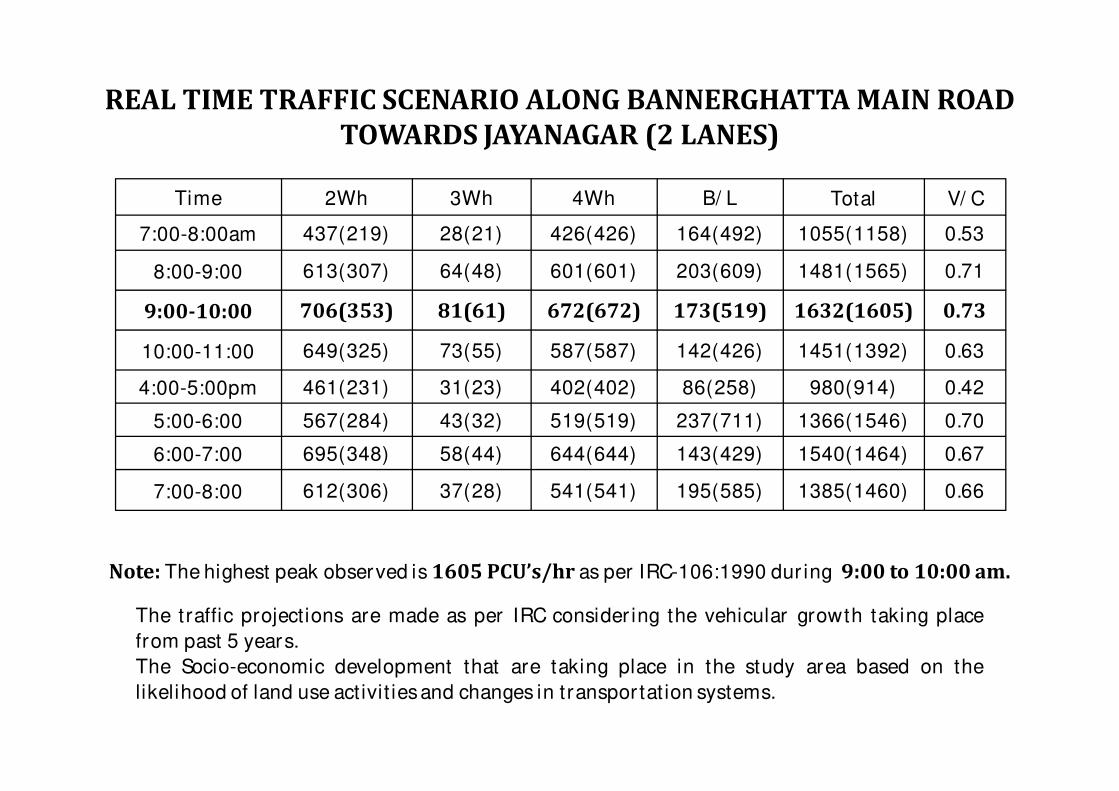
REAL TIME TRAFFIC SCENARIO ALONG BANNERGHATTA MAIN ROAD
TOWARDS JAYANAGAR (2 LANES)
Time 2Wh 3Wh 4Wh B/ L Total V/ C
7:00-8:00am 437(219) 28(21) 426(426) 164(492) 1055(1158) 0.53
8:00-9:00 613(307) 64(48) 601(601) 203(609) 1481(1565) 0.71
9:00-10:00 706(353) 81(61) 672(672) 173(519) 1632(1605) 0.73
10:00-11:00 649(325) 73(55) 587(587) 142(426) 1451(1392) 0.63
4:00-5:00pm 461(231) 31(23) 402(402) 86(258) 980(914) 0.42
5:00-6:00 567(284) 43(32) 519(519) 237(711) 1366(1546) 0.70
6:00-7:00 695(348) 58(44) 644(644) 143(429) 1540(1464) 0.67
7:00-8:00 612(306) 37(28) 541(541) 195(585) 1385(1460) 0.66
Note: The highest peak observed is 1605 PCU’s/hr as per IRC-106:1990 dur ing 9:00 to 10:00 am.
The traffic projections are made as per IRC consider ing the vehicular growth taking place
from past 5 years.
The Socio-economic development that are taking place in the study area based on the
likelihood of land use activit iesand changes in transpor tat ion systems.
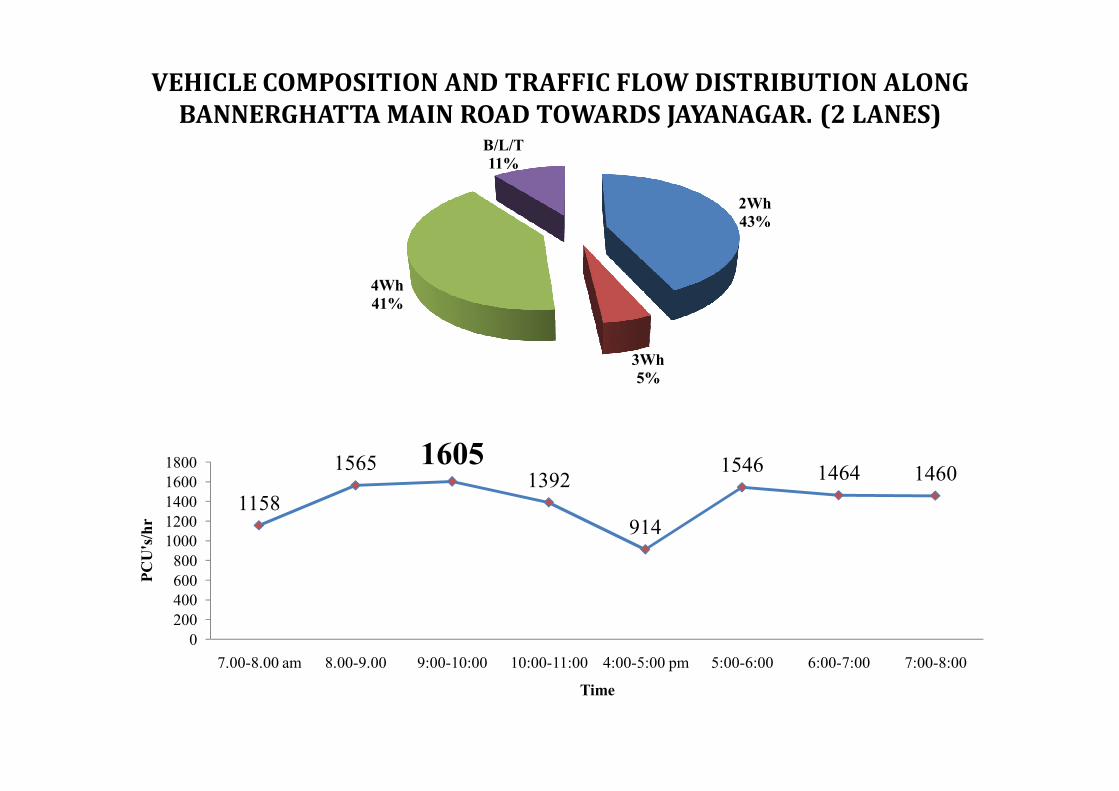
VEHICLE COMPOSITION AND TRAFFIC FLOW DISTRIBUTION ALONG
BANNERGHATTA MAIN ROAD TOWARDS JAYANAGAR. (2 LANES)
1158
1565 16051392
914
1546 1464 1460
0
200
400
600
800
1000
1200
1400
1600
1800
7.00-8.00 am 8.00-9.00 9:00-10:00 10:00-11:00 4:00-5:00 pm 5:00-6:00 6:00-7:00 7:00-8:00
PC
U's
/hr
Time
2Wh
43%
3Wh
5%
4Wh
41%
B/L/T
11%

VARIATION OF V/C OVER STUDY PERIOD
0.53
0.71
0.73
0.63
0.42
0.70 0.67 0.66
0.00
0.10
0.20
0.30
0.40
0.50
0.60
0.70
0.80
0.90
1.00
7.00-8.00 am 8.00-9.00 9:00-10:00 10:00-11:00 4:00-5:00 pm 5:00-6:00 6:00-7:00 7:00-8:00
V/C
Time

REAL TIME TRAFFIC SCENARIO ALONG BANNERGHATTA MAIN ROAD
TOWARDS GOTTIGERE (2 LANES)
Time 2Wh 3Wh 4Wh B/ L Total V/ C
7:00-8:00am 388(194) 35(26) 406(406) 73(219) 902(845) 0.38
8:00-9:00 741(371) 48(36) 591(591) 156(468) 1536(1466) 0.67
9:00-10:00 679(340) 84(63) 682(682) 137(411) 1582(1496) 0.68
10:00-11:00 569(285) 51(38) 563(563) 118(354) 1301(1240) 0.56
4:00-5:00pm 425(213) 38(29) 487(487) 84(252) 1034(980) 0.45
5:00-6:00 667(334) 59(44) 718(718) 105(315) 1549(1411) 0.64
6:00-7:00 719(360) 78(59) 649(649) 164(492) 1610(1559) 0.71
7:00-8:00 643(322) 64(48) 584(84) 145(435) 1436(1389) 0.63
Note: The highest peak observed is 1559 PCU’s/hr as per IRC-106:1990 dur ing 6:00 to 7:00 pm.
The traffic projections are made as per IRC consider ing the vehicular growth taking place
from past 5 years.
The Socio-economic development that are taking place in the study area based on the
likelihood of land use activit iesand changes in transpor tat ion systems.
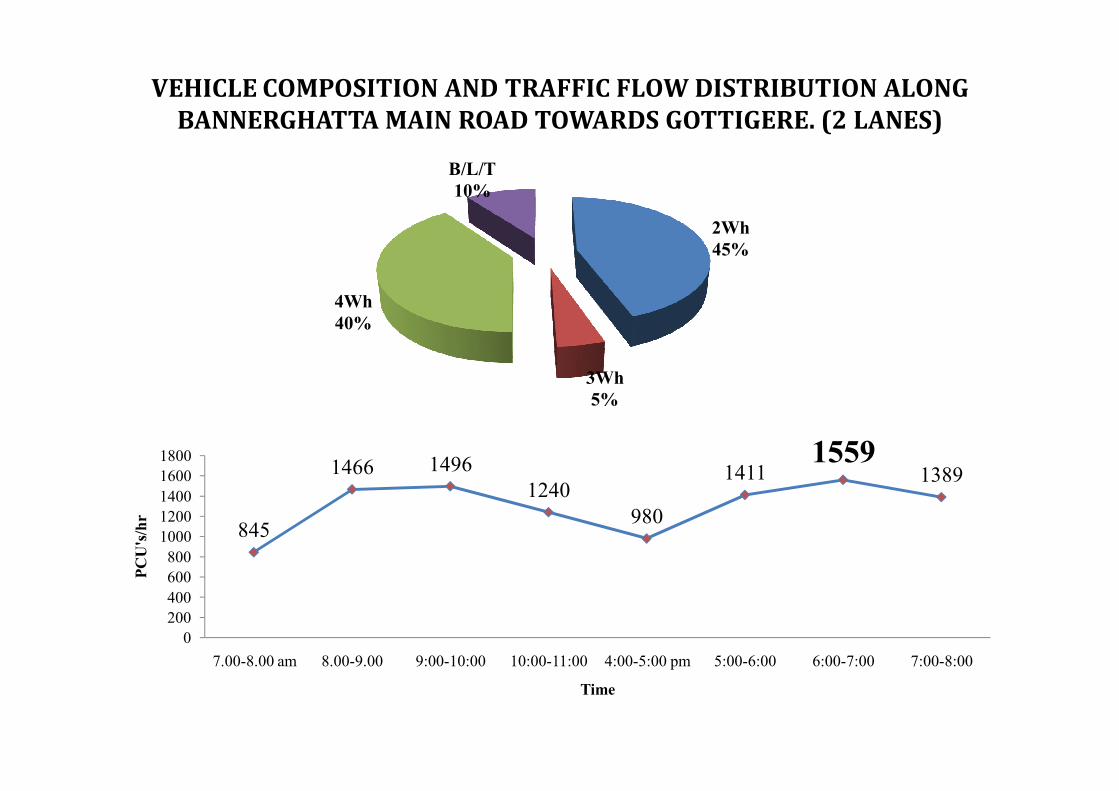
VEHICLE COMPOSITION AND TRAFFIC FLOW DISTRIBUTION ALONG
BANNERGHATTA MAIN ROAD TOWARDS GOTTIGERE. (2 LANES)
845
1466 1496
1240
980
14111559
1389
0
200
400
600
800
1000
1200
1400
1600
1800
7.00-8.00 am 8.00-9.00 9:00-10:00 10:00-11:00 4:00-5:00 pm 5:00-6:00 6:00-7:00 7:00-8:00
PC
U's
/hr
Time
2Wh
45%
3Wh
5%
4Wh
40%
B/L/T
10%

VARIATION OF V/C OVER STUDY PERIOD
0.38
0.67 0.68
0.56
0.45
0.64
0.71
0.63
0.00
0.10
0.20
0.30
0.40
0.50
0.60
0.70
0.80
0.90
1.00
7.00-8.00 am 8.00-9.00 9:00-10:00 10:00-11:00 4:00-5:00 pm 5:00-6:00 6:00-7:00 7:00-8:00
V/C
Time

Road Towards V C Existing V/C LOS
6th main road
2 lanes undivided288 2200 0.13 A
Kothanur main road
2 lanes undivided988 2200 0.45 C
Bannerghatta Main
Road
(2+2) lanes divided
Jayanagar 1605 2200 0.73 D
Gottigere 1559 2200 0.71 D
REAL TIME TRAFFIC SCENARIO FOR STUDY ROADS
V= Volume in PCU’s/hr & C= Capacity in
PCU’s/ hr LOS = Level of Service
V/C LOS Performance
0.0 - 0.2 A Excellent
0.2 - 0.4 B Very Good
0.4 - 0.6 C Good
0.6 - 0.8 D Fair / Average
0.8 - 1.0 E Poor
1.0& Above F Very Poor
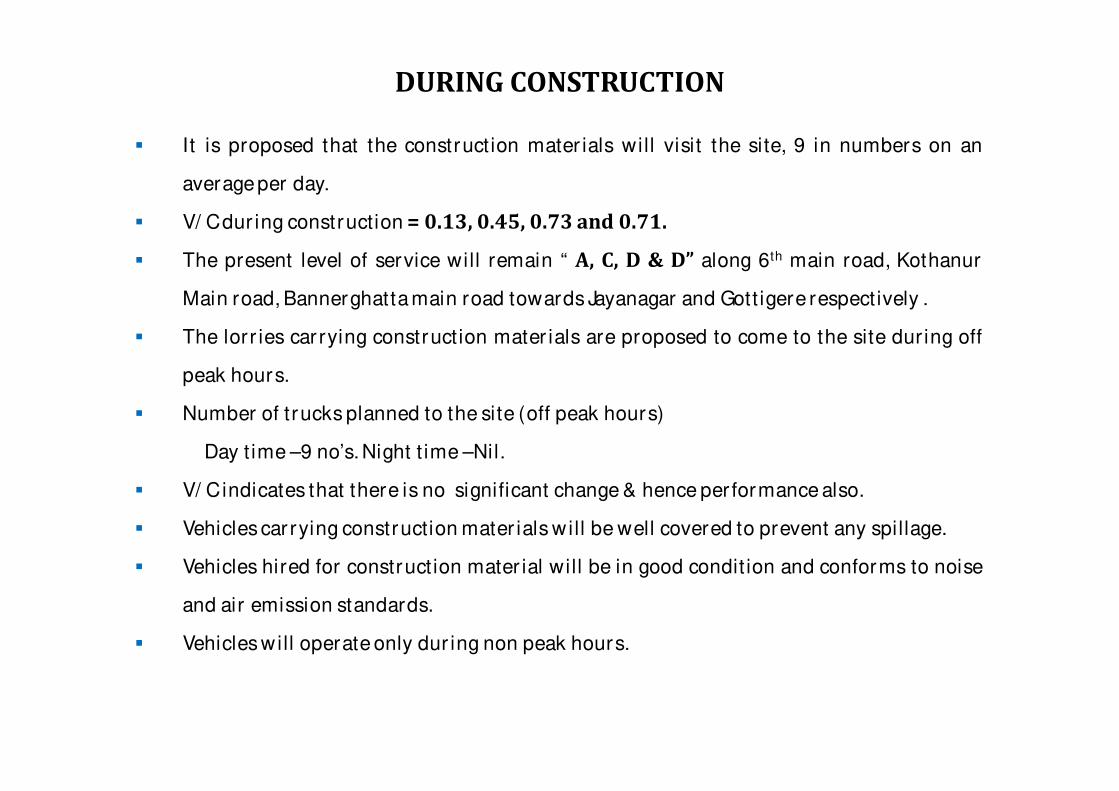
It is proposed that the construction mater ials will visit the site, 9 in numbers on an
averageper day.
V/ Cdur ing construction = 0.13, 0.45, 0.73 and 0.71.
The present level of service will remain “ A, C, D & D” along 6th main road, Kothanur
Main road, Bannerghattamain road towards Jayanagar and Gott igere respectively .
The lorr ies car rying construction mater ials are proposed to come to the site dur ing off
peak hours.
Number of trucks planned to the site (off peak hours)
Day time –9 no’s.Night t ime –Nil.
V/ Cindicates that there is no significant change & hence per formance also.
Vehicles car rying construction mater ials will be well covered to prevent any spillage.
Vehicles hired for construction mater ial will be in good condit ion and conforms to noise
and air emission standards.
Vehicles will operate only dur ing non peak hours.
DURING CONSTRUCTION

Activity Units Total No.s
Residential 280 284
10% visitors Parking 28
Club House (1/ 50 Sq. m) 30
Total no. of cars required 338
Sl no. Levels Total No’s
1 Basement level -1 225
2 Basement level -2 225
3 Stilt Covered at Ground Level -
4 Sur face Parking 45
Total 495
PARKING LOGISTICS
Parking required
Parking provided
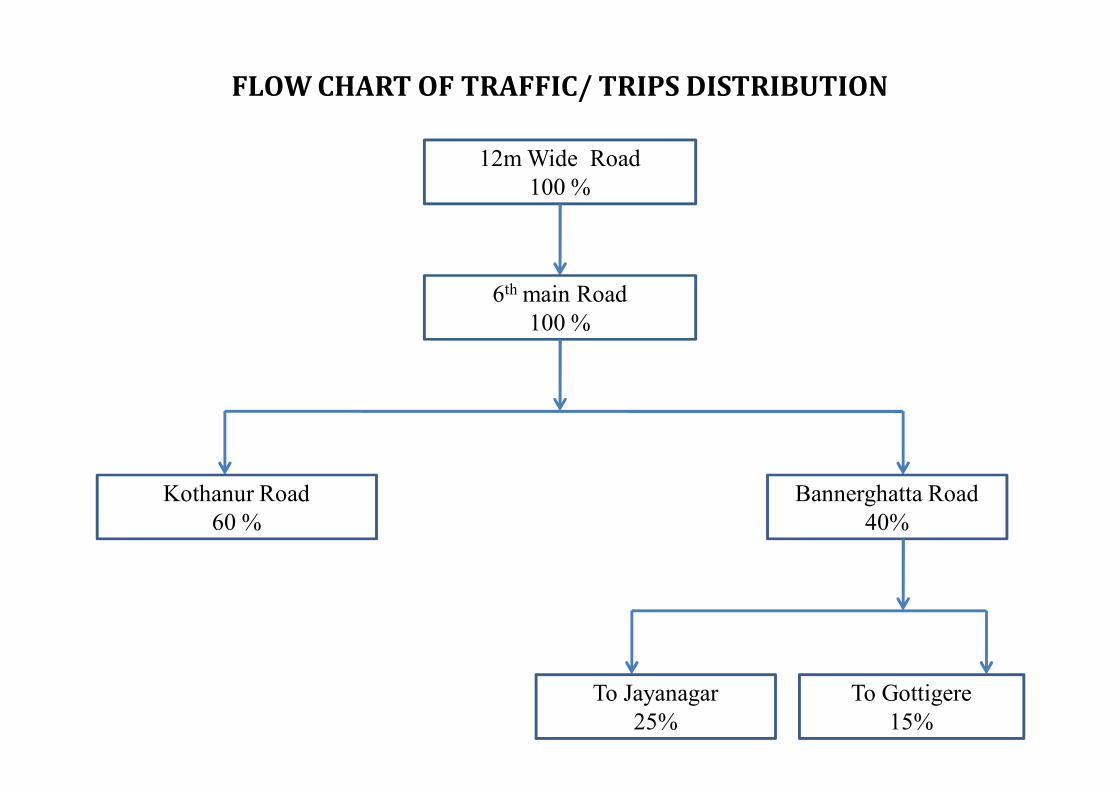
FLOW CHART OF TRAFFIC/ TRIPS DISTRIBUTION
12m Wide Road
100 %
Bannerghatta Road
40%
Kothanur Road
60 %
6th main Road
100 %
To Jayanagar
25%
To Gottigere
15%
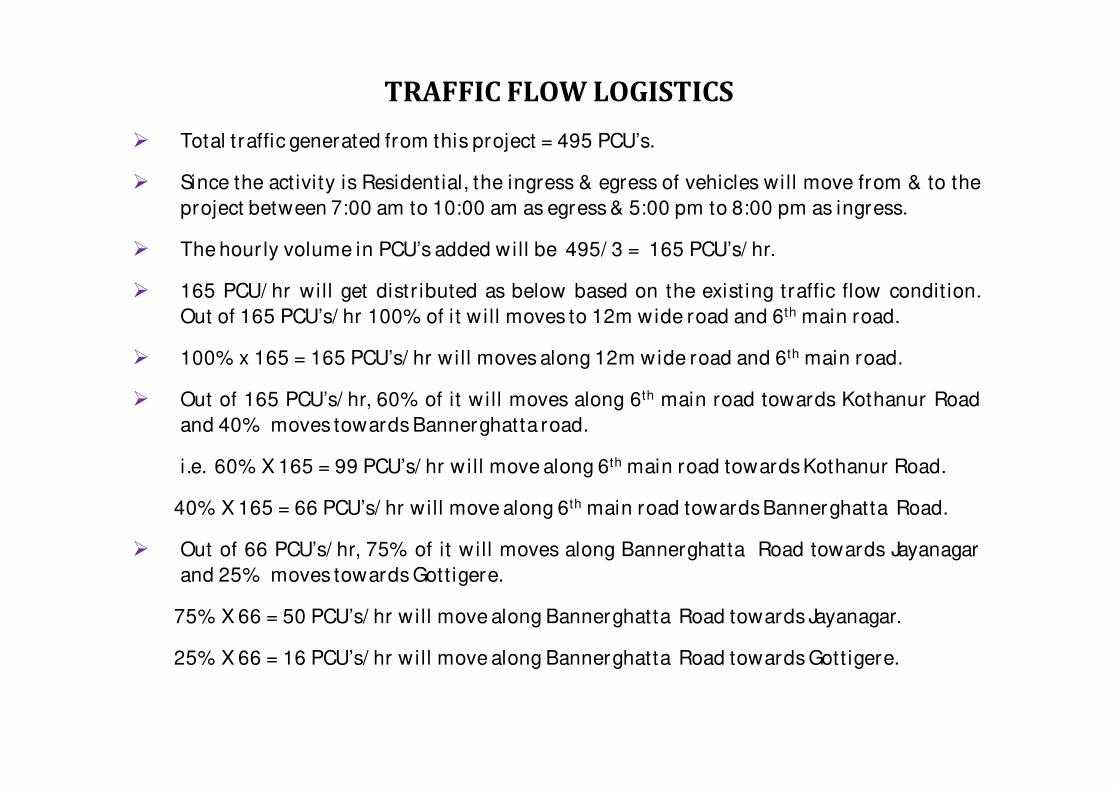
Total traffic generated from this project = 495 PCU’s.
Since the activity is Residential, the ingress & egress of vehicles will move from & to the
project between 7:00 am to 10:00 am as egress & 5:00 pm to 8:00 pm as ingress.
The hour ly volume in PCU’s added will be 495/ 3 = 165 PCU’s/ hr.
165 PCU/ hr will get distr ibuted as below based on the exist ing traffic flow condit ion.
Out of 165 PCU’s/ hr 100% of it will moves to 12m wide road and 6th main road.
100% x 165 = 165 PCU’s/ hr will moves along 12m wide road and 6th main road.
Out of 165 PCU’s/ hr, 60% of it will moves along 6th main road towards Kothanur Road
and 40% moves towards Bannerghatta road.
i.e. 60% X 165 = 99 PCU’s/ hr will move along 6th main road towards Kothanur Road.
40% X 165 = 66 PCU’s/ hr will move along 6th main road towards Bannerghatta Road.
Out of 66 PCU’s/ hr, 75% of it will moves along Bannerghatta Road towards Jayanagar
and 25% moves towards Gott igere.
75% X 66 = 50 PCU’s/ hr will move along Bannerghatta Road towards Jayanagar.
25% X 66 = 16 PCU’s/ hr will move along Bannerghatta Road towards Gott igere.
TRAFFIC FLOW LOGISTICS

CHANGED V/C & LOS AFTER ADDING THE GENERATED
TRAFFIC TO EXISTING TRAFFIC
Road TowardsExisting Traffic
Changed V/C and LoS after adding
generated traffic
V C V/C LOS V C V/C LOS
6th main road
2 lanes undivided288 2200 0.13 A
288+165 =
4532200 0.21 B
Kothanur main road
2 lanes undivided988 2200 0.45 C
988+99 =
10872200 0.49 C
Bannerghatta
Main Road
(2+2) lanes
divided
Jayanagar 1605 2200 0.73 D1605+50 =
16552200 0.75 D
Gottigere 1559 2200 0.71 D1559+16 =
15752200 0.72 D
Note: Vehicle generated from the project do not change the level of service.

PEDESTRIAN FLOW MANAGEMENT & SAFETY
Pedestr ians are considered as most Vulnerable Road Users (VRU) as the accidents are
increasing on pedestr ians. Hence pedestr ians safety must be considered as top pr ior ity
in traffic engineer ing.
As per IRC, a minimum of 1.8 m wide neatly paved, well i lluminated and leveled
footpath must be made available for pedestr ians.
The under ground drain is covered by slabs and used for pedestr ian movement .
Presently due to very less pedestr ians use the footpath being a highway, hence the they
are very safe.
12 m wide road is gett ing widened to 12 m as said ear lier and 1.8 m on either side will
be given for remaining 8.4 m will be considered for 2 lanes.
This width can accommodate1890 ped/ hr in each direction of footpath.

RECOMMENDED PEDESTRIAN SIDE WALK CAPACITY
AND LEVEL OF SERVICE (IRC 103-2012)
Width of side
walk in
(meter)
Design Flow in number of Person per hour
In Both Direction All in one direction
LOS B LOS C LOS B LOS C
1.8 1350 1890 2025 2835
2.0 1800 2520 2700 3780
2.5 2250 3150 3375 4725
3.0 2700 3780 4050 5670
3.5 3150 4410 4725 6615
4.0 3600 5040 5400 7560
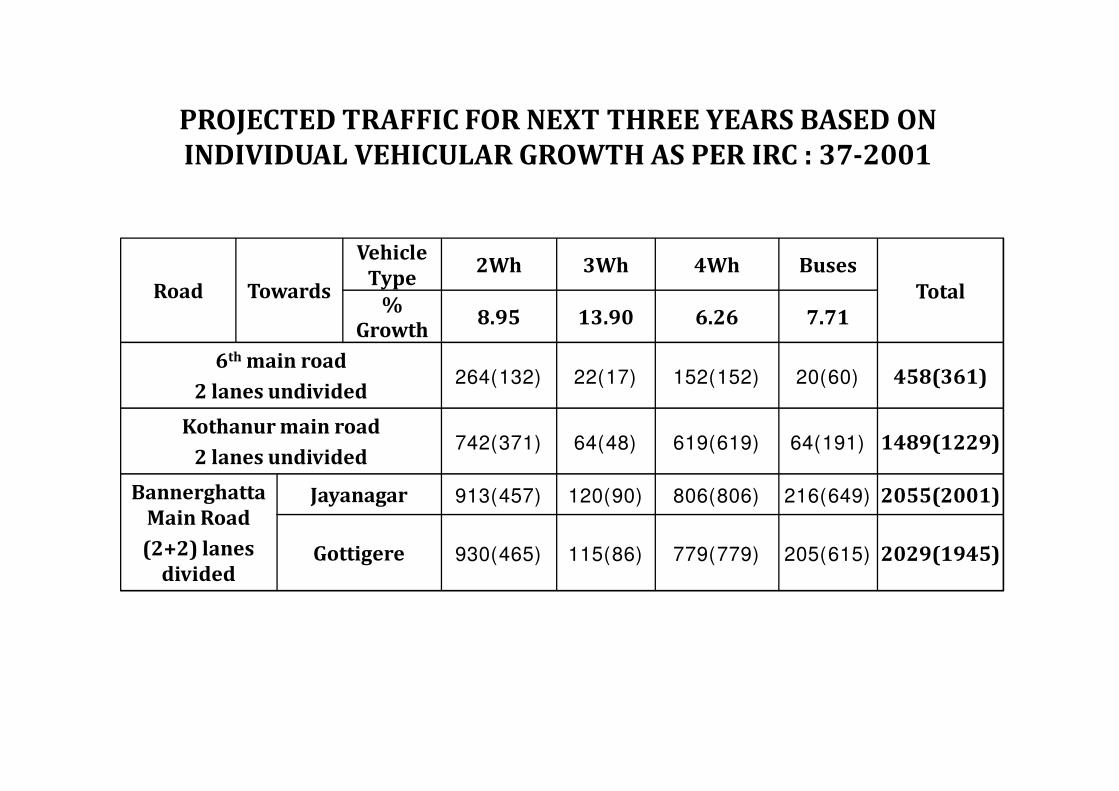
PROJECTED TRAFFIC FOR NEXT THREE YEARS BASED ON
INDIVIDUAL VEHICULAR GROWTH AS PER IRC : 37-2001
Road Towards
Vehicle
Type2Wh 3Wh 4Wh Buses
Total%
Growth8.95 13.90 6.26 7.71
6th main road
2 lanes undivided264(132) 22(17) 152(152) 20(60) 458(361)
Kothanur main road
2 lanes undivided742(371) 64(48) 619(619) 64(191) 1489(1229)
Bannerghatta
Main Road
(2+2) lanes
divided
Jayanagar 913(457) 120(90) 806(806) 216(649) 2055(2001)
Gottigere 930(465) 115(86) 779(779) 205(615) 2029(1945)
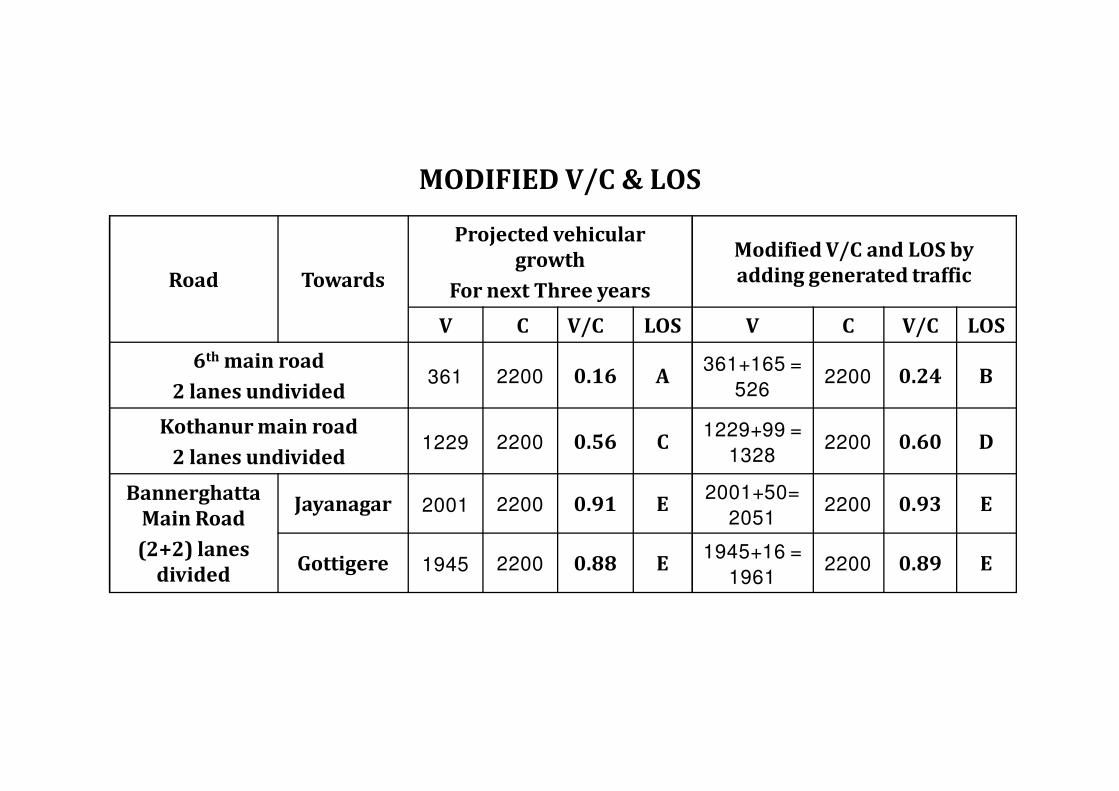
Road Towards
Projected vehicular
growth
For next Three years
Modified V/C and LOS by
adding generated traffic
V C V/C LOS V C V/C LOS
6th main road
2 lanes undivided361 2200 0.16 A
361+165 =
5262200 0.24 B
Kothanur main road
2 lanes undivided1229 2200 0.56 C
1229+99 =
13282200 0.60 D
Bannerghatta
Main Road
(2+2) lanes
divided
Jayanagar 2001 2200 0.91 E2001+50=
20512200 0.93 E
Gottigere 1945 2200 0.88 E1945+16 =
19612200 0.89 E
MODIFIED V/C & LOS

BDA-CDP MAP
45m
45m
24m
24m
15m
12mKo
tha
nu
r M
ain
Rd
(2 l
an
es
un
div
ided
)

Road Towards
Modified V/C and LOS by
adding generated traffic
Changed Scenario – 1
Road Widening
V C V/C LOS V C V/C LOS
6th main road
2 lanes undivided526 2200 0.24 B -
Kothanur main road
2 lanes undivided1328 2200 0.60 D 1328 4400 0.30 B
Bannerghatta
Main Road
(2+2) lanes
divided
Jayanagar 2051 2200 0.93 E 2051 5500 0.37 B
Gottigere 1961 2200 0.89 E 1961 5500 0.36 B
Cond….

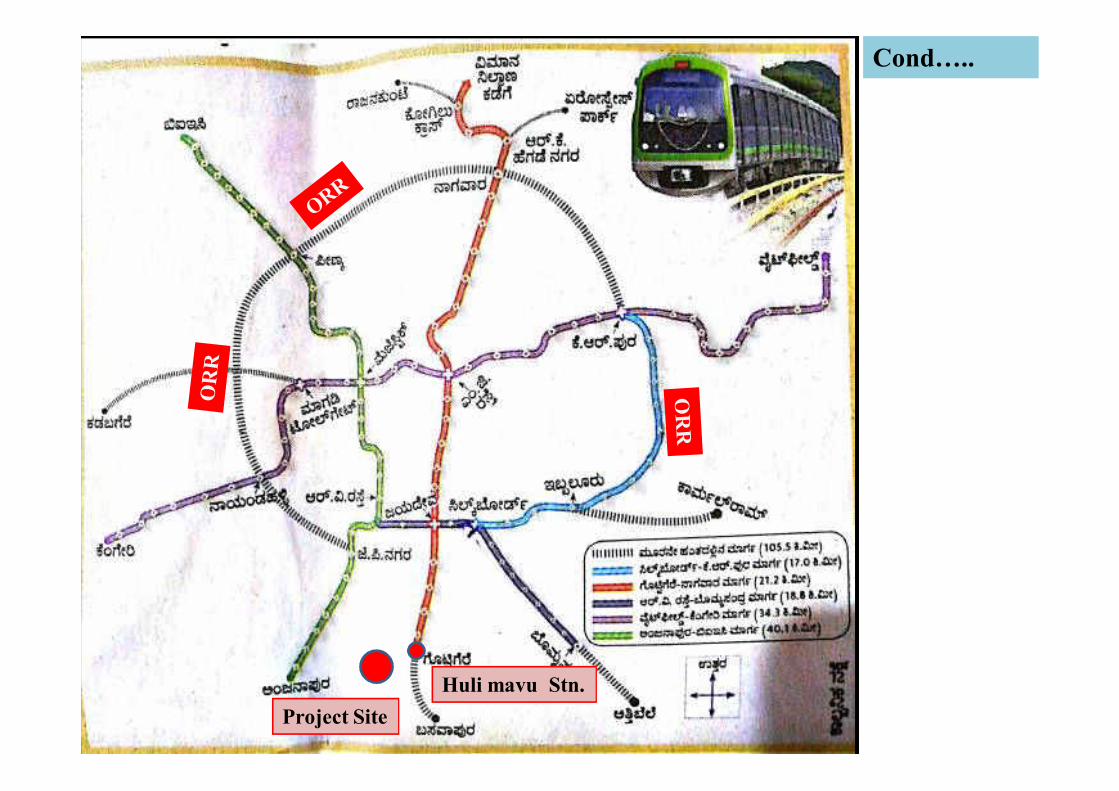
CHANGED SCENARIO (INTRODUCING NAMMA METRO)
Huli mavu Stn.
Project Site
Cond…..
Project Site
Huli mavu Stn.
Cond…..
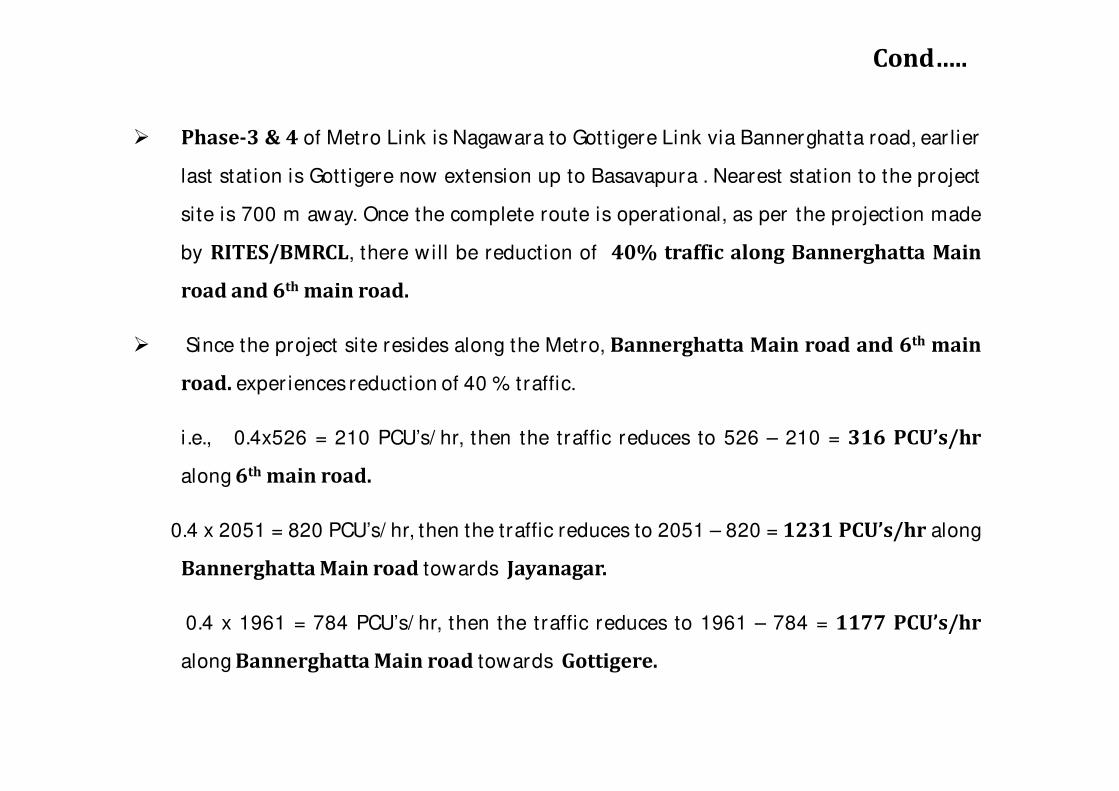
Phase-3 & 4 of Metro Link is Nagawara to Gott igere Link via Bannerghatta road, ear lier
last stat ion is Gott igere now extension up to Basavapura . Nearest stat ion to the project
site is 700 m away. Once the complete route is operational, as per the projection made
by RITES/BMRCL, there will be reduction of 40% traffic along Bannerghatta Main
road and 6th main road.
Since the project site resides along the Metro, Bannerghatta Main road and 6th main
road. exper iencesreduction of 40 % traffic.
i.e., 0.4x526 = 210 PCU’s/ hr, then the traffic reduces to 526 – 210 = 316 PCU’s/hr
along 6th main road.
0.4 x 2051 = 820 PCU’s/ hr, then the traffic reduces to 2051 – 820 = 1231 PCU’s/hr along
Bannerghatta Main road towards Jayanagar.
0.4 x 1961 = 784 PCU’s/ hr, then the traffic reduces to 1961 – 784 = 1177 PCU’s/hr
along Bannerghatta Main road towards Gottigere.

Road Towards
Changed Scenario -1
After road widening.
Changed Scenario-2
Introducing Metro Rail
V C V/C LOS V C V/C LOS
6th main road
2 lanes undivided- 316 2200 0.14 A
Kothanur main road
2 lanes undivided1328 4400 0.30 B Not Impacted
Bannerghatta
Main Road
(2+2) lanes
divided
Jayanagar 2051 5500 0.37 B 820 5500 0.15 A
Gottigere 1961 5500 0.36 B 784 5500 0.14 A
Cond…..

CONSOLIDATED V/C & LOS FOR CHANGED SCENARIO
Road Towards
Existing
traffic
Changed by
adding the
generated
traffic from
the project
Projected
traffic for
next Three
years
Modified by
adding the
generated
traffic from
the project
Changed
Scenario-1
After road
widening
Changed
Scenario-2
Metro
operational
V/C LOS V/C LOS V/C LOS V/C LOS V/C LOS V/C LOS
6th Main Rd 0.13 A 0.21 B 0.16 A 0.24 B - 0.14 A
Kothanur main road 0.45 C 0.49 C 0.56 C 0.60 D 0.30 B -
Bannerghatta
Main Road
Jayanagar 0.73 D 0.75 D 0.91 E 0.93 E 0.37 B 0.15 A
Gottigere 0.71 D 0.72 D 0.88 E 0.89 E 0.36 B 0.14 A

TRAFFIC AND PEDESTRIAN MANAGEMENT IN FRONT
OF THE PROJECT SITE

TRAFFIC MANAGEMENT MEASURES & INTERVENTIONS
From the Project site entry/ Exit given to 12m wide road but road is Yet to be formed.
As per BDA-CDP map, Bannerghatta Main road is gett ing widened to 45m, is having
(3+3) Lanes MCW and (2+2) lanes SR with a central median, shoulder, footpath and
proper drainage.
As per BDA-CDP map, Kothanur village road is gett ing widened to 24m, is having (2+2)
Lanes with a central median, shoulder, footpath and proper drainage.
Phase-3 & 4 of Metro extension is under progress from Nagawara to Basavapura As per
RITES/BMRCL
Since this line is taken as pr ior ity for construction as it connects to Basavapura and
work will be completed in 2023.
All precautionary measures are ensured for the safety of construction laborers while
working at the site.
Adequate sign & guide posts for traffic as per IRC (Indian Roads Congress) or ITE
(Instituteof Transpor tation Engineers USA) to be installed along the study roads.
Road marking (edge markings in yellow and lane markings in broken white), STOP lines
etc must be clear ly painted so as to guide the dr ivers along the study Roads.

40
Annexure – 2(a): Water Demand
WATER DEMAND DURING CONSTRUCTION
Water for construction will be sourced from STP tertiary treated water Table-
2a.1 shows details of the water requirement during construction period.
The water used for construction gets consumed into chemical reactions with
cement and also partly gets evaporated. Hence, there will be no wastewater generation
from curing or mixing processes. However, there will be discharge of domestic
wastewater to the tune of 17.1m3/day. The domestic wastewater will be collected and
treated in Mobile Sewage Treatment Plant.
Table 2a.1: Water Requirement for construction purpose
Sl. No. Activity Quantity of Works (m3)
Rate of water usage m3/m3
Total requirement (m3)
1. Concrete curing 36,652 0.9 32,987
2. Mortar mixing and
curing for block work
170 0.8 136
3. Mortar mixing and
curing for plastering
295 0.07 21
4. Floor finishes 3,624 0.05 181
5. Sprinkling for dust
suppression -- -- 587
6. Roof works 2,820 0.05 141
Total 34,053
7. Domestic 627
Labours/day 30 L/day 18.81 say 19 KLD
Construction Period 48 Months
No. of Working Days /Month 26
Total No. of Working Days 1248
Average Water Consumption Per Day (for Construction) 27.2 ≈ 27 KLD
Average Water Consumption Per Day (for Domestic) 19 KLD
Source: Civil Engineering Handbook and Indian Building Handbook

41
WATER REQUIREMENT DURING OPERATION
Sources of Water:
The water will be sourced from the BWSSB. The detailed total water
requirement, based on the number of residential units and other facilities to be
provided, during operation phase is estimated as in below Table 2a.2.
Table 2a.2: Water Requirement Break up Sl. No. Purpose Particulars Total in KLD
a.
Total water requirement
For residential units 280 units x 5 Personnel x
135 LPCD 189
b. For club House
(Considering 10% of total population – 140 Nos.)
140 Personnel x 45 LPCD 6.3
c. Maintenance Staff (10% of
total population – 140 Nos)
140 Personnel x 45 LPCD 6.3
Total Water Requirement 201.6 say 202
a.
Fresh water requirement
For residential units 280units x 5 Personnel x 90
LPCD 126
b. For club House 140 Personnel x 25 LPCD 3.5
c. Maintenance Staff 140 Personnel x 25 LPCD 3.5
Total Fresh Water Requirement 133
a.
Flushing water
requirement
For residential units 280 units x 5 Personnel x
45 LPCD 63
b. For club House 140Personnel x 20 LPCD 2.8
Maintenance Staff 140 Personnel x 20 LPCD 2.8
Total Flushing Water Requirement 68.6 say 69
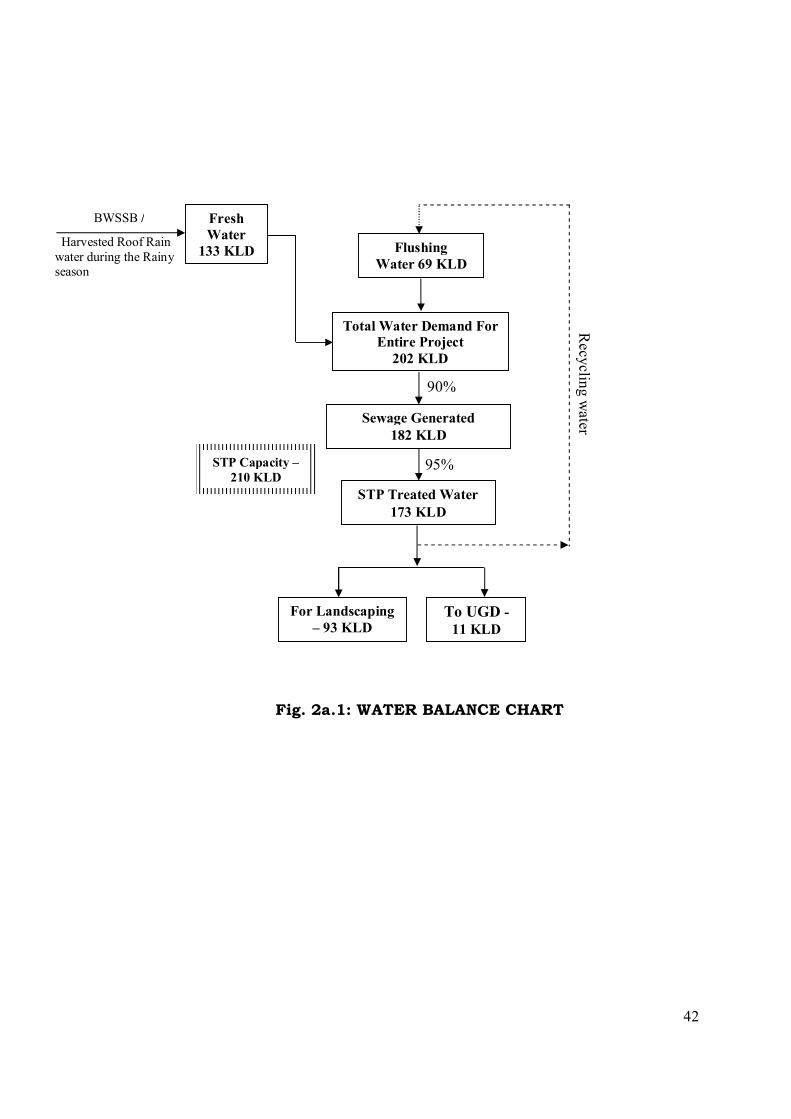
Total Water Requirement = 202 KLD
The total water requirement for the project during operation phase is around
202KLD. It is proposed to use the treated sewage for secondary purposes such as
toilet flushing to the amount of 69 KLD. Hence, the net fresh water demand would be
about 133 KLD which will be supplied by BWSSB. During the rainy season the net
fresh water requirement will be fulfilled by harvested roof rain water. Water balance
chart during the operation phase is shown in the Fig. 2a.1.
42
Fig. 2a.1: WATER BALANCE CHART
Total Water Demand For
Entire Project
202 KLD
Sewage Generated
182 KLD
STP Capacity –
210 KLD
To UGD - 11 KLD
Recy
cling w
ater
STP Treated Water
173 KLD
For Landscaping
– 93 KLD
D
Fresh
Water
133 KLD Flushing
Water 69 KLD
BWSSB /
Harvested Roof Rain
water during the Rainy season
90%
95%

43
Annexure 2(b):
MATERIAL RESOURCES
SBA (S.ft) : 548,372.70
Sl No DESCRIPTION UNIT QUANTITY
1 Cement Bags 177,327.95
2 Sand Cum 27,427.16
3 Quarry dust Cum
8,828.80 4 12mm jelly Cum
5 20mm jelly Cum
6 Rubble Cum 696.65
7 Soling stones Cum 2,322.15
8 200 Engineered Hollow blocks
Nos 1,009,828.33
9 150 Engineered Hollow
blocks
Nos
10 100 Solid blocks Nos
11 RMC M7.5 Cum 19,293.17 12 RMC M10 Cum
13 RMC M20 Cum
14 Reinforcement steel - TMT Fe 415 (8 mm Dia)
MT
2,741.86
15 Reinforcement steel - TMT
Fe 415 (10 mm Dia)
MT
16 Reinforcement steel - TMT
Fe 415 (12 mm Dia)
MT
17 Reinforcement steel - TMT
Fe 500 (16 mm Dia)
MT
18 Reinforcement steel - TMT
Fe 500 (20 mm Dia)
MT
19 Reinforcement steel - TMT
Fe 500 (25 mm Dia)
MT
20 Reinforcement steel - TMT Fe 500 (36 mm Dia)
MT
21 Runners Cum 658.05
22 Film faced plywood Sqm 5,412.87
23 Binding wire Kg 29,514.57
24 cera latex ltr 637.67
25 Mesh Rmt 161,333.98
26 Corner bead Rmt 48,789.99
27 Algiproof (Water proof liq) Ltr 16.98
28 Spanish Tile 200 x 200 Nos 70,983.99
29 Bituminous Sheet Water Proofing
Sqm 14,320.34
30 Primer Murexin Kg 2,854.38
31 SEALING COMPOUND KG 18,838.90
32 cerabond kg 235,320.91

44
33 Murexin adhesive kg 106,501.71
34 SEALING RIBBON
(CAULKING STRIP)
Rm 17,421.03
35 Silicon Sealent ml 614,811.45
36 Acrylc Sealent ml 203,433.51
37 E-board-50mm thk Sqm 4,461.87
38 Water Proofing Elastomeric
membrane (SubContract)
Sqm 718.93
Annexure 5(a):
Emission load from DG set and construction equipments during
construction phase using HSD
Pollutant
Concrete
Mixers
(3 x 3.73
kW/Hr)
Concrete
Pump
(3 x 44.74
kW/Hr)
JCB
Excavator
(2 x 50
kW/Hr)
D G Set
(40kW/Hr)
Earth
Rammers
(1x3.75
kW/Hr)
NOx (@9.2 g/
KW-hr) 102.95 1234.82 920 368 34.5
PM (@0.3 g /
KW-hr) 3.35 40.26 45
12 1.12
HC (@1.3 g /
KW-hr) 14.54 174.48 195
52 4.875
CO (@3.5 g /
KW-hr) 39.16 469.77 525 140 13.125
45
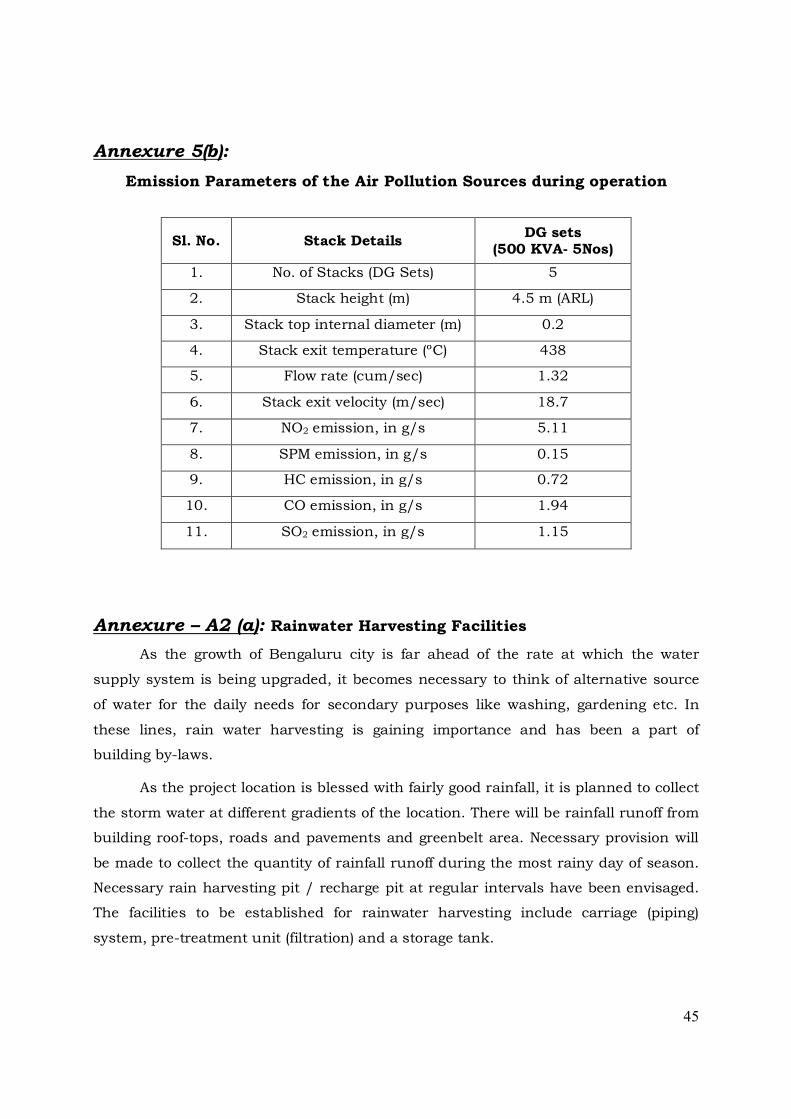
Annexure 5(b):
Emission Parameters of the Air Pollution Sources during operation
Sl. No. Stack Details DG sets
(500 KVA- 5Nos)
1. No. of Stacks (DG Sets) 5
2. Stack height (m) 4.5 m (ARL)
3. Stack top internal diameter (m) 0.2
4. Stack exit temperature (ºC) 438
5. Flow rate (cum/sec) 1.32
6. Stack exit velocity (m/sec) 18.7
7. NO2 emission, in g/s 5.11
8. SPM emission, in g/s 0.15
9. HC emission, in g/s 0.72
10. CO emission, in g/s 1.94
11. SO2 emission, in g/s 1.15
Annexure – A2 (a): Rainwater Harvesting Facilities
As the growth of Bengaluru city is far ahead of the rate at which the water
supply system is being upgraded, it becomes necessary to think of alternative source
of water for the daily needs for secondary purposes like washing, gardening etc. In
these lines, rain water harvesting is gaining importance and has been a part of
building by-laws.
As the project location is blessed with fairly good rainfall, it is planned to collect
the storm water at different gradients of the location. There will be rainfall runoff from
building roof-tops, roads and pavements and greenbelt area. Necessary provision will
be made to collect the quantity of rainfall runoff during the most rainy day of season.
Necessary rain harvesting pit / recharge pit at regular intervals have been envisaged.
The facilities to be established for rainwater harvesting include carriage (piping)
system, pre-treatment unit (filtration) and a storage tank.
46
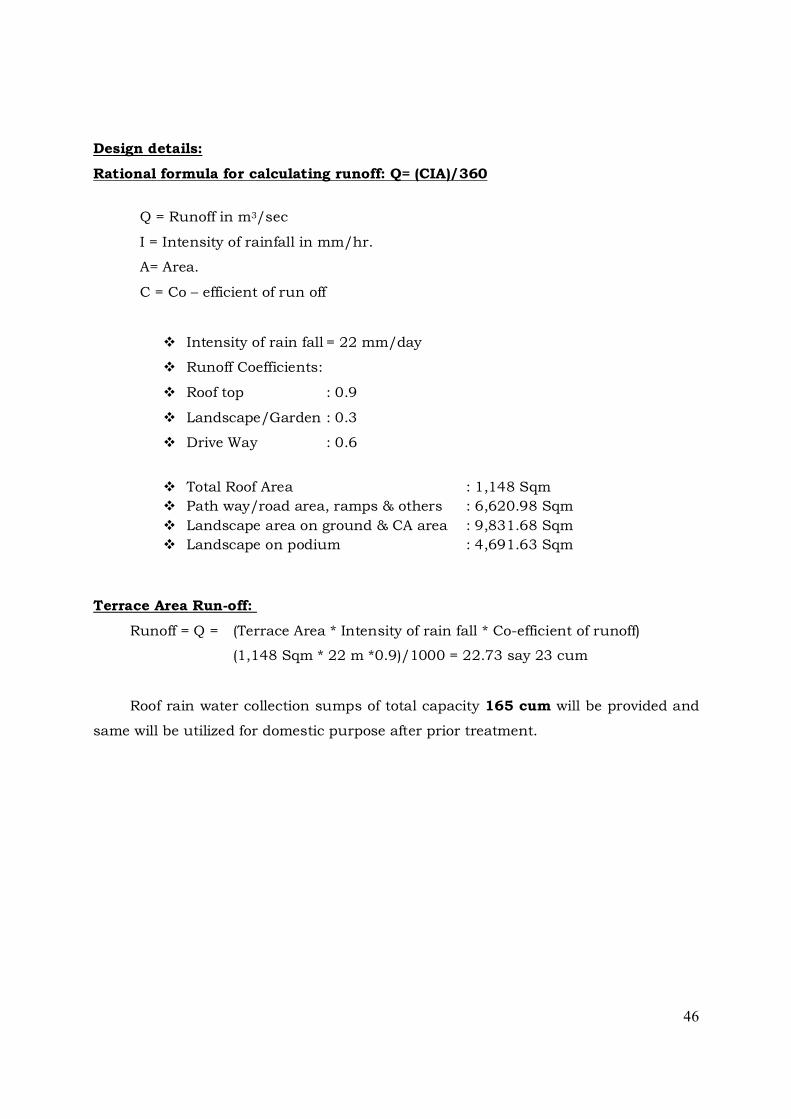
Design details:
Rational formula for calculating runoff: Q= (CIA)/360
Q = Runoff in m3/sec
I = Intensity of rainfall in mm/hr.
A= Area.
C = Co – efficient of run off
Intensity of rain fall = 22 mm/day
Runoff Coefficients:
Roof top : 0.9
Landscape/Garden : 0.3
Drive Way : 0.6
Total Roof Area : 1,148 Sqm
Path way/road area, ramps & others : 6,620.98 Sqm
Landscape area on ground & CA area : 9,831.68 Sqm
Landscape on podium : 4,691.63 Sqm
Terrace Area Run-off:
Runoff = Q = (Terrace Area * Intensity of rain fall * Co-efficient of runoff)
(1,148 Sqm * 22 m *0.9)/1000 = 22.73 say 23 cum
Roof rain water collection sumps of total capacity 165 cum will be provided and
same will be utilized for domestic purpose after prior treatment.
47
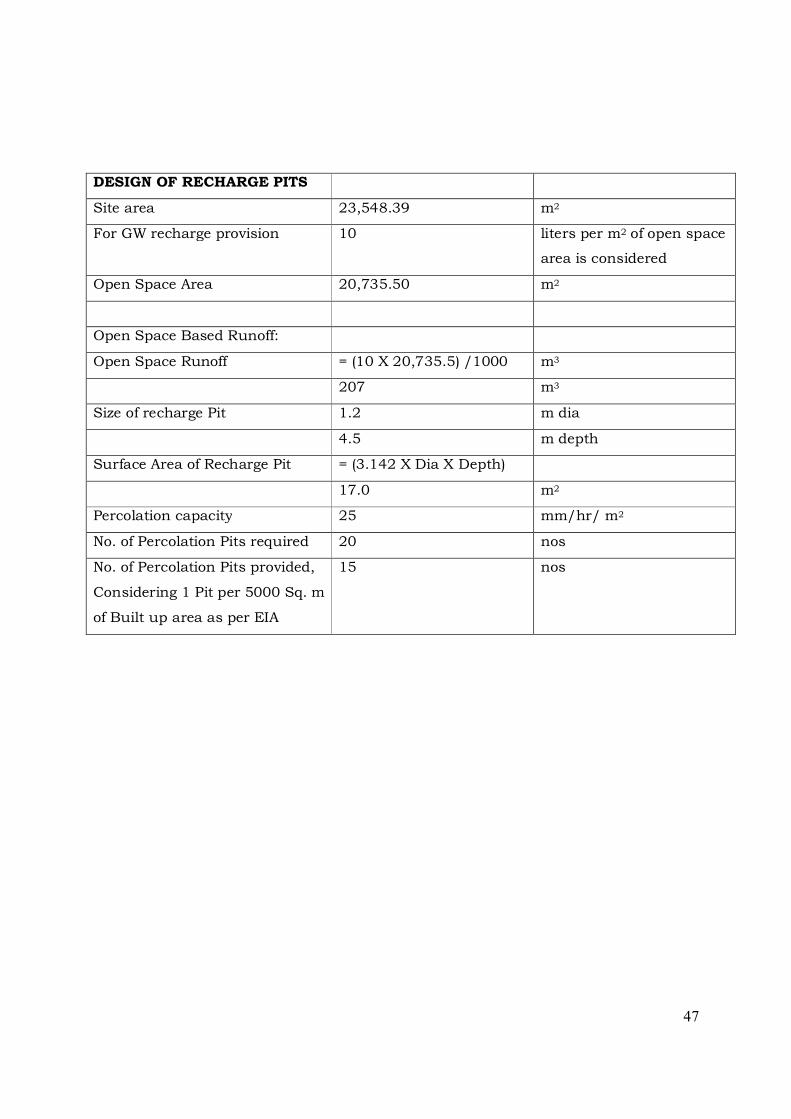
DESIGN OF RECHARGE PITS
Site area 23,548.39 m2
For GW recharge provision 10 liters per m2 of open space
area is considered
Open Space Area 20,735.50 m2
Open Space Based Runoff:
Open Space Runoff = (10 X 20,735.5) /1000 m3
207 m3
Size of recharge Pit 1.2 m dia
4.5 m depth
Surface Area of Recharge Pit = (3.142 X Dia X Depth)
17.0 m2
Percolation capacity 25 mm/hr/ m2
No. of Percolation Pits required 20 nos
No. of Percolation Pits provided,
Considering 1 Pit per 5000 Sq. m
of Built up area as per EIA
15 nos
48
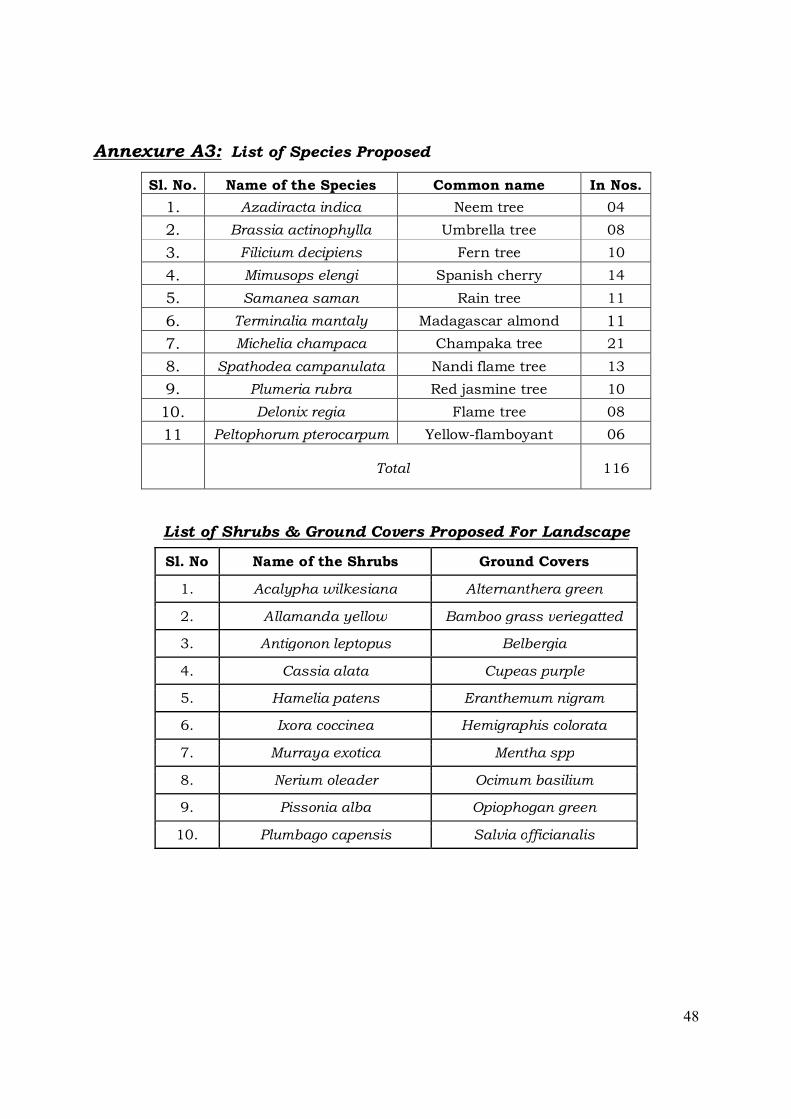
Annexure A3: List of Species Proposed
Sl. No. Name of the Species Common name In Nos.
1. Azadiracta indica Neem tree 04
2. Brassia actinophylla Umbrella tree 08
3. Filicium decipiens Fern tree 10
4. Mimusops elengi Spanish cherry 14
5. Samanea saman Rain tree 11
6. Terminalia mantaly Madagascar almond 11
7. Michelia champaca Champaka tree 21
8. Spathodea campanulata Nandi flame tree 13
9. Plumeria rubra Red jasmine tree 10
10. Delonix regia Flame tree 08
11 Peltophorum pterocarpum Yellow-flamboyant 06
Total 116
List of Shrubs & Ground Covers Proposed For Landscape
Sl. No Name of the Shrubs Ground Covers
1. Acalypha wilkesiana Alternanthera green
2. Allamanda yellow Bamboo grass veriegatted
3. Antigonon leptopus Belbergia
4. Cassia alata Cupeas purple
5. Hamelia patens Eranthemum nigram
6. Ixora coccinea Hemigraphis colorata
7. Murraya exotica Mentha spp
8. Nerium oleader Ocimum basilium
9. Pissonia alba Opiophogan green
10. Plumbago capensis Salvia officianalis

49
Annexure 10: ENVIRONMENTAL MANAGEMENT PLAN
10.1 INTRODUCTION
The Environmental Management Plan (EMP) is aimed at mitigating the possible
adverse impact of a project and ensuring the existing environmental quality. The EMP
converse all aspects of planning, construction and operation of the project relevant to
environment. It is essential to implement the EMP right from the planning stage
continuing throughout the construction and operation stage. Therefore the main
purpose of the Environmental Management Plan (EMP) is to identify the project
specific activities that would have to be considered for the significant adverse impacts
and the mitigation measures required.
The construction phase impacts are mostly short term, restricted to the plot
area and not envisaged on the larger scale. In the operational phase the environmental
impacts are due to continuous operation of the project, hence, the emphasis in the
Environment Management plan (EMP) is to minimize such impacts. The following
mitigation measures are recommended in order to synchronize the economic
development of the project area with the environmental protection of the region.
The emphasis on the EMP development is on the following;
Mitigation measures for each of the activities causing the environmental
impact.
Monitoring plans for checking activities and environmental parameters and
monitoring responsibilities.
Role responsibilities and resource allocation for monitoring; and
Implementation of the scheduled plan.
Environmental management plan has been discussed in the following sections
separately for Construction phase and Operational phase:
10.2 EMP DURING CONSTRUCTION PHASE
During construction phase, the activities which need to be monitored and
managed from the point of pollution are explained in detail in the subsequent
sections.
50
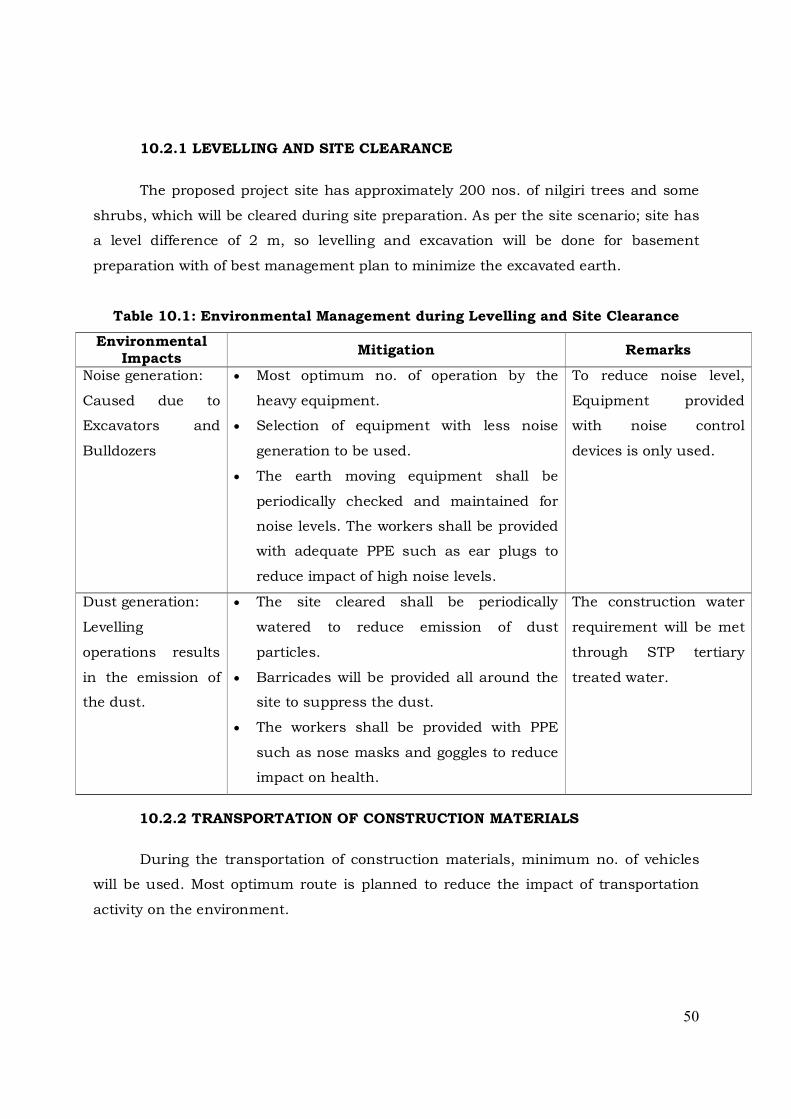
10.2.1 LEVELLING AND SITE CLEARANCE
The proposed project site has approximately 200 nos. of nilgiri trees and some
shrubs, which will be cleared during site preparation. As per the site scenario; site has
a level difference of 2 m, so levelling and excavation will be done for basement
preparation with of best management plan to minimize the excavated earth.
Table 10.1: Environmental Management during Levelling and Site Clearance
Environmental Impacts
Mitigation Remarks
Noise generation:
Caused due to
Excavators and
Bulldozers
Most optimum no. of operation by the
heavy equipment.
Selection of equipment with less noise
generation to be used.
The earth moving equipment shall be
periodically checked and maintained for
noise levels. The workers shall be provided
with adequate PPE such as ear plugs to
reduce impact of high noise levels.
To reduce noise level,
Equipment provided
with noise control
devices is only used.
Dust generation:
Levelling
operations results
in the emission of
the dust.
The site cleared shall be periodically
watered to reduce emission of dust
particles.
Barricades will be provided all around the
site to suppress the dust.
The workers shall be provided with PPE
such as nose masks and goggles to reduce
impact on health.
The construction water
requirement will be met
through STP tertiary
treated water.
10.2.2 TRANSPORTATION OF CONSTRUCTION MATERIALS
During the transportation of construction materials, minimum no. of vehicles
will be used. Most optimum route is planned to reduce the impact of transportation
activity on the environment.

51
Table 10.2: Environmental Management during Transportation
Environmental Impacts
Mitigation
Noise generation Quality fuel will be used.
Periodic maintenance of vehicles is required.
Dust generation Quality packaging of the construction materials.
Construction materials shall be covered with
tarpaulin sheets to prevent the material from
being air borne.
The vehicle speed shall be regulated.
Watering to the wheels of the construction vehicle
will be done while entering to the construction
site.
The workers transporting materials shall be
provided with PPE such as nose masks to reduce
impact of air borne dust on their health.
Vehicular
emissions
Periodic emission check for vehicles is required.
Clean fuel shall be used for vehicles.
10.2.3 CONSTRUCTION ACTIVITIES
During the construction work, the following impacts are identified to monitor
and mitigate the level of impact.
Table 10.3: Environmental Management during Construction
Environmental impacts
Mitigation Remarks
Noise generation Selection of less noise generating equipment.
Personnel Protective Equipment (PPE) such
as ear plugs and helmets shall be provided
for construction workers.
The working hours shall be imposed on
construction workers.
Implementation
responsibility:
Contractor –
Civil Works.

52
Dust generation PPE in the form of nose masks shall be
provided for construction workers.
Use of water sprays to prevent the dust from
being air borne.
Providing barricades all around the project
site.
Implementation
responsibility:
Contractor
Water Discharge
from
construction
works
Sewage generated will be treated in mobile
STP
Implementation
responsibility:
Contractor
Air Emissions
from
construction
machinery
Periodic check and regular maintenance of
construction machinery for emissions.
Clean fuel shall be used in equipments.
Implementation
responsibility:
Contractor
10.2.3.1 WASTEWATER DISCHARGE
The sewage generated from the construction labours during construction is
estimated to be about 17.1 KLD. This will treated in mobile STP.
10.2.3.2 DISPOSAL OF EXCAVATED EARTH
The excavated earth which is generated during construction will be reused for
development of landscape and pavement area formation and excess will be carted out
therefore there will not be any solid waste problem from the generation of excavated
earth.
10.2.3.3 PERSONNEL SAFETY SYSTEM
It is planned to adopt the safe working practices which shall govern all
construction works undertaken throughout the project. Following Safety Aids to all
labourers will be provided:
Safety Helmets
Safety Belts
Safety Shoes
Hand gloves

53
Gumboots while concreting
Safety Goggles while welding/ Stone dressing etc.
Face masks and full body kit while Pest control
Implementation of Safety procedures such as:
Using proper lifting techniques.
Using Safe Scaffolds.
Hot work permits for Fabrication and welding.
BUDGETARY ALLOCATION FOR EMP DURING CONSTRUCTION
Sl. No. EMP Aspects Cost
Capital Investment In Lakh
1. Barricades all round the site 2.5
Total 2.5
During Construction Lakhs/annum
1. Purchase of water from external authorized
suppliers 4.0
2. Plantations of saplings around the periphery
and maintenance 10.0
3. Environmental Monitoring – Air, water, Noise 1.0
4. EMP cell 2.4
Total 17.4
10.3 EMP DURING OPERATION PHASE
Following are the identified operational phase activities in the impact
assessment, which may have impact on the environment.
1. Air quality
2. Water quality
3. Noise quality
4. Solid waste disposal
5. Landscape development
6. Storm water management

54
10.3.1 AIR QUALITY MANAGEMENT
The air pollutants likely to be emanated from the proposed project are SPM,
SO2, NO2, HC and CO mainly due to burning of liquid fuel (HSD) in DG.
Exhaust from DG set will be emitted from stack of adequate height for
dispersion of gaseous pollutants. The green belt development is also proposed covering
about 59.66% of the net plot area. Following table presents the EMP for air quality
management during operation phase.
Table 10.4: Air Quality Management during Operation Phase
Environmental
Impacts Mitigation
DG set Equipment selected will ensure the exhaust emission
standard as prescribed as per the latest amendments
from the CPCB.
DG will be used as stand-by unit.
Periodic check and maintenance.
Ambient air
quality
Ambient air quality monitoring as per the prescribed
norms at regular interval.
10.3.2 WATER QUALITY MANAGEMENT
Water requirement of the project will be met through BWSSB, as mentioned
earlier. Water balance is presented in Annexure 2(a).
The sewage generated from the proposed project is about 182 KLD which will be
treated in the proposed STP of capacity 210 KLD. The treatment scheme for domestic
effluents generated from project has also been discussed in Annexure 2(a). The STP
treated water will be reused for flushing, gardening etc. Following table presents the
EMP for water quality.
Table 10.5: Water Quality Management during Operation Phase
Environmental impacts Mitigation
Effluent from domestic water
consumption
Treated with proposed state-of-the-art sewage
treatment plant to produce tertiary treated water;
this will be ultimately reused for secondary

55
purposes such as for flushing and gardening.
Water conservation measures will be encouraged.
10.3.3 NOISE MANAGEMENT
High noise generating units such as DG set will be provided with acoustic
enclosures. Landscape on the project boundary will further act as noise barrier and
helps in attenuation of noise. Following table presents the EMP for noise levels.
Table 10.6: Noise Management during Operation Phase
Environmental Impacts
Mitigation
Noise from DG set
area
Acoustic enclosures will be provided to DG set.
DG set will be installed in an area (utility section)
where the access will be restricted.
The use of PPE (ear plugs) will be mandatory in this
area.
Selection of equipment to ensure that the residual
noise level of < 65 dB (A).
Noise levels will be checked periodically using a noise
dosimeter.
10.3.4 SOLID WASTE MANAGEMENT
The solid wastes generated during operation phase can be categorized under
three types:
Wet Garbage: Food waste, Lawn mowing wastes etc
Dry Garbage : Paper, Plastic, Bottles, etc.
Sludge from Sewage Treatment Plant (STP)
The solid waste generated in the premises is estimated to be about 714 kg/day.
Out of 714 kg, 428kg (60%) will be biodegradable waste & 286 kg (40%) will be
recyclable wastes. Further this biodegradable wastes will be segregated at household
levels and will be processed in organic waste converter and the recyclable wastes such
as plastic materials, glass & metal wastes will be handed over to the waste recyclers.
56
The sludge from the STP is estimated to be about 9 kg/day and will be used as
manure for gardening purpose.
The various mitigation measures to be adopted during collection and disposal of
wastes are as follows:
It is preferable that the container and bins used for collection of waste should
be of closed type so that the waste is not exposed and thus the possibility of
spreading of disease through flies and mosquitoes is minimized.
Collection system should be properly supervised so that quick and regular
removal of waste from the dustbin is practiced.
Door to door collection shall be done in each unit to collect the solid wastes.
The biodegradable wastes will be processed in organic waste converter,
recyclable wastes such as plastic materials, glass & metal wastes are handed
over to the waste recyclers; e-waste will collected separately and handed over to
authorize e- waste recyclers for further processing.
10.3.5 LANDSCAPE DEVELOPMENT
Vegetation is the natural extension of the soil ecosystem on a site. It can provide
summer shade, wind protection, and a low-maintenance landscape that is adapted to
the local environment.
Following approach will be adopted for vegetation and ground management.
It is planned to include an ecologically knowledgeable landscape architect as an
integral member of the design team.
Preservation of existing vegetation, especially native plants, will possibly be
incorporated. Avoid fencing off property where possible to make landscape available to
community increasing project integration.
Decrease paving and monoculture lawns.
Avoid replacing mature trees with young seedlings.
Protect existing plants during construction. Delineate the “drip line” around
trees and demark or fence off areas to avoid damage.
Contain heavy equipment and stockpiling areas to predefined areas.
Design new plantings as diverse communities of species well adapted to the
site. Plant native species of varying ages. Select vegetation that attracts wildlife.
57
Avoid invasive species and monocultures (same species, same age).
10.3.6 STORM WATER MANAGEMENT
As the project location is blessed with fairly good rainfall, it is planned to collect
the storm water at different gradients of the location. There will be rainfall runoff from
building roof-tops, roads and pavements and landscape area. Necessary provision will
be made to collect the quantity of rainfall runoff during the most rainy day of season.
Necessary rain harvesting pit /recharge pit at equal intervals around the periphery of
the site have been envisaged. A garland drains with RCC precast perforated cover will
be provided around the periphery of property. The details of the rain water harvesting
facilities are interpreted in the early section.
10.3.7 HEALTH, RISK AND DISASTER MANAGEMENT
Public health and safety
Since all the construction related activities shall be confined to the project site,
minimal health related impacts are envisaged within the project influenced area
during the construction stage.
At the project site on an average of 627 persons will be engaged, who face direct
exposure to dust and noise generated from the construction activity. This is likely to
cause health related affects such as asthma, bronchitis etc. and hearing impairments
respectively.
To minimize these anticipated impacts, suitable actions like
Use of water sprinklers to prevent dust from being air borne.
Providing suitable personal protective equipments (PPE) like mouth mask
with filters, nose mask, helmets etc.
Periodic health check up camp for the labourers will be arranged.
Provision of safety belts.
In case of injury, on site medical treatment and transport will be organized.
Employing a safety engineer.
Due to operation of the proposed project, there will be enhancement in public
health and safety.

58
Regular visit of resident medical officer to take care of the first aid and
primary medication in case of emergency for apartment occupants and
labourers.
First aid kit with primary medicines will always be available in the medical
centre.
Display of action plan and preparedness measures during emergency
situations.
Risk and disaster management plan
Disaster is an unexpected event due sudden failure of the system, external
threats, internal disturbances, earth quakes, fire and accidents. Thus an
appropriate management plan shall be incorporated.
Precautions
Once the likelihood of the disaster is suspected, preventive actions
should be undertaken by the project in-charge.
Conditional maintenance of equipments, materials, and expertise for use
during emergency.
The electrical systems shall be provided with automatic circuit breakers
activated by over current.
Fire extinguishers are provided at pre-notified locations inside the
apartments.
Proper escape routes are planned and displayed in the public domain.
Selected representatives are given proper training to guide other
inhabitants during fire accidents.
Periodic awareness programme is conducted for the occupants on their
roles during emergency situations.
Important telephone numbers like police authorities, fire department and
hospitals etc. of use during emergency situations are made available.
10.3.8 EMP IMPLEMENTATION SCHEDULE
Phased according to the priority, the implementation schedule is presented in
below table.
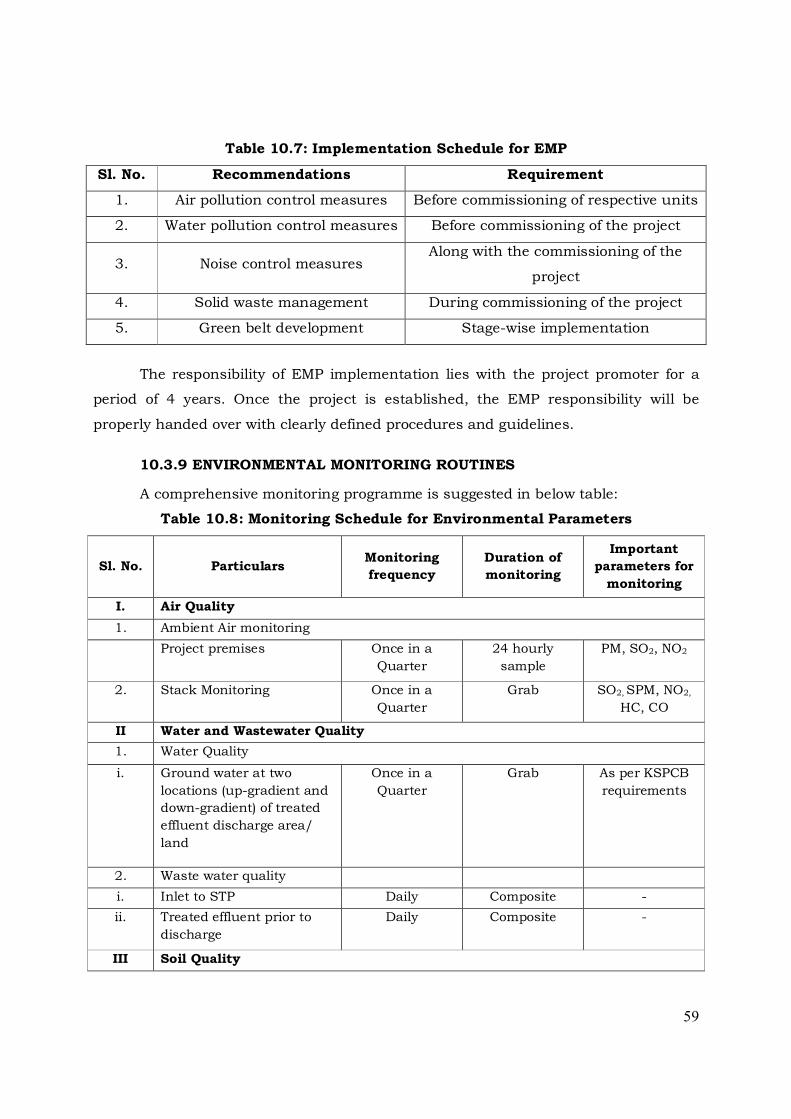
59
Table 10.7: Implementation Schedule for EMP
Sl. No. Recommendations Requirement
1. Air pollution control measures Before commissioning of respective units
2. Water pollution control measures Before commissioning of the project
3. Noise control measures Along with the commissioning of the
project
4. Solid waste management During commissioning of the project
5. Green belt development Stage-wise implementation
The responsibility of EMP implementation lies with the project promoter for a
period of 4 years. Once the project is established, the EMP responsibility will be
properly handed over with clearly defined procedures and guidelines.
10.3.9 ENVIRONMENTAL MONITORING ROUTINES
A comprehensive monitoring programme is suggested in below table:
Table 10.8: Monitoring Schedule for Environmental Parameters
Sl. No. Particulars Monitoring
frequency
Duration of
monitoring
Important
parameters for
monitoring
I. Air Quality
1. Ambient Air monitoring
Project premises Once in a
Quarter
24 hourly
sample
PM, SO2, NO2
2. Stack Monitoring Once in a
Quarter
Grab SO2, SPM, NO2,
HC, CO
II Water and Wastewater Quality
1. Water Quality
i. Ground water at two
locations (up-gradient and
down-gradient) of treated
effluent discharge area/
land
Once in a
Quarter
Grab As per KSPCB
requirements
2. Waste water quality
i. Inlet to STP Daily Composite -
ii. Treated effluent prior to
discharge
Daily Composite -
III Soil Quality
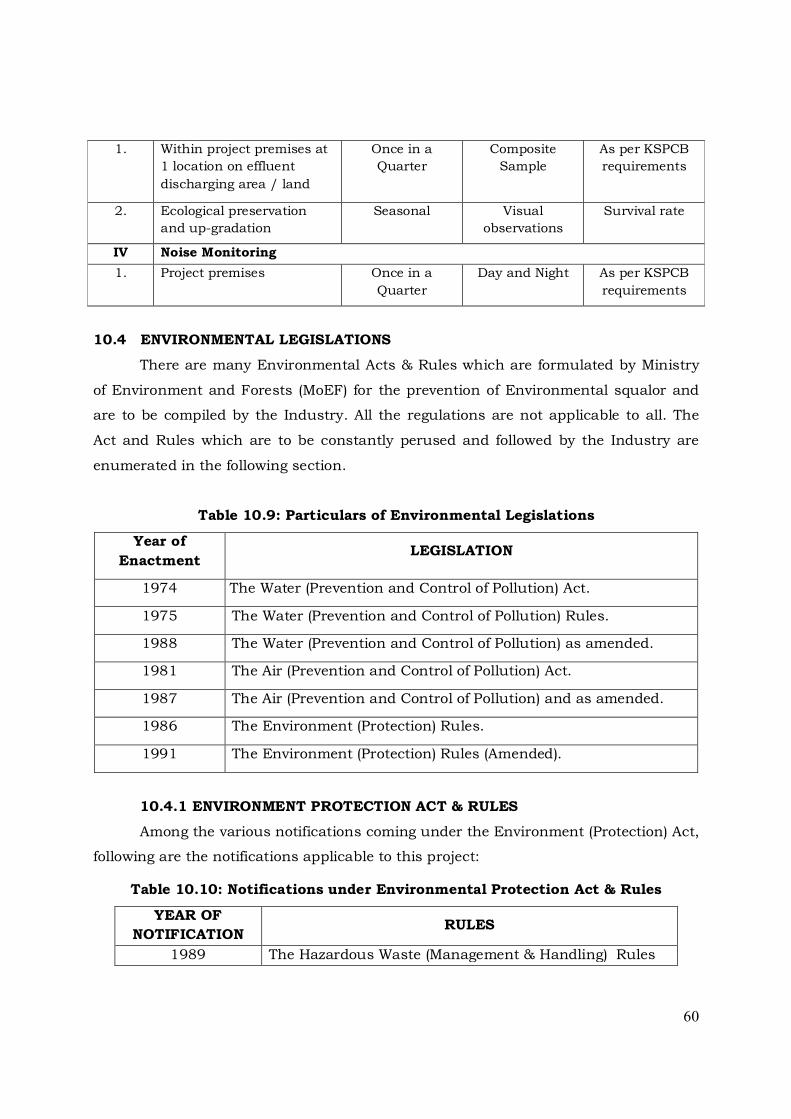
60
1. Within project premises at
1 location on effluent
discharging area / land
Once in a
Quarter
Composite
Sample
As per KSPCB
requirements
2. Ecological preservation
and up-gradation
Seasonal Visual
observations
Survival rate
IV Noise Monitoring
1. Project premises Once in a
Quarter
Day and Night As per KSPCB
requirements
10.4 ENVIRONMENTAL LEGISLATIONS
There are many Environmental Acts & Rules which are formulated by Ministry
of Environment and Forests (MoEF) for the prevention of Environmental squalor and
are to be compiled by the Industry. All the regulations are not applicable to all. The
Act and Rules which are to be constantly perused and followed by the Industry are
enumerated in the following section.
Table 10.9: Particulars of Environmental Legislations
Year of
Enactment LEGISLATION
1974 The Water (Prevention and Control of Pollution) Act.
1975 The Water (Prevention and Control of Pollution) Rules.
1988 The Water (Prevention and Control of Pollution) as amended.
1981 The Air (Prevention and Control of Pollution) Act.
1987 The Air (Prevention and Control of Pollution) and as amended.
1986 The Environment (Protection) Rules.
1991 The Environment (Protection) Rules (Amended).
10.4.1 ENVIRONMENT PROTECTION ACT & RULES
Among the various notifications coming under the Environment (Protection) Act,
following are the notifications applicable to this project:
Table 10.10: Notifications under Environmental Protection Act & Rules
YEAR OF
NOTIFICATION RULES
1989 The Hazardous Waste (Management & Handling) Rules

61
2000 & 2003 The Hazardous Waste (Management & Handling) Rules
(amended)
1992/1993 Environmental Statement
2000 Noise Pollution (Regulation & Control) Rules and
Amendment Rule 2006
2000 Municipal Solid Wastes (Management & Handling) Rules
2002 D.G. Rules
2008 The Hazardous Wastes (Management, Handling &
Transboundary Movement) Rules
The Hazardous Waste (Management & Handling) Rules 1989 (latest amendment
2008)
The DG Set Waste/used oil is included in the schedule-1 of list of Hazardous
Waste under Serial No.5 which states as under:
“Used/spent oil (category No.5.1) generated from industrial operations.
Using mineral/synthetic oil as lubricant in hydraulic systems or other
applications”.
Used oil defined under Rule 3 (34) means any oil derived from crude oil or
mixtures containing synthetic oil including used engine oil, gear oil, hydraulic oil,
turbine oil, compressor oil, industrial gear oil, heat transfer oil, transformer oil, spent
oil and their tank bottom sludge and suitable for re-refining, if it meets the
specifications laid down in Schedule 5, but does not include waste oil.
Responsibility of the occupier and operator of a facility for handling of the
wastes is delineated as under:
1. The Occupier and the operator of a facility shall be responsible for proper
collection, reception, treatment, storage and disposal of hazardous wastes listed
in schedule –1, 2 and3 {Rule 4(1)}
2. It shall be the responsibility of the occupier and the operator of a facility, to
take all steps to ensure that the wastes listed in schedule 1,2 and 3 are
properly handled and disposed of without any adverse effects to the
environment {Rule 4(3)}.
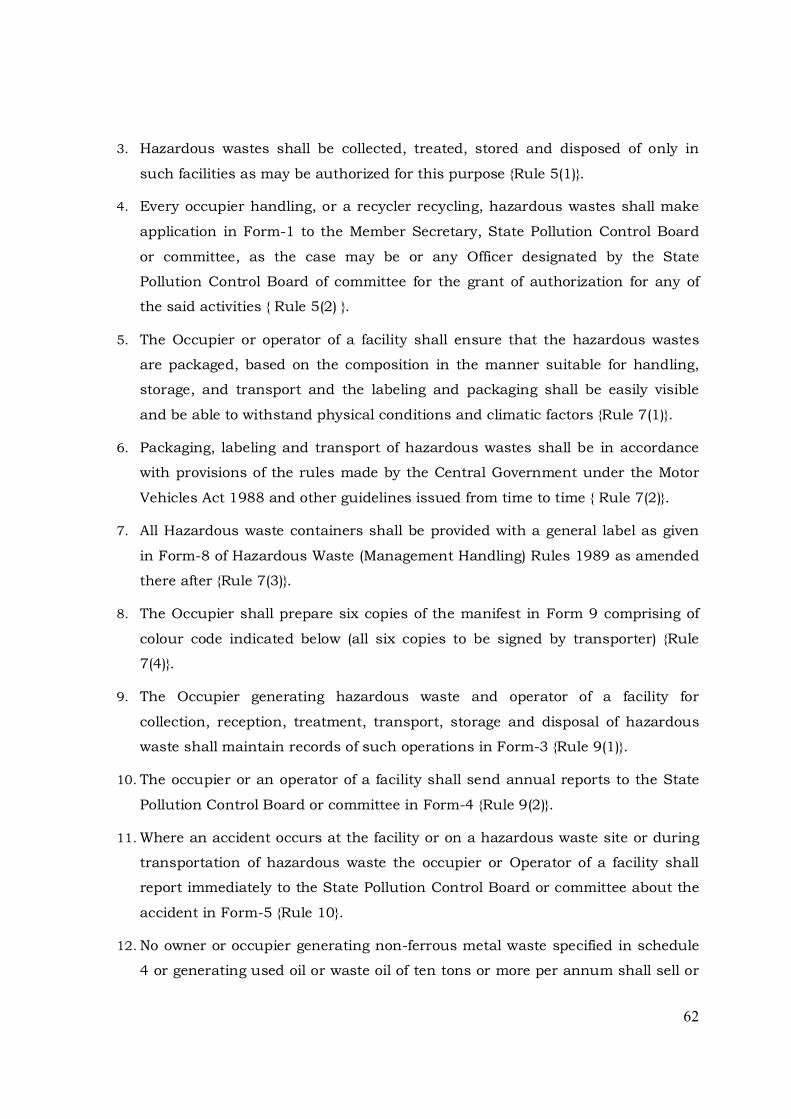
62
3. Hazardous wastes shall be collected, treated, stored and disposed of only in
such facilities as may be authorized for this purpose {Rule 5(1)}.
4. Every occupier handling, or a recycler recycling, hazardous wastes shall make
application in Form-1 to the Member Secretary, State Pollution Control Board
or committee, as the case may be or any Officer designated by the State
Pollution Control Board of committee for the grant of authorization for any of
the said activities { Rule 5(2) }.
5. The Occupier or operator of a facility shall ensure that the hazardous wastes
are packaged, based on the composition in the manner suitable for handling,
storage, and transport and the labeling and packaging shall be easily visible
and be able to withstand physical conditions and climatic factors {Rule 7(1)}.
6. Packaging, labeling and transport of hazardous wastes shall be in accordance
with provisions of the rules made by the Central Government under the Motor
Vehicles Act 1988 and other guidelines issued from time to time { Rule 7(2)}.
7. All Hazardous waste containers shall be provided with a general label as given
in Form-8 of Hazardous Waste (Management Handling) Rules 1989 as amended
there after {Rule 7(3)}.
8. The Occupier shall prepare six copies of the manifest in Form 9 comprising of
colour code indicated below (all six copies to be signed by transporter) {Rule
7(4)}.
9. The Occupier generating hazardous waste and operator of a facility for
collection, reception, treatment, transport, storage and disposal of hazardous
waste shall maintain records of such operations in Form-3 {Rule 9(1)}.
10. The occupier or an operator of a facility shall send annual reports to the State
Pollution Control Board or committee in Form-4 {Rule 9(2)}.
11. Where an accident occurs at the facility or on a hazardous waste site or during
transportation of hazardous waste the occupier or Operator of a facility shall
report immediately to the State Pollution Control Board or committee about the
accident in Form-5 {Rule 10}.
12. No owner or occupier generating non-ferrous metal waste specified in schedule
4 or generating used oil or waste oil of ten tons or more per annum shall sell or
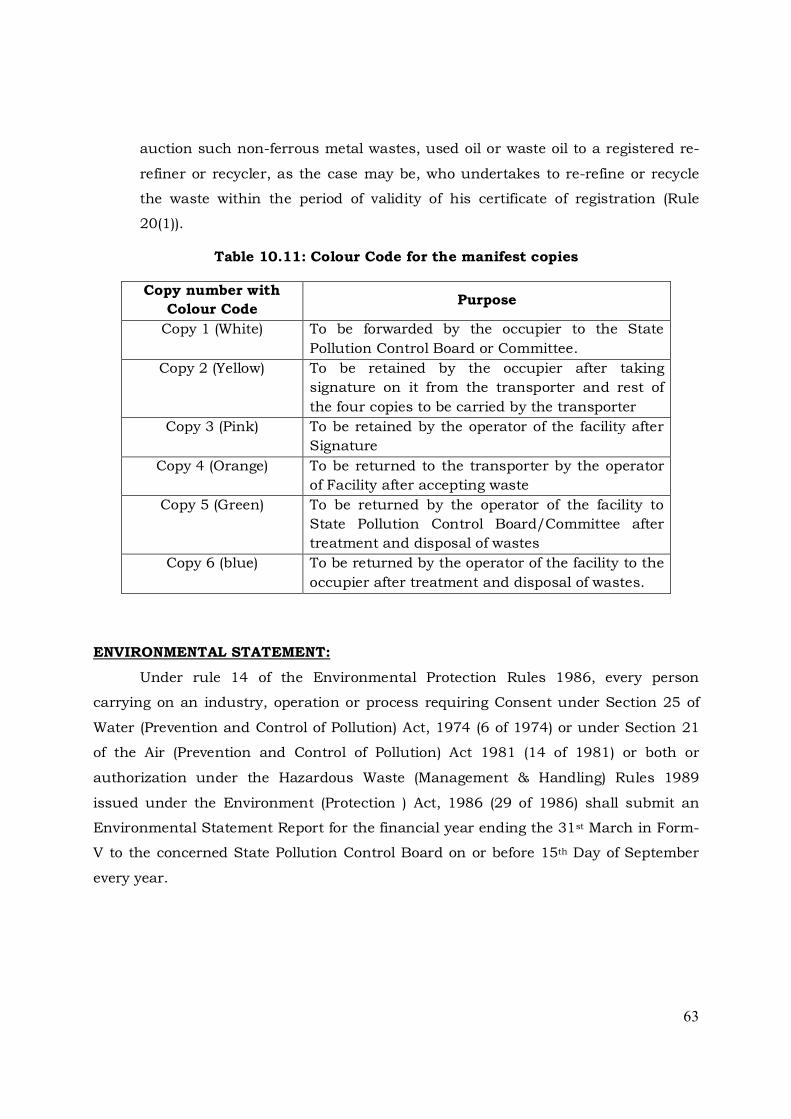
63
auction such non-ferrous metal wastes, used oil or waste oil to a registered re-
refiner or recycler, as the case may be, who undertakes to re-refine or recycle
the waste within the period of validity of his certificate of registration (Rule
20(1)).
Table 10.11: Colour Code for the manifest copies
Copy number with
Colour Code Purpose
Copy 1 (White) To be forwarded by the occupier to the State
Pollution Control Board or Committee.
Copy 2 (Yellow) To be retained by the occupier after taking
signature on it from the transporter and rest of
the four copies to be carried by the transporter
Copy 3 (Pink) To be retained by the operator of the facility after
Signature
Copy 4 (Orange) To be returned to the transporter by the operator
of Facility after accepting waste
Copy 5 (Green)
To be returned by the operator of the facility to
State Pollution Control Board/Committee after
treatment and disposal of wastes
Copy 6 (blue) To be returned by the operator of the facility to the
occupier after treatment and disposal of wastes.
ENVIRONMENTAL STATEMENT:
Under rule 14 of the Environmental Protection Rules 1986, every person
carrying on an industry, operation or process requiring Consent under Section 25 of
Water (Prevention and Control of Pollution) Act, 1974 (6 of 1974) or under Section 21
of the Air (Prevention and Control of Pollution) Act 1981 (14 of 1981) or both or
authorization under the Hazardous Waste (Management & Handling) Rules 1989
issued under the Environment (Protection ) Act, 1986 (29 of 1986) shall submit an
Environmental Statement Report for the financial year ending the 31st March in Form-
V to the concerned State Pollution Control Board on or before 15th Day of September
every year.

64
BUDGETARY ALLOCATION FOR EMP DURING OPERATION
Sl. No. EMP Aspect Cost in Rs
Capital Investment In Lakh
1. Sewage Treatment Plant 80.0
2. Rainwater harvesting facilities 5.0
3. Landscape development 15.0
4. Acoustic & Stacks for DG sets 15.0
5. Organic Waste Converter 5.0
Total 120.0
Operation Investment Lakh/ Annum
1. STP Maintenance 3.0
2. Landscape Maintenance 4.5
3. OWC Maintenance 3.0
4. EMP Cell 2.4
5. Environmental Monitoring-Air, Water, Noise 1.0
Total 13.9

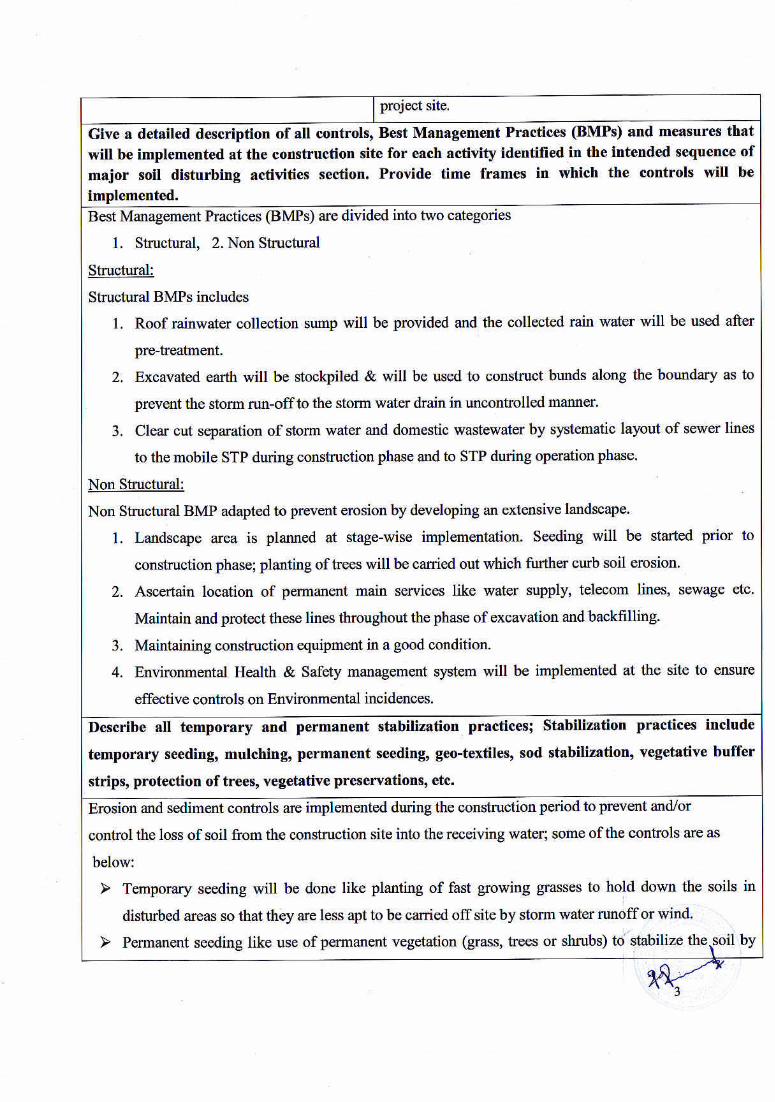

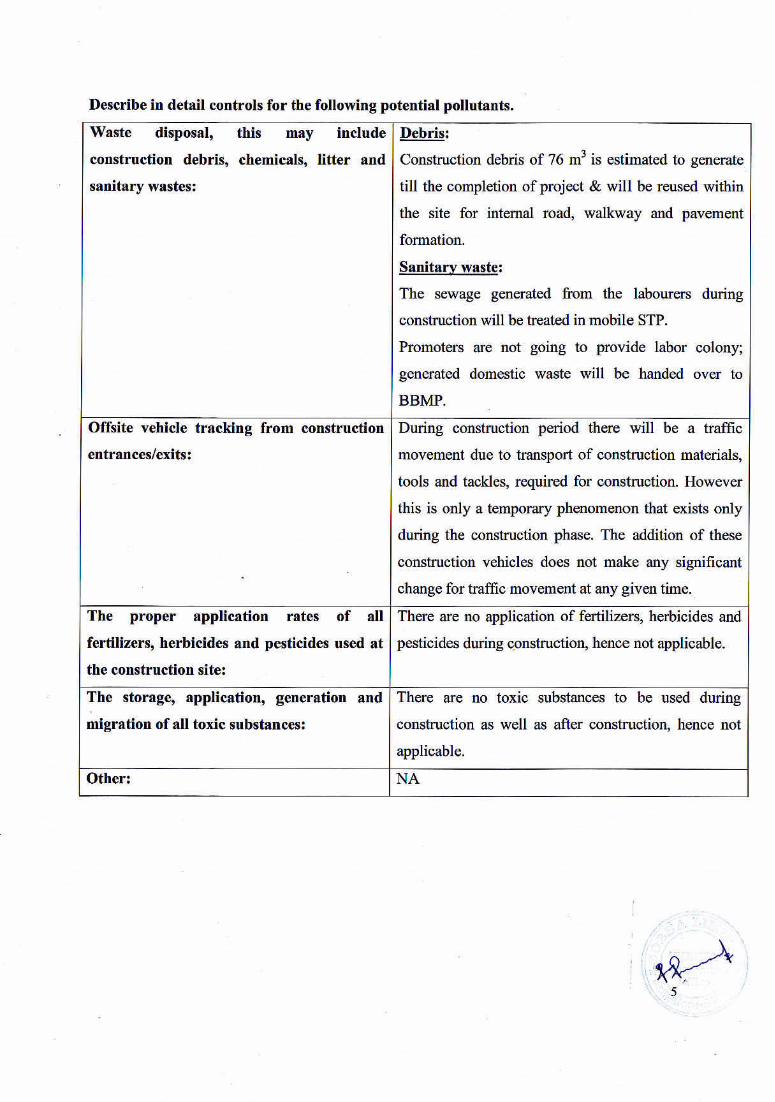


MuneshwaraTemple
Temple
6TH MAIN
Proposed Acquisition
by BMRCL
Proposed
Acquisition by
BMRCL
M e n a k s h i M a h a l
Menakshi SundareshwaraTemple
KO
TH
NU
R V
ILLA
GE
MA
IN R
OA
D
6TH MAIN
Bus Stop
KO
TH
NU
R V
ILLA
GE
MA
IN R
OA
D
SITE
LOCATION
Proposed
Acquisition by
BMRCL
Proposed
Acquisition by
BMRCL
5% RESERVED
CIVIC AMENITIES
SITE
10% RESERVED
PARK & OPEN
SPACE
16000
16000
17000
16000
16M S
ETBACK LIN
E
16M
SETB
AC
K L
INE
16M
SETB
AC
K L
INE
16M SETBACK LINE
16M SE
TB
AC
K L
INE
16M S
ETBACK LIN
E
BLOCK - 12B + G + 35UF
16000
16000
10000
EX
IT
EN
TR
Y
450 mm
wid
e STO
RM W
ATER DRAIN
450
mm
wid
e STO
RM
WATE
R D
RAIN
450
mm
wid
e STO
RM
WATER
DR
AIN
450 m
m w
ide S
TO
RM
WA
TE
R D
RA
IN
RAMP D
OWN T
O
BASEMENT-1
RAMP UP TO
PODIUM LEVEL
BLOCK - 2
2B + G + 35UF
CLUBHOUSE
(G+1)
TEN
NIS
CO
UR
T
8.0M
DR
IVEW
AY
8.0M
DR
IVEW
AY
8.0M DRIV
EWAY
8.0M
DRIV
EWAY
8.0
M D
RIV
EW
AY
8.0M
SER
VICE R
OAD
10000
TR
AN
SFO
RM
YA
RD
UG S
UMP
OWC
125.00 SQM
PLAY GROUND
POOL
17000STP
TRANSFORMERS YARD
ORGANIC WASTE
CONVERTER
DG YARD
RWH SUMP
Recharge pits
BASEMENT EXTENT
SITE BOUNDARY
ROAD
LEGEND
LANDSCAPE
PODIUM LANDSCAPE
UG SUMP
STORM WATER DRAIN
SET BACK
Proposed
Acquisition by
BMRCL
Proposed
Acquisition by
BMRCL
5% RESERVED
CIVIC AMENITIESSITE
10% RESERVED
PARK & OPEN
SPACE
16000
16000
17000
16000
16M S
ETBACK LIN
E
16M
SETB
AC
K L
INE
16M
SETB
AC
K L
INE
16M SETBACK LINE
16M SE
TB
AC
K L
INE
16M S
ETBACK LIN
E
BLOCK - 12B + G + 35UF
16000
16000
10000
EX
IT
EN
TR
Y
450 mm
wid
e STO
RM W
ATER DRAIN
450
mm
wid
e STO
RM
WATE
R D
RAIN
450
mm
wid
e STO
RM
WATER
DR
AIN
450 m
m w
ide S
TO
RM
WA
TE
R D
RA
IN
RAMP D
OWN T
O
BASEMENT-1
RAMP UP TO
PODIUM LEVEL
BLOCK - 22B + G + 35UF
CLUBHOUSE(G+1)
TEN
NIS
CO
UR
T
8.0
M D
RIV
EW
AY
8.0
M D
RIV
EW
AY
8.0M DRIV
EWAY
8.0M
DRIV
EWAY
8.0
M D
RIV
EW
AY
8.0M
SER
VICE R
OAD
10000
TR
AN
SFO
RM
YA
RD
UG
SU
MP
OWC
125.00 SQM
PLAY GROUND
POOL
17000STP
TRANSFORMERS YARD
ORGANIC WASTE
CONVERTER
DG YARD
RWH SUMP
Recharge pits
SCALE2
SITE PLAN
1:750
SCALE1
LOCATION PLAN
NTS
N