seeks attractive income and returns; with less volatility
TRANSCRIPT
GS Real Estate Diversified Income Fund (GSRHX)
Q3 2021
Seeks Attractive Income and Returns;
With Less Volatility and Correlation to Traditional Asset Classes

Overview
3
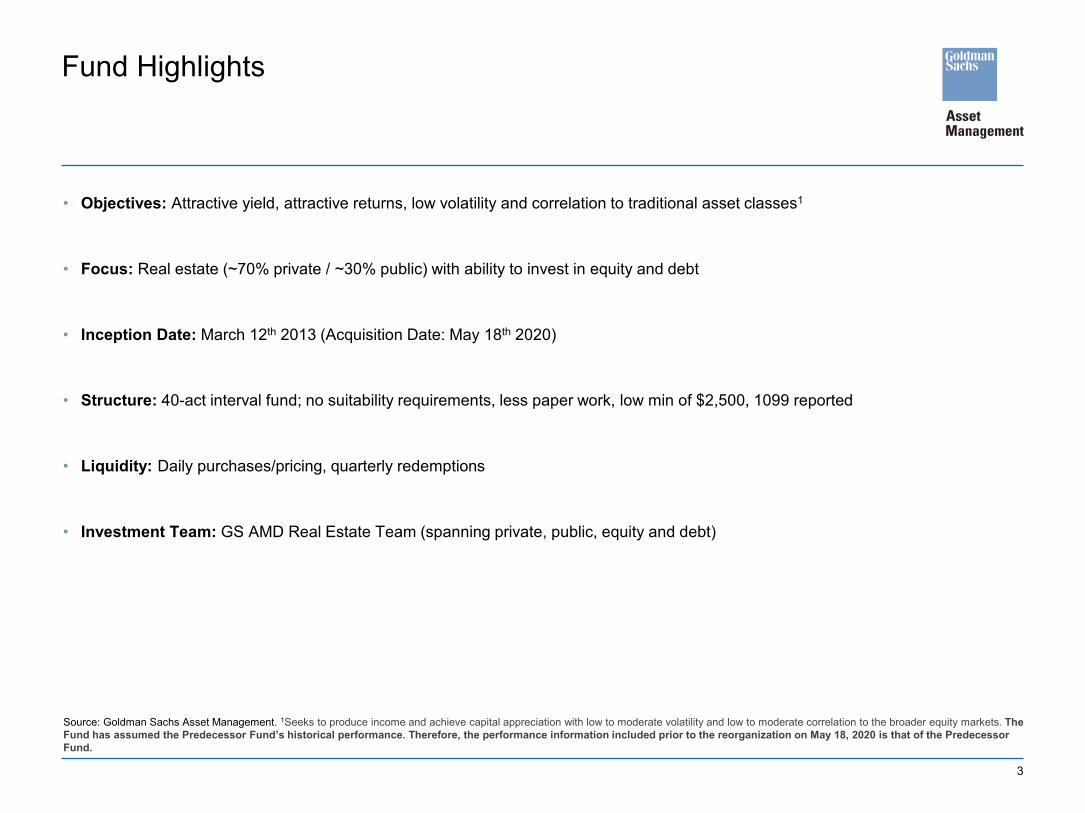
• Objectives: Attractive yield, attractive returns, low volatility and correlation to traditional asset classes1
• Focus: Real estate (~70% private / ~30% public) with ability to invest in equity and debt
• Inception Date: March 12th 2013 (Acquisition Date: May 18th 2020)
• Structure: 40-act interval fund; no suitability requirements, less paper work, low min of $2,500, 1099 reported
• Liquidity: Daily purchases/pricing, quarterly redemptions
• Investment Team: GS AMD Real Estate Team (spanning private, public, equity and debt)
Fund Highlights
Source: Goldman Sachs Asset Management. 1Seeks to produce income and achieve capital appreciation with low to moderate volatility and low to moderate correlation to the broader equity markets. The Fund has assumed the Predecessor Fund’s historical performance. Therefore, the performance information included prior to the reorganization on May 18, 2020 is that of the Predecessor Fund.
4
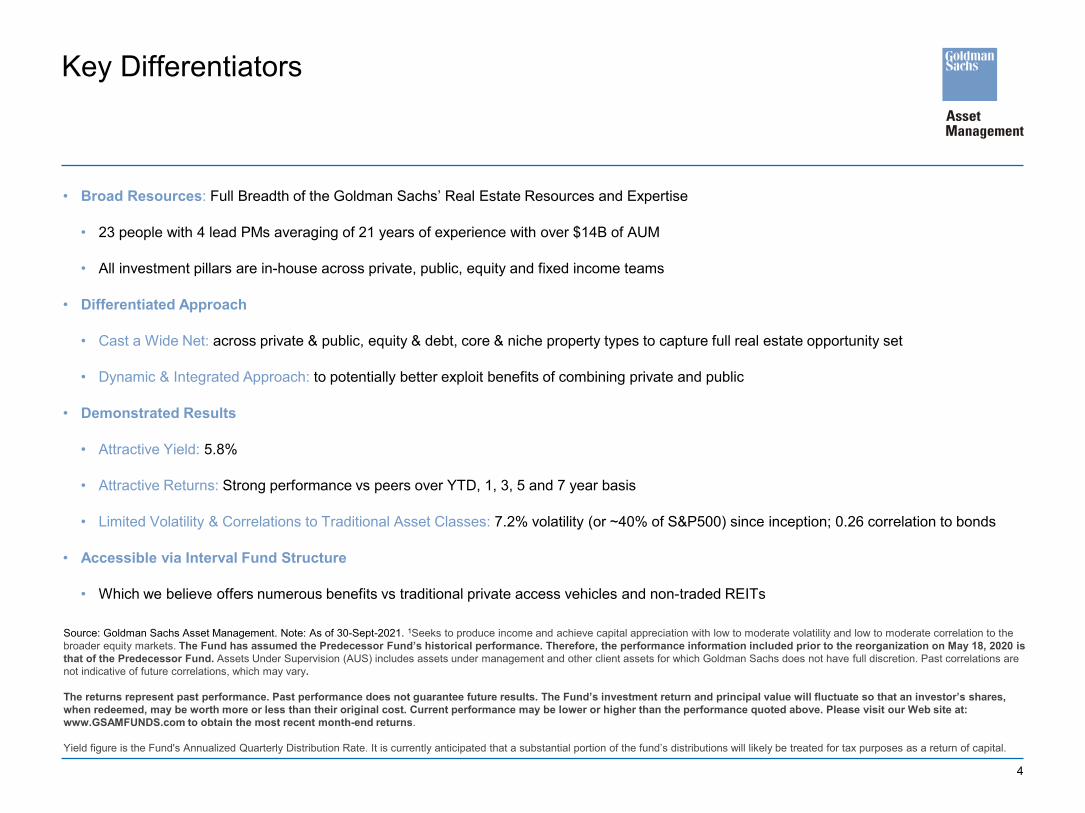
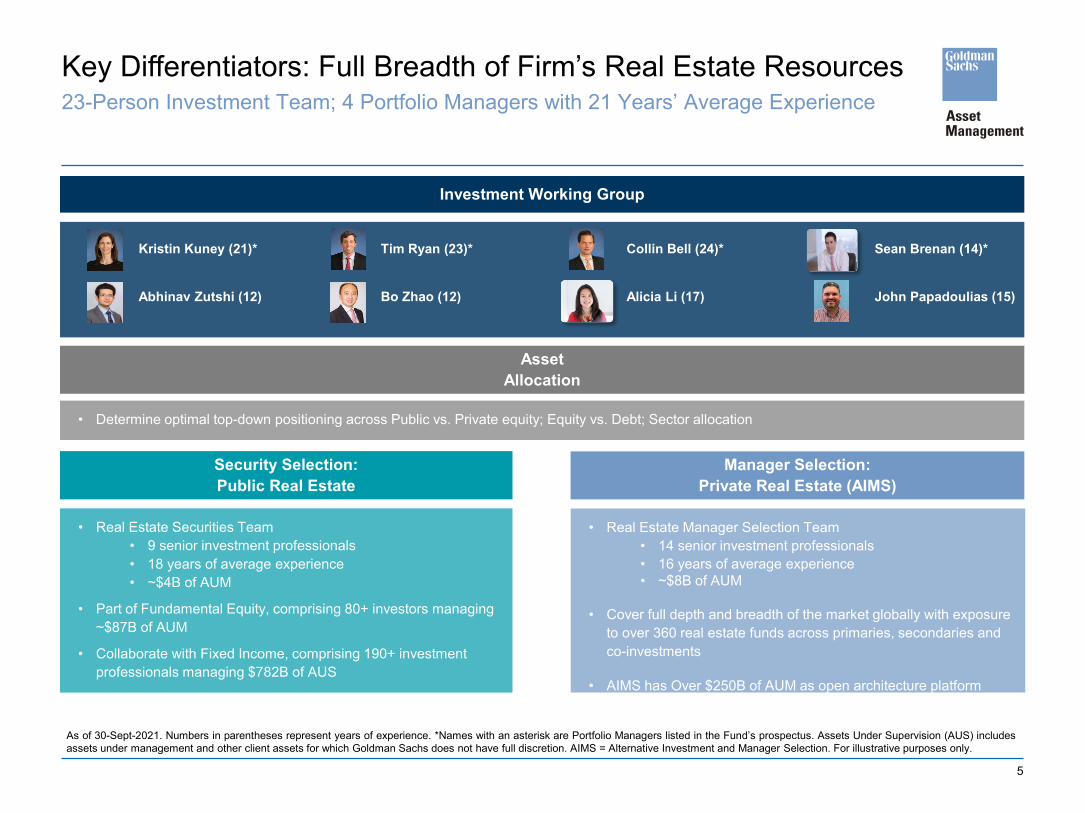
• Broad Resources: Full Breadth of the Goldman Sachs’ Real Estate Resources and Expertise
• 23 people with 4 lead PMs averaging of 21 years of experience with over $14B of AUM
• All investment pillars are in-house across private, public, equity and fixed income teams
• Differentiated Approach
• Cast a Wide Net: across private & public, equity & debt, core & niche property types to capture full real estate opportunity set
• Dynamic & Integrated Approach: to potentially better exploit benefits of combining private and public
• Demonstrated Results
• Attractive Yield: 5.8%
• Attractive Returns: Strong performance vs peers over YTD, 1, 3, 5 and 7 year basis
• Limited Volatility & Correlations to Traditional Asset Classes: 7.2% volatility (or ~40% of S&P500) since inception; 0.26 correlation to bonds
• Accessible via Interval Fund Structure
• Which we believe offers numerous benefits vs traditional private access vehicles and non-traded REITs
Source: Goldman Sachs Asset Management. Note: As of 30-Sept-2021. 1Seeks to produce income and achieve capital appreciation with low to moderate volatility and low to moderate correlation to the broader equity markets. The Fund has assumed the Predecessor Fund’s historical performance. Therefore, the performance information included prior to the reorganization on May 18, 2020 is that of the Predecessor Fund. Assets Under Supervision (AUS) includes assets under management and other client assets for which Goldman Sachs does not have full discretion. Past correlations are not indicative of future correlations, which may vary.
The returns represent past performance. Past performance does not guarantee future results. The Fund’s investment return and principal value will fluctuate so that an investor’s shares, when redeemed, may be worth more or less than their original cost. Current performance may be lower or higher than the performance quoted above. Please visit our Web site at: www.GSAMFUNDS.com to obtain the most recent month-end returns.
Yield figure is the Fund's Annualized Quarterly Distribution Rate. It is currently anticipated that a substantial portion of the fund’s distributions will likely be treated for tax purposes as a return of capital.
Key Differentiators
5
Security Selection:Public Real Estate
AssetAllocation
Manager Selection:Private Real Estate (AIMS)
As of 30-Sept-2021. Numbers in parentheses represent years of experience. *Names with an asterisk are Portfolio Managers listed in the Fund’s prospectus. Assets Under Supervision (AUS) includesassets under management and other client assets for which Goldman Sachs does not have full discretion. AIMS = Alternative Investment and Manager Selection. For illustrative purposes only.
• Real Estate Securities Team• 9 senior investment professionals • 18 years of average experience• ~$4B of AUM
• Part of Fundamental Equity, comprising 80+ investors managing ~$87B of AUM
• Collaborate with Fixed Income, comprising 190+ investment professionals managing $782B of AUS
• Real Estate Manager Selection Team• 14 senior investment professionals • 16 years of average experience• ~$8B of AUM
• Cover full depth and breadth of the market globally with exposure to over 360 real estate funds across primaries, secondaries and co-investments
• AIMS has Over $250B of AUM as open architecture platform
• Determine optimal top-down positioning across Public vs. Private equity; Equity vs. Debt; Sector allocation
Investment Working Group
Kristin Kuney (21)*
Abhinav Zutshi (12)
Collin Bell (24)*
Alicia Li (17)
Sean Brenan (14)*
John Papadoulias (15)
Tim Ryan (23)*
Bo Zhao (12)
23-Person Investment Team; 4 Portfolio Managers with 21 Years’ Average ExperienceKey Differentiators: Full Breadth of Firm’s Real Estate Resources
6
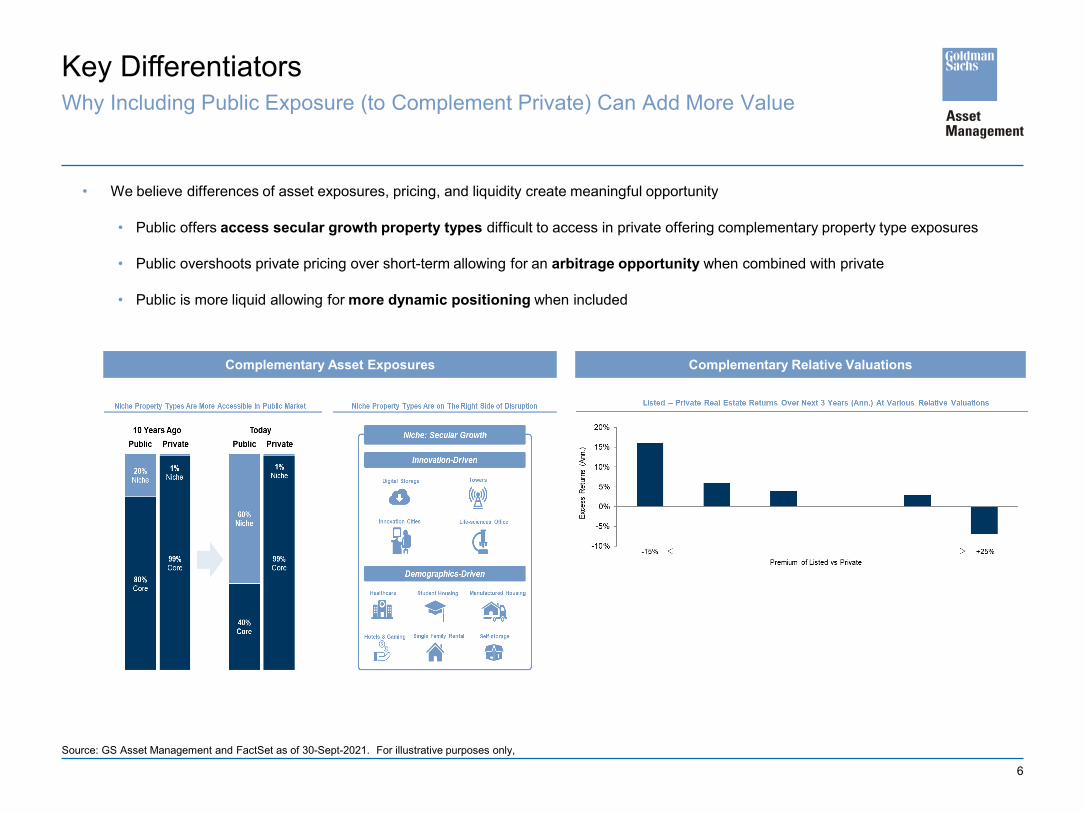
• We believe differences of asset exposures, pricing, and liquidity create meaningful opportunity
• Public offers access secular growth property types difficult to access in private offering complementary property type exposures
• Public overshoots private pricing over short-term allowing for an arbitrage opportunity when combined with private
• Public is more liquid allowing for more dynamic positioning when included
Complementary Asset Exposures Complementary Relative Valuations
Source: GS Asset Management and FactSet as of 30-Sept-2021. For illustrative purposes only,
Why Including Public Exposure (to Complement Private) Can Add More ValueKey Differentiators
7
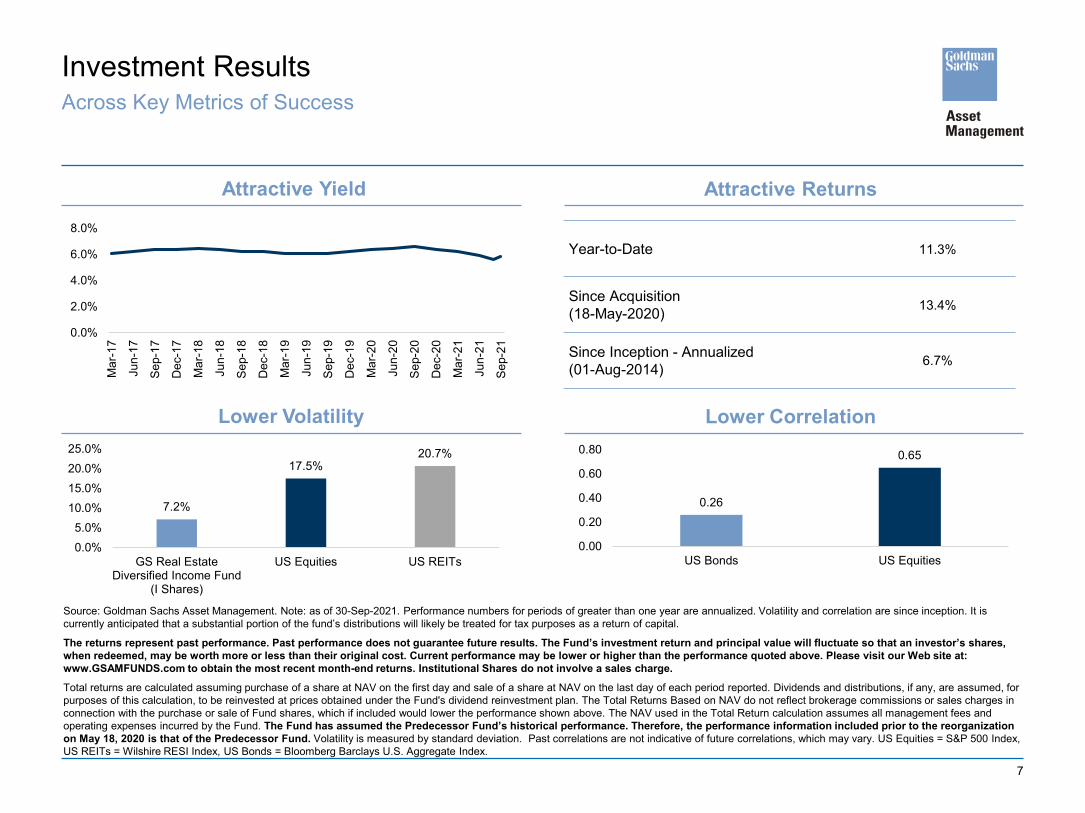
Investment Results Across Key Metrics of Success
Source: Goldman Sachs Asset Management. Note: as of 30-Sep-2021. Performance numbers for periods of greater than one year are annualized. Volatility and correlation are since inception. It is currently anticipated that a substantial portion of the fund’s distributions will likely be treated for tax purposes as a return of capital.
The returns represent past performance. Past performance does not guarantee future results. The Fund’s investment return and principal value will fluctuate so that an investor’s shares, when redeemed, may be worth more or less than their original cost. Current performance may be lower or higher than the performance quoted above. Please visit our Web site at: www.GSAMFUNDS.com to obtain the most recent month-end returns. Institutional Shares do not involve a sales charge.
Total returns are calculated assuming purchase of a share at NAV on the first day and sale of a share at NAV on the last day of each period reported. Dividends and distributions, if any, are assumed, for purposes of this calculation, to be reinvested at prices obtained under the Fund's dividend reinvestment plan. The Total Returns Based on NAV do not reflect brokerage commissions or sales charges in connection with the purchase or sale of Fund shares, which if included would lower the performance shown above. The NAV used in the Total Return calculation assumes all management fees and operating expenses incurred by the Fund. The Fund has assumed the Predecessor Fund’s historical performance. Therefore, the performance information included prior to the reorganization on May 18, 2020 is that of the Predecessor Fund. Volatility is measured by standard deviation. Past correlations are not indicative of future correlations, which may vary. US Equities = S&P 500 Index, US REITs = Wilshire RESI Index, US Bonds = Bloomberg Barclays U.S. Aggregate Index.
Year-to-Date 11.3%
Since Acquisition(18-May-2020) 13.4%
Since Inception - Annualized(01-Aug-2014) 6.7%
0.0%
2.0%
4.0%
6.0%
8.0%
Mar
-17
Jun-
17
Sep-
17
Dec
-17
Mar
-18
Jun-
18
Sep-
18
Dec
-18
Mar
-19
Jun-
19
Sep-
19
Dec
-19
Mar
-20
Jun-
20
Sep-
20
Dec
-20
Mar
-21
Jun-
21
Sep-
21
Lower Volatility Lower Correlation
Attractive Yield Attractive Returns
0.26
0.65
0.00
0.20
0.40
0.60
0.80
US Bonds US Equities
7.2%
17.5%20.7%
0.0%5.0%
10.0%15.0%20.0%25.0%
GS Real EstateDiversified Income Fund
(I Shares)
US Equities US REITs
8
Investment Results
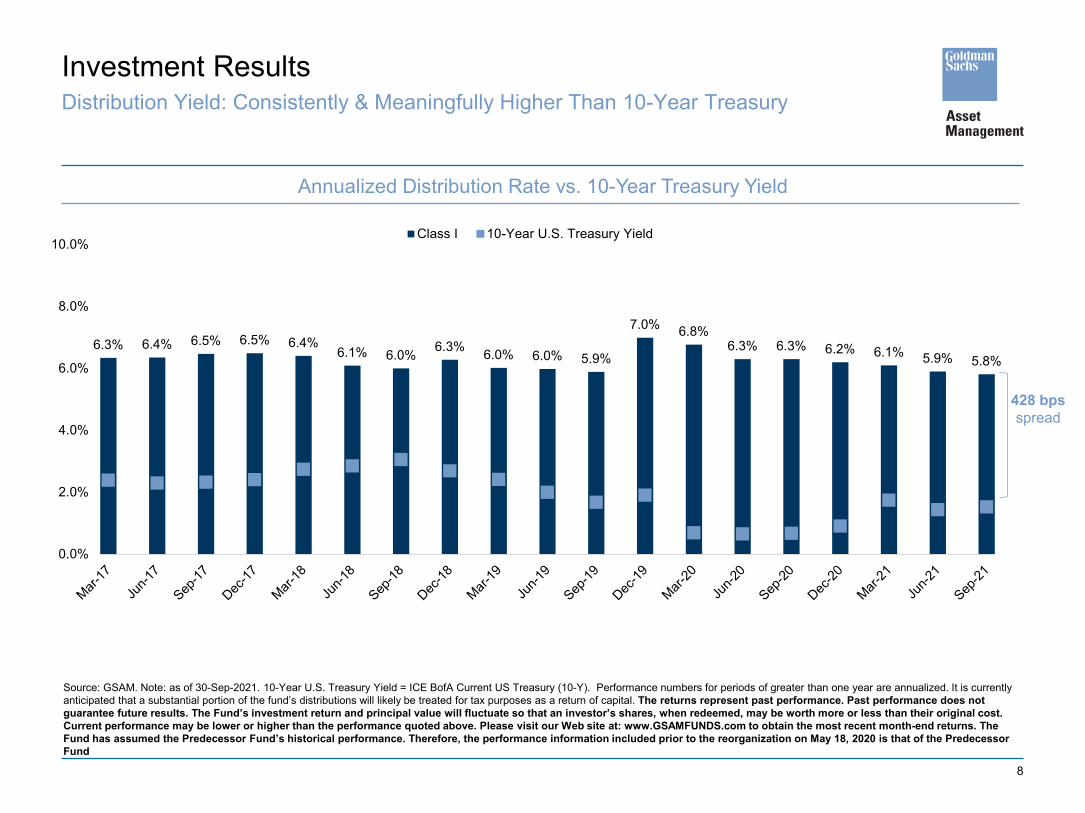
Source: GSAM. Note: as of 30-Sep-2021. 10-Year U.S. Treasury Yield = ICE BofA Current US Treasury (10-Y). Performance numbers for periods of greater than one year are annualized. It is currently anticipated that a substantial portion of the fund’s distributions will likely be treated for tax purposes as a return of capital. The returns represent past performance. Past performance does not guarantee future results. The Fund’s investment return and principal value will fluctuate so that an investor’s shares, when redeemed, may be worth more or less than their original cost. Current performance may be lower or higher than the performance quoted above. Please visit our Web site at: www.GSAMFUNDS.com to obtain the most recent month-end returns. The Fund has assumed the Predecessor Fund’s historical performance. Therefore, the performance information included prior to the reorganization on May 18, 2020 is that of the Predecessor Fund
Annualized Distribution Rate vs. 10-Year Treasury Yield
428 bpsspread
Distribution Yield: Consistently & Meaningfully Higher Than 10-Year Treasury
6.3% 6.4% 6.5% 6.5% 6.4%6.1% 6.0% 6.3% 6.0% 6.0% 5.9%
7.0% 6.8%6.3% 6.3% 6.2% 6.1% 5.9% 5.8%
0.0%
2.0%
4.0%
6.0%
8.0%
10.0%Class I 10-Year U.S. Treasury Yield

Portfolio Positioning
10
Source: Goldman Sachs Asset Management. Note. For illustrative purposes only. Fund holdings and allocations shown are unaudited, and may not be representative of current or future investments. Fund holdings and allocations may not include the Fund's entire investment portfolio, which may change at any time. Fund holdings should not be relied on in making investment decisions and should not be construed as research or investment advice regarding particular securities. Current and future holdings are subject to risk.
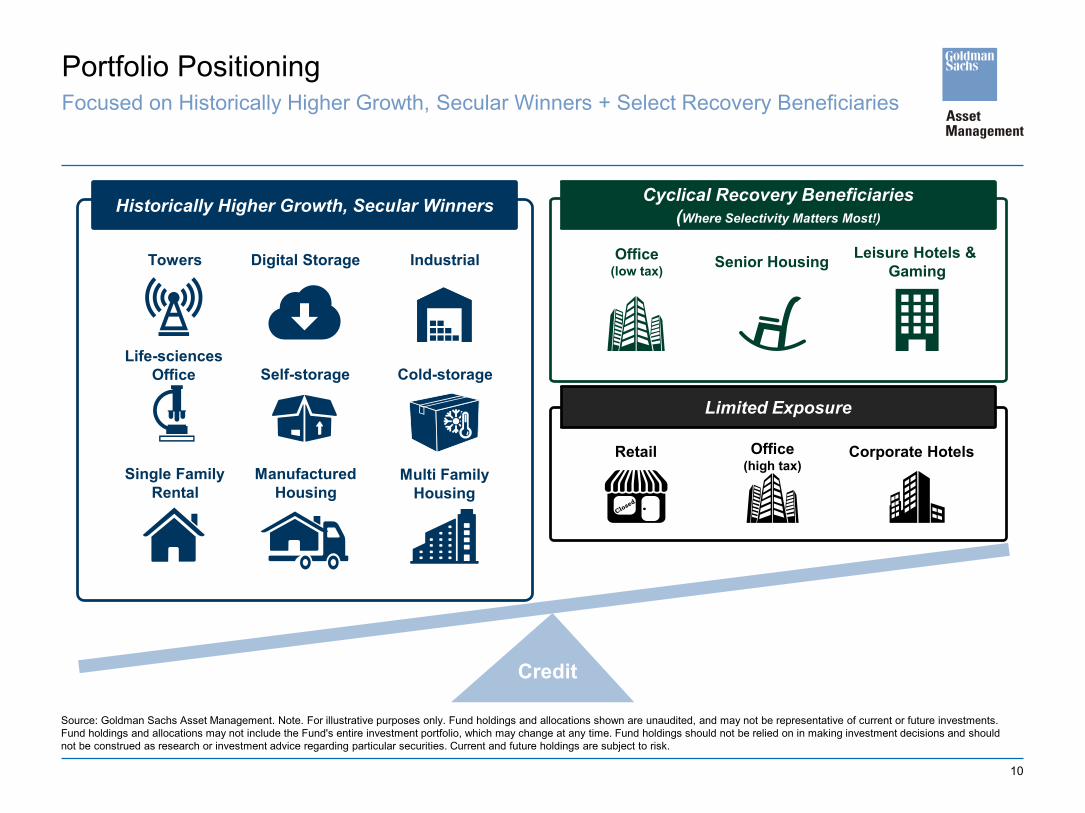
Portfolio PositioningFocused on Historically Higher Growth, Secular Winners + Select Recovery Beneficiaries
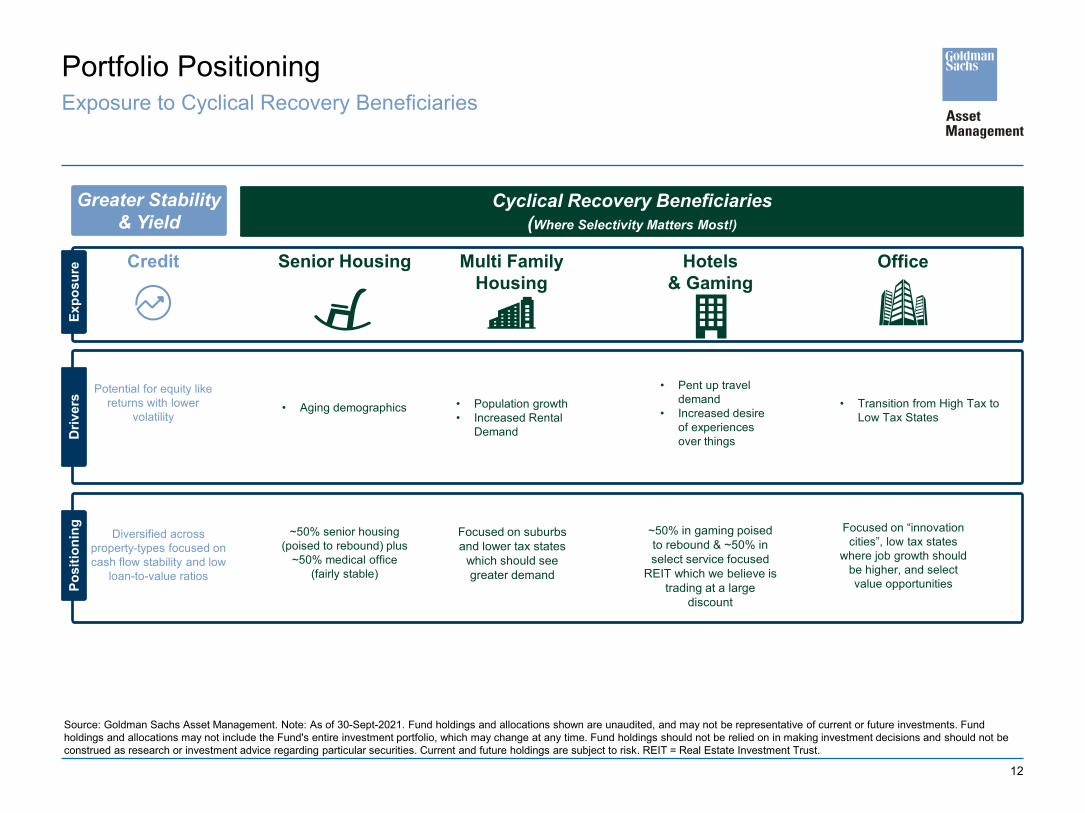
Credit
Senior Housing Leisure Hotels & Gaming
Historically Higher Growth, Secular Winners Cyclical Recovery Beneficiaries (Where Selectivity Matters Most!)
Office(low tax)
Towers Digital Storage Industrial
Life-sciencesOffice
Single FamilyRental
Self-storage
ManufacturedHousing
Multi FamilyHousing
Cold-storage
Limited Exposure
Office(high tax)
Retail Corporate Hotels
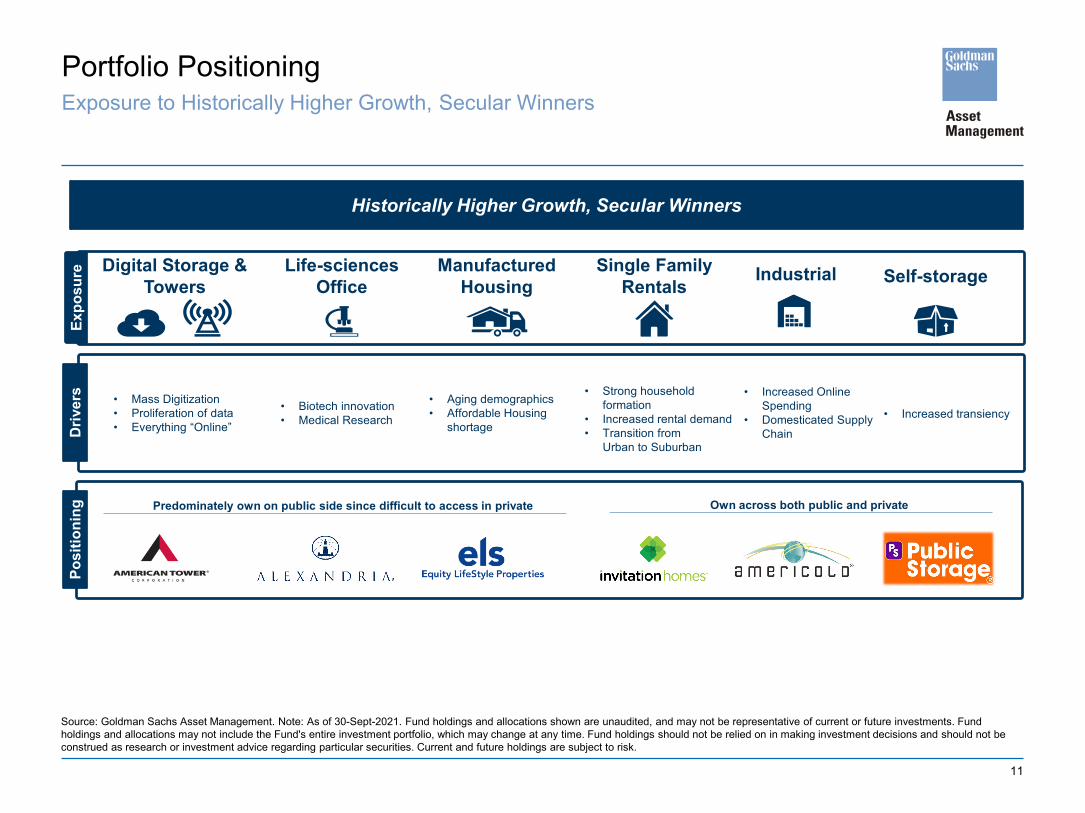
11
Expo
sure
Driv
ers
Digital Storage & Towers
• Mass Digitization• Proliferation of data• Everything “Online”
Life-sciencesOffice
• Biotech innovation• Medical Research
Industrial
• Increased Online Spending
• Domesticated Supply Chain
Source: Goldman Sachs Asset Management. Note: As of 30-Sept-2021. Fund holdings and allocations shown are unaudited, and may not be representative of current or future investments. Fund holdings and allocations may not include the Fund's entire investment portfolio, which may change at any time. Fund holdings should not be relied on in making investment decisions and should not be construed as research or investment advice regarding particular securities. Current and future holdings are subject to risk.
Posi
tioni
ng
• Aging demographics• Affordable Housing
shortage
ManufacturedHousing
• Strong household formation
• Increased rental demand• Transition from
Urban to Suburban
• Increased transiency
Single FamilyRentals Self-storage
Portfolio PositioningExposure to Historically Higher Growth, Secular Winners
Historically Higher Growth, Secular Winners
Predominately own on public side since difficult to access in private Own across both public and private
12
Driv
ers
• Aging demographics
Expo
sure Senior HousingCredit
Source: Goldman Sachs Asset Management. Note: As of 30-Sept-2021. Fund holdings and allocations shown are unaudited, and may not be representative of current or future investments. Fund holdings and allocations may not include the Fund's entire investment portfolio, which may change at any time. Fund holdings should not be relied on in making investment decisions and should not be construed as research or investment advice regarding particular securities. Current and future holdings are subject to risk. REIT = Real Estate Investment Trust.
Posi
tioni
ng ~50% senior housing (poised to rebound) plus
~50% medical office (fairly stable)
Potential for equity like returns with lower
volatility
Diversified across property-types focused on cash flow stability and low
loan-to-value ratios
Portfolio PositioningExposure to Cyclical Recovery Beneficiaries
• Population growth• Increased Rental
Demand
• Pent up travel demand
• Increased desire of experiences over things
Multi FamilyHousing
Hotels& Gaming
Focused on suburbs and lower tax states
which should see greater demand
~50% in gaming poised to rebound & ~50% in select service focused
REIT which we believe is trading at a large
discount
• Transition from High Tax to Low Tax States
Office
Focused on “innovation cities”, low tax states
where job growth should be higher, and select value opportunities
Greater Stability & Yield
Cyclical Recovery Beneficiaries (Where Selectivity Matters Most!)
13
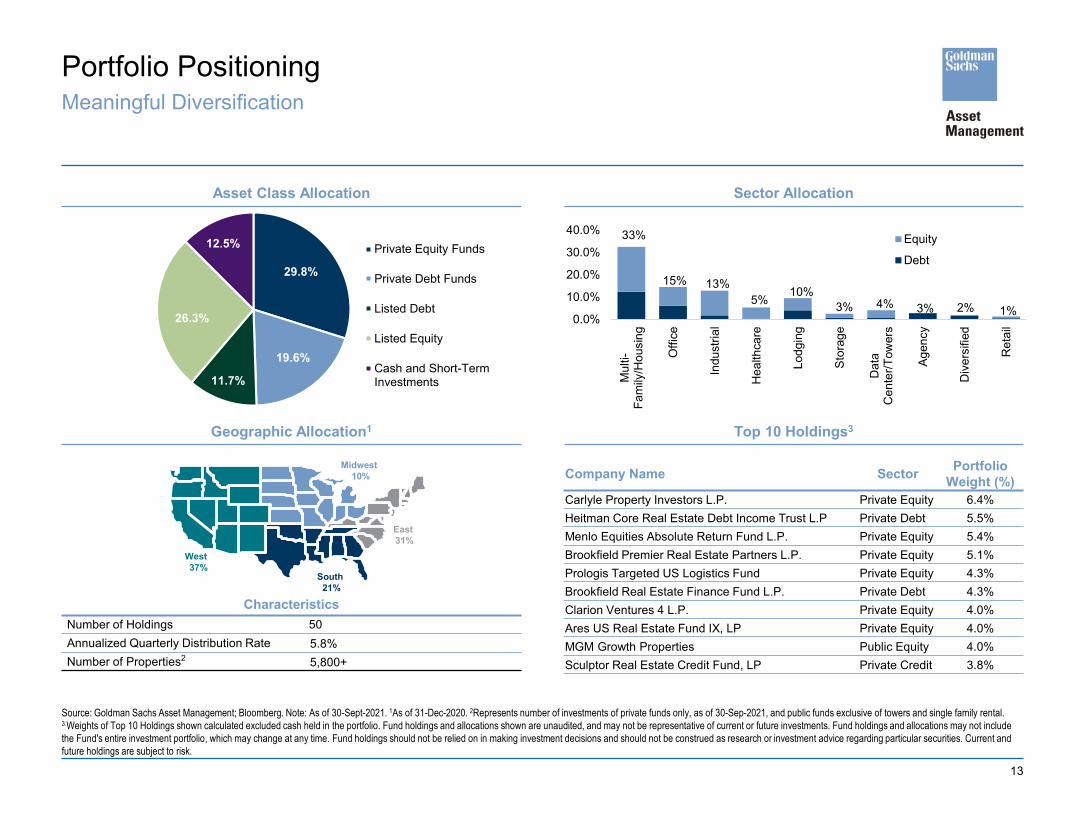
29.8%
19.6%
11.7%
26.3%
12.5% Private Equity Funds
Private Debt Funds
Listed Debt
Listed Equity
Cash and Short-TermInvestments
Portfolio PositioningMeaningful Diversification
Asset Class Allocation Sector Allocation
Source: Goldman Sachs Asset Management; Bloomberg. Note: As of 30-Sept-2021. 1As of 31-Dec-2020. 2Represents number of investments of private funds only, as of 30-Sep-2021, and public funds exclusive of towers and single family rental. 3.Weights of Top 10 Holdings shown calculated excluded cash held in the portfolio. Fund holdings and allocations shown are unaudited, and may not be representative of current or future investments. Fund holdings and allocations may not include the Fund's entire investment portfolio, which may change at any time. Fund holdings should not be relied on in making investment decisions and should not be construed as research or investment advice regarding particular securities. Current and future holdings are subject to risk.
Geographic Allocation1 Top 10 Holdings3
CharacteristicsNumber of Holdings 50Annualized Quarterly Distribution Rate 5.8%Number of Properties2 5,800+
Midwest10%
East31%
South21%
West37%
33%
15% 13%5% 10%
3% 4% 3% 2% 1%0.0%
10.0%
20.0%
30.0%
40.0%
Mul
ti-Fa
mily
/Hou
sing
Offi
ce
Indu
stria
l
Hea
lthca
re
Lodg
ing
Stor
age
Dat
aC
ente
r/Tow
ers
Agen
cy
Div
ersi
fied
Ret
ail
Equity
Debt
Company Name Sector Portfolio Weight (%)
Carlyle Property Investors L.P. Private Equity 6.4%Heitman Core Real Estate Debt Income Trust L.P Private Debt 5.5%Menlo Equities Absolute Return Fund L.P. Private Equity 5.4%Brookfield Premier Real Estate Partners L.P. Private Equity 5.1%Prologis Targeted US Logistics Fund Private Equity 4.3%Brookfield Real Estate Finance Fund L.P. Private Debt 4.3%Clarion Ventures 4 L.P. Private Equity 4.0%Ares US Real Estate Fund IX, LP Private Equity 4.0%MGM Growth Properties Public Equity 4.0%Sculptor Real Estate Credit Fund, LP Private Credit 3.8%

14
Meaningful Diversification: >5,800 Properties Across Property-Type, Geography, & Asset Class
Portfolio Positioning
As of 30-Sept-2021. Source: Goldman Sachs Asset Management. Fund holdings and allocations shown are unaudited, and may not be representative of current or future investments. Fund holdings and allocations may not include the Fund's entire investment portfolio, which may change at any time. Fund holdings should not be relied on in making investment decisions and should not be construed as research or investment advice regarding particular securities. Current and future holdings are subject to risk. Number of properties represents number of investments of private funds only, as of 31-Dec-2020,. These images were selected to illustrate the exposures to various property types within the underlying holdings of the fund. Diversification does not protect an investor from market risk and does not ensure a profit.
Office | San Diego, CAAlexandria Real Estate Equities
Life Science Office
Hotels | Las Vegas, NVMGP
Leisure Hotels & Gaming
Communications | United StatesAmerican Tower Corporation
Towers & Digital Storage
GRADLABS MGM GRAND LATTICE TOWER
15
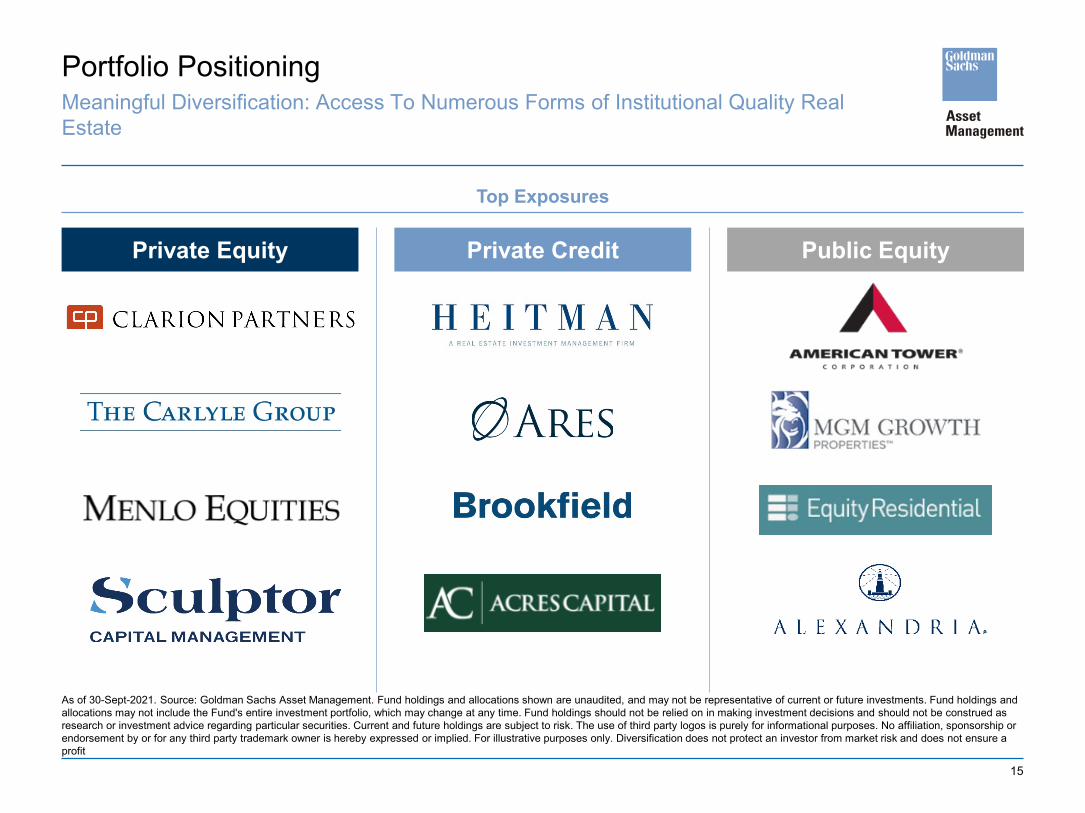
Meaningful Diversification: Access To Numerous Forms of Institutional Quality Real Estate
Portfolio Positioning
As of 30-Sept-2021. Source: Goldman Sachs Asset Management. Fund holdings and allocations shown are unaudited, and may not be representative of current or future investments. Fund holdings and allocations may not include the Fund's entire investment portfolio, which may change at any time. Fund holdings should not be relied on in making investment decisions and should not be construed as research or investment advice regarding particular securities. Current and future holdings are subject to risk. The use of third party logos is purely for informational purposes. No affiliation, sponsorship or endorsement by or for any third party trademark owner is hereby expressed or implied. For illustrative purposes only. Diversification does not protect an investor from market risk and does not ensure a profit
Top Exposures
Private Equity Private Credit Public Equity

Real Estate Outlook
17
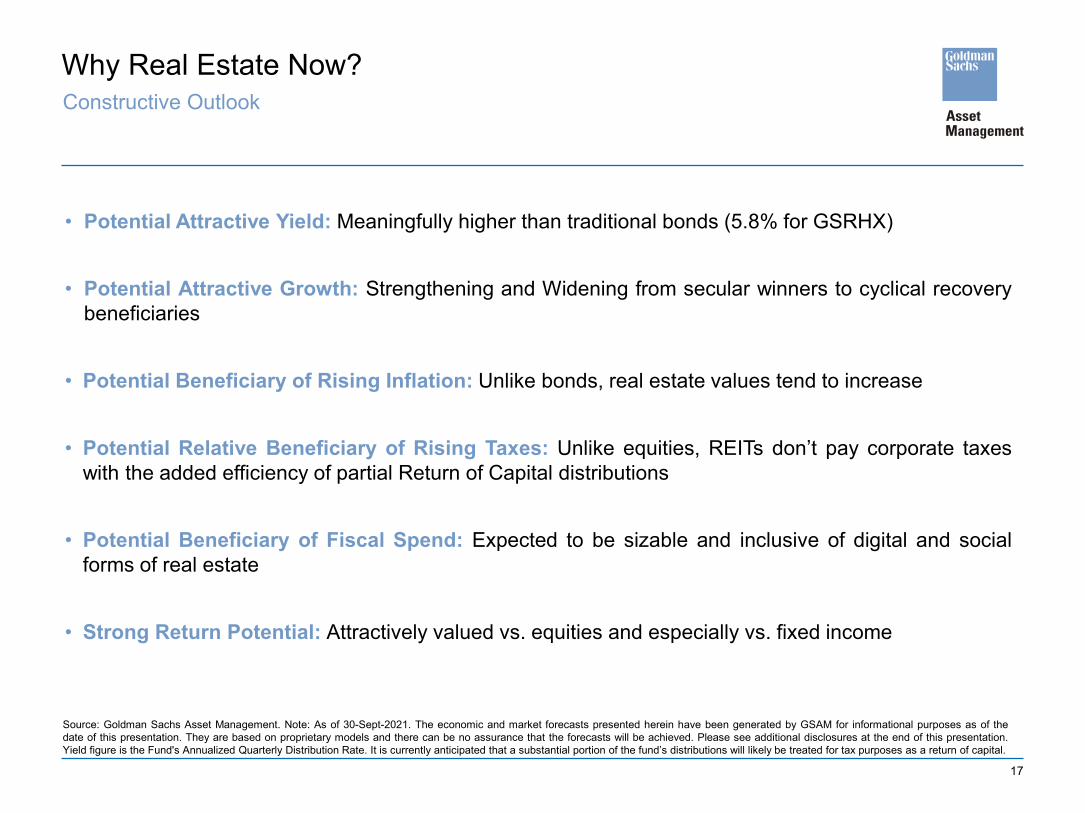
Why Real Estate Now?Constructive Outlook
• Potential Attractive Yield: Meaningfully higher than traditional bonds (5.8% for GSRHX)
• Potential Attractive Growth: Strengthening and Widening from secular winners to cyclical recoverybeneficiaries
• Potential Beneficiary of Rising Inflation: Unlike bonds, real estate values tend to increase
• Potential Relative Beneficiary of Rising Taxes: Unlike equities, REITs don’t pay corporate taxeswith the added efficiency of partial Return of Capital distributions
• Potential Beneficiary of Fiscal Spend: Expected to be sizable and inclusive of digital and socialforms of real estate
• Strong Return Potential: Attractively valued vs. equities and especially vs. fixed income
Source: Goldman Sachs Asset Management. Note: As of 30-Sept-2021. The economic and market forecasts presented herein have been generated by GSAM for informational purposes as of thedate of this presentation. They are based on proprietary models and there can be no assurance that the forecasts will be achieved. Please see additional disclosures at the end of this presentation.Yield figure is the Fund's Annualized Quarterly Distribution Rate. It is currently anticipated that a substantial portion of the fund’s distributions will likely be treated for tax purposes as a return of capital.
18
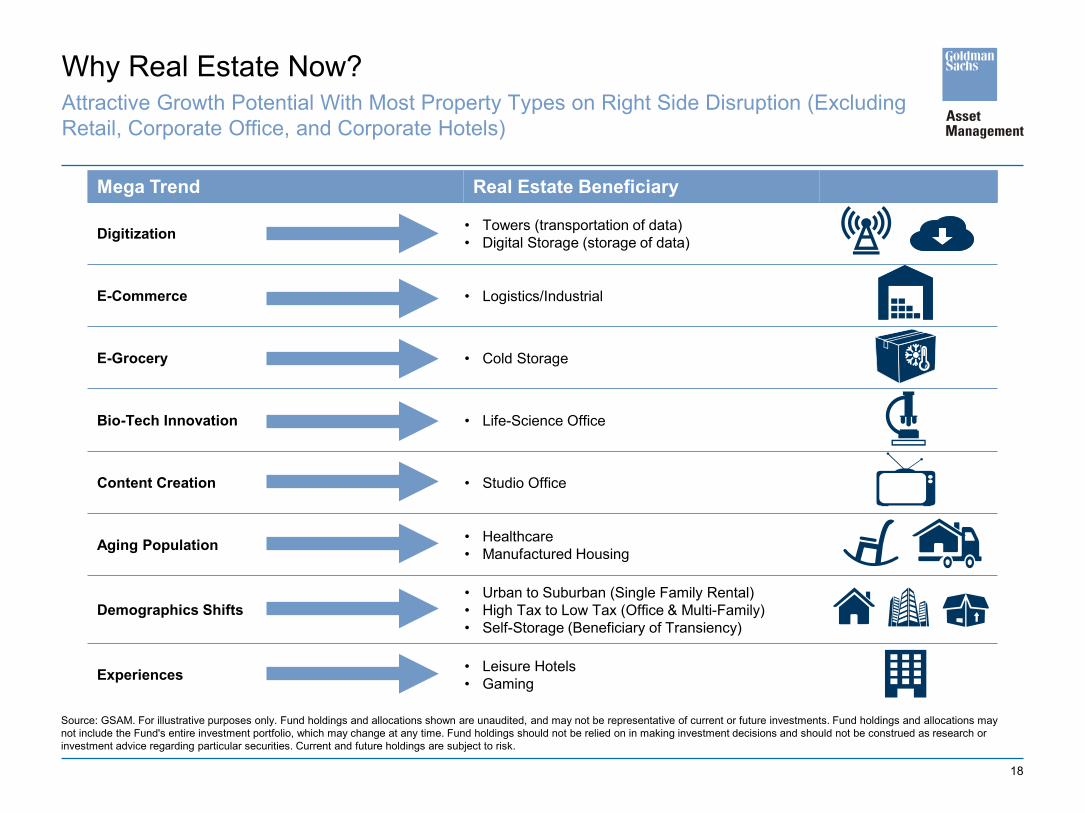
Mega Trend Real Estate Beneficiary
Digitization • Towers (transportation of data) • Digital Storage (storage of data)
E-Commerce • Logistics/Industrial
E-Grocery • Cold Storage
Bio-Tech Innovation • Life-Science Office
Content Creation • Studio Office
Aging Population • Healthcare• Manufactured Housing
Demographics Shifts• Urban to Suburban (Single Family Rental)• High Tax to Low Tax (Office & Multi-Family)• Self-Storage (Beneficiary of Transiency)
Experiences • Leisure Hotels • Gaming
Why Real Estate Now?Attractive Growth Potential With Most Property Types on Right Side Disruption (ExcludingRetail, Corporate Office, and Corporate Hotels)
Source: GSAM. For illustrative purposes only. Fund holdings and allocations shown are unaudited, and may not be representative of current or future investments. Fund holdings and allocations may not include the Fund's entire investment portfolio, which may change at any time. Fund holdings should not be relied on in making investment decisions and should not be construed as research or investment advice regarding particular securities. Current and future holdings are subject to risk.
19
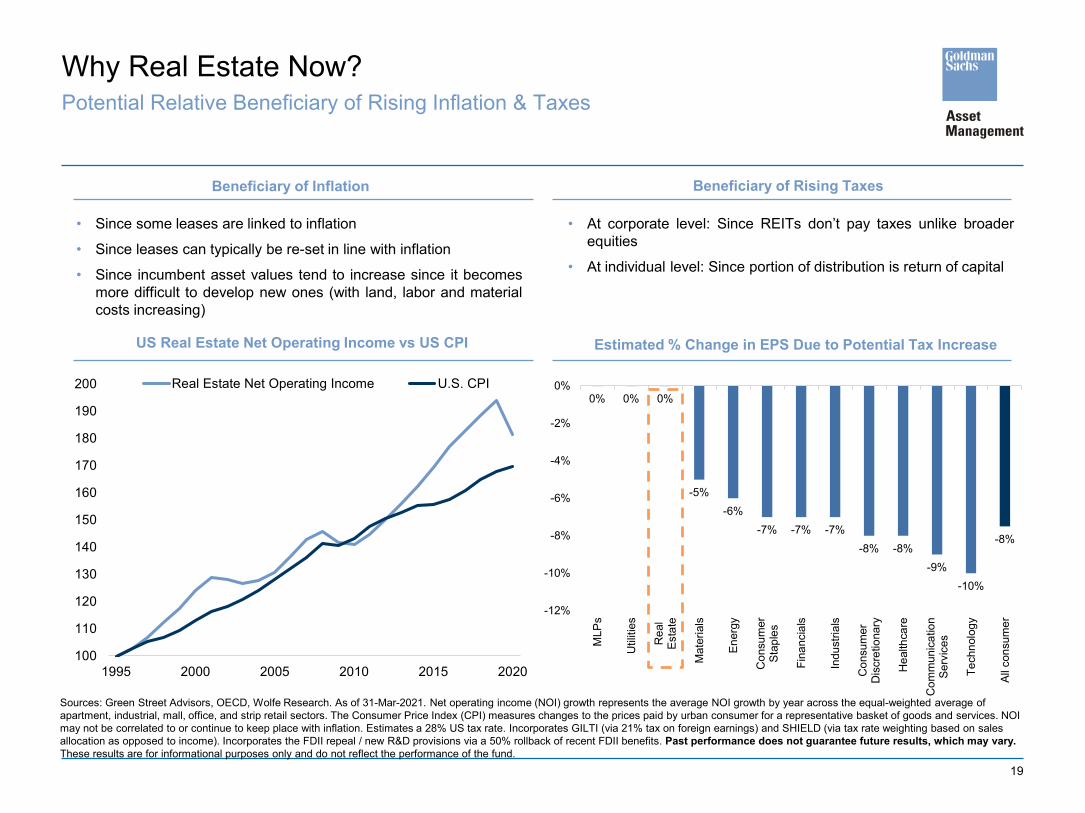
Why Real Estate Now?Potential Relative Beneficiary of Rising Inflation & Taxes
Sources: Green Street Advisors, OECD, Wolfe Research. As of 31-Mar-2021. Net operating income (NOI) growth represents the average NOI growth by year across the equal-weighted average of apartment, industrial, mall, office, and strip retail sectors. The Consumer Price Index (CPI) measures changes to the prices paid by urban consumer for a representative basket of goods and services. NOI may not be correlated to or continue to keep place with inflation. Estimates a 28% US tax rate. Incorporates GILTI (via 21% tax on foreign earnings) and SHIELD (via tax rate weighting based on sales allocation as opposed to income). Incorporates the FDII repeal / new R&D provisions via a 50% rollback of recent FDII benefits. Past performance does not guarantee future results, which may vary.These results are for informational purposes only and do not reflect the performance of the fund.
100
110
120
130
140
150
160
170
180
190
200
1995 2000 2005 2010 2015 2020
Real Estate Net Operating Income U.S. CPI
• At corporate level: Since REITs don’t pay taxes unlike broaderequities
• At individual level: Since portion of distribution is return of capital
• Since some leases are linked to inflation
• Since leases can typically be re-set in line with inflation
• Since incumbent asset values tend to increase since it becomesmore difficult to develop new ones (with land, labor and materialcosts increasing)
0% 0% 0%
-5%-6%
-7% -7% -7%-8% -8%
-9%-10%
-8%
-12%
-10%
-8%
-6%
-4%
-2%
0%
MLP
s
Util
ities
Rea
lEs
tate
Mat
eria
ls
Ener
gy
Con
sum
erSt
aple
s
Fina
ncia
ls
Indu
stria
ls
Con
sum
erD
iscr
etio
nary
Hea
lthca
re
Com
mun
icat
ion
Serv
ices
Tech
nolo
gy
All c
onsu
mer
Beneficiary of Inflation Beneficiary of Rising Taxes
Estimated % Change in EPS Due to Potential Tax IncreaseUS Real Estate Net Operating Income vs US CPI
20
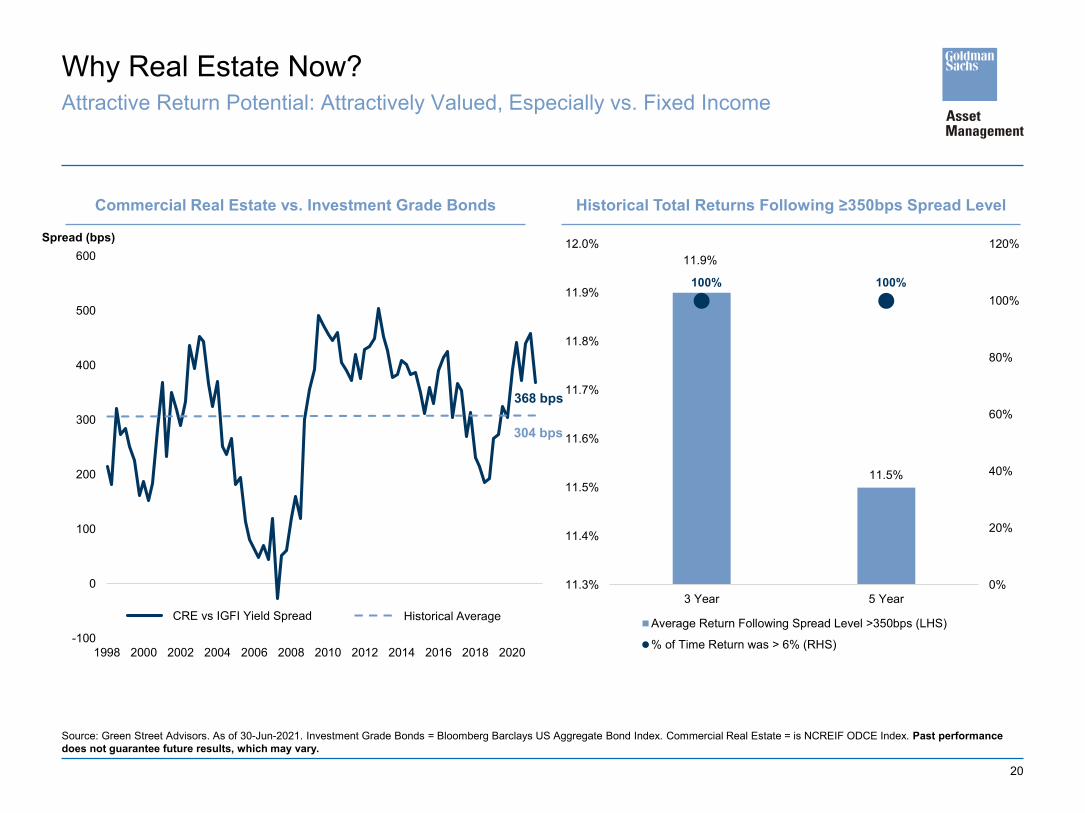
Why Real Estate Now?Attractive Return Potential: Attractively Valued, Especially vs. Fixed Income
Source: Green Street Advisors. As of 30-Jun-2021. Investment Grade Bonds = Bloomberg Barclays US Aggregate Bond Index. Commercial Real Estate = is NCREIF ODCE Index. Past performance does not guarantee future results, which may vary.
Commercial Real Estate vs. Investment Grade Bonds
Spread (bps)
Historical Total Returns Following ≥350bps Spread Level
CRE vs IGFI Yield Spread
-100
0
100
200
300
400
500
600
1998 2000 2002 2004 2006 2008 2010 2012 2014 2016 2018 2020
11.9%
11.5%
100% 100%
0%
20%
40%
60%
80%
100%
120%
11.3%
11.4%
11.5%
11.6%
11.7%
11.8%
11.9%
12.0%
3 Year 5 Year
Average Return Following Spread Level >350bps (LHS)
% of Time Return was > 6% (RHS)
368 bps
304 bps
Historical Average

Peer Analysis
22
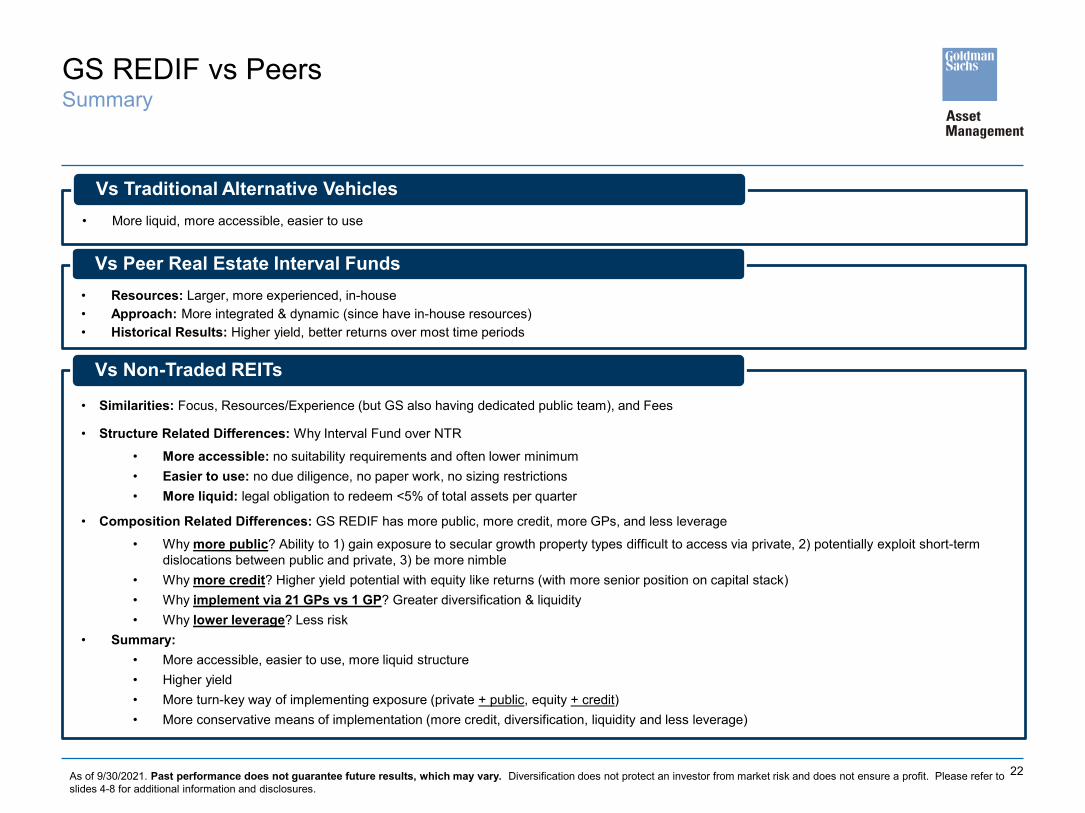
GS REDIF vs PeersSummary
• Resources: Larger, more experienced, in-house• Approach: More integrated & dynamic (since have in-house resources)• Historical Results: Higher yield, better returns over most time periods
Vs Peer Real Estate Interval Funds
• Similarities: Focus, Resources/Experience (but GS also having dedicated public team), and Fees
• Structure Related Differences: Why Interval Fund over NTR
• More accessible: no suitability requirements and often lower minimum• Easier to use: no due diligence, no paper work, no sizing restrictions• More liquid: legal obligation to redeem <5% of total assets per quarter
• Composition Related Differences: GS REDIF has more public, more credit, more GPs, and less leverage
• Why more public? Ability to 1) gain exposure to secular growth property types difficult to access via private, 2) potentially exploit short-term dislocations between public and private, 3) be more nimble
• Why more credit? Higher yield potential with equity like returns (with more senior position on capital stack)• Why implement via 21 GPs vs 1 GP? Greater diversification & liquidity• Why lower leverage? Less risk
• Summary:• More accessible, easier to use, more liquid structure• Higher yield• More turn-key way of implementing exposure (private + public, equity + credit)• More conservative means of implementation (more credit, diversification, liquidity and less leverage)
Vs Non-Traded REITs
As of 9/30/2021. Past performance does not guarantee future results, which may vary. Diversification does not protect an investor from market risk and does not ensure a profit. Please refer to slides 4-8 for additional information and disclosures.
• More liquid, more accessible, easier to use
Vs Traditional Alternative Vehicles

Appendix
24
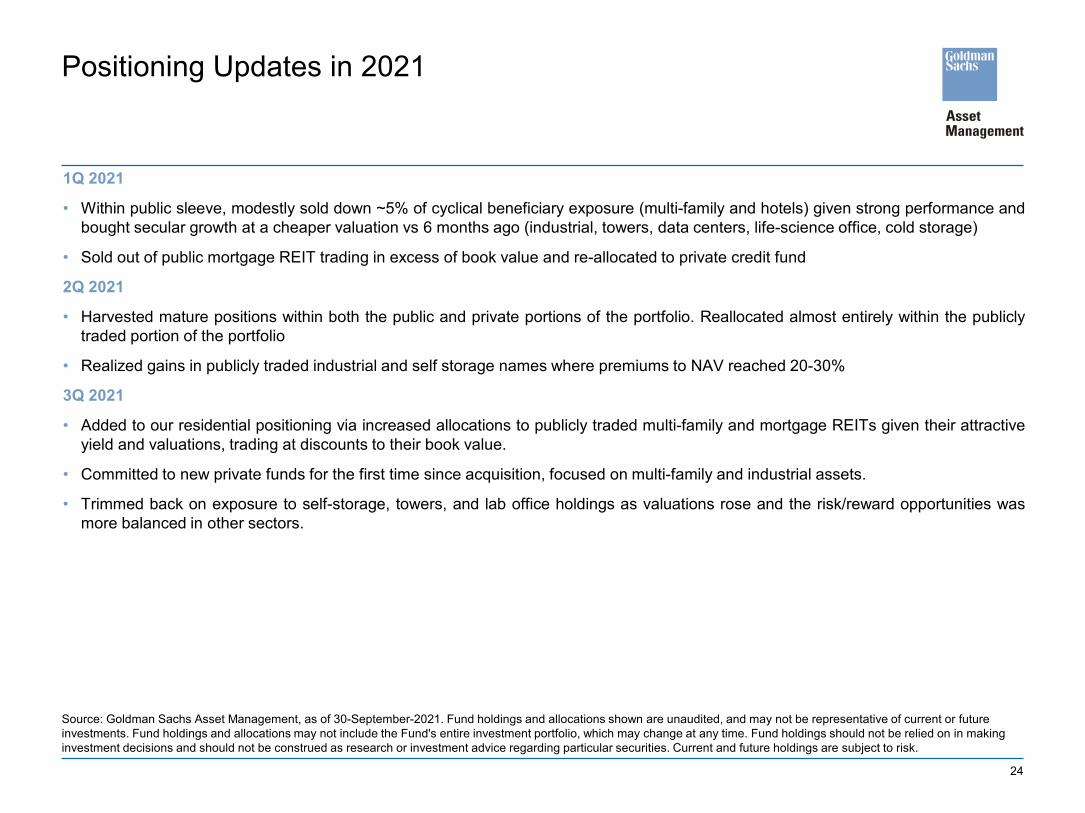
1Q 2021
• Within public sleeve, modestly sold down ~5% of cyclical beneficiary exposure (multi-family and hotels) given strong performance andbought secular growth at a cheaper valuation vs 6 months ago (industrial, towers, data centers, life-science office, cold storage)
• Sold out of public mortgage REIT trading in excess of book value and re-allocated to private credit fund
2Q 2021
• Harvested mature positions within both the public and private portions of the portfolio. Reallocated almost entirely within the publiclytraded portion of the portfolio
• Realized gains in publicly traded industrial and self storage names where premiums to NAV reached 20-30%
3Q 2021
• Added to our residential positioning via increased allocations to publicly traded multi-family and mortgage REITs given their attractiveyield and valuations, trading at discounts to their book value.
• Committed to new private funds for the first time since acquisition, focused on multi-family and industrial assets.
• Trimmed back on exposure to self-storage, towers, and lab office holdings as valuations rose and the risk/reward opportunities wasmore balanced in other sectors.
Positioning Updates in 2021
Source: Goldman Sachs Asset Management, as of 30-September-2021. Fund holdings and allocations shown are unaudited, and may not be representative of current or future investments. Fund holdings and allocations may not include the Fund's entire investment portfolio, which may change at any time. Fund holdings should not be relied on in making investment decisions and should not be construed as research or investment advice regarding particular securities. Current and future holdings are subject to risk.
25
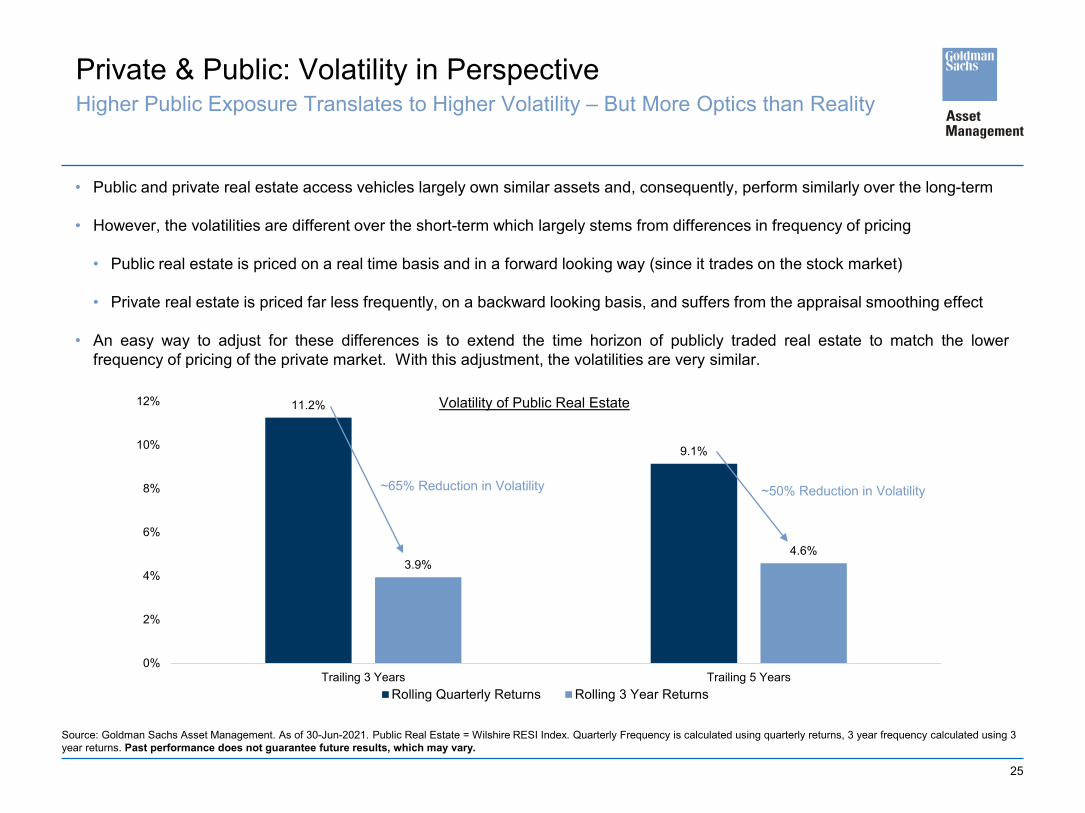
Private & Public: Volatility in PerspectiveHigher Public Exposure Translates to Higher Volatility – But More Optics than Reality
• Public and private real estate access vehicles largely own similar assets and, consequently, perform similarly over the long-term
• However, the volatilities are different over the short-term which largely stems from differences in frequency of pricing
• Public real estate is priced on a real time basis and in a forward looking way (since it trades on the stock market)
• Private real estate is priced far less frequently, on a backward looking basis, and suffers from the appraisal smoothing effect
• An easy way to adjust for these differences is to extend the time horizon of publicly traded real estate to match the lowerfrequency of pricing of the private market. With this adjustment, the volatilities are very similar.
Source: Goldman Sachs Asset Management. As of 30-Jun-2021. Public Real Estate = Wilshire RESI Index. Quarterly Frequency is calculated using quarterly returns, 3 year frequency calculated using 3 year returns. Past performance does not guarantee future results, which may vary.
11.2%
9.1%
3.9%4.6%
0%
2%
4%
6%
8%
10%
12%
Trailing 3 Years Trailing 5 Years
Volatility of Public Real Estate
Rolling Quarterly Returns Rolling 3 Year Returns
~65% Reduction in Volatility ~50% Reduction in Volatility
26
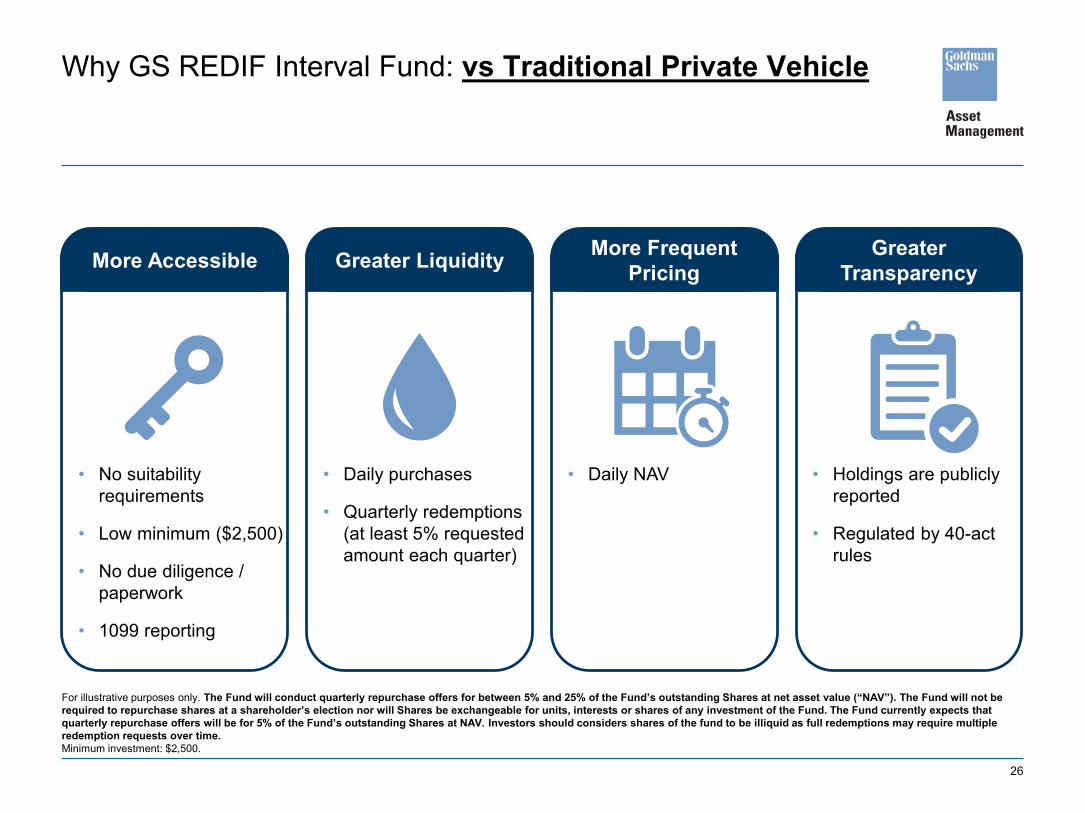
Why GS REDIF Interval Fund: vs Traditional Private Vehicle
• No suitability requirements
• Low minimum ($2,500)
• No due diligence / paperwork
• 1099 reporting
More Accessible
• Daily purchases
• Quarterly redemptions (at least 5% requested amount each quarter)
Greater Liquidity
• Daily NAV
More Frequent Pricing
• Holdings are publicly reported
• Regulated by 40-act rules
Greater Transparency
For illustrative purposes only. The Fund will conduct quarterly repurchase offers for between 5% and 25% of the Fund’s outstanding Shares at net asset value (“NAV”). The Fund will not be required to repurchase shares at a shareholder’s election nor will Shares be exchangeable for units, interests or shares of any investment of the Fund. The Fund currently expects thatquarterly repurchase offers will be for 5% of the Fund’s outstanding Shares at NAV. Investors should considers shares of the fund to be illiquid as full redemptions may require multiple redemption requests over time. Minimum investment: $2,500.

27
Portfolio Management Team BiosGoldman Sachs Real Estate Diversified Income Fund
Kristin KuneyManaging Director, Global Public Real Estate and Infrastructure Kristin Kuney is the co-lead portfolio manager of the REITs and Global Infrastructure strategies within the Fundamental Equity team of Goldman Sachs Asset Management in the Investment Management Division. She also has primary research responsibilities over the Real Estate and Utilities sectors across the US Equity Strategies. She joined the Real Estate Team in May 2004 as a research analyst and later joined the US Equity Team in February 2009. Prior to that, Kristin joined Goldman Sachs Asset Management in 2000 where she worked in the Global Risk and Performance Analytics group focusing on quantitative and risk analysis of the Goldman Sachs Mutual Funds. Kristin has 21 years of industry experience. Kristin was named managing director in 2019. She is a member of the National Association of Real Estate Investment Trusts. Kristin earned a bachelor's degree in Finance from Villanova University and is a CFA® charterholder.
Timothy RyanManaging Director, Global Public Real Estate and Infrastructure Tim Ryan is a portfolio manager for the US REIT team within the Fundamental Equity team of Goldman Sachs Asset Management in the Investment Management Division. His specialization is he US office and industrial sectors. Tim joined Goldman Sachs in 2010 as a vice president and was named managing director in 2015. Prior to joining the firm, Tim spent six years at Oppenheimer Funds, where he had research responsibility for the financial services sector across all market capitalizations. Tim earned a BA in Mathematics and Economics from Boston College in 1996 and an MBA in Finance from Columbia Business School in 2001. He is a CFA charterholder.
Collin BellManaging Director, Global Public Real Estate and Infrastructure Collin is global head of client portfolio management for Fundamental Equity within Goldman Sachs Asset Management and a portfolio manager on the Multi-Asset Income franchise including the GS Real Estate Diversified Income and the GS Income Builder Funds. The Fundamental Equity team manages over $80B across a broad range of equity solutions on behalf of institutional and individual clients around the world. Previously, he was a research analyst for the Real Estate Securities team with a focus on the office and industrial sub-sectors. He joined Goldman Sachs in the Investment Management Division in 1997 and has remained there his entire career. Collin earned a bachelor’s degree from Amherst College.
Sean BrenanManaging Director, AIMS Real Estate StrategiesSean Brenan is a managing director in the Alternative Investments & Manager Selection (AIMS) Group, based in New York. He is a member of the AIMS Real Estate Investment Committee. Sean joined Goldman Sachs in 2010 as an associate and was named managing director in 2017. Prior to joining the firm, he worked in General Electric's Business Development Group. Sean earned a BA in Economics from Georgetown University, an MBA from the Wharton School at the University of Pennsylvania and a JD from the University of Pennsylvania.
28
Fund Risk Considerations
Goldman Sachs Real Estate Diversified Income Fund, a newly organized Delaware statutory trust (the “Fund”), is registered under the Investment Company Act of 1940, as amended (the “1940 Act”), as a diversified, closed-end management investment company. The Fund operates as an “interval fund” and is the successor to the Resource Real Estate Diversified Income Fund (the “Predecessor Fund”), a Delaware statutory trust, as a result of the reorganization of the Predecessor Fund into the Fund. The Fund’s operates as an “interval fund” and the investment objective and strategies are similar to those of the Predecessor Fund. The Fund has assumed the Predecessor Fund’s historical performance on May 18, 2020. Therefore, the performance information included prior to the reorganization is that of the Predecessor Fund.
The Goldman Sachs Real Estate Diversified Income Fund invests primarily in a portfolio of equity and debt investments in issuers that are primarily engaged in or related to the real estate industry. The Fund’s investments are subject to market risk, which means that the value of the securities in which it invests may go up or down in response to the prospects of individual companies, particular sectors or governments, general economic conditions and other conditions and events (including, but not limited to, natural disasters, pandemics, epidemics, and social unrest). Investing in private real estate investment funds (“Private Real Estate Investment Funds”) and real estate investment trusts (“REITs”) involves certain unique risks in addition to those risks associated with investing in the real estate industry in general. REITs whose underlying properties are concentrated in a particular industry or geographic region are also subject to risks affecting such industries and regions. The securities of REITs involve greater risks than those associated with larger, more established companies and may be subject to more abrupt or erratic price movements because of interest rate changes, economic conditions and other factors. These risks may be more pronounced in connection with the Fund’s investments in private REITs. The Fund’s performance depends in part upon the performance of the Private Real Estate Investment Fund managers and selected strategies, the adherence by such Private Real Estate Investment Fund managers to such selected strategies, the instruments used by such Private Real Estate Investment Fund managers and the investment adviser’s ability to select Private Real Estate Investment Fund managers and strategies and effectively allocate Fund assets among them. To the extent permitted by applicable law, the Fund may make commitments to Private Real Estate Investment Funds in which it invests that represent a substantial portion of the total assets of the Fund, including through the use of leverage. As a result, in certain circumstances, the Fund may need to retain investment income, borrow funds or liquidate some or all of its investments prematurely at potentially significant discounts to market value if the Fund does not have sufficient liquid assets to meet these commitments The securities of mid- and small-capitalization companies involve greater risks than those associated with larger, more established companies and may be subject to more abrupt or erratic price movements. The Fund may invest in private companies, or companies prior to their initial public offering, which are not subject to Securities and Exchange Commission (“SEC”) reporting and are more vulnerable to market conditions. Foreign and emerging markets investments may be more volatile and less liquid than investments in U.S. securities and are subject to the risks of currency fluctuations and adverse economic, social or political developments. The Fund may invest in non-investment grade securities (commonly known as “junk bonds”), including without limitation distressed securities, special situation investments. Investmentsin commercial mortgage-backed securities are also subject to prepayment risk (i.e., the risk that in a declining interest rate environment, issuers may pay principal more quickly than expected, causing the Fund to reinvest proceeds at lower prevailing interest rates). The Fund’s investments in other investment companies (including ETFs and Private Real Estate Investment Funds) subject it to additional expenses. Investments in fixed income securities are subject to the risks associated with debt securities generally, including credit, liquidity, interest rate, call and extension risk.
The Fund is subject to leverage risk, which involves risks and special considerations including the likelihood of greater volatility of net asset value (“NAV”) and dividend rates of the shares than a comparable portfolio without leverage; the risk that fluctuations in interest rates on borrowings and short-term debt or in the interest or dividend rates on any leverage that the Fund must pay will reduce returns; and the effect of leverage in a declining market, which is likely to cause a greater decline in the NAV of the shares than if the Fund were not leveraged. The Fund is also subject to the risks associated with short selling of securities, which involves leverage of the Fund’s assets and presents various other risks. The Fund may be obligated to cover its short position at a higher price than the short price, resulting in a loss. Losses on short positions are potentially unlimited as a loss occurs when the value of an asset with respect to which the Fund has a short position increases. Derivative instruments (including options, futures, swaps and forward foreign currency transactions) may involve a high degree of financial risk. These risks include the risk that a small movement in the price of the underlying security or benchmark may result in a disproportionately large movement, unfavorable or favorable, in the price of the derivative instrument; risk of default by a counterparty; and liquidity risk. The Fund’s borrowing and use of derivatives may result in leverage, which can make the Fund more volatile. The Fund’s investments in derivative instruments or synthetic instruments, including, but not limited to, credit default swaps (including credit default swaps on credit related indices)) can be illiquid, may disproportionately increase losses, and may have a potentially large impact on Fund performance. Investments in derivative instruments may be harder to value, subject to greater volatility and more likely subject to changes in tax treatment than other investments. The Fund is also subject to the risks associated with writing (selling) call options, which limits the opportunity to profit from an increase in the market value of stocks in exchange for up-front cash at the time of selling the call option. In a rising market, the Fund could significantly underperform the market, and the Fund’s options strategies may not fully protect it against declines in the value of the market. There is no assurance that the Fund will be able to maintain a certain level of distributions to shareholders. The amount of distributions that the Fund may pay, if any, is uncertain. The Fund may pay distributions in significant part from sources that may not be available in the future and that are unrelated to the Fund’s performance, such as from offering proceeds and borrowings. A portion or all of any distribution of the Fund may consist of a return of capital.
29
General Disclosures
The Fund is intended for long-term investors who can accept the risks associated with investing in illiquid investments. An investment in the Fund is not suitable for investors who need certainty about their ability to access all of the money they invest in the short term. Even though the Fund will make quarterly repurchase offers for its outstanding shares (expected to be 5% per quarter), investors should consider shares of the Fund to be an illiquid investment. In addition, there will be no active secondary market for shares. There is no guarantee that investors will be able to sell their shares at any given time or in the quantity that they desire.
An investment in the Fund is speculative with a substantial risk of loss. The Fund should not be relied upon as a complete investment program. The Fund’s investment techniques (if they do not perform as designed) may increase the volatility of performance and the risk of investment loss, including the loss of the entire amount that is invested, and there can be no assurance that the investment objective of the Fund will be achieved.
GSA CPRI = Green Street's Commercial Property Price Index is a time series of unleveraged U.S. commercial property values that captures the prices at which commercial real estate transactions are currently being negotiated and contracted. Features that differentiate this index are its timeliness, its emphasis on high-quality properties, and its ability to capture changes in the aggregate value of the commercial property sector.
Wilshire RESI Index = Public US REIT index.
US Private Real Estate = NCREIF Property Index (NPI) is a quarterly, unleveraged composite total return for private commercial real estate properties held for investment purposes only. All properties in the NPI have been acquired, at least in part, on behalf of tax-exempt institutional investors and held in a fiduciary environment.
US Equity = S&P 500 is top 500 Public US companies by market capitalization size.
US Corporate Credit = Bloomberg Barclays US Aggregate Corporate Credit Index is a broad-based flagship benchmark that measures the investment grade, US dollar-denominated, fixed-rate taxable bond market. The index includes Treasuries, government-related and corporate securities, MBS (agency fixed-rate pass-throughs), ABS and CMBS (agency and non-agency).
US Preferred REITs = iShares S&P US Preferred Stock Index ETF seeks to track the investment results of an index composed of U.S. dollar-denominated preferred and hybrid securities.
This material is not authorized for distribution unless preceded or accompanied by a current prospectus or summary prospectus, if applicable. Investors should consider a fund's objectives, risks, and charges and expenses, and read the summary prospectus, if available, and the prospectus carefully before investing or sending money. The summary prospectus, if available, and the Prospectus contains this and other information about the Fund.
Distribution rate is calculated by annualizing the most recent declared distribution amount divided by the most recent NAV on the date of calculation. In a market environment where NAVs are falling, this means that the distribution rate will be higher than it was on the date it was actually paid, and the more the NAV of shares decreases the more the “distribution rate” from the last declared dividend will increase. Similarly, when prices rise the distribution rate will be lower than it was on the date the last distribution was actually paid. The Distribution Rate is subject to change and is not an indication of Fund performance. It is currently anticipated that a substantial portion of the fund's distributions will likely be treated for tax purposes as a return of capital. A return of capital is not taxable and results in a reduction in the tax basis of a shareholder’s investment. The final determination regarding the nature of the distributions will be made after the end of the Fund’s fiscal year when the Fund can determine its earnings and profits. The final tax status of the distribution may differ substantially, and will be made available to shareholders after the close of each calendar year. The proportion of distributions that are treated as taxable distributions may also vary and or increase in future years.
Views and opinions expressed are for informational purposes only and do not constitute a recommendation by Goldman Sachs Asset Management to buy, sell, or hold any security. Views and opinions are current as of the date of this presentation and may be subject to change, they should not be construed as investment advice.
Debt to Assets = Ratio of debt divided by total assets.
Interest Expense to Net Operating Income = Annual interest expense divided by net operating income (revenue less all necessary operating expenditures).
30
General Disclosures
Weighted Average Term to Maturity on Debt of All Equity REITs = term to maturity for all debt on all equity REITs
Weighted Average Interest Coverage Ratio of All Equity REITs = the interest coverage ratio measures how many times a company can cover its current interest payments with available earnings, it is the interest / earnings before interest and taxes.
Prospectus: https://www.gsam.com/bin/gsam/servlets/LiteratureViewerServlet?pdflink=%2Fcontent%2Fdam%2Fgsam%2Fpdfs%2Fus%2Fen%2Fprospectus-and-regulatory%2Fprospectus%2FGS_Real_Estate_Diversified_Income_Fund_prospectus.pdf&RequestURI=/content/gsam/us/en/advisors&sa=n
This information discusses general market activity, industry or sector trends, or other broad-based economic, market or political conditions and should not be construed as research or investment advice. This material has been prepared by Goldman Sachs Asset Management and is not financial research nor a product of Goldman Sachs Global Investment Research (GIR). It was not prepared in compliance with applicable provisions of law designed to promote the independence of financial analysis and is not subject to a prohibition on trading following the distribution of financial research. The views and opinions expressed may differ from those of Goldman Sachs Global Investment Research or other departments or divisions of Goldman Sachs and its affiliates. Investors are urged to consult with their financial advisors before buying or selling any securities. This information may not be current and Goldman Sachs Asset Management has no obligation to provide any updates or changes.
The portfolio risk management process includes an effort to monitor and manage risk, but does not imply low risk.
Goldman Sachs does not provide legal, tax or accounting advice, unless explicitly agreed between you and Goldman Sachs (generally through certain services offered only to clients of Private Wealth Management). Any statement contained in this presentation concerning U.S. tax matters is not intended or written to be used and cannot be used for the purpose of avoiding penalties imposed on the relevant taxpayer. Notwithstanding anything in this document to the contrary, and except as required to enable compliance with applicable securities law, you may disclose to any person the US federal and state income tax treatment and tax structure of the transaction and all materials of any kind (including tax opinions and other tax analyses) that are provided to you relating to such tax treatment and tax structure, without Goldman Sachs imposing any limitation of any kind. Investors should be aware that a determination of the tax consequences to them should take into account their specific circumstances and that the tax law is subject to change in the future or retroactively and investors are strongly urged to consult with their own tax advisor regarding any potential strategy, investment or transaction.
The website links provided are for your convenience only and are not an endorsement or recommendation by Goldman Sachs Asset Management of any of these websites or the products or services offered. Goldman Sachs Asset Management is not responsible for the accuracy and validity of the content of these websites.
Although certain information has been obtained from sources believed to be reliable, we do not guarantee its accuracy, completeness or fairness. We have relied upon and assumed without independent verification, the accuracy and completeness of all information available from public sources.
Goldman Sachs & Co. LLC is the distributor of the Goldman Sachs Funds.
- No Bank Guarantee
- May Lose Value
- Not FDIC Insured
© 2021 Goldman Sachs. All rights reserved.
Date of First Use: 14-Sep-2021
Compliance Code: 252893-OTU-1474987