seed value chain analysis...
TRANSCRIPT

Value Chain Analysis of
Improving Employment and Income through Development of Egypt’s Aquaculture Sector
Ahmed Mohamed Nasr Allah,Fathi Mohamed Ahmed,
Chain Analysis of Egyptian Fish Seed Production
Improving Employment and Income through Development of Egypt’s Aquaculture Sector
(IEIDEAS) Project
April 2012
Ahmed Mohamed Nasr Allah, Malcolm Dickson, Diaa Abdel Reheem Kenawy, MohamedFathi Mohamed Ahmed, and Gamal El Naggar, WorldFish Center, Egypt.
Production
Improving Employment and Income through Development of Egypt’s Aquaculture Sector
Diaa Abdel Reheem Kenawy, Mohamed, WorldFish Center, Egypt.
Egyptian Fish Seed Value Chain Analysis
Executive Summary
WorldFish Center staff, assisted by staff from CLAR, carried out a value chain analysis (VCA)study of the Egyptian fish seed sector in March and April 2012. This was the first field activityof the Improving Employment and Income through Development of Egypt’s AquacultureSector (IEIDEAS) Project, a three-year intervention supported by the Swiss Agency forDevelopment and Cooperation (SDC).
The main aim of the VCA was to better understand this input supply chain of the Egyptianaquaculture industry through mapping and financial analysis of the main actors; hatcheryoperators and fry/fingerling traders. The current study followed a wider Egyptianaquaculture industry VCA carried out during IDEAS project preparation in 2011 that mappedthe sector from aquaculture producers to retailers but did not include input suppliers.
Following an initial preparation phase, a field team of up to five WorldFish Center and CLARstaff carried out focus group discussions and individual interviews with hatchery operatorsand fry/fingerling traders in four key Governorates; Sharkia, Kafr el Sheikh, Behera andFayoum. The complete dataset covered responses from fifty individual hatchery operatorsand four focus group discussions with hatchery operators. It was more difficult to identify fryand fingerling traders so only 8 individuals were interviewed.
Egyptian aquaculture produced over 900,000 tonnes of fish in 2010 (GAFRD estimate)making it easily the largest aquaculture industry in Africa and the MENA region. According tothe 2011 VCA, 89% of production in private farms in the study area was tilapia, 9% wasmullet and 1.75% was catfish, and 85% of production was from earth pond based systems.
Mapping of the fish seed value chain revealed that expansion of Egypt’s aquacultureindustry has been matched by the development of a large number of tilapia hatcheries allproducing sex-reversed all-male fry and fingerlings. They use a range of technologies, fromsimple hapa-based systems to greenhouse covered tanks and systems incorporating waterheating to advance and lengthen the spawning season. Most of their production (95%) issold as fry (soon after sex reversal) rather than fingerlings and sold directly to productionfarms (rather than through fry/fingerling traders). Some of the hatcheries are part of anintegrated fish farm with both hatchery and production systems.
The average size of hatchery was 1.7 ha and most used hapas as their main hatchery system.Almost half of the hatcheries used some form of heating (solar or fuel-fired boiler) to extendthe spawning season. The 50 hatcheries hold over 0.5 million broodstock and sold a total of474 million fry in 2010 at an average price of LE 30 (US$ 5) per 1000. They also sold 21million fingerlings at an average price of LE 114 per 1000. These prices are significantly lowerthan current prices in comparable countries and have dropped gradually over recent years inEgypt indicating that there is a high degree of competition in the market.
An average Egyptian tilapia hatchery produces around 10 million seed and employs 5-6 FTE,with 59% of the employees under 30 years old. If overall tilapia seed production is estimatedat 3.5 billion, there could be over 400 hatcheries employing 2000 FTEs.
Despite low seed prices, hatcheries appear to be highly profitable with average net profits of44% of sales and average total value added of LE 24,430 per million fry.
While fry and fingerling traders play a limited role linking tilapia hatcheries with producers,they play a major role in the mullet fry/fingerling trade where seed are wild-caught from theMediterranean shoreline by GAFRD licensed and unlicensed fishermen. Fry caught throughthe GAFRD system are distributed to licensed fish farms according to a quota systemhowever, an unknown (and probably much larger) number of mullet fry are now caught byunlicensed fishermen and supplied to fish farms, often through fry and fingerling traders.
Egyptian Fish Seed Value Chain Analysis
iii
Fry/fingerling traders generate relatively few jobs (0.55 FTE per million fry sales) butgenerate reasonable profit levels (29% net profits).
The main issues raised as problems by hatchery operators were: access to capital;broodstock quality; hormone quality; water quality and availability; labour and managementskills; power costs and availability; land availability and tenure; fish health management;declining prices; fluctuating prices; and, permission to transport fry.
Many of these issues will be covered by the IEIDEAS project which includes dissemination offaster-growing genetically improved Abbassa strain tilapia as one of its main activities. Theproject will also supporting training, the development of best management practices andactions to improve the policy and operational environment for Egyptian aquaculture.
The results of this study support the IEIDEAS project seed dissemination strategy as mosttilapia hatcheries aim to replace their broodstock on a regular basis but now find it difficultto source high quality female fish as production is almost exclusively based on males. Theproject will distribute mixed sex broodstock to strategically located multiplication centresthat meet certain criteria and who would become the default suppliers of Abbassa strainbroodstock for hatcheries across the country.
The hatchery sector along with the rest of the aquaculture industry faces a number ofregulatory challenges that should be addressed by industry representatives through aneffective Producers Organisation. These include registration and licensing of aquaculturebusinesses and necessary changes to laws over the use of water and land for aquaculture.The project already plans to deliver training through Producers Organisation. However,there are many other ways that POs could deliver benefits to members including bulkpurchase of inputs (as in Fayoum) and the provision of professional services such asconsultancy advice and stock insurance.
The study makes the following recommendations for the Egyptian fish seed sector:
It will take some time for clear benefits from the IEIDEAS project seed disseminationstrategy to result in definite production increases. The logframe should be revised toinclude more direct indicators.
The project should carry out a consultancy study on ways to address the backlog inregistration and licensing of aquaculture businesses.
More emphasis needs to be placed on developing effective Producer Organisationsfor the aquaculture sector.
A feasibility study should be carried out to update information on the potential fordeveloping mullet hatcheries in Egypt.
Assistance should be given to developing African catfish hatcheries.
The project should help to develop a core group of private-sectorconsultants/specialists to assist aquaculture producers and hatcheries.

Egyptian Fish Seed Value Chain Analysis
iv
Table of Contents
1 Introduction and Background............................................................................................ 11.1 Background to the study ........................................................................................... 11.2 Value chain analysis................................................................................................... 11.3 The IEIDEAS project and fish seed value chains ........................................................ 21.4 Report structure ........................................................................................................ 3
2 Study methodology and approach .................................................................................... 42.1 Mapping and planning............................................................................................... 42.2 Field work .................................................................................................................. 42.3 Data entry, analysis and report writing..................................................................... 4
3 Egyptian aquaculture and fish seed production................................................................ 63.1 Global trends ............................................................................................................. 63.2 Farmed fish production in Egypt ............................................................................... 63.3 Fish Seed Production in Egypt ................................................................................... 63.4 Species....................................................................................................................... 7
4 Mapping the fish seed value-chain.................................................................................... 94.1 Introduction and overview........................................................................................ 94.2 Types of hatcheries.................................................................................................. 104.3 Fish Hatchery analysis ............................................................................................. 124.4 Fry and fingerling trader analysis ............................................................................ 154.5 Problem identification............................................................................................. 174.6 Summary of analysis................................................................................................ 19
5 Benchmarking.................................................................................................................. 216 Analysis of critical factors................................................................................................ 23
6.1 Seed availability and quality.................................................................................... 236.2 IEIDEAS project seed dissemination strategy.......................................................... 236.3 Catfish and mullet ................................................................................................... 256.4 The role of Producers’ Organisations ...................................................................... 256.5 Statistics, registration and licensing........................................................................ 26
7 Conclusions and recommendations ................................................................................ 277.1 Summary.................................................................................................................. 277.2 Dissemination of genetically improved tilapia seed................................................ 277.3 Registration of hatcheries ....................................................................................... 277.4 Producer Organisations........................................................................................... 287.5 Mullet ...................................................................................................................... 287.6 African catfish.......................................................................................................... 287.7 Specialist technical assistance................................................................................. 29
Appendices
Appendix 1. References
Appendix 2. Implementation plan for seed value chain study
Appendix 3. Study questionnaires

Egyptian Fish Seed Value Chain Analysis
v
Acronyms
BMP Best Management Practices
CLAR Central Laboratory for Aquaculture Research
EU European Union
FAO Food and Agriculture Organisation (of the United Nations)
FTE Full-Time Equivalents (jobs)
GAFRD General Authority for Fisheries Resource Development
GDP Gross Domestic Product
CGIAR Consultative Group on International Agricultural Research
CRP CGIAR Research Program
Ha Hectare
IEIDEAS Improving Employment and Income through Development of Egypt’sAquaculture Sector
LE Egyptian Pound
MENA Middle East and North Africa
MOALR Ministry of Agriculture and Land Reclamation
MWRI Ministry of Water Resources and Irrigation
PO Producer Organisation
NIOF National Institute of Oceanography and Fisheries
SDC Swiss Agency for Development and Cooperation
USDA United States Department of Agriculture
VC Value Chain
VCA Value Chain Analysis
Conversion factors
US$ 1 = LE 6.04
1 hectare = 2.381 feddans
Cover image:
Harvesting eggs from a mouthbrooding female tilapia at the WorldFish Center hatchery,Abbassa.
Egyptian Fish Seed Value Chain Analysis
1
1 Introduction and Background
1.1 Background to the study
This report presents the outputs of a fish seed value-chain study, completed during Februaryand March 2012, by a team from WorldFish Center, Abbassa assisted by staff from CentralLaboratory for Aquaculture Research (CLAR), Ministry of Agriculture and Land Reclamation.
It was implemented under the Swiss Agency for Development and Cooperation (SDC) fundedproject, Improving Employment and Income through Development of Egypt’s AquacultureSector (IEIDEAS) and complements a value chain assessment of the Egyptian aquaculturesector carried out by a team from WorldFish Center and CARE Egypt under the direction offisheries consultant, Graeme Macfadyen in September 2011 (Macfadyen et al, 2011).
The 2011 study concentrated on the aquaculture value chain from production to retail anddescribed a simple value chain involving three main actors; producers, wholesalers andretailers.
The current study was designed to provide more information on one of the main inputs forthe value chain, the supply of fish seed. The study focused on the four governorates whichtogether account for 74% of pond aquaculture production in Egypt, namely Behera, Fayoum,Kafr el Sheikh and Sharkia.
The main objective of the study was to better understand the freshwater fish seed industryin Egypt. In particular the study aimed to:
map the Egyptian fish seed value chain;
consider the employment generated by the sub-sector;
understand the costs and earnings profiles of the different stages of the value chain;
identify the key constraints and problems impacting on different actors in the valuechain; and
identify potential interventions to address the problems.
1.2 Value chain analysis
A value chain is a sequence of related enterprises conducting activities which add value to aproduct at each stage from its primary production, through its processing and marketing to
the final sale of the product to consumers. The functions of each link in the chain involvesourcing inputs, making/producing, and then delivering/selling the product to the next linkin the chain.
Value chain analysis was first described and popularized by Michael Porter in the mid-1980's(Porter, 1985). The methodology is used to assess the relative importance of factorsaffecting competitiveness, and the costs and earnings of those involved in the value chain;
It helps to identify gaps or weaknesses in value chain performance and perhaps mostimportantly it aids identification of ‘levers’ and targeted action programmes to ‘upgrade’and improve value chain performance.
Value chain analysis also involves benchmarking changes over time and allows a focus ondistributional issues and pro-poor growth. In the case of export products it can highlightglobal linkages.
Value chain analysis is composed of a number of steps. The first is to describe the overallmarket within which the specific value chain operates. The second task is to describe the
Egyptian Fish Seed Value Chain Analysis
2
value chain itself. This involves considering who is involved, and tries to capture quantitativeand qualitative information on employment, revenues, profits, and unit product values forthose involved in the value chain. Analysis is also conducted to assess the critical challengesand factors impacting on value-addition through the chain. Finally, these descriptive andanalytical steps can be used to identify possible interventions to the critical challenges, andto specify an implementation plan to bring about an 'upgrading' or development of the valuechain.
An important component of value-chain analysis is recognition that support and action forimproving performance throughout the value chain can be achieved both by those withinthe value chain itself, and by those outside it.
For businesses in the chain, they can improve performance by reducing costs, increasingoutputs, and/or increasing the prices of their products. Typically, mechanisms to do soinvolve value chain actors being more efficient at what they do, and improving the quality orvalue of the product being sold to the next actor in the value chain.
Improvements in value chain performance can also be supported through governmentintervention and other parties external to the value chain (policy, institutions and donors).
1.3 The IEIDEAS project and fish seed value chains
The IEIDEAS project is a 3-year intervention funded by the Swiss Agency for Developmentand Cooperation (SDC) and implemented by WorldFish Center in partnership with CARE andthe Egyptian Ministry of Agriculture and Land Reclamation. Within the CGIAR system theproject falls within Livestock and Fish Research Program (CRP3.7). The project started inDecember 2011 and its main aims are to secure the future of at least 100,000 people alreadyemployed directly in the aquaculture value chain and support sustainable expansion of thesector.
The planned project outcomes are:
Profitability of existing fish farmers improved
Employment in retailing increased
Fish production in Upper Egypt increased
Efficient and sustainable Value Chains established
(Human) Nutrition improved
The main project activities are summarized in Figure 1.
Most of the planned activities on fish seed value chains fall under Outcome 1 - Profitability
of existing fish farmers improved and include:
The present study
Dissemination of Abbassa strain broodstock from Worldfish Center’s breeding
program to 7 multiplication centers and then to hatcheries who will supply Abbassa
strain fry/fingerlings to fish farmers
Continued development of the genetic improvement program at Abbassa
Development of hatchery ‘best management practices’
Training and support for hatchery operators through Producers’ Organisations
Policy workshops to address aquaculture sector constraints/issues
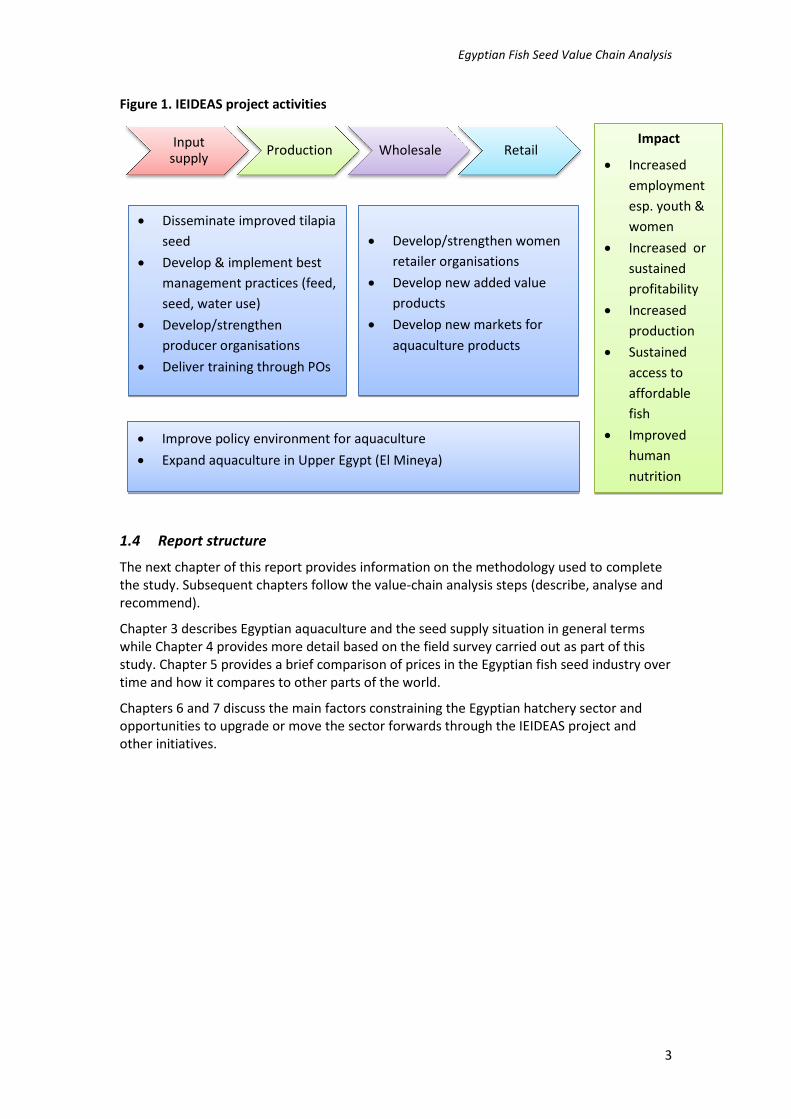
Figure 1. IEIDEAS project activities
1.4 Report structure
The next chapter of this report provides information on the methodology used tothe study. Subsequent chapters follow the valuerecommend).
Chapter 3 describes Egyptian aqwhile Chapter 4 provides more detail based on the field survey carried out as part of thisstudy. Chapter 5 provides a brief comparison of prices in the Egyptian fish seed industry overtime and how it compares to other parts of the world.
Chapters 6 and 7 discuss the main factors constraining the Egyptian hatchery sector andopportunities to upgrade or move the sector forwards through the IEIDEAS project andother initiatives.
Inputsupply
Production
Disseminate improved tilapia
seed
Develop & implement best
management practices (feed,
seed, water use)
Develop/strengthen
producer organisations
Deliver training through POs
Improve policy environment for aquaculture
Expand aquaculture in Upper Egypt (El
Egyptian Fish Seed Value Chain Analysis
IEIDEAS project activities
of this report provides information on the methodology used tohapters follow the value-chain analysis steps (describe, analyse
Chapter 3 describes Egyptian aquaculture and the seed supply situation in general termswhile Chapter 4 provides more detail based on the field survey carried out as part of thisstudy. Chapter 5 provides a brief comparison of prices in the Egyptian fish seed industry over
it compares to other parts of the world.
Chapters 6 and 7 discuss the main factors constraining the Egyptian hatchery sector andopportunities to upgrade or move the sector forwards through the IEIDEAS project and
Production Wholesale Retail
mproved tilapia
Develop & implement best
management practices (feed,
producer organisations
Deliver training through POs
Develop/strengthen women
retailer organisations
Develop new added value
products
Develop new markets for
aquaculture products
Improve policy environment for aquaculture
Expand aquaculture in Upper Egypt (El Mineya)
Egyptian Fish Seed Value Chain Analysis
3
of this report provides information on the methodology used to complete(describe, analyse and
uaculture and the seed supply situation in general termswhile Chapter 4 provides more detail based on the field survey carried out as part of thisstudy. Chapter 5 provides a brief comparison of prices in the Egyptian fish seed industry over
Chapters 6 and 7 discuss the main factors constraining the Egyptian hatchery sector andopportunities to upgrade or move the sector forwards through the IEIDEAS project and
Impact
Increased
employment
esp. youth &
women
Increased or
sustained
profitability
Increased
production
Sustained
access to
affordable
fish
Improved
human
nutrition

Egyptian Fish Seed Value Chain Analysis
4
2 Study methodology and approach
2.1 Mapping and planning
The first phase of the work started with a desk review of recent statistics on fish seed supplyin terms of numbers of hatcheries, production and geographical distribution by the studyteam. The information was used to decide on the number of interviews that would becarried out in each governorate.
A detailed agenda of activities and travel schedule was then agreed among the study team;travel logistics were arranged and contacts in the governorates were made ahead of thefield visits. A draft report structure was then developed.
Two separate questionnaires, one for freshwater fish hatcheries, and other for fry traderswere drafted in English and then translated into Arabic. The questionnaires were revised,discussed and modified by the study team which resulted in the addition/deletion of somequestions, and changes to other questions in terms of the phrasing and the wording used inArabic. The hatchery questionnaire was then piloted at the WorldFish Center office inAbbassa with one hatchery manager. This piloting resulted in some small additionalamendments based on the lessons learned, and the questionnaires were then finalised andprinted in multiple copies in readiness for the field work. The finalised questionnaires arepresented (in English) in Appendix , along with some general suggestions for the approachesto be taken during the interviews and group discussions.
2.2 Field work
In order to maximise the number of interviews possible during the time available for thefield work and to reduce travel time, the general approach taken was to use local contacts ineach of the governorates to arrange for small groups of stakeholders to meet the study teamat a central location. This provided the study team with the opportunity to introduce thestudy and to hold a focus group discussion in plenary, before individual interviews were thenconducted with the same participants.
The introductory comments and focus group discussions, which concentrated mainly on keystakeholder problems and potential solutions, generally lasted around sixty to seventy fiveminutes, as did the individual interviews. Each meeting was thus scheduled to last aroundhalf a day. The field work focussed mainly on tilapia hatcheries but interviews were alsocompleted, where possible, with fry traders/brokers. The field work also enabled discussionwith a number of fish farmers (producers).
Table 1 provides information on the number of individual questionnaires completed withstakeholders in each of the four governorates, along with the number of participants in thefocus group discussions.
2.3 Data entry, analysis and report writing
All data from the questionnaires were entered into a spreadsheet and validity checked withthe different interviewers. Any variability in the results collected is generally thought toreflect actual differences in individual financial performance rather than misreporting asminimal data cleaning was required and the results were in line with the study team’sexisting knowledge of the aquaculture sector in Egypt.
Calculation of depreciation costs of equipment was computed using the straight line method(Jolly and Clonts, 1993) where annual depreciation = (Cost – Salvage Value) / Useful life andthe salvage value for all equipment was assumed to be zero (Asmah, 2008).

Egyptian Fish Seed Value Chain Analysis
5
Value added was used as a measure of the wealth created by the activity (fish hatchery orfish trading). The usual definition is:
Value added = Total sales value (price x volume) - value of intermediate goods (rawmaterials + finished products + services)1
In our case ‘value added’ = wages + net profits.
Table 1. Sample frame
Governorate Hatcheries Fry/fingerling traders
Behera 8 questionnaires1 focus group (12 participants)
1 questionnaire
Fayoum 8 questionnaires1 focus group (20 participants)
2 questionnaires
Kafr el Sheikh 24 questionnaires1 focus group (19 participants)
4 questionnaires
Sharkia 10 questionnaires1 focus group (10 participants)
1 questionnaire
Totals 50 questionnaires4 focus groups (61 participants)
8 questionnaires
Figure 2. Conducting an interview with a hatchery operator
1Valuelinks Manual - The Methodology of Value Chain Promotion. GTZ, Eschborn, 2007.

Egyptian Fish Seed Value Chain Analysis
6
3 Egyptian aquaculture and fish seed production
3.1 Global trends
Aquaculture is the fastest growing animal-food producing sector in the world, and continuesto outpace population growth, with per capita supply from aquaculture increasing from 0.7kg in 1970 to 7.8 kg in 2008 and an average annual growth rate of 6.6 per cent. It has almostovertaken capture fisheries as the main source of food fish. While aquaculture production(excluding aquatic plants) was less than 1 million tonnes per year in the early 1950s,production in 2008 was 52.5 million tonnes, with a value of US$98.4 billion (FAO, 2010).
Egypt is by far Africa’s largest aquaculture producing country with total production of over900,000 tonnes in 2010, making it the eleventh largest global producer of aquacultureproducts in terms of volume, the leading global producer of mullet and the second largestglobal producer of tilapia. According to GAFRD statistics, Egyptian aquaculture produced557,000 tonnes of tilapia, 160,000 tonnes of mullet, 191,000 tonnes of carp and 10,000tonnes of catfish in 2010.
3.2 Farmed fish production in Egypt
The main sources of fish production in Egypt include marine fisheries, inland fisheries inlakes, lagoons, the Nile River, irrigation and drainage canals, and aquaculture. Totalproduction levels rose from 456,900 tonnes in 1997 to 1.3 million tonnes in 2010 and theseincreases were primarily derived from significant increases in aquaculture production, whilewild capture fisheries production remained almost constant (385,000 tonnes in 1997 and2010). By 2010 the share of aquaculture production compared to fisheries production hadrisen to 70% from 16% in 1997. Meanwhile, the land area used for fish farming increasedfrom 186,216 feddans (78,210 ha) in 1997 to reach 290,594 feddans (122,050 ha) in 2010.2
Earth pond-based aquaculture is the predominant farming system, responsible for anestimated 85% of production from Egyptian fish farms in 2009 (Macfadyen et al., 2011).
The remarkable increase in Egyptian aquaculture production can be attributed, in part, tothe success of Egyptian fish seed producers, both in terms of the quantity of seed producedand the shift to all-male tilapia production.
3.3 Fish Seed Production in Egypt
The origins of the Egyptian fish seed sector lie with the decision by the Egyptian Governmentin the 1970s to establish 14 freshwater hatcheries to produce the carp to stock governmentand private fish farms as well as integrating aquaculture into rice fields, the stocking ofnatural reservoirs, lakes, and the stocking of herbivorous species into the Nile River andirrigation canals for weed control.
Meanwhile private freshwater hatcheries started producing tilapia fry to satisfy demandfrom private fish farms or stocking their own farms. From the first private hatchery startingin 1992, the number had increased to 7 hatcheries in 1996 and has reached around 135licensed hatcheries in 2010. However there are also a great number of unlicensed privatehatcheries, perhaps more than 500 in operation. Unfortunately, their production, which ismuch greater than the production from official hatcheries, is not included in official statisticsproduced by GAFRD. This means that official statistics on hatchery production, as shown inFigure 3, do not reflect the real situation.
2GAFRD 2010 Statistics

Egyptian Fish Seed Value Chain Analysis
7
Nevertheless GAFRD statistics show the increasing trend towards tilapia production and thedecreasing importance of carp production. The number of tilapia fry produced by licensedhatcheries increased from 38 million (11% of fry production) in 1995 to reach 210 million(52.5% of fry production) in 2010. Meanwhile the total number of carp fry fell from 302million (87% of total fry) in 1995 to 175 million (44% of total fry production) in 2010.
Figure 3. Fry production by licensed hatcheries (GAFRD)
In his study for FAO, Saleh (2007) noted the difference between official tilapia seedproduction statistics and the actual number of seed stocked into farms to achieve theobserved total fish yields. He estimated that the total number of tilapia seed required toproduce 190,000 tonnes in 2004 was 1,197 million fingerlings, while the official record oftilapia seed production in the same year was only 145.5 million (GAFRD). Based on the samecalculation, the total tilapia yield of 557,000 tonnes in 2010 would require around 3.5 billionfingerlings. If anything this is a conservative estimate as it equates to 6.3 fingerlings per kg offish production whereas the actual requirement is more likely to be 8 fingerlings per kg andthe total yield of tilapia is probably higher than the official estimate (G. El Naggar, pers.comm., I. Radwan, pers. comm.)
Clearly the contribution of unlicensed hatcheries and unreported production is verysignificant and the system for collection of official statistics on hatchery production andacross the aquaculture sector urgently needs to be revised.
3.4 Species
According to the 2011 aquaculture value chain assessment, 89% (by volume) of aquacultureproduction in 2010 in privately owned fish farms in the study areas was accounted for bytilapia, 9% by mullet, 1.75% by catfish and 0.2% by carp.
0
50
100
150
200
250
300
350
19
95
19
96
19
97
19
98
19
99
20
00
20
01
20
02
20
03
20
04
20
05
20
06
20
07
20
08
20
09
20
10
Fry
pro
du
ctio
n(m
illio
ns)
Fry production by licensed hatcheries
Tilapia
Carp
Other species
Egyptian Fish Seed Value Chain Analysis
8
The indigenous species, Nile tilapia (Oreochromis niloticus) is the main tilapia speciesproduced as it shows high growth rates and tolerates poor water quality conditions. O.aureus has also been produced and is indigenous.
Wild-caught African catfish (Clarias gariepinus), fingerlings are grown in Egyptian fish farmsand there is also very limited production by private hatcheries. This is another indigenousspecies with high production potential.
Various carp species have been introduced to Egypt over the years. The main carp speciesproduced in Government hatcheries are common carp (Cyprinus carpio), silver carp(Hypophthalmichthys molitrix) and grass carp (Ctenopharyngodon idella). Poor market pricesmean that very little carp is grown in private farms, apart from silver carp, a filter feedingspecies that can thrive on plankton alone, produced in cages in the Nile River using little orno additional feeding. Although carp production from Government farms has been, untilnow, used for stocking public waterbodies and fish farms this sector has suffered badly overthe recent period of political instability as funding has been drastically reduced andbudgeted funds have not been released on a timely basis. This means that official statisticsfor carp production are probably seriously overestimated (G. El Naggar, pers. comm.).
The second most important type of fish grown in Egyptian fish farms is mullet, the greymullet (Mugil cephalus) and the thinlip mullet (Liza ramada). Market prices for mullet arerelatively high, so there is strong demand for fingerlings but this is a capture-basedaquaculture system depending entirely on wild-caught seed from the Mediterraneancoastline.
The mullet collection system has been described in some detail by Saleh (2008). There is an‘official’ government-regulated fry catching and distribution system where numbers andquality are checked and licensed farms receive fry or fingerlings based on a quota system.Like most Government-managed services this is probably not fully functioning at presentbecause of funding problems. Meanwhile, there is a very significant ‘black market’ supplychain for mullet fry and fingerlings to meet demand from the rest of the aquacultureindustry.
Mullet can be bred in captivity. However past experience in Egypt was that the cost ofhatchery reared fry was much higher than prevailing prices for wild-caught seed. Obviouslythe uncontrolled nature of the mullet fry capture industry is worrying as it could threatenthe sustainability of both mullet aquaculture and the wild fishery for these valuable species.The FAO has developed an addendum on capture-based aquaculture to their Code ofConduct for Responsible Fisheries which should help to give direction to efforts to controlthe current free-for-all (FAO, 2011).
The marine species, European seabass (Dicentrarchus labrax) and gilthead seabream (Sparusaurata), are now being grown in private farms in Egypt and reproduced in salt-waterhatcheries. However the quantities being produced are limited.
Egyptian Fish Seed Value Chain Analysis
9
4 Mapping the fish seed value-chain
4.1 Introduction and overview
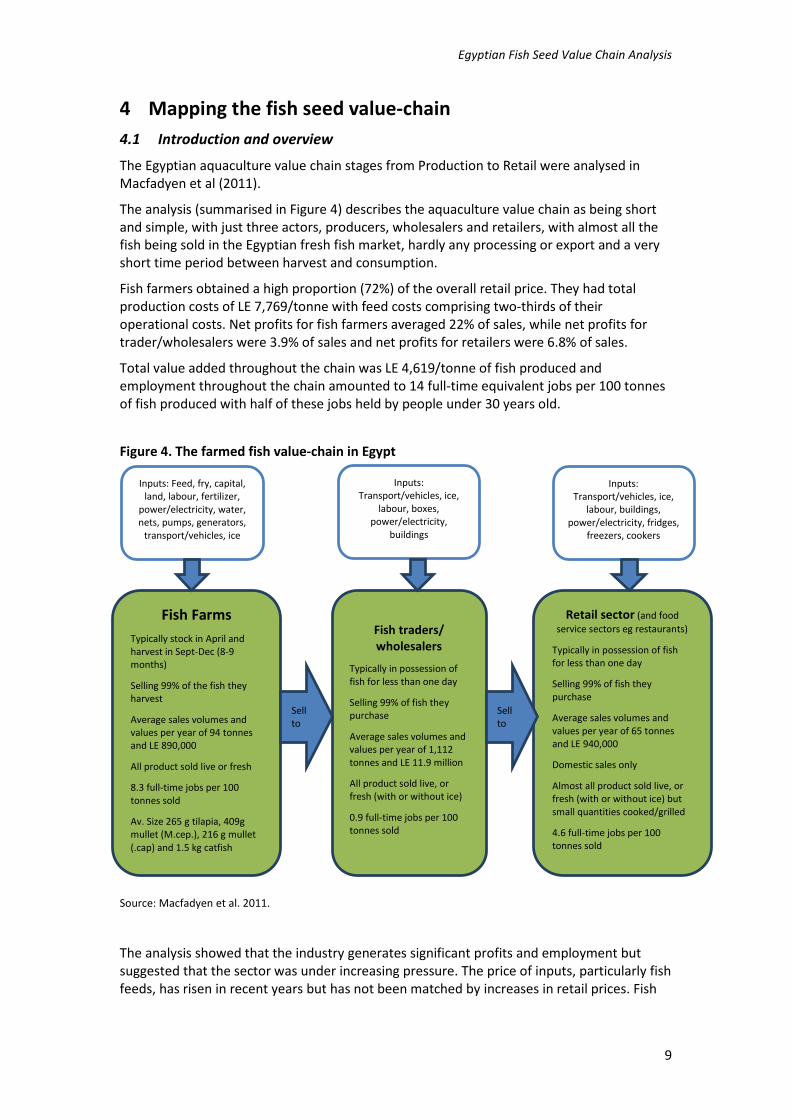
The Egyptian aquaculture value chain stages from Production to Retail were analysed inMacfadyen et al (2011).
The analysis (summarised in Figure 4) describes the aquaculture value chain as being shortand simple, with just three actors, producers, wholesalers and retailers, with almost all thefish being sold in the Egyptian fresh fish market, hardly any processing or export and a veryshort time period between harvest and consumption.
Fish farmers obtained a high proportion (72%) of the overall retail price. They had totalproduction costs of LE 7,769/tonne with feed costs comprising two-thirds of theiroperational costs. Net profits for fish farmers averaged 22% of sales, while net profits fortrader/wholesalers were 3.9% of sales and net profits for retailers were 6.8% of sales.
Total value added throughout the chain was LE 4,619/tonne of fish produced andemployment throughout the chain amounted to 14 full-time equivalent jobs per 100 tonnesof fish produced with half of these jobs held by people under 30 years old.
Figure 4. The farmed fish value-chain in Egypt
Source: Macfadyen et al. 2011.
The analysis showed that the industry generates significant profits and employment butsuggested that the sector was under increasing pressure. The price of inputs, particularly fishfeeds, has risen in recent years but has not been matched by increases in retail prices. Fish
Inputs: Feed, fry, capital,land, labour, fertilizer,
power/electricity, water,nets, pumps, generators,
transport/vehicles, ice
Inputs:Transport/vehicles, ice,
labour, boxes,power/electricity,
buildings
Inputs:Transport/vehicles, ice,
labour, buildings,power/electricity, fridges,
freezers, cookers
Fish Farms
Typically stock in April andharvest in Sept-Dec (8-9months)
Selling 99% of the fish theyharvest
Average sales volumes andvalues per year of 94 tonnesand LE 890,000
All product sold live or fresh
8.3 full-time jobs per 100tonnes sold
Av. Size 265 g tilapia, 409gmullet (M.cep.), 216 g mullet(.cap) and 1.5 kg catfish
Fish traders/wholesalers
Typically in possession offish for less than one day
Selling 99% of fish theypurchase
Average sales volumes andvalues per year of 1,112tonnes and LE 11.9 million
All product sold live, orfresh (with or without ice)
0.9 full-time jobs per 100tonnes sold
Retail sector (and food
service sectors eg restaurants)
Typically in possession of fishfor less than one day
Selling 99% of fish theypurchase
Average sales volumes andvalues per year of 65 tonnesand LE 940,000
Domestic sales only
Almost all product sold live, orfresh (with or without ice) butsmall quantities cooked/grilled
4.6 full-time jobs per 100tonnes sold
Sellto
Sellto
Egyptian Fish Seed Value Chain Analysis
10
feeds represented 67% of operating costs while fish seed was the second highest cost (13%of operating costs).
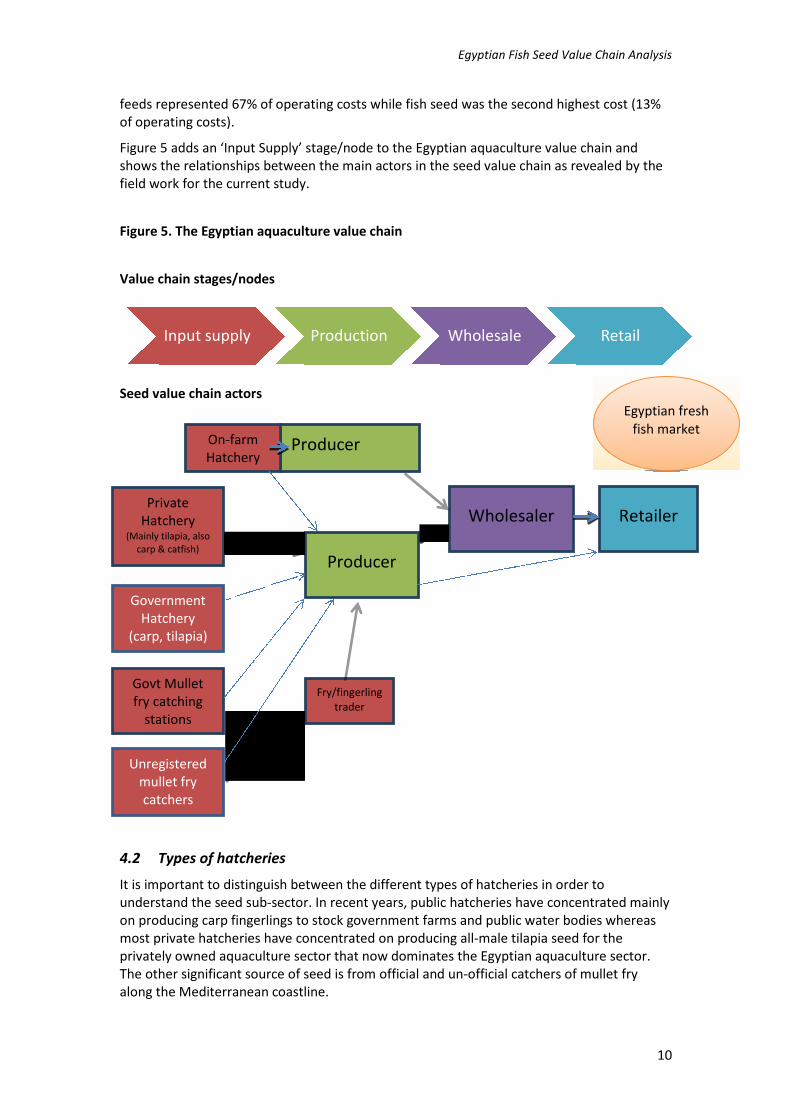
Figure 5 adds an ‘Input Supply’ stage/node to the Egyptian aquaculture value chain andshows the relationships between the main actors in the seed value chain as revealed by thefield work for the current study.
Figure 5. The Egyptian aquaculture value chain
Value chain stages/nodes
Seed value chain actors
4.2 Types of hatcheries
It is important to distinguish between the different types of hatcheries in order tounderstand the seed sub-sector. In recent years, public hatcheries have concentrated mainlyon producing carp fingerlings to stock government farms and public water bodies whereasmost private hatcheries have concentrated on producing all-male tilapia seed for theprivately owned aquaculture sector that now dominates the Egyptian aquaculture sector.The other significant source of seed is from official and un-official catchers of mullet fryalong the Mediterranean coastline.
Input supply Production Wholesale Retail
PrivateHatchery
(Mainly tilapia, alsocarp & catfish)
Govt Mulletfry catching
stations
Fry/fingerlingtrader
Producer
Wholesaler Retailer
Egyptian freshfish market
ProducerOn-farmHatchery
GovernmentHatchery
(carp, tilapia)
Unregisteredmullet frycatchers

Egyptian Fish Seed Value Chain Analysis
11
As shown in figure 5, private hatcheries fall into two main types; independently operatedhatcheries and on-farm hatcheries operating as part of a vertically integrated hatchery andproduction farm.
Egyptian tilapia seed producers have specialised in the production of sex-reversed, all-malefry and fingerlings3. They operate on a seasonal basis as temperatures are too low in thewinter for tilapia (also carp and catfish) to breed. The usual tilapia cycle is to stock breedingsystems with broodstock in March/April and start collecting fry within two weeks. The fryare then fed hormone-treated food for 3-4 weeks before they are sold as 0.2 g all-male fry. Ittakes another 4-6 weeks (or longer if they are being over-wintered) before these fish can besold as 3-5 g fingerlings.
Many hatcheries are advancing and extending their breeding season by warming the waterin their systems. The most common technique is to use solar heating (enclosing breedingtanks or ponds in greenhouse tunnels), but this may be augmented by heating using a boileror using borehole water which has a higher temperature than surface water. This allows thehatchery to meet high demand for seed at the start of the season.
The main tilapia seed market in Egypt is for fry rather than fingerlings as fry are muchcheaper and are easily transported, although some hatcheries also sell advanced fry (around1 g). There are significant seasonal variations in supply and prices. At the start of the season,farmers will pay high prices for over-wintered fingerlings. The first new season’s fry,produced by hatcheries with heating systems, also command high prices. However, pricesdrop as the season progresses and more seed becomes available.
The other main actors in the fish seed value chain are the fry and fingerling traders whopurchase seed from hatcheries and sell to farmers. In some cases, traders sell the fishdirectly. In others, they stock fry into nursery ponds and grow the fish for a period, perhapsbuying cheaply at the end of one season and over-wintering to benefit from strong demandat the start of the next growing season.
As noted earlier, the carp hatchery system operates almost entirely within the public sectorwith government hatcheries supplying fingerlings to stock government fish farms and publicwater bodies. Market demand for carp is low and retail prices reflect this (Macfadyen et al,2011).
Interest in African catfish production is growing in Egypt and is at present based mainly onwild-caught fingerlings. There is also limited production by hatcheries. However, it is a moredifficult fish to breed than tilapia. A number of hatchery technologies have been developedfor this species ranging from induced spawning in tanks to semi-natural spawning methodsdeveloped at WorldFish Center, Abbassa. There should be potential for significantdevelopment in the future as the requisite hatchery skills and facilities become established.
The supply of mullet fry to the value chain is through licensed fishing stations and unlicensedfishermen operating along the Mediterranean coastline. This is a valuable part of theaquaculture sector as mullet retail prices are significantly higher than those for other speciesand is reflected in the value of the mullet fry which are worth much more than tilapia or carpseed. There is a quota system controlling the supply of mullet seed from licensed catchingstations to licensed production farms, however much of the trade is unregulated and illegal.It appears that fry and fingerling traders play a key role in the transfer of mullet fry andfingerlings to the much larger unlicensed production farm sector.
3Tilapia fry are fed a male hormone-treated feed for 3-4 weeks which converts all the fish to faster
growing males and reduces problems caused by early reproduction in ponds.

Egyptian Fish Seed Value Chain Analysis
12
The official figures for the numbers of hatcheries in each of the four study governorates areshown in Table 2. It should be noted that the figures for unlicensed hatcheries are onlyestimates and are probably underestimated. As with the unlicensed aquaculture productionfarms there is no way of telling how many hatcheries are actually operating at present andeven less is known about the number of fry and fingerling traders operating in eachgovernorate.
Table 2. Distribution of hatcheries by Governorate (2010)
GovernorateGovernment
owned Private - licensedPrivate -
unlicensed Total
Behera 1 5 20-30 35-45
Fayoum 7 10 17
Kafr El-Sheikh 1 113 200-300 313-413
Sharkia 2 0 40-50 40-50
Source: GAFRD
4.3 Fish Hatchery analysis
All the 50 hatchery operators interviewed by the study team were private hatcheries (bothlicensed and unlicensed) and concentrated on the production of all-male tilapia fry andfingerlings. The average time that they had been in business was 11 years and theinterviewees were a mixture of owners and managers of hatcheries.
All the hatcheries used surface water as their main water source, while 4 of the 50 also hadaccess to ground water. Seventy six percent said that they had mains electricity supply fortheir facility, while 54% had a household water supply and 56% were accessed via a pavedroad.
The average size of hatchery was 4.09 feddans (1.72 ha) with an average of 3.68 feddansused for fish production. Twenty two of the hatcheries were based on land that they owned,while 28 were on rented land.
The most common hatchery system used was hapas (40 hatcheries, total 4053 units) while36 farms had concrete tanks (total 1831 units) and 17 hatcheries used earth ponds (total 80units). All the hatcheries used natural spawning methods - as would be expected for tilapia.
Forty six percent of hatcheries used water heating and greenhouses to increase production,while 18% used only greenhouses, 6% used groundwater and 36% used aeration. Most (90%)of the farms had additional ponds to hold broodstock and 54% had nursery ponds.
The average annual period for spawning tilapia was 6.5 months and hatchery operatorsexpected on average to sell tilapia fry and fingerlings over 5.7 months of the year. The 50hatcheries hold a total of 535,900 broodstock (422,000 female and 113,900 male) at anaverage female to male ratio of 2.9:1 and average broodstock size of 276g and 307g forfemales and males respectively. Broodstock are stocked in spawning units at an averagedensity of 3.8 fish per m2. The average number of fry collected in each spawning batch is1016/m2 with an average spawning interval of 13.9 days resulting in 6 spawning cycles perseason. Most (39 of the 50) of the interviewees said that the most important factor settingfry and fingerling prices was supply and demand.
The estimated total number of tilapia fry produced by the 50 hatcheries was 474 million soldat an average price of LE 30.4 per 1000 fry. This represents 95.7% of their total fry and
Egyptian Fish Seed Value Chain Analysis
13
fingerling production. Fingerling production by the 50 hatcheries totalled 21 million at anaverage price of LE 114.3 per 1000 fingerlings. A small number (9700) of broodstock werealso sold at LE 2.6 each. Thus, the average hatchery sold just under 10 million fish seed (fryand fingerlings) per year and 95% of sales were in the form of fry. At an average of 8 seedrequired to produce one kg of fish, 10 million seed should produce 1250 tonnes of fish.
The hatcheries had mixed perspectives on historical trends. Fifteen hatcheries saidproduction had increased in 2011 compared to the previous year whereas 10 said it hadgone down, and the rest said it was much the same. Three hatchery operators claimedprices were higher in 2011 while 9 said they had gone down, and 14 said their annual salesvalue had gone up, while 15 said it had gone down.
Most of the hatcheries said they were able to sell all their production and of the 19 who saidthey experienced problems, all but one said this was because of mortalities, not because ofmarket demand. The average loss of fry at different stages was estimated as 11%, 12% and39% during hormone treatment, nursery and fingerling stages (usually overwinteringfingerlings), respectively.
All the hatcheries used commercially available feeds for broodstock (average 30.4% protein),while a mix of commercial and farm-made feeds was used for fry (45.1% protein) andfingerlings (29.6% protein). Average feed prices ranged from LE 4000 per tonne forbroodstock feed to LE 4433 per tonne for fingerling feed and LE 7139 per tonne for fry feed.
Sixteen of the 50 hatcheries were selling over 50% of their production to their own farm;that is, they are an integral part of a production fish farm. On average 30% of the fry andfingerlings produced by all the hatcheries were sold to their own production farm, 58% toother production farms and 12% to fry traders. On average, 56% of production was sold forcash and 44% as credit sales that took an average of 6 months for reimbursement. However,hatcheries usually charge an average of 3% for credit sales.
Seventy three per cent of the interviewees said that their customers would be keen to buyfaster growing fish seed while 13% disagreed. 68% of the hatcheries had tried to introducefaster growing tilapia into their farms. If they were able to get a faster growing strain oftilapia, on average they said they would replace 31.7% of their broodstock.
Table 3 shows the basic operational data grouped by Governorate. This shows thathatcheries interviewed in Behera and Fayoum were smaller than those in Kafr el Sheikh andSharkia. However, fry and fingerling prices were higher in Fayoum than in the othergovernorates. This is in accordance with the results of the 2011 value chain analysis whichfound that prices through the value chain were higher in Fayoum.
The average seed prices recorded by this study are significantly lower than those in the 2011value chain analysis. The 2011 study team reported prices of LE 50-200 per thousand seedhowever, they also said that the usual stocking size was 10 g (4 g in Behera) whereas thisstudy found that most seed are sold to production farms as fry of less than 1 g.
There are also significant seasonal variations. Tilapia fry prices tend to be highest at the startof the season (April/May) when farmers are keen to stock their ponds as early as possiblebut the supply can only be met by hatcheries that have invested in heating systems, or thosewhich have overwintered fingerlings. Supply from unheated hatcheries coupled withreducing demand results in lower prices in the middle and at the end of the season. In thecurrent study, hatcheries were asked to give an average price across the season.

Egyptian Fish Seed Value Chain Analysis
14
Table 3. Operational data for Egyptian fish hatcheries
Operational data Behera FayoumKafr elSheikh
Sharkia All farms
Number of hatcheryoperators interviewed
8 8 24 10 50
Total area (feddans) 23 18 122.5 41 205
Average area (feddans) 2.9 2.3 5.1 4.1 4.1
Average number ofbroodstock
9,344 5,281 11,373 14,600 10,719
Female:Male ratio 3.0 3.0 2.9 2.9 2.9
Average male tilapia (g) 291 225 368 240 307.1
Average female tilapia (g) 240 191 346 205 275.8
Average tilapia fry price(LE/1000)
29.21 34.25 29.87 29.50 30.43
Average tilapia fingerlingprice (LE/1000)
80.00 200.00 96.25 116.67 114.29
A summary of the data collected on employment in Egyptian fish hatcheries is shown inTable 4. This indicates that employment levels were similar across different governoratesand averaged 1.6 full-time equivalents (FTEs) per feddan of hatchery area. When expressedin terms of fry production, employment varied from 0.42 FTE per million fry in Sharkia to0.88 FTE per million fry in Fayoum with an overall average of 0.57 FTE per million fry. If theoverall production of the Egyptian tilapia seed industry is 3.5 billion fry, this means thatalmost 2000 FTE jobs are engaged in Egyptian hatcheries. This compares to estimated overallemployment in the aquaculture value chain from production to retailing of around 82,000FTE jobs (Macfadyen et al. 2011). While none of the fish hatcheries employed women, anaverage of 59% of the FTE jobs were for people under 30 years old.
Table 4. Employment in Egyptian fish hatcheries
Employment Behera FayoumKafr elSheikh
Sharkia Total
Average FTE perfeddan
1.75 1.78 1.58 1.35 1.60
Average FTE per 1million fry
0.52 0.88 0.54 0.42 0.57
FTE under 30 yearsold
37% 54% 65% 66% 59%
The financial performance of the hatcheries is summarised in Table 5. Obviously, the costbase of hatcheries is quite different to production farms. In the 2011 aquaculture valuechain study, feed costs represented 67% of operating costs in production farms whereasfeed costs are only 29% of hatchery operating costs. On the other hand, the relative cost oflabour is higher in hatcheries than in production farms.
From this analysis it appears that hatcheries achieve significantly higher profit levels thanproduction farms. Average operating profits per million fry were very consistent ranging

Egyptian Fish Seed Value Chain Analysis
15
from LE 21,283 in Kafr el Sheikh to LE 27,062 in Fayoum and averaging LE 22,485 across all50 hatcheries.
When fixed costs are taken into account, average net profits ranged from LE 14,613 permillion fry in Kafr el Sheikh to LE 22,332 in Fayoum with an overall average of LE 17,720 permillion fry. This is equivalent to an average net profit of 44% of sales, or twice the averageprofitability of production farms recorded in the 2011 value chain analysis.
Table 5. Financial performance in Egyptian fish hatcheries
Financial performance Behera FayoumKafr elSheikh
Sharkia All farms
Average sales revenue perhatchery (LE)
237,594 172,750 379,875 445,526 337,100
Average operational costs(LE)
93,529 59,158 100,515 167,783 111,781
Average feed costs (%operational costs)
28.3% 25.6% 29.8% 30.1% 28.9%
Average labour costs (%operational costs)
51.8% 48.9% 41.4% 47.2% 45.4%
Average labour costs (LE permillion fry)
7156 7599 6507 6129 6710
Average operational profit(LE)
146,293 113,592 225,693 277,743 205,463
Average operational costsper million fry (LE)
13,817 16,437 16,373 13,355 15,371
Average op. profit permillion fry (LE)
21,848 27,062 21,283 22,219 22,485
Average operational profit(% sales revenue)
59.4% 60.9% 58.9% 57.2% 59.0%
Average fixed costs (LE) 33,667 21,603 66,001 68,804 47,518
Average total productioncost (LE)
124,968 80,761 218,679 236,586 185,200
Average production cost(LE/million fry)
18,628 21,167 22,798 18,678 21,045
Average net profit (LE) 112,626 91,989 161,196 208,939 151,900
Average net profit(LE/million fry)
17,037 22,332 14,613 16,897 17,720
Average net profit (% ofsales)
46% 49% 40% 41% 44.0%
Average total value-added(LE/million fry)
24,194 29,931 21,120 23,026 24,430
Value added = net profit + wages
4.4 Fry and fingerling trader analysis
The study team found it surprisingly difficult to identify fry and fingerling traders. Clearlyonly a relatively small proportion of hatchery-bred fish sales are carried out through traders.The hatchery analysis indicated that only 12% of their sales, which were all tilapia, were totraders. However fry and fingerling traders also supply fingerlings from other sources such aswild-caught mullet fry.

Egyptian Fish Seed Value Chain Analysis
16
Of the 8 traders that were interviewed, 4 were from Kafr el Sheikh, 2 from Fayoum and 1each from Behera and Sharkia. The average length of time that the traders had beeninvolved in the business was 7.4 years. The traders represented a range of types and scalesof business from a simple operation where the trader had a transport tank and plastic bagsand used hired transport, to traders who owned ponds, vehicles and oxygen cylinders.
Two of the operators only bought and sold fry and fingerlings, selling them immediately tofish farmers while all the others said that they also reared fry in ponds before selling the fishas fingerlings to farmers.
While most of the traders sold more tilapia fry and fingerlings than any other type, 3 of the 4traders in Kafr el Sheikh sold more mullet than tilapia. This is quite a different business fromtilapia as all the mullet seed are wild-caught either through the official catching stations orthrough ‘black market’ fry catchers. Mullet fry and fingerlings are also much more expensivethan tilapia. There were also significant sales of carp by 2 of the 8 traders. On average, thetraders said 68% of fry and fingerling sales were from hatcheries while the remainder werewild-caught.
The traders said the preferred size of fingerlings for their customers was around 1 g fortilapia, 100 g for catfish4, 3 g for carp and 2.5 g for mullet. The peak supply period for tilapiafry to traders (from hatcheries) is June-August while the peak demand from farmers is inMarch/April. The traders said that the most important issue for their customers was thequality of fry, followed by prices and fingerling size. The traders said that tilapia fry andfingerling prices were highest at the start of the season (April) and dropped from Juneonwards, while the annual trend in mullet prices was the opposite of this, rising through theseason.
On average, 90% of fry/fingerling trader operating cost was the cost of purchasing fry andfingerlings and most traders said that these costs were rising. The second most importantoperating cost was labour (6%).
While most of the traders sold more tilapia than other species, traders concentrating onmullet generate much higher revenues (and have higher operating costs) than those thatdeal mainly in tilapia. This is because mullet fingerlings have a much higher value, LE 400-1200 per 1000 fingerlings compared to average tilapia prices of LE 38 per 1000 fry and LE166 per 1000 fingerlings. Traders said that while their sales volumes of tilapia were static(compared to previous years), the volume of mullet sales had fallen (because of poor supply)and prices had increased as a result. Half of the traders said that they are the mostimportant link in the value chain for setting fish seed prices. There appear to be fewproblems with mortalities and good demand for fingerlings.
Most of the traders’ sales (77%) are conducted in cash while credit sales take around 12months to be paid and cost 4% extra for their customers. All the traders said their businesseswere self-financed. Only one of the traders has received training in the past.
Most of the traders employed few staff, except for the larger operations that hold fry inponds for an extended period. As shown in Table 6, the average employment level was 0.55FTEs per million of fry sales.
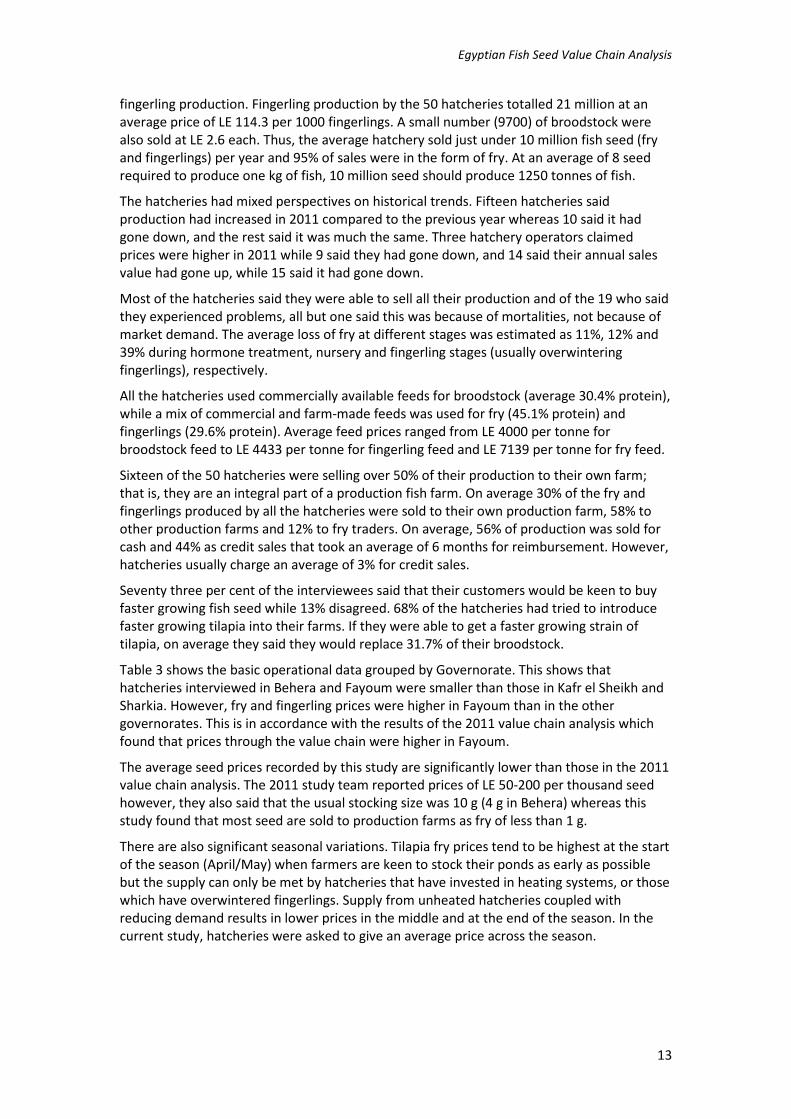
Operating and net profits averaged 31.7% and 29.2% respectively indicating that fry andfingerling trading is a profitable enterprise, even for smaller operations such as the traders inFayoum.
4This was based on only one trader probably dealing in wild caught fish so may not represent usual
preferences.
Egyptian Fish Seed Value Chain Analysis
17
Table 6. Operational and financial data for fry/fingerling traders
Summary/Average Frytrader model 2011
Behera Fayoum Kafr el Sheikh SharkiaAll traderaverage
No. of traders interviewed 1 2 4 1 8
Average sales value (LE) 938,000 235,825 1,064,688 810,000 809,800
Average employment (FTEper million of fry sales) 0.18 0.72 0.65 0.19 0.55
Average labour costs (LE) 30,000 19,200 39,850 38,400 33,275
Average operational costs(LE) 726,100 165,125 667,094 678,400 550,391
Average operational profit(LE) 211,900 70,700 397,594 131,600 259,409
Average operational profitas % of sales 22.6% 27.1% 40.2% 16.2% 31.7%
Average fixed costs (LE) 830 2,700 33,570 13,500 19,251
Average net profit (LE) 211,070 68,000 364,024 118,100 240,158
Average net profit as % ofsales 22.5% 25.8% 36.3% 14.6% 29.2%
Average total value-added 241,070 87,200 403,874 156,500 273,433
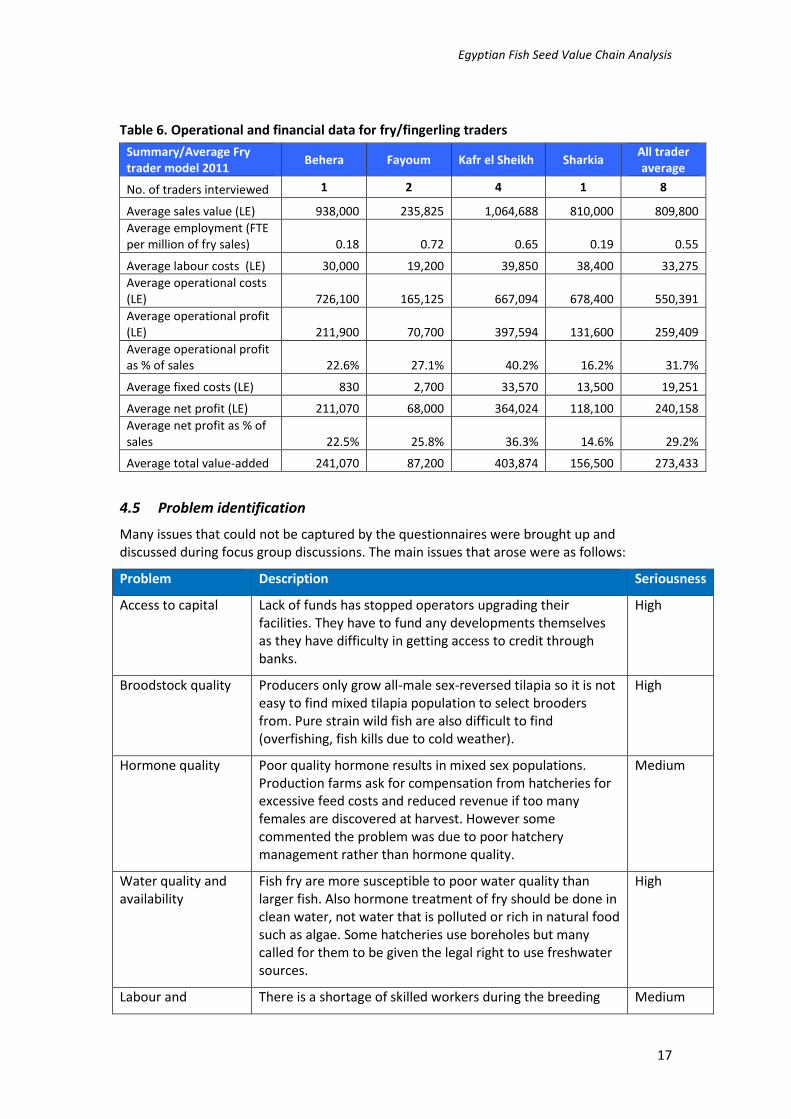
4.5 Problem identification
Many issues that could not be captured by the questionnaires were brought up anddiscussed during focus group discussions. The main issues that arose were as follows:
Problem Description Seriousness
Access to capital Lack of funds has stopped operators upgrading theirfacilities. They have to fund any developments themselvesas they have difficulty in getting access to credit throughbanks.
High
Broodstock quality Producers only grow all-male sex-reversed tilapia so it is noteasy to find mixed tilapia population to select broodersfrom. Pure strain wild fish are also difficult to find(overfishing, fish kills due to cold weather).
High
Hormone quality Poor quality hormone results in mixed sex populations.Production farms ask for compensation from hatcheries forexcessive feed costs and reduced revenue if too manyfemales are discovered at harvest. However somecommented the problem was due to poor hatcherymanagement rather than hormone quality.
Medium
Water quality andavailability
Fish fry are more susceptible to poor water quality thanlarger fish. Also hormone treatment of fry should be done inclean water, not water that is polluted or rich in natural foodsuch as algae. Some hatcheries use boreholes but manycalled for them to be given the legal right to use freshwatersources.
High
Labour and There is a shortage of skilled workers during the breeding Medium

Egyptian Fish Seed Value Chain Analysis
18
management skills season. Hatchery managers have to spend time and efforttraining unskilled labourers and provide incentives for skilledworkers. Meanwhile hatchery labourers are calling forimprovements in their working conditions, such as beingcovered by national labour laws, getting pensions and beingcovered by medical health insurance.
Powercosts/availability
Hatcheries which heat the water incur increased costs andmany have encountered problems with short supply ofheating fuel. Heating using electricity is cheaper howevernot all hatcheries have a reliable connection to the network.
High
Land availability &tenure
Hatcheries do require large areas of land, however some ofthe interviewees reported that short-term leases preventthem from investing in their hatcheries.
Medium
Fish healthmanagement
Hatcheries said they lacked technical support to diagnosedisease problems and decide on appropriate treatments.The most common problems were death of broodstock andpoor fry survival during the rearing stage. The most commonfish problems were with bacterial diseases, fungal diseasesand parasitic diseases especially Trichodina and Monogenea.
Medium -high
Declining prices Many hatcheries noted declining fry prices over time causedby oversupply from the increasing number of tilapiahatcheries. Oversupply also leads to credit sales of fry whichmeans they may not get paid for 8 – 12 months.
High
Fluctuating prices Fry prices are highest at the start of the season and declinegradually. Average prices for mono-sex tilapia fry in Aprilstart at LE 50-60 per 1000 and decline to LE 10-20 per 1000in July and August.
Medium
Permission totransport fry
Hatcheries and fry/fingerling traders cannot transport seedfrom one governorate to another without a hatchery licenseand a fry transport permit however most cannot get thenecessary documentation as they are unlicensed. Police ortraffic officers take an action against any vehicle caughttransporting fry without permission.
High

Egyptian Fish Seed Value Chain Analysis
19
4.6 Summary of analysis
According to the 2011 aquaculture value chain analysis, the purchase of fish seed was thesecond most important operating cost for Egyptian fish farmers, representing an average of13% of total operating costs. This compares to 67% for feed, 8% for labour, 5% for salescommission and 3% for fuel/electricity/power.
While seed costs represent a significant but relatively minor proportion of overall costs, theavailability of high quality seed is a precondition for development of an aquacultureindustry. Egyptian aquaculture is increasingly dominated by tilapia production, while mulletis the second most important type of fish grown. Tilapia fry and fingerlings are now derivedalmost exclusively from private hatcheries while wild-caught mullet seed are supplied byofficial catching stations and unlicensed catchers. Carp aquaculture, largely dominated bypublic sector hatcheries and farms, now represents a minor part of the aquaculture valuechain.
The seed value chain study team found all of the 50 hatchery operators interviewedconcentrated on all-male tilapia seed production and sold most of their production directlyto producers (or their own production farm) as fry rather than fingerlings. Some also sold aproportion of their production to fry/fingerling traders.
An average hatchery produces 10 million seed (fry and fingerlings) per year. At an averageyield of 8 seed per kg this is equivalent to 1250 tonnes of marketable fish. According to the2011 aquaculture VCA the average volume of production farm is around 90 tonnes per yearso each hatchery serves the needs of around 14 production farms. If Egyptian tilapia farmsproduce a total of 550,000 tonnes per year this means there are approximately 440hatcheries and over 6000 production farms.
The main operating cost for hatcheries was labour (45%), followed by feed (29%) andfuel/electricity (9%). Most had low fixed costs although some have invested in water heatingsystems to produce fry earlier in the season which allows them to service premium markets.
Hatcheries employ relatively few people, on average 5.7 FTE for an average hatchery.However a high proportion (59%) of employees are under 30 years old and they are skilledjobs that command higher wage levels than ordinary agricultural labourers. Totalemployment in the hatchery sector is likely to be around 2,000 FTE compared to 96,000 FTEin the overall aquaculture sector.
The hatchery operators said that number of tilapia hatcheries has expanded in recent years,which has resulted in declining tilapia seed prices. There are also significant seasonalvariations in fingerling prices. Nevertheless hatcheries appear to be highly profitable withaverage operating profits of LE 22,485 and average net profits of 44% of sales. The totalvalue added by the average hatchery was LE 24,430.
While fry and fingerling traders are relatively unimportant to the tilapia supply chain theyare a key link in the supply of mullet seed to production farms. The study team were onlyable to interview 8 traders and these represented a wide range of different types of businessso data averages should be used with caution. Most had significantly higher financialturnover in sales of mullet fry than tilapia as mullet are worth much more than tilapia. Fishpurchases represented 90% of operating costs. Average employment levels were 0.55 FTEsper million fry sales. Operating profits averaged 32% while net profits were 29%.

Egyptian Fish Seed Value Chain Analysis
20
Figure 6. A typical tank-based hatchery enclosed in a greenhouse tunnel
Figure 7. A hapa-based hatchery in a greenhouse tunnel
Figure 8. Fry packed in plastic bags for distribution to fish farmers

Egyptian Fish Seed Value Chain Analysis
21
5 BenchmarkingComparing the financial performance of Egyptian fish hatcheries and fry/fingerling traderswith their past performance and with operators in other countries is difficult. There appearto be few other value chain studies focussed specifically on fish seed production. A recentstudy was carried out for WorldFish Center in Bangladesh, however, which concentratedsolely on carp seed in southern Bangladesh (Innovision, 2012).
As already noted in this report, seed prices vary greatly depending on the product beingsold. The Egyptian tilapia aquaculture industry almost exclusively farms all-male Nile tilapia,most of which are sold by hatcheries as fry immediately after sex-reversal. Larger fry orfingerlings cost more to rear and usually command higher prices. However prices also varygreatly according to seasonal demand; the first tilapia fry at the start of a new season willcost more than fry purchased in the middle or end of the season, while overwinteredfingerlings will cost even more.
The average selling price for all-male tilapia fry and fingerlings reported by hatcheryoperators in this study were LE 30 (US$ 5) per 1000 and LE 114 (US$ 18.9) per 1000respectively. Meanwhile, fry/fingerling traders said their average selling prices for all-malefry and fingerlings were LE 38 (US$ 6.3) per 1000 and LE 166 (US$ 27.5) per 1000respectively. In the 2011 value chain analysis, fry and fingerling prices were reported asbetween LE50 and LE200 per thousand, depending on quality and size. There is no clearreason why higher prices were recorded in the previous study.
Table 7 shows fry and fingerling prices from GAFRD’s hatcheries. Their tilapia prices have notchanged over the years (tilapia seed production is a relatively minor part of their activities)whereas mullet prices have risen substantially.
Table 7. GAFRD official fingerling selling prices (LE per 1000)
Year Tilapia Fingerlings (Monosex) Grey MulletThinlip & keeled
Mullet
0.5 g 2 g 2-5 g 5-10 g 10-15 g 15-30 g 0.5 g 0.5-2 g 0.5 g 0.5-2 g
2000 70 90 120 180 230 23 100 8 20
2001 70 90 120 180 230 23 100 8 20
2002 70 90 120 180 230 23 100 8 20
2003 70 90 120 180 230 23 100 8 20
2004 70 90 120 180 230 100 200 20 100
2005 70 90 120 180 230 100 200 20 100
2006 70 90 120 180 230 100 200 20 100
2007 70 90 120 180 230 100 200 20 100
2008 30 70 90 120 180 230 150 300 40 150
2009 30 70 90 120 180 230 150 300 40 150
2010 30 70 90 120 180 230 150 300 40 150
2011 30 70 90 120 180 230 150 300 40 150
2012 30 70 90 120 180 230 150 300 40 150
Source: GAFRD
During the interviews for this study, declining mono-sex tilapia fry prices was voiced as acommon problem. The first private tilapia hatchery was developed in Kafr El-Sheikh in 1990-1991 by Dr. Ismail Radwan (Radwan, 2008). He said that he sold mono-sex tilapia fry 0.2-0.5g, (post hormonal treatment) at LE 120 per 1000 fry, which was equivalent to US$ 36-40 atthat time. He also reported that he maintained his prices for five years and as a result ofestablishing another hatchery he started to sell fingerlings (1-2 g) at the same price (LE 120per 1000) as an extra service for his customers. He now says that there is very little profit tobe earned from tilapia hatcheries and concentrates on training and consultancy.
Egyptian Fish Seed Value Chain Analysis
22
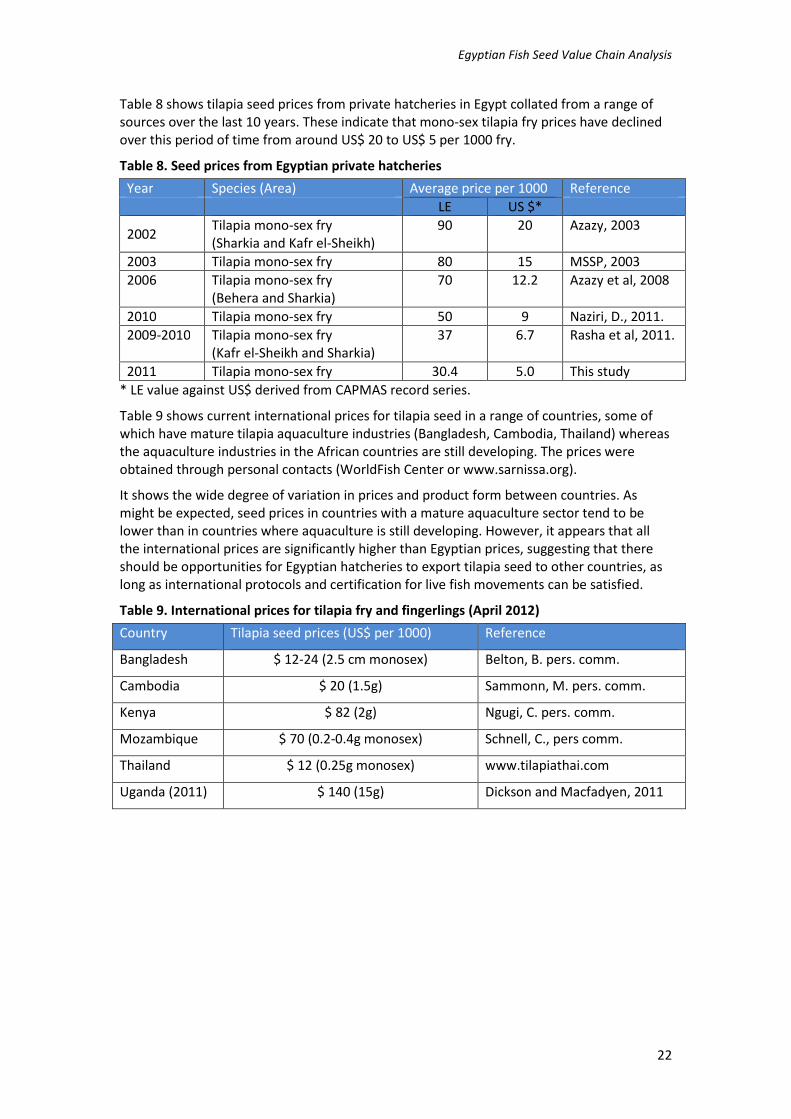
Table 8 shows tilapia seed prices from private hatcheries in Egypt collated from a range ofsources over the last 10 years. These indicate that mono-sex tilapia fry prices have declinedover this period of time from around US$ 20 to US$ 5 per 1000 fry.
Table 8. Seed prices from Egyptian private hatcheries
Year Species (Area) Average price per 1000 Reference
LE US $*
2002Tilapia mono-sex fry(Sharkia and Kafr el-Sheikh)
90 20 Azazy, 2003
2003 Tilapia mono-sex fry 80 15 MSSP, 2003
2006 Tilapia mono-sex fry(Behera and Sharkia)
70 12.2 Azazy et al, 2008
2010 Tilapia mono-sex fry 50 9 Naziri, D., 2011.
2009-2010 Tilapia mono-sex fry(Kafr el-Sheikh and Sharkia)
37 6.7 Rasha et al, 2011.
2011 Tilapia mono-sex fry 30.4 5.0 This study
* LE value against US$ derived from CAPMAS record series.
Table 9 shows current international prices for tilapia seed in a range of countries, some ofwhich have mature tilapia aquaculture industries (Bangladesh, Cambodia, Thailand) whereasthe aquaculture industries in the African countries are still developing. The prices wereobtained through personal contacts (WorldFish Center or www.sarnissa.org).
It shows the wide degree of variation in prices and product form between countries. Asmight be expected, seed prices in countries with a mature aquaculture sector tend to belower than in countries where aquaculture is still developing. However, it appears that allthe international prices are significantly higher than Egyptian prices, suggesting that thereshould be opportunities for Egyptian hatcheries to export tilapia seed to other countries, aslong as international protocols and certification for live fish movements can be satisfied.
Table 9. International prices for tilapia fry and fingerlings (April 2012)
Country Tilapia seed prices (US$ per 1000) Reference
Bangladesh $ 12-24 (2.5 cm monosex) Belton, B. pers. comm.
Cambodia $ 20 (1.5g) Sammonn, M. pers. comm.
Kenya $ 82 (2g) Ngugi, C. pers. comm.
Mozambique $ 70 (0.2-0.4g monosex) Schnell, C., pers comm.
Thailand $ 12 (0.25g monosex) www.tilapiathai.com
Uganda (2011) $ 140 (15g) Dickson and Macfadyen, 2011

Egyptian Fish Seed Value Chain Analysis
23
6 Analysis of critical factors
6.1 Seed availability and quality
The availability of seed of particular species determines the species that are grown, so thegrowth of the Egyptian tilapia industry has depended on the development of tilapiahatcheries. In contrast, the growth of African catfish farming is currently constrained by thepoor performance of the few hatcheries that have been adapted for catfish production andinadequate supply of wild-caught catfish fingerlings, while mullet aquaculture dependssolely on catches of wild mullet fry.
Many point to the introduction of all-male tilapia fry production by Egyptian hatcheries inthe 1990s as a turning point for the aquaculture industry (Radwan, I., 2008). The mainresource base for Egyptian tilapia production is earth ponds where, in contrast to cages orintensive tanks, production of mixed sex populations of tilapia is severely limited byprecocious maturity and early reproduction.
The use of hormones to sex-reverse tilapia was made illegal in Egypt in 2003 under aministerial decree (Decree no. 2655) but its legal status was largely ignored. This decisionwas reversed in 2009 by another ministerial decree. Conditions were attached to the 2009decree, such as hatcheries should be managed by a specialist, fry feed should be produced ina specialised (GAFRD) feed mill and hatchery water had to be disposed of safely by holding itin a drainage channel. However, it appears that very few hatcheries are aware of the 2009decision and most continue to manufacture their own hormone-treated feeds.
Internationally it is now widely accepted that the responsible application of this technologyposes no threat to consumers and it is allowed by the USDA and tolerated by EU authorities(Macintosh, 2008). The new Aquaculture Stewardship Council tilapia standards stipulate theuse of 95%+ male populations on the grounds of minimising the impacts of escapees on theenvironment.
Some farmers suggested that there were problems with the quality of hormone available,resulting in poor levels of sex-reversal. However others reported that the problem wasusually with hatchery management rather than with the chemicals. This suggests a need forsourcing hormone from known suppliers and better training for hatchery operators.
6.2 IEIDEAS project seed dissemination strategy
The fact that tilapia seed production is now almost entirely based in private hatcheriesmeans that there are obvious opportunities to improve the genetic profile of the fish beingfarmed in Egypt. Until now, this seems to have been restricted to using stocks fromparticular sources, such as farmers maintaining their own broodstock, or sourcing fish fromother fish farms with a good reputation such as GAFRD’s Barseek fish farm, or sourcing wild‘pure strain’ fish from Upper Egypt or Lake Nasser.
The development of improved Abbassa strain Nile tilapia by WorldFish Center offers aunique opportunity for the industry. Research trials indicate that 9th generation Abbassastock grows at least 30% faster than the best Egyptian commercial strains (Rezk et al., 2009).
In Asia, improved strains such as GIFT have been widely adopted. Unlike most actions thatcan be taken by fish farmers, such as using new feeds or growing systems, genetic gains arepermanent and cumulative.
Egyptian tilapia hatcheries are clearly profitable, even at the relatively low fry price levelsrecorded by the survey team. Low entry costs and simple, tried-and-tested technologieshave resulted in rapid expansion of the sub-sector. However, the small-scale nature ofhatcheries (average 10 million seed/year) could present problems for the dissemination

Egyptian Fish Seed Value Chain Analysis
24
strategy as the new strain will have to be introduced to many (several hundred) hatcheriesand from there to several thousand fish farms to have a significant impact across theEgyptian industry.
The strategy outlined in the IEIDEAS project proposal is to disseminate Abbassa strainbroodstock to 7 broodstock multiplication centres who would then supply hatcheries withbroodstock and then the hatcheries would supply Abbassa strain fry and fingerlings tofarmers.
The study findings support this strategy as many hatchery operators said that they haddifficulty replacing their broodstock and they aimed to replace around 30% of theirbroodstock each year. Thus, there is a clear window of opportunity for Abbassa strainbroodstock to become the default supply of new broodstock as long the hatcheries can beconvinced that they are the best choice and they can be supplied at a competitive price. Ofcourse, the partner broodstock multiplication centres must also be able to make profits fromsupplying mixed sex broodstock, which will be a new business for them.
This strategy will take some time to implement and even longer to show real impacts interms of fish production. If the first broodstock are transferred to broodstock multiplicationcentres in July 2012 as fingerlings, their progeny will be available to distribute to hatcheries(as fingerlings) in early/mid 2013. At best, hatcheries will start to sell ‘Abbassa strain’ fry toproduction farms at the end of 2013, but more likely it will be 2014 so the first harvests ofAbbassa strain fish will be in late 2014. However, hatcheries will probably not replace alltheir broodstock at one time - most say they aim to replace one third of their broodstockeach year so unless they can be convinced (or incentivised) to change all their broodstock toAbbassa strain, they will be selling mixed Abbassa/existing strain tilapia for some time tocome.
The dissemination strategy is summarised in Figure 9.
Figure 9. ‘Abbassa’ strain dissemination strategy
6000+ Fish farms
440 Hatcheries
7 BroodstockMultiplication
Centres
WorldFishCenter
Abbassa
Mixed sexseed
Mixed sexseed
All-malefry
All-malefry

Egyptian Fish Seed Value Chain Analysis
25
6.3 Catfish and mullet
Catfish aquaculture is constrained by the availability of catfish fingerlings, with the maincurrent source being wild-caught fingerlings. Hatchery production of this species is morechallenging and requires higher levels of investment than tilapia so will require dedicatedfacilities and staff.
At present, the sustainable supply of mullet fingerlings is at grave risk. It is almost totallydependent on catches by fishers who are operating illegally, there is no control over qualityand the stock may well be being be overfished, threatening the future supply of fingerlingsfor the industry and recruitment in the fishery. Although previous attempts at setting up amullet hatchery were not successful, it may be worth re-evaluating the situation in the lightof the increasing price for mullet fingerlings.
6.4 The role of Producers’ Organisations
The hatchery sector faces many problems that need to be addressed by legislators, forexample, Law 124/1983 which restricts and in most cases bans the use of freshwater for fishfarming is critical as is the need for registration of unregistered hatcheries. This problem isalso shared by the wider aquaculture sector and highlights the need for a representativeorganisation for Egyptian fish farmers that can address these issues at the highest level.
There is a Producers’ Organisation in Fayoum and a loose association of producers in Kafr elSheikh. However, it is important that these are linked to a national over-arching body andthat producer organisations are established in all areas. The main problem is the number offarms involved. If there are around 440 hatcheries and around 6000 farms, there will needto be several tiers of organisation between the producers and the apex body, starting withlocal groups (20-30 members) who provide representatives to regional committees (eachrepresenting 20-30 groups,) who in turn supply representatives to a national committee(Figure 10). This would ensure that the apex body truly represents the needs of its membersand provides a committed membership base to sustain the activities of its representatives.
Of course the most difficult thing will be convincing producers that they stand to benefitfrom joining a producers’ organisation and paying membership dues to fund its operatingcosts. In Fayoum, the main incentive for establishing the PO appears to be reducing inputcosts through collective purchasing of feed however there are a wide range of other benefitsthat could be provided by POs including political lobbying for the sector, collectivemarketing, providing market information, developing processing operations and providingprofessional services such as consultancy advice, insurance, pensions, etc.
Figure 10. Possible structure for an Egyptian aquaculture producers’ organisation
National PO
15 regional committees(each representing ~20
groups)
300 local area groups (eachrepresenting ~20 producers)
6000 + producers
Egyptian Fish Seed Value Chain Analysis
26
6.5 Statistics, registration and licensing
It is impossible to plan the development of the aquaculture industry without reliablestatistics. Unfortunately, current GAFRD statistics are incomplete and based on estimatesnot real data. One of the main problems is that most hatcheries and fish farmers are notofficially registered or licensed so there is no way to collect information on their activities.
While the 2011 value chain analysis and the current study have shown that it is possible tocollect production-related data on fish farms it would be a significant logistical task toextend this across all fish farms in the country. But the first task must be to at least addressthe backlog in fish farm registration.
Effective producer organisations could help in the process of registration and data collection.However, GAFRD must remain responsible for compiling official government statistics.
Of course there are many reasons why many Egyptian fish hatcheries are operating withoutregistration or licensing at present, including technical issues, such as drawing water from anillegal source or the incorrect arrangement of farm inlets and outlets, or farmers may beworried about disclosing production information to fisheries authorities, which could thenbe used by tax authorities. It also appears that there is little enthusiasm from the authoritiesto enforce registration and licensing, although a number of cage-based fish farms in the NileRiver were closed down as a result of enforcement by the Ministry of Irrigation as theyposed a hazard to navigation.
It would be worth comparing the situation in Egypt with other countries that have managedto address this issue. Perhaps FAO might be able to help as they have done recently inThailand5.
5FAO aquaculture newsletter 48. December 2011.

Egyptian Fish Seed Value Chain Analysis
27
7 Conclusions and recommendations
7.1 Summary
There are perhaps as many as 440 private fish hatcheries currently operating in Egyptresponding to strong demand for tilapia fry and fingerlings. Most are not officially registeredand the majority (all?) are producing all-male, sex reversed Nile tilapia. A typical hatcheryproduces 10 million seed per year and sells most of it as fry rather than as fingerlings. Itemploys around 5 staff, over half of whom are below 30 years old, and generates revenuesof LE 337,000 per year. Even though seed prices have dropped in recent years, they are stillvery profitable businesses with average net profits of 44% of sales and average value addedof LE 24,430.
Most hatcheries sell tilapia seed directly to production farms, or are part of combinedhatchery-production farm operations. However a proportion is sold through fry/fingerlingtraders whose main activity is often selling wild-caught mullet seed to production farms.
The economic significance of other types of fish hatchery operations is much less importantas carp aquaculture operates mainly in the public sector, and Government-ownedaquaculture operations have struggled during the recent period of instability while catfishand seabass and sea bream aquaculture have yet to expand to a significant scale.
Many of the issues raised during focus group discussions and individual interviews will beaddressed by the IEIDEAS project. The project already plans to provide extensive support toEgyptian fish seed producers through the provision of genetically improved tilapiabroodstock, the development of best management practices6 and organising training. Theproject will also address ‘policy-level’ issues such allowing the use of fresh water for fishfarms. The following conclusions and recommendations are intended to complement andenhance current plans.
7.2 Dissemination of genetically improved tilapia seed
There is likely to be demand for ‘improved’ tilapia seed by Egyptian fish farmers and thestudy findings support the seed dissemination strategy adopted by the IEIDEAS project.However, it may be necessary to review projections and indicators of project impact. Atpresent these are based on production gains and profitability, but it will take some time forgains from the genetic improvement program to result in measurable impacts. Theintroduction of the Abbassa strain tilapia broodstock into hatcheries is likely to be over anextended period as hatcheries tend to replace only a proportion of their broodstock eachseason. It will take many years before their client production farms will be supplied with 100%Abbassa strain seed and the 30%+ extra growth potential of this new strain results inmeasurable production increases.
Recommendation - It would be more meaningful to introduce direct indicators to theproject logframe such as 30% of stock used on 400 production farms is ‘Abbassa strain’ byend of year 3 in addition to the existing production indicators.
7.3 Registration of hatcheries
A lot of the problems faced by the hatchery sector, and indeed the wider aquacultureindustry, stem from the fact that most private fish farms (hatcheries and production farms)are not officially registered with government authorities. Without registration it isimpossible to produce accurate data on what is happening in the sector or control itsactivities. In many cases there are obvious barriers to registration; for example, they may be
6Hatchery-specific best management practices will be developed.
Egyptian Fish Seed Value Chain Analysis
28
using water sources that they are not permitted to use. However it will be difficult for thesector to make real progress until this issue is addressed. The first step should be to get aclear understanding of the barriers to registration, after which it should be possible tofacilitate a registration process, possibly through Producer Organisations.
Recommendation - Carry out a consultancy study on potential ways to address the backlogin registration and licensing of fish farm businesses.
7.4 Producer Organisations
While the IEIDEAS project is based on a strategy of working with Producer Organisations,there are very few POs functioning on the ground. It is unthinkable that such an importantrural industry has no National level Producer Organisation to represent its interests.Similarly, at the local level, Producer Organisations could bring many benefits to theirmembers.
Recommendation - The IEIDEAS project needs to add targeted activities to promote thedevelopment of POs (workshops, training, support), from the local level through to thedevelopment of a representative national body. Lessons can be drawn from the experiencesof the Fayoum aquaculture producers’ organisation and producer organisations from othersectors.
7.5 Mullet
Mullet aquaculture plays a very valuable role in Egypt’s aquaculture sector. According to the2011 value chain assessment it represented 18% in terms of value from the farms studied.However, the seed supply is entirely dependent on wild-caught sources, most of which areillegal and uncontrolled. Fry and fingerling traders clearly play a role in the trade, linking frycatchers with producers, but unless some control over exploitation of the fishery can beintroduced, the future of mullet aquaculture in Egypt is not sustainable. Introducing controlsover the fishery is beyond the scope of this project. However, it would be worth re-examining the case for captive breeding of mullet in Egypt. The general feeling appears to bethat it didn’t work last time because the price of hatchery reared fry was too high, buthatchery techniques for marine fish species have advanced and the value of mullet seed hasincreased.
Recommendation - Carry out a feasibility study on hatchery production of mullet fry.7
7.6 African catfish
This species could play a very important role in Egyptian aquaculture however production iscurrently limited by fingerling supplies (both wild-caught and hatchery produced). Thehatchery techniques are quite different to those for tilapia. They are more complex anddemand dedicated facilities so there are likely to be a few, large hatcheries specialising incatfish. At present, the main problem appears to be technical expertise. However capitalinvestment may also be required.
Recommendation - Identify hatcheries (both private and public sector8) that are interestedin catfish fingerling production and provide training and mentoring support. This shouldinclude research and feasibility studies to refine practical hatchery techniques, such as the
7The IEIDEAS project will coordinate with the EU to ensure that activities in their proposed marine
aquaculture project are complementary rather than overlapping.
8GAFRD hatcheries are already equipped for carp production which requires similar expertise and
facilities to catfish hatcheries.

Egyptian Fish Seed Value Chain Analysis
29
semi-natural methods developed by WorldFish Center, Abbassa (El Naggar et al, 2006). TheIEIDEAS project could also facilitate access to funds for capital equipment.
7.7 Specialist technical assistance
The Egyptian fish hatchery sector has expanded rapidly however there are few consultantsor veterinarians to provide advice and support in the field. The IEIDEAS project will providetraining in best management practices, through Producers’ Organisations. However,hatcheries and producers also need experienced specialists who can provide timely, on-the-spot advice during a crisis or to help fish farmers avoid problems in the future. In the pastthese services may have been provided by Government, but expansion of the industry andcut-backs in Government funding mean that many farmers have only limited access toadvisory services. Many hatchery operators also complained that the quality of advice givenby consultants was poor.
Recommendation - Develop a cadre of private-sector technical specialists (water quality, fishhealth, pond management) to assist producer organisations and fish farmers in the country.This would involve identification of suitable candidates, provide training and possiblyprovide specialist equipment.
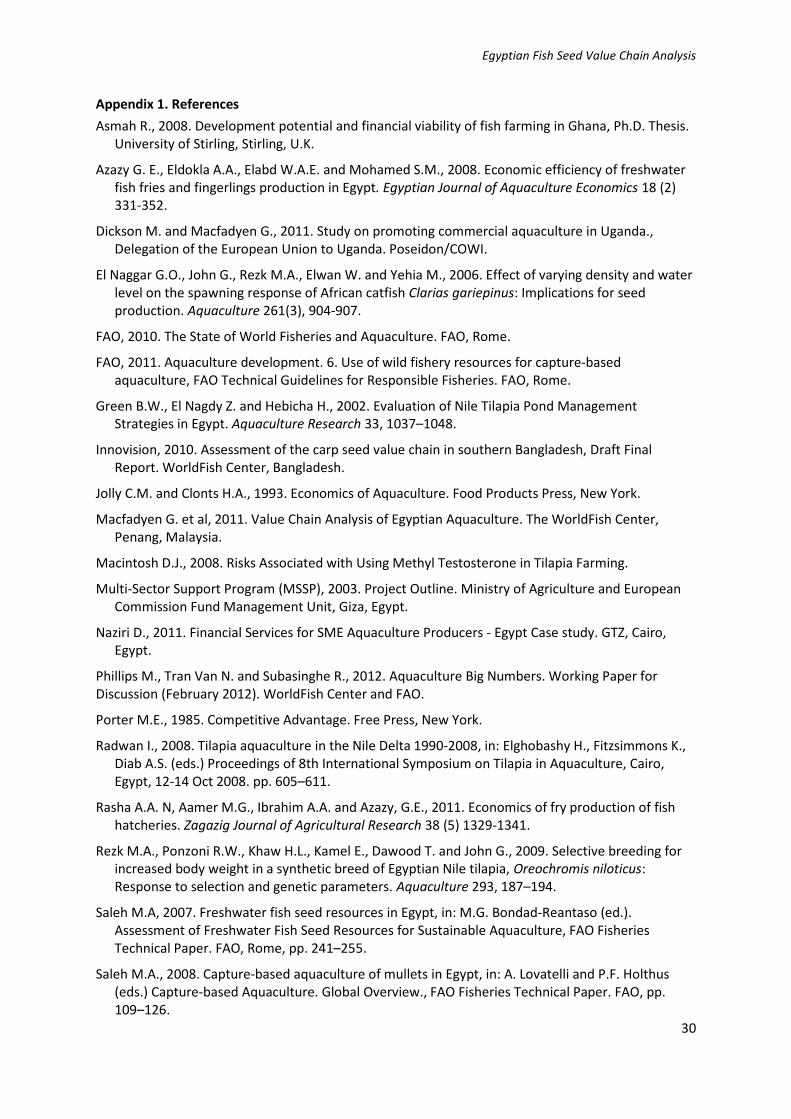
Egyptian Fish Seed Value Chain Analysis
30
Appendix 1. References
Asmah R., 2008. Development potential and financial viability of fish farming in Ghana, Ph.D. Thesis.University of Stirling, Stirling, U.K.
Azazy G. E., Eldokla A.A., Elabd W.A.E. and Mohamed S.M., 2008. Economic efficiency of freshwaterfish fries and fingerlings production in Egypt. Egyptian Journal of Aquaculture Economics 18 (2)331-352.
Dickson M. and Macfadyen G., 2011. Study on promoting commercial aquaculture in Uganda.,Delegation of the European Union to Uganda. Poseidon/COWI.
El Naggar G.O., John G., Rezk M.A., Elwan W. and Yehia M., 2006. Effect of varying density and waterlevel on the spawning response of African catfish Clarias gariepinus: Implications for seedproduction. Aquaculture 261(3), 904-907.
FAO, 2010. The State of World Fisheries and Aquaculture. FAO, Rome.
FAO, 2011. Aquaculture development. 6. Use of wild fishery resources for capture-basedaquaculture, FAO Technical Guidelines for Responsible Fisheries. FAO, Rome.
Green B.W., El Nagdy Z. and Hebicha H., 2002. Evaluation of Nile Tilapia Pond ManagementStrategies in Egypt. Aquaculture Research 33, 1037–1048.
Innovision, 2010. Assessment of the carp seed value chain in southern Bangladesh, Draft FinalReport. WorldFish Center, Bangladesh.
Jolly C.M. and Clonts H.A., 1993. Economics of Aquaculture. Food Products Press, New York.
Macfadyen G. et al, 2011. Value Chain Analysis of Egyptian Aquaculture. The WorldFish Center,Penang, Malaysia.
Macintosh D.J., 2008. Risks Associated with Using Methyl Testosterone in Tilapia Farming.
Multi-Sector Support Program (MSSP), 2003. Project Outline. Ministry of Agriculture and EuropeanCommission Fund Management Unit, Giza, Egypt.
Naziri D., 2011. Financial Services for SME Aquaculture Producers - Egypt Case study. GTZ, Cairo,Egypt.
Phillips M., Tran Van N. and Subasinghe R., 2012. Aquaculture Big Numbers. Working Paper forDiscussion (February 2012). WorldFish Center and FAO.
Porter M.E., 1985. Competitive Advantage. Free Press, New York.
Radwan I., 2008. Tilapia aquaculture in the Nile Delta 1990-2008, in: Elghobashy H., Fitzsimmons K.,Diab A.S. (eds.) Proceedings of 8th International Symposium on Tilapia in Aquaculture, Cairo,Egypt, 12-14 Oct 2008. pp. 605–611.
Rasha A.A. N, Aamer M.G., Ibrahim A.A. and Azazy, G.E., 2011. Economics of fry production of fishhatcheries. Zagazig Journal of Agricultural Research 38 (5) 1329-1341.
Rezk M.A., Ponzoni R.W., Khaw H.L., Kamel E., Dawood T. and John G., 2009. Selective breeding forincreased body weight in a synthetic breed of Egyptian Nile tilapia, Oreochromis niloticus:Response to selection and genetic parameters. Aquaculture 293, 187–194.
Saleh M.A, 2007. Freshwater fish seed resources in Egypt, in: M.G. Bondad-Reantaso (ed.).Assessment of Freshwater Fish Seed Resources for Sustainable Aquaculture, FAO FisheriesTechnical Paper. FAO, Rome, pp. 241–255.
Saleh M.A., 2008. Capture-based aquaculture of mullets in Egypt, in: A. Lovatelli and P.F. Holthus(eds.) Capture-based Aquaculture. Global Overview., FAO Fisheries Technical Paper. FAO, pp.109–126.

Egyptian Fish Seed Value Chain Analysis
31
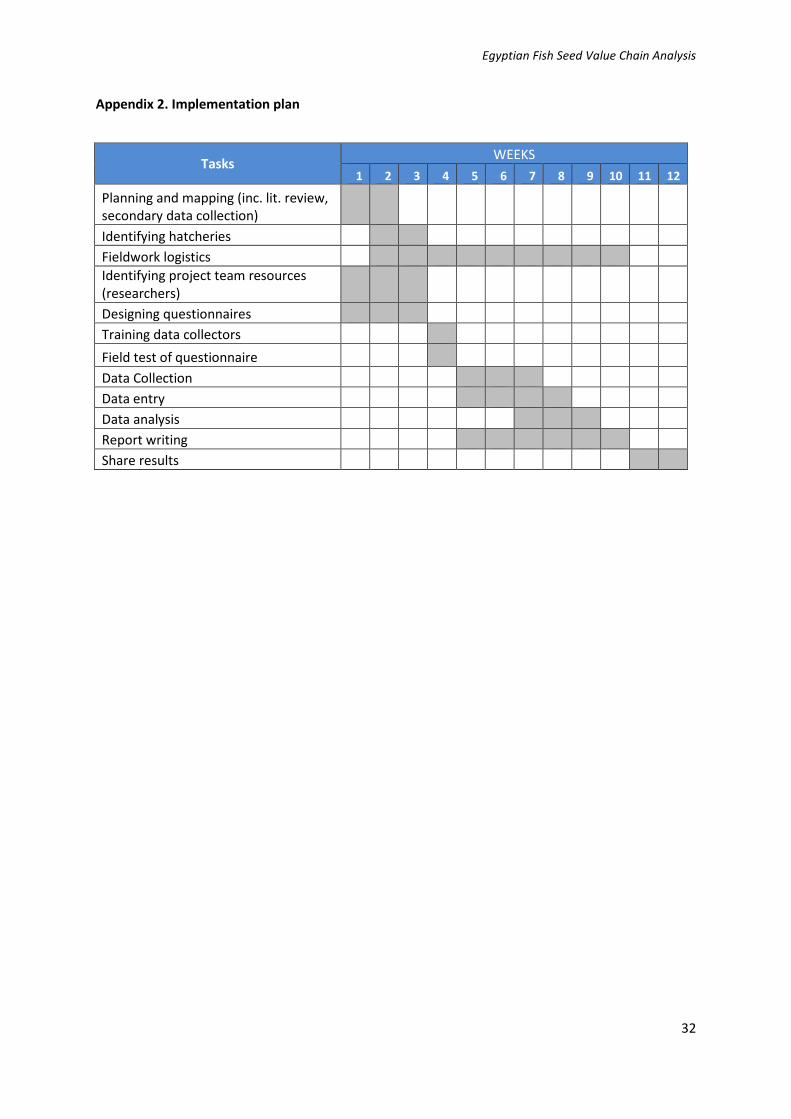
Egyptian Fish Seed Value Chain Analysis
32
Appendix 2. Implementation plan
TasksWEEKS
1 2 3 4 5 6 7 8 9 10 11 12
Planning and mapping (inc. lit. review,secondary data collection)
Identifying hatcheries
Fieldwork logistics
Identifying project team resources(researchers)
Designing questionnaires
Training data collectors
Field test of questionnaire
Data Collection
Data entry
Data analysis
Report writing
Share results

Egyptian Fish Seed Value Chain Analysis
33
Appendix 3: Study questionnaires
Hatchery Questionnaire
Questionnaire number (to be entered when entering data into spreadsheet so as to provide a crossreference)
Section 1: Background information
1. Location………………………………………………………………………………………………………Notes: this should be the location of the Hatchery, not necessarily where the interview wascompleted. State Governorate and specific location within it.
2. Date of interview………………………………………………………………………………………………………
3. Interviewer name(s)………………………………………………………………………………………………………
4. When did you start Fish Hatching?……………………………………….
5. Are you the owner of the hatchery, manager, or both?………………………………………………………..
6. Source of water used in the hatchery for spawning?(a) service ( ) (b) Ground ( )
(c) Mix ( ) (d) Other source ( ) ……………………………….
7. Utilities
(a) Main electricity supply availability Yes ……………. No …………..(b) House hold water availability Yes ……………. No …………..(c) Baved Road Yes ……………. No …………..

Egyptian Fish Seed Value Chain Analysis
34
Section 2: Mapping/describing the value chain
8. What is the current total hatchery size? Specify unit i.e. ha or Fed
Total area ……………………… Hatchery size in 2011 ……..……….
9. Do you own or rent your land?………………………………………………………..
10. Species spawned in your Hatchery?
(a) ……………. (b) ………….. (c) ……………………….
11. Which type of Spawning units do you have?
12. What proportion (%) of the number of fry are produced by different hatchery methods
Percent (%)*Hatchery method
Artificial Spawning (under control)
Semi-Artificial Spawning
Natural spawning
Specify species
Average Size(m2)NumberTypes of Hatchery units
1. Concrete tank
2. hapa
3. earthen pond
4. fibreglass Tanks
5. Aquarium
6. others (specify)…………

Egyptian Fish Seed Value Chain Analysis
35
13. Intervention to increase spawning season/numbers in your Hatchery?
(a) Heating and Green house……………. Average water tempe.
(b) Green house only …………..
(c) Ground water
(d) Air Temperature
(e) Artificial aeration : ………………………. Mention means
(d) Others
14. Do you have nursery and parent replacement ponds in your Hatchery?
(a) nursery ponds # ( ) Area ( )(b) parent ponds # ( ) Area ( )(c) other ponds # ( ) Area ( ).
15. Timing of spawning and marketing? (tick boxes)
MonthSpawning Marketing
Tilapia Catfish Carps Tilapia Catfish Carps
January
February
March
April
May
June
July
August
September
October
November
December
16. How many people do you employ of different ages? Note: i.e. family members and employees
Type of people employed Number ofemployeesover 30
Number ofemployeesunder 30
Estimated total days per year i.e.number x working days per year
Men full time
Men part-time all year
Men seasonal
Women full time
Women part-time all year
Women seasonal

Egyptian Fish Seed Value Chain Analysis
36
17. Where do the people you employ come from? Note: i.e. family members and employees
Type of people employed No. from this governorate # from other governorate (from where?)
Men full time
Men part-time
Men seasonal
Women full time
Women part-time
Women seasonal
18. What is the size of the broodstock when you spawn them? (weight in g/kg)
Species Male Female
Tilapia
Catfish
Common carp
Silver Carp
Others
19. Number of Broodstock of different species last year and Spawning information?
Species TotalNumber
Male tofemale ratio
# per unit(tank/hapa)
# Fry collected eachpatch/harvest
Collectionevery # days
# of cycleper year
Tilapia
Catfish
Common carp
Silver Carp
Others
20. Which link in the value chain is most important in setting prices for Fry?
Hatchery manager/owners
Farmers
Traders
Others (specify).........................................
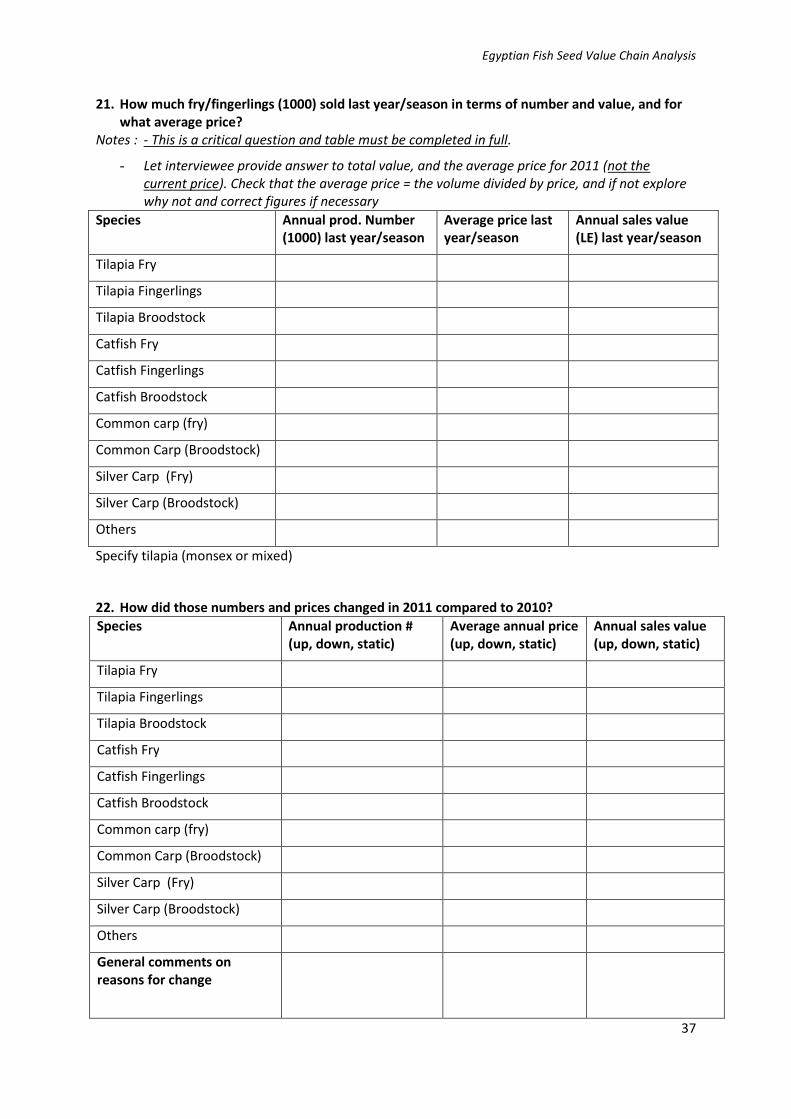
Egyptian Fish Seed Value Chain Analysis
37
21. How much fry/fingerlings (1000) sold last year/season in terms of number and value, and forwhat average price?
Notes : - This is a critical question and table must be completed in full.
- Let interviewee provide answer to total value, and the average price for 2011 (not thecurrent price). Check that the average price = the volume divided by price, and if not explorewhy not and correct figures if necessary
Species Annual prod. Number(1000) last year/season
Average price lastyear/season
Annual sales value(LE) last year/season
Tilapia Fry
Tilapia Fingerlings
Tilapia Broodstock
Catfish Fry
Catfish Fingerlings
Catfish Broodstock
Common carp (fry)
Common Carp (Broodstock)
Silver Carp (Fry)
Silver Carp (Broodstock)
Others
Specify tilapia (monsex or mixed)
22. How did those numbers and prices changed in 2011 compared to 2010?
Species Annual production #(up, down, static)
Average annual price(up, down, static)
Annual sales value(up, down, static)
Tilapia Fry
Tilapia Fingerlings
Tilapia Broodstock
Catfish Fry
Catfish Fingerlings
Catfish Broodstock
Common carp (fry)
Common Carp (Broodstock)
Silver Carp (Fry)
Silver Carp (Broodstock)
Others
General comments onreasons for change

Egyptian Fish Seed Value Chain Analysis
38
23. What proportion (%) of fry produced you are unable to sell because of
a) mortality ………………………………………………………………………………………………………
b) no market demand ………………………………………………………………………………………………………
c ) other reasons (ex. problem with buyers, or his farm)
………………………………………………………………………………………………………
24. What proportion (%) of fry loss occur in deferent stages.
a) hormonal treatment ………………………………………………………………………………………………………
b) nursery after treatment ………………………………………………………………………………………………………
c ) Fingerlings ………………………………………………………………………………………………………
give reasons for loss occur
25. What type of feed and how much feed did you use last year (broodstock and fry feed ).
Protein % Quantity. Price/tonne Farm made
/commercial
Broodstock
Fry

Egyptian Fish Seed Value Chain Analysis
39
26. Please could you tell us about your main operating costs last year? It would also be helpful toknow for each item how costs this year compare to those over the last three years. If costs notprovided per year but by unit, make sure to enter the unit e.g. per fed per year
Cost item Total cost per year (in LE) forlast year/season
How is cost changing overthe years (up, down, static)
Fish feed
Broodstock Feed
Fry Feed
Fingerlings feed
Fertilisers
Hormone used
Alcohol
Feed additives (premixes and oils)
Chemicals/drugs/disinfectant
Management and Labour (regular)
Labour (part time)
Seasonal labour
Electricity
Fuel
Water
Oxygen
Plastic bags
Sales commission to agents
Food and drinks
Transport
Other (specify)
27. After you have paid for your operating expenses, how much profit do you make on averagefrom selling hatchery production (specify if profit is total, LE per kg or tonne, or per area).
…………………………….
This question may not be necessary if we have collected good sales and costs data. If answers to theprevious questions are not thought to be reliable, the question is very important.

Egyptian Fish Seed Value Chain Analysis
40
28. What were your investment/fixed costs last year/season? If costs not provided per year but byunit, make sure to enter the unit e.g. per fed per year
Item needing to be bought Total cost lastyear/season in LE
How are costs changing over the years(up, down, static)
Financial/interest charges (bankloans only not if financed bytraders)
Licensing and other governmentcharges
Repair and maintenance costs
Land rent (if applicable)
Cost and number assets (i.e. newreplacement cost) (lifespan inbrackets) of
- Buildings (25)- Tanks (25)- Earthen ponds (10)- Green houses fram (10)- Plastic sheets (2)- Aerators (10)- Heating system/boiler- Water pumps (5)- generators (10)- Cars(10)- Other machinery (10)- Transporting Tanks (10)- Nets (2)- Hapas (2)- Wood/sticks (3)- Broodstock (3)- Egg spawning structure (5)- Spawning Jars (5)- other (specify)
-----------------
Other (pls specify)
Total
29. What are the sources of finance used in your business (tick and obtain % if possible)
- self finance……………………..
- traders or other links in the value chain………………….
- bank sources………………..
- other……………………
Egyptian Fish Seed Value Chain Analysis
41
30. What % of the value of your sales do you sell to:
- His farm ………………
- Other Farmers ……………….
- Fry traders…………………….
- Others
31. When buyer cash value of the fry collected from your hatchery:
- Cash %. ……………
- Credit % ……………
In case of credit, when you recive seed value ? …………………………..
in case of credit did price change …………………………..
32. From your experience are fish farmers keen to buy fast growing fish seeds if available?
- Yes. ( ) - No ( ) - Not sure ( )
33. Have you tried to get fast growing tilapia strain to reproduce in your hatchery?
- Yes. ( ) - No ( )
34. If fast growing tilapia strain available? How far are you ready to replace your broodstock ?
- As % ( )

Egyptian Fish Seed Value Chain Analysis
42
Section 3: Critical factors impacting on the inputs needed by the interviewee
Notes:
- Explain that this means things that they use or need to buy- Interviewer should prompt using the costs listed in question 26- Reasons may relate to policy, activities of other businesses supplying them, competition, or
anything else- Allow interviewee to think about who could solve the problem and what is the solution.
35. Are there any particular problems at the moment or risks for the future in terms of a) costs, b)availability, c) reliability, d) policy, etc affecting any of the inputs to your activities that youmentioned just now (ie. daily/operational and investment/fixed costs)? If you could pleaseexplain for each problem why you think these problems occur?
Input used Problemexperienced orexpected
Why does thisproblemoccur?
What do you think could be done to solvethe problem and/or what are you doingto try to solve the problem?
Broodstock
Hormone andchemicals
Feed
Electricity,power, fuel
Labour
Water
Landavailability
Transport
Other

Egyptian Fish Seed Value Chain Analysis
43
Section 4: Critical factors impacting on Hatchery production itself
Notes: some examples may include:
- things outside of the influence of the interviewee (licensing, regulation, policies, related costs)- Skills or efficiency of labour employed- Management practices ( feed management, disease prevention, water quality, etc)- Let interviewee suggest who could solve the problem as well as what the solution might be
36. Are there any existing problems or risks for the future in terms of a) skills, b) techniques andmethods, c) information, d) government policy, etc, of any of the activities that you carry out?If you could please explain for each problem why you think these problems occur?
Problem experienced or expected Why this problem occur? What do you think could be done tosolve the problem and/or what areyou doing to try to solve the problem?
37. Are there any particular fish disease problems at the moment or risks for the future
Disease experienced
(List types per species)
Why does thisproblem occur?
Losses thatoccur due tothat problem
What you did to solve that problemand/or what do you think could bedone to avoid this problem?

Egyptian Fish Seed Value Chain Analysis
44
Section 5: Critical factors impacting on fish seed delivery or marketing to farmers or traders
Notes: some examples may include:
- Reliability or costs of transport- Location impacting on time to transport- Lack of information on sales prices
38. Are there any particular problems at the moment or risks for the future in terms of a) methods,b) information, c) logistics/transport, d) negotiating….of delivering or selling your fry to targetbuyers? If you could please explain for each problem why you think these problems occur?
Problem experienced or expected Why does this problemoccur?
What do you think could be done tosolve the problem and/or what areyou doing to try to solve the problem?

Egyptian Fish Seed Value Chain Analysis
45
Section 6: Other questions
39. Has any sort of training or capacity development provided to hatcheries?If yes provide details (when, what and from who).
………………………………………………………………………………………………………
Did it was uesful to you.
40. What sort of training do you think would be most useful to people work inhatcheries ? Please provide details.
………………………………………………………………………………………………………
41. Is any sort of other support provided to fish farms such as yours? If yes provide details.
………………………………………………………………………………………………………
Examples may include subsidies to cost items
42. What are your suggestions to improve the hatchery business in Egypt?
(a)……………………………………………(b)………………………………………
43. Do you have any other comments you would like to make about your activities, or howyou think your livelihood and profits could be improved?
44. Interviewee name………………………………………………………………………………………………………
45. Interviewee contact phone number and/or email………………………………………………………………………………………………………

Egyptian Fish Seed Value Chain Analysis
46
FRY TRADER QUESTIONNAIRE
Questionnaire number (to be entered when entering data into spreadsheet so as to providea cross reference)
Section 1: Background information
1. Location………………………………………………………………………………………………………Notes: this should be the location of the business, not necessarily where the interview wascompleted. State Governorate and specific location within it.
2. Date of interview………………………………………………………………………………………………………
3. Are you a (tick all relevant options), what percentage and since when?
a. Fry Trader buying or collecting from hatchery and selling directly to farmers ( %)b. Rear the fry in ponds to fingerlings ( %)..c. Hatchery owner/operater ( %).d. Other (specify) ( %).when you started the main activity: ………………………………………………………………….
4. Interviewer name(s)………………………………………………………………………………………………………
Egyptian Fish Seed Value Chain Analysis
47
Section 2: General questions
5. How important do you think the following issues are to your customers on a scale of 1-5, with 5 being not important and 1 being the most important at all
Notes: Each item should be ranked 1-5 deleted column
Issue
Interviewee perception ofimportance of issue to theirbuyers/markets (1-5)
Comment on reason
Prices
Numbers of Fry
Quality of Fry
Average Size
Reliability of supply i.e.seasonality
Type of species being sold
Transportation means
Other (pls specify)
6. What is most demanded seed size by the producers?…………………………………………………………………………………………………
Section 3: Mapping/describing the value chain
7. Could you tell us a little bit about your facilities and operations in terms of assets,places of business, etc
……………………………………………………………………………………………………………………………………..
…………………………………………………………………………………………………………………………………………
8. How long do you usually have/rear fry after you have bought it until you sell it (indays)
………………………………………………………………………………………………………
Notes: differentiate if different for different species
Egyptian Fish Seed Value Chain Analysis
48
9. What is the typical size of the fish seed when you sell them? (g)Tilapia……………………………….Catfish………………………………Common carp………………………Silver carp…………………………..Mullet M. Cep………………………Mullet M. Cap………………………Others:……………………
10. When are the peak periods in terms of a) supply of products to you, and b) demand foryour sales? (tick boxes) i.e. is supply meeting demand
Month Peaksupply
Peakdemand
Average 1000sales/day
Comments on anyspecies-specific issues
January
February
March
April
May
June
July
August
September
October
November
December
11. How many people do you employ of different ages? Note: i.e. family members andemployees
Type of people employed Number ofemployeesover 30
Number ofemployeesunder 30
Estimated total days ofemployment per year perperson
Men full time
Men part-time all year
Men seasonal
Women full time
Women part-time all year
Women seasonal

Egyptian Fish Seed Value Chain Analysis
49
12. Where do the people you employ come from?Note: i.e. family members and employees
Type of people employed No. from thisgovernorate
No. from another governorate(say where from)
Men full time
Men part-time
Men seasonal
Women full time
Women part-time
Women seasonal
13. What proportion of your yearly sales revenue comes from Hatched seed or from seedcollected from wild ?
………………% from sales from hatched fish
………………% of sales from wild-caught fish
………………% from other business activities (may include importing fish seed)
14. Could you please explain how fish seed prices change over the course of the year, andwhat are the main reasons for any fluctuations?
TilapiaCatfishCommon carpSilver carpMullet (bori)Mullet (tobar)others

Egyptian Fish Seed Value Chain Analysis
50
15. How many fish seed did you sell last year/season (2011) in terms of number, averageprice and value?
Notes
- This is a critical question and table must be completed in full.- Let interviewee provide answer to total value, and the average price for 2010 (not
the current price). Check that the average price = the volume divided by price, and ifnot explore why not and correct figures if necessary
Species Annual sales #(1000`s) (2011)
Average annualprice (2011)
Annual sales value(LE) (2011)
Tilapia fry
Tilapia Fings.
Tilapia broodstock
Catfish fry
Catfish Fings.
Catfish broodstock
Common carp
Silver Carp
Mullet (M.Cep)
Mullet (M.Cap)
Others
16. How have your sales volumes, sales revenues and prices changed over recent years?
Species Annual sales volume(up, down, static)
Average annual price(up, down, static)
Annual sales value(up, down, static)
Tilapia fry
Tilapia Fings.
Tilapia broodstock
Catfish fry
Catfish Fings.
Catfish broodstock
Common carp
Silver Carp
Mullet (M.Cep)
Mullet (M.Cap)
Others
General comments onreasons for change
Egyptian Fish Seed Value Chain Analysis
51
17. Which link in the value chain is most important in setting prices for fish seed?
Traders
Hatchery owner/managers
Farmers
Others (specify).........................................
18. What proportion (%) of number of fish seed that you buy are you typically unable tosell because of
a) mortality ………………………………………………………………………………………………………..............
b) no market demand ………………………………………………………………………………………………………
c) other reasons (specify what e.g. own farm needs) …………………………………………………..…
19. What % of the total value of sales for different species do you sell.Note each row should add up to 100%
Species Proportion Nots
Tilapia Fry
Tilapia Fingerlings
Tilapia Broodstock
Catfish Fry
Catfish Fingerlings
Catfish Broodstock
Common carp (fry)
Common Carp (Broodstock)
Silver Carp (Fry)
Silver Carp (Broodstock)
Mullet (M.Cep)
Mullet (M.Cap)
Others

Egyptian Fish Seed Value Chain Analysis
52
20. Please could you tell us your main operating costs last year? It would also be helpful toknow for each item how costs this year compare to those over the last three years. Becareful to provide the unit if figures provided per # or per month or per year
Cost item Total cost per year (in LE) for lastyear/season month/yr issue
How is cost changing overthe years (up, down, static)
Tilapia Fry
Tilapia Fingerlings
Tilapia Broodstock
Catfish Fry
Catfish Fingerlings
Catfish Broodstock
Common carp (fry)
Common Carp (Broodstock)
Silver Carp (Fry)
Silver Carp (Broodstock)
Mullet (M.Cep)
Mullet (M.Cap)
Power/electricity/fuel
Labour and management
Feeds
Transport costs
Water
Oxygen
Ice
Sales commissions
Other (specify)
Total
21. After you have paid for your operating expenses, how much profit do you make onaverage from selling hatched fish (specify if profit is LE per # or per year). Note thismay be total profit per year, or a margin/profit per kg or tonne.
…………………………….
This question may not be necessary if we have collected good sales and costs data. If answersto the previous questions are not thought to be reliable, the question is very important.

Egyptian Fish Seed Value Chain Analysis
53
22. What were your investment/fixed costs last year/season? Be careful to provide theunit if figures provided per month
Item needing to be paid for Total cost lastyear/season in LE
How are costs changing over the years(up, down, static) (for unit costs, nottotals which may depend on whetherthen business is growing or not)
Financial/interest charges (e.g.on bank loans)
Licensing and othergovernment charges
Repair and maintenance coststo buildings, vehicles, etc
Land or building rents/leasingcosts (if applicable)
Depreciation on assets (i.e.purchase price divided bylifespan) of
- buildings- ponds/- tanks for transport- Car- Oxygen cylinders- Generators- heaters- Machinery- other (specify)--
---
---
Other (pls specify)
Total
Egyptian Fish Seed Value Chain Analysis
54
23. What % of the total value of your sales do you sell to:- Fish Farmers…………………….- Others……………….
24. When buyer cash value of the fry sold:
- Cash %. ……………
- Credit % ……………
In case of credit, when you recive seed value ?
25. What are the main sources of finance used in your fish farming business (tick andobtain % if possible)- self finance……………………..- Other links in the value chain………………….- formal bank sources………………..- other……………………

Egyptian Fish Seed Value Chain Analysis
Section 4: Critical factors impacting on the interviewee
Notes: Make sure to cover the following issues in discussion to see if important in terms ofavailability and price
1. policy or regulations or issues relating to organisation2. infrastructure e.g. roads and transport3. availability of fish seed , quality of seed, market demand and seed prices and4. issues related to labour (availability and skills)5. issues related to access to finance/capital
26. Are there any particular problems at the moment or risks for the future in terms of thelist of issues (or other) above? If you could please explain for each problem why youthink these problems occur?
Issues Problem experiencedor expected
Why does thisproblem occur?
Suggestion for solving the problemand/or what are you doing to try tosolve the problem?

Egyptian Fish Seed Value Chain Analysis
27. Has any sort of training or capacity development provided to fry traders? If yesprovide details (when, what and from who).how far that was uesful to you ?
………………………………………………………………………………………………………
28. If not, what sort of training do you think would be most useful, if any. Please providedetails.
………………………………………………………………………………………………………
29. Is any sort of other support provided to businesses such as yours? If yes providedetails. Examples may include subsidies to cost items. If not, is there a need for anyspecific type of support
………………………………………………………………………………………………………
30. Is any sort of organisation representing businesses like yours? If yes provide details.
Name or organisation if there is one
Are you member?
What services does it provide?
If there is no organisation, is there a need for one?
31. What are your suggestions to improve the fry trading /handling business in Egypt?
(a)……………………………………………(b)………………………………………
32. Do you have any other comments you would like to make about your activities, or howyou think your livelihood and profits could be improved?
………………………………………………………………………………………………………………
33. Interviewee name………………………………………………………………………………………………………
34. Interviewee contact phone number and/or email………………………………………………………………………………………………………