seed planning basics - british columbia
TRANSCRIPT
Seed Planning Basics
Dave Kolotelo

Seed Planning Inputs• Sowing Guidelines
• Review input variables• Seed Efficiency• Seed Pricing• Big Picture simplicity• Seed Planning Zone complications• Variables to Consider• Seedlot Selection

Sowing GuidelinesGuidelines• SPAR default method of calculating Potential seedlings
• Amount of seed• Seeds per gram • Seeds per seedling (from a table based on 2% GC results)
0.0
0.5
1.0
1.5
2.0
2.5
3.0
3.5
4.0
4.5
5.0
100-
99
98-9
7
96-9
5
94-9
3
92-9
1
90-8
9
88-8
7
86-8
5
84-8
3
82-8
1
80-7
9
78-7
7
76-7
5
74-7
3
72-7
1
70-6
9
Germination Capacity (%)
See
ds p
er S
eedl
ing
2007 non-Pli=20012007 Pli
GerminationCapacity (%)
SowingFactor
Correction(Oversow)
Factor
NurseryHandling
Factor
SeedsSupplied Per
Seedling100-99 1.2 1.25 0.20 1.7698-97 1.4 1.27 0.20 1.9196-95 1.6 1.27 0.20 2.1894-93 1.7 1.28 0.20 2.4292-91 1.9 1.27 0.20 2.5690-89 2.0 1.26 0.20 2.78
•2007 Adjustments for Pli• Improved ease to adjust grams•Encourage gram adjustments (only order what you will sow!)
Guidelines are not different for “A” and “B”class seed
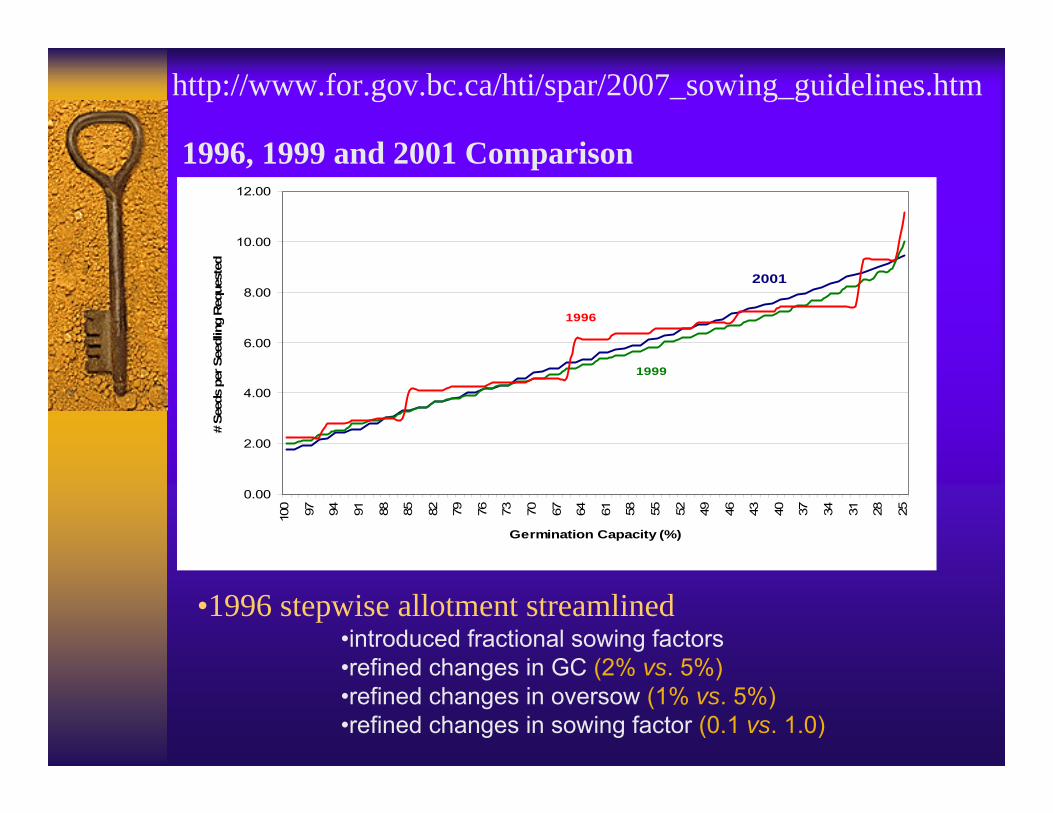
http://www.for.gov.bc.ca/hti/spar/2007_sowing_guidelines.htm
0.00
2.00
4.00
6.00
8.00
10.00
12.00
100 97 94 91 88 85 82 79 76 73 70 67 64 61 58 55 52 49 46 43 40 37 34 31 28 25
Germination Capacity (%)
# Se
eds
per S
eedl
ing
Req
uest
ed
2001
1999
1996
1996, 1999 and 2001 Comparison
•1996 stepwise allotment streamlined•introduced fractional sowing factors•refined changes in GC (2% vs. 5%)•refined changes in oversow (1% vs. 5%)•refined changes in sowing factor (0.1 vs. 1.0)

How do the Sowing Guidelines Work?• You need to know
• Weight of seed or seedlings desired• seeds per gram (SPG) of seedlot• germination capacity (GC) of seedlot
• Obtain seeds supplied per seedling from Table 1 • Insert into the following equation
• grams= # seedlings needed * Seeds/seedlingSeeds per Gram
• 50 000 seedlings GC = 96% SPG = 509• from Table 1 we determine that 2.18 seeds are supplied per
seedling.
• grams= 50 000 * 2.18 = 214.1 grams509
SPAR will round up to nearest gram = 215
GerminationCapacity (%)
SowingFactor
Correction(Oversow)
Factor
NurseryHandlingFactor
SeedsSupplied Per
Seedling100-99 1.2 1.25 0.20 1.7698-97 1.4 1.27 0.20 1.9196-95 1.6 1.27 0.20 2.1894-93 1.7 1.28 0.20 2.4292-91 1.9 1.27 0.20 2.5690-89 2.0 1.26 0.20 2.78

Seed Size• Seeds per gram is not considered
in seed pricing• Do people consider SPG
(all else equal)?
• Is there good evidence to indicate larger seeds –
• Increase sowing efficiency • Germinate ‘better’
• Seed size only explains 3.7% of the variation in germination capacity
• Seed size only explains 4.6 % of variability in germination rate
• Result in higher # recoverable seedlings ? Fdc NO - ???
• Is there any cost advantage?
156951# lots
458309Max
216213Min
338251Ave.
BAPLI

Seed Cost of an Average SRQ
0
1000
2000
3000
4000
5000
6000
7000
8000
9000
A B
$ pe
r Ave
rage
Sow
ing
Req
uest
Ave.MinMax
$2724
$$1074

Seed Efficiency
0
5
10
15
20
25
30
2001 2002 2003 2004 2005 2006 2007
Production Year
Gai
ns in
Effi
cien
cy
(Mill
ions
of S
eedl
ings
) ALLPLI
• Efficiency measured as difference between requested and calculated
• calculated is based on gram adjustments (savings)• How much seed we save (in terms of potential seedlings)
• 2007 Pli 125 M requested – 107 M calculated =18 M saved
Thank you to everyone who reduced grams, but more important reduced the amount of returned seed
We do not want We do not want to reduce to reduce seedling seedling production!production!
We want to We want to increase seed increase seed efficiency efficiency (order (order only seed you will only seed you will sow!)sow!)

Seed Pricing• Seed owned by the MFR and identified as SURPLUS
on SPAR is sold according to the following price scheduleMinistry Surplus Seed Price Schedulehttp://www.for.gov.bc.ca/TIP/publications/updates/vol2no1.pdf
• details the pricing structure for Ministry-owned tree seed• Privately owned seed can be sold at any price, some follow the
Ministry prices, some don’t • MFR price list also provides price reduction
% of seedlot Pli i.e 88/93*1482 = $1402Species average %
0
1000
2000
3000
4000
5000
6000
7000
75 80 85 90 95 100
Germination Capacity (%)
$ pe
r Kg A
B

Seed Supply +Demand – BIG Picture• Potential Trees - 5 Year average (2003-2007) 21/3/07
Sowing Request Totals (2003-2007)
0
25
50
75
100
125
150
2003 2004 2005 2006 2007
Pote
ntia
l Tr
ees
(Mill
ions
)
PLI SX FDI LW
Pli – 118 M = 18 years
Sx – 75 M = 44 years
Fdi – 16 M = 16 years
Lw – 7 M = 16 years
Overall 27 years
Pli correction ?
Demand UncertaintiesMPB further AAC increases ?Species selection choices ? Stocking levels ? Degree of reliance on natural regeneration ?Wildfires – new/increased pest problems Climate Change
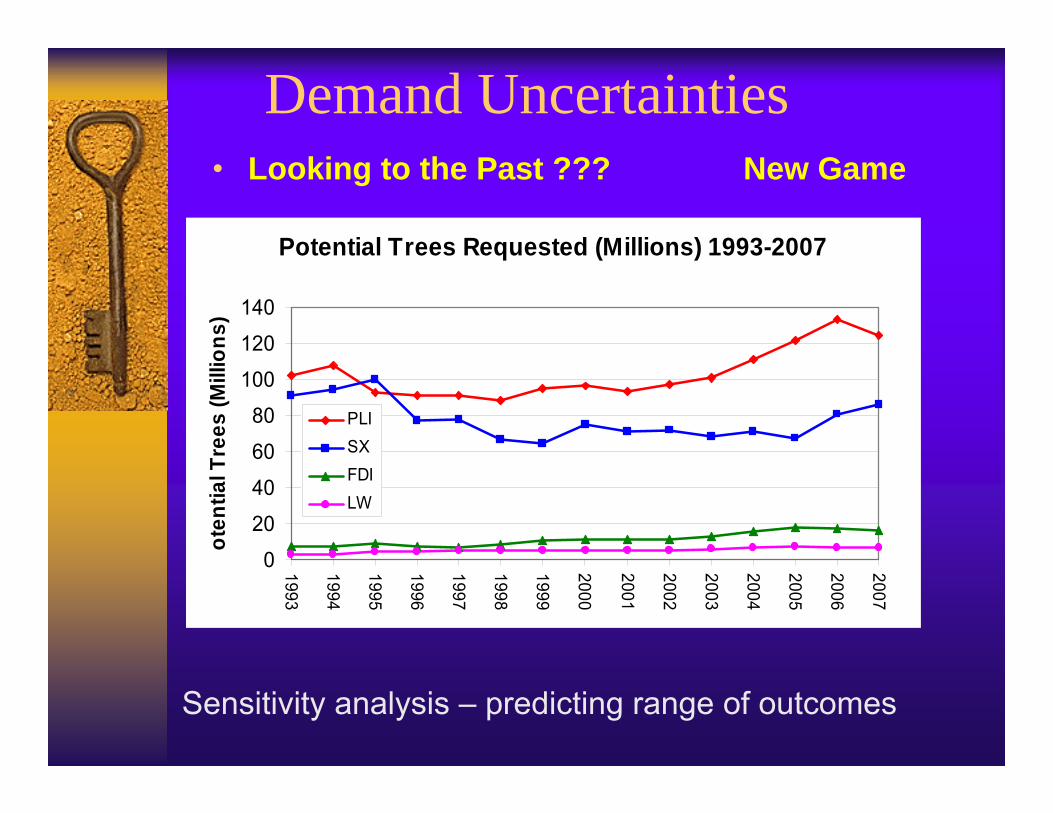
Demand Uncertainties• Looking to the Past ??? New Game
Potential Trees Requested (Millions) 1993-2007
0
20
40
60
80
100
120
140
1993
1994
1995
1996
1997
1998
1999
2000
2001
2002
2003
2004
2005
2006
2007
oten
tial T
rees
(Mill
ions
)
PLI SX FDI LW
Sensitivity analysis – predicting range of outcomes

MPB Seed Analysis - PliBase Case
Assumptions•Only B-seed = 98.5% of Pli inventory•Seedlots w/multiple SPZ divided equally (B+ & others)•2004-2006 Pli average request by SPZ used as demand •Inventory based on August 26•Inventory /demand results in estimates of years supply
Does not represent availability92% Pli seed “Reserved”
Base case is based on Inventory demand+20% and+40% increase in demand scenarios
Years supply colour coded by SPZ>20 years supply10 to 20 years supply<10 years supply
+20% +40%

B+ Seed Transfer Advantage
Nechako River example – BLK, CP, MGR,MRB, NCH, QL

SPZ Complications
Natural Stand SPZ (all species) Orchard Seed SPZ (Pli – sp. Specific)
Overlap zones
Administrative
Science-Based
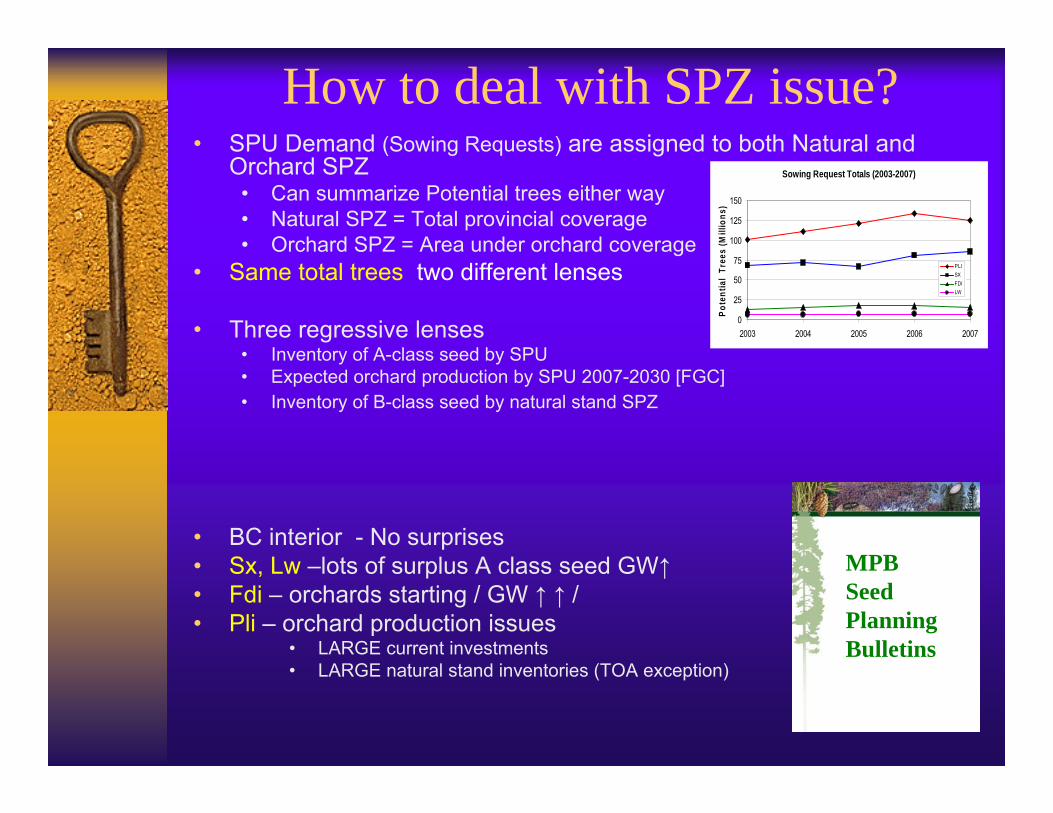
How to deal with SPZ issue?• SPU Demand (Sowing Requests) are assigned to both Natural and
Orchard SPZ• Can summarize Potential trees either way• Natural SPZ = Total provincial coverage• Orchard SPZ = Area under orchard coverage
• Same total trees two different lenses
• Three regressive lenses• Inventory of A-class seed by SPU• Expected orchard production by SPU 2007-2030 [FGC]• Inventory of B-class seed by natural stand SPZ
• BC interior - No surprises• Sx, Lw –lots of surplus A class seed GW↑• Fdi – orchards starting / GW ↑ ↑ / • Pli – orchard production issues
• LARGE current investments• LARGE natural stand inventories (TOA exception)
Sowing Request Totals (2003-2007)
0
25
50
75
100
125
150
2003 2004 2005 2006 2007
Pote
ntia
l Tr
ees
(Mill
ions
)
PLI SX FDI LW
MPB Seed Planning Bulletins

Supply – Genetic Considerations
61.0%0.0%83.6%0.2%% A SURPLUS
34%28%30%17%GW MAX
12.923.115.57.3GW wt. POT
4.5%25.8%7.6%7.6%% ZND
14.619.812.79.2GW ave.
70.010.182.212.2% A Seed Use- 07
70.93.678.410.6% A seed Use-5Yr
30.6%0.2%9.0%1.2%% A-seed inventory
300.625019Pot. > GW 5
340.629524Pot. Trees M
16910371# Seedlots
LWFDISXPLI

Pli Orchard Production and Gain
0
10
20
30
40
50
60
70
80
90
100
2005
2006
2007
2008
2009
2010
2011
2012
2013
2014
2015
2016
2017
2018
2019
2020
2021
2022
2023
2024
Mill
ions
of s
eedl
ings
0
2
4
6
8
10
12
14
16
18
Gen
etic
Wor
th (%
)
SeedlingsGW
