see action guide for states: guidance on establishing and · pdf fileestablishing and...
TRANSCRIPT

DOE/EE-1610
SEE Action Guide for States: Guidance on Establishing and Maintaining Technical Reference Manuals for Energy Efficiency Measures
Evaluation, Measurement, and Verification Working Group
June 2017
The State and Local Energy Efficiency Action Network is a state and local effort facilitated by the federal government that helps states, utilities, and other local stakeholders take energy efficiency to
scale and achieve all cost-effective energy efficiency by 2020.
Learn more at www.seeaction.energy.gov

June 2017 www.seeaction.energy.gov ii
SEE Action Guide for States: Guidance on Establishing and Maintaining Technical Reference Manuals for Energy Efficiency Measures is a product of the State and Local Energy Efficiency Action Network (SEE Action), facilitated by the U.S. Department of Energy and the U.S. Environmental Protection Agency. Content does not imply an endorsement by the individuals or organizations that are part of SEE Action working groups or reflect the views, policies, or otherwise of the federal government.
This document was final as of June 21, 2017.
This report was funded by the U.S. Department of Energy’s Office of Energy Efficiency and Renewable Energy (EERE) under Lawrence Berkeley National Laboratory Contract No. DE-AC02-05CH1131. The EERE Project Manager is Michael Li.
If this document is referenced, it should be cited as:
Steven R. Schiller, Greg Leventis, Tom Eckman, and Sean Murphy. 2017. Guidance on Establishing and Maintaining Technical Reference Manuals for Energy Efficiency Measures. Prepared by Lawrence Berkeley National Laboratory for the State and Local Energy Efficiency Action Network.
FOR MORE INFORMATION
Regarding SEE Action Guide for States: Guidance on Establishing and Maintaining Technical Reference Manuals for Energy Efficiency Measures, please contact:
Michael Li Niko Dietcsch U.S. Department of Energy U.S. Environmental Protection Agency [email protected] [email protected]
Regarding the State and Local Energy Efficiency Action Network, please contact:
Johanna Zetterberg U.S. Department of Energy

June 2017 www.seeaction.energy.gov iii
Acknowledgments
The authors wish to acknowledge the support and guidance of U.S. Department of Energy Program Manager Michael Li, which made this guide possible.
We would also like to thank the following individuals for providing valuable input through interviews or comments and input on a review draft of this report. While the authors benefited immensely from the input of these people, the content and any opinions stated are the responsibility of the authors and the listing of these individuals is not intended to imply their agreement with regards to all or any elements of this guide.
• Annette Beitel, Future Energy Enterprises
• David Brightwell and Jennifer Morris, Illinois Commerce Commission
• Gregory Brown, Brolte, LLC
• Kevin Cooney, Ryan Del Balso, and Kevin Grabner, Navigant
• Sue Hanson and Lark Lee, Tetra Tech
• Cheryl Jenkins and Zoe Dawson, Vermont Energy Investment Corporation
• Lauren Gage, Bonneville Power Administration
• Frederick M Gordon, Energy Trust of Oregon
• Hossein Haeri, The Cadmus Group
• Katherine Johnson, Johnson Consulting Group
• Jennifer Light, Northwest Power and Conservation Council
• Joe Loper, Itron
• Mike Myser, Energy Platforms
• Jake Oster, EnergySavvy
• Ralph Prahl, Prahl & Associates
• Emily Shusas and Jennifer Meissner, New York State Energy Research and Development Authority
• Rodney Sobin, National Association of State Energy Officials
• Zack Tamble and Steve Lynch, QuadROI
• Elizabeth Titus, Northeast Energy Efficiency Partnerships, Inc.
• Nikhil Vijaykar, Midwest Energy Efficiency Alliance
Mark Wilson provided editing services. The National Renewable Energy Laboratory provided formatting and graphics services.

June 2017 www.seeaction.energy.gov iv
Acronyms
AMI advanced metering infrastructure
ANSI American National Standards Institute
ASHRAE American Society of Heating, Refrigerating and Air-Conditioning Engineers
BPA Bonneville Power Administration
Btu British thermal unit
CDD cooling degree days
CalTF California Technical Forum
CIP Conservation Improvement Program
CPUC California Public Utilities Commission
DEER California Database for Energy Efficient Resources
DOE U.S. Department of Energy
DSM demand-side management
EEM energy efficiency measure
ECM energy conservation measure
EERS energy efficiency resource standard
EFLH equivalent full-load hours
EM&V evaluation, measurement, and verification
ESPC energy service performance contract
ESCO energy service company
ETO Energy Trust of Oregon
EUL effective useful life
EVO efficiency valuation organization
FEMP Federal Energy Management Program
HDD heating degree days
hp horsepower
HVAC heating, ventilating, and air conditioning
IOU investor-owned utility
IPMVP International Performance Measurement and Verification Protocol
kW kilowatt
kWh kilowatt-hour
LED light-emitting diode (efficient light bulb)
M&V measurement and verification
M&V 2.0 advanced measurement and verification data collection and analytics
NEBs non-energy benefits

June 2017 www.seeaction.energy.gov v
NEEP Northeast Energy Efficiency Partnerships
NEIs non-energy impacts
NTG net-to-gross
NWPCC Northwest Power and Conservation Council
O&M operations and maintenance
PUCT Public Utility Commission of Texas
RTF (Northwest Power and Conservation Council) Regional Technical Forum
TRM Technical Reference Manual
UES unit energy savings
UMP Uniform Methods Project

June 2017 www.seeaction.energy.gov vi
Glossary1
Baseline: Conditions, such as energy consumption and demand, which would have occurred without implementation of the subject energy efficiency measure. Baseline conditions are sometimes referred to as the counterfactual. There are several baseline options and a range of definitions for these options used in the efficiency industry.
Custom measures: Energy efficiency measures that provide efficiency solutions to unique situations that are not amendable to fully deemed savings values or for which an individualized savings determination approach is preferable. Custom measures rely on site-specific information (e.g., hours of operation, horsepower, existing equipment efficiency) that determines their impacts (e.g., energy savings). See the prescriptive measures definition for comparison with custom measures definition.
Deemed calculation: Agreed-to engineering algorithm(s) used to calculate energy and/or demand savings associated with installed efficiency measure(s). Referred to in some TRMs as stipulated algorithm(s), standard protocols, or site-specific protocols. Deemed calculations that use only deemed variables or factors define fully deemed savings values. Deemed calculations are used to determine partially deemed savings values when used with a combination of (1) deemed variables/factors and (2) site- or project-specific variables/factors.
Deemed factor: An attribute of an energy efficiency measure or its impacts used in the calculation of its energy or demand savings, lifetime, cost-effectiveness, or non-energy cost or benefit. Examples of deemed factors are measure costs and effective useful life.
Deemed savings method: The process used to derive fully deemed savings values.
Deemed savings values: Predetermined estimates of energy or peak demand savings attributable to individual energy efficiency measures implemented in a particular type of building, application, climate zone, etc. Referred to in some TRMs as unit energy savings or stipulated savings values. These are documented, numerical values for specific energy efficiency measures, often in the form of per-unit savings that define the agreed-upon performance of an individual energy efficiency measure. Applicable to specific energy efficiency actions that can be defined in individual units with specific characteristics (e.g., installation of a single, residential 12-watt LED lamp or a single, 20-horsepower premium efficiency motor); see definition of prescriptive measures. Often subject to some form of verification that the measure was deployed consistent with its application.
Deemed savings values may be either:
• Fully deemed savings values—values that are fixed regardless of any site- or project-specific conditions, variables, or factors, or
• Partially deemed savings values—values determined with algorithms, which have as inputs some combination of (1) deemed variables or factors and (2) site- or project-specific conditions, variables, and factors. Option A of the International Performance Measurement and Verification Protocol (IPMVP) results in partially deemed savings values.
Deemed variable: Values for input assumptions that determine the performance of an energy efficiency measure under different operating conditions, applications, climates, etc. Also referred to as a stipulated variable.
Demand savings: The reduction in peak electricity use in units of kW or fossil or other fuel (e.g., wood, biomass) use in units of Btu/hour from the baseline to the use associated with the energy-efficient measure installation. May also refer to an energy efficiency measure’s coincident peak savings, which is the reduction in peak electricity
1 Most of the definitions contained in this glossary are derived from the glossary contained in Schiller 2012. Other definitions have been developed specifically for this guide.

June 2017 www.seeaction.energy.gov vii
or other fuel use that occurs simultaneously with the servicing utility system’s maximum use during a specific period (i.e., single hour, multiple hours, day, etc.).
Demand-side management: Strategies used to manage energy demand, including energy efficiency, load management, fuel substitution, and load building.
Energy efficiency: The use of less energy to provide the same or an improved level of service to the energy consumer, or the use of less energy to perform the same function or produce equivalent output per unit of energy input.
Energy efficiency measure: At an energy consumer facility, an installed piece of equipment or system; a strategy intended to affect consumer energy use behaviors; or modification of equipment, systems, or operations that reduces the amount of energy that would otherwise have been used to deliver an equivalent or improved level of end-use service. Some energy efficiency measures may also be referred to as “energy conservation measures.”
Energy savings: Reduction in electricity use in units of kWh or in fossil or other fuel (e.g., wood, biomass) use in units of Btu as compared to a baseline consumption.
Evaluation, measurement, and verification: The conduct of any of a wide range of assessment studies and other activities aimed at determining the effects of an efficiency program, project, or measure and understanding or documenting program, project, or measure performance, program or program-related markets and market operations, program-induced changes in energy efficiency markets, demand or energy savings, or program cost-effectiveness.
Fully deemed savings value: See deemed savings value.
Impact Evaluation: An assessment of the program-specific, directly or indirectly induced changes (e.g., changes in energy and/or demand use) associated with an energy efficiency program.
Interactive effects: Increases or decreases in the use of electricity or other fuels that occur outside of the end uses targeted by a specific energy efficiency measure, project, or program. For example, reduction in lighting loads through an energy-efficient lighting retrofit can reduce buildings’ air conditioning requirements and increase heating requirements because less heat is generated by energy-efficient lighting systems compared with less efficient lighting systems. Measures may also interact. For example, savings from the installation of weatherization measures affect the savings associated with the installation of a higher-efficiency heat pump or furnace.
Measurement and verification: Methods used to determine energy or demand savings at a single site/project by a combination of implementation verification, direct metering, agreed to or deemed calculations and analytical methods, and/or measurements and stipulations of key independent variables and factors. Commonly defined by IPMVP Options A, B, C, and D. Does not include the use of fully deemed savings values.
Partially deemed savings value: See deemed savings value.
Peak demand savings: The demand (kW or Btu) reduction produced by an energy efficiency measure that is coincident with a utility system’s peak period, which may occur over one or more hours or days.
Prescriptive measures: Specific, defined actions that can usually be described on a per unit basis. Typically, they are one-for-one replacements for existing equipment or the equipment that would have been installed in lieu of the associated prescriptive measure program. Energy or demand savings can be described with fully deemed savings values or values with some limited variation based on deemed variables and project-specific data (i.e., partially deemed savings values). Prescriptive measures may also refer to measures for which fixed financial incentives are paid, either per unit or per unit of savings (e.g., kWh or KW). Typical prescriptive measures are appliances, motors, and lamps (e.g., LEDs).

June 2017 www.seeaction.energy.gov viii
Program administrator: An entity selected by a regulatory or other government organization to manage an energy efficiency portfolio within a specific geographic region and/or market. Typical administrators are publicly owned utilities, investor-owned utilities, nonprofit organizations, or state government agencies, as determined by legislation.
Program implementer: An entity selected and contracted with or qualified by a program administrator to provide products and services to consumers either directly or indirectly.
Stipulated savings values: See deemed savings values.
Technical Reference Manual: A resource that contains energy efficiency measure information used in program planning, implementation, tracking, and reporting and evaluation of impacts associated with the subject measures.
Unit energy savings: See deemed savings values.
Work papers: A term used in some TRMs to describe the supporting documentation associated with specific measures or groups of similar measures.

June 2017 www.seeaction.energy.gov ix
Table of Contents
Executive Summary ............................................................................................................................................. 13 Recommendations for the Development and Use of Deemed Savings Values, Deemed Calculations, and
Deemed Variables and Factors ................................................................................................................. 15 Recommendations for Technical Reference Manual Content, Structure, and Development and Maintenance
.................................................................................................................................................................. 17
1. Background: Introduction to Technical Reference Manuals ........................................................................ 19 1.1. Technical Reference Manual Objectives, Benefits, and Barriers .............................................................. 20 1.2. Technical Reference Manual Jurisdiction Coverage Options .................................................................... 22 1.3. Information Contained in Technical Reference Manuals ......................................................................... 22
2. Background: Savings Taxonomy and Interactions; Evaluation, Measurement, and Verification Methods and Prescriptive and Custom Measures ............................................................................................................. 26 2.1. The Savings Taxonomy and Savings Interactions ...................................................................................... 26 2.2. Evaluation, Measurement, and Verification of Efficiency ........................................................................ 28 2.3. Prescriptive and Custom Measures .......................................................................................................... 36 2.4. Common Practice ...................................................................................................................................... 38
3. Current Practices: Technical Reference Manual Content, Structure, and Development Options ................. 40 3.1. Examples of Existing Technical Reference Manuals ................................................................................. 40 3.2. TRM Content Options ............................................................................................................................... 46 3.3. TRM Structure Options ............................................................................................................................. 47 3.4. TRM Format Options ................................................................................................................................ 50 3.5. TRM Development and Updating Process Options .................................................................................. 52
4. Recommendations: Suggested Practices for the Deemed Savings Method and Developing and Maintaining Technical Reference Manuals and Recommendations for Further Research ............................................... 62 4.1. Deemed Savings Methods Recommendations ......................................................................................... 62 4.2. Recommendations for Technical Reference Manuals Content, Structure, Development, and
Maintenance ............................................................................................................................................. 66 4.3. Concluding Comments and Recommendations for Further Research...................................................... 75
Appendix 1. TRMs in the United States ................................................................................................................ 80
Appendix 2. Background: Common Deemed Values, Variables, and Factors Contained in Technical Reference Manuals ...................................................................................................................................................... 85
Appendix 3. Industry Standard Energy Efficiency Evaluation, Measurement, and Verification Resources and Protocols .................................................................................................................................................... 91 A3.1. Energy Efficiency Program Evaluation Resources ..................................................................................... 91
A3.1.1. SEE Action Energy Efficiency Program Impact Evaluation Guide ................................................. 91 A3.1.2. SEE Action EM&V Portal ............................................................................................................... 91
A3.2. Industry-Standard M&V Protocols and Guidelines ................................................................................... 91 A3.2.1. IPMVP: International Performance Measurement and Verification Protocol ............................. 91 A3.2.2. Uniform Methods Project ............................................................................................................ 91 A3.2.3. FEMP M&V Guidelines: Measurement and Verification for Performance-Based Contracts,
Version 4.0 ................................................................................................................................. 91 A3.2.4. ASHRAE Guideline 14-2014: Measurement of Energy and Demand Savings. American Society of
Heating, Refrigerating and Air-Conditioning Engineers ............................................................. 92

June 2017 www.seeaction.energy.gov x
List of Tables
Table 2.1. Common Evaluation, Measurement, and Verification Methods for Selecting Energy Efficiency and Demand Response Categories and Project Types ....................................................................................................... 36
Table 3.1. Simplified TRM Outline ............................................................................................................................... 48
Table 3.2. Example Threshold TRM Technical Issues ................................................................................................... 54
Table 3.3. Texas Technical Reference Manual Revision Process Summary Table ....................................................... 61
Table A1. United States Technical Reference Manuals—Summary Information ........................................................ 80
List of Figures
Figure 1.1. Example Deemed Calculation (Source: Dimetrosky et al. 2015) ............................................................... 24
Figure 2.1. Energy efficiency action taxonomy with examples of included programs, projects, and measures ......... 27
Figure 2.2. Evaluation, measurement, and verification methods, inputs, and resulting values covered by most technical reference manuals ....................................................................................................................................... 32
Figure 2.3. The Efficiency Measure Spectrum, Prescriptive and Custom Measures, and the Use of Technical Reference Manual Information ................................................................................................................................... 39
Figure 3.1. Publicly accessible Technical Reference Manuals in the United States (Source: Authors’ research and Tamble et al. 2016. Both Delaware and Oregon have state TRMs and are also covered in regional TRMs.) ............. 41
Figure 3.2. End-use classifications contained within six Midwest TRMs, by customer sector (Source: MEEA 2017) . 42
Figure 3.3. Kentucky Technical Reference Manual decision tree (Source: MEEA 2016) ............................................. 53
Figure 3.4. Example process flow chart for updating net-to-gross ratios (Note: NTG is the abbreviation for “net-to-gross”) .......................................................................................................................................................................... 58
Figure 3.5. Example process flow chart for updating or adding measure-specific information .................................. 60

June 2017 www.seeaction.energy.gov 11
About This Document
This guide addresses the development and maintenance of reference documents, known as Technical Reference Manuals (TRMs), that provide information primarily used for estimating the energy and demand savings of end-use energy efficiency measures associated with utility customer-funded programs. TRMs may also include information on non-energy impacts and factors that are used to calculate measure cost-effectiveness, among other uses. TRMs are used extensively in the planning, implementation, and evaluation of utility customer-funded efficiency programs.
This guide describes existing TRMs in the United States and provides recommendations for best practices based on Lawrence Berkeley National Laboratory’s (Berkeley Lab’s) review of TRMs and input from TRM developers and users throughout the country. The information and recommendations in this guide can be used to help improve the quality of existing TRMs as they are updated, and new TRMs as they are developed. High quality TRMs with consistent savings values and methods can increase confidence in the quantification of impacts associated with efficiency actions and support increased implementation of cost-effective efficiency actions. Therefore, the goal of this guide is to support the development, maintenance, and use of accurate and reliable TRMs.
The intended audience for this guide is state utility regulators, administrators of energy efficiency programs (including publicly owned and investor-owned utilities and government and nongovernmental organizations), efficiency program implementers, evaluation consultants, and other stakeholders, such as industry representatives and consumer advocates. All of these groups are interested in using reliable savings values for evaluating efficiency measures and programs and providing sound guidance on the uses, development, maintenance, and updating of TRMs.
Users of this guide with related energy efficiency program or evaluation experience can go directly to summaries of how existing TRMs address various topics and the specific recommendations. The guide is also organized so that those without such experience can benefit from the chapters and the appendices on basics of TRMs; evaluation, measurement, and verification (EM&V); and the types of efficiency measures addressed by TRMs.
This table on page 12 offers a summary of the contents of this Technical Reference Manual (TRM) guide and suggestions for which chapters and appendices that different audiences will find of interest.

June 2017 www.seeaction.energy.gov 12
Chapter/Appendix Intended Audience Contents
Summary Executive Summary Readers interested in a brief introduction to TRMs and this guide’s recommendations for deemed savings and TRM development and updating
Overview of guide content and recommendations
Background: TRMs
Chapter 1: Introduction to TRMs
Readers who want an overview of TRMs, their role in energy efficiency programs, and their coverage and content
TRM objectives and benefits, jurisdiction coverage options, and contents
Background:
Efficiency and Evaluation, Measurement, and Verification (EM&V)
Chapter 2: Savings Taxonomy and Interactions; EM&V Methods; Prescriptive and Custom Measures
Readers requiring background on EM&V practices and different categories of efficiency measures to help understand how deemed savings, measurement and verification methods, and TRM data are used for quantifying the impacts of efficiency measures
Relationship between efficiency measures, projects, and programs; EM&V basics and key definitions of deemed savings related terms; and the differences between prescriptive and custom efficiency measures
Current Practices
Chapter 3: TRM Content, Structure, and Development Options
Readers who are interested in current TRM practices and background on these practices as an introduction to the next chapter’s recommendations
Descriptions of the content, structure, and development (and updating) processes used in existing TRMs
Recommended Practices
Chapter 4: Suggested Practices for the Deemed Savings Method and Developing and Maintaining TRMs and Recommendations for Further Research
Readers who will be developing new TRMs or are considering improving or updating their existing TRMs
Nine recommendations associated with the deemed savings method and ten recommendations with discussion of the development and updating of TRMs. Also includes topics areas that represent opportunities for improvements through further research.
Resources References Readers interested in more sources of TRM information as cited in the guide
Citations for references listed in the guide
Resources Appendix 1: TRMs in the United States
Readers who are interested in accessing and understanding basic characteristics of existing TRMs
Summary information on the existing TRMs in the United States that can be publicly accessed
Resources Appendix 2: Common Deemed Values, Variables, and Factors Contained in TRMs
Readers interested in definitions and descriptions of the specific types of information contained in TRMs (such as energy and demand savings and measure costs)
Definitions, descriptions, and key issues associated with the most common data types found in TRMs
Resources Appendix 3: Industry Standard Energy Efficiency EM&V Resources and Protocols
Readers interested in resources covering energy efficiency EM&V
Lists of industry standards resources for project- and program-level EM&V

June 2017 www.seeaction.energy.gov 13
Executive Summary
Across the United States, energy efficiency (efficiency) programs rely on Technical Reference Manuals (TRMs) as sources for stipulated savings, calculations, and variables and factors for planning efficiency programs and assessing the impacts of well-defined energy efficiency measures. These measures are typically referred to as prescriptive or deemed measures. When used in the context of evaluation, measurement, and verification (EM&V) of efficiency measures, TRMs are associated with two EM&V methods.
1. Deemed Savings Methods: Per-unit impacts (e.g., unit energy savings) are predetermined for specific efficiency measures subject to some form of implementation verification. These methods result in deemed savings values that are either:
o Fully deemed—requiring no field- or site-based information; or
o Partially deemed—requiring some field- or site-based information, such as data relating to climate, operating hours, or baseline conditions.
2. Measurement and Verification (M&V) method: Energy or demand savings are determined through a combination of agreed-to calculations and analytical methods (deemed calculations), project site measurements, stipulations of other factors, and implementation verification.
Technical reference manuals also play an important part in efficiency program planning and implementation by providing a common and consistent source of information used for the calculation of per-measure energy savings and other impacts (e.g., demand savings and avoided air emissions) and other factors (such as net-to-gross ratios, measure costs, and cost-effectiveness). TRMs not only facilitate savings calculations, but they also support standardized reporting processes, promote greater transparency and predictability in savings claimed by efficiency program administrators, and can expedite the EM&V process and reporting.
WHAT IS A TRM?
Technical Reference Manual (TRM): A technical resource (in the form of a document, spreadsheet, searchable desktop, and/or online database) that contains energy efficiency measure information used in program planning, implementation, tracking, and reporting and evaluation. This information can include deemed energy and demand savings values (aka, unit energy savings or stipulated savings vales) for measures, engineering algorithms to calculate energy and demand savings, and variables and factors, such as measure life information and hourly load shapes used, for calculating impacts. TRMs also include documentation to support the values, calculations, and assumptions for energy efficiency measures, as well as applicability conditions for how the information is to be used.
DEEMED SAVINGS TERMINOLOGY
This guide differentiates between the deemed savings method, the measurement and verification (M&V) method, and fully and partially deemed savings values. Fully deemed savings values are the “output” of the deemed savings method. Partially deemed savings values are one possible “output” of the M&V method.
• Fully deemed savings values are fixed regardless of any site- or project-specific conditions, variables, or factors.
• Partially deemed savings values are values determined with algorithms that have as inputs some combination of (1) deemed variables or factors and (2) site- or project-specific conditions, variables, and factors. Option A of the International Performance Measurement and Verification Protocol (IPMVP) results in partially deemed savings values.
The differentiation between the deemed savings and M&V methods is made to emphasize that M&V requires some degree of site- or project-specific measurement, while the deemed savings method, and the resulting fully deemed savings values, do not. However, both M&V and deemed savings methods involve some level of measure implementation verification.

June 2017 www.seeaction.energy.gov 14
Reliable, documented, and accepted TRMs benefit program administrators, utility regulators, implementation contractors (including those implementing projects under energy service performance contracts ESPCs) and other stakeholders in three ways. First, TRMs reduce the uncertainty in savings claims and establishing regulatory compliance, particularly, but not exclusively, for jurisdictions with energy efficiency resource standards (EERS). Second, TRMs can lower efficiency resource acquisition costs by streamlining program planning and implementation.2 Third, the development and use of accepted TRMs reduces the need for and cost of extensive or ongoing measurement of the performance of established efficiency measures. It should be noted, however, that to update or add new measure information in TRMs, the need for ongoing research and EM&V is still an essential component of TRM development and maintenance.
Program administrators and state regulatory commissions are developing and adopting TRMs at an increasing rate. As of the date of this publication, 28 state or regional TRMs have been adopted. This compares to just 17 such state and regional TRMs in 20123 and perhaps only half a dozen at the beginning of the twenty-first century. In addition to these state or regional TRMs, some utilities developed and maintain their own TRMs.
Often subject to acceptance, if not approval, by utility regulators, TRMs are usually associated with utility customer-funded, energy efficiency programs and typically cover both natural gas and electricity efficiency measures in primarily the commercial and residential markets.4 While TRMs are often utility/ratepayer-program-focused, they can be also be adapted and adopted more broadly to support state and community level programs such as energy savings performance contracting and to advance other energy efficiency policy objectives, including emissions abatement.
The development process, number of measures covered, values included, format, and level of documentation and transparency vary across the TRMs. The reliability of the values found in TRMs also varies. In some cases, identical measures have been assigned a wide range of savings values in different TRMs, which are not obviously justifiable, even when differences in climate and application are considered. Hence, reliability of the values found in TRMs could be enhanced through greater transparency and consistency in their development, maintenance, and documentation processes.
Given the current wide application of both fully deemed and partially deemed saving values, as well as deemed calculations that are documented in TRMs and their potential for reducing the costs and uncertainty associated with documenting energy efficiency program impacts, this guide provides a basic resource for the development, maintenance, and use of utility, program administrator, state, and regional TRMs. The guide is designed to be of value to jurisdictions with or without TRMs; it is intended to help both types of jurisdictions take full advantage of industry best practices. Particularly with regard to improving the reliability of deemed savings values, deemed
2 Although TRMs can reduce some costs, they do rely on rigorous EM&V that supports the information contained in TRMs. Thus, TRMs in of themselves do not represent reliable savings estimates if the supporting, and sometimes expensive, efficiency measure and evaluation research is not conducted on an ongoing basis. 3 Jayaweera et al. 2012. 4 Although most TRMs focus primarily on residential and commercial sector measures, some TRMs also address the agricultural and industrial sectors.
TRM CONTENTS
Deemed Savings Values: These are also known as stipulated savings values and unit energy savings. These are documented numerical values that define the agreed-upon performance of a specific efficiency measure in a defined application. Such values may be fully deemed or partially deemed.
Deemed Calculations: These are agreed-to (stipulated) engineering algorithm(s) used to calculate the energy and/or demand savings associated with an efficiency measure(s).
Deemed Variables and Factors: These are stipulated values used to support the determination of deemed savings values or used in deemed calculations.

June 2017 www.seeaction.energy.gov 15
calculations, and related deemed variables and factors included in TRMs, an objective of this guide is to improve the confidence that efficiency policy makers, regulators, stakeholders, administrators, and implementers have in the reported impacts of efficiency actions.
Given this objective, this guide covers the following topics.
• Introduction to TRM basics, their objectives, benefits, content, and options for jurisdiction or geographic coverage (e.g., statewide versus regional TRMs)
• Background on efficiency measures and EM&V, with a focus on the deemed savings and M&V methods that use the information found in TRMs
• TRM content, structure, format, and development options
• Recommendations for applying the deemed savings method and developing, using, and updating TRMs
• Reference information on existing TRMs, efficiency metrics and factors found in TRMs, and resources for further information on TRMs and EM&V in general.
To support best practices and improvements in the reliability and usefulness of updated and new TRMs, and thus greater levels of consistency and uniformity in savings methods and values across jurisdictions, this guide provides two sets of recommendations: deemed savings method recommendations and TRM recommendations. These recommendations build on a review of the content, structure, development, use, and maintenance practices associated with existing TRMs and a survey of both users and developers of TRMs. The recommendations are summarized below. There is a necessary overlap between the two sets of recommendations because TRM content, structure, development, and maintenance is closely tied to application of the deemed savings method.
Recommendations for the Development and Use of Deemed Savings Values, Deemed Calculations, and Deemed Variables and Factors5
1. Adopt and adhere to clear and transparent guidelines that emphasize using industry standard assumptions and calculation methods, current information, an independent peer-reviewed process, and thorough documentation in publicly accessible formats.
5 New measures for pilot programs or measures with minimal savings may not need the level of savings reliability associated with other measures and thus can perhaps be treated differently in their development and use. Thus, the recommendations in this section should not be used to exclude the deemed savings method for measures that have potential future value or which in themselves do not generate a lot of savings, but support overall program objectives.
CURRENT AND FUTURE USE OF THE DEEMED SAVINGS METHOD
TRMs are important because fully and partially deemed savings values, deemed calculations, and deemed variables and factors are used to assess the impact of a significant portion of efficiency measures. While estimates vary, the deemed savings values and deemed calculations in TRMs appear to be used for some 50 to 90 percent of the measures and savings implemented in their respective efficiency programs.
However, two factors may indicate a leveling off or decrease in the use of the deemed savings method. First, this method is less applicable for a growing number of efficiency measures, such as controls and behavior-based measures, that are both more sophisticated than conventional equipment retrofits and produce more variable outcomes. Second, other methods for assessing efficiency impacts, such as use of control groups and what is sometimes known as measurement and verification (M&V) 2.0 are becoming more reliable and cost-effective.

June 2017 www.seeaction.energy.gov 16
2. Deemed savings values should be applied to:
o Measures that are well-understood with documented experience that indicates that there is a strong central tendency in the distribution of savings across installations
o Measures for which savings or calculations can be developed from reliable data sources and analytical methods
o Measures that fit within well-defined boundary conditions that clearly describe the applications for which the measures’ deemed savings value(s) do, or do not, apply
o Conditions under which the measure’s application can be verified by the nature of the program design (i.e., direct installation delivery) or through post-installation inspection
o Measures with impacts that are not highly dependent upon the application of consistent quality control in their installation
o Measures with impacts that are not highly dependent upon customer behavior.
3. Deemed calculations with input variables and factors (e.g., partially deemed savings values) should be applied to:
o Measures for which these variables and factors are known to vary widely by project site
o Measures for which inputs to site-specific calculations are easily ascertained and verifiable
o Measures for which “reasonableness” ranges for site-specific input variables and factors can be built into the calculation process.
4. Deemed savings values and deemed calculations should be based on input assumptions that are realistic and not necessarily conservative or optimistic.
5. Deemed savings values, variables, factors and calculations should account for significant interactions with other measures and end uses at the site or facility in which they are installed.
6. Conditions and applications for which each deemed savings value or calculation can be applied should be documented:
o The baseline(s) for which the savings value is applicable (with the baseline defined).
o Measure descriptions and documentation for the application of deemed savings values should include those characteristics (e.g., installation specifications, delivery mechanism, location, capacity, etc.) that determine the measure’s savings.
o Descriptions for the application of deemed savings values should include recommended or required installation verification and other quality-assurance procedures to ensure actual and proper measure implementation and to improve the reliability of the assumed deemed savings values.
o Justification should be provided if common conditions (e.g., different climate conditions) used to determine applicability are not addressed (e.g., the measure is not weather sensitive).
7. Deemed savings values, calculations, factors, and variables should be based on reliable, traceable, publicly available, and documented sources of information.

June 2017 www.seeaction.energy.gov 17
8. When using computer simulation models to develop deemed savings values:
o Use experienced practitioners with expertise in building science and simulation
o Document assumptions and inputs
o Use documented and vetted industry-standard simulation models
o Calibrate models to applicable metered or monitored data.
9. Verification activities, for at least a sample of installed efficiency measures, should confirm that the conditions and applications (e.g., installation specifications) defined for use of the deemed savings values are consistent with the actual conditions under which the measures are implemented in order to confirm proper use of the deemed savings values.
Recommendations for Technical Reference Manual Content, Structure, and Development and Maintenance
1. The roles, responsibilities, and processes for developing, approving, and maintaining a TRM should be clearly defined. While not a consensus opinion, many in the industry believe that state utility commissions should participate in or oversee the development and maintenance of TRMs used for investor-owned utility (IOU) customer-funded programs.
2. It is usually best to develop TRMs with a public, collaborative process that includes program administrators, implementers, evaluators, and independent technical experts, as well as advocates and active regulatory staff participation for TRMs involving IOU customer-funded programs. Some practices that support successful TRM development collaborations are members having sufficient technical expertise and time, having defined roles and responsibilities, and agreeing to adhere to a conflict of interest policy.
3. Regulatory agencies should approve TRMs that will be used by IOUs.
4. Each TRM should have its own guidance document, preferably agreed to by those participating in the TRM development and indicating decisions on topics such as public accessibility, guidance on balancing rigor of TRM content versus effort (and cost) to develop the content, quality control mechanisms, and documentation sufficient for replication of indicated values, baseline definitions, the process for TRM revisions, the TRM approvals process, and TRM format.
5. TRMs are most useful when they are (1) well documented with transparent indications of calculations and assumptions (such as data used to derive values) sufficient for others to replicate the values and calculations found in the TRMs, (2) prepared using credible, standardized calculations and data-based assumptions, and (3) designed for ease of operation/compatibility with program tracking and reporting systems.
6. TRMs should strive to use data and tools that are “best available” (i.e., accurate, relevant, and current). Thus, deemed values, factors, variables, and calculations should be prepared using credible, standardized calculations, software tools, and assumptions that are based on and/or informed by field measurements, impact evaluations, customer or market surveys, billing analysis, etc.
7. To avoid the potential for undue bias because of financial or other considerations, provisions should be made to have TRM content reviewed by an independent, unbiased body that abides by a transparent conflict of interest policy. In addition, consultants and others that prepare and/or update TRM content should be independent.

June 2017 www.seeaction.energy.gov 18
8. TRMs should have regular, scheduled processes in place for periodically reviewing TRM content. This includes updating TRMs for new measures that are determined to be priorities and making changes to existing measures data or calculations when significant changes are justified, typically because of changing baselines or availability of more current, applicable evaluation studies for updating values. As implied in recommendation number seven, the updates should also use data and tools that are “best available” (i.e., accurate, relevant, and current) and this indicates that TRM updates should be based on M&V studies conducted on a regular basis.
9. Searchable, formatted TRMs are preferred, with easily and publicly accessible documentation that should include measure characterization with narrative measure descriptions, baseline and measure case technical specifications, energy and demand savings algorithms, clearly stated assumptions, and any pertinent program implementation details (i.e., qualification requirements and exclusions).
10. Regional TRMs can be excellent opportunities for states that do not have their own TRMs or that are contemplating expansions of the coverage of their TRMs.

June 2017 www.seeaction.energy.gov 19
1. Background: Introduction to Technical Reference Manuals
The terms “Technical Reference Manual” and “TRM” are terms of art in the energy efficiency industry for a repository of information that documents how energy efficiency measure (EEMs) impacts are calculated and the sources of information used in these calculations. Typically available as a document, spreadsheet, or an electronic database, TRMs serve as a common reference, providing transparency and consistency to interested stakeholders.
TRMs are also living documents in that they should be updated as impact analyses and procedures evolve and to account for changes in codes and standards, the introduction of new EEMs, changes in available product efficiencies of existing efficiency measures, and new data collected about the performance of efficiency measures. Appendix 1 of this guide lists and summarizes the 28 TRMs that are publicly accessible in the United States.
TRMs are mostly associated with utility customer-funded efficiency programs and typically cover both natural gas and electricity efficiency measures in all market sectors (residential, commercial, etc.). TRMs also can include information on other efficiency measures, such as those associated with energy conservation or demand response, water conservation, and utility customer-sited storage and distributed generation projects, including renewable resources. In this guide, these measures are all collectively referred to as efficiency actions for simplicity of presentation and because efficiency measures are the primary, if not the exclusive, focus of existing TRMs.
TRMs tend to be initiated by state utility regulatory commissions and, in some cases, are formally approved by those commissions. Most TRMs are prepared by consulting firms with expertise in efficiency measures and the assessment of their performance.
6 Beitel et al. 2016. 7 California Public Utilities Commission 2017.
BRIEF HISTORY OF TECHNICAL REFERENCE MANUALS
Technical Reference Manuals (TRMs) originate in the guides, spreadsheets, and individual per-measure analyses prepared by efficiency project implementers and utilities acting as administrators of efficiency programs. Perhaps the first formal effort to organize data into a comprehensive and consistent format was in 1990, when the California Energy Commission convened a broad coalition of stakeholders, known as the California Conservation Inventory Group, and tasked that initial collaborative with identifying the energy efficiency data and methodologies to be developed and tracked in California.6 This led to the publication of the first California Database for Energy Efficient Resources (DEER)7 in the early 1990s. Other databases were subsequently developed by utilities and consultants, with the first document identified as a TRM developed by the Vermont Energy Investment Corporation in 2000 for Vermont programs. Since then, more than two dozen TRMs have been developed for different regions, states, and utility service territories. Existing TRMs are covered in more depth in Chapter 3.
TECHNICAL REFERENCE MANUALS: NOT JUST FOR UTILITY PROGRAMS
Although mostly associated with utility customer–funded efficiency programs, TRMs can also be adopted, and adapted, for use in other types of efficiency programs, such as for energy service performance contracts between energy service performance companies and their private-sector or public-sector clients.

June 2017 www.seeaction.energy.gov 20
Beyond these TRM consultants, the stakeholders that are usually involved in the development and/or use of TRMs are:
• Utilities and other efficiency program administrators for efficiency program planning, cost-effectiveness screening, tracking, and reporting of savings and other impacts
• State utility regulators for evaluating administrator performance relative to plans and statutory goals and facilitating planning and portfolio review
• Evaluation and energy-efficiency potential study consultants who assist regulators, stakeholders, and utilities
• Technical experts with specific expertise or knowledge of technologies or research relevant to measures under consideration
• Efficiency program and project implementers that want to provide resources to utility customer-funded efficiency programs, regional wholesale markets, or carbon and other pollutant markets for valuing efficiency resources and reporting efficiency measure savings and other impacts
• State energy offices that have energy efficiency programs or responsibilities for state comprehensive energy planning within their purview
• Manufacturers of efficiency products and/or their trade organizations
• Advocacy groups and other intervenor in the efficiency regulatory process to ensure that reliable and reasonable efficiency savings data are used in the programs.
1.1. Technical Reference Manual Objectives, Benefits, and Barriers
TRMs play an important part in streamlining the planning and reporting functions of program administrators, and in establishing regulatory compliance, particularly, but not exclusively, in jurisdictions where energy efficiency EERS are in effect.8 TRMs also facilitate savings calculations, standardize reporting processes, and promote greater transparency and predictability in savings claimed by efficiency program administrators.9 In effect, TRMs are a mechanism for encapsulating what has been cumulatively learned from assessing efficiency activities.
8 Jayaweera et al. 2012. 9 Cleff et al. 2011.
TECHNICAL REFERENCE MANUALS: NOT JUST FOR EVALUATION
TRMs are mostly thought of as tools for supporting the ex-post evaluation of efficiency measure impacts. However, TRMs can be just as important to efficiency program planners and project implementers. This is because the information, particularly the fully or partially deemed savings values, can be used to:
• Project savings in potential studies and other planning efforts used to set efficiency goals for portfolios or programs
• Estimate savings for individual projects in the feasibility assessment stages.
Thus, TRMs can be critical to the entire program planning, implementation, and evaluation cycle—providing a common basis for agreement among stakeholders on savings estimating methods as well as the savings.

June 2017 www.seeaction.energy.gov 21
The following is a summary of TRM goals and benefits developed from a review of published TRMs with paraphrasing from several sources:10, 11, 12
• Providing a central reference document for regulatory agencies and other stakeholders to consistently, reliably, and transparently calculate electric and natural gas savings from the implementation of EEMs. This includes supporting:
o Access to best available, applicable information
o The regulatory process by streamlining oversight and evaluation methods and reducing costs, all of which can lead to greater energy savings
o Facilitation of ongoing stakeholder collaboration and coordinated program planning across all program administrators in a jurisdiction, which can lead to greater energy savings and more effective customer engagement
o Less uncertainty for utilities and program administrators regarding the cost-effectiveness and savings they claim or that such claims will be challenged by regulators
o Program planning and portfolio assessments, including assessments used for the purposes of establishing future EERS
o Consistency for the savings values and calculations so that all the program administrators in the jurisdiction covered by a TRM claim the same savings for the same measures implemented under the same conditions.
• Leveraging existing knowledge across multiple utility service territories, enabling multiple stakeholders to work collectively with shared resources, rather than having each program administrator (e.g., utility) create and maintain their own TRM or rely on information from other jurisdictions. This supports:
o Potentially reducing the costs of implementing and evaluating energy efficiency programs13
o Allowing measure technologies, analyses techniques, and baseline and performance assumptions to be updated in a timely manner and consistent with program reporting cycles, or on a regular cycle per agreed upon policies or regulatory orders, and transferred directly into program planning, implementation, and evaluation documents or online databases
o A basis for consistent baseline (i.e., the counterfactual) definitions14
o Development of advanced measurement and verification (M&V), including M&V 2.0 (see Chapter 2 for a description of M&V 2.0).
There are also, of course, barriers to the development of TRMs—and TRMs do not eliminate the need for the fundamental research and analyses of the efficiency measures and their impacts, which form the basis for the TRM information. The TRM barriers tend to be the same as those found when evaluating efficiency programs in general—time and funding requirements and, in some jurisdictions, absence of a driving policy (such as an EERS that requires measurement for compliance with policy goals. For TRMs, the most specific barrier may be limited
10 Missouri Department of Economic Development 2016. 11 Del Balso and Grabner 2013. 12 Beitel et al. 2016. 13 The standardized information in TRMs can reduce the overall cost of evaluation by allowing for more complex, customized evaluation efforts to focus on more complicated and more uncertain measures, projects, or programs. The TRM information can also reduce the burden on efficiency program participants and implementers by minimizing the amount of data that need to be collected. However, while TRMs can reduce some costs, they do rely on rigorous EM&V that supports the information contained in TRMs. Thus, TRMs in of themselves do not represent reliable savings estimates if supporting, and sometimes expensive, efficiency measure and evaluation research is not conducted on an ongoing basis. 14 One of the major challenges of EM&V is defining the appropriate baselines and baseline definitions, and how they are determined does vary across the efficiency industry.

June 2017 www.seeaction.energy.gov 22
access to reliable data sources for developing the deemed savings values and inputs to deemed calculations and other TRM content.
Another, and often significant, barrier to TRM development is a lack of consensus among stakeholders, particularly when multiple utility service territories are involved, on what to include in TRMs; the TRM development, updating, and approval process; the criteria for accepting the content (e.g., deemed savings values and deemed calculations, see discussion below) as sufficiently reliable; and whether TRM data are mandated for use by efficiency program administrators versus only being considered “advisory.” The process involved in surmounting these barriers generally starts with the adoption of clear policy guidance that prioritizes the implementation of efficiency, encourages collaboration, and establishes multi-year funding agreements that provide the resources, structure, and stability to conduct and maintain highly complex and technical analysis and databases. Such a process clearly requires the support of key stakeholders who both inform the scope and ensure transparency in the development of the TRM. These barriers, which are mostly, but not entirely, related to allocating limited resources, may be overcome if the stakeholders assign resources in the context of comparing barriers to the significant potential benefits of TRMs listed above.
1.2. Technical Reference Manual Jurisdiction Coverage Options
TRMs are developed for and applicable to either a service territory associated with a specific utility or program administrator (e.g., Energy Trust of Oregon [ETO]); several utility service territories in a state, typically those under the jurisdiction of a state utility regulatory commission (e.g., the Michigan TRM or the Arkansas TRM); or a region in which multiple state agencies, utilities, or program administrators have agreed to coordinate efforts (e.g., the Northwest Regional Technical Forum [RTF]15 and the Mid-Atlantic TRM).16
For regional and statewide efforts, TRMs share the advantages of other types of statewide or regional efficiency coordination, including the potential for reduced program administrator and implementer transaction costs through economies of scale, additional resources for creating high quality products and services, consistency in terminology, and consistent reporting format and content. These potentially reduced program-related evaluation costs and improvements in consistency and quality can then also support higher levels of efficiency activity.
Conversely, there are also potential disadvantages to any coordination effort, including possible loss of some control by individual utilities in a statewide TRM or states in a regional TRM, “lowest common denominator”17 efforts that do not meet the needs of some of the TRM users, and additional costs and delays due to coordination inefficiencies or failures. While these potential disadvantages can be mitigated, they require consideration in the decision-making process used for developing and updating TRMs. The TRM development and updating processes are addressed by some of the recommendations in this guide.
1.3. Information Contained in Technical Reference Manuals
TRMs are used in planning and implementation as well as in the evaluation, measurement, and verification (EM&V) of efficiency projects and programs. For a given jurisdiction, TRMs provide tabulated and documented information that is used for estimating impacts (typically energy and demand savings) associated with specific efficiency
15 Northwest RTF home page. https://rtf.nwcouncil.org/. 16 Northeast Energy Efficiency Partnerships (NEEP) 2016. 17 One approach, adopted by the Northwest RTF, overcomes the problems that might lead to “lowest common denominator” results. The Northwest RTF, which serves four states, provides all the “building blocks” behind each of its deemed savings values so that utilities in different states where baseline assumptions and reporting requirements may vary can construct their own analysis. These individual utilities and program administrators still benefit by leveraging the RTF’s data collection and analysis, without having to adopt a specific RTF value. More information about the RTF is contained in other chapters of this guide.

June 2017 www.seeaction.energy.gov 23
measures. Although terminology is not universally consistent within the efficiency industry, the term EM&V often is used as a catch-all for activities primarily designed to determine the impacts of efficiency activities.18
To support program planning, implementation, and EM&V, the information in TRMs takes one or more of the following forms (more information on these three categories can be found in Chapter 2 and Appendix 2).
• Deemed Savings Value: Also known as stipulated savings values and unit energy savings(UES), these are what TRMs are most known for—documented, numerical values such as per-unit energy and/or demand savings that define the agreed-upon performance of a specific efficiency measure (e.g., kilowatt-hour [kWh] savings per year for a defined light-emitting diode [LED] lamp type in a defined application). From a broad perspective, considering other impacts beyond energy or demand savings, deemed values can also be developed for measure costs, estimated useful lives as well as values for avoided environmental impacts (e.g., water savings or emission reductions), and other non-energy benefits or costs, although these are less commonly found in TRMs. As discussed in Chapter 2, deemed savings value can be fully deemed or partially deemed.
• Deemed Variables and Factors: Variables are values for parameters that determine the performance of an efficiency measure. These parameters are associated with different operating conditions, applications, climates, etc. (e.g., climate conditions to be used for heating system retrofit savings determinations or operating hours per year for certain types of lighting systems in specific applications)—that is, variables that are independent and separated from the characteristics of the efficiency measure. Factors is a term for attributes of an EEM’s impacts that are dependent, i.e., connected, to each measure.
Deemed variables and factors include net-to-gross (NTG) ratios, effective useful life (EUL) of measures, and measure cost data. When variables or factors are deemed, they are stipulated, or fixed, for the determination of savings impacts. Also, with deemed variables and factors versus project- or site-specific measurements, the resulting savings values are usually average or typical values (e.g., based on average weather conditions) versus the “actual” savings, which would be based on actual conditions (e.g., the actual weather in any given year).
• Deemed Calculations (or Algorithms): These are agreed-to (stipulated) simple to complex econometric or engineering algorithm(s) (equations) used to calculate the energy and/or demand savings associated with an efficiency measure(s). For example, the equations for calculating savings from lighting retrofits are defined with indications of which variables are to be determined with measurements or project-specific data and which are to be deemed variables or factors, if any, to be applied under given circumstances. Figure 1.1 shows an example of a deemed calculation.
18 Schiller 2012.
DEEMED SAVINGS VERSUS DEEMED SAVINGS VALUES
As discussed in Chapter 2, deemed savings is the name of one of the evaluation, measurement, and verification methods. Thus, for some, the term has a double meaning—it is a method, but it is also the generic term for a value in a TRM. In this guide, the term deemed savings refers to the method and deemed savings value to the actual values. With the deemed savings method, the result is a fully deemed savings value that does not depend on any site- or project-specific measurements.
The measurement and verification (M&V) methods are differentiated from the deemed savings methods in that with M&V some site- or project-specific measurements are required to determine a savings value. With the M&V method, the result is either (1) a partially deemed savings value that depends on some site- or project-specific measurement or (2) a totally site- or project-specific savings value since all, or substantively all, of the savings calculation input is site- or project-specific.

June 2017 www.seeaction.energy.gov 24
Gross energy first-year energy savings from residential lighting
kWhsaved = NUMMEAS * (ΔW/1,000) * HRS * ISR * IEe (1)
kWsaved = NUMMEAS * (ΔW/1,000) * PCF * ISR * IEe (2)
where:
kWhsaved = first-year electricity energy savings measured in kilowatt-hours
kWsaved = first-year electricity peak demand savings measured in kilowatts
NUMMEAS = number of measures sold or distributed through the program
ΔW = delta Watts (baseline wattage minus efficient lighting product wattage)
HRS = annual operating hours
PCF = peak coincidence factor
ISR = in-service rate
IEe = cooling and heating interactive effects
Figure 1.1. Example Deemed Calculation (Source: Dimetrosky et al. 2015)
It is critical for the validity and proper use of these deemed savings values, deemed calculations, and deemed variables and factors that they be developed and applied appropriately. This is mentioned here and stressed in a Chapter 4 recommendation because the primary area identified in assessments of TRMs for improvement is validity of the deemed savings values found in the TRMs.19, 20, 21, 22 Similarly, another shortcoming associated with the proper use of deemed savings values is that once a measure has been “deemed,” the stakeholders’ interest in conducting new impact evaluations for the subject measure is significantly diminished. As a result, updating requirements need to be explicit, or such evaluations may not occur as needed to maintain reliable savings estimates.
However, it is important to note that some TRMs also establish deemed savings values and other data for efficiency measures that are not yet well-understood and documented (e.g., new measures in pilot programs), or are measures that represent very little of a portfolio’s total savings. For these measures, the cost of research and evaluation necessary to achieve the high level of savings reliability expected for established measures with significant savings may not be justified. Thus, although such values or data for these less well-understood and documented measures should be assigned a lower level of reliability and be treated differently in tracking and reporting, they do support:
• Systematic technical and peer review of efficiency measures prior to implementation in pilot programs
• Efficiency measures that may have a cumulative savings potential that is judged to be small, but still worthy of data development.
19 Loper et al. 2010. 20 Jayaweera et al. 2012. 21 Tamble et al. 2016. 22 ANSI 2014.
June 2017 www.seeaction.energy.gov 25
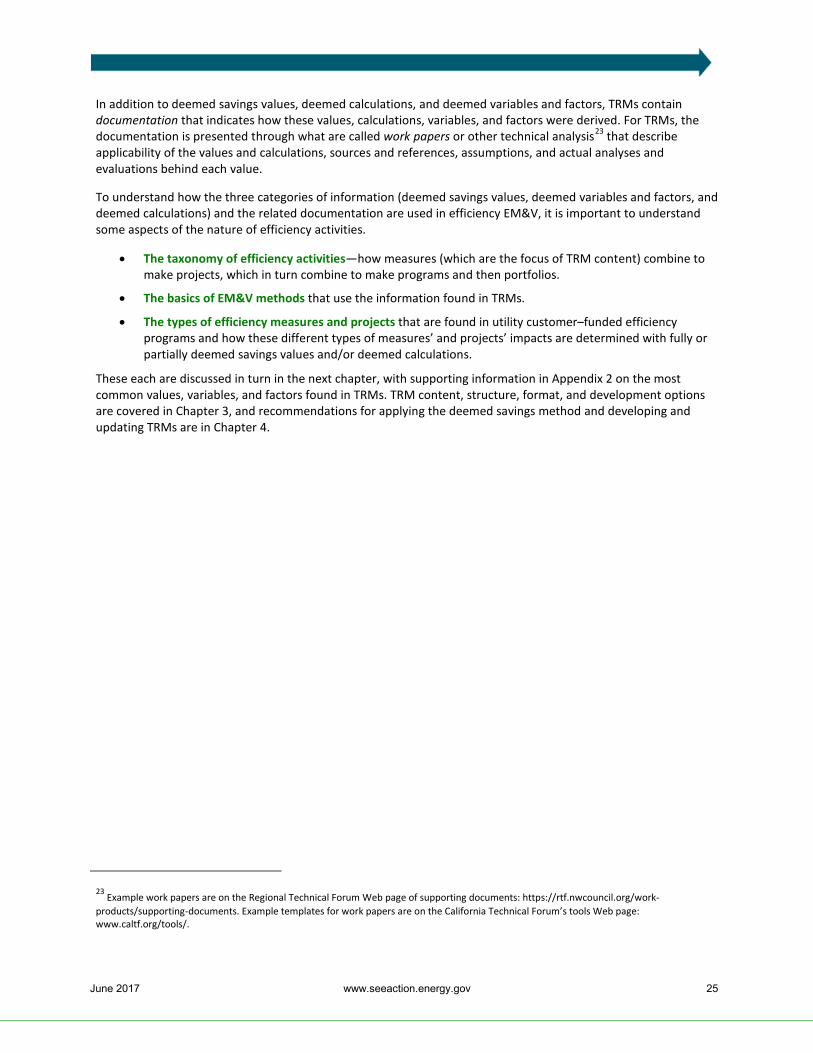
In addition to deemed savings values, deemed calculations, and deemed variables and factors, TRMs contain documentation that indicates how these values, calculations, variables, and factors were derived. For TRMs, the documentation is presented through what are called work papers or other technical analysis23 that describe applicability of the values and calculations, sources and references, assumptions, and actual analyses and evaluations behind each value.
To understand how the three categories of information (deemed savings values, deemed variables and factors, and deemed calculations) and the related documentation are used in efficiency EM&V, it is important to understand some aspects of the nature of efficiency activities.
• The taxonomy of efficiency activities—how measures (which are the focus of TRM content) combine to make projects, which in turn combine to make programs and then portfolios.
• The basics of EM&V methods that use the information found in TRMs.
• The types of efficiency measures and projects that are found in utility customer–funded efficiency programs and how these different types of measures’ and projects’ impacts are determined with fully or partially deemed savings values and/or deemed calculations.
These each are discussed in turn in the next chapter, with supporting information in Appendix 2 on the most common values, variables, and factors found in TRMs. TRM content, structure, format, and development options are covered in Chapter 3, and recommendations for applying the deemed savings method and developing and updating TRMs are in Chapter 4.
23 Example work papers are on the Regional Technical Forum Web page of supporting documents: https://rtf.nwcouncil.org/work-products/supporting-documents. Example templates for work papers are on the California Technical Forum’s tools Web page: www.caltf.org/tools/.

June 2017 www.seeaction.energy.gov 26
2. Background: Savings Taxonomy and Interactions; Evaluation, Measurement, and Verification Methods and Prescriptive and Custom Measures
This chapter provides context on the taxonomy of efficiency measures, projects, and programs and discusses how TRMs are applicable to prescriptive and some custom measures. It also discusses three common EM&V methods used to estimate energy and demand savings, with a focus on the two most closely associated with TRMs, namely deemed savings methods and M&V methods.
2.1. The Savings Taxonomy and Savings Interactions
Because the information in TRMs is almost always provided with respect to specific efficiency measures, it is important to understand how efficiency projects, programs, and portfolios are made up of individual measures. This relationship, as a hierarchy for analyzing efficiency actions, is shown in Figure 2.1. This figure shows efficiency actions in the following order (from bottom to top).
• Efficiency Measure: An installed piece of equipment or system; a strategy intended to affect consumer energy use behaviors; or a modification of equipment, systems, or operations that reduce the amount of energy that would otherwise have been used to deliver an equivalent or improved level of end-use service.24 Examples include LED lamp lighting retrofits, installation of a new motor, and the purchase of ENERGY STAR®-rated appliances. Deemed savings values are typically applied at the measure level.
• Efficiency Project: This is an activity or course of action involving one or multiple efficiency measures (the same or different measures) at a single facility or site. These can also be the same or different measures as implemented on other projects. Examples include a home energy retrofit, multiple efficiency measures incorporated as part of a new building’s construction, or a street lighting retrofit that could encompass lamps on one street or an entire city.
• Efficiency Program: This is an activity, strategy, or course of action undertaken by a program implementer or administrator. Programs consist of a group of projects with similar characteristics and/or installed in similar applications. Examples include a utility program to install efficient lighting in commercial buildings, a developer’s program to build a subdivision of efficient homes that exceed current codes or common building practices, or a state’s effort to improve compliance with energy efficiency codes.
• Efficiency Portfolio: This is either (1) a collection of programs addressing the same market (e.g., a portfolio of residential programs), technologies (e.g., motor efficiency programs), or mechanisms (e.g., loan programs), or (2) the set of all programs administered by single program administrator.
24 Providing an equivalent or improved level of service, while reducing energy use, is the characteristic that distinguishes energy efficiency from conservation (or curtailment). However, the boundary between these two terms is not always clear. For example, compact fluorescent lamps are intended to provide equivalent lighting levels, however, they have other characteristics (e.g., slow to start) that consumers viewed as inferior to the incandescent lamps they replaced. By contrast, energy conservation measures (which may also be included in TRMs) are not necessarily designed or intended to deliver an equivalent or improved level of end-use service. For example, refrigerator recycling programs that remove a second refrigerator may be viewed by some consumers as reducing their level of service, while other consumers view the removal as a benefit.
June 2017 www.seeaction.energy.gov 27
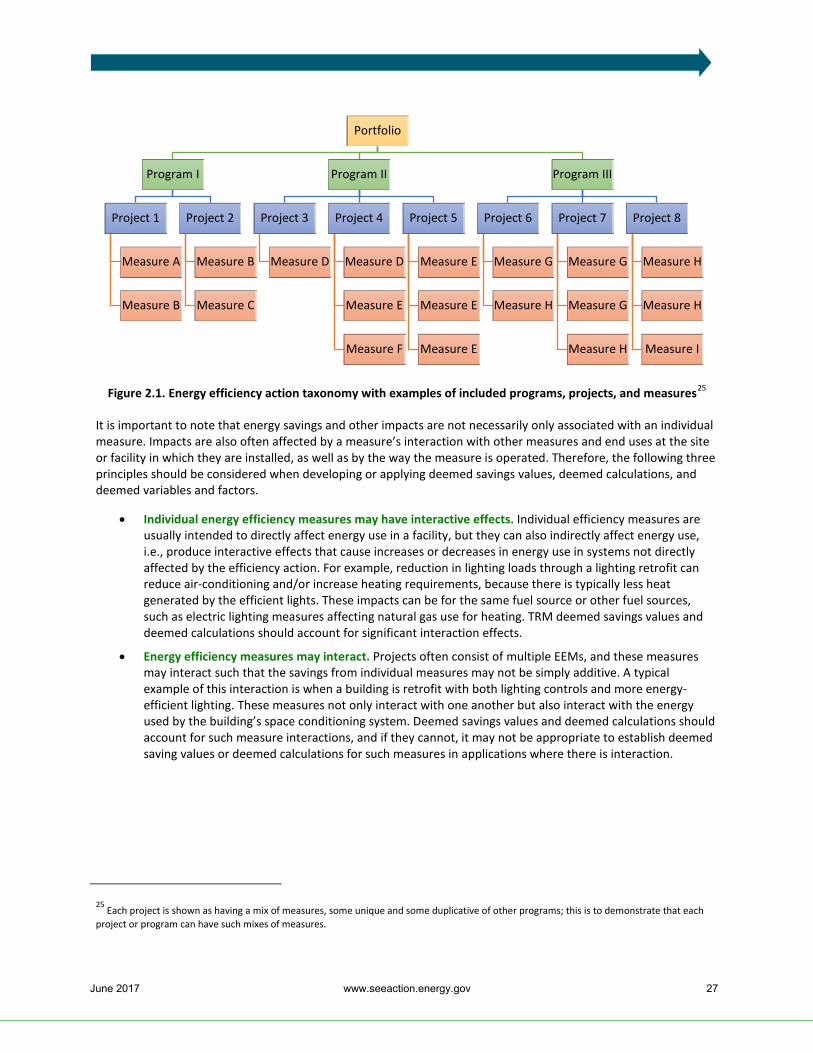
Figure 2.1. Energy efficiency action taxonomy with examples of included programs, projects, and measures25
It is important to note that energy savings and other impacts are not necessarily only associated with an individual measure. Impacts are also often affected by a measure’s interaction with other measures and end uses at the site or facility in which they are installed, as well as by the way the measure is operated. Therefore, the following three principles should be considered when developing or applying deemed savings values, deemed calculations, and deemed variables and factors.
• Individual energy efficiency measures may have interactive effects. Individual efficiency measures are usually intended to directly affect energy use in a facility, but they can also indirectly affect energy use, i.e., produce interactive effects that cause increases or decreases in energy use in systems not directly affected by the efficiency action. For example, reduction in lighting loads through a lighting retrofit can reduce air-conditioning and/or increase heating requirements, because there is typically less heat generated by the efficient lights. These impacts can be for the same fuel source or other fuel sources, such as electric lighting measures affecting natural gas use for heating. TRM deemed savings values and deemed calculations should account for significant interaction effects.
• Energy efficiency measures may interact. Projects often consist of multiple EEMs, and these measures may interact such that the savings from individual measures may not be simply additive. A typical example of this interaction is when a building is retrofit with both lighting controls and more energy-efficient lighting. These measures not only interact with one another but also interact with the energy used by the building’s space conditioning system. Deemed savings values and deemed calculations should account for such measure interactions, and if they cannot, it may not be appropriate to establish deemed saving values or deemed calculations for such measures in applications where there is interaction.
25 Each project is shown as having a mix of measures, some unique and some duplicative of other programs; this is to demonstrate that each project or program can have such mixes of measures.
Portfolio
Program I
Project 1
Measure A
Measure B
Project 2
Measure B
Measure C
Program II
Project 3
Measure D
Project 4
Measure D
Measure E
Measure F
Project 5
Measure E
Measure E
Measure E
Program III
Project 6
Measure G
Measure H
Project 7
Measure G
Measure G
Measure H
Project 8
Measure H
Measure H
Measure I

June 2017 www.seeaction.energy.gov 28
Technologies alone do not save energy. When developing or applying deemed savings values, it is important to realize that technologies alone do not save energy; it is how they are installed and used that determines how much energy is saved. Therefore, a deemed energy savings value needs to be defined in the context of how (i.e., delivery mechanism) and where (i.e., the application) a technology (i.e., the EEM) is placed into service (i.e., installed). For example:
o An LED lamp’s annual savings are dependent on its annual operating hours. Such a lamp installed in a closet will likely save much less energy during a year than one that is installed in a kitchen.
o An efficiency system (e.g., an energy management system) may only realize the expected savings if it is properly activated, operated, and maintained.
TRMs should, therefore, account for these installation-related issues in their measure descriptions by including installation specifications, delivery mechanisms, and related parameters (e.g., building type, climate, etc.) in their documentation. For example, an LED lamp’s savings could be based on the “average hours of use across all lamps” or only “kitchen” areas. A TRM could have deemed savings values for both applications, but the “delivery mechanism” in the former case might be “retail buy down” while the latter case might be restricted to “direct install” program to ensure that the measure was installed in the location assumed in the deemed savings value’s development. Similarly, a TRM might have different savings values for energy management systems installed as part of programs that require verification of the systems’ proper operation (i.e., require commissioning) as compared to the savings values for systems installed as part of programs that do not require verification.
2.2. Evaluation, Measurement, and Verification of Efficiency
2.2.1. Evaluation, Measurement, and Verification Fundamentals
The impacts of energy efficiency (and demand response and conservation) activities, such as energy and demand savings, cannot be directly measured. Instead, impacts are based on a comparison between what happened and a set of assumptions about what would have happened (i.e., the counterfactual). In effect, efficiency impacts are always “estimates.” The need for counterfactual assumptions (see sidebar) creates a fundamental need to balance the reliability of impact estimates with the cost of obtaining such estimates through EM&V. Establishing the counterfactual creates some level of uncertainty and can add complexity to the EM&V process. Furthermore, for a given program or project, the specific EM&V method that is applied depends on a number of factors, including the type of efficiency activity, overall policy objectives, access to data, available budgets, and other factors. Thus, these factors and the counterfactual result in the need to balance the accuracy of savings estimate against the cost and effort to determine that estimate. EM&V practitioners select one of the three EM&V methods described in Section 2.2.2, or one or more of the numerous variations across these methods that they believe creates the right balance of cost, accuracy, and timeliness for the subject measure(s).

June 2017 www.seeaction.energy.gov 29
EM&V has been used primarily for, and is most advanced for, utility customer-funded energy efficiency and demand response programs as well as performance-based projects implemented directly by energy service companies (ESCOs) for their clients. Thus, efficiency EM&V strategies in wide use today—including budget levels, oversight procedures, and preferred methods—are mostly derived from utility regulatory agency requirements, together with industry standard energy efficiency guides and protocols developed to support regulatory requirements and ESCO projects. For those interested in more information on EM&V practices and resources, refer to Appendix 3: Energy Efficiency Evaluation, Measurement, and Verification Resources and Protocols.
EM&V offers substantial benefits by providing data to assess efficiency activities and improving the confidence in the reliability of quantified program impacts. However, the costs of EM&V, especially those associated with obtaining high levels of precision and confidence in estimated impacts and delays in obtaining results, can limit the commitment to and confidence in efficiency activities. The development and use of TRMs, which incorporate a set of agreed-upon deemed savings values, deemed calculations, and deemed variables and factors is seen as a viable option for reducing the uncertainty and delays in reporting results and potentially reducing the costs of EM&V. In the continuing effort to improve EM&V methods, a second option for potentially reducing costs, uncertainty, and delays in obtaining results is the use of real-time or continuous M&V based on short-interval (hourly, daily) metering, also known as M&V 2.0 (see text box below).
THE COUNTERFACTUAL AND VARIATION IN BASELINE DEFINITIONS PROGRAMS
Energy and demand savings and associated impacts of efficiency actions are estimated to varying degrees of accuracy by comparing the situation (e.g., energy consumption) after a measure is implemented (the reporting period) to what is assumed to have been the situation in the absence of the efficiency measure (the “counterfactual” scenario, also known as the baseline). For energy impacts, the baseline and reporting period energy use are compared, while controlling (making adjustments) for factors unrelated to energy efficiency actions, such as weather or building occupancy. These adjustments are a major part of the evaluation process; how they are determined can vary from one measure type to another and between EM&V methods.
There is some variation in the definitions and assumptions used for establishing the (counterfactual) baseline. For example, common practice, preexisting condition, and codes and standards are examples of different options (and definitions) of baselines used throughout the industry. Thus, TRMs should establish clear baseline definitions, and users of TRMs should be aware of possible variations in definitions and application to different measures. See Appendix 3 for standard industry resources that address and define baseline issues. It should also be noted that baselines can vary by measure application. For example, the same LED lamp installed in a commercial building lobby would likely have a very different baseline than one installed in a residential kitchen. Another example is measures implemented in low-income homes. For these homes, the baseline conditions, such as operating hours or thermostat set points assumptions, can be different than assumptions used for average homes.

June 2017 www.seeaction.energy.gov 30
26 Granderson et al. 2015. 27 Eckman and Silvia 2014. 28 Franconi et al. 2017.
MEASUREMENT AND VERIFICATION 2.0 METHODS AND DATA COLLECTION TOOLS
M&V 2.0 has been defined as “The leveraging of smart grid investments, advances in interval meter data, nonintrusive load monitoring, and equipment-embedded sensors and controls to provide new tools with potential to reduce the cost of M&V, produce more timely results with higher confidence and transparency, and thereby increase the acceptance of the savings calculations.”26 These concepts have been applied to evaluation to create another term—EM&V 2.0,27 which is usually shortened to just M&V 2.0. As noted above, the current use of deemed savings methods is very common, but advances in both technology and analytics could potentially result in significant improvements in the accuracy and timeliness of energy savings determinations and reductions in M&V costs associated with M&V 2.0. A recent publication summarizes current M&V 2.0 methods as well as key needs and opportunities.28
In practice, M&V 2.0 describes recent advances in metering (e.g., advanced metering infrastructure [AMI]) and monitoring (e.g., wireless sensors, smart thermostats), data availability and analytical tools (e.g., machine learning, interactive visualization, cloud-based analytical platforms) associated with documenting the energy and demand savings from specific energy efficiency measures or projects based on consumption data. One rapidly developing area of M&V 2.0 is automated M&V (auto-M&V), which can use a combination of automated continuous data collection (e.g., 15-minute, hourly, monthly, or bimonthly energy data and corresponding temperature data) and continuous processing, machine learning, and analytical tools to calculate the difference in energy use before and after measure installation at a site or at the program level. These tools use data that can be correlated to energy use and that can be readily obtained (e.g., ambient temperatures and time of day, day of week, season). This is similar to energy billing analyses that have been conducted for decades, but uses higher resolution (i.e., shorter interval) datasets and advanced analytics to arrive at savings estimates in less time and with greater granularity.
M&V 2.0 tools are likely to interact with TRMs in two different ways: (1) The results of analyses completed by M&V 2.0 tools may provide the primary source data for creating or updating deemed savings values in a TRM, or (2) M&V 2.0 analysis may provide impact estimates that take the place of deemed savings values that were previously used to evaluate savings from programs. Examples of M&V 2.0 analytic methods include:
• “Big data” analytics: the process of examining large quantities of data to uncover hidden patterns, unknown correlations, and other useful information that can be used to make better decisions
• Automated M&V: estimating savings without direct human interaction
• Continuous M&V: estimating savings from projects or programs in less than 12 months
• Behavior analytics: providing insights into how people make energy decisions
• Benchmarking: measuring a building’s energy use and then comparing it to the average for similar buildings, to allow owners and occupants to understand their building’s relative energy performance and help identify opportunities to cut energy waste
• Non-intrusive load monitoring: analyzing changes in the voltage and current going into a building or the operating of in-house systems and deducing what appliances or equipment are in use and measuring their energy consumption.
Examples of M&V 2.0 data collection tools include smart meters and AMI, smart devices (e.g., thermostats, appliances, and energy management systems), and wireless metering using transducers that do not need to be connected to monitoring stations via wire.

June 2017 www.seeaction.energy.gov 31
2.2.2. Evaluation, Measurement, and Verification Methods
Broadly speaking, impact evaluation includes a range of retrospective assessments and activities aimed at determining the effects of efficiency policies, portfolios, programs, or projects. Impact evaluation is one three broad categories of efficiency evaluations: impact, process, and market effects. Impact evaluation can document metrics such as performance (i.e., energy and demand savings, avoided air emissions), changes in markets (e.g., changes in product and services availability and pricing), and cost-effectiveness.
This guide’s focus is within the construct of impact evaluations of programs (and more broadly, policies or portfolios of programs that result in efficiency actions), projects, and measures. Evaluation is the typical term associated with assessing programs (and program portfolios and policies). Measurement and verification (M&V) are methods associated with assessing project and individual measure impacts.30 M&V is also one way that programs are evaluated. For example, M&V can be applied to a sample of projects, and the results extrapolated to the entire program population of projects.
Besides M&V methods, there are two other methods commonly used for efficiency program impact evaluation: (1) deemed (also called unit energy savings or stipulated) savings methods and (2) comparison group methods. Solely using fully deemed savings values is not considered M&V. M&V, as defined by the efficiency industry, always requires some level of site measurements.
These three methods are described briefly below, but TRMs that contain deemed savings values and deemed calculations, variables, and factors are only applicable for the deemed savings and M&V methods, as described below and shown in Figure 2.2.
29 Franconi et al. 2017. Page 7. 30 EM&V is often used as a catchall for all types of impact, process, and market evaluations, but is also sometimes associated only with impact evaluation, which includes the market impact portion of market evaluations.
EVALUATION, MEASUREMENT, AND VERIFICATION METHODS
“Evaluation, measurement, and verification (EM&V) is a process of assessing an energy efficiency program, including applying M&V and other methods to estimate program savings. EM&V can include:
• The M&V methods applied at the building level, with results expanded to the program level.
• The use of deemed savings values, with installations and key parameters verified by the evaluator, but without direct measurement of site performance (thus deemed savings is not considered a true M&V approach) [deemed savings method].
• Analysis of consumption data for program participants and a comparison group to determine savings for the program as a whole, and not necessarily for any individual facility or measure. [comparison group method].”29

June 2017 www.seeaction.energy.gov 32
Figure 2.2. Evaluation, measurement, and verification methods, inputs, and resulting values covered by most technical reference manuals
TRM INFORMATION CAN BE USED FOR TWO OF THE EM&V METHODS
The information in TRMs can be used for two of the EM&V methods:
• Deemed savings methods, in which fully deemed per-unit impacts (e.g., unit energy savings) are predetermined for specific efficiency measures subject to some form of implementation verification
• Measurement and verification (M&V) methods, in which energy or demand savings are determined through a combination of implementation verification, agreed-to or deemed calculations, and analytical methods, measurements, and stipulations of key independent variables or factors. M&V (IPMVP Option A) results in partially deemed savings values. However, fully deemed savings values are not considered a result of M&V, only of the deemed savings methods.
Resulting Savings Values
Inputs
Methods
TRMs
Deemed Savings Methods
Deemed Calculations, Variables and
Factors
Fully Deemed Savings Values
Measurement and Verification
Methods
Deemed Equations with Combination of Deemed and Site- (or
Project-) Specific Variables and Factors
Partially Deemed Savings Values
Deemed Equations (analysis tools,
algorithms) with only Site- (or Project-) Specific Variables
and Factors
Site- or Project-Specific Savings
Values

June 2017 www.seeaction.energy.gov 33
Deemed savings methods. These are processes by which fully deemed savings values are determined and applied. The deemed savings methods can also overlap with the M&V methods, as both methods can involve developing deemed variables, factors, and calculations, which are used for determining fully deemed savings values (deemed savings methods) as well as partially deemed savings values (M&V methods). However, the focus of the deemed savings methods is the fully deemed savings values that are stipulated estimates of energy or demand savings (or potentially other impacts) for a single unit of an installed efficiency measure that:
• Has been developed from data sources (such as prior metering studies) and analytical methods that are widely considered acceptable for the measure and purpose
• Is applicable to the condition (e.g., office building lighting system retrofit, residential refrigerator upgrade) under which the measure is being implemented.
As part of the deemed savings method, and in order to fully quantify impacts, a separate verification process is usually needed to confirm the quantity of units installed (and for some programs, whether they are operating correctly) and that the measure installation conforms to the conditions and applications (e.g., installation specifications) defined for use of the deemed savings value.
The deemed savings method is used to stipulate values (i.e., unit energy and/or demand savings) for projects with well-known and documented savings values and for which it has been observed that there is a strong central tendency in the distribution of savings across sites or installations—that is, not much variation in savings across most installations. Examples include energy-efficient appliances such as washing machines, computer equipment, and refrigerators as well as lighting retrofit projects with well-understood operating hours. Many performance contracting projects document their savings with deemed savings values.
Measurement and Verification Methods. The industry standard M&V document—the International Performance Measurement and Verification Protocol (IPMVP)31—defines four M&V options: two retrofit isolation options and two whole-facility options.
• Retrofit Isolation Options. Assessing savings from each efficiency measure individually (IPMVP Options A & B). Verification is an integral part of Options A and B because the measurement process involves direct observation of all or a sample of the affected equipment.
o With Option A, savings are determined by field measurement(s) of the key performance parameter(s) that define the energy use of (and thus savings of) a measure or project and stipulation of other factors. Option A may thus be considered a partially deemed savings value approach, resulting in partially deemed savings values.
31 Efficiency Valuation Organization (EVO). International Performance Measurement and Verification Protocol (IPMVP). (multiple dates). www.evo-world.org.
DEEMED SAVINGS METHOD—AGREEING TO SAVINGS
A fundamental element of the deemed savings methods is an agreement, informed by prior evaluations, research, analysis, and expert judgment, between the involved parties to accept as “evaluated” the indicated savings value or a set of assumptions (e.g., deemed variables and factors) for use in determining the difference between the baseline and the reporting period energy consumption or demand. While there might be requirements such as verification of installation and performance, satisfactory commissioning results, and evidence of sufficient equipment or system maintenance, if these requirements are met, the project savings are considered confirmed. Thus, with the deemed savings method, typical industry practice is to hold the stipulated value constant, regardless of what the actual value is during the program’s term. That is, any adjustments to reflect observed savings (as opposed to “deemed”) are done on a prospective basis (for future projects), and not applied retrospectively.

June 2017 www.seeaction.energy.gov 34
o With Option B, savings are determined with field measurement(s) of all significant performance parameter(s) that define the energy use of (and thus savings of) a measure or project; unlike Option A, Option B does not allow stipulations of any major factors.32
• Whole Facility Options. Collectively assessing energy (and demand) savings from all EEMs in a facility while taking into consideration the interactions between measures and systems within the facility.
o With Option C, facility energy meter(s) data are used to compare energy use before and after implementation of the efficiency measures.
o With Option D, calibrated simulation models33 are used to estimate energy use before and after measure implementation. Option D is often used with new construction efficiency actions, as the baseline does not exist, but can be simulated.
The IPMVP retrofit isolation options—IPMVP Options A and B, and the billing analysis option of using a project’s pre-project and post-project utility bills for analysis—appear to be the more common M&V approaches versus calibrated simulations, which is IPMVP Option D. One study of the U.S. Department of Energy’s (DOE’s) Energy Savings Performance Contract program further indicated that for those ESCO projects, the most common M&V approaches were IPMVP Options A and B.34 Options A and B have historical limitations associated primarily with cost of metering (equipment and labor), which project participants may not be interested in paying for, particularly over the life of projects. This may be changing with M&V 2.0 developments. Option D, calibrated computer simulations, is used when the savings for individual measures are desired but only whole-premise metered data are available.
32 For example, in a lighting retrofit, the parameters may be a change in wattage and operating hours. With Option A, only operating hours might be measured and a change in wattage is stipulated. With Option B, they would both be measured. 33 Whole-building and building component energy simulation programs are physics-based tools that engineers, architects, and researchers use to model both energy consumption (for heating, cooling, ventilation, lighting, and plug and process loads) and energy savings opportunities in buildings. A wide variety of building energy simulation programs have been developed and enhanced, and are in use throughout the building industry. 34 Slattery 2015.
FULLY DEEMED VERSUS PARTIALLY DEEMED VALUES
M&V is distinguished from deemed savings methods by M&V’s requirement for some field-based or project-specific measurements, which is not a requirement for deemed savings. Without any such measurements, a value is a fully deemed savings value, period. However, because M&V may involve the use of predetermined (deemed) calculations and values or factors (such as those for long-term weather data) there is some possible overlap in terminology when savings values assigned to a measure are essentially partially deemed. In this guide, the separation between M&V and deemed savings methods is defined such that deemed calculations—which result in partially deemed savings values—are an element of M&V.
For example, the approach taken for the Illinois, Iowa, Ohio, and Missouri TRMs is mostly a deemed calculation approach that provides deemed savings values only as defaults. The approach is to provide a full algorithm that indicates what input values are needed for the required factors or variables. Many variables/factors will have deemed assumptions based on data (provided as single values or as elements of look-up tables if there are lots of options for the measure), and some variables/factors will use site- or project–specific inputs, if available. Because these TRMs are designed for use by multiple program administrators, not all will have programs that gather these specific required input values, so in each case, a deemed default value is provided to use if needed.

June 2017 www.seeaction.energy.gov 35
With respect to TRM development, computer simulation models are commonly used to develop deemed savings values. For example, the Northwest RTF database35 derives savings for individual shell insulation measures using simulations calibrated to metered or billing analysis estimates of space conditioning energy use. Use of simulation has the benefits of being able to consis-tently analyze multiple scenarios involving multiple variables and factors (such as operating hours, baselines, measure interactions, and weather). However, performing and reviewing the large-scale and large number of computer simulation analyses needed to establish savings estimates and the range of contexts to which they apply can be labor intensive and error-prone.36
Comparison group EM&V. This method involves determining program savings based on the differences in energy consumption between a comparison group and program participants. Comparison group methods include randomized control trials and quasi-experimental methods.37
Because the effects of implemented measures are reflected in the observed participant-comparison differences, separate verification is not required. Control groups have been used for decades for residential efficiency programs with large numbers of relatively
homogenous participants. There has been renewed interest in this method for a wide range of program types, as a potential gold standard of savings determination. Some M&V 2.0 applications are also employing this method.
At least in theory, comparison group analyses assess the savings associated with just the efficiency activity and not changes in energy consumption or demand associated with outside factors such as changes in the economy and energy prices or savings from those consumers who would have completed the projects outside of program influences (i.e., free riders).38 This is done by comparing data between a treatment group (participants) and a control group of consumers that are determined to be statistically similar. The challenges for comparison group approaches include reasonably applying them to populations of non-homogenous, customized projects (such as efficiency in commercial, institutional, and industrial facilities) and structuring a control group. Particularly if done
35 Northwest RTF website supporting data files: https://rtf.nwcouncil.org/work-products/supporting-documents. 36 Roth et al. 2016. 37 Randomized control trials (sometimes referred to as full experimental designs) are evaluations that derive savings estimates by comparing the energy use of customers who are randomly assigned to receive an energy efficiency measure to a control group that does not. Randomization minimizes self-selection bias, and the different comparison groups allow the evaluator to determine the impact of the measure when compared with the no treatment (control) group, while other variables are kept constant. In practice, this is often problematic because consumers generally self-select to participate in programs, so quasi-experimental evaluation methods are more frequently used. A quasi-experimental estimate of the savings still compares the energy use of participants with a control group, but without random assignment of consumers to either a control group or participant group. 38 In practice, how well the control group method determines true incremental, net impacts depends on the specific approach applied (randomized control trials are more reliable than quasi-experimental methods) and how well the approach is implemented.
ARE DEEMED SAVINGS VALUES EVALUATED SAVINGS?
Deemed savings values can be and are developed via a wide range of approaches, from computer simulations to applying past impact evaluations that used experimental designs in their assessment of measures. Thus, while deemed savings values are ex-ante savings values, when combined with verification activities, they also can be considered as part of an ex-post savings estimating approach—based on both prior ex-post evaluations (which provide the basis for a deemed savings value or other parameters) and verification activities—and thus evaluated savings.
Many TRMs also use simulation modeling to determine deemed savings values. Such modeling relies on calibrating the aggregate simulation results to measured data, but likely not to savings for individual measures.
Note that not all deemed savings values in TRMs are based on prior impact evaluations, field measurements, or generally accepted engineering practices.
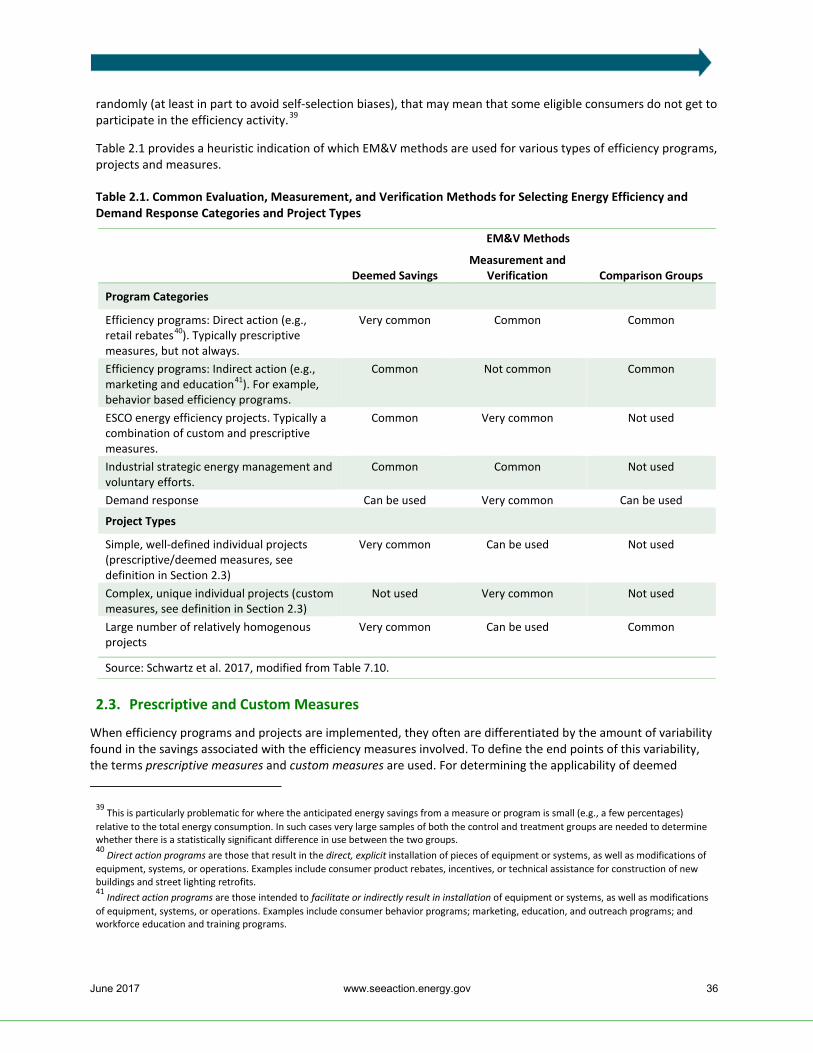
June 2017 www.seeaction.energy.gov 36
randomly (at least in part to avoid self-selection biases), that may mean that some eligible consumers do not get to participate in the efficiency activity.39
Table 2.1 provides a heuristic indication of which EM&V methods are used for various types of efficiency programs, projects and measures.
Table 2.1. Common Evaluation, Measurement, and Verification Methods for Selecting Energy Efficiency and Demand Response Categories and Project Types
EM&V Methods
Deemed Savings Measurement and
Verification Comparison Groups
Program Categories
Efficiency programs: Direct action (e.g., retail rebates40). Typically prescriptive measures, but not always.
Very common Common Common
Efficiency programs: Indirect action (e.g., marketing and education41). For example, behavior based efficiency programs.
Common Not common Common
ESCO energy efficiency projects. Typically a combination of custom and prescriptive measures.
Common Very common Not used
Industrial strategic energy management and voluntary efforts.
Common Common Not used
Demand response Can be used Very common Can be used
Project Types
Simple, well-defined individual projects (prescriptive/deemed measures, see definition in Section 2.3)
Very common Can be used Not used
Complex, unique individual projects (custom measures, see definition in Section 2.3)
Not used Very common Not used
Large number of relatively homogenous projects
Very common Can be used Common
Source: Schwartz et al. 2017, modified from Table 7.10.
2.3. Prescriptive and Custom Measures
When efficiency programs and projects are implemented, they often are differentiated by the amount of variability found in the savings associated with the efficiency measures involved. To define the end points of this variability, the terms prescriptive measures and custom measures are used. For determining the applicability of deemed
39 This is particularly problematic for where the anticipated energy savings from a measure or program is small (e.g., a few percentages) relative to the total energy consumption. In such cases very large samples of both the control and treatment groups are needed to determine whether there is a statistically significant difference in use between the two groups. 40 Direct action programs are those that result in the direct, explicit installation of pieces of equipment or systems, as well as modifications of equipment, systems, or operations. Examples include consumer product rebates, incentives, or technical assistance for construction of new buildings and street lighting retrofits. 41 Indirect action programs are those intended to facilitate or indirectly result in installation of equipment or systems, as well as modifications of equipment, systems, or operations. Examples include consumer behavior programs; marketing, education, and outreach programs; and workforce education and training programs.

June 2017 www.seeaction.energy.gov 37
savings or M&V methods (or some combination) for determining savings, the following descriptions of prescriptive and custom measures provides context.42
• Prescriptive/Deemed Measures. These measures are specific, defined actions that can be defined as individual units. Typically, they are one-for-one replacements for existing equipment or the equipment that would have been installed in lieu of the associated prescriptive measure program. Energy or demand savings can be fully deemed savings values or values with some limited variation based on deemed variables and project-specific data (i.e., partially deemed savings values). Typical prescriptive measures are appliances, motors, and lamps (e.g., LEDs). In terms of incentives or rebates provided for these types of measures, they are usually in the form of a fixed, per-unit incentive, such as a $1 rebate per 9-watt LED lamp, based upon a predicted energy savings estimate (e.g., a deemed savings value found in the TRM) for each installed measure.
• Custom Measures. These measures provide efficiency solutions to unique situations that are not amenable to completely standard solutions, or for which a customized approach is preferable—and thus fully deemed, or probably even partially deemed, savings values are not applicable. Custom measures rely on site-specific information (e.g., hours of operation, horsepower, existing equipment efficiency) that determines their impacts (e.g., energy savings). Each custom measure is examined for its individual characteristics, savings opportunities, efficiency solutions, and often, customer incentives, such as $0.10 per kWh saved, based on the documented first-year annual kWh reduction achieved. In some programs, the incentive is tied to customized, pre-implementation assessments, but this is not considered ex-post EM&V.
From a consumer perspective, prescriptive measures and the associated incentives are often more straightforward than custom measures. But to obtain prescriptive measure incentives, the consumer must perform a specific qualifying action for which the necessary information to determine a prescriptive (fully deemed) savings value is known. Custom measures and incentives, on the other hand, give consumers more flexibility in how and what they implement, and thus how they achieve savings. Because of this complexity, custom measures usually require more time and effort in project approval and savings documentation.
42 The term prescription measure is sometimes also used to refer to measures where there is a fixed financial incentive/rebate per unit of savings. In this document, the term is used in the context of the method used to assign a measure’s energy savings, hence it is equivalent to measures with deemed, or perhaps partially deemed, savings values, unit energy savings, or stipulated savings.
RELYING ON DEEMED VALUES
The use of any deemed savings values or deemed variables and factors presume the acceptance of the veracity of the sources of such values. It also assumes that the underlying assumptions that went into determining that such values are applicable to the situation (e.g., measures, measure delivery mechanism, facility types) being evaluated. Thus, other than for measures being initially assessed for limited applications (e.g., in pilots), it is essential that deemed savings values and deemed variables and factors, if used, be based on reliable, traceable, and documented sources of information. Achieving these attributes in the deemed savings approach is one objective of this guide.

June 2017 www.seeaction.energy.gov 38
2.4. Common Practice
The use of fully and partially deemed savings values is a popular approach for many efficiency programs because it is typically viewed as having lower costs than alternative program evaluation methods, and such values provide greater certainty of savings values that all parties can rely on for their own purposes. Anecdotal input obtained from surveys of experts involved in the EM&V field, conducted for this guide’s development, indicate that on the order of 50% to 90% of energy savings from measures implemented in utility customer-funded efficiency programs are based on fully or partially deemed savings values or some form of deemed calculations, variables, and factors.43
At the program-evaluation level, the deemed savings values (whether fully or partially deemed) for each verified installed measure are then summed to generate total program savings. In some cases, the number of installations might be verified by physical inspection of a sample of projects or perhaps just an audit of receipts. A particularly important aspect of such inspections is also confirming that the measures and their “circumstance” match the applicability conditions defined for the deemed savings values. In concept, but not often practice, savings can also be verified for “persistence” with periodic inspections that verify that the measures are still in place and functioning over the lifetime of the measure(s).
In practice, though, there is a spectrum of EEMs or projects that fall between prescriptive and custom measures. Figure 2.3 illustrates how this spectrum relates to the methods and deemed savings values, deemed calculations, deemed variables, and deemed factors found in TRMs. As can be seen, fully deemed savings values are commonly used for prescriptive measures, whereas a combination of partially deemed savings values, deemed calculations, deemed variables, and deemed factors can be used for measures that have a mix of custom and prescriptive characteristics. For pure custom measures, while the TRM information is not typically directly applicable, some custom projects include deemed measures and some TRMs provide guidance for custom measure and program level evaluations, such as suggested equations, factors, and variables.44
43 These percentages are based on anecdotal experience of the authors and a (nonscientific) survey conducted for preparation of this guide. Some of the variation in the wide range indicated is likely due to differences in definitions between deemed savings values and deemed calculations as adopted by efficiency practitioners. 44 Northwest Regional Technical Forum 2015. Chapters 4 and 5.

June 2017 www.seeaction.energy.gov 39
Figure 2.3. The Efficiency Measure Spectrum, Prescriptive and Custom Measures, and the Use of Technical Reference Manual Information
45 Even with fully customized measures, some variables such as weather data maybe stipulated (e.g., 30-year average conditions).
100% Prescriptive 100% Custom
Exclusive Source Primary Source Used as a Source May Be Used as a Source
Deemed Calculation(s)
No Yes Yes No, unless custom measure EM&V protocols are included
Deemed Variables or Factors
No Mix of site-/project-specific and deemed data
None or minimal None or minimal45
Site- or Project-Specific Variables or Factors
No Mix of site-/project-specific and deemed data
Exclusively or mostly Exclusively or mostly
Deemed Savings Values
Fully deemed savings values
Partially deemed savings values
No, savings determined per deemed calculations, resulting in site-/project-specific savings values
No, savings determined per project-/measure-specific analyses and data collection, resulting in site-/project-specific savings values
EM&V Method
Deemed savings M&V Option A M&V Options B, C, or D M&V Options B, C, or D (e.g., for individual commercial building projects) or control group methods (e.g., for mass market residential projects)
Source: Adopted from a figure in Carroll 2013. Slide 7.

June 2017 www.seeaction.energy.gov 40
3. Current Practices: Technical Reference Manual Content, Structure, and Development Options
This chapter covers current practices associated with the content, structure, and development of publicly available TRMs in the United States. This, as well as the information in prior chapters and the appendices, is provided as background for the recommendations in Chapter 4. It is intended that an understanding of current and recommended practices can lead to improvements in the integrity of TRMs. In some cases, current practices are recommended practices, and the current practices identified in other publications identified herein, such as the Northwest RTF’s Guideline for Development and Maintenance of Incremental Measure Costs and Benefits Estimates, can be used to guide the development and use of TRMs in other jurisdictions. Thus, the recommendations in Chapter 4 both reinforce some current practices and improve upon some current practices in TRM content, structure, development, maintenance, and use.
In developing this guide, 28 publicly accessible documents that can be defined as state or regional TRMs were identified across the United States. Figure 3.1 indicates the states and regions these TRMs cover.46 They incorporate a wide range of measures, are presented in several formats, and were developed via different processes—some with many stakeholders in an open process and others prepared by program administrators or public agencies through internal processes. Appendix 1 lists and summarizes these existing TRMs.
3.1. Examples of Existing Technical Reference Manuals
There is considerable variation in terms of the scope and amount of information provided in TRMs for individual measures. For example, Figure 3.2 shows, by end-use function, the variation in measures covered by six Midwest TRMs. In addition, one recent review of TRMs found that: “Only a small minority of distinct technology types appear in more than half of the TRMs. In other words, there is more difference in the TRMs in terms of technology coverage than there is similarity.”47
46 In some cases, the indicated TRMs are used for efficiency programs in most or all of the public and IOU service territories in a state or region, such as the regional one in the Northwest. However, for most states, the TRMs were only developed for and directly applied by the IOUs overseen by a state’s utility regulatory commission. 47 Tamble et al. 2016.
QUESTIONS: HOW MUCH DOES A TRM COST AND
HOW LONG DOES IT TAKE TO PREPARE OR UPDATE A TRM?
ANSWER: IT DEPENDS!
Unfortunately, this guide does not address these questions because of the wide variability found in the content and development processes used for TRMs. The costs can vary from tens of thousands to many hundreds of thousands of dollars. The time can vary from a few months to update an existing TRM to a year for developing a new one. Balancing costs, content, and reliability of content tends to be an iterative process with cost and schedule input available from the managers and developers of the TRMs described in this chapter.

June 2017 www.seeaction.energy.gov 41
Figure 3.1. Publicly accessible Technical Reference Manuals in the United States (Source: Authors’ research and Tamble et al. 2016. Both Delaware and Oregon have state TRMs and are also covered in regional TRMs.)
The same study and at least one other48 also found a range of deemed savings values and other input assumptions used to derive savings (e.g., lighting hours of use) for the same measures, with savings estimates varying by as much as a factor of two to more than ten across TRMs for the same measure. The main drivers in variances are: (1) source of savings (building simulation versus engineering algorithm), (2) differing baseline assumptions (e.g., used of common practice versus preexisting conditions, hours of use, weather, prevailing codes), and (3) parameters included in algorithm (e.g., use of heating, ventilating, and air conditioning [HVAC] interaction factor for lighting). In summary, many of the wide variations in values are expected due to regional differences; however, other variations are not understood and may not be justified.
48 Jayaweera 2012.
STANDARDIZING CALCULATION METHODS
An important objective for improving the accuracy and reliability of TRMs is to enhance their uniformity by standardizing calculation methods and providing transparency of documentation for the assumptions, values and factors used. This is a goal that this guide hopes to support.

June 2017 www.seeaction.energy.gov 42
Figure 3.2. End-use classifications contained within six Midwest TRMs, by customer sector (Source: MEEA 2017)
The following are brief descriptions of five state TRMs and two regional TRMs that are currently in place. These are provided only as an indication of the range of the content, structures, and processes used for developing TRMs.
Arkansas Technical Reference Manual.49 The Arkansas TRM is summarized in three separate volumes. It is developed through a collaborative process that incorporates feedback from the seven investor-owned gas and electric utilities, stakeholders, program implementers, and evaluators. This group is known as the Parties Working Collaboratively or PWC. The PWC develops and recommends the TRM updates, which are then approved by the Public Service Commission.
The TRM comprises three separate volumes, each with a clearly defined purpose. Volume 1 is the Evaluation Measurement & Verification Protocols, which describes the types of information that must be collected to conduct a comprehensive examination of a program’s overall effectiveness, the recommended frequency for conducting these program evaluations, and the key metrics that must be reported during these evaluation activities. These EM&V protocols cover a broad range of evaluation topics including:
• Program tracking and database development and management
• Process evaluation guidance
• Verification and ongoing modification of deemed savings values
• Determination of accurate net program impacts
• TRM updating process and timing
• Roles and responsibilities of the independent evaluation monitor
49 Arkansas Public Service Commission 2016.

June 2017 www.seeaction.energy.gov 43
• Calculating leakage for lighting programs
• Calculating the effects of behavioral programs
• Calculating non-energy benefits for other fuels, water savings, and operations and maintenance savings from energy efficiency programs.
Volume 2 contains deemed savings values for gas and electric energy annual usage as well as coincident peak electric demand savings and peak day gas savings. Volume 3 contains supporting appendices on a variety of topics used to estimate deemed savings. The Arkansas TRM protocols also provide detailed guidance on a number of critical issues, such as the level of rigor required when assessing NTG ratios.
Illinois Statewide Technical Reference Manual for Energy Efficiency.50 The Illinois TRM is contained in a series of PDF documents covering specific sectors (residential, commercial, and industrial, and cross-cutting measures, including behavior savings adjustments to account for persistence and statewide NTG methodologies), with a separate overview document containing background and context. The TRM’s purpose is to provide transparency and consistency in calculating capacity savings and energy savings (both gas and electric) for efficiency programs run by the state’s largest investor-owned utilities. It is used in a number of ways, including to:
• Serve as a common reference point for efficiency program stakeholders that provides transparency to all parties regarding savings assumptions and calculations and the underlying sources of those assumptions and calculations
• Provide a consistent basis for savings calculations, and to create stability and certainty for utilities as they make program design and implementation decisions
• Inform total resource cost test calculations (although actual benefit-cost calculations are not part of the TRM)
• Recognize gaps in robust, primary data for Illinois that can be addressed in evaluation efforts.
• Support coincident peak capacity savings estimates (for electricity)
• Document standardized NTG methodologies for use by the Illinois evaluators.
The Illinois TRM is updated annually.51
Massachusetts Technical Reference Manual for Estimating Savings from Energy Efficiency Measures.52 The Massachusetts TRM, which is available in a PDF format, is a reference manual that provides methods, formulas, and default assumptions for estimating electricity and natural gas, energy and peak demand, and other resource and non-energy impacts (such as water savings or operation and maintenance cost savings) resulting from efficiency measures. It also includes some deemed savings values for some measures. Within the TRM, efficiency measures are organized by the sector for which the measure is eligible and by the primary energy source associated with the measure. The two sectors are residential (including low-income) and commercial/industrial. Each measure is presented in its own section as a “measure characterization.” The measure characterizations provide mathematical equations for determining savings (deemed calculations or algorithms), as well as default assumptions and sources, where applicable. The parameters for calculating savings are listed in the same order for each measure. Data assumptions are based on Massachusetts data when available.
50 Illinois Energy Efficiency Stakeholder Advisory Group (SAG) 2017. 51 Illinois Commerce Commission 2012. 52 Massachusetts Electric and Gas Energy 2015.

June 2017 www.seeaction.energy.gov 44
When Massachusetts-specific data are not available, assumptions may be based on (1) manufacturer and industry data, (2) a combination of the best available data from jurisdictions in the same region, or (3) credible and realistic factors developed using engineering judgment. The TRM will be reviewed and updated annually to reflect changes in technology, baselines, and evaluation results. Along with program administrators in Rhode Island and Connecticut, Massachusetts administrators have been developing an online Technical Reference Library that will allow for user navigation and PDF report generation.
Minnesota Technical Reference Manual.53 Minnesota’s TRM is published in three very different formats. It is delivered in the traditional PDF format, as a set of live calculators on a website, and is available for direct integration with utility tracking systems. All formats include deemed calculations and deemed variables and factors. Minnesota is one of a very few states that also maintains an online TRM calculation tool. As described in the Minnesota TRM, its purpose is to put forth standard methodologies and inputs for calculating the savings impacts and cost-effectiveness of energy Conservation Improvement Programs (CIPs) in Minnesota. The TRM also documents the calculations that are embedded in models for real-time savings calculations and tracking that is available to all Minnesota utilities on ESP®.54 The TRM is not intended to define a single set of approved calculators or calculation methods; rather, the TRM is a standard set of methodologies and inputs that CIP administrators may reference when developing, implementing, and reporting on CIP programs and a software tool for utilities to build, manage, verify, and share their own savings calculators. Each measure included in the TRM represents a preapproved calculation method when correctly applied in a program. While utilities are encouraged to use the TRM measure designs and calculators, utilities may propose, with justification, variations that reflect different program designs or enhanced calculation methods that will result in more accurate savings estimations. Utilities may also use the TRM to generate tables of unitary “deemed savings” values for predefined pre- and post-equipment combinations.
Texas Technical Reference Manual.55 The purpose of the Texas TRM is to provide a single common reference document for estimating energy and peak demand savings resulting from the installation of energy efficiency measures (EEMs) promoted by utility-administered programs in Texas. The document is a compilation of deemed savings values previously approved by the Public Utility Commission of Texas (PUCT) for use in estimating savings for EEMs. The TRM also includes standardized M&V protocols for determining and/or verifying energy and demand savings for particular measures or programs. The data and methodologies in the TRM are to be used by program planners, administrators, implementers, and evaluators for forecasting, reporting, and evaluating energy and demand savings from EEMs installed by Texas Investor-Owned Utility programs. The statewide EM&V contractor, selected by the PUCT, is tasked with reviewing the TRM at least once per year. As part of this review, the EM&V contractor will recommend TRM revisions. Any utility or other stakeholder may also request revisions with the provision of documentation for the basis of a modification. There is a defined process by which the EM&V contractor, PUCT staff, utilities, and other stakeholders review modifications. Commission staff approves the Texas TRM.
53 Minnesota Department of Commerce, Division of Energy Resources, Version 2.1, December 15, 2016. Minnesota Department of Commerce. http://mn.gov/commerce/industries/energy/utilities/cip/technical-reference-manual/. 54 ESP® is a cloud-based software application for energy efficiency program management and reporting developed by Energy Platforms, LLC, with funding from the Minnesota Department of Commerce. ESP is launched from www.energyplatforms.com. ESPCalcs graphical design tool allows users to build simple and/or complex calculators. One can build any number of calculators, including electric/gas/water savings, rebate, emissions, project ROI, etc. ESPCalcs includes formal versioning and storage for supporting documentation. ESPCalcs integrates with tracking systems, portals, and websites. All Minnesota utilities are granted free access to all features within ESP. 55 Public Utility Commission of Texas 2014.

June 2017 www.seeaction.energy.gov 45
The RTF does not have regulatory authority. The Northwest Power and Conservation Council (NWPCC) established an RTF Policy Advisory Committee (RTF PAC) composed of Bonneville Power Administration (BPA), utilities, the Energy Trust of Oregon (ETO), commission staff, and public interest stakeholders to advise the NWPCC on the RTF’s annual work plans and budget priorities. Northwest RTF members are appointed for three-year terms and are selected by the NWPCC for their technical expertise (selection is not constituency-based), with technical analysis and staff supported by voluntary contributions from the BPA, the region’s largest utilities, and ETO.
Northwest Regional Technical Forum.56 The Northwest Regional Technical Forum (RTF) was formed by the Northwest Power and Conservation Council (NWPCC) in 1999 in response to a request from Congress. The Northwest RTF is charged with developing and providing reliable estimates of savings from efficiency activities. A major function of the RTF is developing and updating transparent EM&V methods for specific EEMs. The RTF focuses on four savings estimation methods:
• Unit energy savings: deemed savings values
• Standard protocols: deemed calculation methods for common, well-defined efficiency measures
• Custom measure protocols: methods for specialized efficiency measures or applications
• Program impact evaluations: methods for determining program level savings
The RTF website has links to downloadable databases of deemed savings values (referred to as unit energy savings) and deemed calculators (referred to as standard protocol) with supporting work papers and data with decisions made by the RTF with regard to the published information. Also available are the RTF guidelines that indicate how the RTF selects, develops, and maintains approved methods for estimating savings, measure costs, and lifetimes. In these guidelines, the RTF established four categories of measures/quality standards that vary in the degree of reliability due to underlying differences in availability of supporting data and analysis. Ranked from most to least reliable, these include proven, provisional, planning, and small saver.
Each measure adopted by the RTF has a “sunset date,” installation specifications, and delivery verification guidance. The “sunset date” determines when the measure will be reviewed. Installation specifications detail how to install the measure in order to achieve its deemed savings value. Delivery verification guidance is specified for each measure to help evaluators and program implementers establish requirements for verification.
Mid-Atlantic Technical Reference Manual. 57 The Mid-Atlantic TRM provides a common reference document for estimating energy efficiency impacts from significant measures offered by programs within three neighboring jurisdictions: Delaware, Maryland and the District of Columbia. This TRM is publicly available in a PDF format and provides methods, formulas and default assumptions for estimating electricity and natural gas, energy and peak demand and other resource.
The TRM also provides values for some non-energy impacts such as water savings and operation and maintenance cost savings, associated with efficiency measures. Assumptions are provided for various locations within the region. Incremental costs are also included in the TRM. Efficiency measures are organized by sector, end use and program type. Data assumptions are based on Maryland, Delaware and District of Columbia data where available. The TRM is reviewed annually and updated to reflect changes in codes, standards, programs and available evaluation results. This TRM documents measures that are significant contributors to the portfolios and includes some measures or programs that are somewhat forward looking. It was developed and is updated in a consensus-
56 Regional Technical Forum. About the RTF. https://rtf.nwcouncil.org/about-rtf. 57 Northeast Energy Efficiency Partnerships (NEEP) 2016.

June 2017 www.seeaction.energy.gov 46
based process that brings together program administrators, regulatory staff, evaluation advisors and consultants, and program implementers and has benefitted from being conducted within the context of a regional energy efficiency organization, in this case the Northeast Energy Efficiency Partnerships regional EM&V forum.
3.2. TRM Content Options
As listed in Chapter 1, TRMs generally provide deemed savings values, variables, factors, and calculations, and the associated materials that support the estimation or documentation of the impacts of EEMs. Typically, the information in TRMs reflects agreements between efficiency program administrators and regulatory oversight bodies and is used by administrators in their interactions with implementation contractors and end users. Thus, the efficiency stakeholders tend to rely heavily on the information in the TRM that addresses their jurisdictions. For example, a fully deemed savings value indicates that no additional measurements beyond verification of installation of a measure would be necessary for the savings to be accepted by all the parties involved. This implies that what is included in the TRM needs to be well-researched and documented so that these entities are using the best information possible.
The content of TRMs depends on the following.
• What measures are included and the variety of measure characteristics and applications that are covered (such as different building types, locations, climate zones, equipment interactions, fuel types, and implementation mechanisms, e.g., direct install, point of sale rebates, new construction).
• Whether fully deemed savings values, partially deemed savings values, and deemed calculations are included.
• The extent to which the different users of the TRM want, or need, documentation on each specific efficiency measure.58
• Resources available to prepare the TRM.
In practice, the measures that are included are the controlling factor in setting the structure of a TRM, as each measure type and the applications and variations that are covered in the TRM determine how the savings are to be indicated. In determining how measures are characterized (i.e., the granularity of deemed savings measures and the scope of deemed savings calculations), it is important to consider how measures will be delivered and tracked by programs. For example:
• For standard appliances (such as washing machines, dishwashers, or refrigerators), a set of simple, fully deemed savings values or a simple deemed savings calculation that results in partially deemed savings values, with required input on appliance capacity, may be all that is required.
• For compact fluorescent and LED lamp measures, the TRM may simply consist of tables of deemed savings values per lamp wattage (e.g., 30 kWh/year savings for an 8-watt LED). However, if lighting efficiency measures will be delivered through both retail rebates and direct install programs, unique deemed savings value tables will be required for each delivery method.
• For weatherization measures, the TRM may include a table of per-unit (e.g., per linear foot of weather stripping or square feet of R-19 insulation) deemed savings values for different weather zones in a state and by heating system type.
58 Any TRM should contain documentation supporting the basis of the information contained in it, such as the assumptions, data sources, calculations, etc.; however, the documentation also may contain either generic information applicable to all the included efficiency measures within a given category (e.g., commercial lighting) and/or information specific to each measure.
June 2017 www.seeaction.energy.gov 47
• For commercial lighting or motor retrofits, the TRM may include no deemed savings values but deemed calculations with deemed variables/factors and instruction on what field data are required to determine savings.
In summary, as shown in Figure 3.2, truly prescriptive measures tend to have only fully deemed savings values indicated in the TRM. As the measures become more customized (unique in their application and attributes), however, the occurrence of deemed calculations and multiple variable values and factors become more prevalent, resulting in partially deemed savings values or purely site- or project-specific calculated values.
3.3. TRM Structure Options
Most TRMs begin with an introduction section (or sections) describing its purposes and presumed or authorized applications. In addition, some provide information on the TRM’s development and approval process; for example, if it was approved by a jurisdiction’s utility regulatory commission. There also may be lists of guiding principles, decision criteria and values, assumptions, etc. that are common to all or most of the measures covered in the TRM. As discussed in Chapter 4, including such an introductory section is highly recommended.
The introductory sections are usually followed by the section with individual or groupings of measure information. Most TRMs organize the measure information on a measure-by-measure basis and often by the market segment (e.g., residential and commercial) in which the measures are applied. Information presented for each measure in the TRM tends to be standardized and may reflect either fully deemed savings values, deemed calculations, or deemed variables and factors (which may be used for partially deemed savings values). For example:
• A measure type may require the user to select the appropriate input value from a list of input options (e.g., building types or typical weather data choices for measures installed in different climate zones) for a given parameter in the savings calculation. If the TRM asks the user to select the input, it provides look-up tables of allowable values.
• A set of input parameters may depend on building type and a range of values is given for each parameter, with only one value appropriate for any specific building type.
If no table of alternative inputs is provided for a particular value or factor, then either a single fully deemed savings value is used or the measure’s savings must be derived using a deemed calculation requiring that site-specific input variables and factors be obtained (e.g., measured) on a case-by-case or project-by-project basis.
Table 3.1 is a simplified example outline of a TRM.

June 2017 www.seeaction.energy.gov 48
Table 3.1. Simplified TRM Outline
i Document Information • TRM title
• Date
• Jurisdiction applicability
• Time frame of applicability (e.g., 2016–2017)
• Author(s)
• Collaborative participants (if any)
• Approving entity (if any) and date of approval
I TRM Purpose
II Protocols • Evaluation protocols used for development of TRM
• Guidelines for using the TRM and updating process
III Glossary
IV Residential Energy Efficiency Measure Categories • Lighting measures
• Space heating measures
• Space cooling measures
• Building envelope measures
• Water heating measures
• Appliances measures
• Plug load measures
V
Nonresidential Energy Efficiency Measure Categories • Lighting measures
• Space heating measures
• Space cooling measures
• Building envelope measures
• Water heating measures
• Motor measures
• Plug load measures
VI References and Documentation
For each efficiency measure, characterization (i.e., a unique set of descriptors of a measure’s major attributes) information is typically presented in a standardized format with common components. This is generally done not

June 2017 www.seeaction.energy.gov 49
only to ensure consistency across measures, but to permit users to more easily sort and select measures of interest. Measures that have a higher level of complexity may have additional components, and will also follow the same organizational format, flow, and function. The following set of annotated bullets provides an example of how to prepare descriptions of a measure’s characterization in a TRM with deemed savings values:59
• Sector and TRM Measure Name. The market sector, end use application (e.g., lighting, ventilation, heating), and TRM measure name are defined.
• Measure Overview and Applicability Conditions. This is a concise characterization of the measure that includes characteristics such as the measure category, applicable building types, fuels affected, implementation strategy/application (e.g., retrofit, replace-on-burnout), program delivery method, deemed savings type (value or calculated), and the savings methodology (e.g., engineering estimation, calculator, building simulation, billing analysis).
• Measure Description. This is a more detailed description of the measure, including the type of baseline (e.g., common practice or preexisting condition) and specific baseline condition (e.g., efficiency level, technology, performance), and the high-efficiency condition. Any special conditions, scenarios, installation specifications, or required technology/performance certifications or relevant codes and standards are also described in this section.
• Energy and Demand Savings Methodology. This section covers the parameters, equations, assumptions, and reference sources that are used for the energy and demand savings for the measure. Subsections are used to describe and illustrate the details, such as the following.
o Savings Calculation Algorithms and Input Variables. Provide equations and parameters that are used for the deemed savings values calculations, and provide an explanation and references for all. This section would also contain any look-up tables of stipulated values that are used for the calculations.
o Deemed Energy and Demand Savings Value Tables. This section includes deemed energy and demand savings values developed using the algorithms and look-up table parameters. If site-specific inputs or equipment specifications are required, then a statement explaining that will be included in this section rather than tables of savings values.
o Additional Calculators and Tools. If a calculator or other tool is available and typically used for calculating measure savings, then that tool and/or tools would be briefly described in this section.
o Measure Life and Lifetime Savings. This section notes the EUL and its source, and describes how lifetime savings should be calculated.
• Additional Parameters. This section is used for unique, measure-specific parameters that affect the savings calculations but are not currently included in the algorithms.
• Program Tracking Data and Evaluation Requirements. This section specifies the recommended list of primary inputs and contextual data needed for evaluation and proper application of the savings, including any delivery verification requirements. For example, the application of interactive HVAC factors should, at a minimum, require tracking the space conditioning type in which a lighting system is used (air-conditioned or low/medium temperature refrigerated).
• References and Efficiency Standards. All references and citations are listed, including relevant standards (e.g., used for baseline determination).
• Document Revision History. Tracking of the revision history of the measure characterization is included.
All of the above content might be contained in the body of the TRM, or some portions, such as the methodology, assumptions, data, referenced standards, etc., may be included in accompanying work papers.
59 Modified from Public Utility Commission of Texas 2014.

June 2017 www.seeaction.energy.gov 50
For comparison with the above outline, the following is another example outline of a measure characterization. This outline may be more applicable to a TRM that focuses on deemed calculations (and partially deemed savings values) rather than just fully deemed savings values.60
• Measure name and code
• Measure description
• Definition of efficient equipment
• Definition of baseline equipment
• Deemed lifetime of efficient equipment
• Persistence
• Deemed measure cost/incremental cost
• Load shape
• Coincidence factors
• Algorithms for calculation of energy savings:
o Electric energy savings
o Electric coincident peak demand savings
o Natural gas savings
o Peak day natural gas savings
o Interactive effects.
• Non-energy savings (e.g., water and emission impacts) as appropriate
• Deemed operations and maintenance cost adjustment calculations
• Underlying support and data sources, referenced for all assumptions.
Source document references cited in TRMs are typically linked to data spreadsheets, primary research reports (such as completed evaluation reports that used applicable measurement data for the subject measures and jurisdiction), secondary reports, or other jurisdictions’ TRMs.
3.4. TRM Format Options
TRMs tend to be published on publicly accessible websites in one of three formats.
• Documents
o PDF documents (most common); for example, the Arkansas TRM: www.apscservices.info/EEInfo/TRM6.pdf or Iowa TRM: https://iub.iowa.gov/energy-efficiency
o Microsoft Word documents (less common); for example, the Pennsylvania TRM: www.puc.pa.gov/filing_resources/issues_laws_regulations/act_129_information/technical_reference_manual.aspx or the Mid-Atlantic TRM: www.neep.org/mid-atlantic-technical-reference-manual-v6
• Downloadable spreadsheets; for example, Michigan’s TRM: www.michigan.gov/mpsc/0,4639,7-159-52495_55129---,00.html or Northwest RTF’s TRM: https://rtf.nwcouncil.org/measures
60 Private communication with Cheryl Jenkins, Vermont Energy Investment Corporation, November 16, 2016.

June 2017 www.seeaction.energy.gov 51
• Online Web portals accessed through a graphical interface; for example, Minnesota’s CIP Energy Savings Platform: www.energyplatforms.com/MN.aspx
Other jurisdictions (e.g., California) are considering moving in this direction in the future.
There are two important functional differences between document-based TRMs and spreadsheet or database format TRMs. Document-based TRMs may be much harder to navigate, to update, and to extract specific values from in order to use them in calculation and tracking systems. Spreadsheet or database formats may not contain the narrative, textual information about the measures (designed to help ensure that the characterization is being applied correctly), and may not include as much information about algorithms, calculation methodologies, applica-tion cases, references, and identification of variables that require site-specific input that a document usually contains.
The document formats generally are more manageable when the TRM contains a more limited number of measures (i.e., hundreds rather than thousands), although some jurisdictions maintain a large number of measures in document form to provide transparency and to facilitate stakeholder review.61 Document formats tend to follow the form of the two outlines described at the end of the prior subsection on TRM content, and can be applicable for all TRM information, including fully and partially deemed savings values, variables, factors, and calculations, and the associated documentation. TRMs that contain large numbers of measures, or many permutations on values for even a limited set of measures, generally are in spreadsheet or database formats to facilitate both user access and administration.62
The volume of technologies present in an efficiency program, however, may exceed what is useful to present in a TRM. To strike a balance between transparency, EM&V rigor, and user-friendliness, a TRM may find some economy by describing a single high-level measure (e.g., “Commercial LED lighting”) with its associated baseline, high efficiency case, and savings algorithm. Thus, within an efficiency program, many devices that may vary in sizing or application may fall under that measure’s classification.
An example of an exceptionally large database is the California Database for Energy Efficiency Resources (DEER),63 which contains thousands of residential and nonresidential measures. The California Public Utilities Commission (CPUC), which oversees DEER, has developed a software tool, the “Remote Ex-Ante Database Interface,” that allows users to examine DEER on the Internet.64 In addition to the official database that catalogues the data used for program tracking, there is also a preliminary database that allows users to explore measure data as it is developed. DEER contains estimates of a measure’s natural gas and electrical gross impacts, incremental cost, and EUL. DEER also has datasets in varying temporal resolutions and multiple energy and resource units, and includes weather- and climate-related variables for technologies that are weather dependent. The savings estimates are based on engineering calculations, building simulations, measurement studies and surveys, econometric regres-sions, or a combination of approaches; some of which are documented in separate work papers prepared by utili-ties. As of the publication date of this guide, the California Technical Forum (CalTF) has initiated a project to develop a California electronic TRM that would be a statewide repository of all of California’s deemed efficiency measures, which could replace current systems used to track information about deemed measures, including DEER.65
61 The California Technical Forum (CalTF) has prepared a technical paper on considerations for the appropriate level of measure complexity that should be employed in TRMs. See CalTF 2016a. 62 Database TRMs typically refer to all possible permutations of a measure as individual measures, whereas the document based TRMs may include the either very large lookup tables and/or algorithms the user must use to calculate each measure permutation. For example, the Illinois TRM document includes “thousands of measures” in lookup tables showing every possible combination of commercial and industrial lighting building type, program type, baseline wattage, ballast type, and efficient wattage. 63 California Public Utilities Commission 2017. 64 California Public Utilities Commission. READI (Remote Ex-Ante Database Interface). www.deeresources.com/index.php/deer-versions/readi. 65 CalTF 2017.

June 2017 www.seeaction.energy.gov 52
3.5. TRM Development and Updating Process Options
3.5.1. TRM Development
Two forces have driven the development and use of TRMs across the country. Many TRMs have been initiated by action of a utility regulatory agency to satisfy a specific order or part of an overall EM&V framework66 that requires impact evaluations of efficiency programs implemented by utilities or third-party administrators. Other TRMs have been initiated by state or regional stakeholders, including utilities, when they determine that the information management and transparency benefits of TRMs outweigh the costs of coordination (see Chapter 1).
Once the decision to develop a TRM has been made, the initial step is to agree upon a work plan or scope of work that will guide its preparation. These work plans generally include a list of deliverables describing the TRM’s content as well as a schedule and often a budget. A core element of these work plans concerns where the data and calculations to be contained in the TRM are to come from—from recent or new data and analysis (e.g., updated M&V studies), prior versions of the same TRM, or data from other sources, such as other jurisdictions’ TRMs.
Work plans are typically developed in collaboration with consultants selected through a competitive process by the entity overseeing or sponsoring the TRM. The entity charged with overseeing the development of a TRM may be a public utility commission, a state energy office, a utility, another efficiency program administrator, a regional organization, or a specially designated stakeholder group representing these and perhaps other parties with an interest in the TRM development process. Figure 3.3 illustrates an example decision tree, prepared by stakeholders in Kentucky, that might be followed when developing a TRM.
66 A framework is a primary document that lays out EM&V principles, metrics, allowable methods, net versus gross savings issues, reporting requirements, schedules, and the roles and responsibilities of various entities. An EM&V framework document tends to be “fixed” but can be updated periodically and often sets the expectations for the content and scope of other EM&V documents. These other EM&V documents can include annual portfolio and statewide evaluation reports produced by state agencies, utilities and/or independent evaluators charged with producing EM&V results, and TRMs.

June 2017 www.seeaction.energy.gov 53
Figure 3.3. Kentucky Technical Reference Manual decision tree (Source: MEEA 2016)

June 2017 www.seeaction.energy.gov 54
Once the process for developing a TRM is underway, the actual development of a TRM requires multiple decisions on technical issues. Resolution of these issues will establish the policies and decision criteria used to create deemed savings values or deemed calculations and may also set in place the rules for estimating measure lifetimes and costs (as well as any other needed values or factors). Table 3.2, developed for CalTF, 67 lists many threshold technical issues that generally must be considered when preparing a TRM. Some jurisdictions have codified their decisions on these technical issues into written guidelines to ensure greater consistency in their processes and to improve transparency for stakeholders. 68
Table 3.2. Example Threshold TRM Technical Issues
Individual Measure Development
What is a discrete measure?
When should a measure be deemed custom or “hybrid”?
When should measure savings be determined through building modeling vs. engineering algorithms?
How complex should measures be, and when should parametric analysis be conducted to identify a reasonable number of measure permutations without creating “false precision”?
When and how does measure characterization need to vary based on field conditions and/or implementation strategy?
Create a standard format and data structure for all measures.
Develop guidelines/standard approaches for determining “best available data,” “industry standard practice,” and other recurring technical issues.
Establish written quality assurance/quality control process and standards to ensure high quality, error-free measure characterizations.
Identify a process for prioritizing measures for development or review.
Parameter Development
Identify which measure parameters most affect key measure values (e.g., savings and cost-effectiveness); prioritize resources to refine the most impactful inputs/parameters.
Identify which parameters need more certainty—develop a data collection plan to refine values during program implementation.
How should interactive effects be derived and applied?
Identify how and whether program implementation strategy will affect the parameter.
How should EULs be determined and updated?
67 Beitel et al. 2016. Page 11 68 Northwest Regional Technical Forum 2015.
Table continued on the next page.

June 2017 www.seeaction.energy.gov 55
TRM Structure
How should technologies or measures be grouped or organized?
What tables/appendices are needed that contain information used across multiple measures?
Should the TRM be a hard copy or housed in an electronic repository (emerging trend)?
Determine what source(s) will be used for building prototypes.
Identify information that will be used for multiple measures; create readily accessible appendices and/or look-up tables with clear, well-documented common methods, assumptions, and values, including:
1. Building prototypes used to model energy and demand savings, including the sources for building prototype assumptions.
2. Climate zones or weather stations. 3. Interactive effect values, which may vary based on utility and climate zone. 4. Non-energy benefits (NEBs), in jurisdictions that include NEBs. NEBs often vary by
measure, but also may be the same across a class of measures (such a low-income weatherization measures).
5. Standard formulas for calculating values consistently, such as the coincident demand factor formula.
6. Load shape curves for common measures and the sources for those load shape curves.
7. Common variables, including hours of operation, coincidence factors, flow rates, temperature (water), interactive effects, heating and cooling degree days.
8. Common approach to defining how peak demand savings should be calculated.
Building Modeling
Identify modeling tool(s) that will be used to model measure savings.
Identify or construct building prototypes that will be used for modeled measures. Ensure building prototypes reflect jurisdiction-specific building stock and operational characteristics. Building models also need to have source documentation for all key assumptions to ensure they are appropriate representations of jurisdiction-specific building stock and operational characteristics.
Determine a consistent process for validating modeled measures.
Process
Determine the process by which participants will be selected for the technical collaborative; include regulatory staff.
Establish process rules and a website or other public repository to ensure the work is public and transparent.
Source: Beitel et al. 2016
An important element of the TRM work plan is the role of stakeholders and how open the TRM development process will be to stakeholder input. States and regions that incorporate stakeholder advisor groups into the TRM process include the Arkansas, Connecticut, Illinois, Massachusetts, and Rhode Island TRMs; the Mid-Atlantic TRM; and the Northwest RTF.69 Including stakeholder involvement while addressing potential conflicts of interest is another recommendation discussed in Chapter 4.
Whether there is formal approval of the TRM by a public utilities commission (e.g., Colorado, Michigan, and Minnesota) or other regulatory authority, or just by their staff (e.g., Texas), also varies across the country. Generally, there is engagement by regulatory staff, from being part of a collaborative to directly guiding the TRM
69 Jayaweera et al. 2012.

June 2017 www.seeaction.energy.gov 56
technical consultant through a contractual management process. Active regulatory staff participation in the TRM development process tends to be important, and is recommended, because regulators ultimately will be asked to rely on the information in the TRMs, and staff participation fosters timely, coordinated, and informed regulatory review of resulting values.70
One frequently observed approach in jurisdictions developing TRMs for the first time is the adoption of information from TRMs in other jurisdictions or from secondary resources, incorporating modifications for climate or other local variations. On the positive side, this is an inexpensive approach that allows relatively expedient development of a TRM. However, this approach can also perpetuate errors or outdated information. In some states that have recently developed TRMs by borrowing from multiple sources, this approach resulted in the sources not always being properly documented or the use of circular references to other TRMs and not to primary data. Such issues could be minimized if TRMs used more consistent approaches and included more transparent documentation of their sources. This would increase the overall accuracy of TRMs, resulting in greater comparability across jurisdictions and higher confidence in the reported savings.71
The development of deemed savings values is frequently done using well-established engineering calculations (such as those from the DOE’s Uniform Methods Project [UMP]).72 However, another approach is the use of detailed hourly whole-building, computerized energy simulation models. One of the most widely used simulation programs is EnergyPlusTM,73 the DOE’s whole-building simulation model. EnergyPlus is designed to model all of the major factors that affect a building’s energy use, addressing building envelope, mechanical systems, lighting systems, and controls. As a publicly funded tool, EnergyPlus is an open-source and thoroughly documented model, providing a degree of transparency that is consistent with recommendations made in this guide.
Use of building energy use simulation modeling has the benefit of being able to consistently analyze multiple scenarios involving multiple variables and factors (such as operating hours, baselines, and weather). However, performing and reviewing the large-scale analyses needed to establish savings estimates, and the range of contexts to which they apply, can be labor-intensive and error-prone.76 To address these shortcomings, new software tools are being developed to improve the operations of energy efficiency ex-ante estimating simulation tools by supporting process automation, improving transparency, making project review more efficient, and expanding the pool of program support options. One of these tools is OpenStudio® (see text box).
3.5.2. Updating TRMs
To ensure that the information within a TRM continues to be as accurate and relevant as possible, most jurisdictions define a one- to three-year cycle for
70 Beitel et al. 2016. 71 Jayaweera et al. 2012. 72 Violette and Rathbun 2014. 73 DOE. EnergyPlus Energy Simulation Software. http://apps1.eere.energy.gov/buildings/energyplus/. 74 Roth et al. 2016. 75 CalTF 2016b. 76 Roth et al. 2016.
OPENSTUDIO®
OpenStudio® is a cross-platform (Windows, Mac, and Linux) collection of software tools to support whole-building energy modeling using EnergyPlus (https://energyplus.net/) and advanced daylight analysis using Radiance (https://www.radiance-online.org).
OpenStudio® helps automate the development of simulations (and thus of deemed savings values), allowing for more efficient analyses of multiple scenarios and variables, and cost-effectively expanding the number and range of deemed savings values that can be used in an efficiency program. OpenStudio® also facilitates the review process by making the assumptions associated with an energy conservation measure and its application explicit and succinct.74, 75

June 2017 www.seeaction.energy.gov 57
reviewing their TRMs, while others, like the Northwest RTF, continually update measures based on measure-specific review cycles. These update processes add new measures, update existing measures, and remove measures no longer used or valuable. This process reduces the potential that data and estimates will become outdated due to changing baselines and technologies. Even if the nature of an EEM does not change, these reviews are needed because there can be advancements in methods (e.g., engineering equations or building modeling), new data on energy-related factors, and other measure parameters (such as incremental measure costs, load shape, and, less frequently, EULs).
Current industry practice for maintaining TRMs involves updating existing TRMs with new information, preferably based on current data and analyses, with regard to one or more of the following.
• Adding additional measures for which reliable deemed savings values or deemed calculations are available for existing or new measure types (e.g., a new lighting technology).
• Updating existing deemed savings values or deemed calculations based on improved data (e.g., recent evaluation data) or changing baselines (e.g., changes in codes or common practice).
• Removing measures from the TRM as they are no longer being implemented or the new information indicates that the use of deemed savings values or deemed calculations is no longer appropriate or necessary (e.g., if more reliable EM&V methods such as M&V 2.0 are applicable to the measure).
• Adding new metrics or parameters to the TRM, such as adding deemed environmental factors (e.g., factors for water savings or avoided emissions) or updating cost data (e.g., incremental costs) or NTG ratios (see example in Figure 3.4).
• Making other changes deemed appropriate by the stakeholders and TRM managers (e.g., changes in format of data presentation).
Recommendations in Chapter 4 discuss how these considerations are dealt with in the TRM updating processes.

June 2017 www.seeaction.energy.gov 58
Figure 3.4. Example process flow chart for updating net-to-gross ratios (Note: NTG is the abbreviation for “net-to-gross”)77
77 Arkansas Public Service Commission. 2016. Page 55.
Decision Tree for Timing and Selection of Net-to-Gross Research—Arkansas TRM

June 2017 www.seeaction.energy.gov 59
Figure 3.5 and Table 3.3 provide examples of flow charts and schedules for updating a TRM based on the Texas updating process.
78 Northeast Energy Efficiency Partnerships (NEEP) 2012. Page 5. 79 Schiller 2012.
APPLYING TRM UPDATES TO ASSESSMENT OF PROGRAM IMPACTS
Estimates of costs and savings from energy efficiency measures are typically made both prior to program implementation (i.e., projected or ex-ante savings) and post-program implementation (i.e., evaluated or ex-post savings for planning purposes). An issue arises when deemed savings values are used to project and claim energy savings for an energy efficiency measure in a given program year (e.g., based on per-unit savings values in a TRM approved for that program year), but new information arises that indicates the TRM per-unit savings values are too high or too low for the subject measure. The question thus becomes “Should the deemed savings value be adjusted retroactively to the current program year or only applied going forward?”
An example of one approach to this issue is found in the 2014 Mid-Atlantic TRM Updating Process Guidelines: “We recommend recognizing the difference between correcting errors
and updating
parameter values based on new evaluations or research. Error corrections may be applied ex-post, updates stemming from new evaluations or codes and standards applied [to future] ex-ante [estimates]. If ex-post adjustments occur, each jurisdiction may want to consider a process for adjusting or pro-rating implementation goals if impact is significant enough.”78
Other options are discussed in the 2012 SEE Action Energy Efficiency Program Impact Evaluation Guide.79
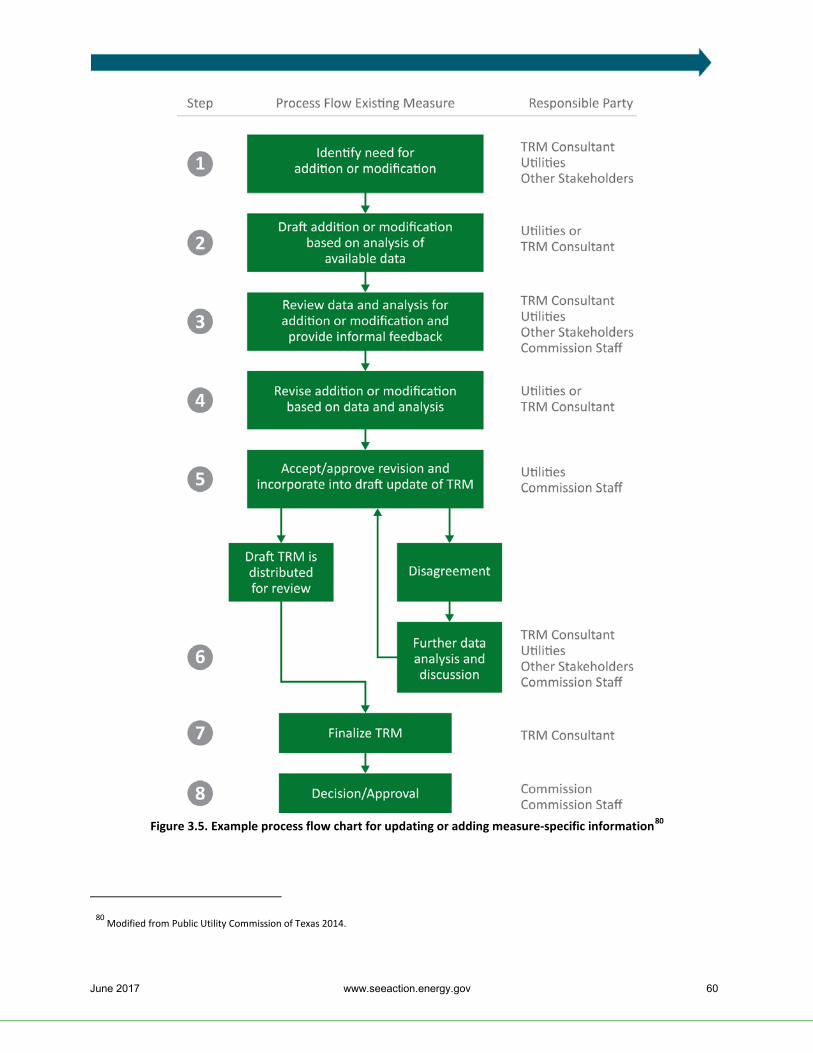
June 2017 www.seeaction.energy.gov 60
Figure 3.5. Example process flow chart for updating or adding measure-specific information80
80 Modified from Public Utility Commission of Texas 2014.

June 2017 www.seeaction.energy.gov 61
Table 3.3. Texas Technical Reference Manual Revision Process Summary Table
Activity Review Period Response Period Timeline
EM&V contractor, commission staff, and utilities discuss and agree on identification and prioritization of updates
N/A N/A Approximately six months prior to TRM finalization date
Draft recommended updates and prioritization to EEIP for review
10 business days 10 business days Four to five months prior to TRM finalization date
Draft measure-specific additions and modifications to primary program year TRM
10 business days 10 business days Deadlines agreed to in TRM Update Tracker. Response period to be completed prior to the draft TRM being submitted to the utilities for review.
Draft of primary program year TRM to utilities
15 business days 15 business days 30 business days prior to EEIP draft distribution date
Draft of primary program year TRM to EEIP
15 business days 15 business days 30 business days prior to TRM finalization date in December of each calendar year
Second draft of primary program year TRM to EEIP (if needed based on substantive edits from the first round of review comments)
10 business days 15 business days If this additional step is needed, the finalization date will be pushed back 25 business days.
Note: EEIP = Energy Efficiency Implementation Project, the Texas stakeholder group Source: Public Utility Commission of Texas 2014.

June 2017 www.seeaction.energy.gov 62
4. Recommendations: Suggested Practices for the Deemed Savings Method and Developing and Maintaining Technical Reference Manuals and Recommendations for Further Research
This chapter provides recommendations regarding the deemed savings method (Section 4.1) and TRM content, structure, and development and maintenance processes (Section 4.2). There is also a concluding section (Section 4.3) with suggestions for future research topics relating to deemed savings and TRM. These recommendations are important, because deemed savings values, deemed calculations, and deemed variables and factors—and the TRMs that document them—are used to assess the impact of a significant portion of the efficiency measures implemented across the country. Recommendations regarding the development and application of the deemed savings method (i.e., using deemed values, calculations, variables, and factors) are presented before discussing TRM recommendations because these are fundamental to the proper application of TRMs. However, there is a necessary overlap between the two sets of recommendations because TRM content, structure, development, and maintenance is intimately tied to application of the deemed savings method.
The overarching goal of these recommendations is to enhance the reliability of deemed savings values, deemed calculations, and related deemed variables and factors included in TRMs. This in turn is intended to improve the confidence that efficiency policy makers, regulators, administrators, and implementers have in the reported impacts of efficiency actions and to thus increase the amount of cost-effective efficiency implemented in the United States. These recommendations also seek to make information more transparent and accessible to their intended audiences as well as to strike a balance between the cost and accuracy of information included in TRMs.
Recommendations in this chapter are made in the form of individual statements with commentary and, in some cases, examples that can support implementation of the recommendations. The recommendations are based on the review of existing TRMs, published reviews of TRMs, and input solicited from efficiency industry experts involved with using, developing, or overseeing TRMs. Most of the experts surveyed are listed in the Acknowledgments section at the beginning of this guide. TRMs and published reviews containing findings, conclusions, or recommendations used in this chapter can be found in Appendix 1 and in References, respectively.
4.1. Deemed Savings Methods Recommendations
This section presents nine recommendations regarding the development and application of deemed savings values and deemed savings calculations, as well as related deemed variables and factors. It is followed by a discussion of these recommendations. These recommendations are primarily aimed at impact evaluation of established efficiency measures with substantial savings potential; other measures that are perhaps just being developed for pilot programs or have negligible savings impacts may not require the same level of attention called for in these recommendations (see text box).
1. Adopt and adhere to clear and transparent guidelines that emphasize using industry standard assumptions and calculation methods,81 current information, an independent peer-reviewed process, and thorough documentation in publicly accessible formats.
81 Although the industry-standard assumptions and calculations for a given measure and application are not necessarily obvious, Appendix 3 provides several protocols and resources that contain established standards, protocols, and other documents that constitute current norms for the efficiency industry in the United States.

June 2017 www.seeaction.energy.gov 63
2. Deemed savings values should be applied to:
• Measures that are well-understood, with documented experience that indicates there is a strong central tendency in the distribution of savings across installations.
• Measures for which savings or calculations can be developed from reliable data sources and analytical methods.
• Measures that fit within well-defined boundary conditions that clearly describe the applications for which the measures’ deemed savings value(s) do, or do not, apply.
• Conditions for which a measure’s application can be verified by the nature of the program design (i.e., direct installation delivery) or through post-installation inspection.82
• Measures for which impacts are not highly dependent upon the application of consistent quality control in their installation.83
• Measures for which impacts are not highly dependent upon customer behavior.
3. Deemed calculations with input variables and factors (e.g., partially deemed savings values) should be applied to measures for which:
• These variables and factors are known to vary widely by project site
• Inputs to site-specific calculations are easily ascertained and verifiable
• “Reasonableness” ranges for site-specific input variables and factors can be built into the calculation process.
4. Deemed savings values and deemed calculations should be based on input assumptions that are realistic and not necessarily conservative or optimistic.84
5. Deemed savings values, variables, and factors and calculations should account for significant interactions with other measures and end uses at the site or facility in which they are installed.
82 For example, savings estimated for a point-of-sale or upstream buy down program for LED lamps might assume the average hours of use for all lighting in a home, adjustments for space conditioning interaction factors across the mix of systems found in a service, and a factor to adjust for lamps that are placed into storage rather than immediately installed. 83 Simple lighting retrofits in which existing lamps and ballasts are switched out for more efficient lamps and ballasts—or motor replacements that improve efficiency—are examples of measures that are not subject to much variation in installation quality. However, lighting and motor control measures and commissioning/retro-commissioning are examples of efficiency activities that can vary in the quality of installation or implementation. Lighting or motor measures can also vary in savings achieved based on the control strategy implemented. 84 Data used to determine impacts typically cannot be specified as a single value but is known to exist in a range. The point of this recommendation is to pick values at or near the middle of such ranges and not at either end (conservative or optimistic) of the range. For example, if commercial lighting in offices is known to have a relatively level distribution of operating hours between 2,000 and 2,800 hours per year, the recommendation would be to use a value of about 2,400 and not 2,000 or 2,800.
DEEMED SAVINGS METHOD FOR PILOT PROGRAMS AND LOW-IMPACT
MEASURES
New measures for pilot programs or measures with minimal savings may not need the level of savings reliability associated with other measures and thus can perhaps be treated differently in their development and use. Thus, the recommendations in this section should not be used to exclude the deemed savings method for measures that have potential future value or that in themselves do not generate a lot of savings, but support overall program objectives.

June 2017 www.seeaction.energy.gov 64
6. Conditions and applications for which each deemed savings value or calculation can be applied should be documented. These include:
• The baseline(s) for which the savings value is applicable (with the baseline defined)
• Measure descriptions and documentation for the application of deemed savings values should include those characteristics (e.g., installation specifications, delivery mechanism, location, capacity, etc.) that determine the measure’s savings85
• Descriptions for the application of deemed savings values should include recommended or required installation verification and other quality assurance procedures to ensure actual and proper measure implementation and to improve the reliability of the assumed deemed savings values
• Justification should be provided if one or more of the following common conditions used to determine applicability is not addressed:
o Climate zone
o Building or facility type (e.g., office building versus hospital, industrial plant versus dairy), and application (e.g., conference room versus private office)
o Vintage (e.g., new, existing, pre-1970, etc.)
o Measure interaction or interactive effects
o Efficiency implementation/delivery mechanism (e.g., direct install versus point-of-sale rebates)
o Efficiency measure characteristics (e.g., capacity, size).
7. Deemed savings values, calculations, factors, and variables should be based on reliable, traceable, publicly available and documented sources of information, such as the following.86
• Prior, preferably peer-reviewed, evaluation studies for the same measures in similar applications, rigorously implemented, and from similar programs in similar—if not the same—jurisdiction, if available
• Standard tables from recognized sources that indicate the power consumption (wattage) of certain pieces of equipment that are being replaced or installed as part of a project (e.g., lighting fixture wattage tables)
• Calibrated computer simulations using publicly available data following established guidelines, such as those in IPMVP and the American Society of Heating, Refrigerating and Air-Conditioning Engineers (ASHRAE) Guideline 14—Measurement of Energy and Demand Savings87
• Manufacturers’ specifications
• Building occupancy schedules
• Data sheets from certification programs (e.g., ENERGY STAR)
• Maintenance logs.
85 For example, LED lamp savings that are based on the “average hours of use in kitchens” might have deemed savings values that are applicable to only “direct install” delivery mechanism/programs. 86 Schiller 2012. 87 American Society of Heating, Refrigerating and Air-Conditioning Engineers. www.ashrae.org.

June 2017 www.seeaction.energy.gov 65
8. When using computer simulation models to develop deemed savings values:
• Use experienced practitioners with expertise in building science and simulation
• Document assumptions and inputs
• Use documented and vetted industry-standard simulation88
• Calibrate models to applicable metered or monitored data.
9. Verification activities, for at least a sample of installed efficiency measures, should confirm that the conditions and applications (e.g., installation specifications) defined for use of the deemed savings values are consistent with the actual conditions under which the measures are implemented in order to confirm proper use of the deemed savings values.
Deemed savings values and deemed savings calculations can be a cost-effective and reliable means for documenting the impacts of efficiency measures, particularly their energy and/or demand savings, if they are used for efficiency measures with well-known and documented characteristics. However, with regard to the applicability of deemed saving values specifically, there are just a minority of measures for which deemed savings values can be used without considering at least one or more applicability conditions related to capacity (e.g., lamp wattage, motor horsepower), application (e.g., an exhaust ventilation fan motor that may run constantly versus a supply ventilation fan that may run intermittently), facility type and use type (e.g., hospitals versus single family homes), implementation strategy/delivery mechanism (e.g., direct install, retail rebate, mid-stream buy down), and geographical location (e.g., climate).
Therefore, a fundamental tenet for correctly using deemed savings values and deemed calculations for partially deemed saving values is to apply them only for applications and conditions for which documentation indicates they are appropriate. For example, it may not be appropriate to use them when there is a significant difference in performance or significant interactive effects (see Chapter 2 and Appendix 2) that cannot be accounted for in the deemed savings values, variables, or factors. Consistent with this tenet is that TRM values are the most reliable when they are reflective of evaluations conducted with measurement-based data and developed from studies conducted for the same measure applications and conditions (i.e., location, climate, building types, and delivery method).
When deemed saving values or deemed calculations are not appropriate, then the use of any of the following likely is necessary:
• Traditional EM&V methods such as standard billing analysis or M&V 2.0 techniques and quasi-experimental research designs
• Customized evaluations that are still consistent with UMP, IPMVP, ASHRAE, or DOE’s Federal Energy Management Program (FEMP) M&V protocols, as described in Appendix 3.
88 Software selection is based on factors such as costs, quality, security, interoperability and flexibility, ease of use, and auditability. For the purposes of EM&V, an advantage of open-source software is that it is auditable because the visibility of the code allows users to see what the code does for aspects such as calculations (physics-based models) and data use and outlier treatment (data-based models). Several physics-based simulation standards are well established and considered standards in the efficiency industry, such as the previously referenced EnergyPlus (which is also free and open source). For physics-based simulation models, various methods exist for evaluating the technical capabilities and applicability of software, such as those described in the ANSI approved, ASHRAE Standard 140—Standard Method of Test for the Evaluation of Building Energy Analysis Computer Programs. Analogously, for data-driven models—which are currently used more for comparison with, versus development of, deemed savings values—Berkeley Lab has developed test procedures to benchmark predictive accuracy (see Granderson et al. 2015; Granderson et al. 2016).

June 2017 www.seeaction.energy.gov 66
Beyond the recommendations and cautions listed just above (and in Chapter 2) regarding the use of deemed savings methods, note that the deemed savings values method can be less expensive to implement than other EM&V methods,89 provide certainty for project and program participants, generally do not require extended post-measure implementation evaluation cycles, and provide, on average, reliable indications of energy impacts. However, as described in Chapter 2, alternatives to deemed savings methods may become more cost-effective and reliable. Thus, the users of deemed savings should acknowledge that deemed savings values are an agreement between parties that savings are stipulated regardless of what occurs and that alternative EM&V methods, as they further develop, can and should be considered versus the widespread application of the deemed savings method.
4.2. Recommendations for Technical Reference Manuals Content, Structure, Development, and Maintenance
This section presents and discusses ten recommendations, with brief discussions regarding the process of creating and maintaining TRMs as well as their content and structure.
4.2.1. Defined Roles and Responsibilities
The roles, responsibilities, and processes for developing, approving, and maintaining a TRM should be clearly defined. While not a consensus opinion, many in the industry believe that state utility commissions should participate in or oversee the development and maintenance of TRMs used for investor-owned utility (IOU) customer-funded programs.
Discussion: The process by which TRMs are developed is critical to reaching agreement by stakeholders so that the information in the TRM is well-understood and sufficiently reliable. TRMs for efficiency programs associated with IOUs, which are regulated by state agencies, need to have “buy-in” by the regulator; and this implies the participation of the regulator in the TRM development and updating processes. Consumer and publicly owned utilities can either develop their own TRMs with their stakeholders or develop them in conjunction with other utilities in their state or region.
Transparency is important in the roles and responsibilities associated with TRM development and updating. Two transparency recommendations that many, but not all, in the efficiency field agree with are (1) that the TRM development and updating process should be publicly accessible, with input allowed from all interested stakeholders, and (2) that TRMs themselves be publicly accessible, i.e., available on a public website. Most stakeholders see such public access as consistent with transparency criteria. In their view, public processes not only can result in broader buy-in to the outcomes, but have the potential to increase the use of TRM data, as stakeholders view it as objective, reliable, and relevant. However, others argue that if other aspects of the development and updating of TRMs are followed, such as the use of skilled and unbiased analyst and independent peer review, that the cost and time associated with public processes and publication are not necessary. To paraphrase one person surveyed, the public oversight is more important than the nature of the specific process used to develop the TRM…that regulatory agencies establish review and/or oversight processes that ensure final decisions are made by parties who are both skilled and unbiased.
4.2.2. Collaborative Processes
It is usually best to develop TRMs with a public, collaborative process. Some practices that support successful TRM collaborative are:
• Members having sufficient technical expertise and time to consider TRM issues, data, and analyses
• Collaborative members having defined roles and responsibilities
89 Although ongoing program impact evaluation costs may be lower, research and evaluation investments still are required to maintain reliable deemed savings methods for existing measures and expand the scope of measures included in TRMs.

June 2017 www.seeaction.energy.gov 67
• Collaborative membership that includes program administrators, implementers, evaluators, and independent technical experts as well as advocates and active regulatory staff participation for those TRMs involving IOU customer-funded programs
• Collaborative members who all agree to adhere to a conflict of interest policy and a membership that also includes, but is not necessarily limited to, representatives who do not have a financial interest in the outcome.90
Discussion: This recommendation is consistent with the opinion of many experts that TRM collaboratives should have a defined membership to ensure regular and active participation, which in turn supports a collaborative’s efficacy. This contrasts with the opinion of others that defined, or selective, membership can be limiting and that collaboratives should be open to all interested parties.
When collaboratives do exist, they can provide a peer review process—a practice generally used in scientific research for ensuring rigor in both data and analysis. Speaking to the advantage of a defined collaborative membership, peer review is particularly enabled when the collaborative comprises qualified technical representatives from different organizations that bring different perspectives, ideas, analytic tools, and data to the discussion.91 Including expertise in TRMs as a requirement for membership in the technical groups will also likely lead to more committed members, analytical rigor, and confidence in the accuracy of a TRM’s measures.
An effective review process is also contingent on data transparency from program administrators. Historical program and utility data can be important inputs to measure characterization and verification. Oversight authorities can stipulate requirements for data sharing to enforce a minimum level of transparency.
In terms of regulatory staff participation, particularly by those with technical skills and experience in managing collaborative efforts, having such participation and even leadership can help provide public oversight, allow all parties to be heard, and ensure that decisions are based on data to the extent possible, with a minimal amount of bias. This oversight role also can be provided by neutral facilitators, but the participation of regulatory staff also helps with acceptance of results by the regulatory commissions.
For more information on efficiency collaboratives see the publication, Energy Efficiency Collaboratives: Driving Ratepayer-Funded Efficiency through Regulatory Policies Working Group.92
4.2.3. TRM Approvals
Regulatory agencies should approve TRMs that will be used by IOUs.
Discussion: Regulatory agency approval creates increased certainty by parties that they can rely upon the TRM’s values and other information during implementation. Approvals can be “presumptively approvable,” implying that if used correctly, the TRM’s information are expected to be accepted in regulatory filings, such as annual efficiency program administrator reports. Agencies may also indicate that the TRMs, while approved, do not have to be used if other EM&V methods are more applicable for individual measures, projects, and programs. A couple of other aspects of approvals are also important to consider when implementing this recommendation:
• Approvals may be by commissions or commission staff. The former provides for more certainty, while the latter can be more expedient and conducive to regular updates.
90 See, for example, the RTF’s Conflict of Interest Policy: https://rtf.nwcouncil.org/about-rtf/conflict-interest-policy. 91 Beitel et al. 2016. 92 State and Local Energy Efficiency Network 2015a.

June 2017 www.seeaction.energy.gov 68
• Commissions may approve a process for TRM development updating or the actual TRM (and update) content. As with the prior bullet, one approach provides more certainty and the other potentially more expediency.
• If a regional TRM is used, see the recommendation below. Then some form of approval by each regulatory commission within the region would be helpful.
4.2.4. Defined Guidance for the Technical Reference Manual
Each TRM should have its own guidance document, preferably agreed to by those participating in the TRM development and indicating decisions on the following topics prior to its initiation:
• Public accessibility
• Guidance on balancing rigor of TRM content with effort (and cost) to develop the content, as well as any weighting of deemed savings values and variables/factors toward expected values or conservative values
• Quality control mechanisms and documentation sufficient for replication of indicated values
• Transparency of the development process
• Baseline definitions
• Characteristics of those preparing the actual TRM content, including independence of those preparing the TRM (and how independence is defined)
• Use of collaborative/review committees for TRM development and updating, and for peer review
• Updating process
• Participation of regulatory staff in the TRM development
• TRM approvals process
• Format (e.g., spreadsheet, database, Web-based, or PDF)
• Level of detail and transparent access for references/work papers.
Discussion: TRM developers attempt to strike a balance between achieving accuracy in the values and other information provided within their TRM while doing so at a reasonable cost and without introducing unnecessary complexity. For many TRMs, the first step in this balancing act is to define, in written guidelines, how measures are selected for inclusion and how the impact values, assumptions, factors, calculations, etc. are developed and documented.
A major evaluation decision is to define the baseline from which savings will be determined. Because a range of baseline options—such as common practice, existing condition, and codes and standards—can be used, the TRM guidance should both define the baselines that are used and indicate where each (if there are multiple options) are used. The resources in Appendix 3 further address and define baseline issues.
Accuracy and reliability of TRM data are ongoing issues, as TRM data, like other estimates of efficiency measure impacts (see Chapter 2), are not “perfect.” Thus, expectations should be managed about what a TRM is and can do—and, because budgets and resources will always be limited, guidelines can cover criteria for how to balance cost, time, and accuracy to help set expectations. In addition, a consistent set of review and decision-making rules can help to address bias, improve consistency in decision making and focus on areas of greatest uncertainty. However, such guidelines should not be viewed as cast in stone. TRMs and the processes used to develop and maintain them should be subject to continuous improvement in areas such as clarity and refinement.
Guidance can also recognize that absolute consistency in the reliability or veracity of deemed values across measures is not necessarily a realistic goal, given the wide variety of measures and the range of availability of underlying measure data. In practice, to implement this balance, jurisdiction-specific guidelines and processes need to be in place to ensure that relatively consistent, or at least comparable, evidence and data are used to

June 2017 www.seeaction.energy.gov 69
establish baseline definitions for comparable measures, as well as factors such as NTG ratios, weather data, interactive factors, and measure costs. Categories of measures for which variation in reliability can be addressed in a guidance document are pilot (new) measures and those with relatively small savings.
Examples of TRM guidelines are:
• Northwest Regional Technical Forum’s Roadmap for Assessment of Energy Efficiency Measures93
• Massachusetts Technical Reference Manual for Estimating Savings from Energy Efficiency Measures 2016–2018 Program Years—Plan Version October 201594
• Public Utility Commission of Texas’ Approach to Texas Technical Reference Manual, Revised for version 3.0 (Final), April 10, 2014.95
4.2.5. Complete, Transparent Documentation of Calculations/Data Sources and Compatibility with Program Tracking and Reporting Systems
TRMs are most useful when they are (1) well documented with transparent indications of calculations and assumptions (such as data used to derive values) sufficient for others to replicate the values and calculations found in the TRMs; (2) prepared using credible, standardized calculations and data-based assumptions; and (3) designed for ease of operation/compatibility with program tracking and reporting systems.
Discussion: TRMs are evaluation tools requiring proper use and understanding of the measures and situations for which their data and other information are applicable. Proper use is thus supported by having the basis for information explained in documentation, with, to the extent possible, quantitative (e.g., confidence intervals) or even qualitative indications of the data reliability indicated. Of particular importance when documenting savings values is to include the estimated values for baseline consumption, backed up by supporting data. Another important element of documentation is that TRMs should include a set of definitions of terms that are unambiguous and minimize opportunities for multiple interpretations or meanings within the document.
TRMs are only as accurate as the impact evaluation research, analyses, simulations, etc. that are used in their development. In some cases, there will be specific research on specific measures that can be used. However, for many measures, the deemed savings values found in TRMs are based on computer simulation modeling. Thus, for those measures, impact evaluations research may focus on calibrating the aggregate simulation results to measured data. Data from the jurisdiction that are covered by the TRM, such as customer characteristics, energy use, and evaluations, is clearly preferable to other data sources or evaluations from other jurisdictions.
For states that have focused more on the verification of installations and less on measurement of parameters used to estimate savings, more focused, periodic evaluations to investigate critical parameters could provide valuable data to improve TRMs. Over time, the systematic application of uniform methods and algorithms, incorporating evaluated results and increasing transparency, could significantly improve consistency across jurisdictions. This could help to enhance the credibility of saving estimates and boost utility planners’, regulators’, and policy makers’ confidence in efficiency as a reliable resource.96
Sources of standardized calculations to support implementation of this recommendation include other TRMs, UMP, IPMVP, and ASHRAE Guideline 14. See Appendix 3 for specific references to these and other related resources.
93 Northwest Regional Technical Forum 2015. 94 Massachusetts Electric and Gas Energy 2015. 95 Public Utility Commission of Texas 2014. 96 Jayaweera et al. 2012.

June 2017 www.seeaction.energy.gov 70
4.2.6. Use of Best Available Data and Tools
TRMs should strive to use data and tools that are the “best available” (i.e., accurate, relevant, and current). Thus, deemed values, factors, variables, and calculations should be prepared using credible, standardized calculations, software tools, and assumptions that are based on and/or informed by field measurements, impact evaluations, customer or market surveys, billing analysis, etc.
Discussion: In theory, all TRM developers intend to use the “best available data,” but in practice “best available” is subject to professional judgment, data availability, and overall cost and time constraints.97 Knowing what is “best available” requires judgment that should incorporate the following: reproducible methods, minimizing systematic bias, use of relevant data sources and estimation methodologies, preparation of complete and transparent documentation, and cost-efficiency. What is cost-efficient should be based on agreement of those involved in developing and using the TRM, considering prioritization of (1) deemed savings values for measures that are most important and (2) the time, resource, and information constraints of the TRM development process.
The Northwest RTF has specific process guidelines98 that are used to determine whether the development of a measure satisfies the use of the “best available” data. The Northwest RTF’s guidelines include the following (and other) guidance on data and analysis:
• Document all methods and supporting data sources clearly so that results can be reproduced by members of the RTF and other agencies.
• Conduct a diligent review of relevant data sources and estimation methods.
• Prepare a complete and transparent documentation of methods and data sources and make it publicly available.
CalTF has developed a position paper on using best available data for TRMs.99 As another example, the Mid-Atlantic TRM100 has process-focused language that indicates that the TRM measure values are based on “consensus agreement and best judgment of project sponsors, managers, and consultants on information that was most useful and appropriate to include within the time, resource, and information constraints of the study.” The Mid-Atlantic TRM also indicates the following criteria should be used when reviewing the proposed assumptions and establishing consensus on the final contents of the TRM:
• Credibility. The savings estimates and any related estimates of the cost-effectiveness of efficiency investments are credible.
• Accuracy and completeness. The individual assumptions or calculation protocols are accurate, and measure characterizations capture the full range of effects on savings.
• Transparency. The assumptions are considered by a variety of stakeholders to be transparent; that is, widely known, widely accessible, and developed and refined through an open process that encourages and addresses challenges from a variety of stakeholders.
• Cost efficiency. The contents of the TRM addressed all inputs that were well within the established project scope and constraints. Sponsors recognize that there are improvements and additions that can be made in future generations of this document.”101
97 “In theory, there is no difference between theory and practice. But, in practice, there is.” Jan L. A. van de Snepscheut. 98 Northwest Regional Technical Forum 2015. 99 CalTF 2016c. 100 Northeast Energy Efficiency Partnerships (NEEP) 2016. Page 11. 101 Northeast Energy Efficiency Partnerships (NEEP) 2016. Pages 13.

June 2017 www.seeaction.energy.gov 71
As discussed in Appendix 2, commonly used EULs generally appear to be quite old and inconsistently defined, and thus represent an area where additional research and documentation would be very valuable.102
With respect to analysis tools, as mentioned in Chapter 3, there are industry standard simulation programs, such as EnergyPlus available, as well as other open-source tools, such as OpenStudio, that support simulation process automation, improve transparency, and make project review more efficient.
4.2.7. Independence and Competence of Technical Reference Manual Preparers
To avoid the potential for undue bias because of financial or other considerations, provisions should be made to have TRM content reviewed by an independent, unbiased body with a transparent conflict of interest policy. In addition, consultants and others that prepare and/or update TRM content should be independent.
Discussion: Some of the experts surveyed believe that the key aspects of avoiding bias in TRM development and updating is associated with defining the entities that oversee the TRM process and applying checks and balances in the process. Such checks and balances can support independent TRM consultants that use appropriate industry standards for quality and integrity, conduct their work in good faith without undue influence from any other party, confirm that supporting data are accurate and complete to the best of their knowledge and belief, and support these practices with reporting on the reliability of the values presented in a TRM.
Independence and lack of bias is in practice a relative characteristic. Different jurisdictions have reached their own conclusions on how to establish this independence. While the funding for the TRM-related efforts will come from utility-customer funds (e.g., as approved by a utility commission), TRM consultants in some states are hired directly by utility commissions (e.g., California) or by stakeholder or advisory groups (e.g., Massachusetts)103 or combinations in which regulators are very involved in the selection process. In some states, even if the commission or stakeholders are choosing the TRM consultant, the contracting is done through utilities (e.g., New Mexico and Illinois) because the utilities may have more established contracting processes in place. As a unique example, at ETO, a nonprofit administrator of efficiency programs, the TRM process is overseen by the planning and evaluation staff who are not in the ETO program operations group that is accountable for achieving savings goals. This provides some level of independence, although ultimately the evaluators and implementers still report to the same head of the organization. The ETO also has an Evaluation Committee that reviews and approves all the evaluations. The Evaluation Committee consists of a subset of the members of their board as well as several outside experts and staff from the state regulatory commission. ETO feeds evaluation results into their forecasts of future savings. The ETO’s true-up process shows that, with this
102 One relatively recent source of EULs is Skumatz 2012. 103 The Massachusetts Energy Efficiency Advisory Council. http://ma-eeac.org.
EXAMPLE OF AUTHORS’ STATEMENT FOR TRMS
The following is an example of a statement (or pledge) that could be prepared by the expert(s) preparing the TRM and included in TRMs as indication of, among other things, independence.
• I certify that I independently determined the information and calculations in this TRM, that they were determined using appropriate industry standards for quality and integrity, that they were determined in good faith without undue influence from any other party, that the supporting data are accurate and complete to the best of the my knowledge and belief, that the reliability of the results are presented in the report, and that I am duly authorized to certify this claim on behalf of the authors of this report.
• I have prepared this TRM consistent with the (client/regulation) requirements to the best of my abilities.
• The documentation provided in this report describing the evaluation methods and data used is accurate.

June 2017 www.seeaction.energy.gov 72
feedback loop in place, ETO’s savings forecasts are, on average, fairly accurate. This may in part reflect their nonprofit nature, as well as management’s commitment to real savings and independent review.104
As another example of how independence is implemented, the RTF organization that oversees the Northwest TRM, while funded by the region’s utilities, BPA, and ETO, was formed by and reports to the Northwest Power and Conservation Council, which is not engaged in program implementation. The RTF is a committee of approximately 30 individuals selected for their technical expertise and experience. They serve as the peer reviewers and final decision makers on analysis carried out by a set of technical contractors. These contractors are working exclusively on behalf of the RTF/Council. Finally, all the contractors’ work undergoes a quality assurance review by a third party to ensure that the final values accurately reflect the RTF’s decisions and as a final check for errors in the analysis.
Another needed characteristic, and a somewhat obvious one, of those who prepare (or update) TRMs is that they be competent. While not directly associated with TRM development competencies, the Northeast Energy Efficiency Partnerships (NEEP), with DOE funding, recently published a series of documents that identify a range of competencies required for impact evaluators, list competencies for entry-level evaluator certification, and summarize a road map that deals with issues that must be addressed to develop certification for such professionals. These documents and organizations for impact evaluation professionals can be consulted for more information on identifying the skill sets needed for TRM development.105
4.2.8. Regular, Scheduled Updating Processes
TRMs should have regular, scheduled processes in place for periodically reviewing TRM content to:
• Update TRMs for new measures that are determined to be priorities
• Make changes to existing measures, data, and calculations when significant changes are justified, typically because of changing baselines or availability of more current, applicable evaluation studies for updating values.
Updates also should use data and tools that are the “best available” (i.e., accurate, relevant, and current) and this indicates that TRM updates should be based on M&V studies that also need to be conducted regularly.
Discussion: Three criteria can be used to implement this recommendation and prioritize which measures to update: (1) magnitude of the impacts associated with the subject measures that are anticipated in the future, (2) potential for improvement of accuracy and consistency of savings estimates, and (3) costs associated with the updating.
Consideration of the first criterion requires an analysis of which measures have the greatest impact on key efficiency metrics (such as savings and cost-effective-ness). Historical data on which measures have been implemented can be useful, but indications of the
104 Private communication with Fred Gordon. Energy Trust of Oregon. December 5, 2016. 105 IEPEC Crafts an Evaluators Certification Road Map for DOE. https://www.iepec.org/?p=9143.
FLEXIBLE UPDATE SCHEDULES BY MEASURE OR MEASURE CATEGORY
Where feasible, it may be desirable to set an update schedule for each measure or groups of similar measures (e.g., weatherization measures) in a TRM. These measure specific update schedules that could be established based on considerations (such as pace of market change, new codes or standards, etc.) with a maximum time period permitted between updates. Establishing an update schedule on a per-measure basis or by groups of similar measures permits analytical resources to be allocated to those measures where conditions may be changing more rapidly than others.

June 2017 www.seeaction.energy.gov 73
potential magnitude of future savings associated with the individual measures of interest are more valuable. For jurisdictions or utilities that have conducted assessments of energy efficiency potential, such data may be available in those assessments.106
The second and third criteria require an assessment of whether there were errors, use of incomplete or outdated data, or outdated analysis tools in prior versions of the TRM and what it would involve to make meaningful improvements. In effect, addressing the third criterion involves comparing the cost of any new data collection and analysis to the total potential value of measures. In summary, it is useful to know for the updating process which measures are most influential, and perhaps have the greatest uncertainty, with regard to future efficiency portfolio savings.
An ongoing process, such as an annual or biennial review, to assess the reliability of deemed savings values, deemed calculations, and deemed variables and factors, may not necessarily result in changes to the TRM. However, the process should include a review to assess whether the assumptions used in the TRM are valid in the years after their initial determination. In particular, such reviews should assess whether the use of the “best (currently) available” data regarding baseline assumptions remains accurate or needs updating (e.g., because of changing code requirements or changes in market practices).
Many TRMs have established fixed schedules for regular reviews (every one, two, or three years), including identification of the responsible parties in the updating process. In some cases, such as with the Northwest RTF, an update schedule is defined each time it reviews a measure, so that measures that are likely to be stable over time (e.g., residential weatherization) are on a different update cycle than those that are changing more rapidly (e.g., LED lighting) or may be subject to changes in codes or standards that occur on known cycles. This approach allows resources to be allocated to those measures that are subject to more rapid changes while still addressing the need to review others, but on a more extended cycle.
Update procedures can also include an indication of which entities can submit new measures for inclusion in the TRMs, when that can occur, and the criteria for measures to be accepted for analysis for possible inclusion. These avoid the need for extensive negotiation every year about what to update and when. Also useful is maintaining, between updating cycles, a central list of potential new measures and existing measure update needs.
The Mid-Atlantic TRM Updating Process Guidelines107 provide some specific recommendations, most of which are paraphrased here, with others further discussed in that TRM’s guidelines.
• Clearly define roles and responsibilities. There should be an individual or governing group who is ultimately responsible for keeping the document up to date and determining who works on the analysis and adjustments during updates, as well as facilitating final approval of changes and updates.
• Set expectations about update cycles so jurisdictions can decide whether adjustments apply to the current year or only future years.
• Maintain regular contact among implementers, evaluators, and TRM administrators.
• Use savings verification and evaluation results to inform TRM updates. Stakeholders should plan to highlight good sources of specific data, recent studies, and other relevant research during annual TRM update meetings and make sure that the update schedule and budget allow for proper review and incorporation of those results.
• Maintain a reference library to track changes and legacy measures that facilitates transparency and consistency through time.
106 National Action Plan for Energy Efficiency 2007. 107 Northeast Energy Efficiency Partnerships (NEEP) 2012.

June 2017 www.seeaction.energy.gov 74
• Develop a protocol and database to catalog pertinent feedback, error corrections, updates, new information, new measure suggestions, and references.
Note that, as discussed in this recommendation, ongoing maintenance associated with deemed savings values requires effort and associated budget, which may indicate that the deemed savings method is not necessarily as inexpensive as some may assume if they expect values to be “set and done.” For example, as indicated in Chapter 1, TRMs do not eliminate the need for ongoing research, data collection, and analyses of efficiency measures and their impacts because, once conducted, this work forms the basis for TRM content.
4.2.9. Searchable, Formatted Technical Reference Manuals
Searchable, formatted TRMs are preferred, with easily and publicly accessible documentation that should include measure characterization with narrative measure descriptions, baseline and measure case technical specifications, energy and demand savings algorithms, clearly stated assumptions, and any pertinent program implementation details (i.e., qualification requirements and exclusions).
Discussion: TRM structure is vitally important for its usability, credibility, quality, and accuracy, as well as for preventing systemic bias.108 The formats discussed in Chapter 3—spreadsheets, databases, PDF documents, and Word documents—all have their advantages and disadvantages. Whichever format is used, it should be accessible, consistently structured, and searchable for the information the user wishes to find. Chapter 3 also provided some example outlines, as do many of the existing 28 TRMs, which represent implementation of this recommendation and thus can be used as models for future or updated TRMs.
As paraphrased from one study of TRMs:109
• A logical and clear organization facilitates the use of the information by all industry stakeholders, including advocates and regulators.
• The TRM’s structure needs to allow for ready access to all savings estimates, key parameters, source data, methodologies, and all other underlying assumptions.
• A well-organized and transparent TRM will yield greater accuracy and is a consumer protection tool, because the more transparent a TRM is, the more it enables users and reviewers (including regulators and advocates) to identify errors.
While other options do exist, it is usually preferable to have TRMs organized by customer sector and within each sector by end-use categories; for example, by residential lighting measures. Such sections of a TRM should then be limited to covering one end-use subcategory, but each subcategory may include more than one measure within the subcategory. For example, a section should not cover both HVAC maintenance and insulation in the same calculation protocols. This leads to difficulties in maintaining tracking systems and proper referencing of measures to a single section or protocol.
4.2.10. Regional Technical Reference Manuals
Regional TRMs can be excellent opportunities for states that do not have their own TRMs or that are contemplating expansions of the coverage of their TRMs.
Discussion: Regional TRMs can be beneficial because of potential cost savings (on a per state or per utility service territory basis) associated with developing and maintaining a comprehensive, high quality TRM. Aggregating resources and taking into account studies and expertise from broader groups of efficiency programs and stakeholders/experts can also lead to higher-quality TRMs than individual jurisdictions could develop on their own. Regional TRMs can be particularly helpful for states just starting out with TRM development.
108 Beitel et al. 2016. 109 Beitel et al. 2016.

June 2017 www.seeaction.energy.gov 75
For multijurisdictional TRMs to be useful for those in individual jurisdictions, each participant entity or state in a regional TRM should have at least some overlaps in the measures of interest and in their guidance and schedules for how and when TRMs should be developed. However, as long as each participant has interest in the TRM and is supportive of a collaborative process, it is not necessary to have total or even significant overlap in the measures. One caveat is that with regional TRMs, it is useful for local entities to have the flexibility to update information more quickly than the regional TRM process may allow, which will facilitate innovation that the regional body can later catch up to, as appropriate.
4.3. Concluding Comments and Recommendations for Further Research
The above recommendations, as well as other chapters and the appendices in this guide, are intended to provide a basic resource for the development, maintenance, and use of utility and other efficiency program administrator, state, and regional TRMs. The intent is to support the reliability of deemed savings values, deemed calculations, and related deemed variables and factors included in TRMs. This in turn is expected to improve the confidence that efficiency policy makers, regulators, administrators, implementers, and other stakeholders have in the reported impacts of efficiency actions.
The authors have attempted to recommend practices that are applicable in any number of states, while recognizing that each state has its own unique set of circumstances. We hope that the reader will find these recommendations useful and well-supported. However, the authors also recognize that there are additional opportunities for improving TRMs and deemed savings methods. Thus, the following topic areas are suggested for further research and development concerning the assessment and documentation of:110
• Savings attribution
• Measure lifetimes
• Persistence of savings
• Non-energy impacts
• Rebound effects111
• Distribution system efficiency measures, such as conservation voltage reduction.
In addition, because the reliability of the deemed savings methods and the integrity of TRMs depends to a large degree on professional experience, expertise, and judgment, another opportunity for advancement is related to EM&V practitioner training and certification.112 Similarly, reliability and integrity depends on access to good data and thus improvements in data access can support improved deemed savings analyses and TRMs. Finally, the content and development of TRMs will need to adapt to advancements in metering technology, data analytics, and a greater share of energy savings opportunities available through improved controls.
110 Schwartz et al. 2017. Pages 312–318. 111 The “rebound effect” pertains to the behavioral and economic responses of consumers, firms, and ultimately the overall economy to policies and programs that promote end-use energy efficiency. 112 ANSI 2014, NEEP 2016a.

June 2017 www.seeaction.energy.gov 76
5. References
ANSI (American National Standards Institute). 2014. Standardization Roadmap—Energy Efficiency in the Built Environment. Prepared by the Energy Efficiency Standardization Coordination Collaborative. June.
Arkansas Public Service Commission. 2016. Arkansas Technical Reference Manual, Volume 6.0. Approved in Arkansas Public Service Commission Docket 10-100-R. www.apscservices.info/pdf/10/10-100-R_143_1.pdf.
Beitel, Annette, Tim Melloch, Bruce Harley, and Alejandra Mejia. 2016. Technical Reference Manuals Best Practices from Across the Nation to Inform the Creation of the California Electronic Technical Reference Manual (eTRM). American Council for an Energy Efficient Economy. ACEEE Summer Study on Energy Efficiency in Buildings. http://aceee.org/files/proceedings/2016/data/papers/6_1027.pdf.
California Public Utilities Commission. 2017. Retrieved from Database for Energy Efficiency Resources (DEER). February 2. www.deeresources.com/.
CalTF (California Technical Forum). 2017. Electronic Technical Reference Manual (eTRM) Repository Request for Proposals, issued by California Technical Forum on February 20. www.caltf.org.
CalTF. 2016a. CalTF Technical Position Paper No. 5: Reducing Measure Complexity. www.caltf.org/tf-meeting-materials/.
CalTF. 2016b. CalTF Technical Position Paper No. 3: Case for Using EnergyPlus as “Default” Modeling Engine for the “Electronic TRM” Project. www.caltf.org/tf-meeting-materials.
CalTF. 2016c. CalTF Technical Position Paper No. 4: Using Best Available Data to Determine Deemed Savings. www.caltf.org/tf-meeting-materials/.
Carroll, Erin. 2013. Dealing Effectively with TRM Development. Vermont Energy Investment Corporation. Association of Energy Services Professionals (AESP) Online Conference, December 4.
Cleff, Pete, Anne West, Hossein Haeri, and Tina Jayaweera. 2011. Impact Evaluation Research Design in a Post TRM World. Paper presented at the International Energy Program Evaluation Conference, Boston. August. www.iepec.org/conf-docs/papers/2011PapersTOC/papers/068.pdf#page=1.
Del Balso, Ryan J. and Kevin Grabner. 2013. But I Thought a Statewide TRM Would Solve Everything? International Energy Program Evaluation Conference, Chicago. August. https://www.iepec.org/conf-docs/conf-by-year/2013-Chicago/022.pdf.
Dimetrosky, Scott, Katie Parkinson, and Noah Lieb. 2015.Chapter 21: Residential Lighting Evaluation Protocol. The Uniform Methods Project. Apex Analytics, LLC.Boulder, Colorado. February. https://energy.gov/sites/prod/files/2015/02/f19/UMPChapter21-residential-lighting-evaluation-protocol.pdf.
Eckman, Tom, and Mark Silvia. 2014. “EM&V 2.0—New tools for measuring energy efficiency program savings.” Retrieved February 2016 from Electric Light & Power. February. www.elp.com/Electric-Light-Power-Newsletter/articles/2014/02/em-v-2-0-new-tools-for-measuring-energy-efficiency-program-savings.html.
Franconi, Ellen, Matt Gee, Miriam Goldberg, Jessica Granderson, Tim Guiterman, Michael Li, and Brian A. Smith. 2017. The Status and Promise of Advanced M&V: An Overview of “M&V 2.0” Methods, Tools, and Applications. Rocky Mountain Institute and Lawrence Berkeley National Laboratory. LBNL report number LBNL-1007125. https://eta.lbl.gov/sites/all/files/publications/lbnl-1007125.pdf.
Granderson, Jessica, Philip N. Price, David Jump, Nathan Addy, and Michael Sohn. 2015. “Automated Measurement and Verification: Performance of Public Domain Whole-Building Electric Baseline Models.” Applied Energy, 144, 106-113. http://eis.lbl.gov/pubs/lbnl-187596.pdf.
Granderson, Jessica, Samir Touzani, Claudine Custodio, Michael Sohn, David Jump, and Samuel Fernandes. 2016. “Accuracy of Automated Measurement and Verification (M&V) Techniques for Energy Savings in Commercial Buildings.” Applied Energy, 173, pp.296-308. http://eis.lbl.gov/pubs/applied-energy-173-2016.pdf.
June 2017 www.seeaction.energy.gov 77
Hoffman, Ian M., Steven. R. Schiller, Annika Todd, Megan A. Billingsley, Charles A. Goldman, and Lisa C. Schwartz. 2015a. Energy Savings Lifetimes and Persistence: Practices, Issues and Data. Lawrence Berkeley National Laboratory. https://emp.lbl.gov/publications/energy-savings-lifetimes-and.
Hoffman, Ian, Gregory Rybka, Greg Leventis, Charles A. Goldman, Lisa Schwartz, Megan Billingsley, and Steven Schiller. 2015b. The Total Cost of Saving Electricity Through Utility Customer–Funded Energy Efficiency Programs: Estimates at the National, State, Sector and Program Level. Lawrence Berkeley National Laboratory. https://emp.lbl.gov/sites/all/files/total-cost-of-saved-energy.pdf.
Illinois Commerce Commission. 2012. Policy Document for the Illinois Statewide Technical Reference Manual for Energy Efficiency. October 25. https://www.icc.illinois.gov/downloads/public/IL%20TRM%20Policy%20Document.pdf.
Illinois Energy Efficiency Stakeholder Advisory Group (SAG). 2017. Illinois Statewide Technical Reference Manual for Energy Efficiency. Version 6.0 Volume 1: Overview and User Guide. February 8. http://ilsagfiles.org/SAG_files/Technical_Reference_Manual/Version_6/Final/IL-TRM_Version_6.0_dated_February_8_2017_Final_Volumes_1-4_Compiled.pdf.
Jayaweera, Tina, Aquila Velonis, Hossein Haeri, Charles A. Goldman, and Steven R. Schiller. 2012. Status and Opportunities for Improving the Consistency of Technical Reference Manuals. American Council for an Energy Efficient Economy (ACEEE). ACEEE 2012 ACEEE Summer Study on Energy Efficiency in Buildings. http://aceee.org/files/proceedings/2012/data/papers/0193-000150.pdf.
Loper, Joe, Steve Capanna, Rodney Sobin, and Tom Simchak. 2010. Scaling-Up Energy Efficiency Programs: The Measurement Challenge. Alliance to Save Energy. https://library.cee1.org/system/files/library/8578/CEE_Scaling%20Up%20Energy%20Efficiency%20Programs%20_The%20Measurement%20Challenge_1Jan2010.pdf.
Massachusetts Electric and Gas Energy. 2015. Massachusetts Technical Reference Manual for Estimating Savings from Energy Efficiency Measures. October. http://ma-eeac.org/wordpress/wp-content/uploads/2016-2018-Plan-1.pdf.
MEEA. 2016. Kentucky Technical Reference Manual Roadmap (TRM Roadmap). Midwest Energy Efficiency Alliance (MEEA) for Kentucky Energy Efficiency Stakeholders. www.mwalliance.org/sites/default/files/media/Kentucky-TRM-Roadmap.pdf.
MEEA. 2017. Midwest TRM Inventory: Statewide Technical Resource Manuals for Energy Efficiency. Midwest Energy Efficiency Alliance (MEEA). February. www.mwalliance.org/sites/default/files/media/Midwest-TRM-Inventory-Feb2017.pdf.
Missouri Department of Economic Development. 2016. (Work Plan) Show Me the Savings: A Statewide TRM as a Catalyst for Energy Efficiency in Missouri. https://energy.mo.gov/docs/default-source/default-document-library/trmworkplan1.pdf?sfvrsn=0.
National Action Plan for Energy Efficiency. 2007. Guide for Conducting Energy Efficiency Potential Studies. November. https://www.epa.gov/sites/production/files/2015-08/documents/potential_guide_0.pdf.
National Action Plan for Energy Efficiency. 2008. Understanding Cost-Effectiveness of Energy Efficiency Programs: Best Practices, Technical Methods, and Emerging Issues for Policy-Makers. Energy and Environmental Economics, Inc. and Regulatory Assistance Project. https://www.michigan.gov/documents/energy/cost-effectiveness_411711_7.pdf.
National Efficiency Screening Project. The National Standard Practice Manual for Assessing Cost-Effectiveness. Prepared by Tim Woolf, Synapse Energy Economics; Chris Neme, Energy Futures Group; Marty Kushler, American Council for and Energy-Efficient Economy; Steven R. Schiller; and Tom Eckman. 2017. https://nationalefficiencyscreening.org/national-standard-practice-manual/.

June 2017 www.seeaction.energy.gov 78
Navigant Consulting. 2012. Guidelines for the Development and Maintenance of Incremental Measure Costs and Benefits Estimates. Prepared for the Regional Technical Forum. March. https://nwcouncil.app.box.com/s/mmvauqt3ln7h7jwc4ex90pttwjfogat3.
Northeast Energy Efficiency Partnerships (NEEP). 2012. Mid-Atlantic Technical Reference Manual (TRM) Updating Process Guidelines. Prepared by Bret Hamilton, Shelter Analytics; Sam Dent, Dent Energy; and Matt Socks, Optimal Energy. September 5. www.neep.org/sites/default/files/resources/ Recommendations%20and%20draft%20update%20process%20for%20the%20Mid%20Atlantic%20TRM-FINAL.pdf.
Northeast Energy Efficiency Partnerships (NEEP). 2016. Mid-Atlantic Technical Reference Manual Version 6.0. Prepared by Shelter Analytics. http://neep.org/mid-atlantic-technical-reference-manual-v6.
Northeast Energy Efficiency Partnerships (NEEP). 2016a. Scoping the Certification of Energy Program Impact Evaluators. www.neep.org/scoping-certification-energy-program-impact-evaluators.
Northwest Regional Technical Forum (RTF). 2015. Roadmap for the Assessment of Energy Efficiency Measures. December 8. https://nwcouncil.app.box.com/v/OperativeGuidelines-20151208.
Northwest Regional Technical Forum (RTF). 2013. Guidelines for Estimation of Incremental Measure Costs and Benefits. April 16. https://nwcouncil.app.box.com/s/z75wnz7u7sqqlqj9mg3d2jcf4zdcymgl.
Public Utility Commission of Texas. 2014. Approach to Texas Technical Reference Manual—Revised for version 3.0 (Final). April 10. www.texasefficiency.com/index.php/emv.
Roth, Amir, Larry Brackney, Andrew Parker, and Annette Beitel. 2016. OpenStudio: A Platform for Ex Ante Incentive Programs. 2016 ACEEE Summer Study on Energy Efficiency in Buildings. http://aceee.org/files/proceedings/2016/data/papers/4_726.pdf.
Schiller, Steven R. 2012. Energy Efficiency Program Impact Evaluation Guide. State and Local Energy Efficiency Action Network (SEE Action). https://www4.eere.energy.gov/seeaction/system/files/documents/ emv_ee_program_impact_guide_0.pdf.
Schwartz, Lisa C., Max Wei, William Morrow, Jeff Deason, Steven R. Schiller, Greg Leventis, Sarah Smith, Woei Ling Leow, Todd Levin, Steven Plotkin, Yan Zhou, and Joseph Teng. 2017. Electricity end uses, energy efficiency, and distributed energy resources baseline. Lawrence Berkeley National Laboratory. https://www.energy.gov/sites/prod/files/2017/01/f34/Electricity%20End%20Uses,%20Energy%20Efficiency,%20and%20Distributed%20Energy%20Resources.pdf.
Skumatz, Lisa A., M. Sami Khawaja, and Richard Krop. 2010. Non-Energy Benefits: Status, Findings, Next Steps, and Implications for Low Income Program Analyses in California. Revised Report. Skumatz Economic Research Associates and The Cadmus Group. May. 27–29. www.liob.org/docs/LIEE%20Non-Energy%20Benefits%20Revised%20report.pdf.
Skumatz, Lisa A. 2012. Regional Technical Forum: Guidelines for Development and Maintenance of Measure Lifetimes. May. https://nwcouncil.app.box.com/s/od1fd9o5c9uwx5f5kwp76pbxg4e0k4x6.
Skumatz, Lisa A. 2015. Non-Energy Benefits: Values and treatment in cost-effectiveness testing—single and multifamily whole-home energy efficiency programs. E4The Future, Inc. September. 6–7. http://e4thefuture.org/wp-content/uploads/2015/10/E4TheFuture_Skumatz_NY-PSC.pdf.
Slattery, Bob. 2015. Reported Energy and Cost Savings from the DOE ESPC Program: FY 2014. Oak Ridge National Laboratory. https://energy.gov/sites/prod/files/2015/04/f21/2014_savings_espcs.pdf.
State and Local Energy Efficiency Action Network. 2015a. Energy Efficiency Collaboratives: Driving Ratepayer-Funded Efficiency through Regulatory Policies Working Groups. Prepared by Michael Li and Joe Bryson. https://www4.eere.energy.gov/seeaction/system/files/documents/EECollaboratives-0925final.pdf.
June 2017 www.seeaction.energy.gov 79
State and Local Energy Efficiency Action Network. 2015b. State Approaches to Demand Reduction Induced Price Effects: Examining How Energy Efficiency Can Lower Prices for All. Prepared by Colin Taylor, Bruce Hedman, and Amelie Goldberg from the Institute for Industrial Productivity under contract to Oak Ridge National Laboratory. December. https://www4.eere.energy.gov/seeaction/system/files/documents/DRIPE-finalv3_0.pdf.
Tamble, Zack, Mark Brown, Ben Parnell, Steve Lynch, Rachel Buckley, and Adam Maxwell. 2016. Behind the Curtain: Characterization of Measure Technologies within Technical Reference Manuals. ACEEE Summer Study on Energy Efficiency in Buildings. http://aceee.org/files/proceedings/2016/data/papers/2_1182.pdf.
Violette, Daniel M., and Pamela Rathbun. 2014. Chapter 23: Estimating Net Savings: Common Practices. The Uniform Methods Project: Methods for Determining Energy Efficiency Savings for Specific Measures. September. https://www.energy.gov/sites/prod/files/2015/02/f19/UMPChapter23-estimating-net-savings_0.pdf.
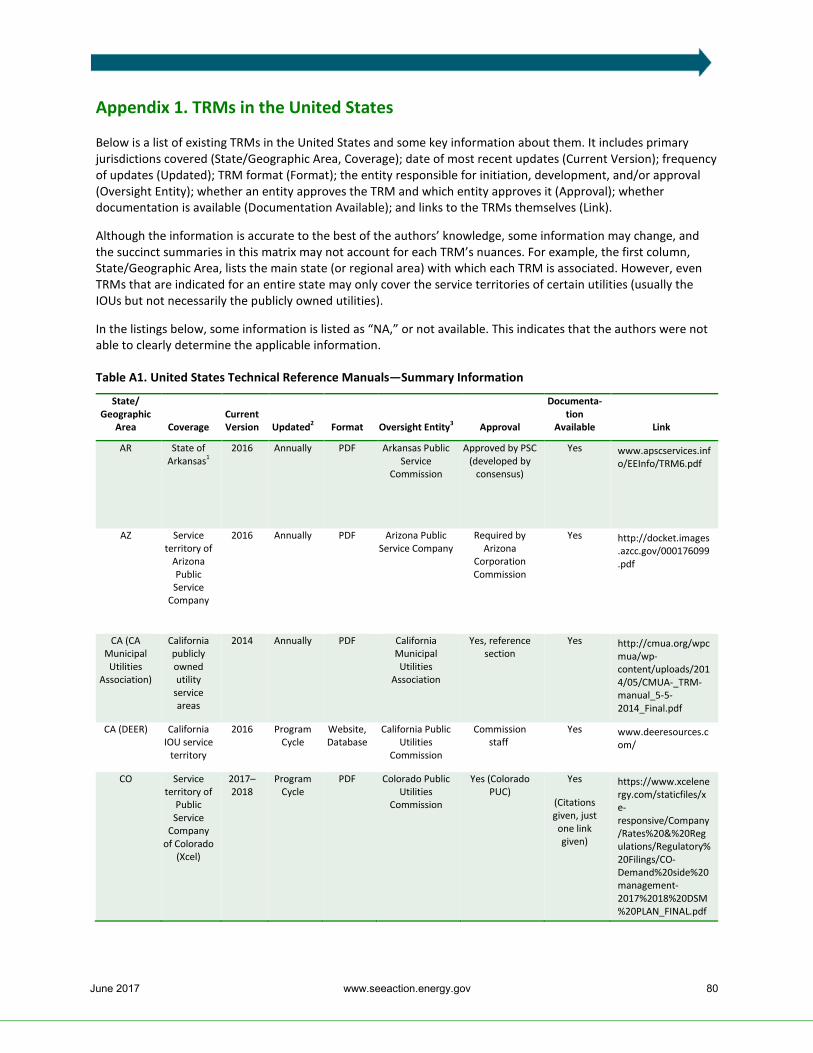
June 2017 www.seeaction.energy.gov 80
Appendix 1. TRMs in the United States
Below is a list of existing TRMs in the United States and some key information about them. It includes primary jurisdictions covered (State/Geographic Area, Coverage); date of most recent updates (Current Version); frequency of updates (Updated); TRM format (Format); the entity responsible for initiation, development, and/or approval (Oversight Entity); whether an entity approves the TRM and which entity approves it (Approval); whether documentation is available (Documentation Available); and links to the TRMs themselves (Link).
Although the information is accurate to the best of the authors’ knowledge, some information may change, and the succinct summaries in this matrix may not account for each TRM’s nuances. For example, the first column, State/Geographic Area, lists the main state (or regional area) with which each TRM is associated. However, even TRMs that are indicated for an entire state may only cover the service territories of certain utilities (usually the IOUs but not necessarily the publicly owned utilities).
In the listings below, some information is listed as “NA,” or not available. This indicates that the authors were not able to clearly determine the applicable information.
Table A1. United States Technical Reference Manuals—Summary Information
State/ Geographic
Area Coverage Current Version Updated2 Format Oversight Entity3 Approval
Documenta-tion
Available Link
AR State of Arkansas1
2016 Annually PDF Arkansas Public Service
Commission
Approved by PSC (developed by
consensus)
Yes www.apscservices.info/EEInfo/TRM6.pdf
AZ Service territory of
Arizona Public Service
Company
2016 Annually PDF Arizona Public Service Company
Required by Arizona
Corporation Commission
Yes http://docket.images.azcc.gov/000176099.pdf
CA (CA Municipal Utilities
Association)
California publicly owned utility
service areas
2014 Annually PDF California Municipal Utilities
Association
Yes, reference section
Yes http://cmua.org/wpcmua/wp-content/uploads/2014/05/CMUA-_TRM-manual_5-5-2014_Final.pdf
CA (DEER) California IOU service
territory
2016 Program Cycle
Website, Database
California Public Utilities
Commission
Commission staff
Yes www.deeresources.com/
CO Service territory of
Public Service
Company of Colorado
(Xcel)
2017–2018
Program Cycle
PDF Colorado Public Utilities
Commission
Yes (Colorado PUC)
Yes
(Citations given, just
one link given)
https://www.xcelenergy.com/staticfiles/xe-responsive/Company/Rates%20&%20Regulations/Regulatory%20Filings/CO-Demand%20side%20management-2017%2018%20DSM%20PLAN_FINAL.pdf

June 2017 www.seeaction.energy.gov 81
State/ Geographic
Area Coverage Current Version Updated2 Format Oversight Entity3 Approval
Documenta-tion
Available Link
CT Connecticut IOUs
2016 Annually PDF Energy Efficiency Board jointly
with IOUs
Department of Energy and
Environ-mental Protection
Yes (Sources used to
construct the measure are listed in
the references
section)
www.neep.org/sites/default/files/2015_10_01_2016%20Program%20Savings%20Document.pdf
DE4 State of Delaware1
2016 Infrequently
PDF NA NA Yes http://regulations.delaware.gov/register/august2016/proposed/DE%20TRM%20complete%202016.pdf
HI State of Hawaii
2014 Annually PDF Hawaii Energy NA Yes (Sources referenced
generally but not
specifically for each
measure)
https://hawaiienergy.com/images/resources/TRMProgramYear_2014_FINAL_V15.pdf
IA State of Iowa
2017 To be determine
d
PDF TRM Oversight Committee
Yes, by Iowa Utilities Board
Yes https://iub.iowa.gov/energy-efficiency
IL State of Illinois1
2017 Annually PDF Stakeholder Advisory Group
Yes (Illinois
Commerce Commission)
Yes http://ilsagfiles.org/ SAG_files/Technical_Reference_Manual/Version_6/Final/IL-TRM_Version_6.0_dated_February_8_2017_Final_Volumes_1-4_Compiled.pdf
IN State of Indiana1
2015 Infrequently
PDF Indiana Utility Regulatory
Commission (IURC) Demand-
Side Management Coordination Committee
NA Yes Not available online
MA State of Massachu-
setts1
2015 (for
2016–2018
program years)
Program Cycle
Word document
MA Energy Efficiency
Advisory Council and IOUs
MA Department of Public Utilities
Yes http://ma-eeac.org/wordpress/wp-content/uploads/2016-2018-Plan-1.pdf

June 2017 www.seeaction.energy.gov 82
State/ Geographic
Area Coverage Current Version Updated2 Format Oversight Entity3 Approval
Documenta-tion
Available Link
ME State of Maine1
2016 Annually PDF Efficiency Maine Trust
PUC has oversight and
input
Yes www.efficiencymaine.com/about/library/policies/
MI State of Michigan1
2017 Annually Excel Energy Efficiency Collaborative of
the Dept. of Licensing and
Regulatory Affairs
Michigan Public Service
Commission
Yes4 www.michigan.gov/mpsc/0,4639,7-159-52495_55129---,00.html
MID-ATLANTIC
Maryland, Delaware, Washing-ton, D.C.
2016 (2017
version slated
for May 2017)
Annually Word document
NEEP Regional EM&V Forum
Yes (Consensus from the
Regional EM&V Forum)
Yes www.neep.org/mid-atlantic-technical-reference-manual-v6
MN State of Minnesota1
2017 Annually PDF, database
Minnesota Department of
Commerce Division of
Energy Resources
Yes Yes http://mn.gov/ commerce/industries/energy/utilities/cip/ technical-reference-manual/
MO State of Missouri
2017 To be Determin
ed
PDF Missouri TRM Oversight
Committee and Missouri Dept. of
Economic Development—
Division of Energy
Yes Yes https://energy.mo.gov/energy/ about/trm
NJ Areas served by NJ’s Clean
Energy Program
2014 Annually PDF New Jersey Board of Public
Utilities
NA Yes www.njcleanenergy.com/files/file/ Appeals/NJ%20Protocols%20Revisions%202013%20Update_04-16-2014_clean.pdf

June 2017 www.seeaction.energy.gov 83
State/ Geographic
Area Coverage Current Version Updated2 Format Oversight Entity3 Approval
Documenta-tion
Available Link
NM Service territories of South-western Public
Service, El Paso
Electric, Public Service
Company of New Mexico, and NM Gas Co.
2016 To be Deter-mined
PDF NM Public Regulation
Commission’s Energy Efficiency
Evaluation Committee
No Yes Not available online
NY State of New York1
2017 Annually PDF New York State Public Service Commission
Yes (NY PSC)
Yes http://www3.dps.ny.gov/W/PSCWeb.nsf/All/72C23DECFF52920A85257F1100671BDD?OpenDocument
OH State of Ohio1
2010 No formal update
schedule or process
PDF Public Utilities Commission of
Ohio
Yes (approves document
developed by a contractor with
utility and stakeholder
input)
Yes http://dis.puc.state.oh.us/DocumentRecord.aspx?DocID=be39455f-350c-43a3-8d46-971563809a01
PA State of Pennsyl-
vania1
2016 Approval is for
5 years with one interim update
Word document
PA PUC’s Bureau of Conservation, Economics and Energy Planning
Statewide evaluator
(contractor) provides revision suggestions, PA
PUC adopts
Yes www.puc.state.pa.us/filing_resources/issues_laws_regulations/act_129_information/technical_reference_manual.aspx
Northwest RTF
Utilities in Idaho,
Oregon, Washing-ton, and Western Montana
2016 As needed PDF, Excel
NW Power and Conservation
Council’s Regional
Technical Forum
Developed by consensus,
advisory-only for IOUs, adopted by
BPA
Yes (In resources
section)
https://rtf.nwcouncil.org/subcommittee/ pacific-northwest-deemed-measure-review-and-standardized-measurement-and-verification
RI National Grid Rhode
Island service
territory
2016 Annually PDF, Excel,
Program measure
cost-effective-ness tools
National Grid and Energy
Efficiency and Resource
Management Council
Accepted by RI Energy Efficiency
and Resource Management
Council
Yes (Cited,
without links)
https://www9.nationalgridus.com/non_html/eer/ri/PY2016%20RI%20TRM.pdf
TVA Used by TVA
program administra-
tors and evaluators
2015 Annually PDF, Excel,
tools, and prototype
models
Tennessee Valley Authority
NA Yes (Designed to
easily reference
inputs)
https://www.tva.gov/file_source/TVA/Site%20Content/Energy/EnergyRight%20Solutions/TVA_TRM_2016_Version%204.pdf

June 2017 www.seeaction.energy.gov 84
State/ Geographic
Area Coverage Current Version Updated2 Format Oversight Entity3 Approval
Documenta-tion
Available Link
TX State of Texas1
2016 Annually PDF, Excel Electric Utilities Marketing
Managers of Texas and the
EM&V contractor
(currently Tetra Tech)
Yes (Public Utilities Commission of
Texas)
Yes www.texasefficiency.com/index.php/emv
VT Program territory of Efficiency Vermont1
2015 Annually PDF Efficiency Vermont, Vermont
Department of Public Service, and third-party
consultants
Yes (Vermont Department of Public Service
and third-party consultants)
Yes http://psb.vermont.gov/sites/psbnew/ files/ doc_library/ ev-technical-reference-manual.pdf
WI State of Wisconsin1
2015 Annually PDF, database
WI PSC, WI Focus on Energy,
Evaluation Team
No. Done by consensus.
Yes https://www.focusonenergy.com/sites/ default/files/ TRM%20Fall%202015%20_10-22-15.compressed2.pdf
1 Tamble et al. 2016 is the source of information for rows in this column that are marked with a superscript 1. 2 Tamble et al. 2016 is the source of information for all rows in this column, with the exception of Iowa. 3 This column captures which entity or entities are responsible for development and updating a TRM, as well as oversight and approval if another entity is not indicated to be the approving entity in the following column. For example, a utility may be responsible for developing and updating the TRM, but a regulatory commission oversees and approves the process and the TRM itself. Oversight versus approval responsibilities is not always obvious in supporting TRM documentation. 4 Delaware is both part of the Mid-Atlantic TRM and also has its own complementary TRM.
5 The Michigan TRM has work papers containing assumptions and calculations used as the basis for the measure savings. However, the work papers are proprietary to the developer for use by Michigan utilities.

June 2017 www.seeaction.energy.gov 85
Appendix 2. Background: Common Deemed Values, Variables, and Factors Contained in Technical Reference Manuals
As indicated in Chapter 1 and Chapter 2, TRMs contain information used to determine the impacts associated with EEMs. In this appendix, the most common values, variables, and factors found in TRMs across the United States are described using definitions used in the efficiency industry. However, individual TRMs will sometimes use their own specific definitions, and these should be consulted when applying the information in any specific TRM.
The following definitions are organized with deemed energy and demand savings values defined first, as they are the most common data provided in TRMs on a per-measure basis. Next, common deemed variables and factors are defined, and then several non-energy impact values are described. For more information on metrics, see the SEE Action Energy Efficiency Program Impact Evaluation Guide113 and protocols defined in UMP.114
Energy and Demand Savings. These are the most common focus of deemed savings values and deemed savings calculations found in TRMs:
• Energy savings is the reduction in electricity (e.g., kWh) or on-site fossil or other fuel consumption (e.g., British thermal units [Btu] of natural gas, fuel oil or biomass) from the baseline to the consumption associated with the subject efficiency measure. This term is usually applied for annual savings, but can be applied for any other period of time from hourly to lifetime savings. Energy savings also can be indicated as site savings (savings at the project site where the measure is implemented) or source savings, the savings that occur at the “source” of the energy provided to the project site. For electricity, the latter typically would be defined as savings at the power plant bus bar to account for losses in the distribution and transmission system. For natural gas, source savings would typically be defined as savings at the wellhead to account for losses (including compression pumping) in the transmission and distribution pipelines.
• Demand savings is the reduction in electric (e.g., kilowatt [kW]) or fossil or other fuel demand (e.g., Btu/hour) from the baseline to the demand associated with the subject efficiency measure during a specific time interval. This term is most appropriately defined as the demand reduction that is coincident with the utility system peak, but may also be defined as the reduction in customer peak billing demand (used to calculate their bill savings) or average demand reduction.
Net-to-Gross Factors or Ratios. Energy and demand savings are usually reported in TRMs as the gross savings that can be attributed to a specific measure, as opposed to the net savings that are attributed to the program. However, in some TRMs, default NTG ratios are included, usually at the program level versus the measure level. In the NTG ratio, all or some of the free ridership, spillover, and market effects associated with net savings are expressed as a ratio to gross savings. When applied to a gross savings value, the ratio is used to estimate net savings. Few issues are more subject to debate in the field of efficiency EM&V than the difference between net and gross savings and how to determine each. The following are standard definitions for gross and net savings.115
• Gross savings: Changes in energy consumption that result directly from program-related actions taken by participants of an efficiency program, regardless of why they participated.
• Net savings: Changes in energy use that are attributable to a particular efficiency program. These changes may implicitly or explicitly include the effects of free ridership, spillover and induced market effects.
113 Schiller 2012. 114 Uniform Methods Project: Determining Energy Efficiency Savings for Specific Measures http://energy.gov/eere/about-us/ump-protocols. 115 Violette and Rathbun 2014.

June 2017 www.seeaction.energy.gov 86
For further information and definitions of free ridership, spillover, and market effects, see the UMP net savings protocol116 and the SEE Action Energy Efficiency Program Impact Evaluation Guide.117
Measure Costs. Measure costs data are used to assess the cost-effectiveness of efficiency measures and incentive programs, and for designing programs to encourage consumer participation. Costs typically represent an increase in the required financial commitment relative to the cost associated with a baseline. For some measures, such as retrofitting wall or ceiling insulation, this may be the full cost of the installation. For other measures, such as more efficient clothes washers or refrigerators, it may be the incremental difference in cost between the average new appliance and the purchased, efficient (e.g., ENERGY STAR) appliance.
Conceptually, the definition of measure cost is straightforward—the cost to put an efficiency measure in place, including the purchase of the more efficient end-use equipment, installation labor, and materials. Measure costs should generally represent net cost over the life of a measure. This is because there may be differences between the efficiency measure and baseline conditions’ ongoing labor, maintenance and operations, and periodic capital replacements costs. For example, the air handler on a high efficiency furnace might have a higher replacement cost than the base case furnace. Although, in some cases the total cost of an efficiency measure over its lifetime may be negative, either due to lower first cost or because the more efficient measure has a lower operation and maintenance cost compared to the baseline. For example, LEDs have significantly longer lifetimes than incandescent lamps. Consequently, because they need to be replaced less often, their total cost, excluding energy savings, may be less than an incandescent lamp.
In some instances, net measure costs can be defined as just the incremental first cost—that is, the additional increment of cost of the high efficiency measure compared to the cost of a “baseline,” “non-efficient” measure (e.g., the equivalent piece of equipment with conventional efficiency or performance).118 Incremental measure costs are used to assess some program types, such as programs that reduce the cost of installing an efficient air conditioner in a new home (rather than a standard, less efficient model) or to replace one that is broken beyond economic repair (replace on burnout).119 In some situations, however, full measure costs are appropriate—such as the above mentioned example when insulation is added to a home’s attic (outside of any code requirements for insulation).
The determination of whether to use incremental or full measure cost depends on (and should be consistent with) the baseline condition from which savings are estimated. For example, measures may have more than one specific application, such as high efficiency windows that include both window upgrades and replacements. Therefore, the same measure may have applications with a common practice or a precondition baseline. Measures for which savings are estimated over a common practice baseline should use only the incremental costs over that same baseline (e.g., the difference in cost between the market average light bulb and an LED bulb). With measures for which savings are determined using existing conditions as a baseline, the incremental impact and cost of the measure is its full cost (e.g., the full cost of adding ceiling insulation in an existing home). In addition, the
116 Violette and Rathbun 2014. 117 Schiller 2012. 118 Baselines can be based on existing conditions, federal or state appliance standards, building energy codes, or market average efficiencies and performance. See Schiller 2012. 119 Hoffman et al. 2015a.
MEASURE COSTS AND COST-EFFECTIVENESS ANALYSIS
Guidelines for determining measure incremental cost should also be consistent with the cost-effectiveness test(s) used by a jurisdiction, as the definition of which costs are included (e.g., total incremental costs, only the cost paid by the utility) varies based on the cost-effectiveness tests. See National Action Plan for Energy Efficiency (2008) and National Efficiency Screening Project (2017).

June 2017 www.seeaction.energy.gov 87
incremental cost of EEMs, such as an efficient refrigerator or window, should be limited to the additional cost associated with its energy-saving features and should not include other desirable features (e.g., a refrigerator’s stainless steel finish or the window’s attractiveness).
As with other inputs into a TRM, establishing a clear set of guidelines to follow when estimating the incremental cost of efficiency measures improves both the consistency and the transparency of its content. The Northwest RTF has developed a set of guidelines for estimating the incremental cost and benefits of efficiency measures.120, 121 The purpose of the RTF guidelines is to provide a systematic approach to developing cost estimates and documenting approaches and sources when estimating measure costs.
Savings Lifetimes and Savings Persistence. Efficiency measure impacts (e.g., energy savings) often are calculated and reported as annual values, but savings lifetimes are essential for assessing the life-cycle benefits and cost-effectiveness of efficiency activities and for forecasting loads in resource planning. Lifetimes and persistence of energy savings are overlapping topics. To date, however, the efficiency industry has focused more on quantifying the lifetimes of savings and less on estimating savings persistence (or degradation) over the savings lifetime. The two issues are interrelated in practice because, where compelling data exist, savings persistence often is integrated into estimates of the lifetimes of energy savings for a given efficiency activity.122
In practice, energy and demand savings for a measure are typically estimated for one or more spans of time: (1) the first year, (2) a specified time horizon such as 10 years, or (3) the life of the measure. A commonly used approach in the industry is to characterize measure lifetime as the EUL of a measure, defined as the median length of time (in years) that an energy efficiency measure is functional. That is, an EUL is the number of years at which half of the measures remain in operation and half have expired. Conceptually, the EUL of an efficiency measure is a function of:
• Technical equipment life: The average number of years that a measure can operate
• Measure persistence:123 The time that an energy-consuming measure lasts, considering business turnover, early retirement of installed equipment, and other reasons that measures might be removed, damaged, or discontinued.
This definition of measure life, EUL, is widely used with only minor variations. However, the methods for estimating measure lifetimes—and the actual lifetime values assumed for similar efficiency measures, which in many cases are quite dated—vary among program administrators, state utility commissions, and the consultant studies that provide the measure lifetime estimates used in TRMs.124
Program administrators make a range of assumptions regarding what happens to energy savings (and emissions avoidance and other benefits) at the end of measure lifetime. At one end of the spectrum, the energy use of the affected end use is assumed to revert to the baseline efficiency at the end of the measure’s life, so residual savings are zero. At the opposite end of the spectrum, is the assumption that efficient equipment and systems will be replaced with equipment or practices either equivalent to or more efficient than the original efficiency measure, so savings continue indefinitely (with or without incremental costs). Regardless of the assumption made regarding
120 Navigant 2012. 121 Northwest Regional Technical Forum 2013. 122 Hoffman et al. 2015b. 123 Savings persistence technically is distinct from, but closely related to, measure persistence. Savings persistence is the change in savings over time as a result of technical or operational/behavioral factors, while measure persistence is more applicable to the physical presence and operability of the measure. As mentioned, a common practice is to integrate savings persistence, as well as measure persistence and equipment life, into the calculation of measure lifetimes. 124 Hoffman et al. 2015a. For example, technical measure life or equipment life usually is defined as the median number of years that a measure is installed or initiated and is operational. Less commonly, it is defined as the mean number of years to failure. Median value means the time at which half of the measures are removed from service or are otherwise no longer operating as assumed, and half remain operating as assumed.

June 2017 www.seeaction.energy.gov 88
persistence of savings beyond the end of an EUL, care should be taken to maintain consistency across other analyses, such as for accounting for savings in forecast load growth and emissions and cost-effectiveness analyses.125
The assumptions regarding measure lifetimes (i.e., EUL values) should be documented in TRMs, but caution should be used when adopting them from different sources, as the definitions and ways they are determined vary significantly across the country.
Interactive Effects. As discussed in Chapter 2, interactive effects are increases or decreases in the use of electricity or other fuels that occur outside of the end uses targeted by a specific efficiency measure, project, or program. These can affect the same fuel that is directly saved by the efficiency measure or different fuels, as with the effects lighting retrofits can have on heating system energy use. Measures may also interact. For example, savings from the installation weatherization measures will affect the savings associated with the installation of a higher efficiency heat pump or furnace. TRMs can provide factors to be used for estimating such affects for measures. They can be multipliers, less than or greater than 1.0, to multiply by the gross savings directly determined. Or they can be in the form of additions or subtractions for the same or other fuel use changes associated with the measure, the most common being changes in natural gas consumption associated with measures primarily designed to reduce electricity consumption or demand.
Here are two examples (values are provided for illustrative purposes only).
• For lighting retrofits installed in a commercial building with air conditioning and variable air volume ventilation systems, add 15% to the annual electricity savings calculated for the savings directly associated with the lighting system. Thus, total annual electricity savings equal 1.15 times the lighting system annual electricity savings.
• For lighting retrofits installed in residential buildings with natural gas furnaces, indicate an increased natural gas consumption of 1,000 Btu/year for each annual kWh reduction of electricity savings directly associated with the lighting system.
To account for the interaction between two or more efficiency measures, assumptions must be made regarding the order in which measures are applied. For example, to estimate the savings from efficient clothes washers and dryers, the dryer might be assumed to be the second measure. This assumption is made to account for the reduction in remaining moisture content in clothes washed in high efficiency clothes washers which result in less dryer savings than if an inefficient washer was used to first clean (and spin) clothes. Accounting for measure interactions in this way ensures that when both measures are installed, the total savings is correct.
Deemed Variables (e.g., operating hours, coincidence factors, and weather data). An efficiency measure’s performance, including associated energy and demand savings is determined by many variables. As discussed in Chapter 2, for “pure prescriptive measures,” fully deemed savings values are used. On the other hand, the EM&V
125 The assumption made regarding the persistence of savings beyond the EUL of a measure has implications for cost-effectiveness analysis, resource planning, and emission reductions. If it is assumed that savings do not persist, then consistent treatment from the perspective of cost-effectiveness, resource planning, and emissions reduction would mean that there are no future measure costs and loads, and emissions should be assumed to rebound to their prior levels. On the other hand, if savings are assumed to persist, then, from a resource planning and emissions reduction perspective, the reduction of both loads and emissions persists. From a cost-effectiveness perspective, the cost of installing equipment with equivalent efficiency or maintaining efficiency practice should be included in the analysis.
AVERAGE VERSUS SITE-/ PROJECT-SPECIFIC VALUES
When using deemed variables and factors, versus project- or site-specific measurements, the resulting savings values are usually average or typical values (e.g., based on average weather conditions or operating hours) versus the “actual” savings, which would be based on actual, measured conditions (e.g., the actual weather or number of operating hours in any given year).

June 2017 www.seeaction.energy.gov 89
analysis tools and the important variables used for “pure custom” measures are all assessed on a case-by-case basis. For measures that are somewhere in between, neither fully prescriptive nor fully custom, measure energy and demand savings are derived through a combination of deemed calculations with both deemed and site- or project-specific actors and variables—resulting in what is known as partially deemed savings values. For these in-between measures, TRMs may include deemed variables or factors such as weather data, equipment operating hours, load shapes, and coincident factors for converting annual energy savings (e.g., KWh) into average demand savings (e.g., kW). 126 For example, numerous TRMs contain commercial sector lighting efficiency savings calculators. These deemed savings calculators allow the user to input the site-specific existing lighting system characteristics, but he or she may use deemed hours of use and space conditioning interaction factors.
Which variables are relevant to calculating impacts is a question that is often decided by common sense, experience, program characteristics, or budget considerations (with respect to how many variables can be measured and tracked), but it also can be determined through field experiments and statistical tests. In practice, the two most commonly used variables are weather data and operating hours, and these can be provided in TRMs as deemed variables.127 For example, a TRM may indicate four sets of weather data—one each to be applied for measures installed in one of the four climate zones in a state covered by the TRM.
Operating hours are typically associated with lighting and HVAC equipment. TRMs can list operating hours to be used in deemed calculations for measures involving these types of equipment. The following are two examples:
• For lighting retrofits, annual energy savings are defined as the change in wattage from the baseline lighting system to the efficient lighting system multiplied by annual operating hours. Tables of annual operating hours are included in the TRM, organized by building type (office, hospital, school, etc.) and by lighting use (private offices, common areas, bathrooms, etc.)
• For air-conditioning retrofits, annual energy savings are defined as the change in hourly electricity consumption from the baseline cooling system to the efficient cooling system, operating at full capacity, multiplied by annual equivalent full-load hours (EFLH). Tables of EFLH values are included in the TRM, organized by building type (office, hospital, school, etc.) and by climate.128
Weather data are used to adjust savings for measures that are dependent on the climate in which they are installed, such as those involving weatherization and HVAC systems.129 There are a wide range of public and private weather data sources available. TRMs may provide actual data or cite specific sources to be used, the most common being weather data provided by the National Weather Service. The National Weather Service data are derived from daily temperature observations at nearly 200 major weather stations in the contiguous United States.130
126 More, and more reliable, data on operating hours, load shapes, coincident factors, and persistence of savings are areas where additional research would be very helpful for improving the reliability of energy savings values. 127 Other common variables include building type, vintage, and space conditioning system type. 128 Equivalent full-load cooling hours (EFLHc) are the number of hours an air conditioner would have to operate at full load to equal the amount of cooling delivered by the system at a constant thermostat setting over a cooling season. Equivalent full-load heating hours (EFLHh) are analogous to EFLHC for heating systems. Variations in the exact definition of this term and how it is to be used do vary, and, as with other variables, it should be used with caution, such as when it used with heat pumps that may be assessed with similar heating seasonal performance factors (HSPF) or cooling seasonal performance factors (CSPF) or other factors. 129 The most commonly considered weather variables are heating and cooling degree days, HDD and CDD. A degree-day is a measure of the heating or cooling load on a facility created by outdoor temperature. It is a quantitative index demonstrated to reflect demand for energy to heat or cool homes and commercial buildings. When the mean daily outdoor temperature is one degree below a stated reference temperature, such as 64°F (18°C), for one day, it is defined as one heating degree day. If this temperature difference prevailed for ten days, ten heating degree days would be counted for the total period. If the temperature difference were to be 12 degrees for ten days, 120 heating degree days would be counted. When the ambient temperature is below the reference temperature, heating degree days are counted. When ambient temperatures are above the reference, cooling degree days are counted. From ASHRAE Guideline 14-2014. 130 NOAA. Climate Prediction Center. www.cpc.ncep.noaa.gov/products/analysis_monitoring/cdus/degree_days/ddayexp.shtml.

June 2017 www.seeaction.energy.gov 90
Non-Energy Impacts. Beyond energy and demand savings, there are many impacts associated with efficiency programs that are commonly called non-energy benefits (NEBs) or, perhaps more accurately, non-energy impacts (NEIs), because these impacts can be positive or negative. NEIs can be categorized as those accruing to the utility system, society as a whole, and individual participants. Some research indicates that the value of benefits to society as a whole and individual participants make up the bulk of the value of NEBs (versus utility system NEBs).131, 132
Even though few, if any, TRMs include more than a limited number of NEIs at most, however, NEIs could be included in the future and thus are briefly described here.133 One of the common participant, NEBs accounted for in TRMs is water savings from more efficient showerheads, aerators, and clothes washers. Some other examples of NEBs that could be included in TRMs are reduced air emissions and other environmental benefits, productivity improvements, health benefits such as reduced asthma cases, jobs created and local economic development, reduced utility customer disconnects, greater comfort for building occupants, and lower maintenance costs due to better equipment.134 In organized electricity markets (e.g., Midwest Independent System Operator, PJM Interconnection, ISO-New England),135 the impact of reduced energy and capacity demands on market prices resulting from energy efficiency is referred to as demand response induced price effects or DRIPE. This efficiency program benefit could be considered either an energy impact or NEI and might also be included in TRMs.136
In terms of including deemed values for NEIs, when this does occur, it is typically added at the program or portfolio level and not at the measure level.137 This is because assessing NEIs can be a complex task, and attributing specific NEIs to specific measures can be difficult. However, certain NEIs can be assigned values based on a presumed relationship between energy savings and environmental impacts. These NEIs include water savings and avoided emissions. While caution should be used due to the wide range of influences that determine NEIs, factors such as gallons of water savings or pounds of nitrogen oxide (NOx) reduction per kWh reduction are commonly assumed.138 Such NEI values can be presented and documented in TRMs for use in assessing the overall benefits of efficiency measures, as well as their cost-effectiveness.
131 Skumatz et al. 2010. Pages 27–29. 132 Skumatz 2015. Pages 6–7. 133 For example, Arkansas only recently adopted NEIs calculations in Volume 1 of its TRM Version 6, focusing first on easily quantifiable NEIs. www.apscservices.info/EEInfo/TRM6.pdf. 134 In some cases an energy efficiency measure may increase costs, such as higher maintenance costs due to a new and more complex system. In those cases the measure should be assigned a non-energy cost. 135 MISO is Midwest Independent System Operator, PJM is PJM Interconnection (also a regional transmission organization), and ISO-New England is another regional transmission organization. 136 A recent SEE Action report provides a more thorough discussion of DRIPE. See State and Local Energy Efficiency Network, 2015b. https://www4.eere.energy.gov/seeaction/system/files/documents/DRIPE-finalv3_0.pdf. 137 The exception to this practice is that resource savings, such as water or labor, that are directly attributable to a specific energy efficiency measure are typically assigned directly to that measure. 138 There are tools and resources for estimating emissions impacts, including published emission factors and manufacturer specifications for direct fuel using equipment (e.g., boilers, furnaces, gas water heater). The U.S. Environmental Protection Agency also offers two models, eGRID and AVERT, that can be used to translate electricity savings into emissions reductions. See the Emissions & Generation Resource Integrated Database (eGRID) at https://www.epa.gov/energy/emissions-generation-resource-integrated-database-egrid and Avoided Emissions and Generation Tool (AVERT) at https://www.epa.gov/statelocalclimate/avoided-emissions-and-generation-tool-avert.

June 2017 www.seeaction.energy.gov 91
Appendix 3. Industry Standard Energy Efficiency Evaluation, Measurement, and Verification Resources and Protocols
A3.1. Energy Efficiency Program Evaluation Resources
A3.1.1. SEE Action Energy Efficiency Program Impact Evaluation Guide139
This industry standard guide to EM&V describes and provides guidance on approaches for determining and documenting energy and NEBs resulting from energy efficiency programs and portfolios of programs funded by utility customer funds. It specifically focuses on impact evaluations for programs designed to reduce facility (e.g., home, commercial building, factory) energy consumption, demand, or both—as well as related air emissions.
A3.1.2. SEE Action EM&V Portal140
The State and Local Energy Efficiency Action Network (SEE Action) offers resources, discussion forums, and technical assistance to state and local decision makers as they provide low-cost, reliable energy to their communities through energy efficiency.
A3.2. Industry-Standard M&V Protocols and Guidelines
A3.2.1. IPMVP: International Performance Measurement and Verification Protocol141
The IPMVP provides an overview of current best practices for determining and verifying results of energy efficiency Internationally; it is the most recognized M&V protocol for demand-side energy activities. The IPMVP provides a framework and definitions that can help practitioners develop M&V plans for their projects. It includes guidance on best practices for determining savings from efficiency projects.
A3.2.2. Uniform Methods Project142
Published by DOE, UMP protocols provide standardized, common practice M&V methods for determining gross energy savings for many of the most common residential and commercial measures and programs offered by administrators of energy efficiency programs in North America for utility customers. UMP also includes cross-cutting protocols for topics such as net savings determination, metering, and persistence of savings determination.
A3.2.3. FEMP M&V Guidelines: Measurement and Verification for Performance-Based Contracts, Version 4.0143
The purpose of this document is to provide guidelines and methods for documenting and verifying the savings associated with federal agency performance contracts. It contains procedures and guidelines for quantifying the savings resulting from energy efficiency equipment, water conservation, improved operations and maintenance, renewable energy, and cogeneration projects.
139 https://www4.eere.energy.gov/seeaction/publication/energy-efficiency-program-impact-evaluation-guide. 140 https://www4.eere.energy.gov/seeaction/topic-category/evaluation-measurement-and-verification. 141 Efficiency Valuation Organization (EVO). International Performance Measurement and Verification Protocol (IPMVP). Multiple dates. www.evo-world.org. 142 http://energy.gov/eere/about-us/ump-protocols. 143 http://energy.gov/eere/femp/downloads/mv-guidelines-measurement-and-verification-federal-energy-projects-version-40.

June 2017 www.seeaction.energy.gov 92
A3.2.4. ASHRAE Guideline 14-2014: Measurement of Energy and Demand Savings. American Society of Heating, Refrigerating and Air-Conditioning Engineers144
Guideline 14 provides a standardized set of energy, demand, and water savings calculation procedures. This publication provides guidance on minimum acceptable levels of performance for determining energy and demand savings, using measurements, in commercial transactions
144 American Society of Heating, Refrigerating and Air-Conditioning Engineers. www.ashrae.org.

This information was developed as a product of the State and Local Energy Efficiency Action Network (SEE Action), facilitated by the U.S. Department of Energy/U.S. Environmental Protection Agency. Content does not imply an endorsement by the individuals or organizations that are part of SEE Action working groups, or reflect the views, policies, or otherwise of the federal government.