sedimentary archives reveal the concealed history of
TRANSCRIPT
HAL Id: hal-02894958https://hal.archives-ouvertes.fr/hal-02894958
Submitted on 9 Jul 2020
HAL is a multi-disciplinary open accessarchive for the deposit and dissemination of sci-entific research documents, whether they are pub-lished or not. The documents may come fromteaching and research institutions in France orabroad, or from public or private research centers.
L’archive ouverte pluridisciplinaire HAL, estdestinée au dépôt et à la diffusion de documentsscientifiques de niveau recherche, publiés ou non,émanant des établissements d’enseignement et derecherche français ou étrangers, des laboratoirespublics ou privés.
Sedimentary Archives Reveal the Concealed History ofMicropollutant Contamination in the Seine River Basin
Sophie Ayrault, Michel Meybeck, Jean-Marie Mouchel, Johnny Gasperi,Laurence Lestel, Catherine Lorgeoux, Dominique Boust
To cite this version:Sophie Ayrault, Michel Meybeck, Jean-Marie Mouchel, Johnny Gasperi, Laurence Lestel, et al.. Sed-imentary Archives Reveal the Concealed History of Micropollutant Contamination in the Seine RiverBasin. In ” The Seine River Basin, Hdb Env Chem”. Sedimentary Archives Reveal the ConcealedHistory of Micropollutant Contamination in the Seine River Basin, 90, SPRINGER, 2019, 978-3-030-54259-7. �10.1007/698_2019_386�. �hal-02894958�

Sedimentary Archives Reveal the ConcealedHistory of Micropollutant Contaminationin the Seine River Basin
Sophie Ayrault, Michel Meybeck, Jean-Marie Mouchel, Johnny Gaspéri,Laurence Lestel, Catherine Lorgeoux, and Dominique Boust
Contents
1 Introduction2 Long-Term Reconstruction of Past Contamination Trajectories Based on River Sedimentary
Archives2.1 Conceptual Steps for the Study of Contaminants in Cores2.2 Contamination Fluxes Estimated from Floodplain Cores2.3 Circulation of Contaminants Within River Basins
3 The Seine River Basin and Its Contamination by Micropollutants3.1 The Seine River Basin: A Sensitive Territory Under High Pressures3.2 Regulatory Surveys Failed to Assess Micropollutants (1971–2006)3.3 Spatial Position of Sedimentary Archives Within the Seine River Basin3.4 Core Dating
4 The Evolution of the Seine River Basin Contamination (1910–2015) Unveiled fromSediment Cores4.1 Temporal Evolution of Persistent Organic Pollutants at the Basin Outlet
and in the Estuary4.2 Metals (Ag, Cd, Cr, Cu, Hg, Ni, Pb, Sb, Zn) and Arsenic (As) at the Seine River Outlet
(1935–2005)4.3 Antibiotics at the Seine River Outlet (1954–2004)
S. Ayrault (*)Université Paris-Saclay, Laboratoire LSCE, CEA-CNRS-UVSQ, Gif-sur-Yvette, Francee-mail: [email protected]
M. Meybeck, J.-M. Mouchel, and L. LestelSorbonne Université, CNRS, EPHE, UMR Metis, Paris, France
J. GaspériUniversité Paris-Est, Laboratoire LEESU, Champs-sur-Marne, France
C. LorgeouxUniv Lorraine, CNRS, GeoRessources, Nancy, France
D. BoustIRSN, Institut de Radioprotection et de Sûreté Nucléaire, Laboratoire de Radioécologie deCherbourg-Octeville (LRC), Cherbourg, France
Nicolas Flipo, Pierre Labadie, and Laurence Lestel (eds.), The Seine River Basin,Hdb Env Chem, DOI 10.1007/698_2019_386, © The Author(s) 2019

5 Intra-basin Comparisons in the Seine River Basin Reveal Contrasted Trendsin Subbasins5.1 Compared Metal Contamination History: The Cadmium Example5.2 Compared POP Contamination History: The PAH Example
6 Interbasin Comparison of Metal Contamination Trends in Western European Rivers UsingSedimentary Archives
7 Circulation of Material Within Basins and Its Impact on River Fluxes7.1 Leakage Ratio of Metals Within the Seine River Basin (1950–2005)7.2 Intercomparison of River Contaminant Fluxes in Relation to Their Population in Western
European Rivers8 Trajectories of the Environmental Issues Affecting River Basins and Society: Example
of PCB Contamination in the Seine River Basin9 ConclusionsReferences
Abstract Sedimentary archives provide long-term records of particulate-boundpollutants (e.g. trace metal elements, PAHs). We present the results obtained on aset of selected cores from alluvial deposits within the Seine River basin, integratingthe entire area’s land uses upstream of the core location, collected upstream anddownstream of Paris megacity and in the estuary. Some of these cores go back to the1910s. These records are complemented by in-depth studies of the related pollutionemissions, their regulation and other environmental regulations, thereby establishingcontaminant trajectories. They are representative of a wide range of contaminationintensities resulting from industrial, urban and agricultural activities and their tem-poral evolution over a 75,000 km2 territory. A wide set of contaminants, includingmetals, radionuclides, pharmaceuticals and up to 50 persistent organic pollutants,have been analysed based on the Seine River sediment archives. Altogether, morethan 70 particulate contaminants, most of them regulated or banned (OSPARconvention, European Water Framework Directive (WFD 2000/60/EC)), were mea-sured in dated cores collected at 7 sites, resulting in a large data set.
After drawing a picture of the literature devoted to sedimentary archives, thefindings resulting from several decades of research devoted to the Seine River basinwill be used, together with other studies on other French and foreign rivers, toillustrate the outstanding potential of sedimentary archives. The limitations of usingsedimentary archives for inter-site comparison and the approaches developed in thePIREN-Seine to overcome such limitations such as selecting pertinent indicators(specific fluxes, per capita release, leakage rate, etc.) will be described. The verycomplex interactions between humans and their environment will be addressedthrough questions such as the impact on the spatial and temporal trajectories ofcontaminants of factors such as wastewater management, deindustrialisation withinthe Seine River basin, implementation of national and EU environmental regula-tions, etc. This chapter will show how such studies can reveal the persistence of thecontamination and the emergence of new pollutants, e.g. antibiotics. It will proposeindicators for the evaluation of the environment resilience and the efficiency ofenvironmental policies.
S. Ayrault et al.

Keywords Contaminant trajectories, Emerging pollutants, Metals, Persistentorganic pollutants, Sediment archives
1 Introduction
Sedimentary archives have been used since the early 1970s to reconstruct the pastcontaminant contents of river particles settled in the river continuum, particularlyin the United States. They were used to reconstruct the past contamination ofthe Chesapeake Bay [1], the progressive eutrophication of the Great Lakes andtheir gradual contamination with mercury [2] and polychlorinated biphenyls(PCBs) [3]. Cores taken in the Mississippi River Delta integrate the contaminationover 3.2 M km2 [4, 5] for trace metals, polycyclic aromatic hydrocarbons (PAHs)and chlorinated organic compounds. Their analysis demonstrated that the lead(Pb) profile showed a doubling of concentrations from 1900 to 1970, followed bya significant decline of Pb contamination over this wide territory. These trends couldnot be demonstrated by the regulatory monitoring performed on filtered and unfil-tered (whole-water) water sample pairs [6]: the analysis of a single core providedmore valuable results on river contamination than 15 years of water quality surveysover the entire United States. To overcome the difficulties raised by this protocol,between 1991 and 2015, the United States Geological Survey (USGS) added theanalysis of fine deposited river sediments to regulatory monitoring (Horowitz, pers.comm.) The sedimentary archive approach was then recommended by the NationalOceanic and Atmospheric Administration (NOAA) [7].
In Europe, sedimentary archives were also considered in the 1970s in Alpinelakes [8] and the Rhine River delta [9]. In this basin, contamination for As, Cd, Cr,Cu, Hg, Ni, Pb and Zn started before 1920 and peaked in the 1970s, a trendconfirmed later [10]. Most of these studies focused on the evolution of contaminantlevels, generally at the river mouth or in deltas, therefore integrating the whole riverbasin.
In France, sediment archive analysis started with the metal contamination in theGaronne estuary (Gironde) [11] and then in the Lot reservoirs, a tributary of theGaronne, downstream of a former zinc mining site, which was the major source ofZn and Cd for this system [12, 13]. More recently, sediment cores have beenanalysed in the Seine basin [14, 15], the Loire basin [16] and the Rhône basin[17, 18]. In addition to trace elements and persistent organic pollutants (POPs),pharmaceutical products have been analysed more recently [19, 20]. This brief andnon-comprehensive review does not cover the many lake cores analysed in France[21]. At all French sites, the sediment archives reveal the evolution of micropollutantcontamination for the period when their regulatory analyses in water were limited orinsufficient (<1990s) and long before, over periods that may exceed 100 years.
Apart from some notable exceptions, the archive-based studies, conducted bygeochemists, have rarely documented the river basin history, which is needed to
Sedimentary Archives Reveal the Concealed History of Micropollutant. . .
correlate the sediment archives with the evolution of the river basin upstream of thecoring site, and its complex interactions with societies.
The interdisciplinary approach, developed by the PIREN-Seine to go further thana geochemical description of the contamination trends, is presented in Sect. 2.Section 3 briefly presents the Seine River basin, our coring strategy and coreanalysis. Greater detail on the basin and its pollutant sources can be found in otherchapters of this volume and in original papers for coring, dating and analysis details.Sections 4–7 present the different steps of the historical reconstruction of the basincontamination to allow for intra- and interbasin comparisons, as conceptualised inFig. 1, illustrated with different particulate contaminants. The final section links thesediment archives with the basin history (past pressures, awareness, conflicts,societal responses and regulations, creation of institutions), i.e. defining the contam-ination trajectory, taking PCB as an example.
2 Long-Term Reconstruction of Past ContaminationTrajectories Based on River Sedimentary Archives
2.1 Conceptual Steps for the Study of Contaminants in Cores
These studies can be schematised by a succession of steps, from the most commonones to those developed on the Seine River by the PIREN-Seine programme, asfollows.
Step A. Depth contaminant profile: cored fine sediments – clay and silt deposits –are sliced, and then targeted contaminants are analysed on each slice. To minimisethe effect of grain size on the contents of pollutants, samples can be sieved at theclay–silt fraction, typically <63 μm. Al, Th or Sc should also be measured asquantitative tracers of this fraction. Particulate organic pollutant contents are oftennormalised to the particulate organic carbon (POC). When the sedimentation rate isregular, the slices are averaged temporal windows, e.g. yearly averages. The bestcores (e.g. lakes and reservoirs) provide an annual resolution. Cores taken in alluvialplains record the deposits corresponding to high flows and floods: the temporalrecord is more fragmented. Sometimes a single flood event corresponds to a multi-centimetre layer.
Step B. Core dating: generally using the measurement of Cs-137, an artificialradioisotope which provides three temporal markers: (1) the Cs-137 emergence in1945, (2) a first maximum in 1962 originating from atmospheric nuclear test bombsand (3) a second and sharper maximum generated by the Chernobyl nuclear accidentin 1986; Pb-210 decay can be used as well [22]. The evolution of the sedimentationrate is then used to convert the depth profile into a temporal evolution of contam-ination. Reliable geochemical tracers for dating before 1945 are lacking.
S. Ayrault et al.

Fig. 1 Environmental contamination history based on multistep analysis of sedimentary archives,from state to environmental indicators and trajectories
Sedimentary Archives Reveal the Concealed History of Micropollutant. . .
Step C. Temporal evolution of contamination and normalisation. The contami-nant contents expressed on a dry weight basis (μg g�1 dw) are presented on atemporal scale. If the core slices are relatively thick, this evolution is presented asa succession of average contents in time slices. At this stage, there are two differentoptions to interpret these profiles: (1) in the geochemical approach for metals,enrichment factors (EF) represent the excess contamination, which are the contentsat time t doubly normalised to the background contents determined in naturalconditions and to a tracer of the finer fraction. A variation of EFs is the Igeo index[23], which has a geometric progression to account for the increase of EFs, up to twoorders of magnitude; (2) the regulatory approach is based on environmental qualitystandards for sediment quality or predicted no-effect concentrations [24]. Before the1990s, these criteria were not available in France.
Once dated and normalised, the results can be used to compare how variouspollutants have evolved at a given station (Step D), to compare stations within agiven basin (Step E) and finally to compare basins (Step F). The understanding ofthese pollution trajectories needs historical socio-economic data (Steps G–K), as willbe discussed in the following sections.
2.2 Contamination Fluxes Estimated from Floodplain Cores
In this approach, the average composition of the core at a given period is multipliedby the sediment flux for the same period to generate the contaminant flux. Thenexcess river fluxes are calculated [25].
This approach has several limitations, however. The extension of core analysis toriver contaminant fluxes is based on the following hypothesis: (H1) these depositsrepresent the flux-averaged quality of the particles carried by the river; (H2) oncedeposited (without hiatus, which makes the age model uncertain), these particles arenot (bio)turbated; and (H3) the targeted compounds do not decompose (H4) ormigrate in the profiles. This set of assumptions is applied only over a long period,i.e. decades and more, considering that the contaminant fluxes are first controlled bythe evolution of the chemical composition of river suspended particulate matter(SPM) much more than sediment fluxes. Note that H1 is discussed for metals andradionuclide trends in [26]. The interpretation should also take into account thepossible retention of contaminated particulates in the river basin [27], as in reser-voirs, which could result in a decreased leakage not connected to environmentalmeasures (e.g. reduction of point pollution sources). In some basins, the sedimentloads can be reduced up to 95% as a consequence of large dam or reservoircascades [28].
In the Seine River, some of these hypotheses have been checked. Floodplainparticles are generally deposited from the peak discharge throughout the receding
S. Ayrault et al.

stage. Cd analysis on river SPM during Seine River floods has shown that actuallythe maximum content is observed at the receding stage, i.e. when particulates settlein the floodplain [29], so that the sediment contamination is not underestimated andhypothesis H1 is satisfied. For the assessment of excess metal fluxes, the effect ofinterannual variations of suspended loads (H2) is minimised by taking a 2 to 5 cmcore slice, homogenised and then analysed (corresponding to an average period of4–6 years, depending on the sedimentation rate), to which an average Seine Riverinterannual sediment load (700,000 t year�1; [30]) has been attributed throughout thecore. In some cores of the Seine River (e.g. [14]), the Cs-137 peak maximum is veryhigh, an indication of the limited mobility of this element and the absence of post-depositional bioturbation (H3, H4).
Finally, it must be remembered that sediment transport in fluvial systems resultsin a mixing of particulates of various ages of mobilisation/remobilisation, rangingfrom a few hours (remobilised bottom sediments) to a few hundred years and more(erosion of floodplain banks). Thus, the comparison of contemporary river output ofpolluted particles to the present-day circulation of material is an approach that ismostly used to compare the life cycle of different chemicals (they are affected by thesame bias) or to assess the general trend of exported pollutants. These reservationsexplain why modelling particulate pollutant transfer in the anthroposphere is sodifficult.
2.3 Circulation of Contaminants Within River Basins
The river’s excess fluxes of particulate contaminants are then compared to thecirculation of products and materials within the anthroposphere, i.e. the materialflow [31] such as imports and exports, transformation and use of products andrecycling (e.g. for metals). In the case of metals, one should also take into accountmining and smelting, which are not always present within the river basin interceptedby the core. The anthroposphere also gradually stores contaminants in contaminatedsoils, infrastructures, etc. In large basins, only a very small proportion of thisenormous cycling of material actually leaks into the aquatic environment. In smallurban streams, it may be greater. Such material flow analysis has been done for Parisfor the metal circulation [32, 33] and for the whole basin for specific elements suchas nitrogen and phosphorus [34]. Fluvial sediment archives are key elements in thevalidation of contaminant circulation in river basins. They concern environmentaltransfers between the major Earth system components – atmosphere, biosphere,hydrosphere, soils and sediments – which intercept different diffuse and pointsources of contamination, which are considered as leaks to the river system: con-taminated atmospheric fallout, agricultural runoff (sometimes impacted by reuse ofurban sewage sludge on cropland), sewage outfalls and leaks from waste dumps.
The ratio of the exported river pollutant fluxes to the circulation of the relatedmaterial within the intercepted basin generates the leakage ratio (Fig. 1, Step H), adimensionless factor, which is a performance indicator for regulation measures
Sedimentary Archives Reveal the Concealed History of Micropollutant. . .
(pressures/driver). Another indicator of environmental pressure, rated to the basinpopulation, is the per capita excess load (Fig. 1, Steps I and J), i.e. the excess fluxdivided by the basin’s population upstream of the coring station (ELcap), expressedin g cap�1 year�1. Both indicators can be used to compare the efficiency ofenvironmental regulations in river basins and their trajectories, provided that pastmetal contents are reconstructed on the basis of dated sediment archives and pastmetal demands are recovered by an analysis of the area’s economic history[25, 35, 36].
3 The Seine River Basin and Its Contaminationby Micropollutants
The Seine River basin has one of the highest ratios of pressures to river sedimentfluxes, which results in a very high contamination level in the lower Seine River,downstream of Paris. This contamination by metals and by numerous organicpollutants was not assessed before 2006 when new monitoring strategies wereapplied, following the EU Water Framework Directive (WFD). At that time, thefirst cores taken in the Seine River basin revealed the unknown long-term history ofcontamination, which reached very severe levels, when compared to current sedi-ment quality guidelines.
3.1 The Seine River Basin: A Sensitive Territory Under HighPressures
In addition to the pressures (e.g. climate, morphology, land use, etc.) describedearlier in this volume [37], the basin is characterised by a highly biased populationdistribution: about 70% of the basin’s population is concentrated in the Parismegacity (2,750 km2 with ten million inhabitants), which covers only 4% of thebasin area. The upper Seine River and Marne tributary meet at Paris (Fig. 1 [37]),and the lower Seine River receives the other main tributary, the Oise River, down-stream of the Paris megacity. The Paris megacity’s main wastewater treatment plant(WWTP) at Achères, today called “Seine-Aval”, discharges the treated effluent justupstream of the Seine-Oise confluence, some 70 river km downstream of the centreof Paris. Its capacity gradually grew in three decades to 8 M people at the end of the1980s and then decreased to 6.5 M people because of the construction of additionalWWTPs, which still makes it the largest WWTP in Europe.
The lower Seine River is structurally very sensitive to wastewater inputs, due toits minimal sediment transport and, above all, to its limited summer dilution duringlow flows (110 m3 s�1).
S. Ayrault et al.

Most Seine River cores presented here intercept the 1945–2005 time window,which covers the reconstruction period after the World War II, from 1945 to 1974,also termed the Glorious Thirties. During that period, important changes and inno-vations occurred in the industrial sector. From 1970 to 2000, sewage collection andtreatment plants were generalised in the Paris megacity (ten million inhabitants),i.e. more than two-thirds of the contamination point sources. Industries, which usedto discharge their wastes directly into river courses, installed recycling processes andwere gradually connected to sewage networks after 1970 [25]. Many heavy indus-tries were delocalised outside the Paris area and then outside the Seine basin. Duringthat period, new types of products were consumed, new drugs were used, and someproducts were legally withdrawn.
Since its beginning, the PIREN-Seine programme launched a series of studies onparticulate micropollutants in the basin, particularly on metals [29, 38–41] and PCBs[42]. Other compounds such as PAHs, alkylphenols, PBDEs [15] and pharmaceu-ticals [19] were later studied. Various strategies have been set up: river profilesupstream and downstream of Paris, temporal variations with river flow and TSS atselected sampling stations, spatial distribution of the contamination using of freshfloodplain deposits [43], in-depth source inventories and circulation of compoundswithin the anthroposphere including atmospheric inputs. At the same time, the long-term history of human activities on the basin and of the social responses to waterquality issues was addressed [33, 44–46]. The selection of core sites, core analysisand interpretation greatly benefited from this accumulated knowledge.
3.2 Regulatory Surveys Failed to Assess Micropollutants(1971–2006)
In France, trace metals and chlorinated insecticides were first surveyed within threenational river quality inventories (1971, 1976 and 1981) on unfiltered waters, tocomply with World Health Organization (WHO) drinking water criteria. Analyseswere carried out 4 to 6 times per year at 25 key stations in the Seine River basin. Dueto substantial bias (contamination during field and laboratory operations, excessivequantification limits in untrained laboratories), the first water quality inventorycarried out by the newly created Agence de l’Eau Seine-Normandie (AESN) didnot provide usable data [47]. The first environmental assessment of the EuropeanEnvironmental Agency in 1994 [48] also failed to produce quantitative figures onmicropollutant concentrations.
The pioneering micropollutant studies in the Seine River basin were conducted onriver SPM and concerned trace elements such as Cd and Hg [49, 50]. These aca-demic studies failed to assess the state of extreme contamination they observed giventhe lack of sediment quality criteria and a reference natural background. Therefore,their use for environmental assessment remained very limited. The use of sedimentarchives had been recommended very early by marine scientists [51] and by the
Sedimentary Archives Reveal the Concealed History of Micropollutant. . .

Ministry of Transport’s technical laboratory [52], but this approach was not used bythe river basin authorities.
From 1982 to 1992, the six French river basin agencies developed their ownmonitoring strategies. The AESN turned to deposited sediments and rotating surveyson 204 sediment stations. The bed sediment analyses were carried out on the fraction<2 mm, i.e. including the sand fraction; unfortunately, ancillary data (e.g. % finefraction, aluminium), which would have allowed for grain-size effect correction,were lacking, limiting data interpretation [53]. The official assessment of the metalcontamination (Ministère de l’environnement, 1985) stated: “one finds high concen-trations only for copper: metals in sediments are low”. This statement ignored thesevere Cd and Hg contamination occurring at that time, gradually unveiled by thePIREN-Seine programme in the 1990s using SPM analysis (e.g. [41]). In 2006,the monitoring within the WFD considered the dissolved fraction only. It thereforeappears that the shifting strategies of micropollutant monitoring from 1971 to 2006did not generate a general spatial and temporal assessment for contamination.
The sediment quality guidelines (SQG) that were or could have been used toassess the contamination of micropollutants is another limitation to contaminationassessments. From 1971 to 2003, the guidelines concerning metal contaminationevolved considerably, depending on the media (e.g. unfiltered waters, agriculturalsoils, dredged river materials, urban sludges). For a long time, the SQG did not existin France, until they were finalised in 2003 by the French water quality assessmentsystem, the SEQ-Eau [54]; sediment guidelines were therefore replaced by the WFDcriteria on waters in 2006. Metal contamination in rivers has not been assessed on anational scale [55, 56], ignoring this critical issue.
3.3 Spatial Position of Sedimentary Archives Within the SeineRiver Basin
The core position within river systems should be chosen depending on the expectedenvironmental information. In the Seine River basin, our coring strategy has con-sidered very different positions of the intercepted basin area (Fig. 2). In addition, thecoring sites are geographically located in Fig. 1 [37]. Coring sites are listed inTable 1 and greater detail can be found in the related articles. Cores taken directlyfrom the river bed by a diver in 1994 [57], which cannot be dated, presented sharpcontamination boundaries, suggesting erosion of previous deposits, are not usedhere.
Our pristine or sub-pristine site (PRI) is a headwater reservoir, which interceptsforested area. The medium impacts are studied on two floodplain cores, downstreamof the city of Troyes (URB), on the Upper Seine River, and in the middle part of theOise River (IND), a major Seine River tributary impacted by heavy industries. Themaximum impact is assessed on a core taken 20 km downstream of the centre ofParis, in a navigated reach blocked by a sluice, which actually acts as a sediment trap
S. Ayrault et al.

for the main Paris combined sewer overflows (CSO) at low flows. The Seine Riverbasin outlet is sampled on floodplain cores (OUT1 and OUT2), at Muids andBouafles, near the outlet (Poses). Finally, an estuarine site on a harbour dock atRouen (EST) integrates both direct estuarine sources with the upstream river
Fig. 2 Schematic positions of sediment archives used in the Seine River basin (see text)
Table 1 Principal coring sites considered in the Seine River basin
Site (periodcovered)
Basinarea(km2)
Dpopa
(cap.km�2) Contaminantsb Reference(s)
EST Rouen har-bour(1965–2008)
75,000 208 Metals, major elements, lead iso-topes, radionuclides, PAH, PCB,PBDE, OCP
[26, 60, 61]
OUT1 Bouafles(1945–2004)
64,277 277 Metals, major elements, lead iso-topes, radionuclides, PAH, PCB,PBDE, alkylphenols, antibiotics
[14, 15, 19,60–63]
OUT2 Muids(1933–2003)
64,484 276 Metals, major elements, lead iso-topes, radionuclides, PAH
[14, 63, 64]
IND Chauny(1954–2004)
3,280 45 Metals, major elements, lead iso-topes, radionuclides
[14, 63]
CSO Chatou(no datablearchive)
44,670 na Metals (Cd, Cu, Pb, Zn, Fe) [65, 66]
URB Troyes(1972–2001)
3,410 47 Metals, major elements, lead iso-topes, radionuclides
[14, 63]
PRI Lac dePannecière(1931–2008)
917 9 Metals, major elements, lead iso-topes, radionuclides, PAH
[64]
na not availableaPopulation density (Dpop)bSee related articles for further detail
Sedimentary Archives Reveal the Concealed History of Micropollutant. . .

sources, particularly from major chemical industries, including P fertiliser produc-tion from phosphogypsum. The atmospheric inputs of contaminants are greater at thecore sites URB to EST [58].
Floodplain sites store the fraction of the sediment flux circulating during floods,usually during winter, and act as a temporary sediment trap. The SPM transported byhigh-flow and flood events in the Seine River, i.e. 10% of the time, was estimated forthe Marne River (12,900 km2) at 60% of the total annual flux [30], and samples fromfloodplains are therefore interesting candidates for the estimation of yearly fluxes.
At the Bassée floodplain, downstream of Troyes (URB), the sedimentation rate35 m from the river channel is 10 mm year�1 on average (5 mm year�1 at 70 m), andthe flooding frequency is 1.6 year�1 [30]. The Bouafles site, at the basin outlet(OUT1), underwent particular study, and 12 cores were retrieved between 2003 and2010. It was clear in the field that the site was under active accretion, with large treesburied above their roots. Unfortunately, in 2016, the inundated prairie was ploughed,evidencing the issue of on-site conservation of the archives in strongly anthropicbasins.
The sampling strategy is completed by the assessment of the natural backgrounds.For organic pollutants, the PRI core can be considered. For metals, a prehistoricreference sediment (REF1) is considered (Marne–Seine Rivers confluence at Paris-Bercy, dated 5,000 years BP). It is similar to another prehistoric estuarine sediment(REF2) [59].
3.4 Core Dating
With the notable exception of the cores from Chatou for which no age model couldbe drawn, the cores exhibiting a clear chronology based on the measurement ofradioactive tracers, 137Cs and 210Pb (and 238Pu for EST), were selected. All coreswere checked for a regular and fine-grain sedimentation profile. Core analyses aredetailed in the published papers quoted here.
4 The Evolution of the Seine River Basin Contamination(1910–2015) Unveiled from Sediment Cores
4.1 Temporal Evolution of Persistent Organic Pollutantsat the Basin Outlet and in the Estuary
4.1.1 Evolution of the River Basin at Its Outlet
The vertical profiles are represented for a set of different pollutants in Fig. 3. Sinceanalyses provide multielemental contents for a given chemical family for eachsample, the individual results are often clustered and given as “sum of”. As the
S. Ayrault et al.

conventions may have evolved over the last 50 years, for instance, for the sum ofPCBs, one must check if the same basket of molecules is considered.
Four organic pollutant (POPs) families, namely, 13 polycyclic aromatic hydro-carbons (PAHs), 15 polychlorinated biphenyls (PCBs), 3 alkylphenols (APs) and8 polybromodiphenylethers (PBDEs), were analysed on the Seine River outlet core[15]. The core provides detailed contamination records at a nearly annual scale. Eachof them exhibits a specific trend, which can be described by several metrics: (1) thestate of contamination at the core bottom, for those already featuring a contaminationin 1945, (2) the emergence date (Te), (3) the period of maximum (Tmax), (4) themultimodal or monoclinic evolution and (5) the recent – last 10 years – trend and itsslope.
The PAH profile reflects an old contamination associated with the use of coal fordomestic heating, industries and power plants in the Seine River basin, which hadnever been impacted by coal mining. Most particularly, the post-war reconstructionperiod, from 1952 to 1960, is clearly marked with the highest levels (up to90 mg kg�1 for ∑PAHs). A marked decrease of PAHs is observed between 1962and 1965, by a factor of 10. The present-day level is fairly stable at 10 mg g�1. Thisvery rapid decrease of PAHs in flood sediments after 1960 cannot be explainedsolely by changes in coal consumption for domestic heating but also reflects a majorindustrial transformation with the closure of several gas plants based on the distil-lation of coal and the reduction of coal use in the steel industry. After 1968, coal wasgradually replaced by fossil fuel in power plants, and contaminated sewage SPMwas reduced by urban water management at the basin scale. Pre-industrial levels ofPAHs – originating from fires – are not established; they should be a few mg kg�1 inthe sediments [67].
PCBs, PBDEs and APs have different contamination profiles, reflecting thepattern of use and regulations specific to each family. The starting points (Te) of
Fig. 3 POP contamination profiles (mg kg�1 dry weight) for PAHs, PCBs, alkyl phenols andpolybromodiphenylethers (PBDEs) in the Seine River floodplain core OUT1 [15]
Sedimentary Archives Reveal the Concealed History of Micropollutant. . .

contamination correspond to the dates of their first industrial uses: the 1950s forPCBs, 1960s for APs and 1970s for PBDEs. PCBs and PBDEs present a sharpincrease, while AP increases are more gradual. The Tmax occurred between 1960and 1972 for PCBs, between 1965–1975 and 1985–1995 for APs and after 1990 forPBDEs. Finally, each of these peaks is followed by a period of sharp decrease,according to the regulations and the means of available substitution products. Forexample, a rapid decay of PCBs from 1972 to the 1980s was observed, followed by aslower period of decay. This trend is further discussed in Sect. 8. For APs, a rapiddecrease has been observed since 1992 following the gradual restriction of their use,initiated by the OSPAR convention on pollutant inputs into the Atlantic Ocean anddue to their substitution in detergents by other compounds such as PBDEs, whichshow a plateau pattern over the 1995–2005 period.
4.1.2 Evolution of Contamination in the Estuary
The EST core was sampled in a harbour dock that can be considered a perfectsediment trap when considering the 137Cs profile used for dating and the sub-annualdefinition (1 cm year�1) of the analysed layers, which provides a highly detailedrecord of the temporal variations of 95 potentially hazardous compounds (Fig. 4)[26]. The contamination pattern is similar to those observed in the OUT1 core forPCBs, with maximum contents in 1970–1975. The comparison of actual PCB levels
Fig. 4 Evolution of POPcontamination in the Seineestuary sediment core EST(1970–2008) [26]
S. Ayrault et al.

between the two cores is difficult because the analyses do not consider the samecompounds. The content of dichlorodiphenyldichloroethane (DDE), a degradationproduct of dichlorodiphenyltrichloroethane (DDT), a chlorinated insecticide useduntil 1970, drops sharply after its total ban in the early 1970s.
4.2 Metals (Ag, Cd, Cr, Cu, Hg, Ni, Pb, Sb, Zn) and Arsenic(As) at the Seine River Outlet (1935–2005)
Considering the OUT1 trends, the maximum metal EF occurred before 1965 (Fig. 5).Metal regulation started in the 1970s (Circulaire July 4, 1972, limiting the metaldischarges from the surface treatment industry) so that the decontamination started~10 years before the social responses to contamination. This pattern is first due to theindustrial delocalisation outside of the centre of Paris and then from its suburbs;second, to changes in industrial practices, which include the gradual recycling ofmetals (e.g. in plating, in the 1980s); and third, to gradual use restrictions and thenbans on Cd (its use as pigment was banned in 1995), Hg (in thermometers in 1999)and leaded gasoline (2000) [36].
Fig. 5 Evolution of metal enrichment factors – 5-year averages – in the Seine River sedimentarchives at the basin outlet OUT1 (1935–2005) [25]
Sedimentary Archives Reveal the Concealed History of Micropollutant. . .

4.3 Antibiotics at the Seine River Outlet (1954–2004)
Several antibiotics were analysed on the Seine River outlet OUT1 core for a period of40 years (1954–2004) [19]. The temporal evolution of norfloxacin, flumequine,oxolinic acid, sulfamethoxazole and nalidixic acid is specific to each compound(Fig. 6). Norfloxacin was detected below its quantification limit in two slices out of45. Flumequine, oxolinic acid and nalidixic acid were accurately recorded: (1) theiremergence date in the record is 2–3 years after or before their assumed first use;(2) they present a general maximum near 1988 for flumequine, oxolinic acid andnalidixic acid. The progressive decrease could be due to (1) changes in the
Fig. 6 Evolution of antibiotic contents in sediment archives of the Seine River at its outlet (OUT1),from [19]. Vertical bars indicate the date of marketing authorisation
S. Ayrault et al.
prescription strategies of practitioners, (2) a general decrease in antimicrobial con-sumption between 2000 and 2005 and (3) constant improvements made in thecollection and treatment of wastewater coming from Paris and its suburbs duringthe last 40 years. Sulfamethoxazole has the least regular record and its detection lags12 years behind its assumed first use. The regularity and the coherence of theseprofiles are encouraging: this is the first demonstration that an antibiotic’s history canbe recorded in sedimentary archives, extending this approach to other types ofenvironmental indicators (e.g. [20]).
5 Intra-basin Comparisons in the Seine River Basin RevealContrasted Trends in Subbasins
5.1 Compared Metal Contamination History: The CadmiumExample
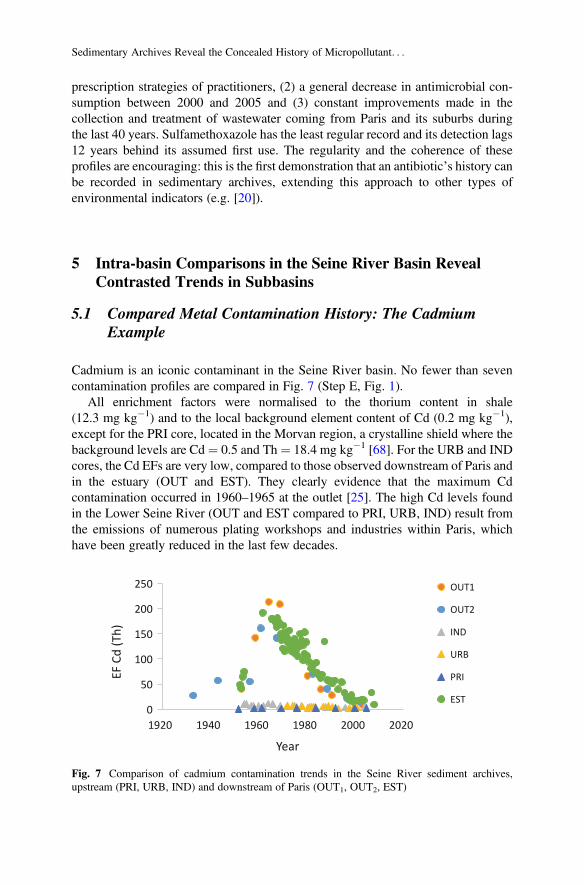
Cadmium is an iconic contaminant in the Seine River basin. No fewer than sevencontamination profiles are compared in Fig. 7 (Step E, Fig. 1).
All enrichment factors were normalised to the thorium content in shale(12.3 mg kg�1) and to the local background element content of Cd (0.2 mg kg�1),except for the PRI core, located in the Morvan region, a crystalline shield where thebackground levels are Cd¼ 0.5 and Th¼ 18.4 mg kg�1 [68]. For the URB and INDcores, the Cd EFs are very low, compared to those observed downstream of Paris andin the estuary (OUT and EST). They clearly evidence that the maximum Cdcontamination occurred in 1960–1965 at the outlet [25]. The high Cd levels foundin the Lower Seine River (OUT and EST compared to PRI, URB, IND) result fromthe emissions of numerous plating workshops and industries within Paris, whichhave been greatly reduced in the last few decades.
0
50
100
150
200
250
1920 1940 1960 1980 2000 2020
EF C
d (T
h)
Year
OUT1
OUT2
IND
URB
PRI
EST
Fig. 7 Comparison of cadmium contamination trends in the Seine River sediment archives,upstream (PRI, URB, IND) and downstream of Paris (OUT1, OUT2, EST)
Sedimentary Archives Reveal the Concealed History of Micropollutant. . .

In the estuary site, the main Cd peak is observed around 1970 and a second one isobserved in the late 1970s. A third very sharp peak is observed in 1987. These peaksare not observed in the OUT1 core, suggesting that the 1970, 1975–1980 and 1987estuary contamination episodes are due to very local events as the direct release ofphosphogypsum wastes from a fertiliser industry using Cd-rich ore. There has beencontinuous dumping of “phosphogypsum residues” from the phosphoric acid indus-try, treating phosphorus ores at several locations in the estuary. Such waste materialswere first released in the upper estuary, over several decades, then in the middleestuary and finally by barges in the outer estuary (Baie de Seine) with substantialoverspills. These dumpings were on the order of magnitude of the Seine Riversediment load (0.7 Mt. year�1 on average): 1974 (0.4 Mt. year�1) to 1987 (0.4Mt. year�1) with a maximum between 1980 and 1984 (1.6–2 Mt. year�1) [60]. TheEST core reveals this long-term impact on many metals and phosphorus (P contentup to 5,000 mg kg�1 in EST sediment vs 800 mg kg�1 for the basin reference) andfor Y, La and lanthanides, U, Cd, As, Cr, Mo, Th, Ba, etc. [26]. All show a markedincrease of their contents in the estuarine core with the same temporality as phos-phorus. This contamination source is estimated to account for 50–70% of theseelements’ contamination, reaching 90% for Y. This type of generalised contamina-tion by a mineral chemistry industry has rarely been documented.
These contaminations were superimposed to those originating from the upstreamriver basin: the EFs recorded in the estuarine sediments were extreme in the 1970s,from 100 to 1,000 for many elements (Hg, Pb, Ag, Cd), making this waterbody oneof the most polluted in Europe [69].
5.2 Compared POP Contamination History: The PAHExample
The comparison of the PAH contamination trends at five coring stations is illustratedin Fig. 8 (Step E, Fig.1). The sub-pristine site (PRI, Fig. 2) is considered to berepresentative of the non-impacted levels. Particle size analysis of the sediment corereveals that the core bottom layers (dated between 1952 and 1955) correspond to amixture of soil and sediment, which is consistent with the reservoir’s impoundmentdate (1949). Therefore, the analyses performed on layers deposited after 1955 areconsidered as representative of the contamination trend of this area of the basinwhere direct industrial and urban sources of contamination are minimal.
In the 1950s, the PRI PAH levels were below 0.2 mg kg�1. Then PAHs increased,possibly due to atmospheric inputs. The maximum levels reached 10 mg kg�1 (∑13PAHs). In 1992, the contamination was still present at 2 mg kg�1, which is five timesless than at OUT1 at the same time but remains high for this type of basin slightlyimpacted by anthropogenic pressure.
The PAH contamination at the Seine River basin outlet was assessed in threecores taken 10 km apart (two cores at OUT1 and one core at OUT2). This allows for a
S. Ayrault et al.

validation of the sediment archive approach: there is no significant PAH sourcebetween Muids and Bouafles and the two OUT1 cores should be identical. Actually,the contamination pattern is very similar in the three cores (date of maximumcontamination, slope of contamination and decontamination), which proves thereliability of the general trend. Small differences (less than 30%) in peak valuesmay stem from local patterns of sedimentation or sediment reworking.
Focusing on the 1970–2000 period, similar PAH decontamination rates areobserved in the outlet cores (OUT1 and the EST), but second-order peaks in 1997and 2004 showed by the EST core suggest a direct PAH source in the estuary. Also,the decontamination rates for OUT1 (3.0 � 0.3 mg kg�1 year�1) and for theupstream site (PRI) (2.8 � 0.2 mg kg�1 year�1) are very close, representative ofthe general decrease of PAH emissions at the scale of the Seine River basin, probablylinked to the decrease in coal consumption over this period (see Sect. 4.1).
6 Interbasin Comparison of Metal Contamination Trendsin Western European Rivers Using Sedimentary Archives
Interbasin comparisons can be performed at basin outlets which integrate the wholecatchment area (Fig. 1, F). The evolution of metals in nine rivers in Europe (RhineVolga and Danube, Mersey, Scheldt and Garonne) and in the Mississippi Deltashows various levels of contamination, highly controlled by the river SPM contam-ination level [70]: the Mississippi had the lowest EFs and the highest dilution power
0
5
10
15
20
25
30
1960 1970 1980 1990 2000 2010
Dock (EST)
Bouafles 11(OUT1)
0
20
40
60
80
100
120
1910 1930 1950 1970 1990 2010
Bouafles 10 (OUT1)
Pannecière (PRI)
Dock (EST)
Muids (OUT2)
Bouafles 11 (OUT1)
A BPA
H co
nten
ts (m
g kg
-1)
Fig. 8 (a) Comparison between the sum of PAH contents (13 PAHs, mg kg�1), in the Seine Riversediment archives, downstream of Paris (Bouafles and Muids sediment (black, grey and opentriangles)) with the upstream sub-pristine reference (Pannecière reservoir sediment, open squares).(b) Enlargement of the 1970–2010 period for basin outlet (Bouafles) and estuary (Dock). Thesecontents are also compared with estuary sediment (dark circles)
Sedimentary Archives Reveal the Concealed History of Micropollutant. . .
by erosion-derived SPM, while the Rhine and Seine Rivers show oppositecharacteristics.
The level of contamination of river sediment strongly depends on the ratio of thepressure over the dilution power (sediment load derived from erosion). The SeineRiver at its mouth has a much higher ratio than the Rhône or the Mississippi. Similarcontrol is observed for PAH contamination when comparing the Orge River, anurban sub-catchment of the Seine River, and other worldwide urban catchments [71].
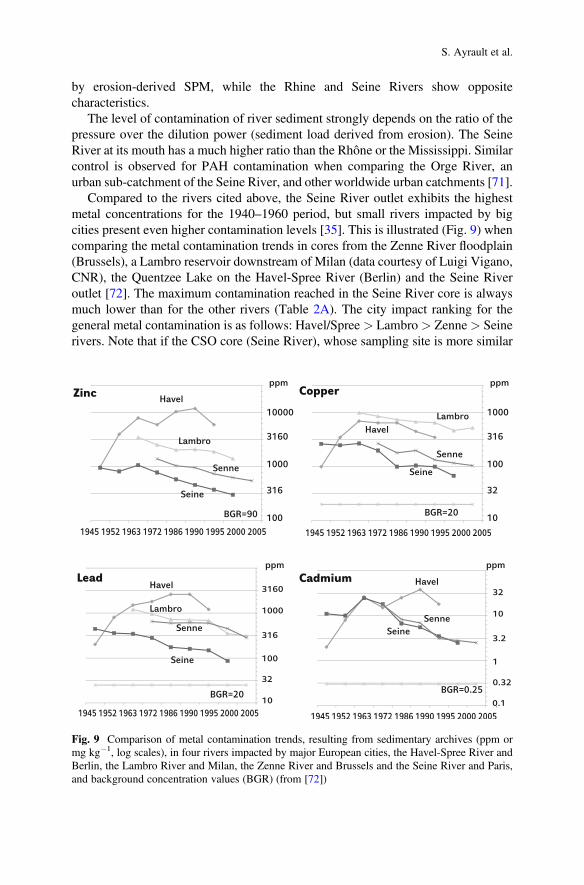
Compared to the rivers cited above, the Seine River outlet exhibits the highestmetal concentrations for the 1940–1960 period, but small rivers impacted by bigcities present even higher contamination levels [35]. This is illustrated (Fig. 9) whencomparing the metal contamination trends in cores from the Zenne River floodplain(Brussels), a Lambro reservoir downstream of Milan (data courtesy of Luigi Vigano,CNR), the Quentzee Lake on the Havel-Spree River (Berlin) and the Seine Riveroutlet [72]. The maximum contamination reached in the Seine River core is alwaysmuch lower than for the other rivers (Table 2A). The city impact ranking for thegeneral metal contamination is as follows: Havel/Spree > Lambro > Zenne> Seinerivers. Note that if the CSO core (Seine River), whose sampling site is more similar
Fig. 9 Comparison of metal contamination trends, resulting from sedimentary archives (ppm ormg kg�1, log scales), in four rivers impacted by major European cities, the Havel-Spree River andBerlin, the Lambro River and Milan, the Zenne River and Brussels and the Seine River and Paris,and background concentration values (BGR) (from [72])
S. Ayrault et al.

to the Spree/Havel, Lambro and Zenne river sampling sites, had been usable as adated archive, the ranking would have been very different. The Cd content in theCSO core was up to 100 mg kg�1 [66]. The decontamination of the Lambro, Zenneand Seine rivers developed around 1960, but the decontamination of the Havel-Spreedid not occur before 1990, after the German reunification. Water quality studies inthe River Elbe since the German reunification in 1990 revealed the improvementof water quality due to the reduction of industrial wastewater emissions since1990 [73].
Table 2 Comparisons of metal contaminations in world rivers from highly industrialised countries,using sedimentary archives at their peak contamination stages
Cd Hg Pb Zn
Basinarea(km2)
Population(106 cap.)
A. Maximum contamination (mg kg�1) observed at urban site (year)
Lambro (Milan) (1) n.d. n.d. 1,400(1964)
3,500(1963)
2,747 4.2
Zenne (Brussels) (1) 15.5(1974)
700(1979)
1,300(1974)
1,160 1.3
Spree/Havel (Berlin) (1) 38(1990)
2,600(1986)
12,000(1990)
10,105 3.5
Seine (Paris) (1) 28(1960)
450(1945)
1,150(1967)
65,000 10
European and US urbansewage PM (1970–1980) (1)
140 410 3,000
European riversbackground (6)
0.25 0.04 20 90
B. Per capita in French rivers at outlet positions (g�1 cap�1 year�1)
Seine (2) 3.4 0.6 50 160 75,000 15
Loire (3) 0.5 0.1 10 40 117,800 7.7
Garonne (4) 1.9 n.d. 50 170 56,198 3.25
Rhône (5) 1.5 0.5 100 190 97,800 14
C. Per capita in other basins (g�1 cap�1 year�1)
Western European rivers(6) (7)
2.8 0.74 33.7 175 0.53 123
Mississippi (8) 0.58 0.175 30 47.5 3.2 67
Danube (9) 0.6 – 9.5 70 0.8 81
Montreal (10) 0.23 0.05 7.6 64 – –
(1) [72] Median of 21 analyses, adjusted to Al ¼ 75,000 mg kg�1, (2) [25], (3) derived from [16],(4) derived from [11], (5) derived from [18], (6) derived from [70]. For Montreal: per capita releaseinto St Lawrence River based on sewer analysis. (7) Elbe, Meuse, Garonne, Rhine, Scheldt andSeine river basins [70], (8) [5], (9) [77], (10) [78]n.d. not determined
Sedimentary Archives Reveal the Concealed History of Micropollutant. . .

7 Circulation of Material Within Basins and Its Impacton River Fluxes
In a fully sustainable society, the products and goods containing potentially harmfulsubstances should circulate without any leak into the environment (air, soil, water,coastal zone). The previous sections have shown that this is not the case and thatriver SPMs are a very good indicator of the way a society is handling theseenvironmental issues. Sedimentary archives add a precious time-depth to this ques-tion, provided that additional information on the general circulation of targetedmaterials within the anthroposystem are available. This approach has been appliedto establish the metal circulation patterns in Western European rivers (Steps G–K,Fig. 1).
7.1 Leakage Ratio of Metals Within the Seine River Basin(1950–2005)
The national demand for Cd, Cu, Hg, Pb and Zn has been reconstructed since 1900on the basis of the national consumption of all metals and products containingmetals. The metal demand in 1900 is the reference value and is set at 1.0 (Fig. 10,left). The metal demands greatly increased (2.5- to 5-fold) after World War II, andthe present-day consumption (year 2000) is much higher than in 1950, except forHg. This increase is faster than the population increase in the Seine River basin,indicating that the per capita consumption has greatly increased, except for Hg after1975 and Cd after 1985. The Hg demand has dropped by nearly two orders ofmagnitude since 1975, and Cd demand has dropped since 1995, both as a result ofregulations (gradual Hg ban since the 1970s and Cd use limitation beginning in1995).
The leakage ratio (in %) is the ratio of exported river pollutant fluxes overcirculation of the related material within the intercepted basin. It can be regarded
Fig. 10 Left circulation of metals in France, normalised to its value in 1900. Right: leakage rates in% estimated for the Seine River basin [25]
S. Ayrault et al.
as an efficiency indicator of the capacity of a given society to recycle its metals. Ithas dramatically decreased for all metals since 1950 (e.g. from 0.8 to 0.05% for Cu),except for Hg, which remains at a high ratio, around 10% of leaks. The metalexported fluxes calculated from core data are therefore powerful tools to observethe general decontamination trend in Europe, which can be linked to the local type ofeconomy and environmental policies, defining the trajectory of a given environmen-tal issue [74]. In the Seine River basin, the location of recycling facilities is a keycontrol factor in contamination by metals [33]. The recycling process (collection ofused metal-containing devices and their retreatment outside of the Seine River basinand often outside France, i.e. a kind of pollution delocalisation [36]) seems to havebeen effective mostly after 1980.
As pointed out in Sect. 2, this leakage estimation is based on several hypotheses:(1) all river particles have the same age; (2) their age is very recent – a few years onaverage – so that the average export at time t � a few years can be compared to thecirculation data for the same period. When there is evidence that the river particleshave extended age ranges or that they have greater ages, these hypotheses are notvalid. In the Seine River, the floodplain deposits are relatively fine (silt), so that theiraverage transit time throughout the river network ranges from a few weeks (largefloods) to a few years. The occurrence of antibiotics in core sediment (Fig. 6) within1 year after first arriving on the market and the decline of DDT metabolite, whichstarted with the ban of this insecticide in France, suggest a rapid reaction of SeineRiver fine sediment (median grain size in the silt fraction) to source changes. Incontrast, coarser material (1 cm) travels in the Seine River at secular rates: gravelscontaminated by iron smelting during the eighteenth century have actually been usedto study the very slow bedload movement in the Upper Marne (see [75], box 1).
7.2 Intercomparison of River Contaminant Fluxesin Relation to Their Population in Western EuropeanRivers
The excess load of metals and the load of micropollutants can be rated by thepopulation of river basins, to generate the per capita excess load (ELcap), anindicator also used for major ions or nutrients to compare and scale these per capitaloads to economic indicators, such as per capita energy consumption [51, 76]. Formetals, the comparison of the per capita loads for Western European rivers, the StLawrence, Mississippi and Danube rivers, at the period of their maximum contam-ination level near 1970 (Table 2A) showed similar orders of magnitude for eachmetal, suggesting the existence of a metal metabolism common to these old indus-trial countries for similar levels of development and environmental regulations[70, 72]. Based on the metal content, the general pressure ranking is Zn � Pb �Cu > Cr > Ni > Cd ¼ As > Hg, but their maximum EFs in river particulates arecompletely reversed: Hg > Cd > Pb > Zn. When looking in greater detail, each
Sedimentary Archives Reveal the Concealed History of Micropollutant. . .

basin may have its own maximum period, depending on local environmental andpolitical history [72].
ELcap trends were calculated for Cd, Hg, Pb and Zn based on the sedimentarchives of the four main French rivers that were studied: the Seine [25], Loire [16],Garonne [11] and Rhône [18] (Fig. 11). All per capita loads in French rivers show aregular decrease after 1960–1965, while the metal demand shows an inverse trend(Fig. 10). This is an outstanding indication of the improved environmental efficiencyfor metal emissions over the long term in France. It could not have been demon-strated on the basis of the regulatory monitoring of metal contamination in thesebasins, which is less than 25 years old, and sometimes not relevant for the rivercontaminant fluxes (e.g. survey of the contamination of aquatic mosses by the Rhônebasin authority).
The levels of per capita loads reveal a totally different ranking of the four basins,with regard to their actual river SPM contamination (Table 2B). While the levels of
Fig. 11 Long-term evolution of metal fluxes (in g�1 cap�1 year�1) carried by French rivers(Rhône, Seine, Loire and Garonne Rivers). The thick grey line is the per capita linear regressionfor the French rivers (population-weighted)
S. Ayrault et al.
metal concentrations are always lower in the Rhône River and higher in the SeineRiver, i.e. inversely to their suspended solid loads, the per capita loads of the SeineRiver are the greatest for Hg and Cd, the highest per capita Zn fluxes are observed inthe Garonne River, while the lowest fluxes of all metals are in the Loire River. Thetop ranking of the Seine for Cd, although well-known mine tailings have alsocontaminated the Garonne for decades [79], is due to the numerous plating work-shops and industries in Paris in the 1960s until the 1980s. The particular pattern ofPb in the Rhone River suggests a shift in reference values. In this highly impoundedbasin whose solid discharge was considerably reduced during the last century, it ispossible that a catchment with a high Pb background has become a higher contrib-utor to the Pb background in the last few decades.
These per capita figures for French rivers are compared to those of other industrialcountries, at the peak contamination, i.e. the pre-regulation stage (Table 2C). Theypresent a remarkable similarity.
8 Trajectories of the Environmental Issues Affecting RiverBasins and Society: Example of PCB Contaminationin the Seine River Basin
The trajectory of the water quality situation (Fig. 1) includes the following compo-nents [74]: (1) the evolution of a state indicator measured during the targeted period;(2) the relevant pressure or driver indicator; (3) the first awareness of a deteriorationof water quality, its social recognition, environmental monitoring and assessmentand reporting; and (4) the technical and/or regulatory responses provided. Here, thetrajectory is completed by a brief analysis of how scientific knowledge of this issuehas evolved, in particular its controlling factors. For micropollutants, the stateindicator might not always be derived from the regulatory survey (see Sect. 3) butfrom the sedimentary archives. Historical archives are used to reconstruct othercomponents of trajectories: the scientific knowledge of the inhabitants’ perceptionof the problem and the interactions between key actors, including controversies. Thisapproach is therefore typically interdisciplinary. It has been tested in the Seine Riverbasin for trace metals and requires a large amount of information to complete thesecomponents and the circulation of the contaminant within the anthroposphere, as formetals [36].
Figure 12 is an attempt to describe the trajectory of PCBs in the Seine River basin.The state indicator is the total PCB content in the dated core profile from [15], takenat the river outlet (65,000 km2).
PCBs are one of the first industrial products to be regulated and then banned.Following the alert made by Rachel Carson (Silent Spring, 1962), PCBs and otherorganochlorines such as DDT and lindane were an early concern of some Frenchscientists [80]. In 1972 these compounds were included on the blacklist ofUNESCO’s International Oceanographic Commission and, in turn, on the list of
Sedimentary Archives Reveal the Concealed History of Micropollutant. . .

products to be carefully monitored in French estuaries and river basin outlets[51]. Marchand [81] stated that the Seine estuary sediments had the highest contam-ination in PCBs with regard to all other French study sites.
PCBs have been commonly used in France since 1950 in transformers andcondensers. They were first imported; then in the late 1950s, they were manufacturedin France by two chemical companies, outside the Seine River basin. In 1979, Colas[82] estimated that the total consumption of PCBs at that period was between 40,000and 50,000 t, i.e. about 12,000–15,000 t for the Seine River basin, considering theproportion of industries in the Seine River basin compared to other river basins. Thesocietal response to the PCB issues (Step K, Fig. 1) lags far behind the maximumcontamination period, itself unnoticed until the first analysis of PCBs in the core.
The preliminary analysis of PCBs in Seine River basin fish revealed fish contam-ination [42]. The mussel watch established since 1979 in the estuary by Ifremerconfirmed an extreme contamination by PCBs, when compared to other French andforeign estuaries [81]. However, this issue could not be handled at the level of asingle river basin. At the national level, the banning of the further sale and use ofPCB-containing devices was an answer to the first socio-political PCB crisis (C1,Fig. 12). The second national crisis (C2) in 2005 was triggered by a health regulationwhen PCB values exceeding the WHO criteria for edible fish were detected in breamfished in the Rhône River, near Lyon [83]. As a result, all fish from the Rhône basinwere officially declared as non-edible, causing great concern on the overall quality inthis basin. This event, in which fish were used as environmental indicators, triggereda national PCB plan (PCB 2008–2012) which forced the Seine River authorities toundertake specific assessments and accelerated the elimination of all former indus-trial devices still containing PCBs.
The current evolution of the contamination of the Seine River and the estuary isdirectly provided by the core analysis of the main PCB congeners (n¼ 7). The OUT1
Fig. 12 Schematic trajectory of the PCBs dumped into the Seine River, based on the data recordedat the OUT1 coring site [15]
S. Ayrault et al.
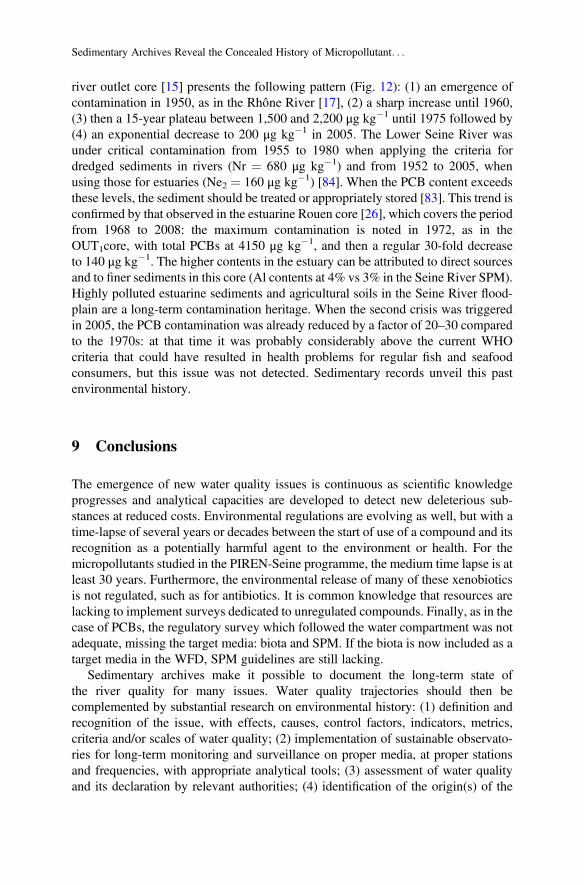
river outlet core [15] presents the following pattern (Fig. 12): (1) an emergence ofcontamination in 1950, as in the Rhône River [17], (2) a sharp increase until 1960,(3) then a 15-year plateau between 1,500 and 2,200 μg kg�1 until 1975 followed by(4) an exponential decrease to 200 μg kg�1 in 2005. The Lower Seine River wasunder critical contamination from 1955 to 1980 when applying the criteria fordredged sediments in rivers (Nr ¼ 680 μg kg�1) and from 1952 to 2005, whenusing those for estuaries (Ne2 ¼ 160 μg kg�1) [84]. When the PCB content exceedsthese levels, the sediment should be treated or appropriately stored [83]. This trend isconfirmed by that observed in the estuarine Rouen core [26], which covers the periodfrom 1968 to 2008: the maximum contamination is noted in 1972, as in theOUT1core, with total PCBs at 4150 μg kg�1, and then a regular 30-fold decreaseto 140 μg kg�1. The higher contents in the estuary can be attributed to direct sourcesand to finer sediments in this core (Al contents at 4% vs 3% in the Seine River SPM).Highly polluted estuarine sediments and agricultural soils in the Seine River flood-plain are a long-term contamination heritage. When the second crisis was triggeredin 2005, the PCB contamination was already reduced by a factor of 20–30 comparedto the 1970s: at that time it was probably considerably above the current WHOcriteria that could have resulted in health problems for regular fish and seafoodconsumers, but this issue was not detected. Sedimentary records unveil this pastenvironmental history.
9 Conclusions
The emergence of new water quality issues is continuous as scientific knowledgeprogresses and analytical capacities are developed to detect new deleterious sub-stances at reduced costs. Environmental regulations are evolving as well, but with atime-lapse of several years or decades between the start of use of a compound and itsrecognition as a potentially harmful agent to the environment or health. For themicropollutants studied in the PIREN-Seine programme, the medium time lapse is atleast 30 years. Furthermore, the environmental release of many of these xenobioticsis not regulated, such as for antibiotics. It is common knowledge that resources arelacking to implement surveys dedicated to unregulated compounds. Finally, as in thecase of PCBs, the regulatory survey which followed the water compartment was notadequate, missing the target media: biota and SPM. If the biota is now included as atarget media in the WFD, SPM guidelines are still lacking.
Sedimentary archives make it possible to document the long-term state ofthe river quality for many issues. Water quality trajectories should then becomplemented by substantial research on environmental history: (1) definition andrecognition of the issue, with effects, causes, control factors, indicators, metrics,criteria and/or scales of water quality; (2) implementation of sustainable observato-ries for long-term monitoring and surveillance on proper media, at proper stationsand frequencies, with appropriate analytical tools; (3) assessment of water qualityand its declaration by relevant authorities; (4) identification of the origin(s) of the
Sedimentary Archives Reveal the Concealed History of Micropollutant. . .

issue; (5) social consensus on the issue’s importance, origins and solutions; and(6) funding and implementation of appropriate solutions.
None of the long-term contaminant trajectories in the Seine River – nor in anyother French river – was available before the use of sediment archives, since themonitoring of these pollutants is very recent and/or has been inefficient, due to lackof appropriate analysed media and analytical difficulties. The studies presented heredemonstrate the effectiveness of sedimentary archives, which give a comprehensiveoverview of the contamination in the Seine River basin. The results presented hereare in agreement with previous studies dedicated to other European rivers and havehighlighted for the first time the specificities of the Seine River basin compared toother large French and European basins. Sediment archives are still present for allEuropean rivers, waiting for multidisciplinary teams, aware of the sedimentary,hydrological, chemical and historical issues, who will be able to elucidate theircontamination history.
Acknowledgements This work is a contribution to the PIREN-Seine research programme (www.piren-seine.fr), which belongs to the Zone Atelier Seine part of the international Long-Term Socio-Ecological Research (LTSER) network.
References
1. Goldberg ED, Hodge V, Koide M et al (1978) A pollution history of Chesapeake Bay. GeochimCosmochim Acta 42(9):1413–1425
2. Kemp A, Williams J, Thomas R et al (1978) Impact of man’s activities on the chemicalcomposition of the sediments of Lakes Superior and Huron. Water Air Soil Pollut 10(4):381–402
3. Eisenreich SJ, Capel PD, Robbins JA et al (1989) Accumulation and diagenesis of chlorinatedhydrocarbons in lacustrine sediments. Environ Sci Technol 23(9):1116–1126
4. Trefry JH, Metz S, Trocine RP et al (1985) A decline in lead transport by the Mississippi River.Science 230(4724):439–441
5. Santschi PH, Presley BJ, Wade TL et al (2001) Historical contamination of PAHs, PCBs,DDTs, and heavy metals in Mississippi river Delta, Galveston bay and Tampa bay sedimentcores. Mar Environ Res 52(1):51–79
6. Horowitz AJ (2013) A review of selected inorganic surface water quality-monitoring practices:are we really measuring what we think, and if so, are we doing it right? Environ Sci Technol 47(6):2471–2486
7. Valette-Silver NJ (1993) The use of sediment cores to reconstruct historical trends in contam-ination of estuarine and coastal sediments. Estuaries 16(3):577–588
8. Förstner UJN (1976) Lake sediments as indicators of heavy-metal pollution.Naturwissenschaften 63(10):465–470
9. Salomons W, De Groot A (1977) Pollution history of trace metals in sediments, as affected bythe Rhine river. In: Krum-Bein W (ed) Environmental biogeochemistry, vol 1. Ann ArborScience, Ann Arbor, pp 149–162
10. Middelkoop H (2000) Heavy-metal pollution of the river Rhine and Meuse floodplains in theNetherlands. Neth J Geosci 79(4):411–427
S. Ayrault et al.

11. Grousset F, Jouanneau J, Castaing P et al (1999) A 70 year record of contamination fromindustrial activity along the Garonne River and its tributaries (SW France). Estuar Coast ShelfSci 48(3):401–414
12. Audry S, Schäfer J, Blanc G, Jouanneau J-M (2004) Fifty-year sedimentary record of heavypollution (Cd, Zn, Cu, Pb) in the Lot River reservoirs (France). Environ Pollut 132:413–426
13. Castelle S, Schäfer J, Blanc G et al (2007) 50-year record and solid state speciation of mercuryin natural and contaminated reservoir sediment. Appl Geochem 22(7):1359–1370
14. Le Cloarec M-F, Bonte P, Lestel L et al (2011) Sedimentary record of metal contamination inthe Seine River during the last century. Phys Chem Earth, Parts A/B/C 36(12):515–529
15. Lorgeoux C, Moilleron R, Gasperi J et al (2016) Temporal trends of persistent organicpollutants in dated sediment cores: chemical fingerprinting of the anthropogenic impacts inthe Seine River basin, Paris. Sci Total Environ 541:1355–1363
16. Grosbois C, Meybeck M, Lestel L et al (2012) Severe and contrasted polymetallic contamina-tion patterns (1900–2009) in the Loire River sediments (France). Sci Total Environ435:290–305
17. Desmet M, Mourier B, Mahler BJ et al (2012) Spatial and temporal trends in PCBs in sedimentalong the lower Rhône River, France. Sci Total Environ 433:189–197
18. Ferrand E, Eyrolle F, Radakovitch O et al (2012) Historical levels of heavy metals and artificialradionuclides reconstructed from overbank sediment records in lower Rhône River (South-EastFrance). Geochim Cosmochim Acta 82:163–182
19. Tamtam F, Le Bot B, Dinh T et al (2011) A 50-year record of quinolone and sulphonamideantimicrobial agents in Seine River sediments. J Soils Sediments 11(5):852–859
20. Thiebault T, Chassiot L, Fougère L et al (2017) Record of pharmaceutical products in riversediments: a powerful tool to assess the environmental impact of urban management?Anthropocene 18:47–56
21. Bajard M, Poulenard J, Sabatier P et al (2017) Long-term changes in alpine pedogeneticprocesses: effect of millennial agro-pastoralism activities (French-Italian Alps). Geoderma306:217–236
22. Krishnaswamy S, Lal D, Martin J et al (1971) Geochronology of lake sediments. Earth PlanetSci Lett 11(1–5):407–414
23. Förstner U, Müller G (1973) Heavy metal accumulation in river sediments: a response toenvironmental pollution. Geoforum 4(2):53–61
24. Barjhoux I, Fechner LC, Lebrun JD et al (2018) Application of a multidisciplinary andintegrative weight-of-evidence approach to a 1-year monitoring survey of the Seine River.Environ Sci Pollut Res 25:23404–23429
25. Meybeck M, Lestel L, Bonté P et al (2007) Historical perspective of heavy metals contamina-tion (Cd, Cr, Cu, Hg, Pb, Zn) in the Seine River basin (France) following a DPSIR approach(1950–2005). Sci Total Environ 375(1):204–231. https://doi.org/10.1016/j.scitotenv.2006.12.017
26. Boust D, Lesueur P, Berthe T (2012) RHAPSODIS - reconstruction de l’historique des apportsparticulaires à la Seine par l’observation de leur intégratio, sédimentaire. Rapport GIP SeineAval, Rouen
27. Meybeck M, Vörösmarty C (2005) External geophysics, climate and environment: fluvialfiltering of land-to-ocean fluxes: from natural Holocene variations to Anthropocene. CR -Géosci 337(1):107–123. https://doi.org/10.1016/j.crte.2004.09.016
28. Vörösmarty CJ, Meybeck M, Fekete B et al (2003) Anthropogenic sediment retention: majorglobal impact from registered river impoundments. Glob Planet Chang 39(1):169–190. https://doi.org/10.1016/S0921-8181(03)00023-7
29. Idlafkih Z, Meybeck M, Chiffoleau JF et al (1997) Comportement des metaux particulaires(Al, Fe, Mn, Cd, Cu, Hg, Pb et Zn) dans la Seine a Poses en periode de hautes eaux(1990–1995). Int Assoc Hydrol Sci Publ 243:45–58
30. Meybeck M, de Marsily G, Fustec É (1998) La Seine en son bassin: fonctionnement écologiqued’un système fluvial anthropisé. Elsevier, Paris
Sedimentary Archives Reveal the Concealed History of Micropollutant. . .

31. Baccini P, Brunner PH (1991) Metabolism of the Anthroposphere, vol 53. Springer, Berlin32. Lestel L, Meybeck M, Thévenot D (2007) Metal contamination budget at the river basin scale: a
critical analysis based on the Seine River. Hydrol Earth Syst Sci Discuss 4:1795–182233. Lestel L (2012) Non-ferrous metals (Pb, Cu, Zn) needs and city development: the Paris example
(1815–2009). Reg Environ Chang 12(2):311–32334. Billen G, Garnier J, Le Noë J et al (2020) The Seine watershed water-agro-food system: long-
term trajectories of C, N, P metabolism. In: Flipo N, Labadie P, Lestel L (eds) The Seine Riverbasin, Handbook of environmental chemistry. Springer, Cham. https://doi.org/10.1007/698_2019_393
35. Meybeck M (2013) Heavy metal contamination in rivers across the globe: an indicator ofcomplex interactions between societies and catchments. In: IAHS (ed) Understanding freshwa-ter quality problems in a changing world, vol 361. IAHS‐IAPSO‐IASPEI Assembly,Gothenburg
36. Lestel L, Meybeck M, Thévenot D (2007) Metal contamination budget at the river basin scale:an original Flux-Flow Analysis (F2A) for the Seine River. Hydrol Earth Syst Sci 11(6):1771–1781
37. Flipo N, Lestel L, Labadie P et al (2020) Trajectories of the Seine River basin. In: Flipo N,Labadie P, Lestel L (eds) The Seine River basin. Handbook of environmental chemistry.Springer, Cham. https://doi.org/10.1007/698_2019_437
38. Chiffoleau J, Claisse D, Cossa D et al (2001) La contamination métallique. Editions Ifremer,Paris
39. Horowitz AJ, Meybeck M, Idlafkih Z et al (1999) Variations in trace element geochemistry inthe Seine River Basin based on floodplain deposits and bed sediments. Hydrol Process 13(9):1329–1340
40. Meybeck M, Horowitz AJ, Grosbois C (2004) The geochemistry of Seine River Basin partic-ulate matter: distribution of an integrated metal pollution index. Sci Total Environ 328(1):219–236. https://doi.org/10.1016/j.scitotenv.2004.01.024
41. Grosbois C, Meybeck A, Horowitz A et al (2006) The spatial and temporal trends of Cd, Cu,Hg, Pb and Zn in Seine River floodplain deposits (1994-2000). Sci Total Environ 356(1–3):22–37
42. Chevreuil M, Chesterikoff A, Letolle R (1987) PCB pollution behaviour in the river Seine.Water Res 21(4):427–434
43. Le Gall M, Ayrault S, Evrard O et al (2018) Investigating the metal contamination of sedimenttransported by the 2016 Seine River flood (Paris, France). Environ Pollut 240:125–139. https://doi.org/10.1016/j.envpol.2018.04.082
44. Barles S, Guillerme A (2014) Paris: a history of water, sewers, and urban development.A history of water, series III, vol 1. IB Tauris, London
45. Bouleau G, Marchal P, Meybeck M et al (2016) La construction politique d’un espace decommune mesure pour la qualité des eaux superficielles. L’exemple de la France (1964) et del’Union Européenne (2000). Développement durable territoires
46. Dmitrieva T, Lestel L, Meybeck M et al (2018) Versailles facing the degradation of its watersupply from the Seine River: governance, water quality expertise and decision making,1852–1894. Water Hist 10(2–3):183–205
47. Seine-Normandie AdlE (1976) Les bassins de la seine et les cours d’eau, tome 2 : Besoins etutilisation de l’eau. vol Fascicule 8. Agence financière de Bassin Seine-Normandie. Missiondéléguée de Bassin, Paris
48. Stanners D, Bourdeau P (1995) Europe’s environment: the Dobris assessment. EuropeanEnvironment Agency, Copenhagen. Arsenic in Urine and Drinking Water We found the articleby Calderon et al, “Excretion of Arsenic in Urine as a Function of Exposure to Arsenic inDrinking Water,” vol 1
49. Chesterikoff A, Carru A, Garban B et al (1973) La pollution de la Basse-Seine par le mercure(du Pecq à Tancarville). La Tribune du CEBEDEAU 355(356):1–8
S. Ayrault et al.

50. Lorenzi L (1975) Hydrogeochimie du mercure dans les eaux du bassin de Paris. Thèse de IIIèmecycle, Paris 6, p 44
51. Martin J, Meybeck M, Salvadori F (1976) Pollution chimique des estuaires: etat actuel desconnaissances; revue bibliographique arrêtée en Juin 1974. Rapports Scientifiques et Tech-niques CNEXO, vol 22
52. Robbe D (1981) Pollutions metalliques du milieu naturel: guide methodologique de leur etude apartir des sediments: rapport bibliographique. Rapport de Recherche LPC, vol 104. Ministère del’urbanisme et du logement - Ministère des Transports
53. Pereira-Ramos L (1989) Exploitation critique des résultats d’analyses de métaux sur sédimentset bryophytes dans le bassin Seine-Normandie de 1979 à 1988. Agence de Bassin SeineNormandie, Institut d’Hydrologie et de climatologie
54. Oudin L, Maupas DJM, L’eau AD (2003) Système d’évaluation de la qualité de l’eau des coursd’eau (Seq-Eau), vol 40. MEDD Agences de l’eau
55. Miquel G, France (2003) Rapport sur la qualité de l’eau et de l’assainissement en France.Assemblée nationale, France
56. Miquel GJOPdEdCSeT (2001) Effet des métaux lourds sur l’environnement et la santé, rapport261.365
57. Ollivon D, Garban B, Blanchard M et al (2002) Vertical distribution and fate of trace metals andpersistent organic pollutants in sediments of the Seine andMarne rivers (France). Water Air SoilPollut 134(1–4):57–79
58. Azimi S, Ludwig A, Thevenot DR et al (2003) Trace metal determination in total atmosphericdeposition in rural and urban areas. Sci Total Environ 308(1–3):247
59. Avoine J, Boust D, Guillaud J-F (1986) Flux et comportement des contaminants dissous etparticulaires dans l’estuaire de la Seine. Rapports et procès-verbaux des réunions, vol 186.Conseil international pour l’exploration de la mer
60. Vrel A (2012) Reconstitution de l’historique des apports en radionucléides et contaminantsmétalliques à l’estuaire fluvial de la Seine par l’analyse de leur enregistrement sédimentaire.Caen University
61. Vrel A, Boust D, Lesueur P et al (2013) Dating of sediment record at two contrasting sites of theSeine River using radioactivity data and hydrological time series. J Environ Radioact126:20–31
62. Ayrault S, Priadi CR, Evrard O et al (2010) Silver and thallium historical trends in the SeineRiver basin. J Environ Monit 12(11):2177–2185
63. Ayrault S, Roy-Barman M, Le Cloarec M-F et al (2012) Lead contamination of the Seine River,France: geochemical implications of a historical perspective. Chemosphere 87(8):902–910.https://doi.org/10.1016/j.chemosphere.2012.01.043
64. Ayrault S, Lefèvre I, Bonté P et al (2009) Archives sédimentaires, témoignages de l’histoire dudéveloppement du bassin. Rapport PIREN-Seine
65. Estèbe A (1996) Impact de l’agglomération parisienne et de ses rejets de temps de pluie sur lesconcentrations en métaux des matières en suspension et des sédiments en Seine en périodeestivale. Université Paris-Est Créteil Val de Marne (UPEC)
66. Bussy A-L (1996) Mobilité des métaux dans un système fluvial urbain. Université Paris-EstCréteil Val de Marne (UPEC)
67. Bertrand O, Montarges-Pelletier E, Mansuy-Huault L et al (2013) A possible terrigenous originfor perylene based on a sedimentary record of a pond (Lorraine, France). Org Geochem58:69–77
68. Joron J-L, Treuil M (2019) Cycles géochimiques: une histoire naturelle illustrée deséléments chimiques. http://iramis.cea.fr/ComScience/GeochimieCycles/GeochimieDonnees.php. Accessed 22 Jan 2019
69. Dauvin J-C (2006) Estuaires Nord-Atlantiques: problèmes et perspectives, September 2006.Groupement d’intérêt public Seine Aval
70. Meybeck M, Kummu M, Dürr H (2013) Global hydrobelts and hydroregions: improvedreporting scale for water-related issues? Hydrol Earth Syst Sci 17(3):1093–1111
Sedimentary Archives Reveal the Concealed History of Micropollutant. . .

71. Froger C, Quantin C, Gasperi J et al (2019) Impact of urban pressure on the spatial and temporaldynamics of PAH fluxes in an urban tributary of the Seine River (France). Chemosphere219:1002–1013
72. Meybeck M, Lestel L, Winklhöfer K et al (2017) Un exemple de trajectoire environnementale :la contamination métallique de la Seine, la Spree, la Senne et le Lambro (1950–2010). In:Lestel L, Carré C (eds) Les rivières urbaines et leur pollution. vol Collection Indisciplines.QUAE
73. Lehmann A, Rode MJWR (2001) Long-term behaviour and cross-correlation water qualityanalysis of the river Elbe, Germany. Wat Res 35(9):2153–2160
74. Meybeck M, Lestel L, Carré C et al (2018) Trajectories of river chemical quality issues over theLongue Durée: the Seine River (1900S–2010). Environ Sci Pollut Res 25(24):23468–23484
75. Lestel L, Eschbach D, Meybeck M et al (2020) The evolution of the Seine basin water bodiesthrough historical maps. In: Flipo N, Labadie P, Lestel L (eds) The Seine River basin.Handbook of environmental chemistry. Springer, Cham. https://doi.org/10.1007/698_2019_396
76. Meybeck M (1982) Carbon, nitrogen, and phosphorus transport by world rivers. Am J Sci 282(4):401–450
77. Winkels H, Kroonenberg S, Lychagin MY et al (1998) Geochronology of priority pollutants insedimentation zones of the Volga and Danube delta in comparison with the Rhine delta. ApplGeochem 13(5):581–591
78. Gobeil C, Rondeau B, Beaudin L (2005) Contribution of municipal effluents to metal fluxes inthe St. Lawrence River. Environ Sci Technol 39(2):456–464
79. Schäfer J, Blanc G, Lapaquellerie Y et al (2002) Ten-year observation of the Gironde tributaryfluvial system: fluxes of suspended matter, particulate organic carbon and cadmium. Mar Chem79(3–4):229–242
80. Mestres R, Belamie R, Aguesse P (1971) Rôle joué par les substances organochlorés dans lapollution des eaux douces, vol 31. Etude la région Centre, Trav Soc Pharm, Montpellier
81. Marchand M (1989) Les PCB dans l’environnement marin. Aspects géochimiques d’apports etde distribution. Cas du littoral français. Rev Sci Eau/J Water Sci 2(3):373–403
82. Colas L (1979) Détermination des valeurs limites applicables aux effluents depolychlorobiphényles et polychloroterphényles, compte tenu des meilleurs moyens techniquesdisponibles (trans: consommateurs Sdleedlpd). Communauté économique européenne, Bruxelles
83. Amiard J-C, Meunier T, Babut M (2016) PCB, environnement et santé. Tec & Doc. Lavoisier84. Carpentier S, Moilleron R, Beltran C et al (2002) Quality of dredged material in the river Seine
basin (France). II. Micropollutants. Sci Total Environ 299(1–3):57–72
Open Access This chapter is licensed under the terms of the Creative Commons Attribution 4.0International License (http://creativecommons.org/licenses/by/4.0/), which permits use, sharing,adaptation, distribution and reproduction in any medium or format, as long as you give appropriatecredit to the original author(s) and the source, provide a link to the Creative Commons licence andindicate if changes were made.
The images or other third party material in this chapter are included in the chapter's CreativeCommons licence, unless indicated otherwise in a credit line to the material. If material is notincluded in the chapter's Creative Commons licence and your intended use is not permitted bystatutory regulation or exceeds the permitted use, you will need to obtain permission directly fromthe copyright holder.
S. Ayrault et al.