security megatrends - helpsystems · healthcare/pharma/medical manufacturing figure 6 it budget...
TRANSCRIPT

SPONSORED BY:
SECURITY MEGATRENDSENTERPRISE MANAGEMENT ASSOCIATES® (EMA™) Research Written by David Monahan January 2019
IT AND DATA MANAGEMENT RESEARCH | INDUSTRY ANALYSIS | CONSULTING

© 2019 Enterprise Management Associates, Inc.SECURITY MEGATRENDS
TABLE OF CONTENTSExecutive Summary .......................................................................................................................1
Demographics ................................................................................................................................1
IT and Security Budgets ...........................................................................................................3
The Cloud ......................................................................................................................................5
Use of Cloud for Security Workloads .......................................................................................5
Security Ownership in Public Cloud .........................................................................................5
Security Challenges in Public Cloud ........................................................................................6
Hybrid Cloud .............................................................................................................................7
SecOps Frustrations: Tools ......................................................................................................9
SecOps Frustrations: Alert Fatigue ..........................................................................................9
Analytics ..................................................................................................................................10
IoT Threats .............................................................................................................................. 11
IoT in Breaches .......................................................................................................................13
DDoS ............................................................................................................................................13
Attacks ....................................................................................................................................13
Defense Strategies .................................................................................................................14
Endpoint Security .........................................................................................................................15
Protection ................................................................................................................................15
Clean Up .................................................................................................................................16
Investigations and Forensics ..................................................................................................16
EMA Perspective ..........................................................................................................................17
TOC

© 2019 Enterprise Management Associates, Inc.SECURITY MEGATRENDS1
Executive SummaryThreats abound, but people are out there trying to deal with them. Organizations continue to fall behind, finding it increasingly difficult to identify and respond to threats in a timely manner. This report delves into several areas of concern today including cloud security issues, SecOps frustrations and tools, the Internet of Things, data sharing and leakage, DDoS, endpoint security, and artificial intelligence. The report identifies challenges and perceptions that enterprises, midmarket companies, and SMBs face across seven industry verticals including manufacturing, financial, and healthcare. The goal is to help readers to understand the common issues and where they are doing a better or worse job than others. Ultimately, the report will help readers understand how to handle threats better, no matter where they stand now.
DemographicsThis research report was distributed across North America and is thus focused. Further geographic division was not tracked. The respondents were primarily targeted from IT/cyber security, with additional extraction from executive management. In this research, line of business personnel were not queried because they do not have enough insight into the desired breadth or depth of security.
Figure 1 Respondent role
Organizations of all sizes and industry verticals have some security issues and challenges in common, but each also has its own specific challenges. The research looked across SMBs, midmarkets, and enterprises as well as multiple industry verticals to understand the commonalities and divergence in the trends.
INTRODUCTION

© 2019 Enterprise Management Associates, Inc.SECURITY MEGATRENDS2
Figure 2 Organization breakout by size
Figure 3 Organizational breakout by revenue
Figure 4 Organizational breakout by industry
DEMOGRAPHICS

© 2019 Enterprise Management Associates, Inc.SECURITY MEGATRENDS3
IT and Security BudgetsIT and security budgets are looking healthy. EMA has seen consistent growth in both over the last five years. IT budgets have been growing an average of 9 to 13 percent, while security has been higher in the 15 to 20 percent range. In this sample, only one percent of organizations reported a budget decrease for IT and security, which is common at this time. The most common annual IT budget increase was 10 to 24 percent and the average was just shy of 23 percent. The state of security over the last five years, with the changed perspective of assuming that the company has already been breached, pushed those budgets up annually far more significantly than in the previous fifteen years.
Figure 5 IT budget increases from 2017-2018
DEMOGRAPHICS

© 2019 Enterprise Management Associates, Inc.SECURITY MEGATRENDS4
By industry, the breakout was quite variant. High tech made a higher increase in investment than the other industries, while manufacturing and healthcare/pharma/medical were significantly below average. Finance/banking/insurance are in a different place. That group has been making larger investments in IT for years, so their proportionate change year over year is not as drastic as some. Though they are at the lower end of the chart, they are actually at the higher end of overall IT and security investments.
33%
31%
29%
23%
22%
18%
12%
10%
High Tech
MSSP
Utilities and Shipping
All
Retail/Wholesale/Dist
Finance/Banking/Insurance
Healthcare/Pharma/Medical
Manufacturing
Figure 6 IT budget increases from 2017-2018 by industry
The issue with manufacturing and healthcare/pharma/medical is a significant one. Those verticals have consistently lagged in IT and security, and now hackers target them. Personal health records (PHR) are the most sought-after records. They drove the highest price on the black market because they can be used for the broadest range of theft from opening new credit accounts, to purchases, and even full identity theft. Manufacturing is a target due to the rise in industrialization in third world countries and other countries. The theft of cutting-edge manufacturing techniques is huge business, especially for competing companies in places like China and India.
On the other side of the equation, industries like utilities and shipping are pulling the average up with a nearly 30 percent increase in their budgets. This is in direct response to the need for defense against infrastructure attacks that have been on the rise since the mid-2000s. Hackers in countries like Iran and Russia, among others, have been infiltrating the U.S. power grid and other utilities to understand more about how they operate and, when possible, affect operations.
DEMOGRAPHICS

© 2019 Enterprise Management Associates, Inc.SECURITY MEGATRENDS5
The Cloud Use of Cloud for Security WorkloadsThe cloud is coming on strong. The frequency of cloud adoption for security workloads is more than triple what it was two years ago, and now it appears as though everyone is in the cloud.
96%
98%
99%
98%
Enterprise SMB Midmarket All
Figure 10 Use of cloud for security workloads
This breakout, though higher than expected, seems to show the correct proportions. Enterprises have an investment in their own data centers, have more complexity in their architectures, and early in the cloud they had a general bias toward cloud, especially for security. At the same time, SMBs and midmarkets dove in to cloud migrate their cost structures from capital to expense and to increase agility of all types of services, security included.
Security Ownership in Public CloudThe most disturbing thing about the cloud is the assumption around who owns security. With an internal data center ownership is within the company, or has very few exceptions for third-party applications. In the hosted environment, ownership is also “usually” more cut-and-dry, with the hosting provider or managed internal IT managing applications. Whoever manages it is primarily responsible for its security, with the hosting provider supplying some layers as necessary to protect the data center and their other customers.
Figure 14 Security ownership within a hosted environment
In the public cloud, however, there is a significant misconception of who owns security. PaaS, IaaS, and SaaS each has different layers of security and different security demarks. Thus, the public cloud has more complex security ownership and management. SaaS providers secure the hardware, network, systems, and underlying applications while the customer is responsible for securing the user access and accessible areas of the application and data. With IaaS services the provider generally stops at the network level, leaving the rest for the customer to maintain. They may provide some underlying system hardening, but the customer is responsible for the operating systems, application installation, and most of the hardening, as well as user access and data. With PaaS, the provider generally maintains everything under the application or development environment and the customer maintains
THE CLOUD

© 2019 Enterprise Management Associates, Inc.SECURITY MEGATRENDS6
the entirety of the application. These definitions are also somewhat fluid, so it is important to discuss the requirements with the prospective cloud providers before you make a selection and with any current cloud providers to clear up any gaps.
Figure 15 Security ownership within the public cloud
In Figure 15, it is clear that the majority of respondents feel that the security of their cloud environment sits squarely on the shoulders of the providers. It is not uncommon for someone creating shadow IT and relying on the cloud provider to keep that instance secure without realizing the onus is really on them, thus putting business data and operations in jeopardy.
The confusion around security ownership may seem a little surprising given the leading role that security is taking in so many cloud initiatives. However, with the lack of security skills and tenure in so many companies, it is most probable that the people from security involved in these initiatives are often inexperienced and therefore do not understand many of the security nuances.
Security Challenges in Public CloudRespondents voiced multiple concerns about their security challenges in the public cloud. The top eight are:
1. Security visibility within the cloud infrastructure due to provider limitations2. Inability to meet compliance needs3. Security visibility within the cloud infrastructure due to architecture limitations4. Threat from crypto-jacking5. Security visibility within the cloud infrastructure due to tool limitations6. Need for or lack of cloud data encryption7. Lack of centralized controls for distributed cloud providers8. Inability to properly manage cloud encryption key lifecycle
Notice that two of the top three centered around a lack of visibility into the public cloud environments, and the third reflects an inability to have centralized or common controls across the cloud providers. Though cloud providers have come a long way in exposing APIs for better visibility and control within their environments, it appears that there is more to do.
THE CLOUD

© 2019 Enterprise Management Associates, Inc.SECURITY MEGATRENDS7
Here are the top three overall security challenges:
Though the percentages varied by organization size, the rankings remained consistent across enterprise, midmarkets, and SMBs.
Hybrid CloudNo discussion of cloud would be complete without including hybrid clouds because there is a lot of activity around hybrid clouds. Ninety-nine percent of organizations are either engaged in a hybrid architecture or are planning to deploy one in the next 24 months.
Figure 19 Use of hybrid cloud architecture
While 58 percent of the midmarket respondents indicated they either had a hybrid cloud architecture or are in the process of deploying a hybrid cloud architecture, as expected, enterprises are a bit more bullish with their hybrid cloud projections, with 78 percent either having hybrid cloud or currently deploying hybrid cloud.
THE CLOUD
Figure 16 Security visibility within the cloud infrastructure due to provider limitations
Figure 17 Security visibility within the cloud infrastructure due to tool limitations
Figure 18 Lack of centralized controls for distributed cloud providers

© 2019 Enterprise Management Associates, Inc.SECURITY MEGATRENDS8
Deploying hybrid now39%
Using hybrid now39%
Deploying hybridwithin 1 year
5%Deploying hybrid w/in 13-24 mos
17%
Figure 20 Enterprise use of hybrid cloud architectures
In retail/wholesale none of the respondents indicated they had a current hybrid cloud deployment, but a resounding 80 percent indicated that their companies were currently deploying hybrid cloud architectures. Only 38 percent of healthcare/pharma/medical companies were working on deploying hybrid. The finance/banking/insurance sector had the highest current hybrid cloud deployment, with 60 percent currently leveraging hybrid and the other 40 percent indicating they were either currently deploying hybrid or were going to deploy in the next year.
With all of the cloud activity, EMA asked respondents what the greatest challenges were in their work in hybrid clouds. The top three responses were:
THE CLOUD
Figure 21 Integrating hybrid cloud security into current on-premises
security architecture
Figure 22 Complexity of multisite security orchestration
Figure 23 Security latency between internal and external cloud resources

© 2019 Enterprise Management Associates, Inc.SECURITY MEGATRENDS9
SecOps Frustrations: ToolsOne of the reasons there is a huge value opportunity for MSSPs is because of the difficulty and frustration security has with managing all of their tools. Enterprises can have a huge number of management consoles to interact with to do their jobs.
8%
17%
34%
26%
6%
9%
10
22
3 or fewer
4-5
6-10
11-15
16-20
More than 20
Average # of Interfaces
Max Interfaces
Figure 27 Consoles security teams use to manage programs
SecOps Frustrations: Alert FatigueAnother area of frustration for security professionals is referred to as alert fatigue. Alert fatigue stems from the large volume of alerts presented to analysts that they are required to validate, identifying whether they are really high severity or at the other extreme—if they are false positives that are really nothing to worry about. In many environments there is highly insufficient context for the systems to properly judge the criticality, so over 95 percent of the tickets that come in are classified as the highest priority.
33%
16%
13%
18%
10%
6%
4%
224
26%
15%
20%
17%
12%
6%
4%
227
<25
26 to 50
51 to 100
101 to 250
251 to 500
501 to 1000
>1000
Average # of Critical Alerts
Average # of Total Alerts
Total alerts Critical alertsFigure 28 Comparison of severe tickets to overall tickets
SECOPS ROLES AND RESPONSIBILITIES
© 2019 Enterprise Management Associates, Inc.SECURITY MEGATRENDS10
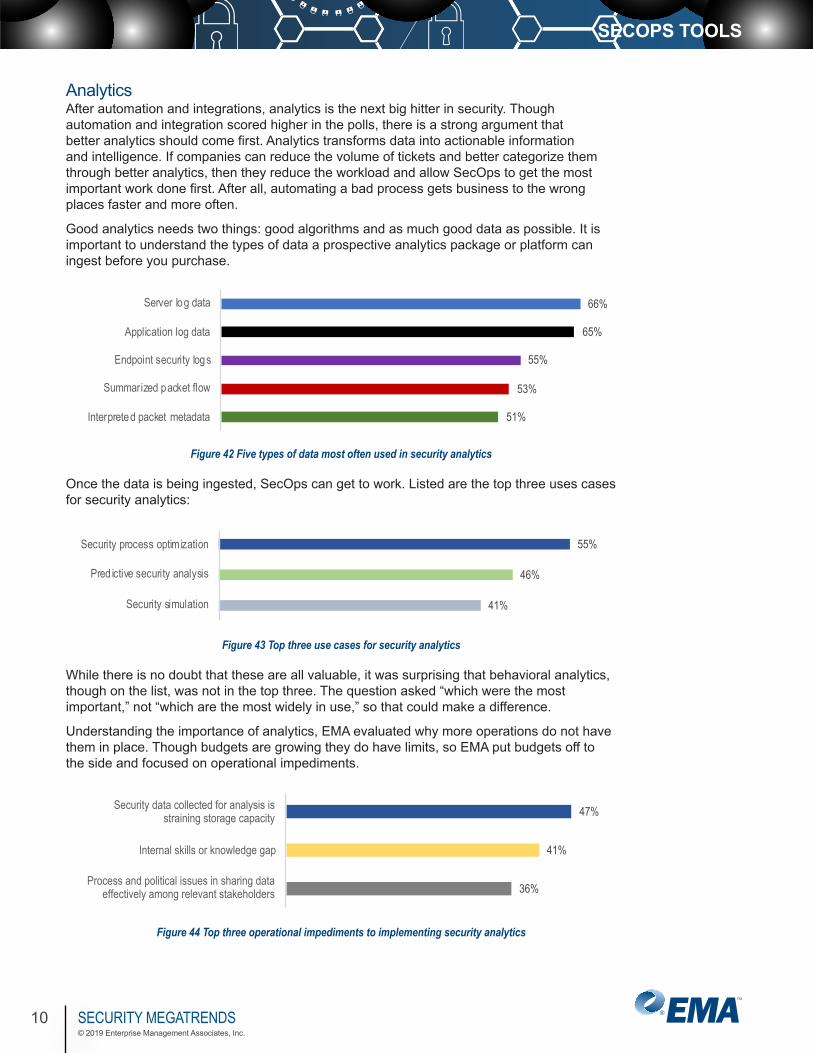
AnalyticsAfter automation and integrations, analytics is the next big hitter in security. Though automation and integration scored higher in the polls, there is a strong argument that better analytics should come first. Analytics transforms data into actionable information and intelligence. If companies can reduce the volume of tickets and better categorize them through better analytics, then they reduce the workload and allow SecOps to get the most important work done first. After all, automating a bad process gets business to the wrong places faster and more often.
Good analytics needs two things: good algorithms and as much good data as possible. It is important to understand the types of data a prospective analytics package or platform can ingest before you purchase.
66%
65%
55%
53%
51%
Server log data
Application log data
Endpoint security logs
Summarized packet flow
Interpreted packet metadata
Figure 42 Five types of data most often used in security analytics
Once the data is being ingested, SecOps can get to work. Listed are the top three uses cases for security analytics:
55%
46%
41%
Security process optimization
Pred ictive security analysis
Security simulation
Figure 43 Top three use cases for security analytics
While there is no doubt that these are all valuable, it was surprising that behavioral analytics, though on the list, was not in the top three. The question asked “which were the most important,” not “which are the most widely in use,” so that could make a difference.
Understanding the importance of analytics, EMA evaluated why more operations do not have them in place. Though budgets are growing they do have limits, so EMA put budgets off to the side and focused on operational impediments.
47%
41%
36%
Security data collected for analysis is straining storage capacity
Internal skills or knowledge gap
Process and political issues in sharing data effectively among relevant stakeholders
Figure 44 Top three operational impediments to implementing security analytics
SECOPS TOOLS

© 2019 Enterprise Management Associates, Inc.SECURITY MEGATRENDS11
Storage is cheap, but when companies start looking at petabytes for larger enterprises to store data for a year, it can put a strain on the budget. Given that sort of constraint, SecOps has to make tougher decisions on whether to reduce the timespan of data stored or whether there are more judicious choices to be made around data selected for ingestion. Not all data is good data. Some definitely provides better telemetry than others.
IoT ThreatsThe problem with the vast majority of wearables and many of the commercial devices is a lack of security developed in the devices. Even the more secure IIoT devices were not initially designed to be inserted into the Internet. They were designed to go into air-gapped or otherwise separated networks. This created a heyday for malicious threat actors, providing numerous opportunities to put a foothold in otherwise well-protected environments.
Recognizing that IoT is pervasive and has entered the environment is the first step. The second step is recognizing that it can be a threat. All organizations are concerned with the threat of both managed and unmanaged IoT in their environments and IoT’s effect on the security of the Internet. Figure 50 shows various measures of the threats.
44%
29%
2%
10% 12%
2%
12%
37%
12%
24%
10%5%
Extreme Very High High Moderate Low None
Managed Unmanaged
Figure 50 Perceived current threat levels of managed and unmanaged IoT devices in the environment
17%
31%
52%
43%
38%
18%
40%
30%
30%
Highest Threat
Mid-Range Threat
Lowest Threat
Industrial Commercial Consumer
Figure 51 Perceived threat to organization of IoT by type
SECOPS TOOLS

© 2019 Enterprise Management Associates, Inc.SECURITY MEGATRENDS12
The first thing to notice is that most respondents perceive commercial IoT as the greatest overall threat to their environment. These devices are prevalent in office buildings throughout the U.S. and other developed nations. They are often only cursorily secured, and they can affect a wide range of building operations as well as being used as a beachhead for incursion into their tenants’ networks. Industrial IoT is perceived as having the lowest threat. While not nearly as commonplace and generally far more secure than other IoT, the perspective is probably a bit skewed. When industrial IoT is compromised, the effects are far wider than an office, a floor, or an individual building. They can affect hundreds of thousands to millions of people. Various attacks have been made worldwide and have accelerated over the last five to seven years. Though the majority of consequences are merely inconvenience, some loss of life has occurred and future losses could be more significant if timed for the proper circumstance or otherwise coordinated for larger effect.
24%
26%
8%
23%
16%
3%
18%
29%
18%
19%
13%
3%
Extreme
Very High
High
Moderate
Low
None
Internet overall My organization
Figure 52 Perceived threat levels of IoT devices to the organization and the Internet overall
The comparison of threat to the Internet overall versus the threat to the organization is interesting. Fifty-eight percent of respondents feel that IoT is a high to extreme threat to their organization, while 65 percent feel it is a high to extreme threat to the Internet. Part of that comparative perception of a greater threat to the Internet could be the perception of how desirable a target their organization is compared to others, but much of it also plays into the often-faulty belief that, “my organization is more secure than their organization.” That is a persistent perspective that significantly affects many people, to their detriment.
INTERNET OF THINGS

© 2019 Enterprise Management Associates, Inc.SECURITY MEGATRENDS13
IoT in BreachesIn this section, respondents shared how their fears about IoT have become a reality for their organization from the aspect of their IoT devices being used in an attack and being attacked by IoT devices.
While it’s a good thing that 25 percent of organizations can say they have never had an IoT-related attack, the converse is really significant.
27%
22%
20%
6%
25%
My organization has been attacked using an external IoT device
My organization has been attacked using an internal IoT device
An internal IoT device was detected as part of an external attack
An internal IoT device was detected as part of an internal attack
None of the above
Figure 53 Organizations involved in an IoT-based attack
Nearly half of organizations have been involved in an IoT threat. Until IoT creators make not only security in general but upgradable security a design priority, things will get worse. For the latter, just because something leaves the factory appearing to be secure does not in any way mean a vulnerability won’t be found after the first ship. The device can’t be upgraded then. It’s as bad as not having been secured in the first place.
DDoSAttacksDDoS attacks have been increasing in frequency and strength each year for at least the last five years. They are no longer a rarity or anomaly, but a real threat to ecommerce and Internet-based businesses. They have now exceeded 1Tb/s in strength, and even the largest Internet-enabled organizations have felt the pinch if one comes knocking. Seventy-eight percent of the respondents indicated they had experienced a DDoS attack, with 53 percent indicating it had happened in the last year and 29 percent having experienced an attack in the last six months.
29%
24%
25%
22%
Yes, we have experienced an attack in the last 6 months
Yes, we have experienced an attack in the last year
Yes, but not in the last year
No, we have never experienced a DDoS attack
Figure 58 Organizations having experienced a DDoS attack
INTERNET OF THINGS

© 2019 Enterprise Management Associates, Inc.SECURITY MEGATRENDS14
DDoS is the bully of the Internet, but in this case, the bully often has a strategy outside of bludgeoning the targets’ Internet presence. Forty-one percent of respondents indicated that the attack included a component to exploit the business logic of the targeted site or applications. Thirty-two percent identified that the DDoS was a diversionary tactic for some other attack. Both of these types of attack are extremely difficult to defend against and require good defense technology and/or astute SecOps personnel. Table 2 shows a list of each industry and the type of DDoS they most commonly experience.
Industry Type of DDoS Attack Percent
High Tech DDoS used to hide other attacks 42%
MSSP Business logic, OSI layer 7 38%
Manufacturing Business logic, Volumetric 36%
Finance/Banking/Insurance OSI Layer 3 38%
Utilities and Shipping OSI layer 4 50%
Healthcare/Pharma/Medical OSI layer 3 29%
Retail/Wholesale/Distribution Business logic 60%
Table 2 Most common type of DDoS by industry
Defense StrategiesEighty-six percent of respondents that experienced a DDoS attack said their organization had a strategy in place prior to the attack. Amazingly, 71 percent said they changed their defense strategy after the DDoS attack. Of the respondents that changed their defense strategy, 75 percent had a single mode, on-premises or cloud, with a defense in place that they augmented or replaced. All of these points prove that making an informed choice for this defense strategy is critical. Only twenty-nine percent of the total respondent organizations have a DDoS defense in place. The following is a breakout of those defense architectures.
54%
23%
14%
10%
Hybrid defense using both on-premises and cloud scrubbing
Always-on cloud scrubbing
On-demand cloud scrubbing
On-premises scrubbing appliance
Figure 59 Organizational DDoS architectures in place
DDOS

© 2019 Enterprise Management Associates, Inc.SECURITY MEGATRENDS15
After everything, EMA asked respondents how they perceived the threat of damage of a DDoS attack today compared to the risk of damage from a DDoS a year ago. Most believe the risk has increased.
62%
22%
16%
Increasing
Neither increasing nor decreasing
Significantly decreasing
Figure 60 Change in damage from a DDoS attack compared to one year ago
Endpoint SecurityProtectionThe modern endpoint is any place data resides or is processed. It is at those points that the vast majority of attackers get to the information they desire. The battle for the endpoint is raging. Across antivirus, detection, prevention, and all combinations thereof, there are approximately 50 companies operating in the endpoint defense space. Seventy-three percent of respondents have been affected by some form of endpoint attack, and only 58 percent of organizations are highly confident they could detect an important security incident before it caused significant impact. When asked how effective their detection and prevention solutions were, respondents felt that detection solutions were only about 71 percent effective and prevention was only about 73 percent effective. Figure 61 shows the kind of infection rates by general malware class. Respondents could select none or any other combination of applicable attacks.
38%
37%
31%
20%
15%
27%
Advanced targeted attack (malware appearing to have been designed for a specific environment)
Advanced persistent attack (malware that resists removal or cleanup)
Ransomware attack
Other nuisance malware
Other destructive malware
None that I am aware of
Figure 61 Successful endpoint attacks
INTERNET OF THINGS

© 2019 Enterprise Management Associates, Inc.SECURITY MEGATRENDS16
Clean UpThese types of successful attacks occur all too often, with 48 percent causing moderate to severe business impacts and overall requiring an average of over four man-hours, and in nine percent of cases more than a working day, from both the support team and the employee to resolve and get back into operation.
7%
28%
42%
14%
9%
<1 hour
1-<4 hours
4-<6 hours
6-<8 hours
8+ hours
Average 4.57 hours
Figure 62 Time to restore an endpoint that a malware attack compromised
Investigations and ForensicsNo matter the type of defense you have or choose, a key aspect is the kind of information it provides after initial detection. How did the malware get in? When did it get in and thus, how long has it been inside? What systems has it touched? What has it done on the endpoint? These questions, along with others, are all pertinent and must be answered to successfully declare victory over the infiltration. Full endpoint interrogation data was rated most useful to accelerating incident response and breach detection.
50%
43%
Accelerating IR
Accelerating BD
Figure 63 Endpoint data as most useful data for breach detection and incident response
The choice for endpoint protection is a big one. It is the last line of defense for precious information. To that end, companies must detail requirements well. In the author’s opinion, detection is good but detection without the proper data collection for full forensics leaves the organization open to a lot of work. Be sure any detection platforms evaluated can provide enough details to understand how the attack executed and proliferated and the attack path.
ARTIFICIAL INTELLIGENCE

© 2019 Enterprise Management Associates, Inc.SECURITY MEGATRENDS17
EMA PerspectiveThere are a lot of common security problems in the world today. One report can’t possibly cover all of them. A key finding is that while there are absolutely nuances to some of the problems that are specific to a vertical, there are very few, if any, security problems totally unique to any company size or vertical. Threat actors may be more persistent and the potential losses may be larger, but a solid security program is based on reducing risk. Each company has to prioritize its risk and address the most significant problems in a way they see most fit. If companies invest appropriately based on their true risk tolerance and follow best practices, they can be compliant and secure without worrying about which compliance regulations they are or are not meeting.
About Enterprise Management Associates, Inc.Founded in 1996, Enterprise Management Associates (EMA) is a leading industry analyst firm that provides deep insight across the full spectrum of IT and data management technologies. EMA analysts leverage a unique combination of practical experience, insight into industry best practices, and in-depth knowledge of current and planned vendor solutions to help EMA’s clients achieve their goals. Learn more about EMA research, analysis, and consulting services for enterprise line of business users, IT professionals, and IT vendors at www.enterprisemanagement.com or blog.enterprisemanagement.com. You can also follow EMA on Twitter, Facebook, or LinkedIn.
This report in whole or in part may not be duplicated, reproduced, stored in a retrieval system or retransmitted without prior written permission of Enterprise Management Associates, Inc. All opinions and estimates herein constitute our judgement as of this date and are subject to change without notice. Product names mentioned herein may be trademarks and/or registered trademarks of their respective companies. “EMA” and “Enterprise Management Associates” are trademarks of Enterprise Management Associates, Inc. in the United States and other countries.
©2019 Enterprise Management Associates, Inc. All Rights Reserved. EMA™, ENTERPRISE MANAGEMENT ASSOCIATES®, and the mobius symbol are registered trademarks or common-law trademarks of Enterprise Management Associates, Inc.
Corporate Headquarters: 1995 North 57th Court, Suite 120 Boulder, CO 80301 Phone: +1 303.543.9500 Fax: +1 303.543.7687 www.enterprisemanagement.com3793-HelpSystems.011819
EMA PERSPECTIVE