sector effects of the shale gas revolution in the united states
TRANSCRIPT
1616 P St. NW Washington, DC 20036 202-328-5000 www.rff.org
July 2013 RFF DP 13-20
Sector Effects of the Shale Gas Revolution in the United States
Al an Krupnick , Zhongmin Wang , and Yushuang W ang
DIS
CU
SS
ION
PA
PE
R
© 2013 Resources for the Future. All rights reserved. No portion of this paper may be reproduced without
permission of the authors.
Discussion papers are research materials circulated by their authors for purposes of information and discussion.
They have not necessarily undergone formal peer review.
Sector Effects of the Shale Gas Revolution in the United States
Alan Krupnick, Zhongmin Wang, and Yushuang Wang
Abstract
This paper reviews the impact of the shale gas revolution on the sectors of electricity generation,
transportation, and manufacturing in the United States. Natural gas is being substituted for other fuels,
particularly coal, in electricity generation, resulting in lower greenhouse gas emissions from this sector.
The use of natural gas in the transportation sector is currently negligible but is projected to increase with
investments in refueling infrastructure and natural gas vehicle technologies. Petrochemical and other
manufacturing industries have responded to lower natural gas prices by investing in domestically located
manufacturing projects. This paper also speculates on the impact of a possible shale gas boom in China.
Key Words: shale gas, electricity, transportation, and manufacturing
JEL Classification Numbers: L71, L9, Q4
Contents
1. Introduction ......................................................................................................................... 1
2. Natural Gas in the US Economy ........................................................................................ 2
3. The Electricity Sector ......................................................................................................... 4
3.1. Historical Trends .......................................................................................................... 5
3.2. Modeling Future Electricity Sector Impacts: Haiku Model Simulation ...................... 7
3.3. Modeling Future Electricity Sector Impacts: NEMS Model Simulation ................... 14
3.4. Comparing Haiku and NEMS Forecasts .................................................................... 18
4. The Transportation Sector ............................................................................................... 19
4.1. The Current Status of Natural Gas Use in Transportation ......................................... 19
4.2. The Current Economics of NGVs versus Gasoline- or Diesel-Fueled Vehicles ....... 25
4.3. Future Projections of NGV Penetration ..................................................................... 31
5. The Manufacturing/Industrial Sector ............................................................................. 32
5.1. Petrochemicals ........................................................................................................... 36
5.2. Fertilizers ................................................................................................................... 37
5.3. Steel Production ......................................................................................................... 38
6. Possible Impact of a Potential Shale Gas Boom in China ............................................. 39
6.1. How Is Natural Gas Used in China? .......................................................................... 39
6.2. How Is Natural Gas Priced in China? ........................................................................ 43
6.3. Natural Gas Use Guidelines in China ........................................................................ 44
6.4. Natural Gas Trade and Global Market Impact ........................................................... 47
6.5. Comparing China with the United States................................................................... 48
References .............................................................................................................................. 50

Resources for the Future Krupnick, Wang, and Wang
1
Sector Effects of the Shale Gas Revolution in the United States
Alan Krupnick, Zhongmin Wang, and Yushuang Wang
1. Introduction
The shale gas revolution in the United States, due to breakthroughs in drilling
technologies such as horizontal drilling and hydraulic fracturing, has significantly boosted US
domestic natural gas production, which was previously in decline. US dry gas production
increased by about 27.4 percent from 18.05 Tcf per year in 2005 to 23 Tcf per year in 2011 (US
Energy Information Administration [EIA] 2012b), largely because of the increasing production
from shale gas and other unconventional sources. The share of shale gas in total natural gas
production in the United States has rapidly increased from 4 percent in 2005 to about 30 percent
today (Logan et al. 2012). This trend is likely to continue in coming decades, leading EIA to
project, in its 2012 reference case, that by 2035, shale gas will contribute about 49 percent of US
domestic natural gas production (EIA 2012a).
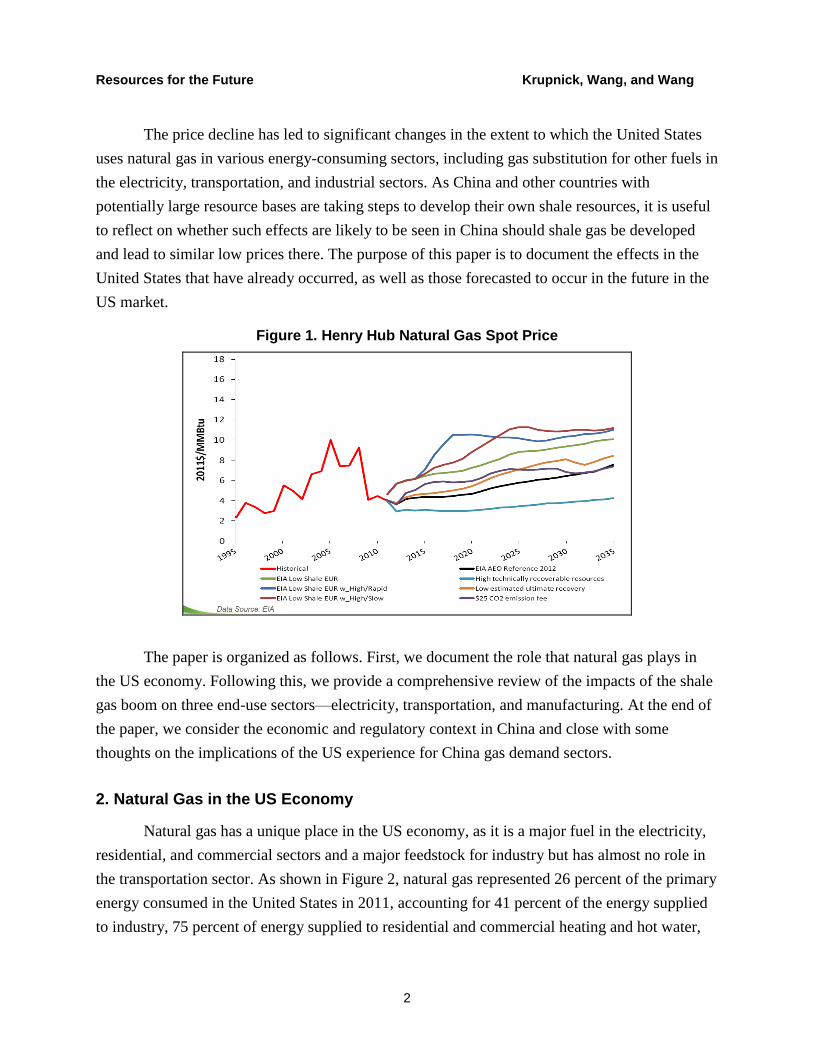
This major shift in the supply of natural gas has driven down its price. The annual
average Henry Hub natural gas spot price dropped by more than 50 percent, from $8.86 per
million Btu (mmBtu) in 2008 to $4.00/mmBtu in 2011, with a low of about $2.50/mmBtu in
early 2012 and a return to about $4.00/mmBtu as of late March 2013.1 These prices contrast to
natural gas spot prices in Japan ranging from $13 to $15/mmBtu and in Europe of around
$9/mmBtu. However, significant uncertainty is associated with the future price of natural gas,
given uncertainty in demand, supply, and regulations, both directly on shale gas extraction and
through existing and potential climate policy.2 Figure 1 shows the wide range of price forecasts
EIA uses to describe the future in its Annual Energy Outlook (AEO) 2012 forecast. A larger
shale resource base assumption leads to a lower price projection and vice versa. Under a carbon
pricing scenario, the natural gas price is projected to be higher relative to the reference case as a
result of the demand shift to natural gas from more carbon-intensive fuels like coal.
Krupnick, senior fellow and director of Resources for the Future’s (RFF) Center for Energy Economics and Policy;
Wang, fellow, RFF; Wang, research assistant, RFF.
1 See EIA, “Henry Hub Gulf Coast Natural Gas Price”, http://www.eia.gov/dnav/ng/hist/rngwhhdM.htm
2 Natural gas price volatility may be reduced as a result of changes in supply/demand balance and the geographic
dispersion of shale plays, which would probably lower the importance of Gulf of Mexico as a source of gas supply
(Lipschultz 2012).
Resources for the Future Krupnick, Wang, and Wang
2
The price decline has led to significant changes in the extent to which the United States
uses natural gas in various energy-consuming sectors, including gas substitution for other fuels in
the electricity, transportation, and industrial sectors. As China and other countries with
potentially large resource bases are taking steps to develop their own shale resources, it is useful
to reflect on whether such effects are likely to be seen in China should shale gas be developed
and lead to similar low prices there. The purpose of this paper is to document the effects in the
United States that have already occurred, as well as those forecasted to occur in the future in the
US market.
Figure 1. Henry Hub Natural Gas Spot Price
The paper is organized as follows. First, we document the role that natural gas plays in
the US economy. Following this, we provide a comprehensive review of the impacts of the shale
gas boom on three end-use sectors—electricity, transportation, and manufacturing. At the end of
the paper, we consider the economic and regulatory context in China and close with some
thoughts on the implications of the US experience for China gas demand sectors.
2. Natural Gas in the US Economy
Natural gas has a unique place in the US economy, as it is a major fuel in the electricity,
residential, and commercial sectors and a major feedstock for industry but has almost no role in
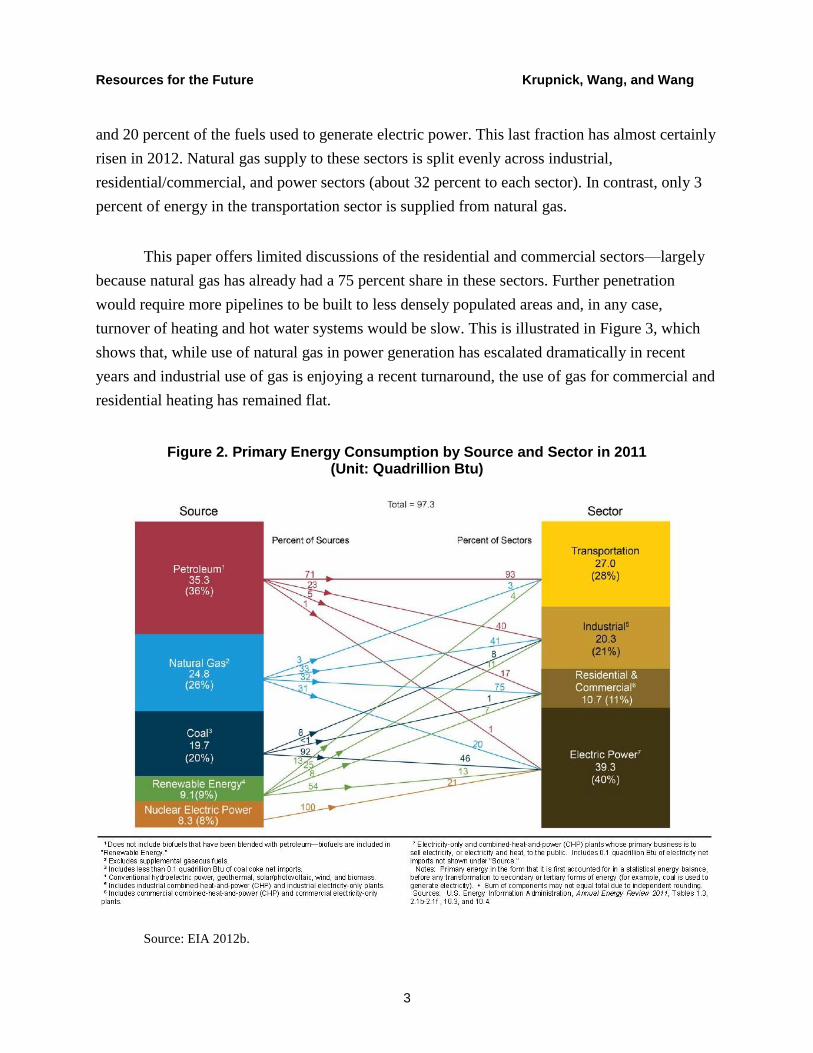
the transportation sector. As shown in Figure 2, natural gas represented 26 percent of the primary
energy consumed in the United States in 2011, accounting for 41 percent of the energy supplied
to industry, 75 percent of energy supplied to residential and commercial heating and hot water,
Resources for the Future Krupnick, Wang, and Wang
3
and 20 percent of the fuels used to generate electric power. This last fraction has almost certainly
risen in 2012. Natural gas supply to these sectors is split evenly across industrial,
residential/commercial, and power sectors (about 32 percent to each sector). In contrast, only 3
percent of energy in the transportation sector is supplied from natural gas.
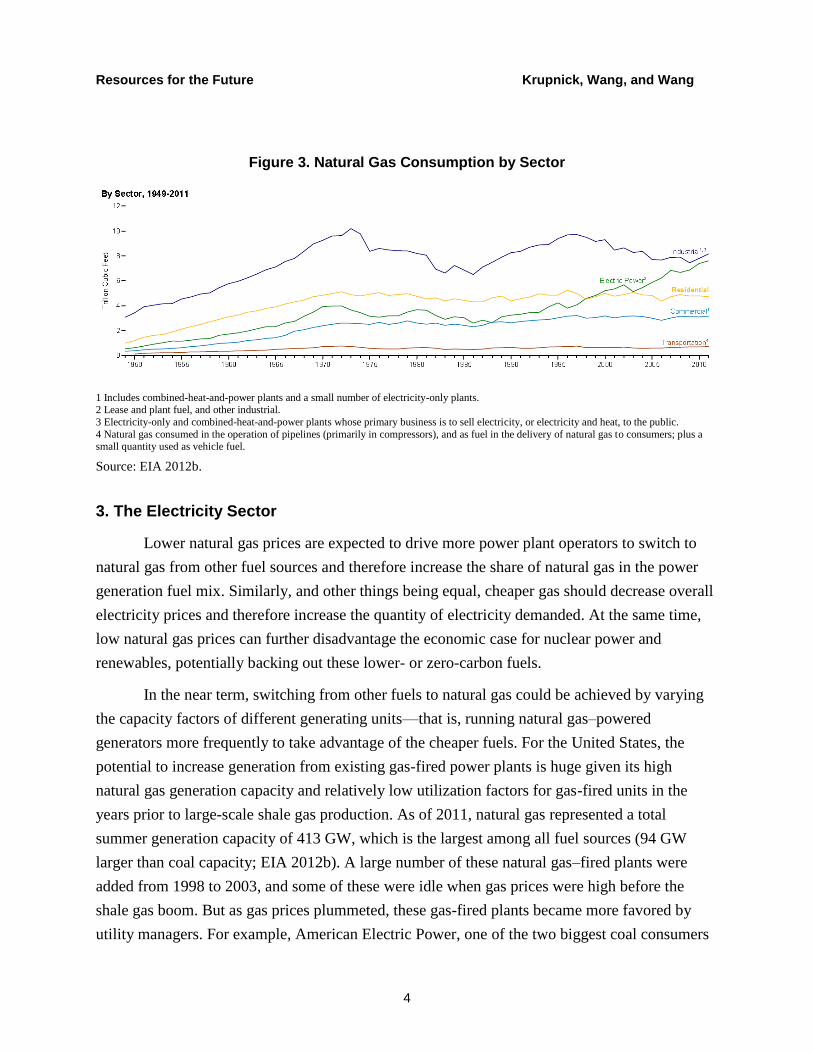
This paper offers limited discussions of the residential and commercial sectors—largely
because natural gas has already had a 75 percent share in these sectors. Further penetration
would require more pipelines to be built to less densely populated areas and, in any case,
turnover of heating and hot water systems would be slow. This is illustrated in Figure 3, which
shows that, while use of natural gas in power generation has escalated dramatically in recent
years and industrial use of gas is enjoying a recent turnaround, the use of gas for commercial and
residential heating has remained flat.
Figure 2. Primary Energy Consumption by Source and Sector in 2011 (Unit: Quadrillion Btu)
Source: EIA 2012b.
Resources for the Future Krupnick, Wang, and Wang
4
Figure 3. Natural Gas Consumption by Sector
1 Includes combined-heat-and-power plants and a small number of electricity-only plants. 2 Lease and plant fuel, and other industrial.
3 Electricity-only and combined-heat-and-power plants whose primary business is to sell electricity, or electricity and heat, to the public.
4 Natural gas consumed in the operation of pipelines (primarily in compressors), and as fuel in the delivery of natural gas to consumers; plus a small quantity used as vehicle fuel.
Source: EIA 2012b.
3. The Electricity Sector
Lower natural gas prices are expected to drive more power plant operators to switch to
natural gas from other fuel sources and therefore increase the share of natural gas in the power
generation fuel mix. Similarly, and other things being equal, cheaper gas should decrease overall
electricity prices and therefore increase the quantity of electricity demanded. At the same time,
low natural gas prices can further disadvantage the economic case for nuclear power and
renewables, potentially backing out these lower- or zero-carbon fuels.
In the near term, switching from other fuels to natural gas could be achieved by varying
the capacity factors of different generating units—that is, running natural gas–powered
generators more frequently to take advantage of the cheaper fuels. For the United States, the
potential to increase generation from existing gas-fired power plants is huge given its high
natural gas generation capacity and relatively low utilization factors for gas-fired units in the
years prior to large-scale shale gas production. As of 2011, natural gas represented a total
summer generation capacity of 413 GW, which is the largest among all fuel sources (94 GW
larger than coal capacity; EIA 2012b). A large number of these natural gas–fired plants were
added from 1998 to 2003, and some of these were idle when gas prices were high before the
shale gas boom. But as gas prices plummeted, these gas-fired plants became more favored by
utility managers. For example, American Electric Power, one of the two biggest coal consumers

Resources for the Future Krupnick, Wang, and Wang
5
in the United States, ran its gas plants at a 70 percent capacity level in 2012 while its coal plants
ran less than half of the time (Mufson 2012).
In the long term, the change in fuel prices would also affect business decision-making on
new power plant investments and old plant retirements, thus changing the fuel mix of generating
capacity. Roughly 30 GW of coal-fired plants, which comprise about 10 percent of the total coal
generation capacity, will be closed down by 2016, according to the announced retirement plans
made by companies as of July 2012 (Celebl et al. 2012). Apart from the abundant supply of
natural gas, the expected stricter regulation of air pollution from coal combustion also plays an
important role in these anticipated closures. Many companies with older coal power plants have
to decide between investing in environmental control facilities to ensure that their coal plants
stay in operation versus putting that investment into new, cleaner gas-fired plants. Low gas price
has made the latter choice more attractive to the industry, although the history of high gas price
volatility acts to dampen the enthusiasm for natural gas.
As noted above, lower natural gas prices also affect the share of renewables in the electric
power fuel mix. Natural gas can be used by three generation technologies: natural gas combined
cycle (NGCC) units, steam turbines, and gas turbines. Of these three technologies, NGCCs and
steam turbines are usually used as base-load or intermediate-load units, while gas turbines are
more likely to act as peaking units given their high flexibility (Massachusetts Institute of
Technology 2009). Cheap gas could potentially displace both coal and renewables since it
provides a cheaper fuel option for both base-load and peak generation. Meanwhile, low natural
gas price would also make renewable generation more competitive by bringing down the cost of
renewable–gas hybrid systems, in which intermittent renewable generation is backed up by
flexible gas turbine generation. These two effects work in the same direction to displace coal
generation, while having the opposite effects on renewables. Hence, the overall impact of
cheaper natural gas on renewable generation depends on the characteristics of the power market,
such as current capacity fuel mix, dispatching system, load characteristics and relevant
regulations.
3.1. Historical Trends
Although not as coal-dominant as China’s power generation sector, US electricity
generation has also relied largely on coal. Recently, however, low natural gas has given natural
gas–powered generation a competitive advantage over coal-powered generation, and there has
been an evident trend of fuel switching—from coal and other fuel sources to natural gas—in the
electricity fuel mix. From 2008 to 2011, the annual share of coal generation dropped from 48.2
Resources for the Future Krupnick, Wang, and Wang
6
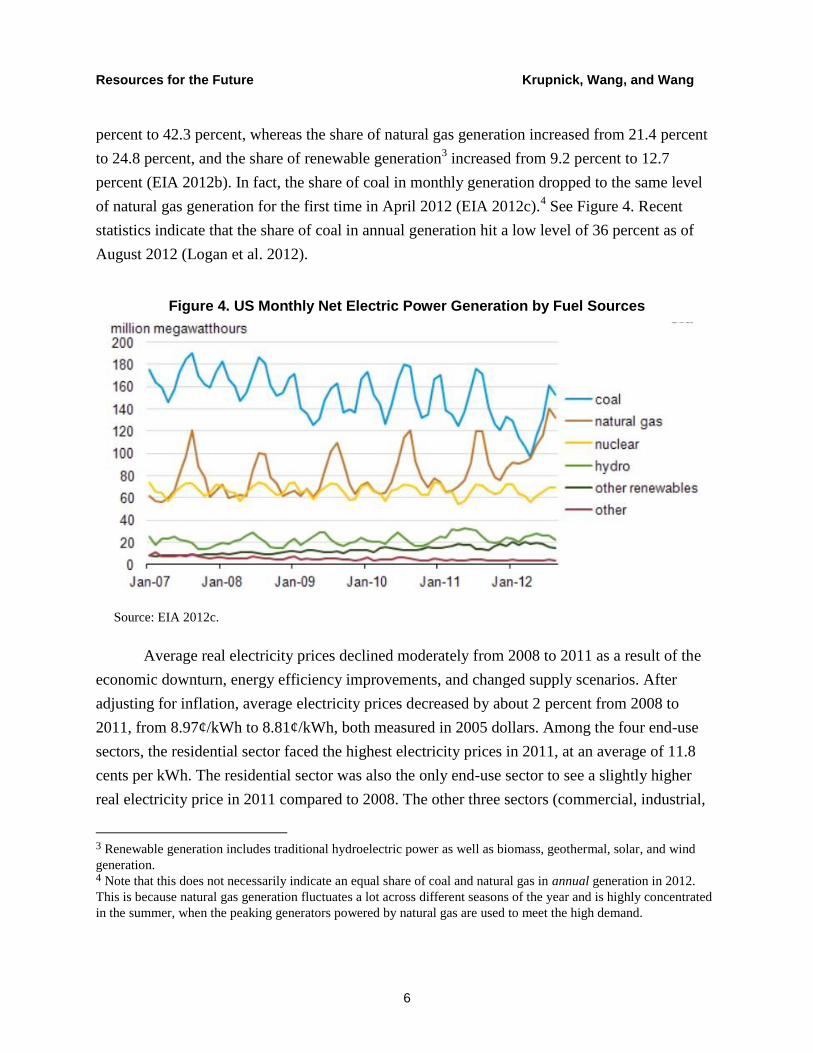
percent to 42.3 percent, whereas the share of natural gas generation increased from 21.4 percent
to 24.8 percent, and the share of renewable generation3 increased from 9.2 percent to 12.7
percent (EIA 2012b). In fact, the share of coal in monthly generation dropped to the same level
of natural gas generation for the first time in April 2012 (EIA 2012c).4 See Figure 4. Recent
statistics indicate that the share of coal in annual generation hit a low level of 36 percent as of
August 2012 (Logan et al. 2012).
Figure 4. US Monthly Net Electric Power Generation by Fuel Sources
Source: EIA 2012c.
Average real electricity prices declined moderately from 2008 to 2011 as a result of the
economic downturn, energy efficiency improvements, and changed supply scenarios. After
adjusting for inflation, average electricity prices decreased by about 2 percent from 2008 to
2011, from 8.97¢/kWh to 8.81¢/kWh, both measured in 2005 dollars. Among the four end-use
sectors, the residential sector faced the highest electricity prices in 2011, at an average of 11.8
cents per kWh. The residential sector was also the only end-use sector to see a slightly higher
real electricity price in 2011 compared to 2008. The other three sectors (commercial, industrial,
3 Renewable generation includes traditional hydroelectric power as well as biomass, geothermal, solar, and wind
generation. 4 Note that this does not necessarily indicate an equal share of coal and natural gas in annual generation in 2012.
This is because natural gas generation fluctuates a lot across different seasons of the year and is highly concentrated
in the summer, when the peaking generators powered by natural gas are used to meet the high demand.
Resources for the Future Krupnick, Wang, and Wang
7
and transportation) experienced a drop in electricity prices during the time period, with a
decrease of 5 percent, 3 percent, and 6 percent, respectively, from 2008 to 2011 (EIA 2012b).
Generation fuel mix changes have also led to changes in greenhouse gas (GHG)
emissions from electricity generation, which accounts for about 40 percent percen of total carbon
dioxide (CO2) emissions in the United States. The CO2 emissions from electricity generation,
after fluctuating in the range of 2,346 to 2,413 million metric tons from 2005 to 2008, dropped
by 9.09 percent to 2,146 million metric tons in 2009, which was then followed by a slight
increase to 2,258 million metric tons in 2010. Total fossil fuel–based CO2 emissions from all
end-use sectors followed a similar pattern, with a significant drop from 5,572 million metric tons
of CO2 in 2008 to 5,206 million metric tons in 2009 and a minimal increase from 2009 to 2010
(US Environmental Protection Agency [EPA] 2012).
To examine what might happen in the future, the following subsections review results
from Resources for the Future’s (RFF’s) Haiku electricity model and EIA’s National Energy
Modeling System (NEMS) model of the US energy economy for quantitative forecasts of the
effects of cheap natural gas on the electricity sector.
3.2. Modeling Future Electricity Sector Impacts: Haiku Model Simulation
RFF’s Haiku model is a partial equilibrium simulation model that solves for equilibrium
outcomes in the US electricity market. RFF researchers recently used Haiku to analyze several
relevant scenarios that include different combinations of forecasts of natural gas supply and
electricity demand (Burtraw et al. 2012). The scenarios most relevant to this paper include the
following.
1. Cheap Gas. This scenario reflects EIA’s AEO 2011 projections of both electricity
demand and natural gas supply.
2. Expensive Gas. This scenario uses the same AEO 2011 projection of electricity
demand but substitutes EIA’s projections of natural gas supply made in AEO 2009,
which are much smaller. From AEO 2009 and AEO 2011, the unproved technically
recoverable shale gas resource estimate increased by more than three-fold from 267
Tcf to 827 Tcf (EIA 2012a). Relative to the Cheap Gas scenario, this scenario shows
the effect on the electricity sector of lower natural gas supply and higher natural gas
wellhead prices.
Resources for the Future Krupnick, Wang, and Wang
8
Haiku can be calibrated to different levels of electricity demand and natural gas supply,
such as the AEO forecasts described above. However, Haiku outcomes can vary from these
forecasts according to information and policies represented in the model. Other model
characteristics, such as data about the existing generation fleet, assumptions about new
generating capacity, and current regulatory structures and pollution policies, remain the same for
the two scenarios modeled. In these two scenarios, the Clean Air Interstate Rule is assumed to
remain in place.
Natural Gas Price
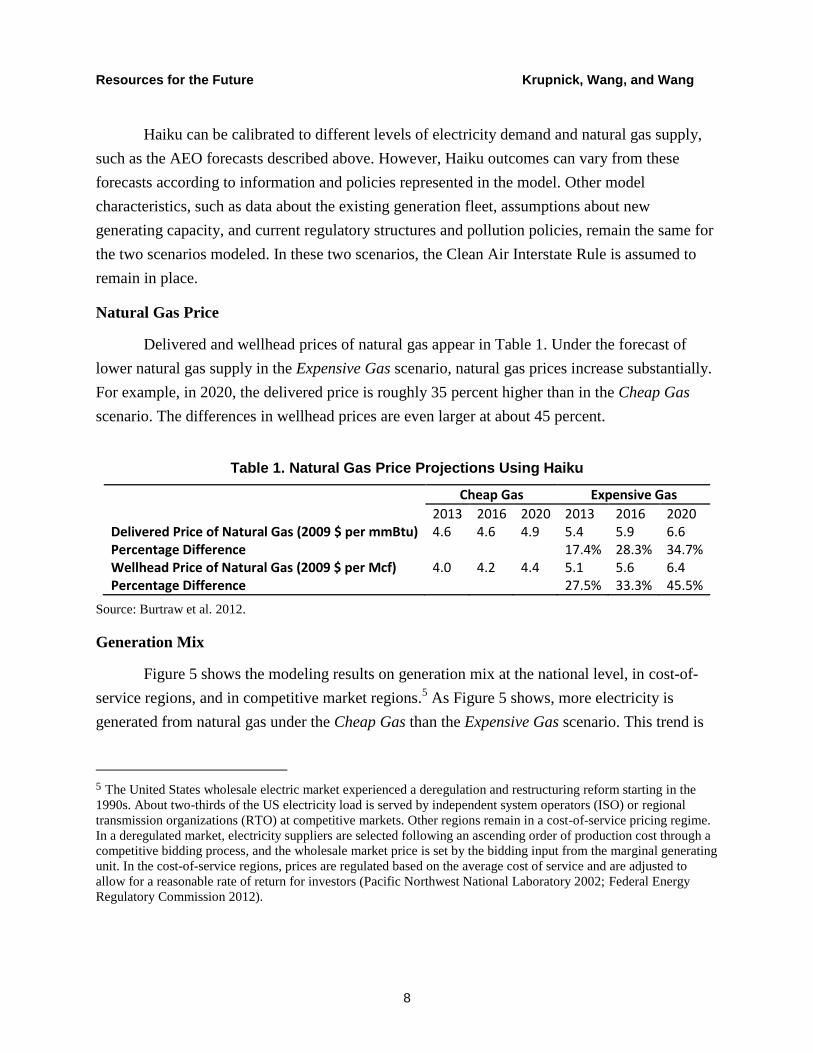
Delivered and wellhead prices of natural gas appear in Table 1. Under the forecast of
lower natural gas supply in the Expensive Gas scenario, natural gas prices increase substantially.
For example, in 2020, the delivered price is roughly 35 percent higher than in the Cheap Gas
scenario. The differences in wellhead prices are even larger at about 45 percent.
Table 1. Natural Gas Price Projections Using Haiku
Cheap Gas Expensive Gas
2013 2016 2020 2013 2016 2020 Delivered Price of Natural Gas (2009 $ per mmBtu) 4.6 4.6 4.9 5.4 5.9 6.6 Percentage Difference 17.4% 28.3% 34.7% Wellhead Price of Natural Gas (2009 $ per Mcf) 4.0 4.2 4.4 5.1 5.6 6.4 Percentage Difference 27.5% 33.3% 45.5%
Source: Burtraw et al. 2012.
Generation Mix
Figure 5 shows the modeling results on generation mix at the national level, in cost-of-
service regions, and in competitive market regions.5 As Figure 5 shows, more electricity is
generated from natural gas under the Cheap Gas than the Expensive Gas scenario. This trend is
5 The United States wholesale electric market experienced a deregulation and restructuring reform starting in the
1990s. About two-thirds of the US electricity load is served by independent system operators (ISO) or regional
transmission organizations (RTO) at competitive markets. Other regions remain in a cost-of-service pricing regime.
In a deregulated market, electricity suppliers are selected following an ascending order of production cost through a
competitive bidding process, and the wholesale market price is set by the bidding input from the marginal generating
unit. In the cost-of-service regions, prices are regulated based on the average cost of service and are adjusted to
allow for a reasonable rate of return for investors (Pacific Northwest National Laboratory 2002; Federal Energy
Regulatory Commission 2012).

Resources for the Future Krupnick, Wang, and Wang
9
most pronounced in competitive regions. In all of the Cheap Gas scenarios, increased natural gas
generation leads to a decrease in consumption of the other fossil fuels, such as coal and oil.
While expanded supply of natural gas could have mixed effects on renewables, the modeling
results show that, by 2035, renewable generation is projected to be about 5 percent lower in the
Cheap Gas scenario compared to the Expensive Gas scenario. Such an overall “crowding-out”
effect of cheap natural gas on renewables is consistent with the dominant industry view and
supports the concerns of environmentalists that shale gas might hurt the market share of
renewables.
Electricity Price
Modeling in Haiku indicates that the forecasted high levels of supply of domestic natural
gas will continue to substantially reduce retail electricity prices over the next 20 years, as shown
in Figure 6. The trajectory of average electricity prices over the simulation time horizon under
each scenario is shown in Figure 6 at national level, for the cost-of-service regions, and for
competitive regions. Nationally and in both types of region, the Expensive Gas scenario forecasts
that natural gas supply leads to higher electricity prices than in the Cheap Gas scenario. These
effects are largest in the competitive regions, where projected average electricity price for the
year 2020 is 9.6 percent higher under the Expensive Gas case compared to the Cheap Gas case,
while the cost-of-service regions see a smaller price difference at about 3.6 percent in 2020. At
the national level, average electricity price in 2020 is projected to climb by about 5.7 percent
moving from the Cheap Gas to the Expensive Gas case.

Resources for the Future Krupnick, Wang, and Wang
10
Figure 5. Projected Fuel Mix in Electric Power Generation in the United States Panel A. National
Panel B. Cost-of-Service Markets

Resources for the Future Krupnick, Wang, and Wang
11
Panel C. Competitive Markets
Source: Burtraw et al. 2012.
Figure 6. Electricity Prices (2009$/MWh) Projected by Haiku
Source: Burtraw et al. 2012.
Resources for the Future Krupnick, Wang, and Wang
12
The pattern described above also holds for the electricity prices facing each customer
class (residential, commercial, and industrial), with the Expensive Gas scenario forecasting
increasing prices. At the national level, the percentage difference is the largest for the industrial
users (6.8 percent in 2020), followed by commercial users (5.7 percent in 2020) and residential
users (4.6 percent in 2020). For each of the customer classes, competitive regions are projected
to see a larger fall in electricity prices compared to cost-of-service regions. Industrial users at
competitive markets will probably enjoy the greatest benefit from cheaper electricity, for whom
the percentage difference in electricity price is projected to be as much as 14.5 percent in 2020.
Electricity Consumption
Electricity consumption under the two scenarios for the year 2020 is shown in Table 2.
This table includes a breakdown of consumption by customer class and electricity market
regulatory structure. Given higher gas and electricity prices under the Expensive Gas scenario
compared to the Cheap Gas scenario (as described above), consumers respond by using less
electricity in the former scenario. Similar to the effects on electricity price, such effects are the
most prominent for industrial users and competitive regions.
GHG Emissions from the Electric Power Sector
As shown in Figure 7, the increased use of natural gas in the Cheap Gas scenario reduces
CO2 emissions from electricity generation by about 6.6 percent compared to emissions under the
Expensive Gas scenario. Total CO2 emissions from the electricity sector will reach 2,676 million
tons and 2,579 million tons by 2035 in the Expensive Gas and Cheap Gas scenarios,
respectively.

Resources for the Future Krupnick, Wang, and Wang
13
Table 2. Projected Electricity Consumption (TWh) in 2020 by Haiku
Cheap Gas Expensive Gas
2020 2020 % difference National
Total 3,952 3,869 –2.1% Residential 1,379 1,361 –1.3% Commercial 1,511 1,488 –1.5% Industrial 1,061 1,020 –3.9% Cost-of-Service
Total 2,699 2,657 –1.6% Residential 958.2 948.0 –1.1% Commercial 1,002 988.0 –1.4% Industrial 739.5 721.1 –2.5% Competitive
Total 1,252 1,212 -3.2% Residential 421.2 412.7 –2.0% Commercial 509.5 500.0 –1.9% Industrial 321.7 299.2 –7.0%
Source: Burtraw et al. 2012.
Figure 7. CO2 Emission from Electricity Generation
Source: Burtraw et al. 2012.

Resources for the Future Krupnick, Wang, and Wang
14
3.3. Modeling Future Electricity Sector Impacts: NEMS Model Simulation
EIA’s projections in its AEO are generated using the NEMS, a modular system
developed to model the economic activities in various sectors (residential, commercial,
industrial, transportation, electricity, and others) involving various energy fuels (petroleum,
natural gas, coal, and others) in the United States. It is a market-based system subject to current
regulations and has the capability to represent regional differences by running a variety of
component models at different regional levels.
EIA produces a reference case and a number of side cases, which represent different
views of the future. What is of interest here is the uncertainty around the supply of shale gas
resources, which is measured by technically recoverable resources (TRR). The remaining
unproved TRR for a shale gas play depends on various factors, including land area, well spacing,
percentage of area untested, percentage of area with potential, and estimated ultimate recovery
(EUR)6 per well. In AEO 2012, two EUR sensitivity cases and a high TRR case combining high
EUR with a high well spacing assumption were created to examine the impacts of the size
variation of the shale gas resource base. Note that “these High and Low EUR cases are not
intended to represent a confidence interval for the resource base, but rather to illustrate how
different EUR assumptions can affect projections of domestic production and prices” (EIA
2012a, p. 59). NEMS scenarios referenced in this paper (EIA 2012a) include the following.
1. Reference Case. The total shale gas unproved TRR assumption in AEO 2012’s
Reference case is 482 Tcf (as of 1/1/2010), with the EURs for selected shale gas plays
assumed to vary from 0.34 Bcf/well (Caney Play) to 2.89 Bcf/well (Woodford Play).
2. Low EUR Case. In this case, the EUR per shale gas well is assumed to be 50 percent
lower than in the Reference case, which brings the total shale gas TRR down to 241
Tcf.
3. High EUR Case. In this case, the EUR per shale gas well is assumed to be 50 percent
higher than in the Reference case, which brings the total shale gas TRR up to 723 Tcf.
4. High TRR Case. In this case, the EUR per shale gas well is assumed to be 50 percent
higher than in the Reference case, and the well spacing for shale gas plays is assumed
6 EUR is an approximation of the quantity of oil or gas that is potentially recoverable or has already been recovered
from a reserve or well. EURs vary widely across plays and within a play. “For every AEO, the EUR for each sub-
play is determined by fitting a hyperbolic decline curve to the latest production history” (EIA 2012a, p. 57).
Resources for the Future Krupnick, Wang, and Wang
15
to be 8 wells/square mile, rather than a play-specific average well spacing ranging
from 2 to 12 wells/square mile, as in the Reference case, which brings the total shale
gas TRR up to 1,091 Tcf.
Natural Gas Price
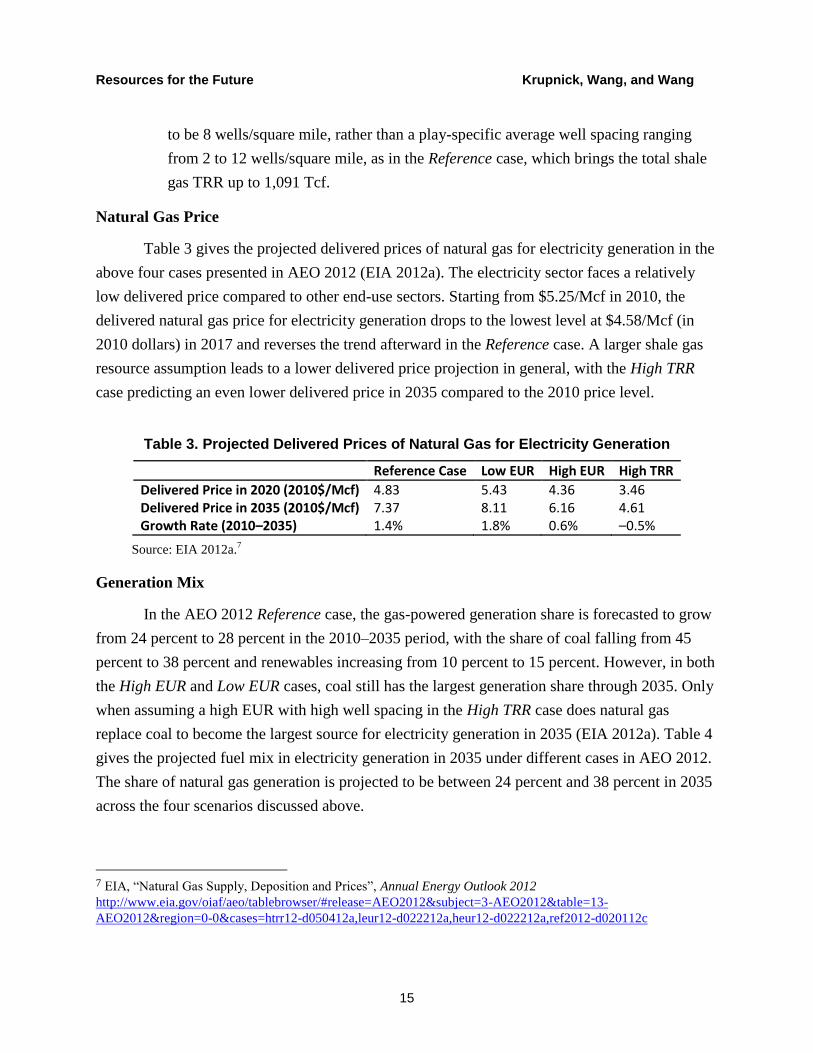
Table 3 gives the projected delivered prices of natural gas for electricity generation in the
above four cases presented in AEO 2012 (EIA 2012a). The electricity sector faces a relatively
low delivered price compared to other end-use sectors. Starting from $5.25/Mcf in 2010, the
delivered natural gas price for electricity generation drops to the lowest level at $4.58/Mcf (in
2010 dollars) in 2017 and reverses the trend afterward in the Reference case. A larger shale gas
resource assumption leads to a lower delivered price projection in general, with the High TRR
case predicting an even lower delivered price in 2035 compared to the 2010 price level.
Table 3. Projected Delivered Prices of Natural Gas for Electricity Generation
Reference Case Low EUR High EUR High TRR
Delivered Price in 2020 (2010$/Mcf) 4.83 5.43 4.36 3.46 Delivered Price in 2035 (2010$/Mcf) 7.37 8.11 6.16 4.61 Growth Rate (2010–2035) 1.4% 1.8% 0.6% –0.5%
Source: EIA 2012a.7
Generation Mix
In the AEO 2012 Reference case, the gas-powered generation share is forecasted to grow
from 24 percent to 28 percent in the 2010–2035 period, with the share of coal falling from 45
percent to 38 percent and renewables increasing from 10 percent to 15 percent. However, in both
the High EUR and Low EUR cases, coal still has the largest generation share through 2035. Only
when assuming a high EUR with high well spacing in the High TRR case does natural gas
replace coal to become the largest source for electricity generation in 2035 (EIA 2012a). Table 4
gives the projected fuel mix in electricity generation in 2035 under different cases in AEO 2012.
The share of natural gas generation is projected to be between 24 percent and 38 percent in 2035
across the four scenarios discussed above.
7 EIA, “Natural Gas Supply, Deposition and Prices”, Annual Energy Outlook 2012
http://www.eia.gov/oiaf/aeo/tablebrowser/#release=AEO2012&subject=3-AEO2012&table=13-
AEO2012®ion=0-0&cases=htrr12-d050412a,leur12-d022212a,heur12-d022212a,ref2012-d020112c

Resources for the Future Krupnick, Wang, and Wang
16
Table 4. Projected Electricity Generation Fuel Mix in 2035 under Different Cases
Percentage of Generation
Reference Case Low EUR High EUR High TRR
Coal 38.0% 40.0% 35.9% 30.1% Natural Gas 28.0% 23.8% 31.3% 37.9% Petroleum 0.6% 0.6% 0.6% 0.6% Nuclear Power 17.8% 19.0% 17.3% 16.9% Renewables 15.2% 16.2% 14.4% 14.1% Other 0.4% 0.4% 0.4% 0.4%
Source: Authors’ calculation based on information from EIA website.8
The recently released AEO 2013 (early release version) extends the projection horizon to
2040. In AEO 2013’s early release, projections on natural gas production and consumption by
power plants are both higher in the Reference case compared to AEO 2012. Natural gas is
expected to account for 27 percent of electricity generation in 2020 and 30 percent in 2040 (EIA
2013).
Generation Capacity
In terms of changes in generation capacity, it is projected that 60 percent of added
capacity between 2011 and 2035 in the US power market would come from natural gas–fired
plants compared to 29 percent from renewables, 7 percent from coal, and 4 percent from nuclear
in the Reference case. Natural gas–fired capacity is predicted to account for 47 percent of new
additions in the Low EUR case and 66 percent in the High EUR case. In addition, 49 GW of coal-
fired plants are projected to be retired through 2035 in the Reference case, while the High EUR
case projects coal retirement by 2035 to be at a higher level of 55 GW (EIA 2012a). Besides the
increased natural gas supply brought by shale gas drilling, other regulatory factors also
contribute to make natural gas–fired plants more attractive to investors, including the
environmental regulations on local air pollution, energy programs, and tax incentives at both the
federal and state levels, and uncertainty about the future US climate policy.
Electricity Price
In EIA’s Reference case, average real electricity prices decline through 2020 and increase
afterward. As a result, real average electricity price is predicted to be 10.1¢/kWh (in 2010
8 EIA, “Electricity Supply, Deposition, Prices, and Emissions”, Annual Energy Outlook 2012
http://www.eia.gov/oiaf/aeo/tablebrowser/#release=AEO2012&subject=6-AEO2012&table=8-AEO2012®ion=0-
0&cases=heur12-d022212a,leur12-d022212a,htrr12-d050412a,ref2012-d020112c
Resources for the Future Krupnick, Wang, and Wang
17
dollars) in 2035, 3 percent higher than the 2010 price level. A larger shale gas resource
assumption lowers the future electricity price projection, with the electricity price in 2035 (in
2010 dollars) projected to be 10.5¢/kWh, 9.7¢/kWh, and 9.1¢/kWh for the Low EUR, High EUR,
and High TRR cases, respectively (EIA 2012a).
Electricity Consumption
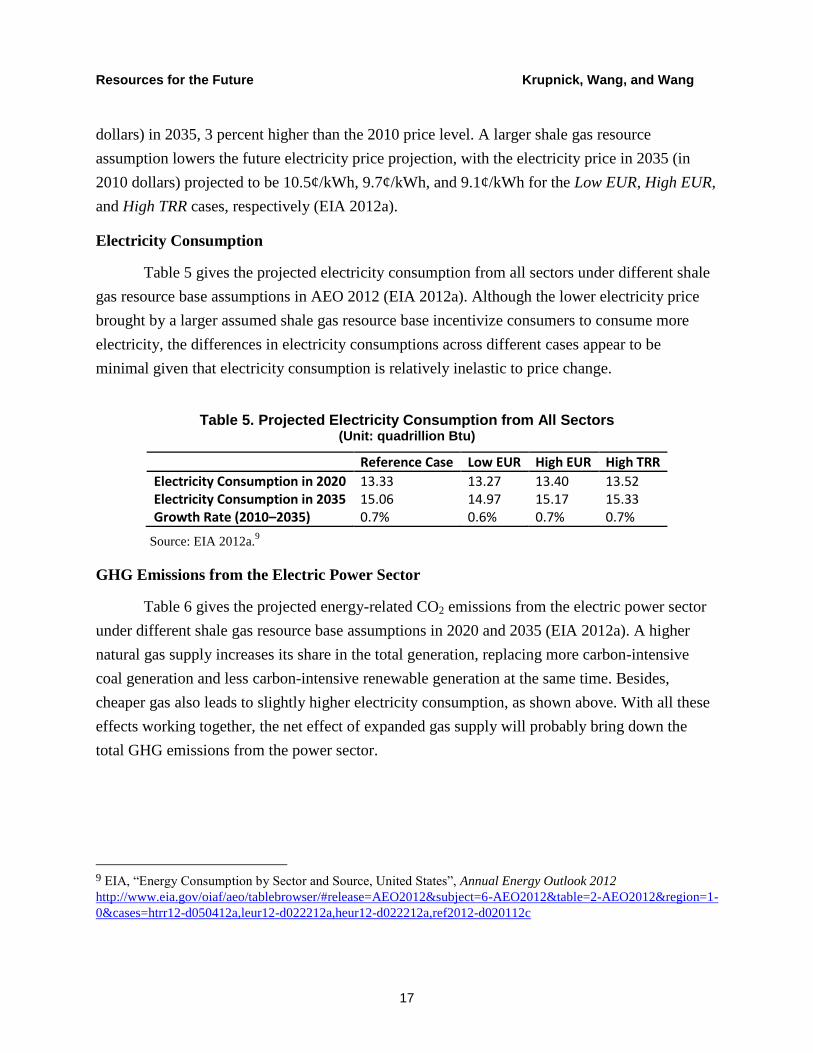
Table 5 gives the projected electricity consumption from all sectors under different shale
gas resource base assumptions in AEO 2012 (EIA 2012a). Although the lower electricity price
brought by a larger assumed shale gas resource base incentivize consumers to consume more
electricity, the differences in electricity consumptions across different cases appear to be
minimal given that electricity consumption is relatively inelastic to price change.
Table 5. Projected Electricity Consumption from All Sectors (Unit: quadrillion Btu)
Reference Case Low EUR High EUR High TRR
Electricity Consumption in 2020 13.33 13.27 13.40 13.52 Electricity Consumption in 2035 15.06 14.97 15.17 15.33 Growth Rate (2010–2035) 0.7% 0.6% 0.7% 0.7%
Source: EIA 2012a.9
GHG Emissions from the Electric Power Sector
Table 6 gives the projected energy-related CO2 emissions from the electric power sector
under different shale gas resource base assumptions in 2020 and 2035 (EIA 2012a). A higher
natural gas supply increases its share in the total generation, replacing more carbon-intensive
coal generation and less carbon-intensive renewable generation at the same time. Besides,
cheaper gas also leads to slightly higher electricity consumption, as shown above. With all these
effects working together, the net effect of expanded gas supply will probably bring down the
total GHG emissions from the power sector.
9 EIA, “Energy Consumption by Sector and Source, United States”, Annual Energy Outlook 2012
http://www.eia.gov/oiaf/aeo/tablebrowser/#release=AEO2012&subject=6-AEO2012&table=2-AEO2012®ion=1-
0&cases=htrr12-d050412a,leur12-d022212a,heur12-d022212a,ref2012-d020112c

Resources for the Future Krupnick, Wang, and Wang
18
Table 6. Projected Energy-Related CO2 Emissions from the Electric Power Sector
Reference Case Low EUR High EUR High TRR
Emissions in 2020 (million tons of CO2 eq) 2067 2127 2026 1917 Emissions in 2035 (million tons of CO2 eq) 2330 2340 2310 2173 Growth Rate (2010–2035) 0.1% 0.1% 0.1% –0.2%
Source: EIA 2012a.10
3.4. Comparing Haiku and NEMS Forecasts
While based on different sets of supply and demand scenarios, both Haiku and NEMS
modeling results show that: (1) the expanded natural gas supply will probably act to lower the
delivered price of natural gas to the electricity sector, increasing the share of natural gas
generation and decreasing coal and renewable generation shares in the coming decade; (2) lower
electricity prices can be expected with a larger shale gas resource availability, accompanied by a
slightly larger amount of electricity consumption; and (3) GHG emissions from the power sector
would be reduced mainly by the increasing use of natural gas for power generation.
Given that Haiku and NEMS projections are based on different methodologies (although
Haiku uses the current baseline information from NEMS11
), we might expect their projection
results to be very different. However, they are quite similar. Table 7 lists the reference case
projections from Haiku12
and NEMS for the year 2020.
10 See EIA, “Energy-Related Carbon Dioxide Emissions by Sector and Source, United States”,
http://www.eia.gov/oiaf/aeo/tablebrowser/#release=AEO2012&subject=0-AEO2012&table=17-
AEO2012®ion=1-0&cases=htrr12-d050412a,leur12-d022212a,heur12-d022212a,ref2012-d020112c 11 Haiku takes the baseline information from AEO 2011, whereas the NEMS projection presented here is taken from
AEO 2012. 12 Here we take the Cheap Gas case in Haiku as the reference case.

Resources for the Future Krupnick, Wang, and Wang
19
Table 7. Reference Case Projections by Haiku and NEMS (2020)13
Haiku Projection by RFF NEMS Projection by EIA
Delivered Natural Gas Price (2010$) $5.11/ Mcf $4.83/ Mcf Electricity Price (2010$) 8.9¢/ kWh 9.6 ¢/ kWh Electricity Consumption 3952 TWh 3906 TWh CO2 Emissions from Electricity Power Sector 2329 ton 2067 ton
Source: Burtraw et al. 2012; EIA 2012a.
4. The Transportation Sector
Unlike the electricity sector, the US transportation sector currently sees only a small
proportion of its energy use coming from natural gas. In 2011, natural gas accounted for 3
percent of the total 27.0 quadrillion Btu of energy consumption for transportation, leaving
petroleum the dominant fuel with a 93 percent share (Figure 2; EIA 2012b). Nevertheless, low
natural gas prices coupled with relatively high oil prices have made natural gas increasingly
attractive as a fuel choice for transportation.
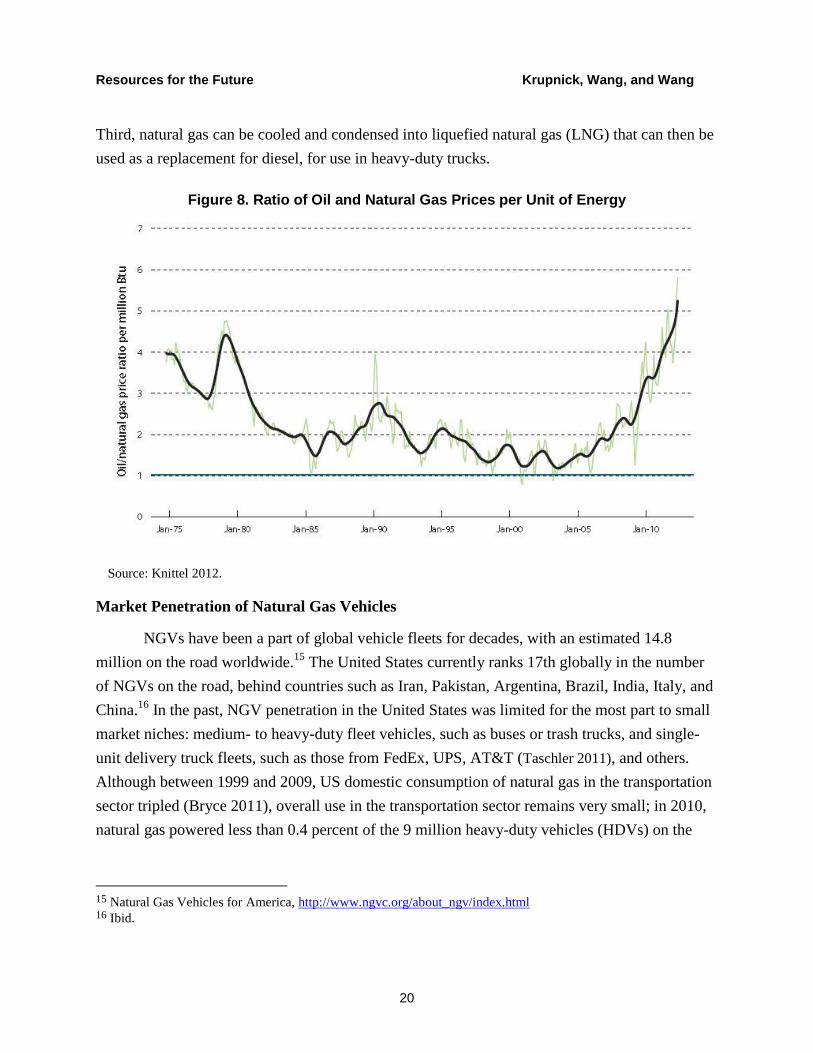
Figure 8 plots the ratio of oil prices to natural gas prices on a per–energy unit basis,
showing a rapidly rising ratio in the past few years that soared to 500 percent as of late 2011.
While other factors affect the fuel prices paid by consumers at the pump (e.g., fuel taxes,14
infrastructure cost, supplier competitiveness, and delivery and storage cost), the price gaps
between compressed natural gas (CNG) and other alternative fuels at the retail level have also
widened recently. Low gas prices have undoubtedly quickened the trend of shifting from oil-
based fuels to gas-based fuels in the transportation sector.
4.1. The Current Status of Natural Gas Use in Transportation
There are three basic ways for natural gas to replace oil for transportation use. First,
natural gas can be converted to liquid fuels, such as methanol, ethanol, and diesel, through a gas-
to-liquids (GTL) process, from which the liquid outputs can be burned in internal combustion
engines with slight modifications. Second, CNG can be burned in light- and medium-duty
natural gas vehicles (NGVs) or dual-fuel vehicles, which can run on either CNG or gasoline.
13 Conversion rate: 1 Mcf natural gas = 1.027 mmBtu; 1 Quad = 293 TWh. Inflation rate for 2010: 1.6%. 14 “Currently, on a Federal level, [compressed natural gas] is taxed at the same rate as gasoline on an energy-
equivalent basis ($0.18 per gasoline gallon equivalent, or 0.21 per diesel gallon equivalent), while [liquefied natural
gas] is taxed at a higher effective rate than diesel fuel” (EIA 2012a, p. 38).
Resources for the Future Krupnick, Wang, and Wang
20
Third, natural gas can be cooled and condensed into liquefied natural gas (LNG) that can then be
used as a replacement for diesel, for use in heavy-duty trucks.
Figure 8. Ratio of Oil and Natural Gas Prices per Unit of Energy
Source: Knittel 2012.
Market Penetration of Natural Gas Vehicles
NGVs have been a part of global vehicle fleets for decades, with an estimated 14.8
million on the road worldwide.15
The United States currently ranks 17th globally in the number
of NGVs on the road, behind countries such as Iran, Pakistan, Argentina, Brazil, India, Italy, and
China.16
In the past, NGV penetration in the United States was limited for the most part to small
market niches: medium- to heavy-duty fleet vehicles, such as buses or trash trucks, and single-
unit delivery truck fleets, such as those from FedEx, UPS, AT&T (Taschler 2011), and others.
Although between 1999 and 2009, US domestic consumption of natural gas in the transportation
sector tripled (Bryce 2011), overall use in the transportation sector remains very small; in 2010,
natural gas powered less than 0.4 percent of the 9 million heavy-duty vehicles (HDVs) on the
15 Natural Gas Vehicles for America, http://www.ngvc.org/about_ngv/index.html 16 Ibid.
Resources for the Future Krupnick, Wang, and Wang
21
road and accounted for 0.3 percent of total energy use by HDVs (EIA 2012a). In 2009, about
114,000 CNG vehicles were on the road, including passenger vehicles, public transit buses, and
trucks, and about 3,000 LNG vehicles, most of which are heavy-duty trucks (Center for Climate
and Energy Solutions [C2ES] 2012). Apart from the dedicated NGVs that run only on natural
gas, the market offers bi-fuel vehicles, which have two separate fueling systems, enabling them
to run on either natural gas or gasoline, and dual-fuels vehicles with fuel systems that run on
natural gas and use diesel fuel for ignition assistance.17
Public transit buses are the largest natural gas consumers in the transportation sector, with
about 20 percent of buses running on natural gas (C2ES 2012). Various public school districts
have also converted their fleets to run on natural gas. For example, after taking part in a pilot
alternative fuel vehicles project in the late 1980s, Tulsa Public School District in Tulsa,
Oklahoma, now has a fleet of 190 CNG vehicles. In 2005, the Tucson Unified School District in
Arizona purchased 70 new CNG buses. The Union of Concerned Scientists reports that 130
school districts in 17 states currently use alternative fuel buses, a large number of which run on
natural gas (Union of Concerned Scientists 2004).
Considering light-duty vehicle (LDV) manufacturers, Honda plans to significantly
expand the availability of its natural gas-fueled Civic from five to over three dozen states, a
Hong Kong–based company plans to build CNG/gasoline/electric hybrids in the United States,
and Chrysler is gearing up to produce natural gas–fueled LDVs. As for truck engines,
competition with industry leader Westport is growing from companies such as Emission
Solutions, Inc. (ESI).18
An absence of refueling infrastructure remains a significant impediment to broader
penetration of NGVs in the United States, particularly outside of fleets that refuel in central
locations. Trucks and buses often travel predictable routes and are stored in common areas,
meaning that the infrastructure for a CNG fleet can be concentrated in certain specified areas, so
long as they are near gas pipelines, whereas the widespread use of CNG in passenger cars would
require a much more extensive and costly refueling infrastructure (Alternative Fuels and
Advanced Vehicles Data Center [AFDC] 2011). As of May 2012, 1,047 CNG fueling stations
17 Natural Gas Vehicles for America, http://www.ngvc.org/about_ngv/index.html 18 ESI has recently developed the natural gas–fueled Phoenix 7.6L, a 300-horsepower rework of the heavy-duty
Navistar MaxxforceDT diesel engine. Currently, ESI has plans to begin sales of the 375-horsepower Phoenix 9.3L,
project development on the T444E 7.3L, and research and development on a 475-horsepower Phoenix 13L in the
third quarter of 2011 (Turner 2010).

Resources for the Future Krupnick, Wang, and Wang
22
and 53 LNG fueling stations were in the United States, compared to 157,000 gasoline fueling
stations nationwide in 2010. According to EIA (2012a), 53 percent of the CNG stations and 57
percent of the LNG stations are privately owned and not open to the public, and many of the
public and private stations are concentrated in a few states like California. Accordingly, access to
refueling infrastructure remains an obstacle in most parts of the United States. Part of the
infrastructure challenge is the “chicken-and-egg” problem: vehicle users will not buy NGVs until
they believe there are enough refueling stations, but motivation to build an NGV refueling
infrastructure will be limited until a sufficient number of vehicle owners demand the fuel. Both
the private and public sectors are working to address this issue, however, as described briefly
below.
Gas-to-Liquids
Through GTL technology, natural gas can be converted into diesel and gasoline, which
can then be burned in traditional internal combustion engines. The conversion rate of current
technology needs around 10 Mcf of natural gas as input for a barrel of oil-equivalent product.
Assuming a $4/mcf gas price, this translates into a cost of $40/barrel oil-equivalent (C2ES 2012).
However, the high up-front capital cost of about $10 billion for a 100,000-bbl/day plant
(Lipschultz 2012) remains a major issue for GTL projects. The use of GTL fuel in transportation
remains limited since only a handful of GTL plants are operating commercially in Malaysia,
South Africa, and Qatar today, and these plants are producing less than 1 percent of global diesel
demand. Nonetheless, the increasing availability of cheap gas has driven Sasol (a South African
company) to announce plans to build the first GTL plant in the United States in Louisiana with a
total investment of $14 billion (Broder and Krauss 2012); this plant is expected to come online in
2017 and to be fully operational in 2018. Shell also has a proposed GTL plant expected to come
online in 2019. These proposed projects may add a total of 17 Tcf of gas consumption in the
period 2018–2035 (Lipschultz 2012), the products of which are expected to partly replace the use
of petroleum-based diesel fuel in the future.
Natural gas can also be converted into methanol or ethanol, which can be combined with
gasoline in various fractions to create an alternative fuel. Common blends include E85 (85
percent ethanol, 15 percent gasoline) and M85 (85 percent methanol, 15 percent gasoline); these
blends are currently usable by the 10 million flexible fuel vehicles on the road in the United
States. Conversion kits are also available to allow standard internal combustion engine vehicles
to run optimally on these blends.
Resources for the Future Krupnick, Wang, and Wang
23
Forthcoming research (Fraas et al. 2013) indicates that, even incorporating the cost of a
conversion kit, the wider use of E85 in passenger vehicles may make strong economic sense,
given current fuel price differentials. This is based on estimates of the cost of producing ethanol
(and eventually E85) from natural gas, using Celanese Corporation’s “TCX” process. As more
details become available about the costs of this process, the use of blended fuels may very well
look increasingly promising to consumers.
Federal and State Efforts
The federal government has been trying to stimulate the use of natural gas in
transportation through a series of subsidy programs. The Energy Tax Policy Act of 2005 (PL
109–58) provided an income tax credit for the purchase of a new, dedicated alternative fuel
vehicle of up to 50 percent of the incremental cost of the vehicle, plus an additional 30 percent if
the vehicle met certain tighter emission standards. These credits ranged from $2,500 to $32,000
depending on the size of the vehicle. However, the credit was effective only on purchases made
after December 31, 2005, and expired on December 31, 2010.19
In August 2009, the US
Department of Energy (DOE) announced that funding for natural gas technologies and fueling
stations would be included in a $300 million grant under the American Recovery and
Reinvestment Act for state and local governments (PL 111–5). A more recent legislative effort
was the House of Representatives 1380 bill, the New Alternative Transportation to Give
Americans Solutions (NAT GAS) Act in 2011.20
This proposed legislation offers tax credits for
new NGVs at the retail and manufacturing ends, commercial and residential refueling
infrastructure, and the gas itself.21
However, the NAT GAS Act was rejected by the Senate in
March 2012.
19 PL 109–58 also provided for a tax credit of 50¢ per gasoline gallon equivalent of CNG or liquid gallon of LNG
for the sale of CNG and LNG for use as a motor vehicle fuel. The credit began on October 1, 2006, and has recently
expired. Note that this rebate (which is over twice the excise tax rate paid now), was to the seller, not the buyer. It is
not clear if this could have been paid to the ultimate seller—in which case an owner of a trucking company could
have qualified for the rebate—or to the wholesaler.
20 Available at http://www.govtrack.us/congress/bill.xpd?bill=h112-1380. 21 Specifically, the NAT GAS Act offers (1) a tax credit for new NGV purchases, up to 80% of the price differential,
which translates to a maximum of $7,500 for LDVs and $64,000 for HDVs; (2) an infrastructure tax credit of 50%
of the cost of a new station, up to a maximum of $100,000; (3) an extension of the 50¢ per gallon fuel tax credit; (4)
a $2,000 tax credit to home refueling units; and (5) a tax credit to NGV manufacturers. This bill currently has
bipartisan support and has been referred to the House Energy and Commerce Committee (Gray 2011).

Resources for the Future Krupnick, Wang, and Wang
24
At the federal level, in August 2011, EPA and the US Department of Transportation’s
(DOT’s) National Highway Traffic Safety Administration adopted the first-ever program to
reduce GHG emissions and improve fuel efficiency of medium-duty vehicles and HDVs, where
NGVs and other alternative fuel vehicles were credited based on their GHG emission reduction
potentials (EPA and DOT 2011). In March 2012, President Obama announced a new $1 billion
National Community Deployment Challenge to “spur deployment of clean, advanced vehicles in
communities around the country (White House 2012, p.1).” This “fuel-neutral” proposal includes
electrification, natural gas, and other alternative fuels. The program also seeks to develop up to
five regional LNG corridors to increase NGV deployment (White House 2012).
States and localities have also intervened. Due in part to air quality management district
regulations, 65 percent of all South Coast Air Basin transit buses are now fueled by natural gas.
The San Pedro Bay Clean Air Action Plan, approved in late 2006, includes a program to replace
all diesel trucks based in the ports of Los Angeles and Long Beach with clean alternatives, such
as LNG-fueled vehicles (including LNG-fueled 18-wheelers), within five years (Port of Los
Angeles and Port of Long Beach 2011). Currently, 879 natural gas–fueled trucks are in the
Drayage Truck Registry, which represents 7 percent of container trips in San Pedro Bay (CAAP
2011). Pennsylvania, a state with significant shale gas reserves, introduced a package of
legislation aimed at providing $47.5 million in tax incentives, grants, and loans to promote
investment in natural gas truck and bus fleets for municipalities and businesses.22
Regional efforts are also in place to address the chicken-and-egg problem by
incentivizing or providing refueling infrastructure. Utah has been promoting the use of NGVs,
including private automobiles, by working with a local gas utility to build the fueling
infrastructure. Trailing only California and New York, Utah currently is one of the top states in
terms of the number of CNG refueling stations, with 73 (AFDC 2011). In Colorado, the city of
Grand Junction opened its first CNG refueling station in April 2011, completing a chain of CNG
stations from California to Denver (Cianca 2011). Texas is building refueling stations between
Dallas, San Antonio, and Houston under the Texas Clean Transportation Triangle strategic plan.
Similar efforts are also under way in the western coast area (the Interstate Clean Transportation
Corridor) and Pennsylvania (the Pennsylvania Clean Transportation Corridor) (EIA 2012a).
22 The Marcellus Shale Coalition, a natural gas trade group in Pennsylvania, released a study in April 2011 to
spearhead a campaign for 17 new refueling stations statewide and subsidies for a proposed 850 new natural gas
HDVs for an estimated $208 million (Gladstein, Neandross & Associates 2011).
Resources for the Future Krupnick, Wang, and Wang
25
Private Efforts
Private corporations are playing an important role in promoting natural gas use for
transportation, without government subsidies. The most important example is an effort
spearheaded by Chesapeake Energy’s $150 million commitment, collaborating with GE, Clean
Fuels, and Pilot Flying J truck stops to develop 150 CNG and LNG refueling stations on Pilot
Flying J footprints on US interstates (150 stations in all). GE will provide modular and
standardized CNG compression stations, called “CNG In A BoxTM
.”23,24
Private–public efforts to
reduce the cost of home CNG refueling stations from their current cost of $4,000 are also
ongoing (Lipschultz 2012).
4.2. The Current Economics of NGVs versus Gasoline- or Diesel-Fueled Vehicles
The future role of natural gas in the US transportation fuel mix depends on the
attractiveness of NGVs, compared to their alternatives, to consumers and policymakers. In this
section, we investigate the evidence for and against NGVs as a reasonable option to their closest
alternatives in the United States, focusing primarily on (1) LDVs running on CNG compared to
conventional gasoline vehicles and electric hybrids and (2) heavy-duty trucks running on LNG
compared to diesel trucks. Many of the comparisons are based on several original analyses, using
data from the NEMS–RFF model, automobile manufacturers, and other key sources.
The results suggest that, under reasonable conditions, LNG heavy-duty trucks have
attractive payback periods even without government subsidies. Infrastructure issues may be less
challenging than commonly thought because the interstate trucking industry is moving
increasingly from a long-haul route structure to a “hub and spoke” structure—a development that
could facilitate more judicious placement of LNG refueling stations and therefore make use of
LNG trucks more prevalent (Taylor et al. 2006).25
Furthermore, as noted above, efforts by Shell
Oil and Chesapeake Energy to build LNG refueling infrastructure represent a very positive and
subsidy-free development. CNG as a fuel for LDVs remains a tough sell without policies in place
that price carbon or otherwise favor natural gas over oil.
23 “GE and Chesapeake Energy Initiative Targets Natural Gas Fueling Infrastructure Development”, NGV Global
News, http://www.ngvglobal.com/ge-and-chesapeake-energy-initiative-targets-natural-gas-fueling-infrastructure-
development-0309 24 Chesapeake Energy Corporation, “Transform US Transportation Fuels Market and Increase Demand for US
Natural Gas”, http://www.chk.com/About/BusinessStrategy/Pages/Increase-Demand.aspx 25 See http://scm.ncsu.edu/public/lessons/less031014.html for a discussion of this system for major retailers in the
United States.
Resources for the Future Krupnick, Wang, and Wang
26
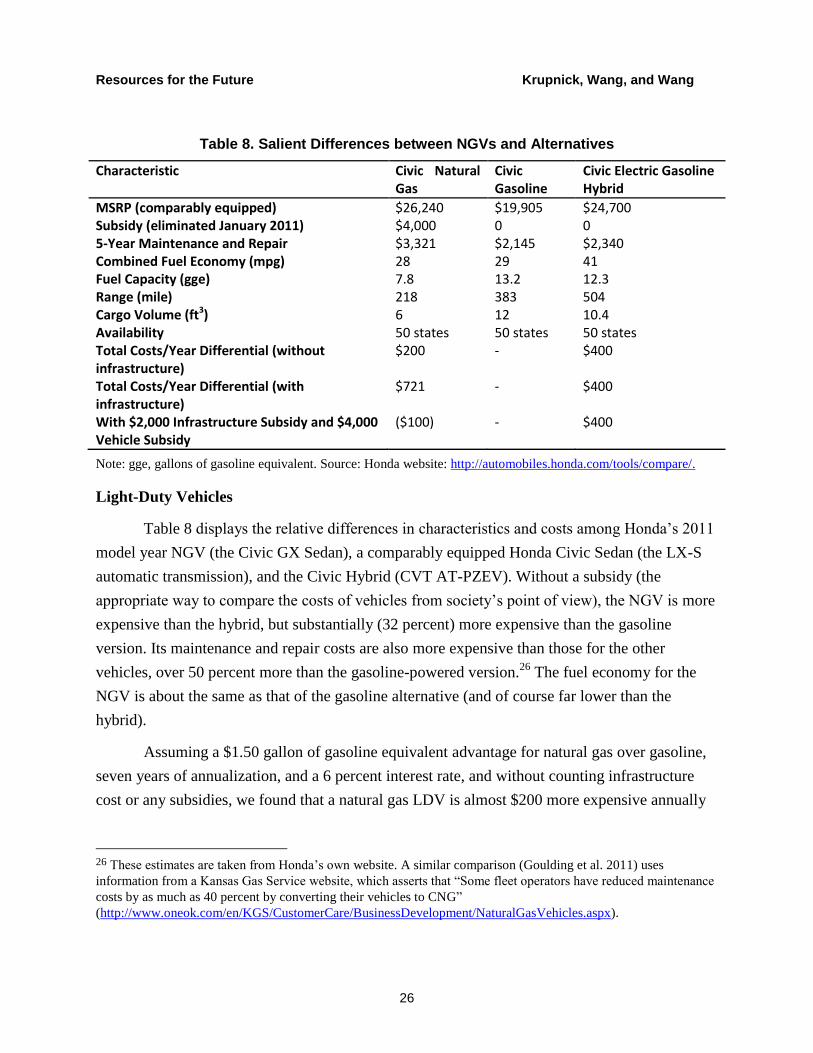
Table 8. Salient Differences between NGVs and Alternatives
Characteristic Civic Natural Gas
Civic Gasoline
Civic Electric Gasoline Hybrid
MSRP (comparably equipped) $26,240 $19,905 $24,700 Subsidy (eliminated January 2011) $4,000 0 0 5-Year Maintenance and Repair $3,321 $2,145 $2,340 Combined Fuel Economy (mpg) 28 29 41 Fuel Capacity (gge) 7.8 13.2 12.3 Range (mile) 218 383 504 Cargo Volume (ft3) 6 12 10.4 Availability 50 states 50 states 50 states Total Costs/Year Differential (without infrastructure)
$200 - $400
Total Costs/Year Differential (with infrastructure)
$721 - $400
With $2,000 Infrastructure Subsidy and $4,000 Vehicle Subsidy
($100) - $400
Note: gge, gallons of gasoline equivalent. Source: Honda website: http://automobiles.honda.com/tools/compare/.
Light-Duty Vehicles
Table 8 displays the relative differences in characteristics and costs among Honda’s 2011
model year NGV (the Civic GX Sedan), a comparably equipped Honda Civic Sedan (the LX-S
automatic transmission), and the Civic Hybrid (CVT AT-PZEV). Without a subsidy (the
appropriate way to compare the costs of vehicles from society’s point of view), the NGV is more
expensive than the hybrid, but substantially (32 percent) more expensive than the gasoline
version. Its maintenance and repair costs are also more expensive than those for the other
vehicles, over 50 percent more than the gasoline-powered version.26
The fuel economy for the
NGV is about the same as that of the gasoline alternative (and of course far lower than the
hybrid).
Assuming a $1.50 gallon of gasoline equivalent advantage for natural gas over gasoline,
seven years of annualization, and a 6 percent interest rate, and without counting infrastructure
cost or any subsidies, we found that a natural gas LDV is almost $200 more expensive annually
26 These estimates are taken from Honda’s own website. A similar comparison (Goulding et al. 2011) uses
information from a Kansas Gas Service website, which asserts that “Some fleet operators have reduced maintenance
costs by as much as 40 percent by converting their vehicles to CNG”
(http://www.oneok.com/en/KGS/CustomerCare/BusinessDevelopment/NaturalGasVehicles.aspx).
Resources for the Future Krupnick, Wang, and Wang
27
than its gasoline-fueled counterpart. Infrastructure costs for the NGVs must be considered,
however, under the assumption that individuals will not purchase such vehicles unless they have
access to a home fueling unit and already have natural gas in their homes. These units cost
$4,000 currently. We assume they last 10 years and amortize their costs at the same 6 percent
interest rate.27
Adding this annual amount to the annual cost of an NGV raises its cost premium
over a gasoline-fueled counterpart from $200 to $721.
From an individual’s perspective, we need to consider the $4,000 subsidy for the
investment cost (which ran out at the end of 2010, but may be reinstated by federal legislation
currently under consideration), the $2,000 subsidy for home charging stations, and the annual
cost of the loan (which we assume is for a five-year period). After these adjustments, amortized
costs are about $100 less than a gasoline vehicle. As noted above, however, NGVs have much
lower range, less trunk space, and, in almost all US locations, could not reliably be used for long-
distance travel because home refueling would be impossible. It remains to be seen if these
restrictions are worth more to consumers than $100 per year.
Heavy-Duty Trucks
The 2011 national average retail price of diesel fuel was $3.84/gallon, and the average
nationwide nominal retail price was $3.05 per diesel gallon equivalent (dge) for LNG and
$2.32/dge for CNG, which indicates a price differential of about $0.80/dge for diesel-fueled
HDVs (EIA 2012a).28
In California, where truckers can fill up with LNG at several stations,
LNG is $0.75 per diesel gallon equivalent cheaper than diesel for an independent trucker and
$1/gallon cheaper for a fleet vehicle.29
Indeed, when oil prices were at their highest in 2008 and
diesel was $4.75/gallon, LNG was $2/gallon cheaper than diesel, even though natural gas was
priced relatively high at $11–$13/mcf of gas (EIA 2008).
27 Honda Corporation also notes (personal communication) that high water content in the natural gas and low
compression by home refueling units raises risks of fuel fouling in CNG engines.
28 Irrespective of these price differentials, it is appropriate to consider any tax benefits for natural
gas over diesel. Currently, no such benefits are available. Until the end of 2009, LNG sellers
were eligible for a credit of 50¢/gallon from the federal government (and some state programs
provide per-gallon credits against excise taxes). It is likely that some of these benefits would
have been passed on in lower fuel prices. 29 Interview with Mitchell Pratt, Clean Energy Inc., November 17, 2009.

Resources for the Future Krupnick, Wang, and Wang
28
Table 9 gives the major assumptions used in our analysis while comparing natural gas–
powered heavy-duty trucks with their diesel-powered counterparts. According to estimates
available online and provided in conversations with experts, the differential ranges from $70,000
to $100,000 (for early models) more than the price of a diesel truck of about $100,000.30
Detailed information on vehicle prices puts the cost differential at $70,000 for a Westport
compression-type LNG engine, with a newer technology relying on an 85 percent LNG/15
percent diesel fuel mix, selling for only $35,000–$40,000 above its diesel counterpart.31
The
price differential for a smaller version of the Class 8 truck (termed a “Baby 8”) or a Class 7 truck
(both using spark plug technology) is around $40,000.
Table 9. Assumptions for Comparing Natural Gas Heavy-Duty Trucks with Diesel Trucks
Price Differential between LNG and Diesel
$0.50/dge, $1.00/dge, and $1.50/dge
Investment Cost Differential $35,000, $70,000, and $100,000
Fuel Economy Diesel (Class 8): 5.1 mpg (2007)32; LNG: 4.6 DEG to 5.6 DEG33
Vehicle Miles Traveled 70,000 miles/year34 to 125,000 miles/year35
Vehicle Lifetime 15 years36
Interest Rate 31%37, 10%, 5%38
Note: dge: diesel gallon equivalent.
30 Total Transportation Services recently purchased 22 additional Kenworth T800 LNG trucks to expand its fleet of
8 such trucks purchased six months before. This purchase suggests that fuel and maintenance costs are manageable
(Kell-Holland 2009). 31 Interview with Michael Gallagher, Cummins Westport, November 2009. 32 FHWA (2008). This estimate was recently revised upwards to 6.0 mpg (FHWA 2009). 33 Interview with Mitchell Pratt, Clean Energy Inc., November 17, 2009. 34 FHWA (2008). 35 This is based on census data from 2002, which feature average vehicle miles traveled of about 90,000 miles per
year and indicate that about one-third of the fleet drives 125,000 miles or more. 36 According to DOT, new combination trucks (Class 8) were purchased in 2007, with registrations in 2007 of 2.221
million combination trucks. Thus, new vehicles are 6.8% of the fleet. Assuming this is an equilibrium situation,
where truck retirements and purchases are equal, truck life averages 14.7 years. Industry analysts offer 18–20 years
as a realistic average for truck life (FHWA 2008). 37 This rate derives from actual market data showing that buyers demand a payback of investment costs through fuel
savings within three to four years and that fuel savings during those first few years are discounted at 10%.
38 Social discount rates used to evaluate public projects are often in the range of 3% to 5%. Although the
substitution of NGVs for diesel vehicles is not a public project, it can confer major public benefits in terms of
emissions reductions and energy security. Thus, we make calculations with this rate to illustrate the efficiency of
LNG truck subsidies or mandates from society’s perspective, assuming complete market failure. An interest rate of
10% is added to reflect partial market failure.
Resources for the Future Krupnick, Wang, and Wang
29
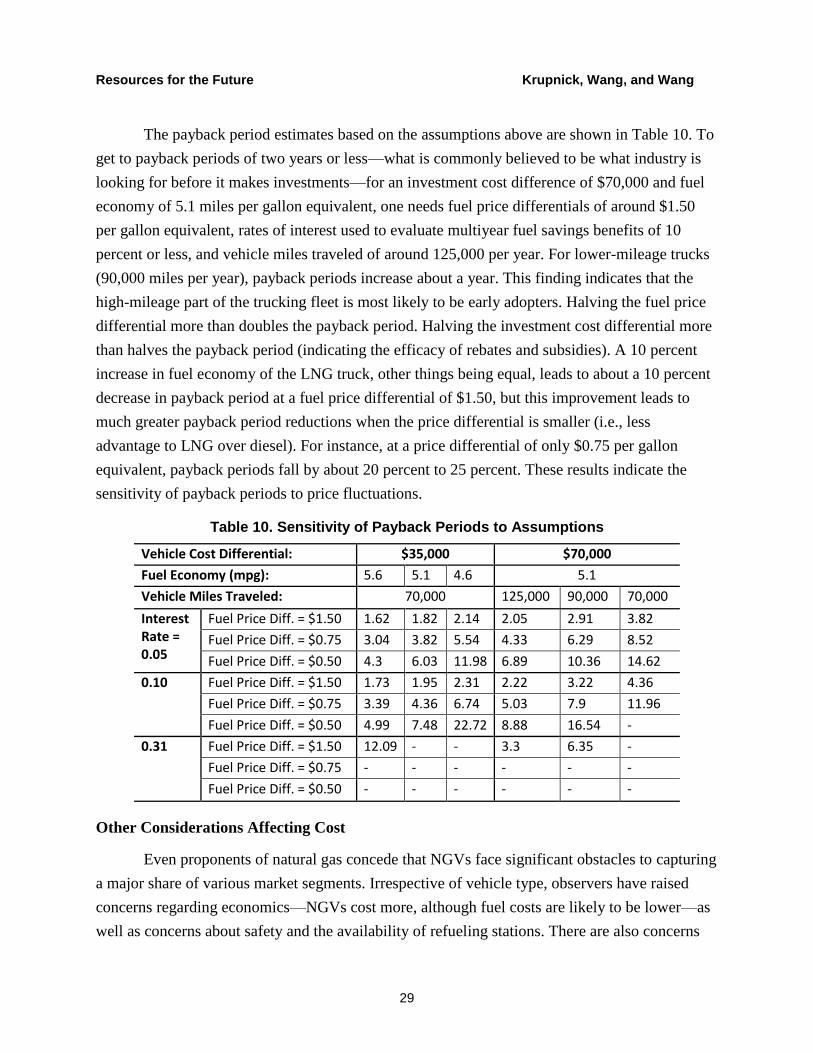
The payback period estimates based on the assumptions above are shown in Table 10. To
get to payback periods of two years or less—what is commonly believed to be what industry is
looking for before it makes investments—for an investment cost difference of $70,000 and fuel
economy of 5.1 miles per gallon equivalent, one needs fuel price differentials of around $1.50
per gallon equivalent, rates of interest used to evaluate multiyear fuel savings benefits of 10
percent or less, and vehicle miles traveled of around 125,000 per year. For lower-mileage trucks
(90,000 miles per year), payback periods increase about a year. This finding indicates that the
high-mileage part of the trucking fleet is most likely to be early adopters. Halving the fuel price
differential more than doubles the payback period. Halving the investment cost differential more
than halves the payback period (indicating the efficacy of rebates and subsidies). A 10 percent
increase in fuel economy of the LNG truck, other things being equal, leads to about a 10 percent
decrease in payback period at a fuel price differential of $1.50, but this improvement leads to
much greater payback period reductions when the price differential is smaller (i.e., less
advantage to LNG over diesel). For instance, at a price differential of only $0.75 per gallon
equivalent, payback periods fall by about 20 percent to 25 percent. These results indicate the
sensitivity of payback periods to price fluctuations.
Table 10. Sensitivity of Payback Periods to Assumptions
Vehicle Cost Differential: $35,000 $70,000
Fuel Economy (mpg): 5.6 5.1 4.6 5.1
Vehicle Miles Traveled: 70,000 125,000 90,000 70,000
Interest Rate = 0.05
Fuel Price Diff. = $1.50 1.62 1.82 2.14 2.05 2.91 3.82
Fuel Price Diff. = $0.75 3.04 3.82 5.54 4.33 6.29 8.52
Fuel Price Diff. = $0.50 4.3 6.03 11.98 6.89 10.36 14.62
0.10 Fuel Price Diff. = $1.50 1.73 1.95 2.31 2.22 3.22 4.36
Fuel Price Diff. = $0.75 3.39 4.36 6.74 5.03 7.9 11.96
Fuel Price Diff. = $0.50 4.99 7.48 22.72 8.88 16.54 -
0.31 Fuel Price Diff. = $1.50 12.09 - - 3.3 6.35 -
Fuel Price Diff. = $0.75 - - - - - -
Fuel Price Diff. = $0.50 - - - - - -
Other Considerations Affecting Cost
Even proponents of natural gas concede that NGVs face significant obstacles to capturing
a major share of various market segments. Irrespective of vehicle type, observers have raised
concerns regarding economics—NGVs cost more, although fuel costs are likely to be lower—as
well as concerns about safety and the availability of refueling stations. There are also concerns

Resources for the Future Krupnick, Wang, and Wang
30
about resale markets, which are an important part of the trucking industry and, if fueled by
natural gas, require a denser refueling network than is likely to arise in the near term. In addition,
for LDVs, cruising range, weight, and cabin space are subjects of concern. Because CNG has
such a low energy density and is under pressure, fuel tanks are large and heavy compared to the
other vehicle types (Table 8). Thus, cargo space is dramatically (50 percent) lower than that of a
gasoline vehicle, as is its range of only 218 miles, compared to 383 miles for the comparable
gasoline vehicle and 504 miles for the hybrid.
Notably, the estimates above do not directly account for safety and infrastructure costs.
There are arguments on both sides of the safety issue: proponents, for example, suggest that the
need to contain high pressures and keep temperatures low requires extremely robust tanks and
other equipment that may make natural gas trucks safer in an accident than their diesel
counterparts. Opponents refer to concerns about LNG storage facilities and their explosive
potential. An independent review of safety concerns (Hesterberg et al. 2009, p. 20) finds that
diesel buses have a “significant fire and safety advantage over CNG vehicles [buses].” Whether
these conclusions would hold for LNG versus diesel trucks is unclear. A government source39
focusing on CNG versus LNG concludes that the latter is less corrosive but cannot take an
odorant, so leaks could go undetected longer, requiring methane detectors. With respect to LNG,
the very cold temperatures required for storage mean that the storage systems require intensive
monitoring for tank pressure and systems to vent the gas in an emergency. While the report
indicates that rupturing of the tanks is extremely unlikely, it also says that any resulting fire will
release 60 percent more heat than from an “equivalent” gasoline tank rupture. Refueling NGVs
also requires additional precautions, and the rapid change in temperature from refueling can
stress vehicle materials and components. The industry’s response to these points is basically that
the fuel is safe if the proper procedures are followed.
In addition, even if the trucking industry had adequate refueling infrastructure for long-
haul trucking, economic issues concerning lack of infrastructure appropriate to the truck resale
market may remain. Trucks are sometimes taken out of the commercial trucking business and
resold for use on farms and within cities after six to eight years of use. Without adequate
infrastructure in rural and urban areas, this market could fail, effectively limiting the useful life
of these trucks, both from a private and a social perspective.
39 See http://www.chebeague.org/fairwinds/risks.html, which is an excerpt from a report produced by the Federal
Transit Administration’s Clean Air Program, Section 3.3.4 Liquefied Natural Gas.

Resources for the Future Krupnick, Wang, and Wang
31
4.3. Future Projections of NGV Penetration
Looking ahead, expected future new vehicle cost differentials may be lower. First, NGVs
have not yet benefited from economies of scale as gasoline and diesel vehicles have, so costs
might decrease significantly if demand for NGVs increases. Second, stricter standards on diesel
emissions, which took effect in 2010, may raise prices on diesel vehicles. Furthermore, future
costs are highly uncertain. Natural gas engine technologies are less mature than diesel and
gasoline technologies, and it is uncertain which particular natural gas engine types will be most
successful in the future.
For several reasons, the recent fuel price gap could remain or widen in the future. Greater
accessibility and technological advances in recovering shale gas could keep prices of LNG stable
or even drive them lower, while prices for oil and, therefore, diesel fuel are believed to be on an
upward trend. A recent presentation by IHS Global Insight (2010) shows that, over the long term,
the ratio of oil to gas prices may rise to about three to one between now and 2030. However,
natural gas prices have a history of instability, and CNG has, at times, been more expensive per
gallon equivalent than its diesel counterpart.
Table 11. Major Projections under Two Heavy-Duty NGV Cases in AEO 2012
2010 HDV Reference Case (2035)
Heavy-Duty NGV Potential Case (2035)
Sales of New Heavy-Duty NGVs 860 (0.2%)
26,000 (3%) 275,000 (34%)
Market Share of Heavy-Duty NGVs 0.4% 2.4% 21.8% Natural Gas Demand in the HDV Sector
0.01 Tcf 0.1 Tcf 1.8 Tcf
Share of Natural Gas in Total Energy Use by HDVs
0.2% 1.6% 32%
Source: EIA 2012a.
In the AEO 2012, EIA runs a side case known as the Heavy-Duty NGV Potential case, in
which natural gas refueling infrastructure is expanded (simply by assumption) and a gradual
increase is allowed in the share of HDV owners “who would consider purchasing an NGV if
justified by the fuel economics over a payback distribution with a weighted average of 3 years”
(EIA 2012a, p. 39). In addition, an HDV Reference case was developed from the AEO 2012
Reference case, assuming that Class 3–6 vehicles use CNG and Class 7 and 8 vehicles use LNG.
Table 11 summarizes the projected sales, market penetrations, and natural gas consumptions in
the HDV sector in these two different scenarios in 2035. The wide gap between these two cases
reflects a great uncertainty over the future prospect of NGVs. The higher consumption of natural
Resources for the Future Krupnick, Wang, and Wang
32
gas in the Heavy-Duty NGV Potential case slightly pushes natural gas prices up, which results in
lower gas consumption in other end-use sectors. The overall impact brings about a 5 percent
higher total US natural gas consumption compared with the Reference case (EIA 2012a). In the
AEO 2013 Early Release, the improved economics of LNG for HDVs, due to a lower natural gas
price projection, results in an increase in natural gas use in the HDV sector compared to the
projection in AEO 2012. Natural gas use in vehicles is predicted to reach 1.7 Tcf by 2040,
including the GTL use, which is about the same level of projected consumption by 2035 in the
Heavy-Duty NGV Potential case in AEO 2012 (EIA 2013).
In summary, the economics of natural gas penetration into transportation suggests that
this fuel deserves more attention. Honda’s natural gas–fueled LDV needs investment and
infrastructure subsidies at the level being discussed in Congress to compare favorably to its
gasoline and hybrid counterparts. Under certain assumptions about fuel and vehicle price
differentials, fuel economy, and vehicle miles traveled (such as being driven 125,000 miles per
year), LNG-fueled heavy-duty trucks can return their added investment in two years, but
generally, payback periods would be much longer. Additionally, this somewhat optimistic
assessment does not directly account for infrastructure and safety costs.
Nonetheless, a variety of developments are in play to make NGVs economical even
without subsidies on the fuel or the vehicles. First, natural gas prices are projected to remain
relatively low given vast new amounts of shale gas becoming available, even if demand
increases greatly. Second, technological changes for NGVs are likely to be more rapid than those
for conventionally fueled vehicles because the latter are more mature technologies. Third, if
demand for NGVs does increase, economies of scale could further reduce prices. Fourth, diesel
vehicles may become more cost disadvantaged in the future by a carbon policy combined with
increasingly stringent air pollution regulations and tighter restrictions on fuel economy of
gasoline and diesel vehicles. Fifth, technological advances in converting gas to liquids look
promising and have the potential to replace oil without requiring as much infrastructure
investment as CNG or LNG.
5. The Manufacturing/Industrial Sector
US manufacturing has been declining in recent decades, as a result of increased
international competition, recession, and a gradual shift toward the service industry. Such
changes in economic activities, together with improvement in energy efficiency, have led to a
reduction of 20 percent in natural gas consumption from the industrial sector during the past 15
years (Lipschultz 2012). However, the reduction in natural gas prices brought about by shale

Resources for the Future Krupnick, Wang, and Wang
33
development has stimulated a series of expansion announcements in manufacturing, especially in
gas-intensive industries like petrochemicals and fertilizers. Some big manufacturers are planning
to move their production plants back to the United States to take advantage of cheaper natural
gas. For example, Huntsman Corp., a chemical maker that used to spend 90 percent of its
discretionary growth capital outside of the United States, now is said to be spending 70 percent
within the United States because of cheap gas (Johnson and Tullo 2013). And the boom in
natural gas has also made the United States attractive to foreign investments, as evidenced by a
recently announced plan by German-based BASF to build a chemical plant in Louisiana.40
The manufacturing sector could benefit from abundant natural gas in several ways. First,
equipment manufacturers and construction material providers could experience a boost in
demand due to shale gas expansion. Second, companies in the petrochemical industry would
benefit from the cost reduction from cheaper raw materials and energy input, which will
subsequently pass on at least some of the cost advantage to downstream sectors (e.g., plastic and
rubber) through the value chain. Lastly, the growth in income, employment, and tax revenue
resulting from a manufacturing renaissance could stimulate the broader economy by increasing
demand in consumption and government spending.
The American Chemistry Council (2012) examined the potential economic benefits of
shale gas development among eight energy-intensive manufacturing industries in the United
States. The study, which was based on an economy-wide input–output model (the IMPLAN
model), assessed the economic gains at three levels: direct effect, indirect effect, and induced
effect.41
According to the study, the direct effects include $121.0 billion in additional industry
output and $72 billion in capital investment measured in 2010 constant US dollars over the
period 2015–2020, which is equivalent to a 7.3 percent gain above the reference output level.
The indirect effect (to supplier industries) was estimated to result in an additional $143.8 billion
growth in economic output. Such economic expansion will subsequently lead to increased
demand in other sectors of $76.8 billion induced economic gain through income and tax growth.
Table 12 provides estimates of direct industry output gains for each of the eight manufacturing
40 BASF, “Governor Jindal and BASF Dedicate Methylamines Plant in Geismar”, http://www.basf.com/group/corporate/en_GB/news-and-media-relations/news-releases/news-releases-usa/P-10-0109 41 Here, direct effects refer to the output and employment effects generated by the sector itself; indirect effects refer
to such effects supported by the sector via purchases from its supply chain; and induced effects refer to the
employment and output supported by the spending of those employed directly or indirectly by the sector (American
Chemistry Council 2012).
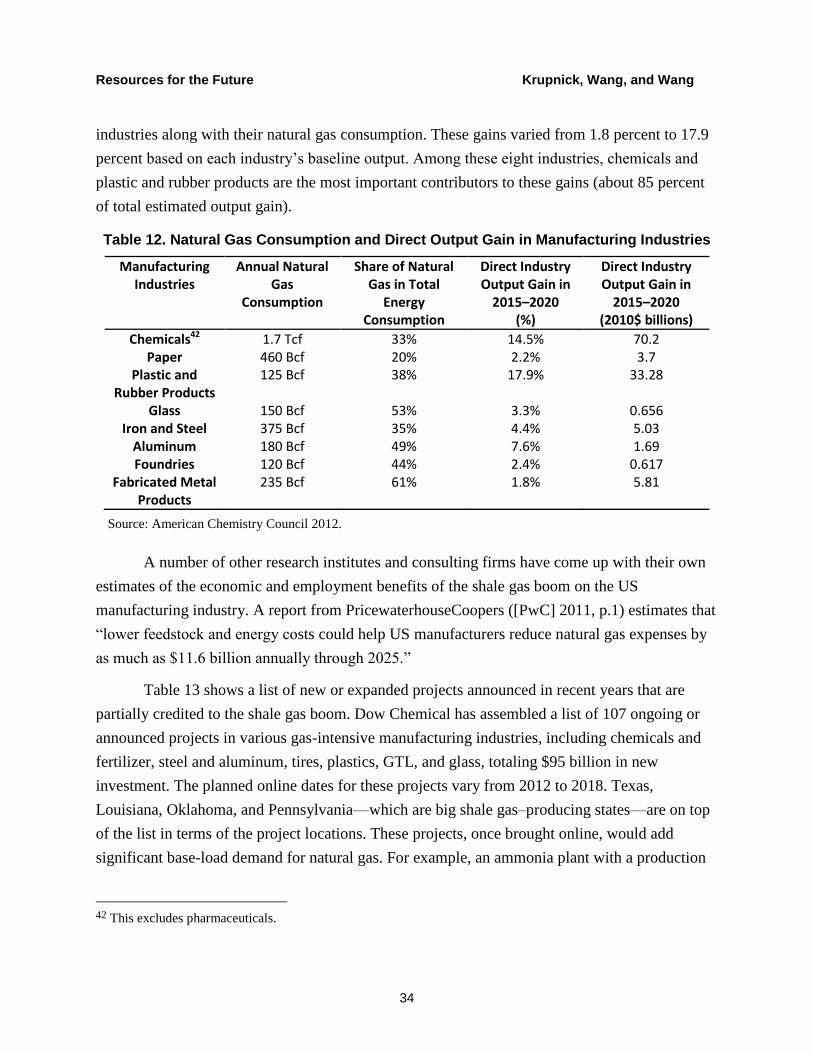
Resources for the Future Krupnick, Wang, and Wang
34
industries along with their natural gas consumption. These gains varied from 1.8 percent to 17.9
percent based on each industry’s baseline output. Among these eight industries, chemicals and
plastic and rubber products are the most important contributors to these gains (about 85 percent
of total estimated output gain).
Table 12. Natural Gas Consumption and Direct Output Gain in Manufacturing Industries
Manufacturing Industries
Annual Natural Gas
Consumption
Share of Natural Gas in Total
Energy Consumption
Direct Industry Output Gain in
2015–2020 (%)
Direct Industry Output Gain in
2015–2020 (2010$ billions)
Chemicals42 1.7 Tcf 33% 14.5% 70.2 Paper 460 Bcf 20% 2.2% 3.7
Plastic and Rubber Products
125 Bcf 38% 17.9% 33.28
Glass 150 Bcf 53% 3.3% 0.656 Iron and Steel 375 Bcf 35% 4.4% 5.03
Aluminum 180 Bcf 49% 7.6% 1.69 Foundries 120 Bcf 44% 2.4% 0.617
Fabricated Metal Products
235 Bcf 61% 1.8% 5.81
Source: American Chemistry Council 2012.
A number of other research institutes and consulting firms have come up with their own
estimates of the economic and employment benefits of the shale gas boom on the US
manufacturing industry. A report from PricewaterhouseCoopers ([PwC] 2011, p.1) estimates that
“lower feedstock and energy costs could help US manufacturers reduce natural gas expenses by
as much as $11.6 billion annually through 2025.”
Table 13 shows a list of new or expanded projects announced in recent years that are
partially credited to the shale gas boom. Dow Chemical has assembled a list of 107 ongoing or
announced projects in various gas-intensive manufacturing industries, including chemicals and
fertilizer, steel and aluminum, tires, plastics, GTL, and glass, totaling $95 billion in new
investment. The planned online dates for these projects vary from 2012 to 2018. Texas,
Louisiana, Oklahoma, and Pennsylvania—which are big shale gas–producing states—are on top
of the list in terms of the project locations. These projects, once brought online, would add
significant base-load demand for natural gas. For example, an ammonia plant with a production
42 This excludes pharmaceuticals.
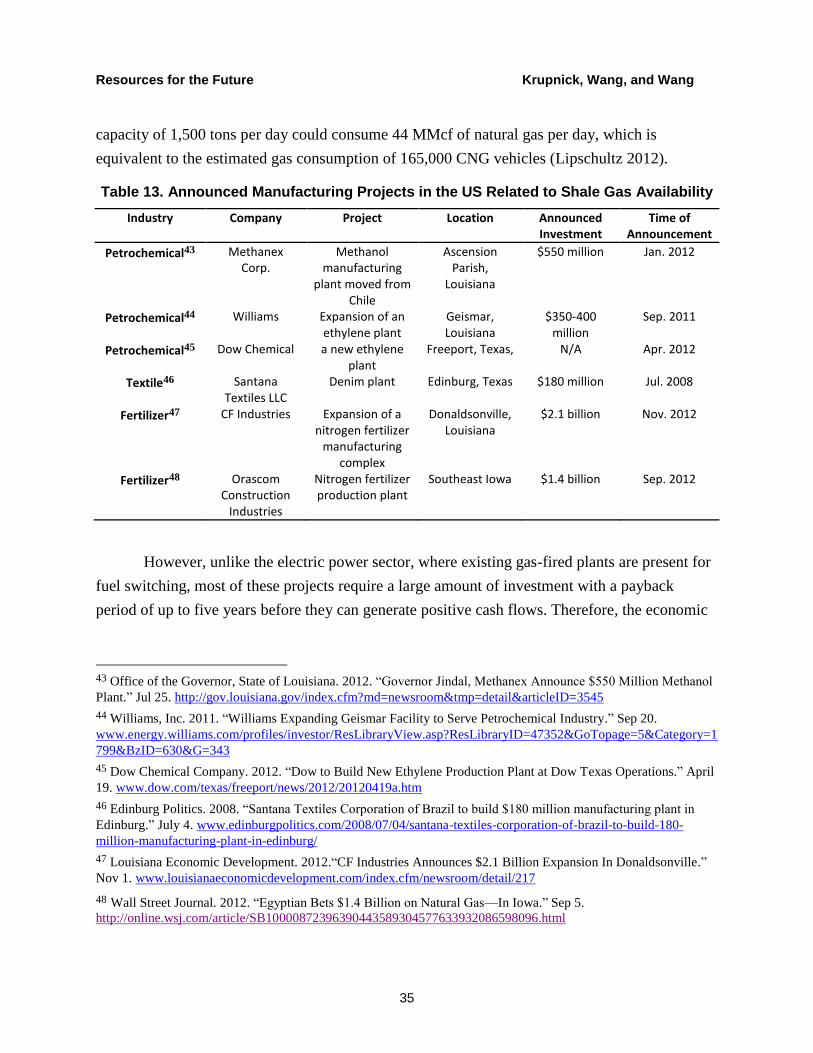
Resources for the Future Krupnick, Wang, and Wang
35
capacity of 1,500 tons per day could consume 44 MMcf of natural gas per day, which is
equivalent to the estimated gas consumption of 165,000 CNG vehicles (Lipschultz 2012).
Table 13. Announced Manufacturing Projects in the US Related to Shale Gas Availability
Industry Company Project Location Announced Investment
Time of Announcement
Petrochemical43 Methanex Corp.
Methanol manufacturing
plant moved from Chile
Ascension Parish,
Louisiana
$550 million Jan. 2012
Petrochemical44 Williams Expansion of an ethylene plant
Geismar, Louisiana
$350-400 million
Sep. 2011
Petrochemical45 Dow Chemical a new ethylene plant
Freeport, Texas, N/A Apr. 2012
Textile46 Santana Textiles LLC
Denim plant Edinburg, Texas $180 million Jul. 2008
Fertilizer47 CF Industries Expansion of a nitrogen fertilizer
manufacturing complex
Donaldsonville, Louisiana
$2.1 billion Nov. 2012
Fertilizer48 Orascom Construction
Industries
Nitrogen fertilizer production plant
Southeast Iowa $1.4 billion Sep. 2012
However, unlike the electric power sector, where existing gas-fired plants are present for
fuel switching, most of these projects require a large amount of investment with a payback
period of up to five years before they can generate positive cash flows. Therefore, the economic
43 Office of the Governor, State of Louisiana. 2012. “Governor Jindal, Methanex Announce $550 Million Methanol
Plant.” Jul 25. http://gov.louisiana.gov/index.cfm?md=newsroom&tmp=detail&articleID=3545
44 Williams, Inc. 2011. “Williams Expanding Geismar Facility to Serve Petrochemical Industry.” Sep 20.
www.energy.williams.com/profiles/investor/ResLibraryView.asp?ResLibraryID=47352&GoTopage=5&Category=1
799&BzID=630&G=343
45 Dow Chemical Company. 2012. “Dow to Build New Ethylene Production Plant at Dow Texas Operations.” April
19. www.dow.com/texas/freeport/news/2012/20120419a.htm
46 Edinburg Politics. 2008. “Santana Textiles Corporation of Brazil to build $180 million manufacturing plant in
Edinburg.” July 4. www.edinburgpolitics.com/2008/07/04/santana-textiles-corporation-of-brazil-to-build-180-
million-manufacturing-plant-in-edinburg/
47 Louisiana Economic Development. 2012.“CF Industries Announces $2.1 Billion Expansion In Donaldsonville.”
Nov 1. www.louisianaeconomicdevelopment.com/index.cfm/newsroom/detail/217
48 Wall Street Journal. 2012. “Egyptian Bets $1.4 Billion on Natural Gas—In Iowa.” Sep 5.
http://online.wsj.com/article/SB10000872396390443589304577633932086598096.html
Resources for the Future Krupnick, Wang, and Wang
36
benefits in manufacturing are more vulnerable to gas price volatility and to underlying concerns
about LNG exports boosting price.
Currently, discussions are ongoing over whether DOE should grant the licenses for LNG
to be exported to countries that lack a US free-trade agreement.49
Though several applications
are pending at DOE, only Cheniere Energy’s 2.2 Bcf/day Sabine Pass project, located in
Louisiana, has been approved. Manufacturers, especially those in the petrochemical industry, are
the most vocal opponents to LNG export with concerns about higher domestic gas prices. An
advocacy group, America’s Energy Advantage, was recently formed by four of the largest US
chemical firms (Celanese, Dow, Eastman Chemical, and Huntsman Corp.) to advance their
position (Johnson and Tullo 2013). Indeed, the chemical industry would face declines in profits
and revenues, but the loss was estimated to be manageable (NERA Economic Consulting 2012).
The costs from liquefaction and transportation to Japan and China could add up to about $5.50
per Tcf (Johnson and Tullo 2013). And landed LNG rates are typically linked to oil prices, with
an oil price of $100/bbl translating into a landed LNG rate of $12.00–$15.50/mmBtu (Lipschultz
2012), which would probably keep the US gas price well below the prices in gas-importing
countries.
The subsections below take a closer look at three industries where the impacts of cheap
gas availability are believed to be the most prominent: petrochemical, fertilizer, and steel
production.
5.1. Petrochemicals
The petrochemical industry is one of the largest natural gas consumers, where natural gas
and natural gas liquids (NGLs) are used as fuels and as feedstock. It is estimated that chemicals
and petroleum refining account for 46 percent of total industrial gas consumption (Lipschultz
2012). Important NGLs for the petrochemical industry include ethane, propane, and butane.
Ethane and propane are the primary feedstocks used in the United States to produce ethylene,
which is a key component in plastics and one of the world’s most common chemical building
blocks. An expansion in the production capacity of ethylene will probably boost production from
49 Only four free-trade agreement countries (South Korea, Australia, Mexico, and Canada) are big natural gas
consumers; of these, only South Korea is a major LNG importer. The world’s largest LNG importers, such as Japan,
China, and the U.K., are non-free-trade-agreement countries (Johnson and Tullo 2013).

Resources for the Future Krupnick, Wang, and Wang
37
a wide variety of manufacturing industries, such as electronics, clothing, and packaging,
therefore leading to far-reaching impacts on the entire manufacturing industry.
An American Chemistry Council (2011) study focusing on the petrochemical industry
indicates an investment of $16.2 billion to build new petrochemical and derivatives capacity
arising from the availability of cheap gas over several years; this is projected to increase US
ethane capacity by about 25 percent. Similarly, PwC (2012, p. 3) estimates that NGL production
is “expected to increase more than 40 percent over the next five years, reaching more than 3.1
MMBD [million barrels per day] in 2016,” and the US chemical industry investment of $15
billion will have increased its ethylene production capacity by 33 percent.
A number of petrochemical manufacturers, including Dow Chemical, Formosa Plastics,
Chevron Phillips Chemical, and Bayer Corp., have announced plans to build new plants or
expand existing capacity for ethane and ethylene production partly because of the availability of
shale gas feedstock (PwC 2011). Dow Chemical (2011, p. 11) stated that its “investments on the
US Gulf Coast will increase [its] US ethylene production capabilities by 20 percent over the next
three years.” An analysis based on economic cost models of petrochemical products shows that,
as the price of natural gas falls from $12.5/mmBtu to $3.00/mmBtu, the estimated price of
ethylene declines from $1,009/ton to $323/ton, with the prices of polyethylene and ethylene
glycol falling by a similar degree (PwC 2012). Such a cost reduction will give the US chemical
manufacturers a significant cost advantage over its international competitors.
In addition, petrochemical manufacturers are shifting from petroleum-based feedstocks to
their gas-based substitutes. The petrochemical producers who were using naphtha (a generic term
for a variety of petroleum refining products) as a feedstock for ethylene production, primarily
located in Europe and Asia, are shifting to ethane to reduce costs, which has caused the naphtha
prices to fall in the United States and international markets (Pirog and Ratner 2012). It is
expected that research and development efforts leveraging ethylene-based chemistries that
replace petroleum-based products will surge in coming years. Finally, a variety of downstream
manufacturing sectors will subsequently benefit from the availability of cheaper chemical raw
materials, which are used in an estimated 90 percent of all manufactured products and may
replace higher-cost materials such as metals, glass, and leather (PwC 2012).
5.2. Fertilizers
Natural gas is used to produce ammonia, which serves as the primary ingredient in most
nitrogen fertilizers and is an essential ingredient in many finished phosphate fertilizers; the cost

Resources for the Future Krupnick, Wang, and Wang
38
of ammonia corresponds to about 70 percent to 90 percent of the estimated production cost faced
by nitrogen-based fertilizer producers (Pirog and Ratner 2012). Although the United States is the
fourth-largest producer of ammonia in the world, US ammonia production capacity shrank by 40
percent during the 2000s, before the shale gas boom changed the situation.50
Many ammonia
plants were moved overseas or closed because of the increasing natural gas price for industrial
users. However, the emergence of large, low-cost shale gas resources has reversed the trend and
brought significant cost savings to the industry. With the high demand for fertilizers in the past
few years, the cost savings brought by cheap natural gas were mainly reaped by the producers
rather than the consumers (Pirog and Ratner 2012). CF Industries, a major manufacturer and
distributor of fertilizer products in the United States, reported a more than three-fold increase in
gross margin of its nitrogen segment from 2009 ($784 million) to 2011 ($2,563 million; CF
Industries 2012). Accordingly, new investment decisions to expand capacity by both domestic
and foreign producers have been announced recently. Nevertheless, this industry is cautious
because of its past suffering from gas price volatility (Pirog and Ratner 2012).
5.3. Steel Production
The benefit of expanded shale gas development for steel production comes from two
factors: the increase in product demand caused by higher demand for drilling equipment and the
decrease in operating costs due to cheaper natural gas. For example, US Steel (the largest US
steelmaker) saw a 17 percent increase in production of tubular goods used in oil and gas drilling
and transmission facilities in 2011 (Miller 2012). The increasing demand for drilling equipment,
together with the demand-driven increase in steel prices and downturn in costs, has increased the
company’s profits.
In addition, the steel industry can benefit directly from fuel switching, from coal to
natural gas, both by directly replacing coal with natural gas in manufacturing processes, and by
experiencing lower electricity prices made possible partly by the increased gas supply. For
example, Nucor and US Steel have both indicated interest in investing in the use of natural gas
for direct reduced iron production (PwC 2011)—a process that has traditionally used coal to
create the requisite “reducing gas.”
50 The Fertilizer Institute, “Natural Gas Access/ Supply,” http://www.tfi.org/issues/energy/natural-gas-accesssupply
Resources for the Future Krupnick, Wang, and Wang
39
However, the cost reduction from switching to natural gas from coal falls into the range
of $8–$10/ton, compared to the overall steel production cost of around $600/ton (Miller 2012;
Pirog and Ratner 2012). Therefore, the cost reduction effect is less important to the industry than
the upward shift in demand.
Looking into the future, as projected by EIA (2013, p. 1), “natural gas use (excluding
lease and plant fuel) in the industrial sector increases by 16 percent from 6.8 Tcf per year to 7.8
Tcf per year in 2025.” Industrial production from the bulk chemical industries and primary metal
industries are projected to grow 1.7 percent and 2.8 percent per year, respectively, from 2011 to
2025, partly powered by the increased production of natural gas and NGLs (EIA 2013). In the
AEO 2012 projections (EIA 2012a), industrial natural gas use grows by 8 percent in the period
2010–2035.
6. Possible Impact of a Potential Shale Gas Boom in China
In the United States, the drop in natural gas prices caused by the shale gas revolution has
resulted in big increases in the quantity of natural gas demanded by the power sector. In the
transportation and manufacturing sectors, the effects of low natural gas prices have so far been
felt mainly in the planning for future increases in natural gas use, through major investments in
refueling infrastructure in the transportation sector, and in chemical and other plants that use
natural gas as a feedstock. Investments into new transportation options using natural gas directly
or as a feedstock to liquid fuels are also beginning. Finally, and not discussed above, major
investments are being planned for natural gas export facilities. Shale gas has not caused much
change in natural gas use in the residential and commercial sectors. These sectors had expanded
years earlier to take advantage of the availability of natural gas in urban areas. Further growth in
this demand would require major new pipeline right-of-way acquisition and pipeline construction
to underserved urban areas as well as conversion of home and business use of (primarily) oil
(and propane) to natural gas. As most of the population using these fuels is rural, the economics
is quite unfavorable to further natural gas growth in the residential and commercial sectors.
In China, natural gas is used, priced, and managed so differently than in the United States
that one must be quite cautious in applying to China any lessons learned from the United States.
6.1. How Is Natural Gas Used in China?
Natural gas currently plays a relatively small role in China’s energy fuel mix. As of 2011,
natural gas made up only about 5.0 percent of China’s total primary energy consumption. While
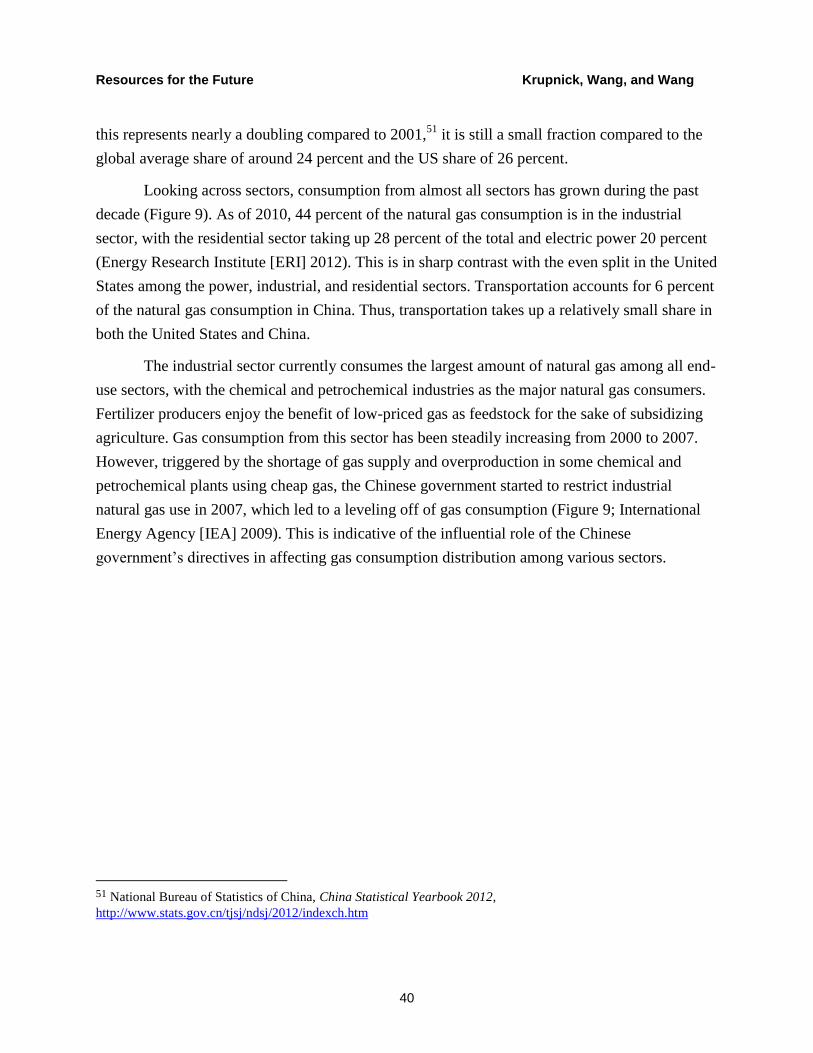
Resources for the Future Krupnick, Wang, and Wang
40
this represents nearly a doubling compared to 2001,51
it is still a small fraction compared to the
global average share of around 24 percent and the US share of 26 percent.
Looking across sectors, consumption from almost all sectors has grown during the past
decade (Figure 9). As of 2010, 44 percent of the natural gas consumption is in the industrial
sector, with the residential sector taking up 28 percent of the total and electric power 20 percent
(Energy Research Institute [ERI] 2012). This is in sharp contrast with the even split in the United
States among the power, industrial, and residential sectors. Transportation accounts for 6 percent
of the natural gas consumption in China. Thus, transportation takes up a relatively small share in
both the United States and China.
The industrial sector currently consumes the largest amount of natural gas among all end-
use sectors, with the chemical and petrochemical industries as the major natural gas consumers.
Fertilizer producers enjoy the benefit of low-priced gas as feedstock for the sake of subsidizing
agriculture. Gas consumption from this sector has been steadily increasing from 2000 to 2007.
However, triggered by the shortage of gas supply and overproduction in some chemical and
petrochemical plants using cheap gas, the Chinese government started to restrict industrial
natural gas use in 2007, which led to a leveling off of gas consumption (Figure 9; International
Energy Agency [IEA] 2009). This is indicative of the influential role of the Chinese
government’s directives in affecting gas consumption distribution among various sectors.
51 National Bureau of Statistics of China, China Statistical Yearbook 2012,
http://www.stats.gov.cn/tjsj/ndsj/2012/indexch.htm

Resources for the Future Krupnick, Wang, and Wang
41
Figure 9. China’s Natural Gas Consumption by Sector (2000–2009)
Source: International Energy Agency (2012b)
The residential sector, which takes up about a quarter of China’s total natural gas
consumption, is one of the fastest-growing end-use sectors of the past few years (Figure 9). This
increased demand was powered by the development of distribution infrastructure and by rapid
expansion and modernization of cities. Since natural gas has been relatively cheap, while the
price of liquefied petroleum gas (LPG) has rapidly increased since 2005 (IEA 2009), we see fuel
switching, from LPG and coal-based gas to natural gas, in urban areas during the past decade
(Figure 10). As of 2011, 27.8 percent of the 691 million urban residents in China have access to
pipeline natural gas,52
a doubling from 2005 (IEA 2009). Since the government has a target of 65
percent urban penetration of pipeline gas by midcentury (IEA 2009), residential use of natural
gas is expected to continue to soar in coming years. This is very different from the situation in
the United States, where there is little room for further increases in residential consumption of
natural gas.
52 National Bureau of Statistics of China, China Statistical Yearbook 2012,
http://www.stats.gov.cn/tjsj/ndsj/2012/indexch.htm
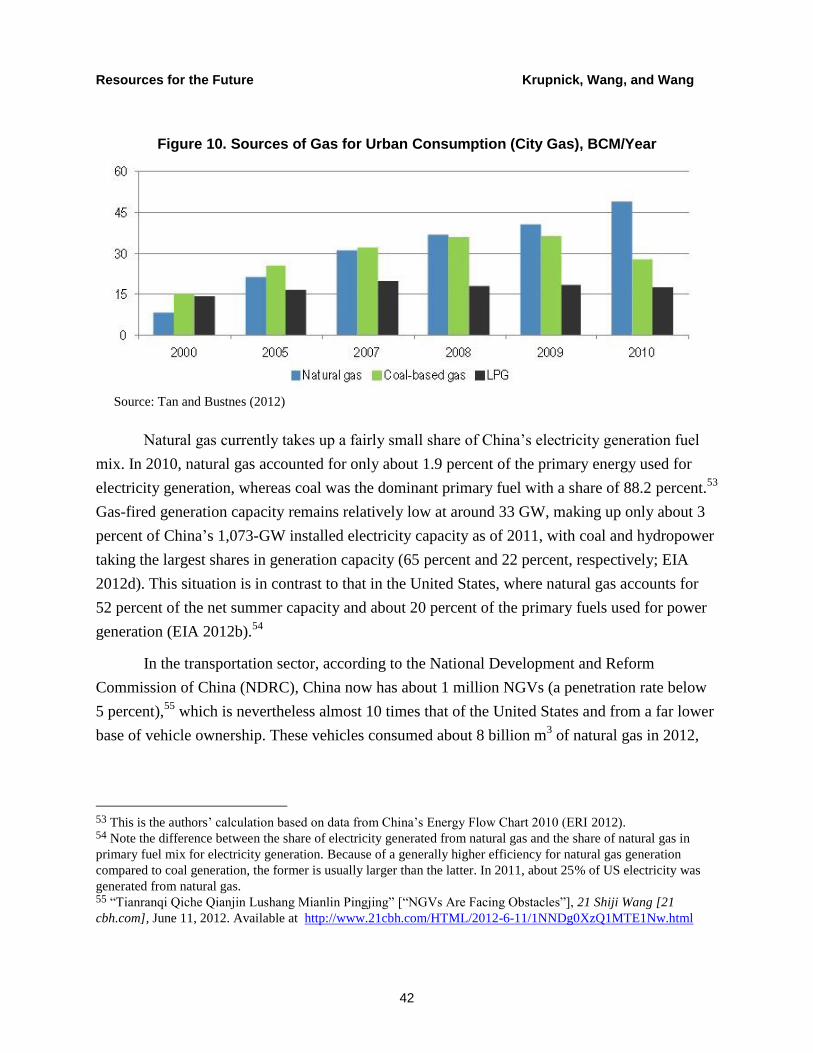
Resources for the Future Krupnick, Wang, and Wang
42
Figure 10. Sources of Gas for Urban Consumption (City Gas), BCM/Year
Source: Tan and Bustnes (2012)
Natural gas currently takes up a fairly small share of China’s electricity generation fuel
mix. In 2010, natural gas accounted for only about 1.9 percent of the primary energy used for
electricity generation, whereas coal was the dominant primary fuel with a share of 88.2 percent.53
Gas-fired generation capacity remains relatively low at around 33 GW, making up only about 3
percent of China’s 1,073-GW installed electricity capacity as of 2011, with coal and hydropower
taking the largest shares in generation capacity (65 percent and 22 percent, respectively; EIA
2012d). This situation is in contrast to that in the United States, where natural gas accounts for
52 percent of the net summer capacity and about 20 percent of the primary fuels used for power
generation (EIA 2012b).54
In the transportation sector, according to the National Development and Reform
Commission of China (NDRC), China now has about 1 million NGVs (a penetration rate below
5 percent),55
which is nevertheless almost 10 times that of the United States and from a far lower
base of vehicle ownership. These vehicles consumed about 8 billion m3 of natural gas in 2012,
53 This is the authors’ calculation based on data from China’s Energy Flow Chart 2010 (ERI 2012). 54 Note the difference between the share of electricity generated from natural gas and the share of natural gas in
primary fuel mix for electricity generation. Because of a generally higher efficiency for natural gas generation
compared to coal generation, the former is usually larger than the latter. In 2011, about 25% of US electricity was
generated from natural gas. 55 “Tianranqi Qiche Qianjin Lushang Mianlin Pingjing” [“NGVs Are Facing Obstacles”], 21 Shiji Wang [21
cbh.com], June 11, 2012. Available at http://www.21cbh.com/HTML/2012-6-11/1NNDg0XzQ1MTE1Nw.html

Resources for the Future Krupnick, Wang, and Wang
43
increasing from 1.79 billion m3 in 2010 (ERI 2012). NGVs currently are mainly public
transportation buses, cabs, long-range fleet bus carriers, and heavy-duty trucks.
6.2. How Is Natural Gas Priced in China?
China administers gas prices rather than letting them be determined in markets. The
delivered price of natural gas is a sum of wellhead price, transportation cost, distribution cost,
and retailer’s profit margin. The wellhead price and the transportation tariff are set nationally by
the NDRC on a cost-plus basis, while distribution cost and retailers’ profit margins are regulated
by local governments.56 Some sectors are cross-subsidized at the expense of others. Residential
and commercial sectors are heavily subsidized to keep prices low, while gas importers are taking
big losses by importing high-priced gas via pipeline from Turkmenistan or via terminals on the
Asian LNG market. Table 14 (IEA 2012a) shows that this situation has led to great regional
variations in prices as well as sectoral price differences, to the detriment of transportation. Cross-
subsidization may lead to inefficient allocation of resources across regions and sectors.
Table 14. End-Use Gas Prices in Selected Chinese Cities, 2011
$/mmBtu Residential Public Services Industry Transportation
Beijing 9.01 12.48 12.48 20.79 Tianjin 9.67 13.85 13.85 17.36
Shanghai 10.99 16.22 17.10 20.66 Nanning, Guangxi 19.21 25.19 25.19 21.76
Shenyang, Liaoning 13.80 16.31 16.31 16.31 Hefei, Anhui 8.78 14.97 10.37 14.97
Wuhan, Hubei 10.58 15.39 12.55 19.82 Chongqing 7.19 9.58 9.37 19.24
Source: IEA 2012a.
56 “Jiage Shichanghua Gaige Zhuzhang Tianranqi” [“Market-based Natural gas Pricing Reform Will Push Up
Natural Gas Prices”], Zhongguo Nengyuan Wang [China5e.com], July 11, 2012. Available at
http://www.china5e.com/show.php?contentid=232484

Resources for the Future Krupnick, Wang, and Wang
44
Table 15. Natural Gas Use Categories in the Natural Gas Use Guidelines
End-user Group
Sectors Included
Prioritized Residential use in urban areas (especially metropolitan areas) Public facilities (e.g., airports, schools, and hospitals) NGVs (especially dual-fuel vehicles and LNG vehicles) Collective home heating Air conditioning Interruptible industrial uses, including building materials, mechanical and electrical equipment,
textiles, petroleum chemicals, and metallurgical industries Interruptible users for hydrogen production from natural gas Distributed energy systems with efficiency greater than 70%, including hybrid systems with
renewables Natural gas vessels (especially LNG vessels) Load-smoothing storage facilities in urban areas Electricity generation projects from coal-bed methane Combined heat and power generation projects
Permissible Distributed home heating Industrial use displacing oil and LPG Industrial use for newly built projects where natural gas is used as heating fuel Industrial use displacing coal with evident environmental and economic benefits Natural gas–powered boiler projects in urban areas (especially metropolitan areas) Electricity generation from natural gas, except those specified in other groups Noninterruptible uses for hydrogen production from natural gas Small-scaled liquefaction plants for load smoothing and storage
Restrictive Expanded and coal-to-gas projects for synthetic ammonia production Feedstock for chemical projects (e.g., ethane and chloromethane production) Feedstock for newly built fertilizer production projects
Banned Base-load electric power generation projects in 13 coal-rich areas, excluding coal-bed methane projects
Feedstock for newly built, expanded, or coal-to-gas projects for methanol production
Source: NDRC 2012a.
6.3. Natural Gas Use Guidelines in China
Besides a regulated pricing system, allocations among different end-use sectors in China
are subject to government directives. In the Natural Gas Use Guidelines issued by NDRC in
October 2012, natural gas end-use sectors were categorized into four groups in a descending
order of priority (Table 15; NDRC 2012a). The category of prioritized use continues to
emphasize residential and commercial users but, in an apparently big change, now includes
transportation uses as well. The emphasis on storage capacity near urban areas is another
interesting inclusion as such capacity is sorely needed to meet growing demand in the residential
and commercial sectors. Including power generation from coal-bed methane (and in the future
probably shale gas) is another interesting choice, indicating that the government wants to
Resources for the Future Krupnick, Wang, and Wang
45
encourage these unconventional fuel sources. The category of permissible use includes certain
industrial uses that displace coal and oil for the environmental and economic benefits. The
restrictive use category includes the use of natural gas for chemical feedstock, another interesting
choice as this use has led many experts in the United States to conclude that low natural gas
prices have been leading to a revitalization of manufacturing that uses natural gas as a feedstock.
The lowest priority category is actually banned use. Notably, the guideline bans the use of
natural gas for base-load electric power generation in 13 coal-rich areas and for producing
methanol (a fuel that could be used as a transportation fuel and in some industrial applications).
It is expected that China’s total gas consumption will more than double from 2010 to
2015 and will take up about 7.7 percent of its total primary energy consumption by 2015.57
However, it is not clear if the Chinese government took into account the need for much more
natural gas infrastructure to process and transport the gas to markets. Although the two countries
are relatively similar in total area, China had just 27,000 miles of main natural gas pipelines as of
the end of 201158
(EIA 2012d) compared to 300,000 miles for the United States (EIA 2007).
With consumption from all sectors projected to increase, transportation and electricity
generation are the two sectors that are expected by Chinese experts to experience a more rapid
growth in consumption (Figure 11). As projected by ERI (2012), natural gas used for power
generation will increase by more than five-fold in the period 2010–2015, becoming the largest
gas consumer and accounting for about 38 percent of total gas consumption by 2015. Gas
consumption in transportation is expected to increase by 1,500 percent over the same time
horizon and is expected to consume about 11 percent of total gas consumption by 2015 (ERI
2012). Such higher projected growth relative to other end-use sectors is consistent with the
priorities that the government has indicated in its current Natural Gas Use Guidelines.
57 This is the authors’ calculation based on data from China’s Energy Flow Chart 2010 (ERI 2012). 58 The Chinese government plans to construct another 24,000 miles of new pipelines by 2015 (EIA 2012d).
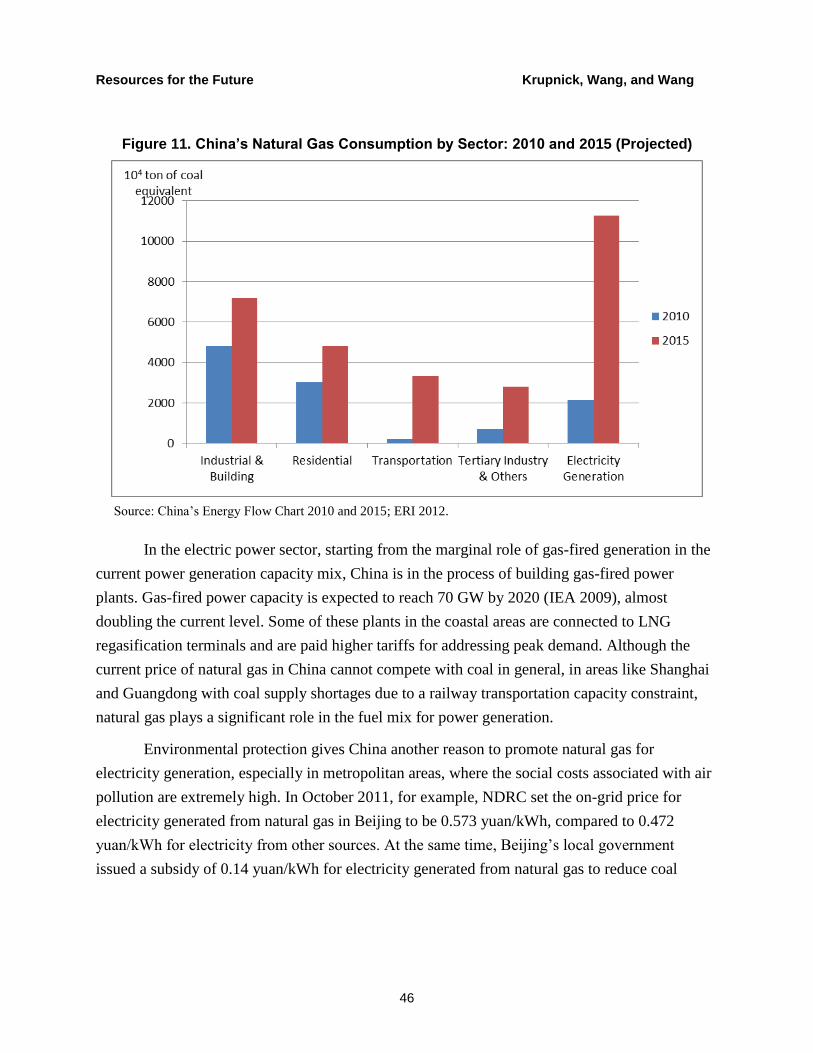
Resources for the Future Krupnick, Wang, and Wang
46
Figure 11. China’s Natural Gas Consumption by Sector: 2010 and 2015 (Projected)
Source: China’s Energy Flow Chart 2010 and 2015; ERI 2012.
In the electric power sector, starting from the marginal role of gas-fired generation in the
current power generation capacity mix, China is in the process of building gas-fired power
plants. Gas-fired power capacity is expected to reach 70 GW by 2020 (IEA 2009), almost
doubling the current level. Some of these plants in the coastal areas are connected to LNG
regasification terminals and are paid higher tariffs for addressing peak demand. Although the
current price of natural gas in China cannot compete with coal in general, in areas like Shanghai
and Guangdong with coal supply shortages due to a railway transportation capacity constraint,
natural gas plays a significant role in the fuel mix for power generation.
Environmental protection gives China another reason to promote natural gas for
electricity generation, especially in metropolitan areas, where the social costs associated with air
pollution are extremely high. In October 2011, for example, NDRC set the on-grid price for
electricity generated from natural gas in Beijing to be 0.573 yuan/kWh, compared to 0.472
yuan/kWh for electricity from other sources. At the same time, Beijing’s local government
issued a subsidy of 0.14 yuan/kWh for electricity generated from natural gas to reduce coal
Resources for the Future Krupnick, Wang, and Wang
47
combustion in the metropolitan area.59 The higher price for electricity generated from natural gas
is a correction for at least some of the negative externalities from coal generation. How closely
these prices match the appropriate market price is not possible to say with precision, but most
analysts think that it carries a welfare benefit for China to switch from coal to natural gas
because of the severe air pollution problems prevalent in cities all over the country.
In the transportation sector, China is actively promoting NGVs as an effort to combat air
pollution and to diversify its fuel sources so as to reduce its reliance on oil imports. However,
China’s southwestern region—where shale gas development is most likely to take off—is the
major sales market for natural gas passenger vehicles, the home to the major natural gas
automakers,60
and the region in which CNG/LNG refueling infrastructure is more developed
compared to other parts of the country. China has the world’s largest production capacity for
vehicle-use natural gas storage cylinders, about 800,000 cylinders per year.61
In 2010, NDRC set
a price floor for natural gas use for vehicles to be 75 percent of the gasoline price (NDRC 2010),
while some experts propose to bring down the price floor to 60 percent to make NGVs more
economically attractive. These factors lead us to speculate on a promising NGV market if China
does significantly expand its shale gas production.
6.4. Natural Gas Trade and Global Market Impact
Unlike the United States, China is expected to be a major net importer of natural gas.
China became a net gas importer in 2007, and its imported gas, about half LNG and half pipeline
gas, took up about 22 percent of total gas consumption in 2011 (EIA 2012d). Currently China
imports pipeline gas mainly from Turkmenistan and Myanmar, and it recently signed a
Memorandum of Understanding with Russia’s Gazprom for a 30-year contract for gas supplies
from Russia to China.62
According to EIA (2012d), China’s major LNG import sources include
59 “Beijing Tianranqi Tidai Ranmei Fadian, Nandu Keneng Yuandayu Dongli” [“Fuel Switching from Coal to
Natural Gas for Electricity Generation in Beijing: Big Challenges, Limited Incentives”], Zhongguo Nengyuan Wang
[China5e.com], July 11, 2012. Available at http://www.china5e.com/show.php?contentid=232357
60 “Tianranqi Qiche Damu Xuxu Lakai, Longtou Qiye Dayoukewei” [“Big Opportunities in NGVs for Leading
Companies”], Fenghuang Wang [ifeng.com], July 02, 2012. Available at
http://finance.ifeng.com/stock/hybg/20120702/6691116.shtml 61 “Daguimo Tuiguang Tianranqi Qiche Haixu Chuangsanguan” [“Three Issues Need to be Addressed to Make
Large-scale Use of NGVs Possible”], Renming Wang [people.com.cn], November 07, 2012. Available at http://gx.people.com.cn/n/2012/1107/c179486-17687275.html 62 Gasprom. “Gazprom and China Sign Memorandum of Understanding on Gas Supplies via Eastern Route”.
Gasprom News, March 2013. Available at http://www.gazprom.com/press/news/2013/march/article158716/
Resources for the Future Krupnick, Wang, and Wang
48
Australia (30 percent), Qatar (19 percent), and Indonesia (17 percent). According to IEA
(2012a), China has been doing a good job of building import terminals, gasifiers, and pipelines to
get the gas to markets. Its gas imports are projected to continue the rapid growth in the years to
come. China’s total gas demand is projected to reach 250 billion m3 by 2015, of which about a
third will come from gas imports.
Against this backdrop, and given China’s targeted production for shale gas at 6.5 billion
m3 (0.23 Tcf) by 2015 and 60–100 billion m
3 (2.12–3.53 Tcf) by 2020 (NDRC 2012b), shale gas
development is unlikely to have large impacts on China’s gas imports in the near term. However,
in the longer term, if China successfully exploits its potentially large shale gas resources, this
expanded domestic supply will probably substitute for the expensive gas imports and perhaps
even lead to downward pressure on the Asian gas price.
6.5. Comparing China with the United States
Cheaper gas, should it occur in China, will provide an unambiguous improvement in
public welfare,63
but the pattern of growth in natural gas use in China is unlikely to match that of
the United States. In the United States, residential and commercial natural gas use already
saturated the market, natural gas already had a major share of the power generation sector prior
to the shale gas boom, the manufacturing sector is undergoing a rebirth, and transportation
demand for natural gas is still in its infancy. In China, government policy will have a big impact
on the ultimate allocation of natural gas across sectors. The Chinese authorities plan to direct
natural gas to residential and commercial uses, giving the industrial sector less emphasis, as the
latter already uses a large percentage of China’s natural gas. The power sector will also be a
major winner, but not in coal-rich areas. Transportation in China already uses more natural gas
than does the US transportation sector, and the authorities plan to increase such use markedly. It
is interesting, but beyond the scope of this paper, to study the extent to which the natural gas use
guidelines issued by the Chinese government are socially and economically optimal policy.
The US experience does provide some lessons for China. Cheap gas can help and hurt the
environment by substituting for fuels in the power sector. While low natural gas prices may
enable natural gas to back out coal in China’s non-coal-producing regions, it may also dampen
enthusiasm for renewables. It is useful for the Chinese government to take this possibility into
63 In terms of climate change, the benefit of natural gas depends critically on the issue of methane leakage.
Resources for the Future Krupnick, Wang, and Wang
49
consideration. Low natural gas prices in the United States have started to stimulate innovations
in the uses of natural gas in transportation. With China already moving in this direction, the
country has an opportunity to serve as a model for the gasification of transportation around the
world. International chemical companies have shown a remarkable willingness to enter new
markets if their feedstock costs are low enough. Such investment in China, however it is
regulated by authorities, can potentially benefit technology transfer and keep the economy
growing.

Resources for the Future Krupnick, Wang, and Wang
50
References
American Chemistry Council. 2011. Shale Gas and New Petrochemicals Investment: Benefits for
the Economy, Jobs, and US Manufacturing. March. Washington, DC: American
Chemistry Council, Economics and Statistics Department.
———. 2012. Shale Gas, Competitiveness and New US Investment: A Case Study of Eight
Manufacturing Industries. May. Washington, DC: American Chemistry Council,
Economics and Statistics Department.
Alternative Fuels Data Center (AFDC). 2011. “Alternative Fueling Station Total Counts by State
and Fuel Type”. Alternative Fuels & Advanced Vehicles Data Center in the US DOE.
Retrieved April 20, 2011. Available at
http://www.afdc.energy.gov/afdc/fuels/stations_counts.html
Broder, J. M., and C. Krauss. 2012. “A Big, and Risky, Energy Bet.” New York Times, December
17. Available at http://www.nytimes.com/2012/12/18/business/energy-
environment/sasol-betting-big-on-gas-to-liquid-plant-in-
us.html?pagewanted=all&_r=2&.
Burtraw, D., K. Palmer, A. Paul, M. Woerman. 2012. “Secular Trends, Environmental
Regulations, and Electricity Markets.” Discussion Paper 12-15. Washington, DC:
Resources for the Future.
Bryce, Robert. 2011. Ten Reasons Why Natural Gas Will Fuel the Future. Energy Policy and the
Environment Report No. 8, April. New York, NY: Manhattan Institute for Policy
Research. Available at http://www.manhattan-institute.org/html/eper_08.htm.
Celebl, M., F. Graves, and C. Russell. 2012. “Potential Coal Plant Retirements: 2012 Update.”
Discussion Paper, October. Washington, DC: The Brattle Group.
Center for Climate and Energy Solutions (C2ES). 2012. Natural Gas Use in the Transportation
Sector. Arlington, VA: Center for Climate and Energy Solutions. Available at
http://www.c2es.org/publications/natural-gas-use-transportation-sector.
CF Industries. 2012. CF Industries 2011 Annual Report: Our Global Table. Deerfield, IL: CF
Industries Holdings, Inc.

Resources for the Future Krupnick, Wang, and Wang
51
Cianca, Dann. 2011. “Natural Gas Passenger Vehicles Coming to Grand Junction: Honda’s Civic
GX Expected Locally by Early Fall.” KJCT8.com of Pikes Peak Television Inc., April 7.
Available at http://www.kjct8.com/news/27473206/detail.html.
Dow Chemical. 2011. 2011 Annual Report: Welcome to SolutionismTM
. Midland, MI: The Dow
Chemical Company.
Energy Information Administration (EIA). 2007. About US Natural Gas Pipelines—
Transporting Natural Gas. Washington, DC: US Department of Energy.
———. 2008. Natural Gas Weekly Update. Washington, DC: Department of Energy.
———. 2012a. Annual Energy Outlook 2012. DOE/EIA-0383(2012). Washington, DC: US
Department of Energy.
———. 2012b. Annual Energy Review 2011. DOE/EIA-0384(2011). Washington, DC: US
Department of Energy.
———. 2012c. “Electricity Generation from Coal and Natural
Gas Both Increased with Summer Heat.” Available at http://www.eia.gov/todayinenergy/
detail.cfm?id=8450#.
———. 2012d. Country Profile: China. Washington, DC: US Department of Energy.
———. 2013. Annual Energy Outlook 2013 Early Release Overview. Washington, DC: US
Department of Energy.
Energy Research Institute (ERI). 2012. “Energy Flow Chart of China: 2010 and 2015” (in
Chinese), published in China Energy Outlook. Beijing, China: National Development and
Reform Commission of China.
Federal Energy Regulatory Commission. 2012. Energy Primer, a Handbook of Energy Market
Basics. Washington, DC: Federal Energy Regulatory Commission.
Federal Highway Administration. 2008. 2008, Table VM1 and annual, “Highway Statistics
2007”. Washington, DC: US Department of Transportation. (Additional resources:
www.fhwa.dot.gov)
———. 2009. 2008, Table VM1 and annual, Highway Statistics 2009. Washington, DC: US
Department of Transportation. (Additional resources: www.fhwa.dot.gov).

Resources for the Future Krupnick, Wang, and Wang
52
Fraas, A. G., W. Harrington, and R. D. Morgenstern. 2013. Cheaper Fuels for the Light Duty
Fleet: Opportunities and Barriers.” Forthcoming Discussion Paper. Washington, DC:
Resources for the Future.
Gladstein, Neandross & Associates. 2011. NGV Roadmap for Pennsylvania Jobs, Energy
Security and Clean Air. Canonsburg, PA: Marcellus Shale Coalition. Available at
http://marcelluscoalition.org/wp-
content/uploads/2011/04/MSC_NGV_Report_FINAL.pdf.
Goulding, A. J., Yifei Zhang, and Van Hoang. 2011. Seeing Past the Hype: Why Natural Gas
Vehicles (NGVs) May Be More Cost Effective Than Electric Vehicles (EVs) for Fighting
Climate Change. February 18. Boston, MA: London Economics International
LLC. Available at
http://www.londoneconomics.com/pdfs/LEI_NGV_paper_updated_Final.pdf.
Gray, Ryan. 2011. “2011 NatGas Act Introduced in Congress.” School Transportation News,
April 6. Available at http://www.stnonline.com/home/latest-news/3257-2011-natgas-act-
to-be-introduced-to-congress.
Hesterberg, Thomas, William Bunn, and Charles Lapin. 2009. “An Evaluation of Criteria for
Selecting Vehicles Fueled with Diesel or Compressed Natural Gas.” Sustainability:
Science, Practice, and Policy 5(1): 20–30.
IHS Global Insight. 2010. Presentation by Mary Novak on US Energy Outlook at annual Energy
Information Administration conference, April 6–7, Washington, DC.
International Energy Agency (IEA). 2009. “Natural Gas in China: Market Evolution and
Strategy.” Working Paper Series. Paris, France: Organization for Economic Co-operation
and Development, IEA.
———. 2012a. Gas Pricing and Regulation: China’s Challenges and IEA Experience. Paris,
France: Organization for Economic Co-operation and Development, IEA.
———. 2012b. Oil & Gas Security Emergency Response of IEA Countries: People’s Republic of
China. Paris, France: Organization for Economic Co-operation and Development, IEA.
Johnson, J., and A. H. Tullo. 2013. “Chemical and Gas Suppliers Battle over LNG Exports.”
Chemical & Engineering News 91(10): 9–13.
Resources for the Future Krupnick, Wang, and Wang
53
Kell-Holland, Clarissa. 2009. “Payoff—One Company Rolled the Dice on LNG and Reaped the
Reward.” LandLine Magazine, March/April: 53. Available at
http://www.cleanenergyfuels.com/pdf/LNG_landline_apr09.pdf.
Knittel, C. R. 2012. “Leveling the Playing Field for Natural Gas in Transportation.” Discussion
Paper 2012-03. Washington, DC: Brookings Institution.
Lipschultz, M. C. 2012. Historic Opportunities from the Shale Gas Revolution. KKR Report,
November. New York, NY: Kohlberg Kravis Roberts & Co. L.P.
Logan, J., G. Heath, J. Macknick, E. Paranhos, W. Boyd, and K. Carlson. 2012. Natural Gas and
the Transformation of the US Energy Sector: Electricity. Technical Report, NREL/TP-
6A50-55538. Denver, CO: The Joint Institute for Strategic Energy Analysis.
Massachusetts Institute of Technology. 2009. The Future of Natural Gas, an Interdisciplinary
Study of MIT. Cambridge, MA: MIT Energy Initiative.
Miller, J. W. 2012. “Steel Finds Sweet Spot in the Shale.” Wall Street Journal, March 26.
Available at
http://online.wsj.com/article/SB10001424052702304177104577305611784871178.html.
Mufson, S. 2012. “The Demise of Coal-Fired Power Plants.” The Washington Post, November
23. Available at http://articles.washingtonpost.com/2012-11-
23/business/35508510_1_coal-plant-coal-prices-coal-mines.
National Development and Reform Commission of China (NDRC). 2010. Notice on Increasing
Benchmarking Well-head Prices for Domestic Onshore Natural Gas (in Chinese). NDRC
Notice No. [2010] 211. Beijing, China: NDRC. Available at
http://www.ndrc.gov.cn/zcfb/zcfbtz/2010tz/t20100531_350432.htm
———. 2012a. Natural Gas Use Guidelines (in Chinese). Beijing, China: NDRC. Available at
http://www.ndrc.gov.cn/zcfb/zcfbl/2012ling/W020121031361673058000.pdf.
———. 2012b. Shale Gas Development Plan (2011–2015) (in Chinese). Beijing, China: NDRC.
Available at http://www.ndrc.gov.cn/zcfb/zcfbtz/2012tz/W020120316370486643634.pdf.
NERA Economic Consulting. 2012. Macroeconomic Impacts of LNG Exports from the United
States. December. Washington, DC: NERA Economic Consulting.
Pacific Northwest National Laboratory. 2002. A Primer on Electric Utilities, Deregulation, and
Restructuring of US Electricity Markets, Version 2.0. Richland, WA: Pacific Northwest
National Laboratory.
Resources for the Future Krupnick, Wang, and Wang
54
Pirog, R., and M. Ratner. 2012. Natural Gas in the US Economy: Opportunities for Growth.
November. Washington, DC: Congressional Research Service.
Port of Los Angeles and Port of Long Beach. 2011. San Pedro Bay Ports Clean Air Action Plan.
Clean Air Action Plan (CAPP) Implementation Progress Report, Quarterly Report – 1st
Quarter
2011. Available at http://www.cleanairactionplan.org/civica/filebank/blobdload.asp?Blob
ID=2518.
PricewaterhouseCoopers (PwC). 2011. Shale Gas: a Renaissance in US Manufacturing?
December. New York, NY: PwC.
———. 2012. Shale Gas: Reshaping the US Chemicals Industry. October. New York, NY: PwC.
Tan, S., and B. E. Bustnes. 2012. China Oil and Gas: Natural Gas Pricing Trial Reform May
Pave the Way for Better Future in Imports and Unconventional Gas. January 17. Hong
Kong, China: J.P. Morgan, Asia Pacific Equity Research.
Taschler, J., and T. Content. 2011. “Interest Soars in Natural Gas Vehicles: As Oil Prices Rise,
More Business Fleets Could Use Alternative Fuel.” The Milwaukee Journal Sentinel,
April 9. Available at http://www.jsonline.com/business/119517879.html.
Taylor G. Don., W. G. DuCote, and G. L. Whicker. 2006. “Regional Fleet Design in Truckload
Trucking.” Transportation Research: Part E 42(3): 167–190.
Turner, Sean. 2010. “Natural Gas Vehicles: What’s Here and What’s Coming.” Presented at the
Waste-to-Wheels: Building for Success conference. December 1, Columbus, Ohio.
Available at http://www1.eere.energy.gov/cleancities/pdfs/ngv_wkshp_turner.pdf.
Union of Concerned Scientists. 2004. The Diesel Dilemma: Diesel’s Role in the Race for Clean
Cars. Cambridge, MA: Union of Concerned Scientists. Available at
http://www.ucsusa.org/clean_vehicles/technologies_and_fuels/gasoline_and_diesel/the-
diesel-dilemma-diesels.html.
US Environmental Protection Agency. 2012. Inventory of US Greenhouse Gas Emissions and
Sinks 1990–2010. EPA 430-R-12-001. April. Washington, DC: US Environmental
Protection Agency.
US Environmental Protection Agency and National Highway Traffic Safety Administration.
2011. “Greenhouse Gas Emissions Standards and Fuel Efficiency Standards for Medium-
and Heavy-Duty Engines and Vehicles.” Federal Register 76(179): 57106–57513.

Resources for the Future Krupnick, Wang, and Wang
55
White House. 2012. “Fact Sheet: All-of-the-Above Approach to American Energy.” Office of
the Press Secretary, March 7. Available at http://www.whitehouse.gov/the-press-
office/2012/03/07/fact-sheet-all-above-approach-american-energy.