section 6 - vulnerability assessmentco.harrison.ms.us/downloads/departmental...
TRANSCRIPT

SECTION 6 VULNERABILITY ASSESSMENT
MEMA District 9 Regional Hazard Mitigation Plan DRAFT – February 2017
6:1
This section identifies and quantifies the vulnerability of the MEMA District 9 Region to the significant hazards identified in the previous sections (Hazard Identification and Profiles). It consists of the following subsections:
6.1 Overview
6.2 Methodology
6.3 Explanation of Data Sources
6.4 Asset Inventory
6.5 Vulnerability Assessment Results
6.6 Conclusions on Hazard Vulnerability
44 CFR Requirement
44 CFR Part 201.6(c)(2)(ii): The risk assessment shall include a description of the jurisdiction's vulnerability to the hazards described in paragraph (c)(2)(i) of this section. The description shall include an overall summary of each hazard and its impact on the community. The plan should describe vulnerability in terms of: (A) The types and numbers of existing and future buildings, infrastructure, and critical facilities located in the identified hazard areas; (B) An estimate of the potential losses to vulnerable structures identified in paragraph (c)(2)(ii)(A) of this section and a description of the methodology used to prepare the estimate; (C) Providing a general description of land uses and development trends within the community so that mitigation options can be considered in future land use decisions.
6.1 OVERVIEW This section builds upon the information provided in Section 4: Hazard Identification and Section 5: Hazard Profiles by identifying and characterizing an inventory of assets in the MEMA District 9 Region. In addition, the potential impact and expected amount of damages caused to these assets by each identified hazard event is assessed. The primary objective of the vulnerability assessment is to quantify exposure and the potential loss estimates for each hazard. In doing so, the MEMA District 9 counties and their participating jurisdictions may better understand their unique risks to identified hazards and be better prepared to evaluate and prioritize specific hazard mitigation actions. This section begins with an explanation of the methodology applied to complete the vulnerability assessment, followed by a summary description of the asset inventory as compiled for the MEMA District 9 Region. The remainder of this section focuses on the results of the assessment conducted.
6.2 METHODOLOGY This vulnerability assessment was conducted using three distinct methodologies: (1) A stochastic risk assessment; (2) a geographic information system (GIS)-based analysis; and (3) a risk modeling software analysis. Each approach provides estimates for the potential impact of hazards by using a common, systematic framework for evaluation, including historical occurrence information provided in the Hazard

SECTION 6: VULNERABILITY ASSESSMENT
MEMA District 9 Regional Hazard Mitigation Plan DRAFT – February 2017
6:2
Identification and Analysis sections. A brief description of the three different approaches is provided on the following pages.
6.2.1 Stochastic Risk Assessment The stochastic risk assessment methodology was applied to analyze hazards of concern that were outside the scope of hazard risk models and the GIS-based risk assessment. This includes hazards that do not have geographically-definable boundaries and are therefore excluded from spatial analysis through GIS. A stochastic risk methodology was used for the following hazards:
Erosion Drought
Lightning Extreme Cold
Extreme Heat Hailstorm
Severe Thunderstorm/High Wind Tornado Winter Weather Infectious Disease
Many of the hazards listed above are considered atmospheric and thus have the potential to affect all buildings and all populations. For many of the hazards listed above, no additional analysis was performed due to an inability to differentiate particular buildings or populations that would be more vulnerable to that particular hazard. When possible, annualized loss estimates for these hazards were determined using the best available data on historical losses from sources including NOAA’s National Climatic Data Center records, previous MEMA District 9 county-level hazard mitigation plans, and local knowledge. Annualized loss is the estimated long-term weighted average value of losses to property in any single year in a specified geographic area (i.e., municipal jurisdiction or county). Annualized loss estimates were generated by totaling the amount of property damage over the period of time for which records were available, and calculating the average annual loss. Given the standard weighting analysis, losses can be readily compared across hazards providing an objective approach for evaluating mitigation alternatives. For the erosion, drought, extreme cold, extreme heat, and infectious disease hazards no data with historical property damages was available. Therefore, annualized potential losses for these hazards are presumed to be negligible. All of the above hazards have the potential to impact the entire MEMA District 9 Region and generally cannot be well-defined geographically in terms of their impact areas. The results for these hazards are found near the end of this section in Table 6.17.
6.2.2 GIS-Based Analysis
Other hazards have specified geographic boundaries that permit additional using Geographic Information Systems (GIS). These hazards include:
Dam and Levee Failure Flood

SECTION 6: VULNERABILITY ASSESSMENT
MEMA District 9 Regional Hazard Mitigation Plan DRAFT – February 2017
6:3
Wildfire
Climate Change/Sea Level Rise Hazardous Material Incident/Train Derailment
The objective of the GIS-based analysis was to determine the estimated vulnerability of critical facilities and populations for the identified hazards in the MEMA District 9 Region using best available geospatial data. Digital data was collected from local, regional, state, and national sources for hazards and buildings. Jurisdictions in the MEMA District 9 Region generally had readily available geospatial parcel or building footprint data. Despite the availability of this data for most communities, others lacked this detailed data. In these cases, the RHMC wanted to have some estimate of potential building and dollar losses, so Census block data was extracted from Hazus MH 3.2 that included building counts and estimated dollar values of property in the region. Additionally, geo-referenced point locations for identified assets (critical facilities and infrastructure, special populations, etc.) were identified from previous plans and updated by local officials. This information was used in the vulnerability analysis by overlaying spatial hazard risk data in ESRI® ArcGIS™ 10.3.1 to assess hazard vulnerability in terms of the local building data and critical assets described above. Using these data layers, hazard vulnerability can be quantified by estimating the number and dollar value of buildings determined to be located in identified hazard areas. To estimate vulnerable populations in hazard areas, digital Census 2010 data by census tract was obtained. This was intersected with hazard areas to determine exposed. The results of the analysis provided an estimate of the amount of property and critical facilities determined to be potentially at risk to those hazards with delineable geographic hazard boundaries.
6.2.3 Risk Modeling Software Analysis A risk modeling software was used for the following hazards:
Earthquake Hurricane and Tropical Storm Storm Surge
There are several models that exist to model hazard risk. Hazus-MH was used in this vulnerability assessment to address the aforementioned hazards.
HAZUS-MH Hazus-MH (“Hazus”) is a standardized loss estimation software program developed by FEMA. It is built upon an integrated GIS platform to conduct analysis at a regional level (i.e., not on a structure-by-structure basis). The Hazus risk assessment methodology is parametric, in that distinct hazard and inventory parameters (e.g., wind speed and building types) can be modeled using the software to determine the impact (i.e., damages and losses) on the built environment. The MEMA District 9 Regional Risk Assessment utilized Hazus-MH to produce hazard damage loss estimations for hazards for the planning area. At the time this analysis was completed, Hazus-MH 3.2

SECTION 6: VULNERABILITY ASSESSMENT
MEMA District 9 Regional Hazard Mitigation Plan DRAFT – February 2017
6:4
was used to estimate potential damages from the hurricane winds, storm surge, and earthquake hazards using Hazus-MH methodology. Although the program can also model losses for flood, it was not used in this Risk Assessment due to availability of flood map data. Figure 6.1 illustrates the conceptual model of the Hazus-MH methodology.
FIGURE 6.1: CONCEPTUAL MODEL OF HAZUS-MH METHODOLOGY
Hazus-MH is capable of providing a variety of loss estimation results. In order to be consistent with other hazard assessments, annualized losses are presented when possible. Some additional results based on location-specific scenarios may also be presented to provide a complete picture of hazard vulnerability. Loss estimates provided in this vulnerability assessment are based on best available data and methodologies. The results are an approximation of risk. These estimates should be used to understand relative risk from hazards and potential losses. Uncertainties are inherent in any loss estimation methodology, arising in part from incomplete scientific knowledge concerning natural hazards and their effects on the built environment. Uncertainties also result from approximations and simplifications that are necessary for a comprehensive analysis (e.g., incomplete inventories, non-specific locations, demographics, or economic parameters).
SECTION 6: VULNERABILITY ASSESSMENT
MEMA District 9 Regional Hazard Mitigation Plan DRAFT – February 2017
6:5
All conclusions are presented in “Conclusions on Hazard Vulnerability” at the end of this section.
6.3 EXPLANATION OF DATA SOURCES
FLOOD FEMA Digital Flood Rate Insurance Maps (DFIRM) flood data was used to determine flood vulnerability. DFIRM data can be used in ArcGIS for mapping purposes, and they identify several features including floodplain boundaries and, in many cases, base flood elevations. Identified areas on the DFIRM represent some features of a Flood Insurance Rate Map including the 100-year flood areas (1.0-percent annual chance flood), the 500-year flood areas (0.2-percent annual chance flood). For the vulnerability assessment, local improved property data and critical facilities were overlaid on the 1.0-percent annual chance floodplains (ACF), 0.2-percent annual chance floodplains, and coastal VE zones for counties. It should be noted that such an analysis does not account for building elevation.
WILDFIRE The data used to determine vulnerability to wildfire in the MEMA District 9 Region is based on GIS data called the Southern Wildfire Risk Assessment (SWRA). This data is available on the Southern Wildfire Risk Assessment website and can be downloaded and imported into ArcGIS. A specific layer, known as “Wildland Urban Interface Risk Index” (WUIRI) was used to determine vulnerability of people and property. The WUIRI is presented on a scale of 0 to -9. It combines data on housing density with the data on the impact and likelihood of a wildfire occurring in a specific area. The primary purpose of the data is to highlight areas of concern that may be conducive to wildfire impacting property. Due to assumptions made, it is not true probability. However, it does provide a comparison of risk throughout the region.
EARTHQUAKE Hazus-MH 3.2 (as described above) was used to assess earthquake vulnerability. A level 1, probabilistic scenario to estimate average annualized loss was utilized. In this scenario, several return periods (events of varying intensities) are run to determine annualized loss. Default Hazus earthquake damage functions and methodology were used to determine the probability of damage. Results are calculated at the 2010 U.S. Census tract level in Hazus and presented at the county level.
HURRICANE AND TROPICAL STORM WIND Hazus-MH 3.2 (as described above) was used to assess wind vulnerability. For the hurricane wind analysis, a probabilistic scenario was created to estimate the annualized loss damage in the MEMA District 9 Region. Default Hazus wind speed data, damage functions, and methodology were used in to determine the probability of damage for 100-, 500-, and 1,000-year frequency events (also known as a return period) in the scenario. Results are calculated in Hazus at the 2010 U.S. Census tract level and presented at the county level.
STORM SURGE Hazus-MH 3.2 also allows for the modeling of impacts from storm surge on coastal communities along the Atlantic and Gulf Coasts. However, it should be noted that the storm surge model can only be run

SECTION 6: VULNERABILITY ASSESSMENT
MEMA District 9 Regional Hazard Mitigation Plan DRAFT – February 2017
6:6
with a historic hurricane track model and cannot be run with the annualized loss tool. Therefore, the dollar damage estimates from storm surge modeling will not be consistent with estimates for other hazards (which are presented in terms of annualized loss). Additionally, losses from storm surge are presented by the model at an aggregate level with all other losses that are estimated for the historic event. That is to say, losses are a combination of hurricane winds and storm surge losses and could not be separated into how those losses were caused.
HAZARDOUS MATERIALS INCIDENT/TRAIN DERAILMENT For the fixed hazardous materials incident analysis, Toxic Release Inventory (TRI) data was used. The Toxics Release Inventory is a publicly available database from the federal Environmental Protection Agency (EPA) that contains information on toxic chemical releases and other waste management activities reported annually by certain covered industry groups as well as federal facilities. This inventory was established under the Emergency Planning and Community Right-to-Know Act of 1986 (EPCRA) and expanded by the Pollution Prevention Act of 1990. Each year, facilities that meet certain activity thresholds must report their releases and other waste management activities for listed toxic chemicals to EPA and to their state or tribal entity. A facility must report if it meets the following three criteria:
The facility falls within one of the following industrial categories: manufacturing; metal mining; coal mining; electric generating facilities that combust coal and/or oil; chemical wholesale distributors; petroleum terminals and bulk storage facilities; RCRA Subtitle C treatment, storage, and disposal (TSD) facilities; and solvent recovery services;
Has 10 or more full-time employee equivalents; and
Manufactures or processes more than 25,000 pounds or otherwise uses more than 10,000 pounds of any listed chemical during the calendar year. Persistent, bioaccumulative, and toxic (PBT) chemicals are subject to different thresholds of 10 pounds, 100 pounds, or 0.1 grams depending on the chemical.
For the mobile hazardous materials incident analysis, transportation data including major highways and railroads were obtained from the Federal Highway Administration’s National Highway Planning Network and the United States Department of Transportation’s Federal Railroad Administration, respectively. This data is ArcGIS compatible, lending itself to buffer analysis to determine risk.
DAM/LEVEE FAILURE Dam inundation data was available in GIS format for several of the major dams in the region from the Mississippi Department of Environmental Quality. Although not all high hazard dams have inundation mapping, several of the major dams in the region are included in this data. With that in mind, analysis with this data should not be considered inclusive of every critical facility or structure that may be at risk to a dam or levee failure as the data is far from being complete.
CLIMATE CHANGE/SEA LEVEL RISE The National Oceanic and Atmospheric Administration has produced sea level rise data that is available for download and which can be used for planning purposes to determine the inundation of areas along the coast based on various levels of sea level rise. These different scenarios can be used to visualize community-level impacts from coastal flooding or sea level rise (up to 6 feet above average high tides).

SECTION 6: VULNERABILITY ASSESSMENT
MEMA District 9 Regional Hazard Mitigation Plan DRAFT – February 2017
6:7
6.4 ASSET INVENTORY An inventory of geo-referenced assets within the MEMA District 9 counties and jurisdictions was compiled in order to identify and characterize those properties potentially at risk to the identified hazards.1 By understanding the type and number of assets that exist and where they are located in relation to known hazard areas, the relative risk and vulnerability for such assets can be assessed. Under this assessment, two categories of physical assets were created and then further assessed through GIS analysis. Additionally, social assets are addressed to determine population at risk to the identified hazards. These are presented below in Section 6.4.1.
6.4.1 Physical and Improved Assets The two categories of physical assets consist of:
1. Improved Property: Includes all improved properties in the MEMA District 9 Region according to
parcel and building footprint data provided by the Mississippi Department of Environmental Quality through the Mississippi Digital Earth Model. The information has been expressed in terms of the number of parcels and total improved value that may be exposed to the identified hazards. However, it should be noted that parcel data was not available for George County. As a result, parcel counts and improved values at the Census Block level were pulled from Hazus 3.2 to estimate exposure in George County. Similarly, although parcel data was available in Pearl River County, it did not include improvement values for the parcels, so Census Block level dollar values were used to estimate exposure in Pearl River County. Further, it should be noted that these estimates often over-estimate the dollar value of properties. In addition, building footprint data was available for all of the counties and it was used to improve the overall assessment by providing a more accurate assessment of how many buildings are located in hazard areas. However, it should be noted that building footprint data has not been updated since 2007 and the parcel data has not been updated since 2009, so these datasets likely underestimate current building counts/parcel data.
2. Critical Facilities: Critical facilities vary by jurisdiction. For this Vulnerability Assessment, identified facilities from past plans were updated by local governments including fire stations, police stations, medical care facilities, schools, and emergency operation centers. It should be noted that this listing is not necessarily all-inclusive for assets located in the region, but it is anticipated that it will be expanded during future plan updates as more geo-referenced data becomes available for use in GIS analysis.
The following tables provide a detailed listing of the geo-referenced assets that have been identified for inclusion in the vulnerability assessment for the MEMA District 9 Region.
1 While potentially not all-inclusive for MEMA District 9, “georeferenced” assets include those assets for which specific location
data is readily available for connecting the asset to a specific geographic location for purposes of GIS analysis.

SECTION 6: VULNERABILITY ASSESSMENT
MEMA District 9 Regional Hazard Mitigation Plan DRAFT – February 2017
6:8
Table 6.1 lists the estimated number of buildings, parcels, and the total value of improvements for participating areas of the MEMA District 9 Region (study area of vulnerability assessment). Because digital parcel data was not available for every community, data obtained from Hazus-MH 3.2 inventory was utilized to supplement the analysis where gaps existed.
TABLE 6.1: IMPROVED PROPERTY IN THE MEMA DISTRICT 9 REGION
Location Counts of Buildings Counts of Parcels Total Value of Improvements
George County* 10,321 -- $1,799,918,000
Lucedale 1,538 -- $335,976,000
Unincorporated Area 8,783 -- $1,463,942,000
Hancock County 41,036 52,302 $991,751,035
Bay St. Louis 5,699 5,313 $128,600,369
Diamondhead 4,682 7,368 $389,782,736
Waveland 4,707 5,443 $94,730,326
Unincorporated Area 41,573 34,178 $378,637,604
Harrison County 123,848 96,568 $6,470,813,817
Biloxi 23,001 16,807 $1,542,665,202
D’Iberville 4,751 3,122 $234,845,437
Gulfport 41,641 32,328 $397,918,520
Long Beach 9,188 7,175 $464,548,692
Pass Christian 3,694 6,224 $183,434,546
Unincorporated Area 41,573 30,912 $3,647,401,420
Jackson County 100,298 80,635 $4,993,387,650
Gautier 7,194 5,573 $397,918,520
Moss Point 10,825 8,690 $405,337,190
Ocean Springs 10,325 8,072 $905,620,110
Pascagoula 14,967 9,886 $852,583,870
Unincorporated Area 56,987 48,414 $2,431,927,960
Pearl River County† 50,721 44,125 $4,750,724,000
Picayune 7,020 6,411 $1,406,763,000
Poplarville 1,964 1,538 $344,167,000
Unincorporated Area 41,737 36,176 $2,999,794,000
Stone County 15,770 13,235 $419,179,006
Wiggins 3,187 2,416 $132,113,728
Unincorporated Area 12,583 10,819 $287,065,278
MEMA DISTRICT 9 REGION TOTAL
341,994 286,865 $19,425,773,508
*Parcel counts and improvement values for George County are based on Hazus 3.2 estimates at the Census Block level †Improvement values for Pearl River County are based on Hazus 3.2 estimates at the Census Block level Source: MDEQ, Hazus-MH 3.2 Table 6.2 lists the critical facilities located in the MEMA District 9 Region by type according to data provided by local government officials. In addition, Figure 6.2 shows the locations of critical facilities in the MEMA District 9 Region. Table 6.14, at the end of this section, shows a complete list of the critical facilities by name, as well as the hazards

SECTION 6: VULNERABILITY ASSESSMENT
MEMA District 9 Regional Hazard Mitigation Plan DRAFT – February 2017
6:9
that affect each facility. As noted previously, this list is not all-inclusive and only includes readily available information. Further, it should be noted that the table below may show that some counties or communities do not have any critical facilities of in certain type, when in reality, that particular type of facility may actually be located within the community. This may occur because spatial data for that facility type was not available or because the facility may have been classified under a different category type for that particular community.
TABLE 6.2: CRITICAL FACILITY INVENTORY IN THE MEMA DISTRICT 9 REGION
Location Communications EOC Fire
Stations Medical
Police Station
Power/ Gas
Private/Non-Profit
George County 2 1 15 2 1 2 1
Lucedale 0 0 1 0 1 0 0
Unincorporated Area
2 1 14 2 0 2 1
Hancock County 4 1 8 3 6 3 3
Bay St. Louis 2 0 2 0 1 1 0
Diamondhead 0 0 1 0 1 0 0
Waveland 0 0 2 0 2 0 1
Unincorporated Area
2 1 3 3 2 2 2
Harrison County 4 3 32 13 17 92 29
Biloxi 3 1 9 6 3 1 24
D’Iberville 1 0 1 2 1 3 0
Gulfport 0 0 12 4 11 1 5
Long Beach 0 0 3 0 1 0 0
Pass Christian 0 1 2 1 1 0 0
Unincorporated Area
0 1 5 0 0 87 0
Jackson County 5 3 45 4 8 1 20
Gautier 0 0 3 0 1 0 0
Moss Point 0 0 4 0 1 0 0
Ocean Springs 0 1 4 2 3 0 2
Pascagoula 1 1 3 2 2 1 17
Unincorporated Area
4 1 31 0 1 0 1
Pearl River County 5 1 29 4 3 0 0
Picayune 1 0 8 3 2 0 0
Poplarville 4 1 11 1 1 0 0
Unincorporated Area
0 0 10 0 0 0 0
Stone County 1 1 1 1 2 3 0
Wiggins 1 1 0 0 1 0 0
Unincorporated Area
0 0 1 1 1 3 0
MEMA DISTRICT 9 REGION TOTAL
21 10 130 27 37 101 53
Source: Local Governments

SECTION 6: VULNERABILITY ASSESSMENT
MEMA District 9 Regional Hazard Mitigation Plan DRAFT – February 2017
6:10
TABLE 6.2: CRITICAL FACILITY INVENTORY IN THE MEMA DISTRICT 9 REGION (CONT.)
Location Public Facility
School Shelter Special
Populations Transportation
Water/ Wastewater
George County 8 9 0 5 0 5
Lucedale 1 0 0 0 0 1
Unincorporated Area
7 9 0 5 0 4
Hancock County 22 18 1 8 12 16
Bay St. Louis 3 3 0 1 1 4
Diamondhead 3 0 0 0 0 0
Waveland 6 0 0 0 0 5
Unincorporated Area
10 15 1 7 11 7
Harrison County 75 68 3 69 26 42
Biloxi 18 9 0 13 2 28
D’Iberville 14 4 0 2 20 4
Gulfport 35 28 3 51 0 4
Long Beach 4 5 0 1 0 3
Pass Christian 3 3 0 2 3 3
Unincorporated Area
1 19 0 0 1 0
Jackson County 50 75 7 27 3 56
Gautier 1 6 0 0 0 0
Moss Point 2 13 4 7 0 1
Ocean Springs 13 13 0 5 1 8
Pascagoula 6 24 0 5 0 33
Unincorporated Area
28 19 3 10 2 14
Pearl River County 8 0 5 0 1 9
Picayune 4 0 3 0 0 7
Poplarville 3 0 2 0 0 1
Unincorporated Area
1 0 0 0 1 1
Stone County 7 5 4 0 2 0
Wiggins 1 0 0 0 0 0
Unincorporated Area
6 5 4 0 2 0
MEMA DISTRICT 9 REGION TOTAL
170 175 20 109 44 128
Source: Local Governments

SECTION 6: VULNERABILITY ASSESSMENT
MEMA District 9 Regional Hazard Mitigation Plan DRAFT – February 2017
6:11
FIGURE 6.2: CRITICAL FACILITY LOCATIONS IN THE MEMA DISTRICT 9 REGION
Source: Local Governments
6.4.2 Social Vulnerability In addition to identifying those assets potentially at risk to identified hazards, it is important to identify and assess those particular segments of the resident population in the MEMA District 9 Region that are potentially at risk to these hazards.
Table 6.3 lists the population by county according to American Community Survey 2015 population estimates. The total population in the MEMA District 9 Region according to Census data is 478,849 persons. Additional population estimates are presented in Section 3: Community Profile.
TABLE 6.3: TOTAL POPULATION IN THE MEMA DISTRICT 9 REGION Location Total 2015 Population
George County 23,104
Hancock County 45,627
Harrison County 196,268
Jackson County 140,676

SECTION 6: VULNERABILITY ASSESSMENT
MEMA District 9 Regional Hazard Mitigation Plan DRAFT – February 2017
6:12
Location Total 2015 Population
Pearl River County 55,196
Stone County 17,978
MEMA DISTRICT 9 REGION TOTAL 478,849
Source: United States Census Bureau, 2011-2015 American Community Survey 5-Year Estimates
In addition, Figure 6.3 illustrates the population density per acre by census block as it was reported by the U.S. Census Bureau in 2010. As can be seen in the figure, the population is spread out through most of the region, with heavy concentrations in coastal communities like Gulfport, Biloxi, and Pascagoula.
FIGURE 6.3: POPULATION DENSITY IN THE MEMA DISTRICT 9 REGION
Source: United States Census Bureau, 2010 Census
6.4.3 Development Trends and Changes in Vulnerability Since the previous local-level hazard mitigation plans were approved, the MEMA District 9 Region has experienced moderate growth and development. Table 6.4 shows the number of building units constructed since 2010 according to the U.S. Census American Community Survey.

SECTION 6: VULNERABILITY ASSESSMENT
MEMA District 9 Regional Hazard Mitigation Plan DRAFT – February 2017
6:13
TABLE 6.4: BUILDING COUNTS FOR THE MEMA DISTRICT 9 REGION
Location 2010 2011 2012 2013 2014 2015 % Building Stock Built Post-2010
George County 9,073 9,215 9,273 9,298 9,342 9,355 3.1%
Lucedale 1,174 1,264 1,250 1,236 1,126 1,113 -5.2%
Unincorporated Area 7,899 7,951 8,023 8,062 8,216 8,242 4.3%
Hancock County 19,756 20,869 21,639 22,237 22,787 23,196 3.1%
Bay St. Louis 5,171 5,511 5,860 5,741 5,868 6,373 23.2%
Diamondhead* -- -- -- 4,330 4,113 4,104 -5.2%
Waveland 3,349 3,311 3,195 3,270 3,306 3,007 -10.2%
Unincorporated Area 15,172 15,055 15,013 10,794 10,995 10,939 -27.9%
Harrison County 80,275 83,011 85,048 86,438 87,824 88,821 10.6%
Biloxi 21,250 21,675 22,094 21,871 21,537 21,506 1.2%
D’Iberville 3,548 3,814 4,051 4,370 4,620 4,836 36.3%
Gulfport 29,619 30,293 31,556 32,092 32,878 33,421 12.8%
Long Beach 6,504 6,755 6,740 6,734 6,696 6,628 1.9%
Pass Christian 2,299 2,549 2,448 2,642 2,698 2,744 19.4%
Unincorporated Area 17,055 17,925 18,159 18,729 19,395 19,686 15.4%
Jackson County 57,995 59,216 59,811 60,237 60,649 60,889 5.0%
Gautier 7,507 7,748 7,886 8,034 8,113 8,180 9.0%
Moss Point 6,305 6,488 6,555 6,435 6,505 6,476 2.7%
Ocean Springs 7,246 7,482 7,628 7,892 7,880 7,625 5.2%
Pascagoula 10,803 10,935 10,696 10,813 10,574 10,891 0.8%
Unincorporated Area 26,134 26,563 27,046 27,063 27,577 27,717 6.1%
Pearl River County 23,692 23,877 24,068 24,135 24,282 24,423 3.1%
Picayune 5,106 4,901 4,864 4,850 4,785 4,854 -4.9%
Poplarville 937 1,108 1,095 1,063 1,021 1,006 7.4%
Unincorporated Area 17,649 17,868 18,109 18,222 18,476 18,563 5.2%
Stone County 6,881 7,048 7,087 7,144 7,192 7,216 4.9%
Wiggins 1,437 1,660 1,460 1,439 1,459 1,513 5.3%
Unincorporated Area 5,444 5,388 5,627 5,705 5,733 5,703 4.8%
MEMA DISTRICT 9 REGION TOTAL
197,672 203,236 206,926 209,489 212,076 213,900 8.2%
*Diamondhead officially incorporated into a city in 2012, so the city’s first housing estimate was not available until 2013. Percent change in population is calculated from 2013 to 2015. Source: United States Census Bureau, American Community Survey
Table 6.5 shows population growth estimates for the region from 2010 to 2015 based on the American Community Survey’s annual population estimates.
TABLE 6.5: POPULATION GROWTH FOR THE MEMA DISTRICT 9 REGION
Location Population Estimates % Change
2010-2015 2010 2011 2012 2013 2014 2015
George County 22,061 22,361 22,579 22,757 22,960 23,104 4.7%
Lucedale 2,934 2,936 2,943 2,959 2,978 2,993 2.0%

SECTION 6: VULNERABILITY ASSESSMENT
MEMA District 9 Regional Hazard Mitigation Plan DRAFT – February 2017
6:14
Location Population Estimates % Change
2010-2015 2010 2011 2012 2013 2014 2015
Unincorporated Area 19,127 19,425 19,636 19,798 19,982 20,111 5.1%
Hancock County 42,408 43,322 44,044 44,597 45,136 45,627 7.6%
Bay St. Louis 9,349 9,385 9,614 9,899 10,313 10,861 16.2%
Diamondhead* -- -- -- 8,777 8,275 8,246 -6.0%
Waveland 6,490 6,504 6,492 6,487 6,463 6,449 -0.6%
Unincorporated Area 26,569 27,433 27,938 19,434 20,085 20,071 -24.5%
Harrison County 181,791 185,120 188,110 190,756 193,642 196,268 8.0%
Biloxi 43,921 44,256 44,223 44,354 44,527 44,825 2.1%
D’Iberville 8,905 9,211 9,539 9,819 10,161 10,532 18.3%
Gulfport 66,286 67,322 68,158 69,004 69,913 70,462 6.3%
Long Beach 14,769 14,872 14,981 15,102 15,224 15,369 4.1%
Pass Christian 4,809 4,756 4,773 4,848 4,957 5,130 6.7%
Unincorporated Area 43,101 44,703 46,436 47,629 48,860 49,950 15.9%
Jackson County 137,082 138,511 139,430 139,906 140,194 140,676 2.6%
Gautier 18,088 18,344 18,502 18,539 18,581 18,563 2.6%
Moss Point 13,963 13,885 13,807 13,749 13,690 13,685 -2.0%
Ocean Springs 17,258 17,379 17,420 17,474 17,446 17,528 1.6%
Pascagoula 22,947 22,765 22,523 22,372 22,239 22,230 -3.1%
Unincorporated Area 64,826 66,138 67,178 67,772 68,238 68,670 5.9%
Pearl River County 55,923 56,042 55,886 55,569 55,293 55,196 -1.3%
Picayune 11,087 11,023 10,982 10,901 10,838 10,784 -2.7%
Poplarville 3,016 2,977 2,923 2,852 2,874 2,919 -3.2%
Unincorporated Area 41,820 42,042 41,981 41,816 41,581 41,493 -0.8%
Stone County 16,923 17,294 17,657 17,854 17,941 17,978 6.2%
Wiggins 4,281 4,237 4,399 4,446 4,463 4,487 4.8%
Unincorporated Area 12,642 13,057 13,258 13,408 13,478 13,491 6.7%
MEMA DISTRICT 9 REGION TOTAL
456,188 462,650 467,706 471,439 475,166 478,849 5.0%
*Diamondhead officially incorporated into a city in 2012, so the city’s first population estimate was not available until 2013. Percent change in population is calculated from 2013 to 2015. Source: United States Census Bureau, American Community Survey
Based on the data above, there has been a moderate rate of residential development and population growth in the region since 2010, and the majority of incorporated jurisdictions have experienced slight increases in population and housing development, resulting in an increased number of structures and people that are vulnerable to the potential impacts of the identified hazards. However, Diamondhead, Moss Point, Pascagoula, Picayune, and Poplarville have all experienced a slight decline in population since 2010 according to estimates. Additionally, there has been a slight decline in housing development since 2010 in Lucedale, Diamondhead, Waveland, and Picayune. Therefore, development and population growth have impacted the region’s vulnerability since the previous local hazard mitigation plans were approved and there has been an increase in the overall vulnerability. It is also important to note that as development increases in the future, greater populations and more structures and infrastructure will be exposed to potential hazards if development occurs in the floodplains or other identified areas of high risk.

SECTION 6: VULNERABILITY ASSESSMENT
MEMA District 9 Regional Hazard Mitigation Plan DRAFT – February 2017
6:15
6.5 VULNERABILITY ASSESSMENT RESULTS As noted earlier, only hazards with a specific geographic boundary, available modeling tool, or sufficient historical data allow for further analysis in this section. All other hazards are assumed to impact the entire planning region (e.g., drought) or, due to lack of data, analysis would not lead to credible results (e.g., infectious disease). The total region exposure, and thus risk to these hazards, was presented in Table 6.1. The hazards to be further analyzed in this section include: flood, wildfire, earthquake, hurricane and tropical storm winds and storm surge, hazardous materials incident, dam and levee failure, and sea level rise. The annualized loss estimate for all hazards is presented near the end of this section in Table 6.17.
6.5.1 Flood Historical evidence indicates that the MEMA District 9 Region is susceptible to flood events. A total of 168 flood events have been reported by the National Climatic Data Center resulting in around $12.2 million (2016 dollars) in property damage as well as 1 fatality. On an annualized level, these damages amounted to $787,125 for the MEMA District 9 Region. In order to assess flood risk, a GIS-based analysis was used to estimate exposure to flood events using Digital Flood Insurance Rate Map (DFIRM) data in combination with improved property records for each of the MEMA District 9 Counties. The determination of value at-risk (exposure) was calculated using GIS analysis by summing the values for improved properties that were located within an identified floodplain. In general, building footprint and parcel data were used in this analysis. However, in some communities, due to a lack of digital parcel data, it was determined that analysis using the inventory from Hazus-MH 3.2 would be used to supplement the building/parcel data. It should be noted that this data will merely be an estimation and may not reflect actual counts or values located in dam inundation areas. Indeed, in almost all cases, this data likely overestimates the amount of property in the identified risk zones. Table 6.6 shows the results of the analysis.
TABLE 6.6: ESTIMATED EXPOSURE OF PARCELS TO THE FLOOD HAZARD
Location
1.0-percent ACF 0.2-percent ACF VE Zone
Approx. Number
of Buildings
Approx. Improved Value
Approx. Number
of Buildings
Approx. Improved Value
Approx. Number
of Buildings
Approx. Improved
Value
George County* 6,339 $1,033,054,000 88 $16,456,000 0 $0
Lucedale 316 $69,124,000 0 $0 0 $0
Unincorporated Area
6,023 $963,930,000 88 $16,456,000 0 $0
Hancock County 15,299 $253,871,546 6,346 $162,854,221 1,160 $16,819,674

SECTION 6: VULNERABILITY ASSESSMENT
MEMA District 9 Regional Hazard Mitigation Plan DRAFT – February 2017
6:16
Location
1.0-percent ACF 0.2-percent ACF VE Zone
Approx. Number
of Buildings
Approx. Improved Value
Approx. Number
of Buildings
Approx. Improved Value
Approx. Number
of Buildings
Approx. Improved
Value
Bay St. Louis 1,047 $30,854,870 3,527 $77,458,001 123 $2,438,213
Diamondhead 676 $47,769,318 410 $36,591,925 39 $1,809,468
Waveland 2,698 $51,863,509 1,653 $38,060,990 200 $2,741,359
Unincorporated Area
10,878 $123,383,849 756 $10,743,305 798 $9,830,634
Harrison County 18,616 $1,079,262,581 17,040 $1,379,486,361 1,024 $716,263,348
Biloxi 6,417 $365,510,696 4,539 $407,939,146 222 $116,507,908
D’Iberville 1,230 $49,867,008 1,343 $116,368,166 52 $2,113,769
Gulfport 5,127 $379,135,841 7,802 $658,083,931 117 $82,687,105
Long Beach 863 $64,152,921 1,383 $92,278,737 40 $1,523,995
Pass Christian 2,534 $108,363,854 452 $22,954,189 199 $13,772,487
Unincorporated Area
2,445 $112,232,261 1,521 $81,862,192 394 $499,658,084
Jackson County 29,696 $1,529,616,550 24,391 $1,765,432,520 1,033 $84,580,080
Gautier 2,316 $118,332,200 4,728 $281,124,330 84 $7,279,640
Moss Point 3,119 $130,471,550 2,572 $132,822,500 55 $5,563,840
Ocean Springs 1,226 $154,955,040 5,987 $571,123,770 94 $12,202,880
Pascagoula 12,248 $644,004,050 2,804 $243,751,930 171 $13,956,290
Unincorporated Area
10,787 $481,853,710 8,300 $536,609,990 629 $45,577,430
Pearl River County* 3,856 $1,689,761,000 1,407 $603,178,000 0 $0
Picayune 576 $549,169,000 629 $394,185,000 0 $0
Poplarville 0 $0 0 $0 0 $0
Unincorporated Area
3,280 $1,140,592,000 778 $208,993,000 0 $0
Stone County 211 $4,120,088 0 $0 0 $0
Wiggins 12 $873,286 0 $0 0 $0
Unincorporated Area
199 $3,246,802 0 $0 0 $0
MEMA DISTRICT 9 REGION TOTAL
74,017 $5,589,685,765 49,272 $3,927,407,102 3,217 $817,663,102
* As noted above, building footprints and parcel data were not available for George County and parcel value data was not available for Pearl River County. As a result of this data limitation, at risk Census block building counts and values of the structures were used where necessary. Source: Federal Emergency Management Agency DFIRM, MDEQ, Hazus MH 3.2 Data
SOCIAL VULNERABILITY Figure 6.4 is presented to gain a better understanding of at-risk population by evaluating census block level population data against mapped floodplains. There are areas of concern in several of the municipal population centers in this region including all of the coastal communities. Indeed, nearly every incorporated municipality is potentially at risk of being impacted by flooding in some areas of its jurisdiction. Therefore, there is significant population vulnerability to flooding.

SECTION 6: VULNERABILITY ASSESSMENT
MEMA District 9 Regional Hazard Mitigation Plan DRAFT – February 2017
6:17
FIGURE 6.4 : POPULATION DENSITY NEAR FLOODPLAINS IN THE MEMA DISTRICT 9 REGION
Source: Federal Emergency Management Agency DFIRM, United States Census 2010
CRITICAL FACILITIES The critical facility analysis revealed that there are 225 facilities located in one of the identified floodplain zones. (Please note, as previously indicated, this analysis does not consider building elevation, which may negate risk.) Of these facilities, 196 are located in the 1.0 percent annual chance flood zone, 205 are located in the 0.2 percent annual chance flood zone, and 24 are located in a VE-zone. A list of specific critical facilities and their associated risk can be found in Table 6.18 at the end of this section.
In conclusion, a flood has the potential to impact many existing and future buildings, facilities, and populations in the MEMA District 9 Region, though some areas are at a higher risk than others. All types of structures in a floodplain are at-risk, though elevated structures will have a reduced risk. Such site-specific vulnerability determinations are outside the scope of this assessment but may be considered during future plan updates. Furthermore, areas subject to repetitive flooding should be analyzed for potential mitigation actions.

SECTION 6: VULNERABILITY ASSESSMENT
MEMA District 9 Regional Hazard Mitigation Plan DRAFT – February 2017
6:18
6.5.2 Wildfire Although historical evidence indicates that the MEMA District 9 Region is susceptible to wildfire events, there are few reports which include information on historic dollar losses. Therefore, it is difficult to calculate a reliable annualized loss figure. Annualized loss is considered relatively low, though it should be noted that a single event could result in significant damages throughout the region. In general, building footprint and parcel data were used in this analysis. However, in some communities, due to a lack of digital parcel data, it was determined that analysis using the inventory from Hazus-MH 3.2 would be used to supplement the building/parcel data. It should be noted that this data will merely be an estimation and may not reflect actual counts or values located in dam inundation areas. Indeed, in almost all cases, this data likely overestimates the amount of property in the identified risk zones. For the critical facility analysis, areas of concern were intersected with critical facility locations. Figure 6.5 shows the Wildland Urban Interface Risk Index (WUIRI) data, which is a data layer that shows a rating of the potential impact of a wildfire on people and their homes. The key input, Wildland Urban Interface (WUI), reflects housing density (houses per acre) consistent with Federal Register National standards. The location of people living in the WUI and rural areas is key information for defining potential wildfire impacts to people and homes. Initially provided as raster data, it was converted to a polygon to allow for analysis. The Wildland Urban Interface Risk Index data ranges from 0 to 7 with higher values being most severe (as noted previously, this is only a measure of relative risk). Figure 6.6 shows the areas of analysis where any grid cell is less than 3. Areas with a value below 3 were chosen to be displayed as areas of risk because this showed the upper echelon of the scale and the areas at highest risk. Table 6.7 shows the results of the analysis.

SECTION 6: VULNERABILITY ASSESSMENT
MEMA District 9 Regional Hazard Mitigation Plan DRAFT – February 2017
6:19
FIGURE 6.5: WUI RISK INDEX AREAS IN THE MEMA DISTRICT 9 REGION
Source: Southern Wildfire Risk Assessment Data

SECTION 6: VULNERABILITY ASSESSMENT
MEMA District 9 Regional Hazard Mitigation Plan DRAFT – February 2017
6:20
FIGURE 6.6: WILDFIRE RISK AREAS IN THE MEMA DISTRICT 9 REGION
Source: Southern Wildfire Risk Assessment Data
TABLE 6.7: EXPOSURE OF IMPROVED PROPERTY TO WILDFIRE RISK AREAS
Location
Wildfire Risk
Approx. Number of Buildings
Approx. Improved Value
George County* 9,548 $1,664,239,000
Lucedale 1,538 $335,976,000
Unincorporated Area 8,010 $1,328,263,000
Hancock County 29,075 $793,624,454
Bay St. Louis 4,266 $104,713,588
Diamondhead 4,438 $376,562,919
Waveland 4,601 $91,012,766
Unincorporated Area 15,770 $221,335,181
Harrison County 87,586 $4,359,508,991
Biloxi 14,782 $990,187,787
D’Iberville 4,036 $173,907,350
Gulfport 30,805 $1,630,516,790

SECTION 6: VULNERABILITY ASSESSMENT
MEMA District 9 Regional Hazard Mitigation Plan DRAFT – February 2017
6:21
Location
Wildfire Risk
Approx. Number of Buildings
Approx. Improved Value
Long Beach 7,348 $392,572,180
Pass Christian 3,413 $164,858,285
Unincorporated Area 27,202 $1,007,466,599
Jackson County 75,257 $3,977,525,960
Gautier 6,767 $362,594,440
Moss Point 9,227 $342,127,140
Ocean Springs 9,622 $850,642,070
Pascagoula 9,231 $541,505,990
Unincorporated Area 40,410 $1,880,656,320
Pearl River County* 29,749 $4,352,141,000
Picayune 6,411 $1,357,763,000
Poplarville 1,846 $319,907,000
Unincorporated Area 21,492 $2,674,471,000
Stone County 6,746 $192,683,090
Wiggins 2,664 $104,838,031
Unincorporated Area 4,082 $87,845,059
MEMA DISTRICT 9 REGION TOTAL
237,961 $15,339,722,495
* As noted above, building footprints and parcel data were not available for George County and parcel value data was not available for Pearl River County. As a result of this data limitation, at risk Census block building counts and values of the structures were used where necessary. Source: SWRA, MDEQ, Hazus MH 3.2 Data
SOCIAL VULNERABILITY Given some level of susceptibility across the entire MEMA District 9 Region, it is assumed that the total population is at risk to the wildfire hazard. Figure 6.7 shows an overlay of the wildfire risk areas identified above with the population density by census block. This shows that many of the areas of high population concentration are susceptible to wildfire because of their proximity to the wildland urban interface.

SECTION 6: VULNERABILITY ASSESSMENT
MEMA District 9 Regional Hazard Mitigation Plan DRAFT – February 2017
6:22
FIGURE 6.7: WILDFIRE RISK AREAS IN THE MEMA DISTRICT 9 REGION
Source: Southern Wildfire Risk Assessment Data; United States Census
CRITICAL FACILITIES The critical facility analysis revealed that there are 586 critical facilities located in wildfire areas of concern, including 9 communications, 6 EOCs, 99 fire stations, 15 medical, 25 police stations, 31 power/gas, 17 private/non-profit, 98 public facilities, 110 schools, 16 shelters, 68 special populations, 8 transportation, 84 water/wastewater. It should be noted, that several factors could impact the spread of a wildfire putting all facilities at risk. A list of specific critical facilities and their associated risk can be found in Table 6.18 at the end of this section. In conclusion, a wildfire event has the potential to impact many existing and future buildings, critical facilities, and populations in the MEMA District 9 Region.
6.5.3 Earthquake As the Hazus-MH model suggests below, and historical occurrences confirm, any earthquake activity in the area is likely to inflict only minor to moderate damage to the planning area. Hazus-MH 3.2 estimates

SECTION 6: VULNERABILITY ASSESSMENT
MEMA District 9 Regional Hazard Mitigation Plan DRAFT – February 2017
6:23
a total annualized loss of $187,000 which includes buildings, contents, and inventory throughout the planning area. For the earthquake hazard vulnerability assessment, a probabilistic scenario was created to estimate the average annualized loss2 for the region on a county by county basis. The results of the analysis are generated at the Census Tract level within Hazus-MH and then aggregated to the county level. Since the scenario is annualized, no building counts are provided. Losses reported included losses due to structure failure, building loss, contents damage, and inventory loss. They do not include losses to business interruption, lost income, or relocation. Table 6.8 summarizes the findings with results rounded to the nearest thousand.
TABLE 6.8: AVERAGE ANNUALIZED LOSS ESTIMATIONS FOR EARTHQUAKE HAZARD
Location Structural Damage
Non-Structural Damage
Contents Damage
Inventory Loss
Total Annualized Loss
George County $2,000 $5,000 $1,000 $0 $8,000
Hancock County $4,000 $9,000 $2,000 $0 $15,000
Harrison County $21,000 $51,000 $15,000 $0 $87,000
Jackson County $12,000 $29,000 $8,000 $0 $49,000
Pearl River County $5,000 $12,000 $3,000 $0 $20,000
Stone County $2,000 $5,000 $1,000 $0 $8,000
MEMA D9 REGION TOTAL
$46,000 $111,000 $30,000 $0 $187,000
Source: Hazus-MH 3.2
SOCIAL VULNERABILITY It can be assumed that all existing and future populations are at risk to the earthquake hazard. CRITICAL FACILITIES The Hazus-MH probabilistic analysis indicated that no critical facilities would sustain measurable damage in an earthquake event. However, all critical facilities should be considered at-risk to minor damage, should an event occur. Specific vulnerabilities for these assets will be greatly dependent on their individual design and the mitigation measures in place. Such site-specific vulnerability determinations are outside the scope of this assessment but will be considered during future plan updates. In conclusion, an earthquake has the potential to impact all existing and future buildings, facilities, and populations in the MEMA District 9 Region. The Hazus-MH scenario indicates that minimal to moderate damage is expected from an earthquake occurrence. While the MEMA District 9 Region may not experience a large earthquake, localized damage is possible with an occurrence. A list of specific critical facilities and their associated risk can be found in Table 6.18 at the end of this section.
2 Annualized loss is defined by Hazus-MH as the expected value of loss in any one year.

SECTION 6: VULNERABILITY ASSESSMENT
MEMA District 9 Regional Hazard Mitigation Plan DRAFT – February 2017
6:24
6.5.4 Hurricane and Tropical Storm Historical evidence indicates that the MEMA District 9 Region has very significant risk to the hurricane and tropical storm hazard. There have been 12 disaster declarations due to hurricanes or tropical storms (Hurricanes Betsy, Camille, Frederic, Elena, Georges, Ivan, Dennis, Katrina, Gustav, and Isaac, as well as Tropical Storms Allison and Isidore). A large number tracks have come near or traversed through the MEMA District 9 Region, as shown and discussed in Section 5: Hazard Profiles. Hazus-MH 3.2 estimates a total annualized loss of $307,250,000 which includes buildings, contents, and inventory throughout the planning area.
HURRICANE WINDS Hurricanes and tropical storms can cause damage through numerous additional hazards such as flooding, erosion, tornadoes, and high winds, thus it is difficult to estimate total potential losses from these cumulative effects. The current Hazus-MH hurricane model only analyzes hurricane winds and storm surge and is not capable of modeling and estimating cumulative losses from all hazards associated with hurricanes; therefore, only these two aspects of hurricane losses are analyzed in this section. It can be assumed that all existing and future buildings and populations are at risk to hurricane and tropical storm wind hazard. Hazus-MH 3.2 was used to determine average annualized losses3 for the region as shown below in Table 6.9. Only losses to buildings, inventory, and contents are included in the results.
TABLE 6.9: AVERAGE ANNUALIZED LOSS ESTIMATIONS FOR HURRICANE WIND HAZARD
Location Building Damage
Contents Damage
Inventory Loss Total Annualized
Loss
George County $4,776,000 $1,959,000 $16,000 $6,751,000
Hancock County $13,931,000 $5,455,000 $37,000 $19,423,000
Harrison County $111,346,000 $50,844,000 $461,000 $162,651,000
Jackson County $70,481,000 $31,767,000 $307,000 $102,555,000
Pearl River County $7,495,000 $3,020,000 $26,000 $10,541,000
Stone County $3,629,000 $1,683,000 $17,000 $5,329,000
MEMA D9 REGION TOTAL
$211,658,000 $94,728,000 $864,000 $307,250,000
Source: Hazus-MH 3.2
STORM SURGE In addition, although it was treated as a separate hazard throughout this plan, storm surge is most often associated with hurricanes and tropical storms. Indeed, Hazus incorporates the storm surge model for estimating damage from storm surge as part of the hurricane model. The storm surge model can only be run as part of a historic hurricane model run and not as part of an annualized loss model. Unfortunately, in this model, storm surge impacts are calculated as part of the total damage from the historic event and thus could not be separated out and evaluated solely in terms of storm surge loss. As such, the estimated losses presented below are combined losses from hurricane winds and storm surge. The historic Hurricane Katrina model was utilized as this was certainly one of the most impactful storms in
3 Annualized loss is defined by Hazus-MH as the expected value of loss in any one year.
SECTION 6: VULNERABILITY ASSESSMENT
MEMA District 9 Regional Hazard Mitigation Plan DRAFT – February 2017
6:25
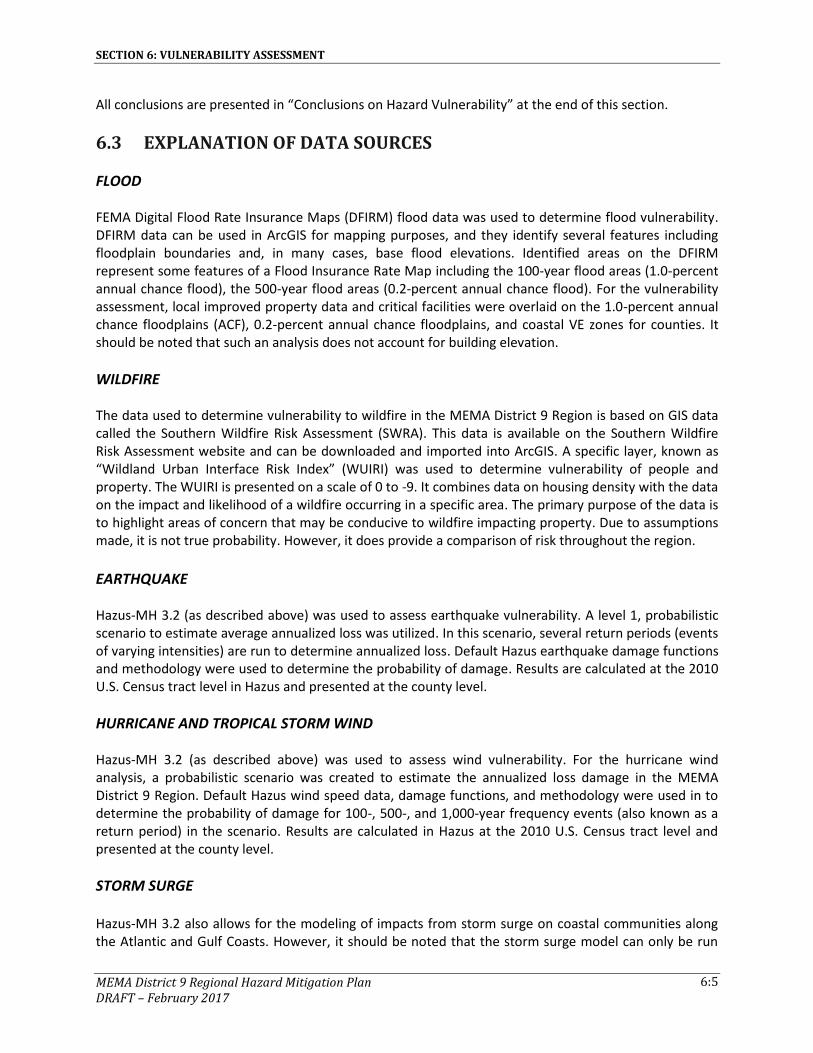
the region and therefore estimates the potential losses that are possible from a large hurricane event. Table 6.10 presents the losses from this modeled event.
TABLE 6.10: POTENTIAL LOSS ESTIMATIONS FOR LARGE HURRICANE EVENT
Location Building Damage
Contents Damage
Inventory Loss Total Annualized
Loss
George County $33,209,000 $10,744,000 $73,000 $44,026,000
Hancock County $279,895,000 $95,284,000 $600,000 $375,779,000
Harrison County $2,064,136,000 $862,483,000 $7,187,000 $2,933,806,000
Jackson County $381,792,000 $142,547,000 $605,000 $524,944,000
Pearl River County $205,561,000 $75,831,000 $628,000 $282,020,000
Stone County $88,416,000 $39,047,000 $495,000 $127,958,000
MEMA D9 REGION TOTAL
$3,053,009,000 $1,225,936,000 $9,588,000 $4,288,533,000
Source: Hazus-MH 3.2
SOCIAL VULNERABILITY Given equal susceptibility across the entire MEMA District 9 Region, it is assumed that the total population, both current and future, is at risk to the hurricane and tropical storm wind hazard. In terms of social vulnerability to storm surge, coastal populations are at much higher risk than inland populations. Since large concentrations of population are located along the coast of the MEMA District 9 Region, there is significant social vulnerability to storm surge in the region.
CRITICAL FACILITIES Given equal vulnerability across the MEMA District 9 Region, all critical facilities are considered to be at risk. Some buildings may perform better than others in the face of such an event due to construction and age, among factors. Determining individual building response to wind and storm surge is beyond the scope of this plan. However, this plan will consider mitigation action for especially vulnerable structures and/or critical facilities to mitigate against the effects of the hurricane hazard. A list of specific critical facilities can be found in Table 6.18 at the end of this section. In conclusion, a hurricane event has the potential to impact many existing and future buildings, critical facilities, and populations in the MEMA District 9 Region.
6.5.5 Hazardous Materials Incident Historical evidence indicates that the MEMA District 9 Region is susceptible to hazardous materials events. A total of 473 HAZMAT incidents have been reported by the Pipeline and Hazardous Materials Safety Administration, resulting in $2,134,323 (2016 dollars) in property damage as well as 5 deaths and 21 injuries. On an annualized level, these damages amount to $47,429 for the region. Most hazardous materials incidents that occur are contained and suppressed before destroying any property or threatening lives. However, they can have a significant negative impact. Such events can cause multiple deaths, completely shut down facilities, and cause affected properties to be destroyed or

SECTION 6: VULNERABILITY ASSESSMENT
MEMA District 9 Regional Hazard Mitigation Plan DRAFT – February 2017
6:26
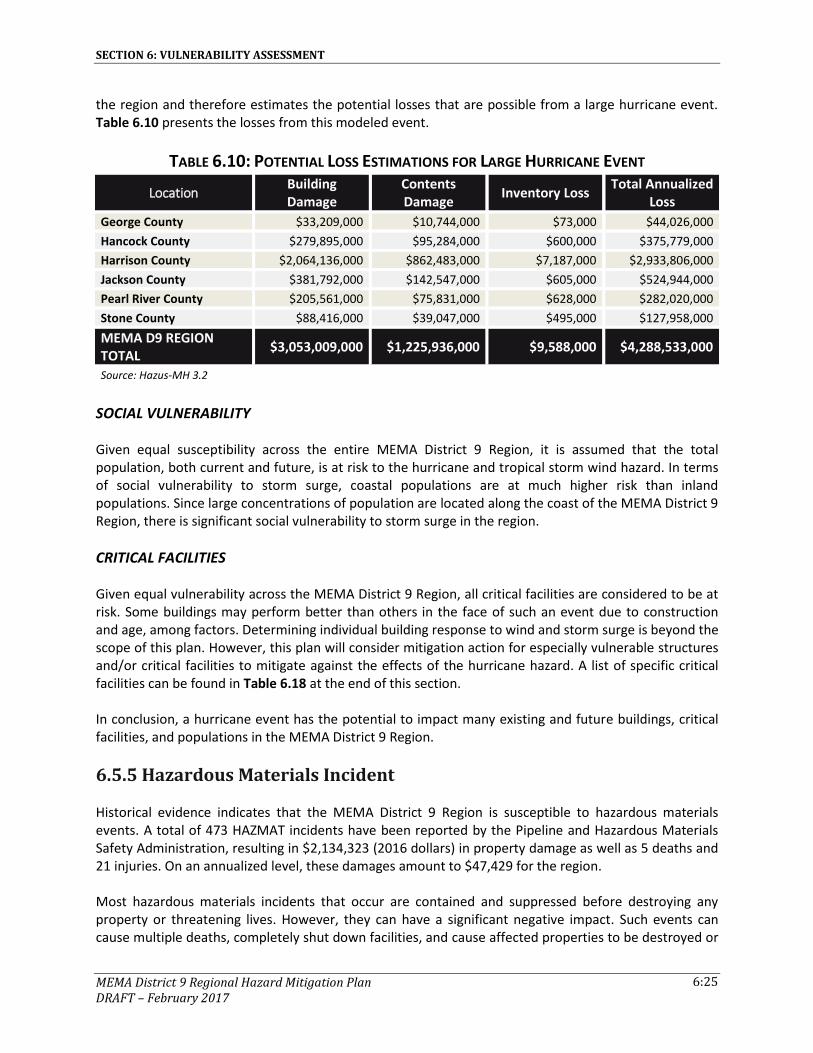
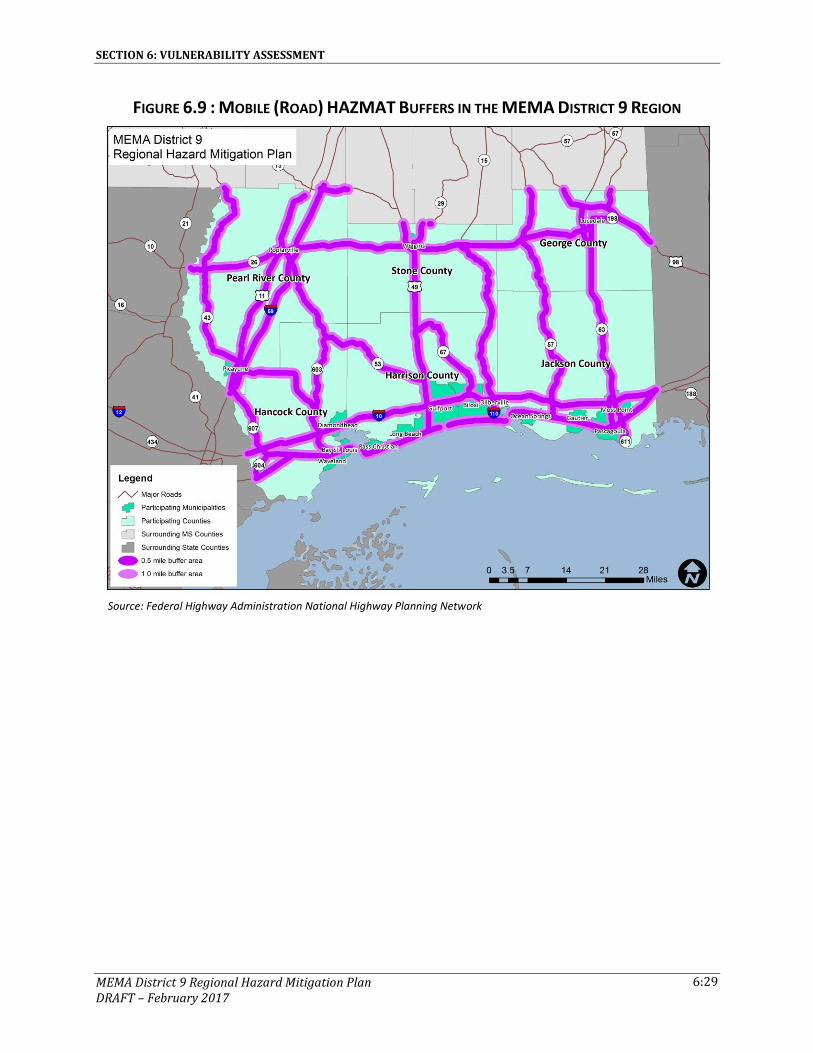
suffer major damage. In a hazardous materials incident, solid, liquid, and/or gaseous contaminants may be released from fixed or mobile containers. Weather conditions will directly affect how the hazard develops. Certain chemicals may travel through the air or water, affecting a much larger area than the point of the incidence itself. Non-compliance with fire and building codes, as well as failure to maintain existing fire and containment features, can substantially increase the damage from a hazardous materials release. The duration of a hazardous materials incident can range from hours to days. Warning time is minimal to none. In order to conduct the vulnerability assessment for this hazard, GIS intersection analysis was used for fixed and mobile areas and building footprints/parcels where available and Census block data where footprints/parcels were not available.4 In both scenarios, two sizes of buffers—0.5-mile and 1.0-mile—were used. These areas are assumed to represent the different levels of effect: immediate (primary) and secondary. Primary and secondary impact zones were selected based on guidance from the PHMSA Emergency Response Guidebook. For the fixed site analysis, geo-referenced TRI sites in the region, along with buffers, were used for analysis as shown in Figure 6.8. For the mobile analysis, the major roads (Interstate highway, U.S. highway, and State highway) and railroads, where hazardous materials are primarily transported that could adversely impact people and buildings, were used for the GIS buffer analysis. Figure 6.9 shows the areas used for mobile road toxic release buffer analysis and Figure 6.10 shows the areas used for the mobile railroad toxic release buffer analysis. The results indicate the approximate number of improved properties and improved value, as shown in Table 6.11 (fixed sites), Table 6.12 (mobile roads), and Table 6.13 (mobile railroads).5
4 This type of analysis will likely yield inflated results (generally higher than what is actually reported after an actual event). 5 Note that improved properties included in the 1.0-mile analysis are also included in the 0.5-mile analysis.
SECTION 6: VULNERABILITY ASSESSMENT
MEMA District 9 Regional Hazard Mitigation Plan DRAFT – February 2017
6:27
FIGURE 6.8 : TRI SITES WITH BUFFERS IN THE MEMA DISTRICT 9 REGION
Source: Environmental Protection Agency
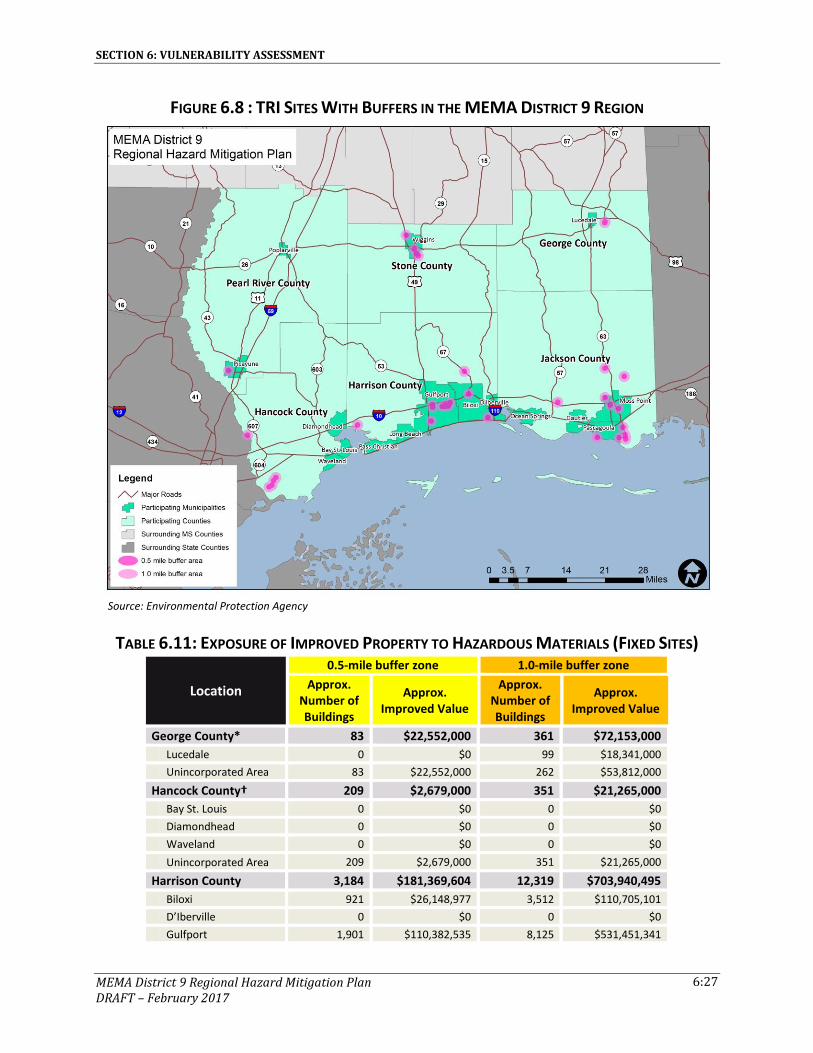
TABLE 6.11: EXPOSURE OF IMPROVED PROPERTY TO HAZARDOUS MATERIALS (FIXED SITES)
Location
0.5-mile buffer zone 1.0-mile buffer zone
Approx. Number of Buildings
Approx. Improved Value
Approx. Number of Buildings
Approx. Improved Value
George County* 83 $22,552,000 361 $72,153,000
Lucedale 0 $0 99 $18,341,000
Unincorporated Area 83 $22,552,000 262 $53,812,000
Hancock County† 209 $2,679,000 351 $21,265,000
Bay St. Louis 0 $0 0 $0
Diamondhead 0 $0 0 $0
Waveland 0 $0 0 $0
Unincorporated Area 209 $2,679,000 351 $21,265,000
Harrison County 3,184 $181,369,604 12,319 $703,940,495
Biloxi 921 $26,148,977 3,512 $110,705,101
D’Iberville 0 $0 0 $0
Gulfport 1,901 $110,382,535 8,125 $531,451,341
SECTION 6: VULNERABILITY ASSESSMENT
MEMA District 9 Regional Hazard Mitigation Plan DRAFT – February 2017
6:28
Location
0.5-mile buffer zone 1.0-mile buffer zone
Approx. Number of Buildings
Approx. Improved Value
Approx. Number of Buildings
Approx. Improved Value
Long Beach 0 $0 0 $0
Pass Christian 0 $0 0 $0
Unincorporated Area 362 $44,838,092 682 $61,784,053
Jackson County 2,554 $89,327,840 8,251 $322,232,380
Gautier 0 $0 0 $0
Moss Point 583 $19,614,990 1,818 $74,425,480
Ocean Springs 0 $0 0 $0
Pascagoula 1,003 $39,815,600 3,902 $180,770,120
Unincorporated Area 968 $29,897,250 2,531 $67,036,780
Pearl River County* 489 $106,765,000 2,265 $412,547,000
Picayune 489 $106,765,000 2,196 $399,979,343
Poplarville 0 $0 0 $0
Unincorporated Area 0 $0 69 $12,567,657
Stone County 467 $21,538,732 1,859 $70,803,546
Wiggins 387 $17,016,665 1,349 $56,455,906
Unincorporated Area 80 $4,522,067 510 $14,347,640
MEMA DISTRICT 9 REGION TOTAL
6,986 $424,232,176 25,406 $1,602,941,421
* As noted above, building footprints and parcel data were not available for George County and parcel value data was not available for Pearl River County. As a result of this data limitation, at risk Census block building counts and values of the structures were used where necessary. †A small area of the Hancock County parcel data does not contain dollar values. Upon examination of the data, these parcels do have structures located on them. As such, Census Block estimates for values were used in this case. Source: EPA, MDEQ, Hazus MH 3.2 Data
SECTION 6: VULNERABILITY ASSESSMENT
MEMA District 9 Regional Hazard Mitigation Plan DRAFT – February 2017
6:29
FIGURE 6.9 : MOBILE (ROAD) HAZMAT BUFFERS IN THE MEMA DISTRICT 9 REGION
Source: Federal Highway Administration National Highway Planning Network

SECTION 6: VULNERABILITY ASSESSMENT
MEMA District 9 Regional Hazard Mitigation Plan DRAFT – February 2017
6:30
FIGURE 6.10 : MOBILE (RAIL) HAZMAT BUFFERS IN THE MEMA DISTRICT 9 REGION
Source: U.S. Department of Transportation Federal Railroad Administration
TABLE 6.12: EXPOSURE OF IMPROVED PROPERTY TO HAZARDOUS MATERIALS SPILL (MOBILE ANALYSIS - ROAD)
Location
0.5-mile buffer zone 1.0-mile buffer zone
Approx. Number of Buildings
Approx. Improved Value
Approx. Number of Buildings
Approx. Improved Value
George County* 5,153 $987,684,000 6,279 $1,175,140,000
Lucedale 1,351 $306,348,000 1,538 $335,976,000
Unincorporated Area
3,802 $681,336,000 4,741 $839,164,000
Hancock County 14,905 $316,655,664 24,394 $593,991,975
Bay St. Louis 3,091 $73,331,871 5,153 $115,765,377
Diamondhead 1,144 $94,088,219 2,515 $232,470,277
Waveland 1,553 $26,881,381 2,902 $57,568,580
Unincorporated Area
9,117 $122,354,193 13,824 $188,187,741
Harrison County 39,552 $2,649,073,410 71,896 $4,093,838,350
Biloxi 8,799 $682,254,259 15,629 $1,016,578,586

SECTION 6: VULNERABILITY ASSESSMENT
MEMA District 9 Regional Hazard Mitigation Plan DRAFT – February 2017
6:31
Location
0.5-mile buffer zone 1.0-mile buffer zone
Approx. Number of Buildings
Approx. Improved Value
Approx. Number of Buildings
Approx. Improved Value
D’Iberville 3,119 $166,129,238 4,714 $228,825,255
Gulfport 14,873 $858,010,293 27,596 $1,412,706,984
Long Beach 2,056 $104,404,162 4,838 $226,495,377
Pass Christian 1,761 $78,050,457 3,009 $128,363,439
Unincorporated Area
8,944 $760,225,001 16,110 $1,080,868,709
Jackson County 30,471 $1,710,795,370 53,653 $2,859,260,310
Gautier 2,038 $128,322,620 3,973 $231,157,040
Moss Point 6,704 $250,007,730 10,082 $360,729,220
Ocean Springs 6,109 $560,929,950 9,412 $825,611,110
Pascagoula 4,913 $365,649,400 9,604 $599,308,610
Unincorporated Area
10,707 $405,885,670 20,582 $842,454,330
Pearl River County* 20,861 $3,111,426,000 30,502 $3,632,518,000
Picayune 4,438 $1,133,195,000 5,927 $1,244,649,000
Poplarville 1,941 $315,740,000 1,964 $321,992,000
Unincorporated Area
14,482 $1,662,491,000 22,611 $2,065,877,000
Stone County 6,348 $178,594,920 8,927 $243,035,752
Wiggins 2,630 $106,292,189 3,183 $126,862,624
Unincorporated Area
3,718 $72,302,731 5,744 $116,173,128
MEMA DISTRICT 9 REGION TOTAL
117,290 $8,954,229,364 195,651 $12,597,784,387
* As noted above, building footprints and parcel data were not available for George County and parcel value data was not available for Pearl River County. As a result of this data limitation, at risk Census block building counts and values of the structures were used where necessary. Source: NHPN, MDEQ, Hazus MH 3.2 Data
TABLE 6.13: EXPOSURE OF IMPROVED PROPERTY TO HAZARDOUS MATERIALS SPILL (MOBILE ANALYSIS - RAILROAD)
Location
0.5-mile buffer zone 1.0-mile buffer zone
Approx. Number of Buildings
Approx. Improved Value
Approx. Number of Buildings
Approx. Improved Value
George County* 2,497 $464,854,000 3,409 $646,775,000
Lucedale 457 $115,711,000 864 $210,193,000
Unincorporated Area
2,040 $349,143,000 2,545 $436,582,000
Hancock County 5,779 $97,328,276 9,363 $165,995,878
Bay St. Louis 2,602 $50,395,193 4,125 $81,202,156
Diamondhead 0 $0 0 $0
Waveland 2,093 $41,357,755 3,346 $70,790,946
Unincorporated Area
1,084 $5,575,328 1,892 $14,002,776

SECTION 6: VULNERABILITY ASSESSMENT
MEMA District 9 Regional Hazard Mitigation Plan DRAFT – February 2017
6:32
Location
0.5-mile buffer zone 1.0-mile buffer zone
Approx. Number of Buildings
Approx. Improved Value
Approx. Number of Buildings
Approx. Improved Value
Harrison County 32,551 $2,011,623,453 52,255 $2,011,623,453
Biloxi 8,278 $464,061,769 12,404 $464,061,769
D’Iberville 0 $0 0 $0
Gulfport 15,657 $873,267,174 26,556 $873,267,174
Long Beach 4,006 $183,255,865 5,514 $183,255,865
Pass Christian 2,484 $96,055,588 3,079 $96,055,588
Unincorporated Area
2,126 $394,983,057 4,702 $394,983,057
Jackson County 22,962 $1,317,989,340 41,658 $2,279,194,530
Gautier 2,105 $96,599,920 4,241 $229,056,300
Moss Point 4,380 $143,660,210 8,047 $285,876,040
Ocean Springs 5,349 $502,955,290 9,255 $811,896,650
Pascagoula 5,903 $415,698,900 11,166 $649,874,460
Unincorporated Area
5,225 $159,075,020 8,949 $302,491,080
Pearl River County* 10,128 $1,651,755,000 15,569 $2,253,555,000
Picayune 3,863 $855,158,000 5,742 $1,159,817,000
Poplarville 1,163 $189,638,000 1,704 $287,734,000
Unincorporated Area
5,102 $606,959,000 8,123 $806,004,000
Stone County 3,396 $98,682,350 5,074 $154,641,393
Wiggins 1,729 $62,551,284 2,535 $102,100,359
Unincorporated Area
1,667 $36,131,066 2,539 $52,541,034
MEMA DISTRICT 9 REGION TOTAL
77,313 $5,642,232,419 127,328 $7,511,785,254
* As noted above, building footprints and parcel data were not available for George County and parcel value data was not available for Pearl River County. As a result of this data limitation, at risk Census block building counts and values of the structures were used where necessary. Source: USDOT FRA, MDEQ, Hazus MH 3.2 Data
SOCIAL VULNERABILITY Given high susceptibility across the entire MEMA District 9 Region, it is assumed that the total population is at risk to a hazardous materials incident. It should be noted that areas of population concentration may be at an elevated risk due to a greater burden to evacuate population quickly.
CRITICAL FACILITIES Fixed Site Analysis: The critical facility analysis for fixed TRI sites revealed that there are 103 facilities located in a fixed HAZMAT risk zone. Of these, 28 facilities are in the primary (0.5 mile) risk area including 1 fire station, 1 medical, 1 police station, 5 power/gas, 4 private/non-profit, 3 public facilities, 4 schools, 3 special populations, and 6 water/wastewater. A list of specific critical facilities and their associated risk can be found in Table 6.18 at the end of this section.

SECTION 6: VULNERABILITY ASSESSMENT
MEMA District 9 Regional Hazard Mitigation Plan DRAFT – February 2017
6:33
Mobile Analysis: The critical facility analysis for transportation corridors revealed that there are 707 facilities located in the primary and secondary road HAZMAT buffer areas. There were 514 critical facilities located in the primary risk zone. For the rail line buffer areas, there were a total of 560 critical facilities located in primary and secondary buffer areas. Of these, 371 facilities are located within the primary buffer area. A list of specific critical facilities and their associated risk can be found in Table 6.18 at the end of this section. In conclusion, a hazardous material incident has the potential to impact many existing and future buildings, critical facilities, and populations in the MEMA District 9 Region. Those areas in a primary buffer are at the highest risk, though all areas carry some vulnerability due to variations in condition that could alter the impact area (i.e., direction and speed of wind, volume of release, etc.).
6.5.6 Dam/Levee Failure In order to assess risk to a dam or levee failure, a GIS-based analysis was used to estimate exposure to one of the areas delineated by the Mississippi Department of Environmental Quality as a potential inundation area in the event of a failure. The determination of value at-risk (exposure) was calculated using GIS analysis by summing the values for improved properties that were located within an identified inundation area. As mentioned previously, this type of inundation mapping has not been completed for every dam/levee in the region, so the results of this analysis likely underestimate the overall vulnerability to a dam or levee failure. However, the analysis is still useful as a sort of baseline minimum of property that is potentially at-risk. The identified inundation areas can be found in Figure 6.11. In general, building footprint and parcel data were used in this analysis. However, in some communities, due to a lack of digital parcel data, it was determined that analysis using the inventory from Hazus-MH 3.2 would be used to supplement the building/parcel data. It should be noted that this data will merely be an estimation and may not reflect actual counts or values located in dam inundation areas. Indeed, in almost all cases, this data likely overestimates the amount of property in the identified risk zones. Table 6.14 presents the potential at-risk property. Both the number of buildings and the approximate improved value are presented.

SECTION 6: VULNERABILITY ASSESSMENT
MEMA District 9 Regional Hazard Mitigation Plan DRAFT – February 2017
6:34
FIGURE 6.11: DAM INUNDATION AREAS IN THE MEMA DISTRICT 9 REGION
Source: Mississippi Department of Environmental Quality
TABLE 6.14: ESTIMATED EXPOSURE OF IMPROVEMENTS TO THE DAM/LEVEE FAILURE HAZARD
Location
Dam Inundation Area
Approx. Number of Buildings
Approx. Improved Value
George County* 0 $0
Lucedale 0 $0
Unincorporated Area 0 $0
Hancock County 92 $1,852,055
Bay St. Louis 0 $0
Diamondhead 0 $0
Waveland 0 $0
Unincorporated Area 92 $1,852,055
Harrison County 0 $0
Biloxi 0 $0
D’Iberville 0 $0
Gulfport 0 $0

SECTION 6: VULNERABILITY ASSESSMENT
MEMA District 9 Regional Hazard Mitigation Plan DRAFT – February 2017
6:35
Location
Dam Inundation Area
Approx. Number of Buildings
Approx. Improved Value
Long Beach 0 $0
Pass Christian 0 $0
Unincorporated Area 0 $0
Jackson County† 1 $0
Gautier 0 $0
Moss Point 0 $0
Ocean Springs 0 $0
Pascagoula 0 $0
Unincorporated Area 1 $0
Pearl River County* 86 $70,289,000
Picayune 0 $0
Poplarville 0 $0
Unincorporated Area 86 $70,289,000
Stone County 29 $1,150,188
Wiggins 18 $808,698
Unincorporated Area 11 $341,490
MEMA DISTRICT 9 REGION TOTAL
208 $73,291,243
* As noted above, building footprints and parcel data were not available for George County and parcel value data was not available for Pearl River County. As a result of this data limitation, at risk Census block building counts and values of the structures were used where necessary. †This does not include areas that would be inundated by the Big Creek Lake Dam, located in Alabama as geospatial data for the inundation area was not available. Source: MDEQ, Hazus 3.2
SOCIAL VULNERABILITY Figure 6.12 is presented to gain a better understanding of at-risk population by evaluating census block level population data against dam inundation areas. There are areas of concern in several of the counties in this region, although it should be noted that most of the population of the region is not at risk to a dam/levee failure.

SECTION 6: VULNERABILITY ASSESSMENT
MEMA District 9 Regional Hazard Mitigation Plan DRAFT – February 2017
6:36
FIGURE 6.12: POPULATION DENSITY NEAR DAM INUNDATION AREAS IN THE MEMA DISTRICT 9 REGION
Source: MDEQ, United States Census 2010
CRITICAL FACILITIES The critical facility analysis revealed that there are 2 facilities located in dam inundation areas. One of these facilities is a dam itself in Stone County, so it is not surprising that it is located in the inundation area. The other facility is a fire station in Pearl River County. A list of specific critical facilities and their associated risk can be found in Table 6.18 at the end of this section. In conclusion, a dam has the potential to impact a number of existing and future buildings, facilities, and populations in the MEMA District 9 Region, though this analysis is not all-encompassing in terms of risk to a dam or levee failure because inundation mapping is not available for all dams in the region.
6.5.7 Climate Change/Sea Level Rise Most assessments carried out across the globe have concluded that climate change is a phenomenon that will impact our planet in the foreseeable future. Among others, the National Climate Assessment, International Panel on Climate Change, and National Oceanic and Atmospheric Administration all project
SECTION 6: VULNERABILITY ASSESSMENT
MEMA District 9 Regional Hazard Mitigation Plan DRAFT – February 2017
6:37
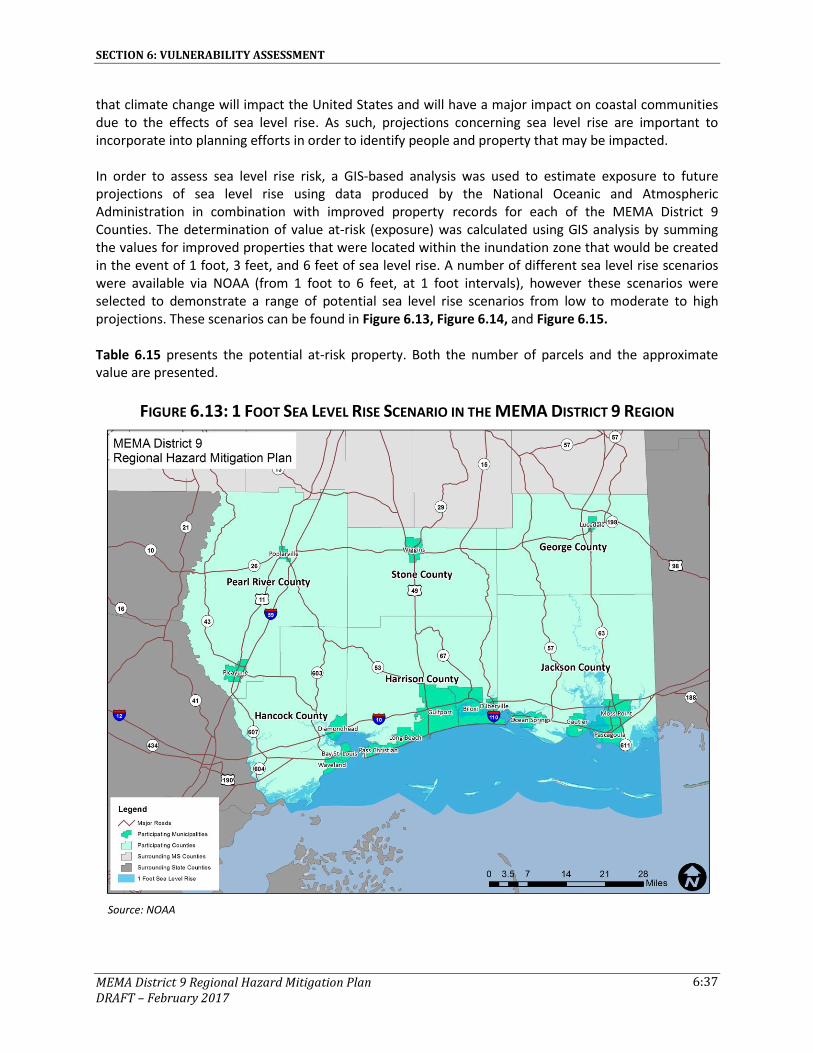
that climate change will impact the United States and will have a major impact on coastal communities due to the effects of sea level rise. As such, projections concerning sea level rise are important to incorporate into planning efforts in order to identify people and property that may be impacted. In order to assess sea level rise risk, a GIS-based analysis was used to estimate exposure to future projections of sea level rise using data produced by the National Oceanic and Atmospheric Administration in combination with improved property records for each of the MEMA District 9 Counties. The determination of value at-risk (exposure) was calculated using GIS analysis by summing the values for improved properties that were located within the inundation zone that would be created in the event of 1 foot, 3 feet, and 6 feet of sea level rise. A number of different sea level rise scenarios were available via NOAA (from 1 foot to 6 feet, at 1 foot intervals), however these scenarios were selected to demonstrate a range of potential sea level rise scenarios from low to moderate to high projections. These scenarios can be found in Figure 6.13, Figure 6.14, and Figure 6.15. Table 6.15 presents the potential at-risk property. Both the number of parcels and the approximate value are presented.
FIGURE 6.13: 1 FOOT SEA LEVEL RISE SCENARIO IN THE MEMA DISTRICT 9 REGION
Source: NOAA
SECTION 6: VULNERABILITY ASSESSMENT
MEMA District 9 Regional Hazard Mitigation Plan DRAFT – February 2017
6:38
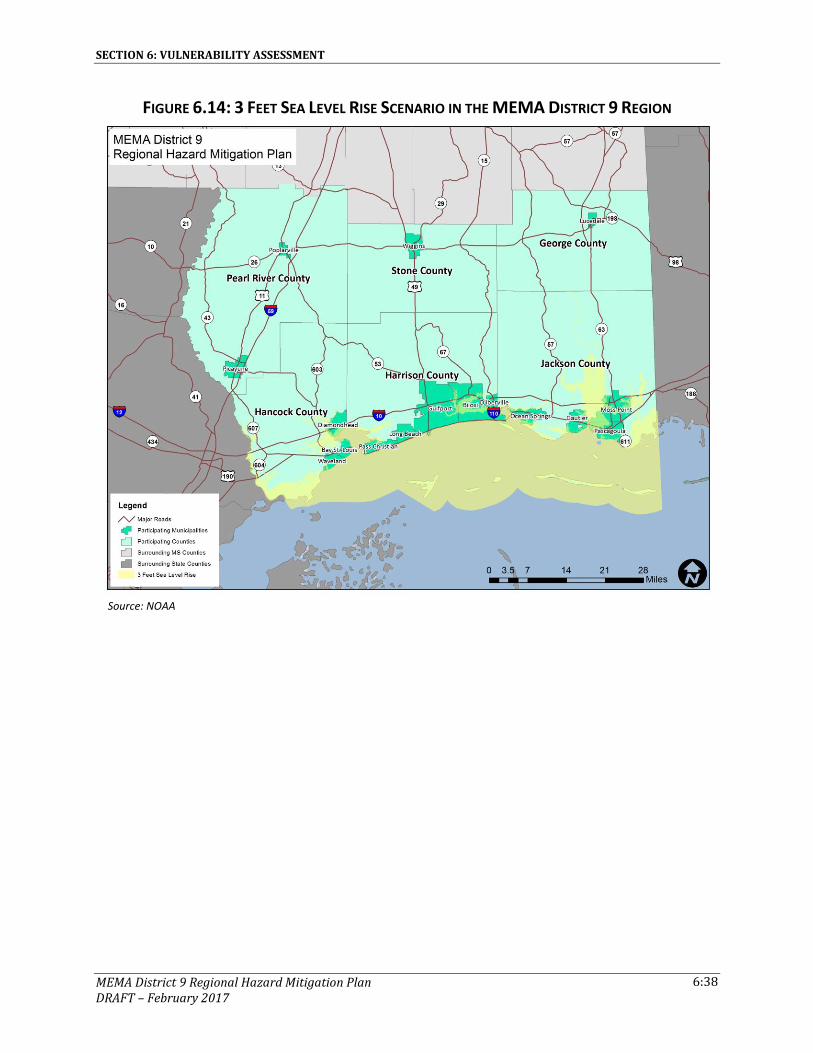
FIGURE 6.14: 3 FEET SEA LEVEL RISE SCENARIO IN THE MEMA DISTRICT 9 REGION
Source: NOAA

SECTION 6: VULNERABILITY ASSESSMENT
MEMA District 9 Regional Hazard Mitigation Plan DRAFT – February 2017
6:39
FIGURE 6.15: 6 FEET SEA LEVEL RISE SCENARIO IN THE MEMA DISTRICT 9 REGION
Source: NOAA
TABLE 6.15: ESTIMATED EXPOSURE OF PARCELS TO THE SEA LEVEL RISE HAZARD
Location
1.0 foot 3.0 feet 6.0 feet
Approx. Number
of Buildings
Approx. Improved
Value
Approx. Number
of Buildings
Approx. Improved
Value
Approx. Number
of Buildings
Approx. Improved Value
George County* 11 $2,708,000 11 $2,708,000 11 $2,708,000
Lucedale 0 0 0 0 0 0
Unincorporated Area
11 $2,708,000 11 $2,708,000 11 $2,708,000
Hancock County 248 $6,391,403 2,755 $43,175,392 5,357 $78,630,485
Bay St. Louis 0 $0 7 $282,410 61 $1,200,443
Diamondhead 30 $2,087,223 52 $3,752,217 115 $8,691,488
Waveland 0 $0 0 $0 36 $264,371
Unincorporated Area
248 $6,391,403 2,748 $42,892,982 5,296 $77,430,042
Harrison County 406 $628,588,092 740 $658,601,989 2,446 $838,354,843
Biloxi 141 $152,875,152 217 $160,571,178 574 $253,581,853

SECTION 6: VULNERABILITY ASSESSMENT
MEMA District 9 Regional Hazard Mitigation Plan DRAFT – February 2017
6:40
Location
1.0 foot 3.0 feet 6.0 feet
Approx. Number
of Buildings
Approx. Improved
Value
Approx. Number
of Buildings
Approx. Improved
Value
Approx. Number
of Buildings
Approx. Improved Value
D’Iberville 3 $88,805 3 $88,805 37 $3,062,657
Gulfport 104 $13,795,779 202 $20,682,997 542 $52,554,190
Long Beach 0 $0 0 $0 0 $0
Pass Christian 36 $3,060,166 122 $11,788,951 701 $46,934,462
Unincorporated Area
265 $475,712,940 523 $498,030,811 1,872 $584,772,990
Jackson County 919 $63,575,980 2,417 $174,291,150 7,501 $374,562,550
Gautier 110 $8,651,090 371 $29,086,520 773 $49,712,830
Moss Point 71 $5,883,400 244 $17,686,870 1,550 $56,765,010
Ocean Springs 49 $12,727,870 118 $24,058,690 278 $47,884,160
Pascagoula 65 $6,319,600 245 $28,427,260 1,102 $73,423,870
Unincorporated Area
809 $54,924,890 2,046 $145,204,630 6,728 $324,849,720
Pearl River County* 0 $0 0 $0 0 $0
Picayune 0 $0 0 $0 0 $0
Poplarville 0 $0 0 $0 0 $0
Unincorporated Area
0 $0 0 $0 0 $0
Stone County 0 $0 0 $0 0 $0
Wiggins 0 $0 0 $0 0 $0
Unincorporated Area
0 $0 0 $0 0 $0
MEMA DISTRICT 9 REGION TOTAL
1,584 $701,263,475 5,923 $878,776,531 $15,315 $1,294,255,878
* As noted above, building footprints and parcel data were not available for George County and parcel value data was not available for Pearl River County. As a result of this data limitation, at risk Census block building counts and values of the structures were used where necessary. Source: NOAA, MDEQ, Hazus MH 3.2 Data
SOCIAL VULNERABILITY Figure 6.16 is presented to gain a better understanding of at-risk population by evaluating census block level population data against the 3 feet sea level rise scenario. The three feet scenario was selected since this is a moderate level projection. Based on this analysis, a significant part of the coastal population in the region is vulnerable to sea level rise.

SECTION 6: VULNERABILITY ASSESSMENT
MEMA District 9 Regional Hazard Mitigation Plan DRAFT – February 2017
6:41
FIGURE 6.16: POPULATION DENSITY WITH 3 FEET SEA LEVEL RISE IN THE MEMA DISTRICT 9 REGION
Source: NOAA, United States Census 2010
CRITICAL FACILITIES The critical facility analysis revealed that there are 23 facilities located in the 3 feet of sea level rise scenario inundation area. As mentioned above, this scenario was selected as it is a mid-range projection for sea level rise based on a number of studies. The 23 facilities include 3 private/non-profit, 4 public facilities, 1 special population, 10 transportation, and 5 water/wastewater. A list of specific critical facilities and their associated risk can be found in Table 6.18 at the end of this section.
6.6 CONCLUSIONS ON HAZARD VULNERABILITY The results of this vulnerability assessment are useful in at least three ways:
Improving our understanding of the risk associated with the hazards in the MEMA District 9 Region through better understanding of the complexities and dynamics of risk, how levels of risk can be measured and compared, and the myriad of factors that influence risk. An understanding
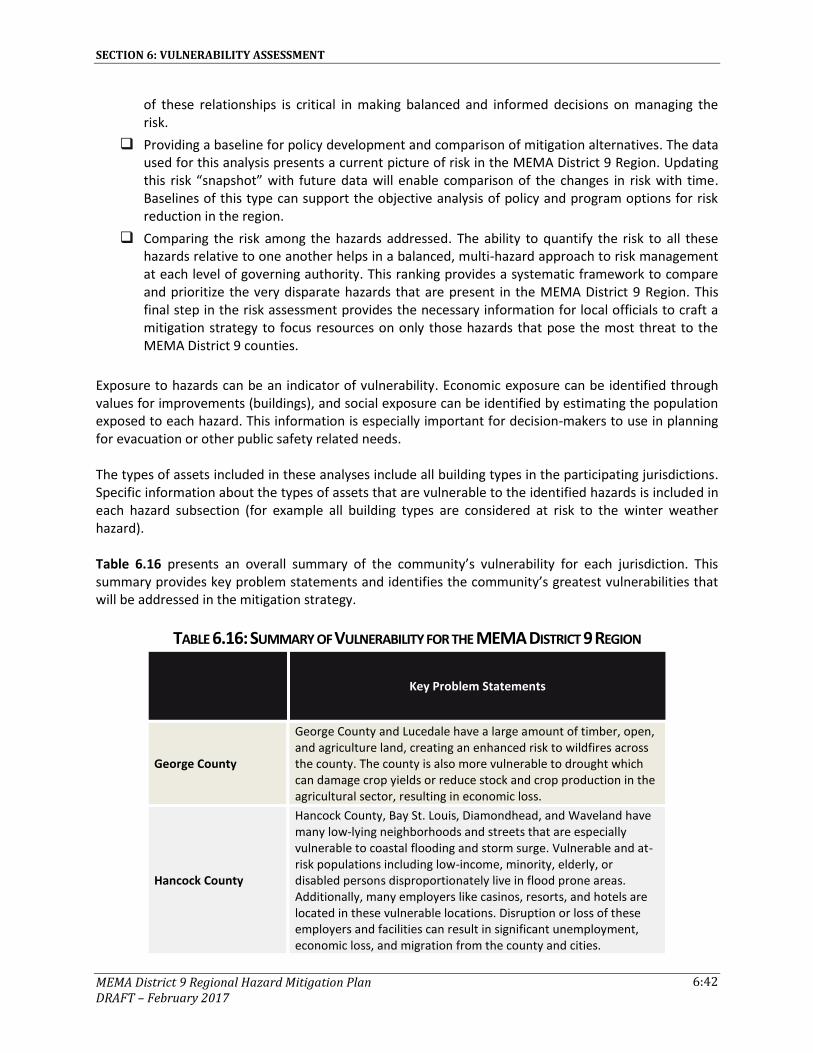
SECTION 6: VULNERABILITY ASSESSMENT
MEMA District 9 Regional Hazard Mitigation Plan DRAFT – February 2017
6:42
of these relationships is critical in making balanced and informed decisions on managing the risk.
Providing a baseline for policy development and comparison of mitigation alternatives. The data used for this analysis presents a current picture of risk in the MEMA District 9 Region. Updating this risk “snapshot” with future data will enable comparison of the changes in risk with time. Baselines of this type can support the objective analysis of policy and program options for risk reduction in the region.
Comparing the risk among the hazards addressed. The ability to quantify the risk to all these hazards relative to one another helps in a balanced, multi-hazard approach to risk management at each level of governing authority. This ranking provides a systematic framework to compare and prioritize the very disparate hazards that are present in the MEMA District 9 Region. This final step in the risk assessment provides the necessary information for local officials to craft a mitigation strategy to focus resources on only those hazards that pose the most threat to the MEMA District 9 counties.
Exposure to hazards can be an indicator of vulnerability. Economic exposure can be identified through values for improvements (buildings), and social exposure can be identified by estimating the population exposed to each hazard. This information is especially important for decision-makers to use in planning for evacuation or other public safety related needs. The types of assets included in these analyses include all building types in the participating jurisdictions. Specific information about the types of assets that are vulnerable to the identified hazards is included in each hazard subsection (for example all building types are considered at risk to the winter weather hazard). Table 6.16 presents an overall summary of the community’s vulnerability for each jurisdiction. This summary provides key problem statements and identifies the community’s greatest vulnerabilities that will be addressed in the mitigation strategy.
TABLE 6.16: SUMMARY OF VULNERABILITY FOR THE MEMA DISTRICT 9 REGION
Key Problem Statements
George County
George County and Lucedale have a large amount of timber, open, and agriculture land, creating an enhanced risk to wildfires across the county. The county is also more vulnerable to drought which can damage crop yields or reduce stock and crop production in the agricultural sector, resulting in economic loss.
Hancock County
Hancock County, Bay St. Louis, Diamondhead, and Waveland have many low-lying neighborhoods and streets that are especially vulnerable to coastal flooding and storm surge. Vulnerable and at-risk populations including low-income, minority, elderly, or disabled persons disproportionately live in flood prone areas. Additionally, many employers like casinos, resorts, and hotels are located in these vulnerable locations. Disruption or loss of these employers and facilities can result in significant unemployment, economic loss, and migration from the county and cities.

SECTION 6: VULNERABILITY ASSESSMENT
MEMA District 9 Regional Hazard Mitigation Plan DRAFT – February 2017
6:43
Key Problem Statements
Harrison County
Harrison County, Biloxi, D’Iberville, Gulfport, Long Beach, and Pass Christian have many low-lying neighborhoods and streets that are especially vulnerable to coastal flooding and storm surge. Vulnerable and at-risk populations including low-income, minority, elderly, or disabled persons disproportionately live in flood prone areas. Additionally, many employers like casinos, resorts, and hotels are located in these vulnerable locations. Disruption or loss of these employers and facilities can result in significant unemployment, economic loss, and migration from the county and cities.
Jackson County
Jackson County, Gautier, Moss Point, Ocean Springs, and Pascagoula have many low-lying neighborhoods and streets that are especially vulnerable to coastal flooding and storm surge. Vulnerable and at-risk populations including low-income, minority, elderly, or disabled persons disproportionately live in flood prone areas. Additionally, many employers like casinos, resorts, and hotels are located in these vulnerable locations. Disruption or loss of these employers and facilities can result in significant unemployment, economic loss, and migration from the county and cities.
Pearl River County
Pearl River, Picayune, and Poplarville have a large amount of timber, open, and agriculture land, creating an enhanced risk to wildfires across the county. The county is also more vulnerable to drought which can damage crop yields or reduce stock and crop production in the agricultural sector, resulting in economic loss.
Stone County
Stone County and Wiggins have a large amount of timber, open, and agriculture land, creating an enhanced risk to wildfires across the county. The county is also more vulnerable to drought which can damage crop yields or reduce stock and crop production in the agricultural sector, resulting in economic loss.
Table 6.17 presents a summary of annualized loss for each hazard in the MEMA District 9 Region. Due to the reporting of hazard damages primarily at the county level, it was difficult to determine an accurate annualized loss estimate for each municipality. Therefore, an annualized loss was determined through the damage reported from historical occurrences at the county level. These values should be used as an additional planning tool or measure of risk for determining hazard mitigation strategies throughout the region. It should also be noted that many of these estimates are based on incomplete data and likely underestimate the historic dollar damage sustained in each county. Especially for hazards such as extreme cold, extreme heat, hail, lightning, and winter weather, it is very likely that more damage occurred historically than has been identified.

SECTION 6: VULNERABILITY ASSESSMENT
MEMA District 9 Regional Hazard Mitigation Plan DRAFT – February 2017
6:44
TABLE 6.17: ANNUALIZED LOSS FOR THE MEMA DISTRICT 9 REGION
Hazard George County
Hancock County
Harrison County
Jackson County
Pearl River County
Stone County
Flood-related Hazards
Dam and Levee Failure
Not Available Not Available Not Available Not Available Not Available Not Available
Erosion Not Available Not Available Not Available Not Available Not Available Not Available
Flood $3,048 $63,260 $286,743 $234,715 $191,132 $8,226
Storm Surge $0 $231,917,975 $534,440,188 $213,721,103 $0 $0
Fire-related Hazards
Drought Not Available Not Available Not Available Not Available Not Available Not Available
Lightning $10,075 $24,550 $22,238 $17,009 $7,388 $6,483
Wildfire Not Available Not Available Not Available Not Available Not Available Not Available
Geologic Hazards
Earthquake† $2,000 $4,000 $21,000 $12,000 $5,000 $2,000
Wind-related Hazards
Extreme Cold $0 $0 $0 $7,675 $0 $0
Extreme Heat/Heat Wave
Not Available Not Available Not Available Not Available Not Available Not Available
Hailstorm $36 $0 $0 $17 $0 $0
Hurricane and Tropical Storm
$2,476,877 $97,894,098 $208,420,678 $101,235,648 $76,274,291 $19,180,679
Severe Thunderstorm/High Wind
$33,394 $11,182 $38,753 $20,249 $373,483 $35,155
Tornado $100,488 $1,232,052 $4,472,901 $150,650 $173,388 $33,495
Winter Weather
Not Available Not Available Not Available Not Available Not Available Not Available
Other Hazards
Climate Change/Sea Level Rise
Not Available Not Available Not Available Not Available Not Available Not Available
Hazardous Materials Incident/Train Derailment
$3,866 $8,313 $11,489 $25,777 $7,961 $2,997
Infectious Disease
Not Available Not Available Not Available Not Available Not Available Not Available
†Historic dollar damage was not available for this hazard, but since estimated annualized losses from Hazus were available, those numbers were used in this table. *In this table, the term “Not Available” is used to indicate that no records of dollar losses for the particular hazard were recorded. This could be the case either because there were no events that caused dollar damage or because documentation of that particular type of event is not well kept.
As noted previously, all existing and future buildings and populations (including critical facilities) are vulnerable to impacts from atmospheric hazards such as drought and hailstorm. Some buildings may be more vulnerable to some of these hazards based on locations, construction, and building type. In

SECTION 6: VULNERABILITY ASSESSMENT
MEMA District 9 Regional Hazard Mitigation Plan DRAFT – February 2017
6:45
addition, all populations are vulnerable to hazards like infectious disease which could presumably impact any segment of the population without regard to geographic location. Table 6.18 shows the critical facilities vulnerable to additional hazards analyzed in this section. The table lists those assets that are determined to be exposed to each of the identified hazards (marked with an “X”).
This Page Intentionally Left Blank

SECTION 6: VULNERABILITY ASSESSMENT
MEMA District 9 Regional Hazard Mitigation Plan DRAFT – February 2017
6:46
TABLE 6.18: AT-RISK CRITICAL FACILITIES
Flood-Related Fire-Related G Wind-Related Other Hazards
Dam
an
d L
eve
e F
ailu
re
Ero
sio
n
Flo
od
– 1
00
ye
ar
Flo
od
– 5
00
ye
ar
Flo
od
– V
E-zo
ne
Dro
ugh
t
Ligh
tnin
g
Wild
fire
Eart
hq
uak
e
Extr
em
e C
old
Extr
em
e H
eat
/ H
eat
Wav
e
Hai
lsto
rm
Hu
rric
ane
an
d T
rop
ical
Sto
rm
Seve
re T
hu
nd
ers
torm
/ H
igh
Win
d
Torn
ado
Win
ter
We
ath
er
Sea
Leve
l Ris
e-
3 f
ee
t
Fixe
d H
AZM
AT
– 0
.5 m
ile
Fixe
d H
AZM
AT
– 1
.0 m
ile
Mo
bile
HA
ZMA
T –
0.5
mile
(ro
ad)
Mo
bile
HA
ZMA
T –
1.0
mile
(ro
ad)
Mo
bile
HA
ZMA
T –
0.5
mile
(rai
l)
Mo
bile
HA
ZMA
T –
1.0
mile
(rai
l)
Infe
ctio
us
Dis
ea
se
FACILITY NAME CITY/TOWN
(if applicable) FACILITY TYPE
GEORGE COUNTY
AT&T Comm X X X X X X X X X X X X X X X
C-Spire Communications Tower Comm
X X X X X X X X X X X X X X
Emergency Operations Center EOC
X X X X X X X X X X X X X X X X
Agricola VFD Fire Station X X X X X X X X X X X X X X X
Barton VFD Fire Station X X X X X X X X X X X X X X
Basin VFD Fire Station X X X X X X X X X X X X X
Benndale VFD Fire Station X X X X X X X X X X X X X X X
Bexley VFD Fire Station X X X X X X X X X X X X X X X X
Broome VFD Fire Station X X X X X X X X X X X X X X
Central VFD Fire Station X X X X X X X X X X X X X X X
Howell VFD Fire Station X X X X X X X X X X X X X
Movella VFD Fire Station X X X X X X X X X X X X X X X
Rocky Creek VFD Fire Station X X X X X X X X X X X X X
Salem VFD Fire Station X X X X X X X X X X X X X X X
Shipman VFD Fire Station X X X X X X X X X X X X X X X

SECTION 6: VULNERABILITY ASSESSMENT
MEMA District 9 Regional Hazard Mitigation Plan DRAFT – February 2017
6:47
Flood-Related Fire-Related G Wind-Related Other Hazards
Dam
an
d L
eve
e F
ailu
re
Ero
sio
n
Flo
od
– 1
00
ye
ar
Flo
od
– 5
00
ye
ar
Flo
od
– V
E-zo
ne
Dro
ugh
t
Ligh
tnin
g
Wild
fire
Eart
hq
uak
e
Extr
em
e C
old
Extr
em
e H
eat
/ H
eat
Wav
e
Hai
lsto
rm
Hu
rric
ane
an
d T
rop
ical
Sto
rm
Seve
re T
hu
nd
ers
torm
/ H
igh
Win
d
Torn
ado
Win
ter
We
ath
er
Sea
Leve
l Ris
e-
3 f
ee
t
Fixe
d H
AZM
AT
– 0
.5 m
ile
Fixe
d H
AZM
AT
– 1
.0 m
ile
Mo
bile
HA
ZMA
T –
0.5
mile
(ro
ad)
Mo
bile
HA
ZMA
T –
1.0
mile
(ro
ad)
Mo
bile
HA
ZMA
T –
0.5
mile
(rai
l)
Mo
bile
HA
ZMA
T –
1.0
mile
(rai
l)
Infe
ctio
us
Dis
ea
se
FACILITY NAME CITY/TOWN
(if applicable) FACILITY TYPE
Twin Creek VFD Fire Station X X X X X X X X X X X X X X X
Ward VFD Fire Station X X X X X X X X X X X X X X X
Davita Dialysis Health Center Medical
X X X X X X X X X X X X X X X X
George Regional Hospital Medical
X X X X X X X X X X X X X X X X
Mississippi Power Company Power/Gas
X X X X X X X X X X X X X X X X
Singing River Electric Power Company Power/Gas
X X X X X X X X X X X X X X X
WRBE Radio Station Private/Non-Profit
X X X X X X X X X X X X X X
George County Administrative Building Public Facility
X X X X X X X X X X X X X X X X
George County Regional Correctional Facility Public Facility
X X X X X X X X X X X X X X X X X
George County Senior Citizens Building Public Facility
X X X X X X X X X X X X X X X X X
Lucedale-George County Public Library Public Facility
X X X X X X X X X X X X X X X X X
Mississippi Forestry Commission Public Facility
X X X X X X X X X X X X X X

SECTION 6: VULNERABILITY ASSESSMENT
MEMA District 9 Regional Hazard Mitigation Plan DRAFT – February 2017
6:48
Flood-Related Fire-Related G Wind-Related Other Hazards
Dam
an
d L
eve
e F
ailu
re
Ero
sio
n
Flo
od
– 1
00
ye
ar
Flo
od
– 5
00
ye
ar
Flo
od
– V
E-zo
ne
Dro
ugh
t
Ligh
tnin
g
Wild
fire
Eart
hq
uak
e
Extr
em
e C
old
Extr
em
e H
eat
/ H
eat
Wav
e
Hai
lsto
rm
Hu
rric
ane
an
d T
rop
ical
Sto
rm
Seve
re T
hu
nd
ers
torm
/ H
igh
Win
d
Torn
ado
Win
ter
We
ath
er
Sea
Leve
l Ris
e-
3 f
ee
t
Fixe
d H
AZM
AT
– 0
.5 m
ile
Fixe
d H
AZM
AT
– 1
.0 m
ile
Mo
bile
HA
ZMA
T –
0.5
mile
(ro
ad)
Mo
bile
HA
ZMA
T –
1.0
mile
(ro
ad)
Mo
bile
HA
ZMA
T –
0.5
mile
(rai
l)
Mo
bile
HA
ZMA
T –
1.0
mile
(rai
l)
Infe
ctio
us
Dis
ea
se
FACILITY NAME CITY/TOWN
(if applicable) FACILITY TYPE
Mississippi National Guard Armory Public Facility
X X X X X X X X X X X X X X X
United States Postal Service Public Facility
X X X X X X X X X X X X X X X X
Agricola Elementary School School
X X X X X X X X X X X X X X X
Benndale Elementary School School
X X X X X X X X X X X X X X
Cental Elementary School School
X X X X X X X X X X X X X X X
George County High School School
X X X X X X X X X X X X X X
George County Middle School School
X X X X X X X X X X X X X X X
L C Hatcher Elementary School School
X X X X X X X X X X X X X X X X
L T Taylor Intermediate School
X X X X X X X X X X X X X X X
MS Gulf Coast Community College School
X X X X X X X X X X X X X X X
Rocky Creek Elementary School School
X X X X X X X X X X X X X
Amelias Garden Personal Care
Special Populations
X X X X X X X X X X X X X
Evas Place Personal Care
Special Populations
X X X X X X X X X X X X
Glen Oaks Nursing Home
Special Populations
X X X X X X X X X X X X X X

SECTION 6: VULNERABILITY ASSESSMENT
MEMA District 9 Regional Hazard Mitigation Plan DRAFT – February 2017
6:49
Flood-Related Fire-Related G Wind-Related Other Hazards
Dam
an
d L
eve
e F
ailu
re
Ero
sio
n
Flo
od
– 1
00
ye
ar
Flo
od
– 5
00
ye
ar
Flo
od
– V
E-zo
ne
Dro
ugh
t
Ligh
tnin
g
Wild
fire
Eart
hq
uak
e
Extr
em
e C
old
Extr
em
e H
eat
/ H
eat
Wav
e
Hai
lsto
rm
Hu
rric
ane
an
d T
rop
ical
Sto
rm
Seve
re T
hu
nd
ers
torm
/ H
igh
Win
d
Torn
ado
Win
ter
We
ath
er
Sea
Leve
l Ris
e-
3 f
ee
t
Fixe
d H
AZM
AT
– 0
.5 m
ile
Fixe
d H
AZM
AT
– 1
.0 m
ile
Mo
bile
HA
ZMA
T –
0.5
mile
(ro
ad)
Mo
bile
HA
ZMA
T –
1.0
mile
(ro
ad)
Mo
bile
HA
ZMA
T –
0.5
mile
(rai
l)
Mo
bile
HA
ZMA
T –
1.0
mile
(rai
l)
Infe
ctio
us
Dis
ea
se
FACILITY NAME CITY/TOWN
(if applicable) FACILITY TYPE
Smith Manor Personal Care
Special Populations
X X X X X X X X X X X X X X
Sparrow Hills Personal Care
Special Populations
X X X X X X X X X X X X
Bexley Utilities Water/ Wastewater
X X X X X X X X X X X X X X
Combined Utilities Water/ Wastewater
X X X X X X X X X X X X X X
Multi Mart Water Association
Water/ Wastewater
X X X X X X X X X X X X X X X X X
Rocky Creek Utilities Water/ Wastewater
X X X X X X X X X X X X X X
Lucedale Fire Department Lucedale Fire Station
X X X X X X X X X X X X X X X X X
Lucedale Police Department Lucedale Police Station
X X X X X X X X X X X X X X X X X
City Hall Lucedale Public Facility X X X X X X X X X X X X X X X X X
Lucedale Sewer & Water Department Lucedale
Water/ Wastewater
X X X X X X X X X X X X X X X X X
HANCOCK COUNTY Bell South Switching Station Comm
X X X X X X X X X X X X
Cell phone Towers Comm X X X X X X X X X X X X
Hancock County EMA EOC
X X X X X X X X X X X X X X X

SECTION 6: VULNERABILITY ASSESSMENT
MEMA District 9 Regional Hazard Mitigation Plan DRAFT – February 2017
6:50
Flood-Related Fire-Related G Wind-Related Other Hazards
Dam
an
d L
eve
e F
ailu
re
Ero
sio
n
Flo
od
– 1
00
ye
ar
Flo
od
– 5
00
ye
ar
Flo
od
– V
E-zo
ne
Dro
ugh
t
Ligh
tnin
g
Wild
fire
Eart
hq
uak
e
Extr
em
e C
old
Extr
em
e H
eat
/ H
eat
Wav
e
Hai
lsto
rm
Hu
rric
ane
an
d T
rop
ical
Sto
rm
Seve
re T
hu
nd
ers
torm
/ H
igh
Win
d
Torn
ado
Win
ter
We
ath
er
Sea
Leve
l Ris
e-
3 f
ee
t
Fixe
d H
AZM
AT
– 0
.5 m
ile
Fixe
d H
AZM
AT
– 1
.0 m
ile
Mo
bile
HA
ZMA
T –
0.5
mile
(ro
ad)
Mo
bile
HA
ZMA
T –
1.0
mile
(ro
ad)
Mo
bile
HA
ZMA
T –
0.5
mile
(rai
l)
Mo
bile
HA
ZMA
T –
1.0
mile
(rai
l)
Infe
ctio
us
Dis
ea
se
FACILITY NAME CITY/TOWN
(if applicable) FACILITY TYPE
Clermont Harbor VFD Fire Station
X X X X X X X X X X X X X X X X
Fenton VFD Fire Station X X X X X X X X X X X X X
West Hancock VFD Fire Station X X X X X X X X X X X X X X X X
Diamondhead Dialysis Center Medical
X X X X X X X X X X X X X X X
Hancock Medical Center Medical
X X X X X X X X X X X X X X X X
Hancock Medical Center Clinics and Offices Medical
X X X X X X X X X X X X X X X X
Hancock County Dispatch Office Police Station
X X X X X X X X X X X X X X X
Hancock County Sheriff’s Office Police Station
X X X X X X X X X X X X X X X
Coast Electric Power Association office and distribution lines Power/Gas
X X X X X X X X X X X X
Mississippi Power Company, office and distribution lines Power/Gas
X X X X X X X X X X X X X X X X X
La Frances Fish Camp
Private/Non-Profit
X X X X X X X X X X X X X X X
WQRZ Radio Station Private/Non-Profit
X X X X X X X X X X X X X X X X X

SECTION 6: VULNERABILITY ASSESSMENT
MEMA District 9 Regional Hazard Mitigation Plan DRAFT – February 2017
6:51
Flood-Related Fire-Related G Wind-Related Other Hazards
Dam
an
d L
eve
e F
ailu
re
Ero
sio
n
Flo
od
– 1
00
ye
ar
Flo
od
– 5
00
ye
ar
Flo
od
– V
E-zo
ne
Dro
ugh
t
Ligh
tnin
g
Wild
fire
Eart
hq
uak
e
Extr
em
e C
old
Extr
em
e H
eat
/ H
eat
Wav
e
Hai
lsto
rm
Hu
rric
ane
an
d T
rop
ical
Sto
rm
Seve
re T
hu
nd
ers
torm
/ H
igh
Win
d
Torn
ado
Win
ter
We
ath
er
Sea
Leve
l Ris
e-
3 f
ee
t
Fixe
d H
AZM
AT
– 0
.5 m
ile
Fixe
d H
AZM
AT
– 1
.0 m
ile
Mo
bile
HA
ZMA
T –
0.5
mile
(ro
ad)
Mo
bile
HA
ZMA
T –
1.0
mile
(ro
ad)
Mo
bile
HA
ZMA
T –
0.5
mile
(rai
l)
Mo
bile
HA
ZMA
T –
1.0
mile
(rai
l)
Infe
ctio
us
Dis
ea
se
FACILITY NAME CITY/TOWN
(if applicable) FACILITY TYPE
Buccaneer State Park Public Facility
X X X X X X X X X X X X X X X
Hancock County Courthouse Public Facility
X X X X X X X X X X X X X X X
Hancock County Health Department Public Facility
X X X X X X X X X X X X X X X X X
Hancock County Jail Public Facility X X X X X X X X X X X X X X X
Hancock County Senior Center Public Facility
X X X X X X X X X X X X X X X X
Kiln Public Library Public Facility X X X X X X X X X X X X X X X
Pearlington Public Library Public Facility
X X X X X X X X X X X X X X X X
Sand Beach Public Facility X X X X X X X X X X X X
Scenic Trails Public Facility X X X X X X X X X X X X
Seawall Public Facility X X X X X X X X X X X X
Bay Catholic Elementary School School
X X X X X X X X X X X X
Bay High School School X X X X X X X X X X X X X X X X
Bay Waveland Child Development Center School
X X X X X X X X X X X X X X X X
Central Christian Academy School
X X X X X X X X X X X X X X X X
East Hancock Elementary School School
X X X X X X X X X X X X

SECTION 6: VULNERABILITY ASSESSMENT
MEMA District 9 Regional Hazard Mitigation Plan DRAFT – February 2017
6:52
Flood-Related Fire-Related G Wind-Related Other Hazards
Dam
an
d L
eve
e F
ailu
re
Ero
sio
n
Flo
od
– 1
00
ye
ar
Flo
od
– 5
00
ye
ar
Flo
od
– V
E-zo
ne
Dro
ugh
t
Ligh
tnin
g
Wild
fire
Eart
hq
uak
e
Extr
em
e C
old
Extr
em
e H
eat
/ H
eat
Wav
e
Hai
lsto
rm
Hu
rric
ane
an
d T
rop
ical
Sto
rm
Seve
re T
hu
nd
ers
torm
/ H
igh
Win
d
Torn
ado
Win
ter
We
ath
er
Sea
Leve
l Ris
e-
3 f
ee
t
Fixe
d H
AZM
AT
– 0
.5 m
ile
Fixe
d H
AZM
AT
– 1
.0 m
ile
Mo
bile
HA
ZMA
T –
0.5
mile
(ro
ad)
Mo
bile
HA
ZMA
T –
1.0
mile
(ro
ad)
Mo
bile
HA
ZMA
T –
0.5
mile
(rai
l)
Mo
bile
HA
ZMA
T –
1.0
mile
(rai
l)
Infe
ctio
us
Dis
ea
se
FACILITY NAME CITY/TOWN
(if applicable) FACILITY TYPE
Hancock County Child Development Center School
X X X X X X X X X X X X X X X X
Hancock County High School School
X X X X X X X X X X X X X X
Hancock County Middle School School
X X X X X X X X X X X X X X X X
Hancock County North Central Elementary School School
X X X X X X X X X X X X X X
North Bay Elementary School School
X X X X X X X X X X X X X X X X
Our Lady of the Gulf High School School
X X X X X X X X X X X X X X X X
South Hancock Elementary School School
X X X X X X X X X X X X X X
St. Stanislaus College and Dorms School
X X X X X X X X X X X X X X X X
Waveland Elementary School School
X X X X X X X X X X X X X X X X X
West Hancock Elementary School School
X X X X X X X X X X X X X X
Hancock County Evacuation Shelters Shelter
X X X X X X X X X X X X
Aloha RV Park Special Populations
X X X X X X X X X X X X
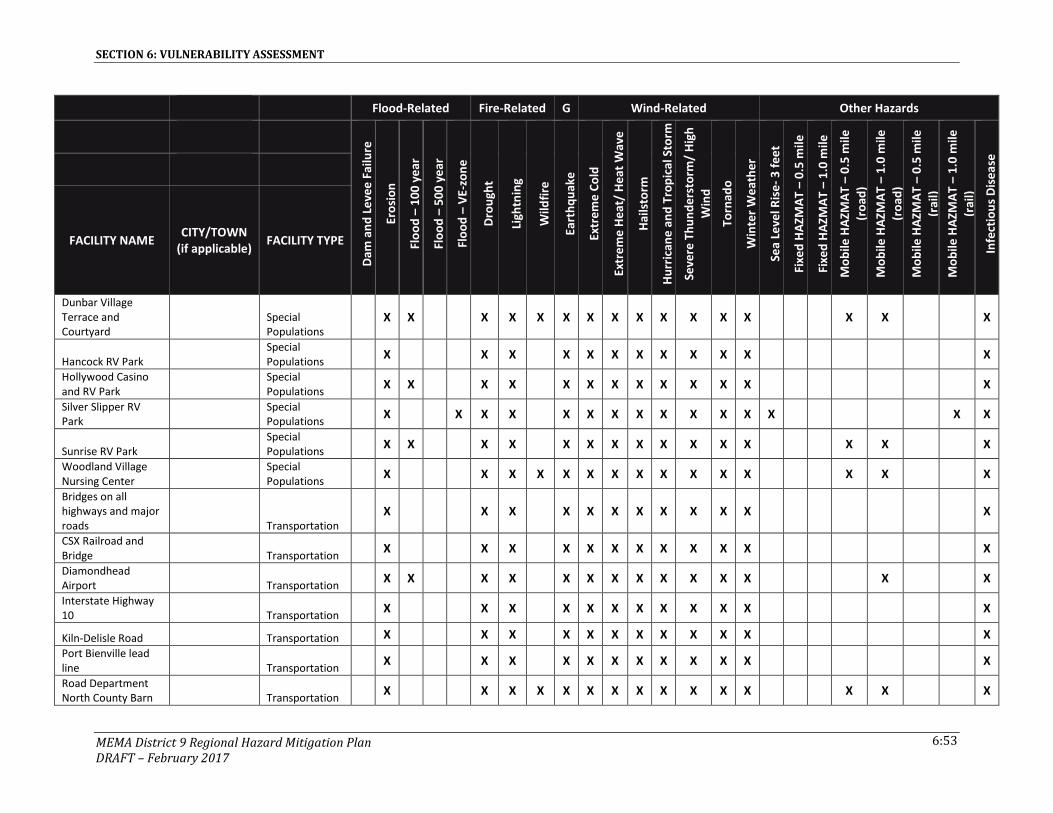
SECTION 6: VULNERABILITY ASSESSMENT
MEMA District 9 Regional Hazard Mitigation Plan DRAFT – February 2017
6:53
Flood-Related Fire-Related G Wind-Related Other Hazards
Dam
an
d L
eve
e F
ailu
re
Ero
sio
n
Flo
od
– 1
00
ye
ar
Flo
od
– 5
00
ye
ar
Flo
od
– V
E-zo
ne
Dro
ugh
t
Ligh
tnin
g
Wild
fire
Eart
hq
uak
e
Extr
em
e C
old
Extr
em
e H
eat
/ H
eat
Wav
e
Hai
lsto
rm
Hu
rric
ane
an
d T
rop
ical
Sto
rm
Seve
re T
hu
nd
ers
torm
/ H
igh
Win
d
Torn
ado
Win
ter
We
ath
er
Sea
Leve
l Ris
e-
3 f
ee
t
Fixe
d H
AZM
AT
– 0
.5 m
ile
Fixe
d H
AZM
AT
– 1
.0 m
ile
Mo
bile
HA
ZMA
T –
0.5
mile
(ro
ad)
Mo
bile
HA
ZMA
T –
1.0
mile
(ro
ad)
Mo
bile
HA
ZMA
T –
0.5
mile
(rai
l)
Mo
bile
HA
ZMA
T –
1.0
mile
(rai
l)
Infe
ctio
us
Dis
ea
se
FACILITY NAME CITY/TOWN
(if applicable) FACILITY TYPE
Dunbar Village Terrace and Courtyard
Special Populations
X X X X X X X X X X X X X X X X
Hancock RV Park Special Populations
X X X X X X X X X X X X
Hollywood Casino and RV Park
Special Populations
X X X X X X X X X X X X X
Silver Slipper RV Park
Special Populations
X X X X X X X X X X X X X X X
Sunrise RV Park Special Populations
X X X X X X X X X X X X X X X
Woodland Village Nursing Center
Special Populations
X X X X X X X X X X X X X X X
Bridges on all highways and major roads Transportation
X X X X X X X X X X X X
CSX Railroad and Bridge Transportation
X X X X X X X X X X X X
Diamondhead Airport Transportation
X X X X X X X X X X X X X X
Interstate Highway 10 Transportation
X X X X X X X X X X X X
Kiln-Delisle Road Transportation X X X X X X X X X X X X
Port Bienville lead line Transportation
X X X X X X X X X X X X
Road Department North County Barn Transportation
X X X X X X X X X X X X X X X

SECTION 6: VULNERABILITY ASSESSMENT
MEMA District 9 Regional Hazard Mitigation Plan DRAFT – February 2017
6:54
Flood-Related Fire-Related G Wind-Related Other Hazards
Dam
an
d L
eve
e F
ailu
re
Ero
sio
n
Flo
od
– 1
00
ye
ar
Flo
od
– 5
00
ye
ar
Flo
od
– V
E-zo
ne
Dro
ugh
t
Ligh
tnin
g
Wild
fire
Eart
hq
uak
e
Extr
em
e C
old
Extr
em
e H
eat
/ H
eat
Wav
e
Hai
lsto
rm
Hu
rric
ane
an
d T
rop
ical
Sto
rm
Seve
re T
hu
nd
ers
torm
/ H
igh
Win
d
Torn
ado
Win
ter
We
ath
er
Sea
Leve
l Ris
e-
3 f
ee
t
Fixe
d H
AZM
AT
– 0
.5 m
ile
Fixe
d H
AZM
AT
– 1
.0 m
ile
Mo
bile
HA
ZMA
T –
0.5
mile
(ro
ad)
Mo
bile
HA
ZMA
T –
1.0
mile
(ro
ad)
Mo
bile
HA
ZMA
T –
0.5
mile
(rai
l)
Mo
bile
HA
ZMA
T –
1.0
mile
(rai
l)
Infe
ctio
us
Dis
ea
se
FACILITY NAME CITY/TOWN
(if applicable) FACILITY TYPE
Road Department South County Barn Transportation
X X X X X X X X X X X X X X
State Highways 603,603 and 43 Transportation
X X X X X X X X X X X X
Stennis International Airport Transportation
X X X X X X X X X X X X X
U. S. Highway 90 Transportation X X X X X X X X X X X X
Diamondhead Regional Wastewater Treatment Plant
Water/ Wastewater
X X X X X X X X X X X X
Hancock County Utility Authority Offices
Water/ Wastewater
X X X X X X X X X X X X X X X
Northern Regional Wastewater Treatment Plant
Water/ Wastewater
X X X X X X X X X X X X
Sewer Lift Stations Water/ Wastewater
X X X X X X X X X X X X
Southern Regional Wastewater Treatment Plant
Water/ Wastewater
X X X X X X X X X X X X
Water Wells Water/ Wastewater
X X X X X X X X X X X X

SECTION 6: VULNERABILITY ASSESSMENT
MEMA District 9 Regional Hazard Mitigation Plan DRAFT – February 2017
6:55
Flood-Related Fire-Related G Wind-Related Other Hazards
Dam
an
d L
eve
e F
ailu
re
Ero
sio
n
Flo
od
– 1
00
ye
ar
Flo
od
– 5
00
ye
ar
Flo
od
– V
E-zo
ne
Dro
ugh
t
Ligh
tnin
g
Wild
fire
Eart
hq
uak
e
Extr
em
e C
old
Extr
em
e H
eat
/ H
eat
Wav
e
Hai
lsto
rm
Hu
rric
ane
an
d T
rop
ical
Sto
rm
Seve
re T
hu
nd
ers
torm
/ H
igh
Win
d
Torn
ado
Win
ter
We
ath
er
Sea
Leve
l Ris
e-
3 f
ee
t
Fixe
d H
AZM
AT
– 0
.5 m
ile
Fixe
d H
AZM
AT
– 1
.0 m
ile
Mo
bile
HA
ZMA
T –
0.5
mile
(ro
ad)
Mo
bile
HA
ZMA
T –
1.0
mile
(ro
ad)
Mo
bile
HA
ZMA
T –
0.5
mile
(rai
l)
Mo
bile
HA
ZMA
T –
1.0
mile
(rai
l)
Infe
ctio
us
Dis
ea
se
FACILITY NAME CITY/TOWN
(if applicable) FACILITY TYPE
Western Regional Wastewater Treatment Plant
Water/ Wastewater
X X X X X X X X X X X X
Bell South Bay St Louis Comm X X X X X X X X X X X X X X X X X
Cell phone Towers Bay St Louis Comm X X X X X X X X X X X X X X X X X
Bay St. Louis Fire Department #1 Bay St Louis Fire Station
X X X X X X X X X X X X X X X X X
Bay St. Louis Fire Department #2 Bay St Louis Fire Station
X X X X X X X X X X X X X X X X
Bay St. Louis Police Department Bay St Louis Police Station
X X X X X X X X X X X X X X X X X
Natural Gas Regulator Bay St Louis Power/Gas
X X X X X X X X X X X X X X X X X X
Bay St. Louis-Hancock County Library Bay St Louis Public Facility
X X X X X X X X X X X X X X X X X
Bay St. Louis City Hall Bay St Louis Public Facility
X X X X X X X X X X X X X X X X X
Bay St. Louis Public Works Yard Bay St Louis Public Facility
X X X X X X X X X X X X X X X X X
Bay-Waveland Middle School Bay St Louis School
X X X X X X X X X X X X X X X X
Second Street Elementary Bay St Louis School
X X X X X X X X X X X X X X X X X X
St. Rose De Lima School Bay St Louis School
X X X X X X X X X X X X X X X X

SECTION 6: VULNERABILITY ASSESSMENT
MEMA District 9 Regional Hazard Mitigation Plan DRAFT – February 2017
6:56
Flood-Related Fire-Related G Wind-Related Other Hazards
Dam
an
d L
eve
e F
ailu
re
Ero
sio
n
Flo
od
– 1
00
ye
ar
Flo
od
– 5
00
ye
ar
Flo
od
– V
E-zo
ne
Dro
ugh
t
Ligh
tnin
g
Wild
fire
Eart
hq
uak
e
Extr
em
e C
old
Extr
em
e H
eat
/ H
eat
Wav
e
Hai
lsto
rm
Hu
rric
ane
an
d T
rop
ical
Sto
rm
Seve
re T
hu
nd
ers
torm
/ H
igh
Win
d
Torn
ado
Win
ter
We
ath
er
Sea
Leve
l Ris
e-
3 f
ee
t
Fixe
d H
AZM
AT
– 0
.5 m
ile
Fixe
d H
AZM
AT
– 1
.0 m
ile
Mo
bile
HA
ZMA
T –
0.5
mile
(ro
ad)
Mo
bile
HA
ZMA
T –
1.0
mile
(ro
ad)
Mo
bile
HA
ZMA
T –
0.5
mile
(rai
l)
Mo
bile
HA
ZMA
T –
1.0
mile
(rai
l)
Infe
ctio
us
Dis
ea
se
FACILITY NAME CITY/TOWN
(if applicable) FACILITY TYPE
Notre Dame De La Mer Senior Housing Bay St Louis
Special Populations
X X X X X X X X X X X X X X X X X
CSX Railroad Bay Bridge Bay St Louis Transportation
X X X X X X X X X X X X X X X
Water Well- 10th Bay St Louis Water/ Wastewater
X X X X X X X X X X X X X X X X
Water Well- Esterbrook Bay St Louis
Water/ Wastewater
X X X X X X X X X X X X X X X X X
Water Well- Harry Bay St Louis Water/ Wastewater
X X X X X X X X X X X X X X X X
Water Well- St Charles Bay St Louis
Water/ Wastewater
X X X X X X X X X X X X X X X X X
Diamondhead Fire Station Diamondhead Fire Station
X X X X X X X X X X X X X X X
Diamondhead Proposed Police Station Diamondhead Police Station
X X X X X X X X X X X X X X
Diamondhead City Offices Diamondhead Public Facility
X X X X X X X X X X X X X X
Diamondhead POA Diamondhead Public Facility X X X X X X X X X X X X X X
East Hancock County Library Diamondhead Public Facility
X X X X X X X X X X X X X X X
Waveland Central Fire Station Waveland Fire Station
X X X X X X X X X X X X X X X X
Waveland Fire Station #1 Waveland Fire Station
X X X X X X X X X X X X X X X X

SECTION 6: VULNERABILITY ASSESSMENT
MEMA District 9 Regional Hazard Mitigation Plan DRAFT – February 2017
6:57
Flood-Related Fire-Related G Wind-Related Other Hazards
Dam
an
d L
eve
e F
ailu
re
Ero
sio
n
Flo
od
– 1
00
ye
ar
Flo
od
– 5
00
ye
ar
Flo
od
– V
E-zo
ne
Dro
ugh
t
Ligh
tnin
g
Wild
fire
Eart
hq
uak
e
Extr
em
e C
old
Extr
em
e H
eat
/ H
eat
Wav
e
Hai
lsto
rm
Hu
rric
ane
an
d T
rop
ical
Sto
rm
Seve
re T
hu
nd
ers
torm
/ H
igh
Win
d
Torn
ado
Win
ter
We
ath
er
Sea
Leve
l Ris
e-
3 f
ee
t
Fixe
d H
AZM
AT
– 0
.5 m
ile
Fixe
d H
AZM
AT
– 1
.0 m
ile
Mo
bile
HA
ZMA
T –
0.5
mile
(ro
ad)
Mo
bile
HA
ZMA
T –
1.0
mile
(ro
ad)
Mo
bile
HA
ZMA
T –
0.5
mile
(rai
l)
Mo
bile
HA
ZMA
T –
1.0
mile
(rai
l)
Infe
ctio
us
Dis
ea
se
FACILITY NAME CITY/TOWN
(if applicable) FACILITY TYPE
Waveland Police Department- New Waveland Police Station
X X X X X X X X X X X X X X X X
Waveland Police Department- Temporary Waveland Police Station
X X X X X X X X X X X X X X X X
Hope Haven Waveland Private/Non-Profit
X X X X X X X X X X X X X X X X X
Waveland City Hall Waveland Public Facility X X X X X X X X X X X X X X X X
Waveland City Hall Annex Waveland Public Facility
X X X X X X X X X X X X X X X X
Waveland Civic Center Waveland Public Facility
X X X X X X X X X X X X X X X X
Waveland Public Library Waveland Public Facility
X X X X X X X X X X X X X X X X
Waveland Public Library Waveland Public Facility
X X X X X X X X X X X X X X X X
Waveland Public Works Yard Waveland Public Facility
X X X X X X X X X X X X X X X X
Davis Ave Water Well Waveland
Water/ Wastewater
X X X X X X X X X X X X X X X X
Faith Street Water Well Waveland
Water/ Wastewater
X X X X X X X X X X X X X X X X X
Gulfside Street Water Well Waveland
Water/ Wastewater
X X X X X X X X X X X X X X X X
Tide Street Water Well Waveland
Water/ Wastewater
X X X X X X X X X X X X X X X

SECTION 6: VULNERABILITY ASSESSMENT
MEMA District 9 Regional Hazard Mitigation Plan DRAFT – February 2017
6:58
Flood-Related Fire-Related G Wind-Related Other Hazards
Dam
an
d L
eve
e F
ailu
re
Ero
sio
n
Flo
od
– 1
00
ye
ar
Flo
od
– 5
00
ye
ar
Flo
od
– V
E-zo
ne
Dro
ugh
t
Ligh
tnin
g
Wild
fire
Eart
hq
uak
e
Extr
em
e C
old
Extr
em
e H
eat
/ H
eat
Wav
e
Hai
lsto
rm
Hu
rric
ane
an
d T
rop
ical
Sto
rm
Seve
re T
hu
nd
ers
torm
/ H
igh
Win
d
Torn
ado
Win
ter
We
ath
er
Sea
Leve
l Ris
e-
3 f
ee
t
Fixe
d H
AZM
AT
– 0
.5 m
ile
Fixe
d H
AZM
AT
– 1
.0 m
ile
Mo
bile
HA
ZMA
T –
0.5
mile
(ro
ad)
Mo
bile
HA
ZMA
T –
1.0
mile
(ro
ad)
Mo
bile
HA
ZMA
T –
0.5
mile
(rai
l)
Mo
bile
HA
ZMA
T –
1.0
mile
(rai
l)
Infe
ctio
us
Dis
ea
se
FACILITY NAME CITY/TOWN
(if applicable) FACILITY TYPE
Waveland Wastewater Treatment Plant Waveland
Water/ Wastewater
X X X X X X X X X X X X X X X X
HARRISON COUNTY
Harrison County EOC EOC
X X X X X X X X X X X X X X X X
Cuevas VFD Fire Station X X X X X X X X X X X X X
Henderson Point VFD Fire Station
X X X X X X X X X X X X X X X X X X
Lizana VFD Fire Station X X X X X X X X X X X X X X X
Saucier VFD Fire Station X X X X X X X X X X X X X X X X
West Harrison VFD Fire Station X X X X X X X X X X X X X X
Arizona Chemicals Power/Gas X X X X X X X X X X X X X
Canal Road- Electric Substation Power/Gas
X X X X X X X X X X X X X X
CE Lizana- Electric Substation Power/Gas
X X X X X X X X X X X X X X
Cedar Lake CE- Electric Substation Power/Gas
X X X X X X X X X X X X X X X
CenterPoint Entex- Gulfport Power/Gas
X X X X X X X X X X X X X X X X X X
CenterPoint Entex- Long Beach Power/Gas
X X X X X X X X X X X X X X X X
CenterPoint Entex- Pass Christian Power/Gas
X X X X X X X X X X X X X X X X

SECTION 6: VULNERABILITY ASSESSMENT
MEMA District 9 Regional Hazard Mitigation Plan DRAFT – February 2017
6:59
Flood-Related Fire-Related G Wind-Related Other Hazards
Dam
an
d L
eve
e F
ailu
re
Ero
sio
n
Flo
od
– 1
00
ye
ar
Flo
od
– 5
00
ye
ar
Flo
od
– V
E-zo
ne
Dro
ugh
t
Ligh
tnin
g
Wild
fire
Eart
hq
uak
e
Extr
em
e C
old
Extr
em
e H
eat
/ H
eat
Wav
e
Hai
lsto
rm
Hu
rric
ane
an
d T
rop
ical
Sto
rm
Seve
re T
hu
nd
ers
torm
/ H
igh
Win
d
Torn
ado
Win
ter
We
ath
er
Sea
Leve
l Ris
e-
3 f
ee
t
Fixe
d H
AZM
AT
– 0
.5 m
ile
Fixe
d H
AZM
AT
– 1
.0 m
ile
Mo
bile
HA
ZMA
T –
0.5
mile
(ro
ad)
Mo
bile
HA
ZMA
T –
1.0
mile
(ro
ad)
Mo
bile
HA
ZMA
T –
0.5
mile
(rai
l)
Mo
bile
HA
ZMA
T –
1.0
mile
(rai
l)
Infe
ctio
us
Dis
ea
se
FACILITY NAME CITY/TOWN
(if applicable) FACILITY TYPE
Dedeaux- Electric Substation Power/Gas
X X X X X X X X X X X X X X
Diamond Head- Electric Substation Power/Gas
X X X X X X X X X X X X X
Dupont- Electric Substation Power/Gas
X X X X X X X X X X X X X X X
East Biloxi- Electric Substation Power/Gas
X X X X X X X X X X X X X X X X X
Fernwood- Electric Substation Power/Gas
X X X X X X X X X X X X X X
Gay Road- Electric Substation Power/Gas
X X X X X X X X X X X X X X X
Gulf South Pipeline Company LP Power/Gas
X X X X X X X X X X X X X X X
Gulfport 29th Ave- Electric Substation Power/Gas
X X X X X X X X X X X X X X
Highway 53- Electric Substation Power/Gas
X X X X X X X X X X X X X X X
Jack Watson- Electric Substation Power/Gas
X X X X X X X X X X X X X X X X X X X
Keesler- Electric Substation Power/Gas
X X X X X X X X X X X X X X X X X X
Lamey- Electric Substation Power/Gas
X X X X X X X X X X X X X X X
Landon- Electric Substation Power/Gas
X X X X X X X X X X X X X X X X X
Long Beach- Electric Substation Power/Gas
X X X X X X X X X X X X X X

SECTION 6: VULNERABILITY ASSESSMENT
MEMA District 9 Regional Hazard Mitigation Plan DRAFT – February 2017
6:60
Flood-Related Fire-Related G Wind-Related Other Hazards
Dam
an
d L
eve
e F
ailu
re
Ero
sio
n
Flo
od
– 1
00
ye
ar
Flo
od
– 5
00
ye
ar
Flo
od
– V
E-zo
ne
Dro
ugh
t
Ligh
tnin
g
Wild
fire
Eart
hq
uak
e
Extr
em
e C
old
Extr
em
e H
eat
/ H
eat
Wav
e
Hai
lsto
rm
Hu
rric
ane
an
d T
rop
ical
Sto
rm
Seve
re T
hu
nd
ers
torm
/ H
igh
Win
d
Torn
ado
Win
ter
We
ath
er
Sea
Leve
l Ris
e-
3 f
ee
t
Fixe
d H
AZM
AT
– 0
.5 m
ile
Fixe
d H
AZM
AT
– 1
.0 m
ile
Mo
bile
HA
ZMA
T –
0.5
mile
(ro
ad)
Mo
bile
HA
ZMA
T –
1.0
mile
(ro
ad)
Mo
bile
HA
ZMA
T –
0.5
mile
(rai
l)
Mo
bile
HA
ZMA
T –
1.0
mile
(rai
l)
Infe
ctio
us
Dis
ea
se
FACILITY NAME CITY/TOWN
(if applicable) FACILITY TYPE
MG Ind.- Electric Substation Power/Gas
X X X X X X X X X X X X X X
Mississipppi Power Company Power Plant Power/Gas
X X X X X X X X X X X X X X X X X
Munro Petroleum and Terminal Corp. Power/Gas
X X X X X X X X X X X X X X X
O'Neal Road- Electric Substation Power/Gas
X X X X X X X X X X X X X X
Olsen- Electric Substation Power/Gas
X X X X X X X X X X X X X X X X
Pass Christian- Electric Substation Power/Gas
X X X X X X X X X X X X X X X X
Percy Street- Electric Substation Power/Gas
X X X X X X X X X X X X X X X X X
Rodensberg- Electric Substation Power/Gas
X X X X X X X X X X X X X X
Saucier- Electric Substation Power/Gas
X X X X X X X X X X X X X
Saucier CEPA- Electric Substation Power/Gas
X X X X X X X X X X X X X
Steely Drive- Electric Substation Power/Gas
X X X X X X X X X X X X X X X
Sunkist- Electric Substation Power/Gas
X X X X X X X X X X X X X
Tap- Electric Substation Power/Gas
X X X X X X X X X X X X X X

SECTION 6: VULNERABILITY ASSESSMENT
MEMA District 9 Regional Hazard Mitigation Plan DRAFT – February 2017
6:61
Flood-Related Fire-Related G Wind-Related Other Hazards
Dam
an
d L
eve
e F
ailu
re
Ero
sio
n
Flo
od
– 1
00
ye
ar
Flo
od
– 5
00
ye
ar
Flo
od
– V
E-zo
ne
Dro
ugh
t
Ligh
tnin
g
Wild
fire
Eart
hq
uak
e
Extr
em
e C
old
Extr
em
e H
eat
/ H
eat
Wav
e
Hai
lsto
rm
Hu
rric
ane
an
d T
rop
ical
Sto
rm
Seve
re T
hu
nd
ers
torm
/ H
igh
Win
d
Torn
ado
Win
ter
We
ath
er
Sea
Leve
l Ris
e-
3 f
ee
t
Fixe
d H
AZM
AT
– 0
.5 m
ile
Fixe
d H
AZM
AT
– 1
.0 m
ile
Mo
bile
HA
ZMA
T –
0.5
mile
(ro
ad)
Mo
bile
HA
ZMA
T –
1.0
mile
(ro
ad)
Mo
bile
HA
ZMA
T –
0.5
mile
(rai
l)
Mo
bile
HA
ZMA
T –
1.0
mile
(rai
l)
Infe
ctio
us
Dis
ea
se
FACILITY NAME CITY/TOWN
(if applicable) FACILITY TYPE
Tap- Electric Substation Power/Gas
X X X X X X X X X X X X X
Tap- Electric Substation Power/Gas
X X X X X X X X X X X X X X X
Tap- Electric Substation Power/Gas
X X X X X X X X X X X X X
Tap- Electric Substation Power/Gas
X X X X X X X X X X X X
Texas Ave.- Electric Substation Power/Gas
X X X X X X X X X X X X X X X X
Transmission Line- CE Lizana to Tap Power/Gas
X X X X X X X X X X X X
Transmission Line- Dedeaux to Jack Watson Power/Gas
X X X X X X X X X X X X
Transmission Line- Diamond Head to Kiln Power/Gas
X X X X X X X X X X X X
Transmission Line- East Biloxi to Percy Street Power/Gas
X X X X X X X X X X X X
Transmission Line- Fernwood to Jack Watson Power/Gas
X X X X X X X X X X X X
Transmission Line- Fernwood to Texas Ave. Power/Gas
X X X X X X X X X X X X
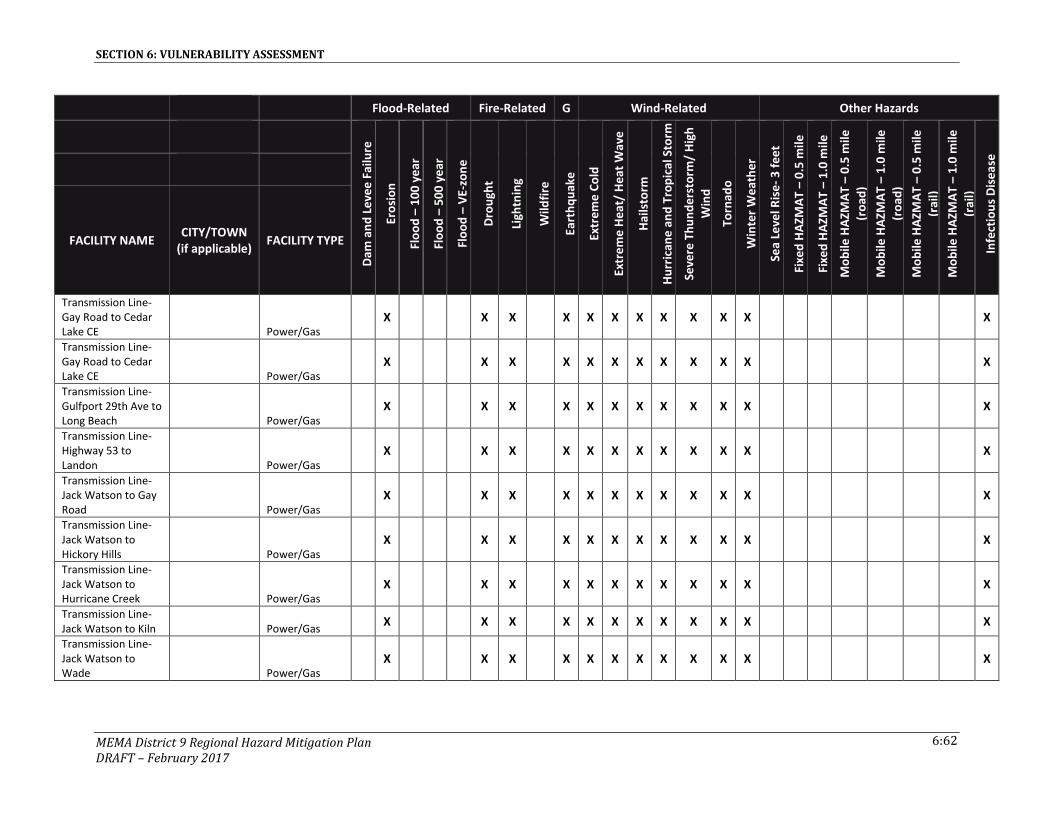
SECTION 6: VULNERABILITY ASSESSMENT
MEMA District 9 Regional Hazard Mitigation Plan DRAFT – February 2017
6:62
Flood-Related Fire-Related G Wind-Related Other Hazards
Dam
an
d L
eve
e F
ailu
re
Ero
sio
n
Flo
od
– 1
00
ye
ar
Flo
od
– 5
00
ye
ar
Flo
od
– V
E-zo
ne
Dro
ugh
t
Ligh
tnin
g
Wild
fire
Eart
hq
uak
e
Extr
em
e C
old
Extr
em
e H
eat
/ H
eat
Wav
e
Hai
lsto
rm
Hu
rric
ane
an
d T
rop
ical
Sto
rm
Seve
re T
hu
nd
ers
torm
/ H
igh
Win
d
Torn
ado
Win
ter
We
ath
er
Sea
Leve
l Ris
e-
3 f
ee
t
Fixe
d H
AZM
AT
– 0
.5 m
ile
Fixe
d H
AZM
AT
– 1
.0 m
ile
Mo
bile
HA
ZMA
T –
0.5
mile
(ro
ad)
Mo
bile
HA
ZMA
T –
1.0
mile
(ro
ad)
Mo
bile
HA
ZMA
T –
0.5
mile
(rai
l)
Mo
bile
HA
ZMA
T –
1.0
mile
(rai
l)
Infe
ctio
us
Dis
ea
se
FACILITY NAME CITY/TOWN
(if applicable) FACILITY TYPE
Transmission Line- Gay Road to Cedar Lake CE Power/Gas
X X X X X X X X X X X X
Transmission Line- Gay Road to Cedar Lake CE Power/Gas
X X X X X X X X X X X X
Transmission Line- Gulfport 29th Ave to Long Beach Power/Gas
X X X X X X X X X X X X
Transmission Line- Highway 53 to Landon Power/Gas
X X X X X X X X X X X X
Transmission Line- Jack Watson to Gay Road Power/Gas
X X X X X X X X X X X X
Transmission Line- Jack Watson to Hickory Hills Power/Gas
X X X X X X X X X X X X
Transmission Line- Jack Watson to Hurricane Creek Power/Gas
X X X X X X X X X X X X
Transmission Line- Jack Watson to Kiln Power/Gas
X X X X X X X X X X X X
Transmission Line- Jack Watson to Wade Power/Gas
X X X X X X X X X X X X

SECTION 6: VULNERABILITY ASSESSMENT
MEMA District 9 Regional Hazard Mitigation Plan DRAFT – February 2017
6:63
Flood-Related Fire-Related G Wind-Related Other Hazards
Dam
an
d L
eve
e F
ailu
re
Ero
sio
n
Flo
od
– 1
00
ye
ar
Flo
od
– 5
00
ye
ar
Flo
od
– V
E-zo
ne
Dro
ugh
t
Ligh
tnin
g
Wild
fire
Eart
hq
uak
e
Extr
em
e C
old
Extr
em
e H
eat
/ H
eat
Wav
e
Hai
lsto
rm
Hu
rric
ane
an
d T
rop
ical
Sto
rm
Seve
re T
hu
nd
ers
torm
/ H
igh
Win
d
Torn
ado
Win
ter
We
ath
er
Sea
Leve
l Ris
e-
3 f
ee
t
Fixe
d H
AZM
AT
– 0
.5 m
ile
Fixe
d H
AZM
AT
– 1
.0 m
ile
Mo
bile
HA
ZMA
T –
0.5
mile
(ro
ad)
Mo
bile
HA
ZMA
T –
1.0
mile
(ro
ad)
Mo
bile
HA
ZMA
T –
0.5
mile
(rai
l)
Mo
bile
HA
ZMA
T –
1.0
mile
(rai
l)
Infe
ctio
us
Dis
ea
se
FACILITY NAME CITY/TOWN
(if applicable) FACILITY TYPE
Transmission Line- Jack Watson to Woolmarket Power/Gas
X X X X X X X X X X X X
Transmission Line- Keesler to Rodensberg Power/Gas
X X X X X X X X X X X X
Transmission Line- Kiln to Dupont Power/Gas
X X X X X X X X X X X X
Transmission Line- Lamey to Gay Road Power/Gas
X X X X X X X X X X X X
Transmission Line- Landon to Dedeaux Power/Gas
X X X X X X X X X X X X
Transmission Line- Landon to Diamond Head Power/Gas
X X X X X X X X X X X X
Transmission Line- Landon to Jack Watson Power/Gas
X X X X X X X X X X X X
Transmission Line- Landon to Long Beach Power/Gas
X X X X X X X X X X X X
Transmission Line- Landon to O'Neal Road Power/Gas
X X X X X X X X X X X X
Transmission Line- Landon to Tap Power/Gas
X X X X X X X X X X X X
Transmission Line- Long Beach to Olsen Power/Gas
X X X X X X X X X X X X

SECTION 6: VULNERABILITY ASSESSMENT
MEMA District 9 Regional Hazard Mitigation Plan DRAFT – February 2017
6:64
Flood-Related Fire-Related G Wind-Related Other Hazards
Dam
an
d L
eve
e F
ailu
re
Ero
sio
n
Flo
od
– 1
00
ye
ar
Flo
od
– 5
00
ye
ar
Flo
od
– V
E-zo
ne
Dro
ugh
t
Ligh
tnin
g
Wild
fire
Eart
hq
uak
e
Extr
em
e C
old
Extr
em
e H
eat
/ H
eat
Wav
e
Hai
lsto
rm
Hu
rric
ane
an
d T
rop
ical
Sto
rm
Seve
re T
hu
nd
ers
torm
/ H
igh
Win
d
Torn
ado
Win
ter
We
ath
er
Sea
Leve
l Ris
e-
3 f
ee
t
Fixe
d H
AZM
AT
– 0
.5 m
ile
Fixe
d H
AZM
AT
– 1
.0 m
ile
Mo
bile
HA
ZMA
T –
0.5
mile
(ro
ad)
Mo
bile
HA
ZMA
T –
1.0
mile
(ro
ad)
Mo
bile
HA
ZMA
T –
0.5
mile
(rai
l)
Mo
bile
HA
ZMA
T –
1.0
mile
(rai
l)
Infe
ctio
us
Dis
ea
se
FACILITY NAME CITY/TOWN
(if applicable) FACILITY TYPE
Transmission Line- O'Neal Road to Jack Watson Power/Gas
X X X X X X X X X X X X
Transmission Line- Olsen to Pass Christian Power/Gas
X X X X X X X X X X X X
Transmission Line- Pass Christian to Dupont Power/Gas
X X X X X X X X X X X X
Transmission Line- Percy Street to Keesler Power/Gas
X X X X X X X X X X X X
Transmission Line- Plant - Jack Watson to Sub - Jack Watson Power/Gas
X X X X X X X X X X X X
Transmission Line- Rodensberg to Steely Drive Power/Gas
X X X X X X X X X X X X
Transmission Line- Rodensberg to Sunkist Power/Gas
X X X X X X X X X X X X
Transmission Line- Saucier CEPA to Highway 53 Power/Gas
X X X X X X X X X X X X
Transmission Line- Saucier to Saucier CEPA Power/Gas
X X X X X X X X X X X X

SECTION 6: VULNERABILITY ASSESSMENT
MEMA District 9 Regional Hazard Mitigation Plan DRAFT – February 2017
6:65
Flood-Related Fire-Related G Wind-Related Other Hazards
Dam
an
d L
eve
e F
ailu
re
Ero
sio
n
Flo
od
– 1
00
ye
ar
Flo
od
– 5
00
ye
ar
Flo
od
– V
E-zo
ne
Dro
ugh
t
Ligh
tnin
g
Wild
fire
Eart
hq
uak
e
Extr
em
e C
old
Extr
em
e H
eat
/ H
eat
Wav
e
Hai
lsto
rm
Hu
rric
ane
an
d T
rop
ical
Sto
rm
Seve
re T
hu
nd
ers
torm
/ H
igh
Win
d
Torn
ado
Win
ter
We
ath
er
Sea
Leve
l Ris
e-
3 f
ee
t
Fixe
d H
AZM
AT
– 0
.5 m
ile
Fixe
d H
AZM
AT
– 1
.0 m
ile
Mo
bile
HA
ZMA
T –
0.5
mile
(ro
ad)
Mo
bile
HA
ZMA
T –
1.0
mile
(ro
ad)
Mo
bile
HA
ZMA
T –
0.5
mile
(rai
l)
Mo
bile
HA
ZMA
T –
1.0
mile
(rai
l)
Infe
ctio
us
Dis
ea
se
FACILITY NAME CITY/TOWN
(if applicable) FACILITY TYPE
Transmission Line- St. Martin to Cedar Lake CE Power/Gas
X X X X X X X X X X X X
Transmission Line- Steely Drive to Fernwood Power/Gas
X X X X X X X X X X X X
Transmission Line- Sunkist to Cedar Lake CE Power/Gas
X X X X X X X X X X X X
Transmission Line- Tap to Canal Road Power/Gas
X X X X X X X X X X X X
Transmission Line- Tap to MG Ind. Power/Gas
X X X X X X X X X X X X
Transmission Line- Tap to O'Neal Road Power/Gas
X X X X X X X X X X X X
Transmission Line- Tap to Watts Power/Gas
X X X X X X X X X X X X
Transmission Line- Texas Ave. to Gulfport 29th Ave Power/Gas
X X X X X X X X X X X X
Transmission Line- Victor J Daniel Jr to McKnight Power/Gas
X X X X X X X X X X X X
Transmission Line- Wiggins to Saucier Power/Gas
X X X X X X X X X X X X
Transmission Line- Woolmarket to Lamey Power/Gas
X X X X X X X X X X X X

SECTION 6: VULNERABILITY ASSESSMENT
MEMA District 9 Regional Hazard Mitigation Plan DRAFT – February 2017
6:66
Flood-Related Fire-Related G Wind-Related Other Hazards
Dam
an
d L
eve
e F
ailu
re
Ero
sio
n
Flo
od
– 1
00
ye
ar
Flo
od
– 5
00
ye
ar
Flo
od
– V
E-zo
ne
Dro
ugh
t
Ligh
tnin
g
Wild
fire
Eart
hq
uak
e
Extr
em
e C
old
Extr
em
e H
eat
/ H
eat
Wav
e
Hai
lsto
rm
Hu
rric
ane
an
d T
rop
ical
Sto
rm
Seve
re T
hu
nd
ers
torm
/ H
igh
Win
d
Torn
ado
Win
ter
We
ath
er
Sea
Leve
l Ris
e-
3 f
ee
t
Fixe
d H
AZM
AT
– 0
.5 m
ile
Fixe
d H
AZM
AT
– 1
.0 m
ile
Mo
bile
HA
ZMA
T –
0.5
mile
(ro
ad)
Mo
bile
HA
ZMA
T –
1.0
mile
(ro
ad)
Mo
bile
HA
ZMA
T –
0.5
mile
(rai
l)
Mo
bile
HA
ZMA
T –
1.0
mile
(rai
l)
Infe
ctio
us
Dis
ea
se
FACILITY NAME CITY/TOWN
(if applicable) FACILITY TYPE
Watts- Electric Substation Power/Gas
X X X X X X X X X X X X
Woolmarket- Electric Substation Power/Gas
X X X X X X X X X X X X X X X X X
Harrison County Courthouse Public Facility
X X X X X X X X X X X X X X X X
DIberville Elementary School School
X X X X X X X X X X X X X X
Diberville Senior High School School
X X X X X X X X X X X X X X X X
East Harrison High School School
X X X X X X X X X X X X X X
Harrison Central 9th Grade School School
X X X X X X X X X X X X X X X X X X
Harrison Central Elementary School School
X X X X X X X X X X X X X X X X X
Harrison Central High School School
X X X X X X X X X X X X X X X X
Harrison County Alternative School School
X X X X X X X X X X X X X X X X X
Harrison County Child Development Center School
X X X X X X X X X X X X X X X X
Harrison County Vocational Complex School
X X X X X X X X X X X X X X X X
Lizana Elementary School School
X X X X X X X X X X X X X

SECTION 6: VULNERABILITY ASSESSMENT
MEMA District 9 Regional Hazard Mitigation Plan DRAFT – February 2017
6:67
Flood-Related Fire-Related G Wind-Related Other Hazards
Dam
an
d L
eve
e F
ailu
re
Ero
sio
n
Flo
od
– 1
00
ye
ar
Flo
od
– 5
00
ye
ar
Flo
od
– V
E-zo
ne
Dro
ugh
t
Ligh
tnin
g
Wild
fire
Eart
hq
uak
e
Extr
em
e C
old
Extr
em
e H
eat
/ H
eat
Wav
e
Hai
lsto
rm
Hu
rric
ane
an
d T
rop
ical
Sto
rm
Seve
re T
hu
nd
ers
torm
/ H
igh
Win
d
Torn
ado
Win
ter
We
ath
er
Sea
Leve
l Ris
e-
3 f
ee
t
Fixe
d H
AZM
AT
– 0
.5 m
ile
Fixe
d H
AZM
AT
– 1
.0 m
ile
Mo
bile
HA
ZMA
T –
0.5
mile
(ro
ad)
Mo
bile
HA
ZMA
T –
1.0
mile
(ro
ad)
Mo
bile
HA
ZMA
T –
0.5
mile
(rai
l)
Mo
bile
HA
ZMA
T –
1.0
mile
(rai
l)
Infe
ctio
us
Dis
ea
se
FACILITY NAME CITY/TOWN
(if applicable) FACILITY TYPE
Lyman Elementary School School
X X X X X X X X X X X X X X X X X
North Gulfport Seventh and Eighth School School
X X X X X X X X X X X X X X X X X
North Woolmarket Elementary School School
X X X X X X X X X X X X X X X X
Orange Grove Elementary School School
X X X X X X X X X X X X X X X X X
Pineville Elementary School School
X X X X X X X X X X X X X X
Three Rivers Elementary School School
X X X X X X X X X X X X X
West Harrison High School School
X X X X X X X X X X X X
West Wortham Elementary and Middle School School
X X X X X X X X X X X X X
Woolmarket Elementary School School
X X X X X X X X X X X X X
Gulfport-Biloxi Regional Airport Transportation
X X X X X X X X X X X X
Biloxi Communications Center Biloxi Comm
X X X X X X X X X X X X X X X
Communications Tower Biloxi Comm
X X X X X X X X X X X X X X X

SECTION 6: VULNERABILITY ASSESSMENT
MEMA District 9 Regional Hazard Mitigation Plan DRAFT – February 2017
6:68
Flood-Related Fire-Related G Wind-Related Other Hazards
Dam
an
d L
eve
e F
ailu
re
Ero
sio
n
Flo
od
– 1
00
ye
ar
Flo
od
– 5
00
ye
ar
Flo
od
– V
E-zo
ne
Dro
ugh
t
Ligh
tnin
g
Wild
fire
Eart
hq
uak
e
Extr
em
e C
old
Extr
em
e H
eat
/ H
eat
Wav
e
Hai
lsto
rm
Hu
rric
ane
an
d T
rop
ical
Sto
rm
Seve
re T
hu
nd
ers
torm
/ H
igh
Win
d
Torn
ado
Win
ter
We
ath
er
Sea
Leve
l Ris
e-
3 f
ee
t
Fixe
d H
AZM
AT
– 0
.5 m
ile
Fixe
d H
AZM
AT
– 1
.0 m
ile
Mo
bile
HA
ZMA
T –
0.5
mile
(ro
ad)
Mo
bile
HA
ZMA
T –
1.0
mile
(ro
ad)
Mo
bile
HA
ZMA
T –
0.5
mile
(rai
l)
Mo
bile
HA
ZMA
T –
1.0
mile
(rai
l)
Infe
ctio
us
Dis
ea
se
FACILITY NAME CITY/TOWN
(if applicable) FACILITY TYPE
WLOX TV-13 Biloxi Comm X X X X X X X X X X X X X X X X X
Biloxi Emergency Operations Biloxi EOC
X X X X X X X X X X X X X X X X X
Back Bay-Fire Station #3 Biloxi Fire Station
X X X X X X X X X X X X X X X X
Bay Vista-Fire Station #5 Biloxi Fire Station
X X X X X X X X X X X X X X X X
Cedar Lake/Popps Ferry-Fire Station #7 Biloxi Fire Station
X X X X X X X X X X X X X X X
Central-Fire Station #1 Biloxi Fire Station
X X X X X X X X X X X X X X X X X
East End-Fire Station #2 Biloxi Fire Station
X X X X X X X X X X X X X X X X X
Oaklawn Rd-Fire Station #9 Biloxi Fire Station
X X X X X X X X X X X X X X X
Popps Ferry-Fire Station #6 Biloxi Fire Station
X X X X X X X X X X X X X
Veterans-Fire Station #4 Biloxi Fire Station
X X X X X X X X X X X X X X X X X
Woolmarket- Fire Station #8 Biloxi Fire Station
X X X X X X X X X X X X X X X
Cedar Lake Medical Center Biloxi Medical
X X X X X X X X X X X X X X
Gulf Coast Medical Center Biloxi Medical
X X X X X X X X X X X X X X X X X
Gulf Oak Hospital Biloxi Medical X X X X X X X X X X X X X X X X X

SECTION 6: VULNERABILITY ASSESSMENT
MEMA District 9 Regional Hazard Mitigation Plan DRAFT – February 2017
6:69
Flood-Related Fire-Related G Wind-Related Other Hazards
Dam
an
d L
eve
e F
ailu
re
Ero
sio
n
Flo
od
– 1
00
ye
ar
Flo
od
– 5
00
ye
ar
Flo
od
– V
E-zo
ne
Dro
ugh
t
Ligh
tnin
g
Wild
fire
Eart
hq
uak
e
Extr
em
e C
old
Extr
em
e H
eat
/ H
eat
Wav
e
Hai
lsto
rm
Hu
rric
ane
an
d T
rop
ical
Sto
rm
Seve
re T
hu
nd
ers
torm
/ H
igh
Win
d
Torn
ado
Win
ter
We
ath
er
Sea
Leve
l Ris
e-
3 f
ee
t
Fixe
d H
AZM
AT
– 0
.5 m
ile
Fixe
d H
AZM
AT
– 1
.0 m
ile
Mo
bile
HA
ZMA
T –
0.5
mile
(ro
ad)
Mo
bile
HA
ZMA
T –
1.0
mile
(ro
ad)
Mo
bile
HA
ZMA
T –
0.5
mile
(rai
l)
Mo
bile
HA
ZMA
T –
1.0
mile
(rai
l)
Infe
ctio
us
Dis
ea
se
FACILITY NAME CITY/TOWN
(if applicable) FACILITY TYPE
Keesler Medical Center Biloxi Medical
X X X X X X X X X X X X X X X X X
Merit Hospital Biloxi Medical X X X X X X X X X X X X X X X X
Veterans Administration Hospital Biloxi Medical
X X X X X X X X X X X X
Harrison County Sheriff Biloxi Police Station
X X X X X X X X X X X X X X X X
Mississippi Marine Patrol Dispatch Biloxi Police Station
X X X X X X X X X X X X X X X X
Police Station-Lopez/Quave Biloxi Police Station
X X X X X X X X X X X X X X X X X
Natural Gas Pipeline Biloxi Power/Gas X X X X X X X X X X X X
Beau Rivage Biloxi Private/Non-Profit
X X X X X X X X X X X X X X X X
Beauvoir Jeff Davis Home & Library Biloxi
Private/Non-Profit
X X X X X X X X X X X X X X X X X X
Bond House Biloxi Private/Non-Profit
X X X X X X X X X X X X X X X X
Boomtown Casino Biloxi Private/Non-Profit
X X X X X X X X X X X X X X X
Cadet Point Biloxi Private/Non-Profit
X X X X X X X X X X X X X X X
Creole Cottage Biloxi Private/Non-Profit
X X X X X X X X X X X X X X X X X
Edgewater Mall Biloxi Private/Non-Profit
X X X X X X X X X X X X X X X X X

SECTION 6: VULNERABILITY ASSESSMENT
MEMA District 9 Regional Hazard Mitigation Plan DRAFT – February 2017
6:70
Flood-Related Fire-Related G Wind-Related Other Hazards
Dam
an
d L
eve
e F
ailu
re
Ero
sio
n
Flo
od
– 1
00
ye
ar
Flo
od
– 5
00
ye
ar
Flo
od
– V
E-zo
ne
Dro
ugh
t
Ligh
tnin
g
Wild
fire
Eart
hq
uak
e
Extr
em
e C
old
Extr
em
e H
eat
/ H
eat
Wav
e
Hai
lsto
rm
Hu
rric
ane
an
d T
rop
ical
Sto
rm
Seve
re T
hu
nd
ers
torm
/ H
igh
Win
d
Torn
ado
Win
ter
We
ath
er
Sea
Leve
l Ris
e-
3 f
ee
t
Fixe
d H
AZM
AT
– 0
.5 m
ile
Fixe
d H
AZM
AT
– 1
.0 m
ile
Mo
bile
HA
ZMA
T –
0.5
mile
(ro
ad)
Mo
bile
HA
ZMA
T –
1.0
mile
(ro
ad)
Mo
bile
HA
ZMA
T –
0.5
mile
(rai
l)
Mo
bile
HA
ZMA
T –
1.0
mile
(rai
l)
Infe
ctio
us
Dis
ea
se
FACILITY NAME CITY/TOWN
(if applicable) FACILITY TYPE
Golden Nugget Casino Biloxi
Private/Non-Profit
X X X X X X X X X X X X X X X
Gray-Slay House Biloxi Private/Non-Profit
X X X X X X X X X X X X
Hard Rock Casino Biloxi Private/Non-Profit
X X X X X X X X X X X X X X X X
Harrah's Gulf Coast Casino Biloxi
Private/Non-Profit
X X X X X X X X X X X X X X X X X
Home Depot Biloxi Private/Non-Profit
X X X X X X X X X X X X X X X
Imperial Palace Resort & Casino Biloxi
Private/Non-Profit
X X X X X X X X X X X X X X X
Magnolia Hotel Biloxi Private/Non-Profit
X X X X X X X X X X X X X X X X X
Margaritaville Casino Biloxi
Private/Non-Profit
X X X X X X X X X X X X
Margaritaville Resort Biloxi
Private/Non-Profit
X X X X X X X X X X X X X X X X
Old Brick House Biloxi Private/Non-Profit
X X X X X X X X X X X X X X
Palace Casino Biloxi Private/Non-Profit
X X X X X X X X X X X X X X X X
Saenger Theatre Biloxi Private/Non-Profit
X X X X X X X X X X X X X X X X
Treasure Bay Casino Biloxi Private/Non-Profit
X X X X X X X X X X X X X X X X X

SECTION 6: VULNERABILITY ASSESSMENT
MEMA District 9 Regional Hazard Mitigation Plan DRAFT – February 2017
6:71
Flood-Related Fire-Related G Wind-Related Other Hazards
Dam
an
d L
eve
e F
ailu
re
Ero
sio
n
Flo
od
– 1
00
ye
ar
Flo
od
– 5
00
ye
ar
Flo
od
– V
E-zo
ne
Dro
ugh
t
Ligh
tnin
g
Wild
fire
Eart
hq
uak
e
Extr
em
e C
old
Extr
em
e H
eat
/ H
eat
Wav
e
Hai
lsto
rm
Hu
rric
ane
an
d T
rop
ical
Sto
rm
Seve
re T
hu
nd
ers
torm
/ H
igh
Win
d
Torn
ado
Win
ter
We
ath
er
Sea
Leve
l Ris
e-
3 f
ee
t
Fixe
d H
AZM
AT
– 0
.5 m
ile
Fixe
d H
AZM
AT
– 1
.0 m
ile
Mo
bile
HA
ZMA
T –
0.5
mile
(ro
ad)
Mo
bile
HA
ZMA
T –
1.0
mile
(ro
ad)
Mo
bile
HA
ZMA
T –
0.5
mile
(rai
l)
Mo
bile
HA
ZMA
T –
1.0
mile
(rai
l)
Infe
ctio
us
Dis
ea
se
FACILITY NAME CITY/TOWN
(if applicable) FACILITY TYPE
Walmart – Neighborhood- 2050 Pass Road Biloxi
Private/Non-Profit
X X X X X X X X X X X X X X X
Walmart – Neighborhood- 1820-A Popps Ferry Road Biloxi
Private/Non-Profit
X X X X X X X X X X X X X X
Walmart Supercenter Biloxi
Private/Non-Profit
X X X X X X X X X X X X X X X X X
West End Hose Co #3 Biloxi
Private/Non-Profit
X X X X X X X X X X X X X X X X
Biloxi Port Commission & Small Craft Harbour Biloxi Public Facility
X X X X X X X X X X X X X X X X X
Biloxi Visitors Center Biloxi Public Facility X X X X X X X X X X X X X X X X X X
City Hall Biloxi Public Facility X X X X X X X X X X X X X X X X X
Coast Transit Authority Biloxi Public Facility
X X X X X X X X X X X X X X X
Community Development Biloxi Public Facility
X X X X X X X X X X X X X X X X X
Donal Snyder Community Center Biloxi Public Facility
X X X X X X X X X X X X X X
Dr Eldon Bolton State Office Bldg Biloxi Public Facility
X X X X X X X X X X X X X X X X
Dr. Frank Gruich, Sr. Community Center Biloxi Public Facility
X X X X X X X X X X X X X X X X X

SECTION 6: VULNERABILITY ASSESSMENT
MEMA District 9 Regional Hazard Mitigation Plan DRAFT – February 2017
6:72
Flood-Related Fire-Related G Wind-Related Other Hazards
Dam
an
d L
eve
e F
ailu
re
Ero
sio
n
Flo
od
– 1
00
ye
ar
Flo
od
– 5
00
ye
ar
Flo
od
– V
E-zo
ne
Dro
ugh
t
Ligh
tnin
g
Wild
fire
Eart
hq
uak
e
Extr
em
e C
old
Extr
em
e H
eat
/ H
eat
Wav
e
Hai
lsto
rm
Hu
rric
ane
an
d T
rop
ical
Sto
rm
Seve
re T
hu
nd
ers
torm
/ H
igh
Win
d
Torn
ado
Win
ter
We
ath
er
Sea
Leve
l Ris
e-
3 f
ee
t
Fixe
d H
AZM
AT
– 0
.5 m
ile
Fixe
d H
AZM
AT
– 1
.0 m
ile
Mo
bile
HA
ZMA
T –
0.5
mile
(ro
ad)
Mo
bile
HA
ZMA
T –
1.0
mile
(ro
ad)
Mo
bile
HA
ZMA
T –
0.5
mile
(rai
l)
Mo
bile
HA
ZMA
T –
1.0
mile
(rai
l)
Infe
ctio
us
Dis
ea
se
FACILITY NAME CITY/TOWN
(if applicable) FACILITY TYPE
East Biloxi Library and Civic Center Biloxi Public Facility
X X X X X X X X X X X X X X X X X
Juvenile Detention Center Biloxi Public Facility
X X X X X X X X X X X X X X
Margaret Sherry Library Biloxi Public Facility
X X X X X X X X X X X X X
MGM Park Biloxi Public Facility X X X X X X X X X X X X X X X X
Mississippi Coast Coliseum & Convention Center Biloxi Public Facility
X X X X X X X X X X X X X X X X X X
Public Safety Garage Biloxi Public Facility X X X X X X X X X X X X
Public Works Biloxi Public Facility X X X X X X X X X X X X X X X X X
Swetman House Biloxi Public Facility X X X X X X X X X X X X X X X X X X X
West Biloxi Public Library Biloxi Public Facility
X X X X X X X X X X X X X X X X
Woolmarket Civic Center Biloxi Public Facility
X X X X X X X X X X X X X X X X X
Beauvoir Elementary Biloxi School
X X X X X X X X X X X X X X X X X
Biloxi High School Biloxi School X X X X X X X X X X X X X X
Biloxi Jr High School Biloxi School X X X X X X X X X X X X X X X X X
Gorenflo Elementary School Biloxi School
X X X X X X X X X X X X X X X X
Jeff Davis Elementary Biloxi School
X X X X X X X X X X X X X X

SECTION 6: VULNERABILITY ASSESSMENT
MEMA District 9 Regional Hazard Mitigation Plan DRAFT – February 2017
6:73
Flood-Related Fire-Related G Wind-Related Other Hazards
Dam
an
d L
eve
e F
ailu
re
Ero
sio
n
Flo
od
– 1
00
ye
ar
Flo
od
– 5
00
ye
ar
Flo
od
– V
E-zo
ne
Dro
ugh
t
Ligh
tnin
g
Wild
fire
Eart
hq
uak
e
Extr
em
e C
old
Extr
em
e H
eat
/ H
eat
Wav
e
Hai
lsto
rm
Hu
rric
ane
an
d T
rop
ical
Sto
rm
Seve
re T
hu
nd
ers
torm
/ H
igh
Win
d
Torn
ado
Win
ter
We
ath
er
Sea
Leve
l Ris
e-
3 f
ee
t
Fixe
d H
AZM
AT
– 0
.5 m
ile
Fixe
d H
AZM
AT
– 1
.0 m
ile
Mo
bile
HA
ZMA
T –
0.5
mile
(ro
ad)
Mo
bile
HA
ZMA
T –
1.0
mile
(ro
ad)
Mo
bile
HA
ZMA
T –
0.5
mile
(rai
l)
Mo
bile
HA
ZMA
T –
1.0
mile
(rai
l)
Infe
ctio
us
Dis
ea
se
FACILITY NAME CITY/TOWN
(if applicable) FACILITY TYPE
Michel 7th Grade School Biloxi School
X X X X X X X X X X X X X X X X X
North Bay Elementary Biloxi School
X X X X X X X X X X X X X X
Popps Ferry Elementary Biloxi School
X X X X X X X X X X X X X X
Woolmarket Elementary Biloxi School
X X X X X X X X X X X X X
Bay Cove Assisted Living Center Biloxi
Special Populations
X X X X X X X X X X X X X X
Biloxi Industries Biloxi Special Populations
X X X X X X X X X X X X X X X X
Biloxi Veterans Administration & Hospital& Retirement Home Biloxi
Special Populations
X X X X X X X X X X X X
Cadet Point Senior Village Biloxi
Special Populations
X X X X X X X X X X X X X X X X X
Cottage Memory Care @ Bay Cove Biloxi
Special Populations
X X X X X X X X X X X X X
Emeritus at Biloxi Biloxi Special Populations
X X X X X X X X X X X X X X X
Gabriel Manor Retirement Community Biloxi
Special Populations
X X X X X X X X X X X X X X X
Gulf Shore Villas Biloxi Special Populations
X X X X X X X X X X X X X X X

SECTION 6: VULNERABILITY ASSESSMENT
MEMA District 9 Regional Hazard Mitigation Plan DRAFT – February 2017
6:74
Flood-Related Fire-Related G Wind-Related Other Hazards
Dam
an
d L
eve
e F
ailu
re
Ero
sio
n
Flo
od
– 1
00
ye
ar
Flo
od
– 5
00
ye
ar
Flo
od
– V
E-zo
ne
Dro
ugh
t
Ligh
tnin
g
Wild
fire
Eart
hq
uak
e
Extr
em
e C
old
Extr
em
e H
eat
/ H
eat
Wav
e
Hai
lsto
rm
Hu
rric
ane
an
d T
rop
ical
Sto
rm
Seve
re T
hu
nd
ers
torm
/ H
igh
Win
d
Torn
ado
Win
ter
We
ath
er
Sea
Leve
l Ris
e-
3 f
ee
t
Fixe
d H
AZM
AT
– 0
.5 m
ile
Fixe
d H
AZM
AT
– 1
.0 m
ile
Mo
bile
HA
ZMA
T –
0.5
mile
(ro
ad)
Mo
bile
HA
ZMA
T –
1.0
mile
(ro
ad)
Mo
bile
HA
ZMA
T –
0.5
mile
(rai
l)
Mo
bile
HA
ZMA
T –
1.0
mile
(rai
l)
Infe
ctio
us
Dis
ea
se
FACILITY NAME CITY/TOWN
(if applicable) FACILITY TYPE
Pillars of Biloxi Biloxi Special Populations
X X X X X X X X X X X X X
Precious Care Home Biloxi Special Populations
X X X X X X X X X X X X X
Santa Maria Senior Community Center Biloxi
Special Populations
X X X X X X X X X X X X X X
Seashore Development Group Biloxi
Special Populations
X X X X X X X X X X X X X X X X X X
South Mississippi Regional Center Biloxi
Special Populations
X X X X X X X X X X X X X X X X X
CSX Railroad Biloxi Transportation X X X X X X X X X X X X X X X X
Keesler Air Force Base Biloxi Transportation
X X X X X X X X X X X X X X X
67 & Oaklawn Well Biloxi Water/ Wastewater
X X X X X X X X X X X X X X X X X X
Bradford St Well Biloxi Water/ Wastewater
X X X X X X X X X X X X X X X X X
Cedar Lake Well Biloxi Water/ Wastewater
X X X X X X X X X X X X X X X X
Debuys Well Biloxi Water/ Wastewater
X X X X X X X X X X X X X X X X
Father Ryan Well Biloxi Water/ Wastewater
X X X X X X X X X X X X X X X X X X
Greater Ave Well Biloxi Water/ Wastewater
X X X X X X X X X X X X X X X X X

SECTION 6: VULNERABILITY ASSESSMENT
MEMA District 9 Regional Hazard Mitigation Plan DRAFT – February 2017
6:75
Flood-Related Fire-Related G Wind-Related Other Hazards
Dam
an
d L
eve
e F
ailu
re
Ero
sio
n
Flo
od
– 1
00
ye
ar
Flo
od
– 5
00
ye
ar
Flo
od
– V
E-zo
ne
Dro
ugh
t
Ligh
tnin
g
Wild
fire
Eart
hq
uak
e
Extr
em
e C
old
Extr
em
e H
eat
/ H
eat
Wav
e
Hai
lsto
rm
Hu
rric
ane
an
d T
rop
ical
Sto
rm
Seve
re T
hu
nd
ers
torm
/ H
igh
Win
d
Torn
ado
Win
ter
We
ath
er
Sea
Leve
l Ris
e-
3 f
ee
t
Fixe
d H
AZM
AT
– 0
.5 m
ile
Fixe
d H
AZM
AT
– 1
.0 m
ile
Mo
bile
HA
ZMA
T –
0.5
mile
(ro
ad)
Mo
bile
HA
ZMA
T –
1.0
mile
(ro
ad)
Mo
bile
HA
ZMA
T –
0.5
mile
(rai
l)
Mo
bile
HA
ZMA
T –
1.0
mile
(rai
l)
Infe
ctio
us
Dis
ea
se
FACILITY NAME CITY/TOWN
(if applicable) FACILITY TYPE
Harrison County Wastewater And Solid Waste Biloxi
Water/ Wastewater
X X X X X X X X X X X X X X X
Harrison County Wastewater And Solid Waste Biloxi
Water/ Wastewater
X X X X X X X X X X X X X X X
Hospital Well Biloxi Water/ Wastewater
X X X X X X X X X X X X X X X
Iberville Well Biloxi Water/ Wastewater
X X X X X X X X X X X X X X X X X X
Kuhn St Well Biloxi Water/ Wastewater
X X X X X X X X X X X X X X X X X
Lakeview Well Biloxi Water/ Wastewater
X X X X X X X X X X X X X X X
Lift Stations throughout City Biloxi
Water/ Wastewater
X X X X X X X X X X X X
Maple St Well Biloxi Water/ Wastewater
X X X X X X X X X X X X X X X X X
New Bay Vista Well Biloxi Water/ Wastewater
X X X X X X X X X X X X X X X X
North Biloxi #1 Well Biloxi Water/ Wastewater
X X X X X X X X X X X X X
North Rivervue Well Biloxi Water/ Wastewater
X X X X X X X X X X X X X X X X
Oaklawn Well Biloxi Water/ Wastewater
X X X X X X X X X X X X X X
Old Bay Vista Well Biloxi Water/ Wastewater
X X X X X X X X X X X X X
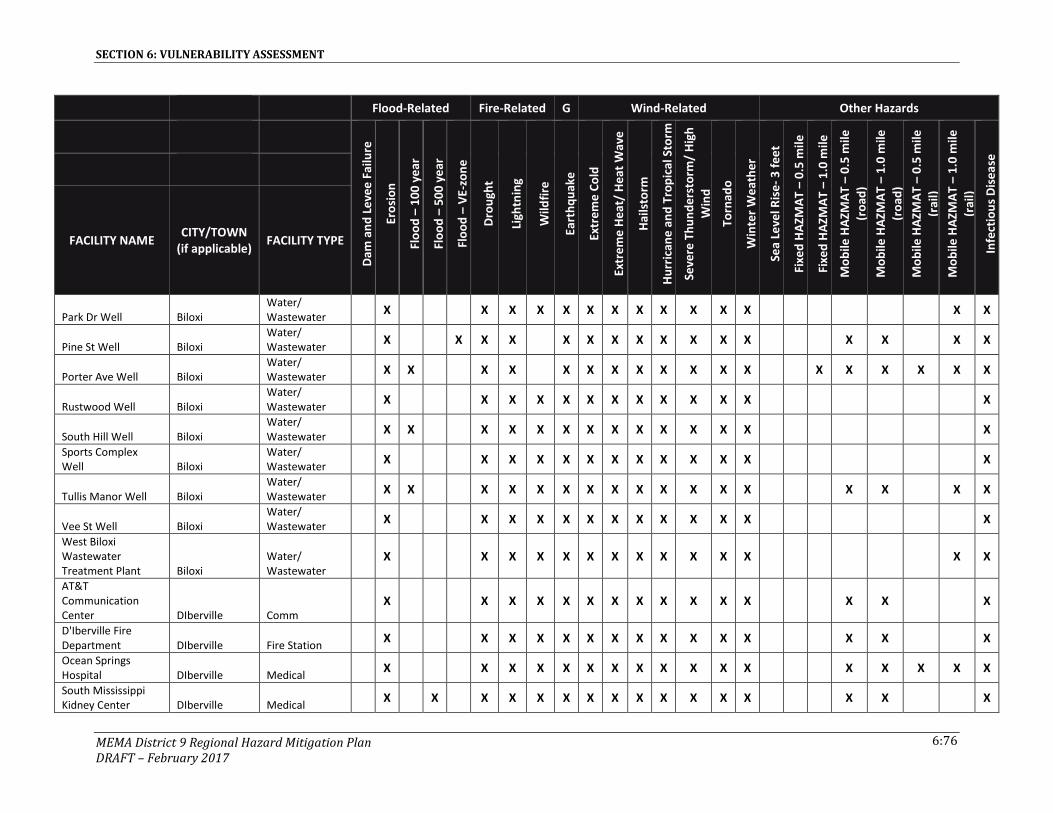
SECTION 6: VULNERABILITY ASSESSMENT
MEMA District 9 Regional Hazard Mitigation Plan DRAFT – February 2017
6:76
Flood-Related Fire-Related G Wind-Related Other Hazards
Dam
an
d L
eve
e F
ailu
re
Ero
sio
n
Flo
od
– 1
00
ye
ar
Flo
od
– 5
00
ye
ar
Flo
od
– V
E-zo
ne
Dro
ugh
t
Ligh
tnin
g
Wild
fire
Eart
hq
uak
e
Extr
em
e C
old
Extr
em
e H
eat
/ H
eat
Wav
e
Hai
lsto
rm
Hu
rric
ane
an
d T
rop
ical
Sto
rm
Seve
re T
hu
nd
ers
torm
/ H
igh
Win
d
Torn
ado
Win
ter
We
ath
er
Sea
Leve
l Ris
e-
3 f
ee
t
Fixe
d H
AZM
AT
– 0
.5 m
ile
Fixe
d H
AZM
AT
– 1
.0 m
ile
Mo
bile
HA
ZMA
T –
0.5
mile
(ro
ad)
Mo
bile
HA
ZMA
T –
1.0
mile
(ro
ad)
Mo
bile
HA
ZMA
T –
0.5
mile
(rai
l)
Mo
bile
HA
ZMA
T –
1.0
mile
(rai
l)
Infe
ctio
us
Dis
ea
se
FACILITY NAME CITY/TOWN
(if applicable) FACILITY TYPE
Park Dr Well Biloxi Water/ Wastewater
X X X X X X X X X X X X X X
Pine St Well Biloxi Water/ Wastewater
X X X X X X X X X X X X X X X X
Porter Ave Well Biloxi Water/ Wastewater
X X X X X X X X X X X X X X X X X X
Rustwood Well Biloxi Water/ Wastewater
X X X X X X X X X X X X X
South Hill Well Biloxi Water/ Wastewater
X X X X X X X X X X X X X X
Sports Complex Well Biloxi
Water/ Wastewater
X X X X X X X X X X X X X
Tullis Manor Well Biloxi Water/ Wastewater
X X X X X X X X X X X X X X X X X
Vee St Well Biloxi Water/ Wastewater
X X X X X X X X X X X X X
West Biloxi Wastewater Treatment Plant Biloxi
Water/ Wastewater
X X X X X X X X X X X X X X
AT&T Communication Center DIberville Comm
X X X X X X X X X X X X X X X
D'Iberville Fire Department DIberville Fire Station
X X X X X X X X X X X X X X X
Ocean Springs Hospital DIberville Medical
X X X X X X X X X X X X X X X X X
South Mississippi Kidney Center DIberville Medical
X X X X X X X X X X X X X X X X

SECTION 6: VULNERABILITY ASSESSMENT
MEMA District 9 Regional Hazard Mitigation Plan DRAFT – February 2017
6:77
Flood-Related Fire-Related G Wind-Related Other Hazards
Dam
an
d L
eve
e F
ailu
re
Ero
sio
n
Flo
od
– 1
00
ye
ar
Flo
od
– 5
00
ye
ar
Flo
od
– V
E-zo
ne
Dro
ugh
t
Ligh
tnin
g
Wild
fire
Eart
hq
uak
e
Extr
em
e C
old
Extr
em
e H
eat
/ H
eat
Wav
e
Hai
lsto
rm
Hu
rric
ane
an
d T
rop
ical
Sto
rm
Seve
re T
hu
nd
ers
torm
/ H
igh
Win
d
Torn
ado
Win
ter
We
ath
er
Sea
Leve
l Ris
e-
3 f
ee
t
Fixe
d H
AZM
AT
– 0
.5 m
ile
Fixe
d H
AZM
AT
– 1
.0 m
ile
Mo
bile
HA
ZMA
T –
0.5
mile
(ro
ad)
Mo
bile
HA
ZMA
T –
1.0
mile
(ro
ad)
Mo
bile
HA
ZMA
T –
0.5
mile
(rai
l)
Mo
bile
HA
ZMA
T –
1.0
mile
(rai
l)
Infe
ctio
us
Dis
ea
se
FACILITY NAME CITY/TOWN
(if applicable) FACILITY TYPE
D'Iberville Police Department DIberville Police Station
X X X X X X X X X X X X X X X X
Blossman Propane Gas DIberville Power/Gas
X X X X X X X X X X X X X X
D'Iberville Electric Substation- 10224 Rodriguez Street DIberville Power/Gas
X X X X X X X X X X X X X X X
D'Iberville Electric Substation- 11281 Clinton Lane DIberville Power/Gas
X X X X X X X X X X X X X X X
Central Avenue Overlook DIberville Public Facility
X X X X X X X X X X X X X X X X
D'Iberville City Hall DIberville Public Facility X X X X X X X X X X X X X X X
D'Iberville Civic Center DIberville Public Facility
X X X X X X X X X X X X X X X
D'Iberville Public Works Center DIberville Public Facility
X X X X X X X X X X X X X X X X
D'Iberville Senior Citizen Center DIberville Public Facility
X X X X X X X X X X X X X X X X
Fountain Beach Complex DIberville Public Facility
X X X X X X X X X X X X X X
Harrison Co. District 1 Work Center DIberville Public Facility
X X X X X X X X X X X X X X X X
Harrison County Public Library DIberville Public Facility
X X X X X X X X X X X X X X X
Marina Complex DIberville Public Facility X X X X X X X X X X X X X X X

SECTION 6: VULNERABILITY ASSESSMENT
MEMA District 9 Regional Hazard Mitigation Plan DRAFT – February 2017
6:78
Flood-Related Fire-Related G Wind-Related Other Hazards
Dam
an
d L
eve
e F
ailu
re
Ero
sio
n
Flo
od
– 1
00
ye
ar
Flo
od
– 5
00
ye
ar
Flo
od
– V
E-zo
ne
Dro
ugh
t
Ligh
tnin
g
Wild
fire
Eart
hq
uak
e
Extr
em
e C
old
Extr
em
e H
eat
/ H
eat
Wav
e
Hai
lsto
rm
Hu
rric
ane
an
d T
rop
ical
Sto
rm
Seve
re T
hu
nd
ers
torm
/ H
igh
Win
d
Torn
ado
Win
ter
We
ath
er
Sea
Leve
l Ris
e-
3 f
ee
t
Fixe
d H
AZM
AT
– 0
.5 m
ile
Fixe
d H
AZM
AT
– 1
.0 m
ile
Mo
bile
HA
ZMA
T –
0.5
mile
(ro
ad)
Mo
bile
HA
ZMA
T –
1.0
mile
(ro
ad)
Mo
bile
HA
ZMA
T –
0.5
mile
(rai
l)
Mo
bile
HA
ZMA
T –
1.0
mile
(rai
l)
Infe
ctio
us
Dis
ea
se
FACILITY NAME CITY/TOWN
(if applicable) FACILITY TYPE
MS Driver's License Facility DIberville Public Facility
X X X X X X X X X X X X X X X
Parks and Recreation Bulding/ D'Iberville Recreation Center DIberville Public Facility
X X X X X X X X X X X X X X
Rudy Moran Park DIberville Public Facility X X X X X X X X X X X X X X X
Town Green DIberville Public Facility X X X X X X X X X X X X X X X
US Post Office DIberville Public Facility X X X X X X X X X X X X X X X
D'Iberville Elementary School DIberville School
X X X X X X X X X X X X X X
D'Iberville High School DIberville School
X X X X X X X X X X X X X X
D'Iberville Middle School DIberville School
X X X X X X X X X X X X X X X X
Sacred Heart School DIberville School X X X X X X X X X X X X X X X
Boys & Girls Club: IP Center at North Bay DIberville
Special Populations
X X X X X X X X X X X X X X X
Gilbert R. Mason Sr. Head Start Center DIberville
Special Populations
X X X X X X X X X X X X X X X
Automall Parkway DIberville Transportation X X X X X X X X X X X X
Bayshore Drive Bridge DIberville Transportation
X X X X X X X X X X X X X X X X
Central Avenue DIberville Transportation X X X X X X X X X X X X

SECTION 6: VULNERABILITY ASSESSMENT
MEMA District 9 Regional Hazard Mitigation Plan DRAFT – February 2017
6:79
Flood-Related Fire-Related G Wind-Related Other Hazards
Dam
an
d L
eve
e F
ailu
re
Ero
sio
n
Flo
od
– 1
00
ye
ar
Flo
od
– 5
00
ye
ar
Flo
od
– V
E-zo
ne
Dro
ugh
t
Ligh
tnin
g
Wild
fire
Eart
hq
uak
e
Extr
em
e C
old
Extr
em
e H
eat
/ H
eat
Wav
e
Hai
lsto
rm
Hu
rric
ane
an
d T
rop
ical
Sto
rm
Seve
re T
hu
nd
ers
torm
/ H
igh
Win
d
Torn
ado
Win
ter
We
ath
er
Sea
Leve
l Ris
e-
3 f
ee
t
Fixe
d H
AZM
AT
– 0
.5 m
ile
Fixe
d H
AZM
AT
– 1
.0 m
ile
Mo
bile
HA
ZMA
T –
0.5
mile
(ro
ad)
Mo
bile
HA
ZMA
T –
1.0
mile
(ro
ad)
Mo
bile
HA
ZMA
T –
0.5
mile
(rai
l)
Mo
bile
HA
ZMA
T –
1.0
mile
(rai
l)
Infe
ctio
us
Dis
ea
se
FACILITY NAME CITY/TOWN
(if applicable) FACILITY TYPE
Corso's Bridge DIberville Transportation X X X X X X X X X X X X X X X X
Cypress Creek Bridge DIberville Transportation
X X X X X X X X X X X X X X X X
D'Iberville Boulevard DIberville Transportation
X X X X X X X X X X X X
HWY 67 Bridge DIberville Transportation X X X X X X X X X X X X X X X X X
I-110 Bridge/ Drawbridge DIberville Transportation
X X X X X X X X X X X X X X X X
Interstate 10 DIberville Transportation X X X X X X X X X X X X
Interstate 110 DIberville Transportation X X X X X X X X X X X X
Lamey Bridge DIberville Transportation X X X X X X X X X X X X X X X
Lamey Bridge Road DIberville Transportation X X X X X X X X X X X X
Lemoyne Boulevard DIberville Transportation X X X X X X X X X X X X
MS Highway 15 DIberville Transportation X X X X X X X X X X X X
MS Highway 67 DIberville Transportation X X X X X X X X X X X X
Old Highway 67 DIberville Transportation X X X X X X X X X X X X
Popps Ferry Road DIberville Transportation X X X X X X X X X X X X
Promenade Parkway DIberville Transportation X X X X X X X X X X X X
Rodriguez Street DIberville Transportation X X X X X X X X X X X X
Sangani Boulevard DIberville Transportation X X X X X X X X X X X X

SECTION 6: VULNERABILITY ASSESSMENT
MEMA District 9 Regional Hazard Mitigation Plan DRAFT – February 2017
6:80
Flood-Related Fire-Related G Wind-Related Other Hazards
Dam
an
d L
eve
e F
ailu
re
Ero
sio
n
Flo
od
– 1
00
ye
ar
Flo
od
– 5
00
ye
ar
Flo
od
– V
E-zo
ne
Dro
ugh
t
Ligh
tnin
g
Wild
fire
Eart
hq
uak
e
Extr
em
e C
old
Extr
em
e H
eat
/ H
eat
Wav
e
Hai
lsto
rm
Hu
rric
ane
an
d T
rop
ical
Sto
rm
Seve
re T
hu
nd
ers
torm
/ H
igh
Win
d
Torn
ado
Win
ter
We
ath
er
Sea
Leve
l Ris
e-
3 f
ee
t
Fixe
d H
AZM
AT
– 0
.5 m
ile
Fixe
d H
AZM
AT
– 1
.0 m
ile
Mo
bile
HA
ZMA
T –
0.5
mile
(ro
ad)
Mo
bile
HA
ZMA
T –
1.0
mile
(ro
ad)
Mo
bile
HA
ZMA
T –
0.5
mile
(rai
l)
Mo
bile
HA
ZMA
T –
1.0
mile
(rai
l)
Infe
ctio
us
Dis
ea
se
FACILITY NAME CITY/TOWN
(if applicable) FACILITY TYPE
D'Iberville Wastewater Plant DIberville
Water/ Wastewater
X X X X X X X X X X X X X X X X
D'Iberville Water Tower- 10085 1st Avenue W DIberville
Water/ Wastewater
X X X X X X X X X X X X X X X X
D'Iberville Water Tower- 11288 Lamey Bridge Road DIberville
Water/ Wastewater
X X X X X X X X X X X X X X X
HC/D'Iberville POTW DIberville
Water/ Wastewater
X X X X X X X X X X X X X X
Central Fire Station Gulfport Fire Station X X X X X X X X X X X X X X X X X
Fire Station 10 Gulfport Fire Station X X X X X X X X X X X X X X X X
Fire Station 11 Gulfport Fire Station X X X X X X X X X X X X X
Fire Station 12 Gulfport Fire Station X X X X X X X X X X X X X X X X
Fire Station 2 Gulfport Fire Station X X X X X X X X X X X X X X X X
Fire Station 3 Gulfport Fire Station X X X X X X X X X X X X X X X X X X
Fire Station 4 Gulfport Fire Station X X X X X X X X X X X X
Fire Station 5 Gulfport Fire Station X X X X X X X X X X X X X X
Fire Station 6 Gulfport Fire Station X X X X X X X X X X X X X X
Fire Station 7 Gulfport Fire Station X X X X X X X X X X X X
Fire Station 8 Gulfport Fire Station X X X X X X X X X X X X X X X X X
Fire Station 9 Gulfport Fire Station X X X X X X X X X X X X X X X X

SECTION 6: VULNERABILITY ASSESSMENT
MEMA District 9 Regional Hazard Mitigation Plan DRAFT – February 2017
6:81
Flood-Related Fire-Related G Wind-Related Other Hazards
Dam
an
d L
eve
e F
ailu
re
Ero
sio
n
Flo
od
– 1
00
ye
ar
Flo
od
– 5
00
ye
ar
Flo
od
– V
E-zo
ne
Dro
ugh
t
Ligh
tnin
g
Wild
fire
Eart
hq
uak
e
Extr
em
e C
old
Extr
em
e H
eat
/ H
eat
Wav
e
Hai
lsto
rm
Hu
rric
ane
an
d T
rop
ical
Sto
rm
Seve
re T
hu
nd
ers
torm
/ H
igh
Win
d
Torn
ado
Win
ter
We
ath
er
Sea
Leve
l Ris
e-
3 f
ee
t
Fixe
d H
AZM
AT
– 0
.5 m
ile
Fixe
d H
AZM
AT
– 1
.0 m
ile
Mo
bile
HA
ZMA
T –
0.5
mile
(ro
ad)
Mo
bile
HA
ZMA
T –
1.0
mile
(ro
ad)
Mo
bile
HA
ZMA
T –
0.5
mile
(rai
l)
Mo
bile
HA
ZMA
T –
1.0
mile
(rai
l)
Infe
ctio
us
Dis
ea
se
FACILITY NAME CITY/TOWN
(if applicable) FACILITY TYPE
Dialysis Centers Gulfport Medical X X X X X X X X X X X X
Garden Park Community Hospital Gulfport Medical
X X X X X X X X X X X X X X X X
Medical Supply Stores Gulfport Medical
X X X X X X X X X X X X
Memorial Hospital at Gulfport Gulfport Medical
X X X X X X X X X X X X X X X X
Harrison County Sheriff's Info Gulfport Police Station
X X X X X X X X X X X X X X X X
Harrison County Sheriff's Office Gulfport Police Station
X X X X X X X X X X X X X X X X X X
North Gulfport Police Complex Gulfport Police Station
X X X X X X X X X X X X X X X X
Orange Grove Police Sub Gulfport Police Station
X X X X X X X X X X X X X X X X X
Police Complex Fleet Maintenance Center Gulfport Police Station
X X X X X X X X X X X X X X
Police Complex Motorcycle Storage/General Gulfport Police Station
X X X X X X X X X X X X X X
Police Complex Technical Service Center Gulfport Police Station
X X X X X X X X X X X X X X
Police Department Old Electronic Shop Gulfport Police Station
X X X X X X X X X X X X X X

SECTION 6: VULNERABILITY ASSESSMENT
MEMA District 9 Regional Hazard Mitigation Plan DRAFT – February 2017
6:82
Flood-Related Fire-Related G Wind-Related Other Hazards
Dam
an
d L
eve
e F
ailu
re
Ero
sio
n
Flo
od
– 1
00
ye
ar
Flo
od
– 5
00
ye
ar
Flo
od
– V
E-zo
ne
Dro
ugh
t
Ligh
tnin
g
Wild
fire
Eart
hq
uak
e
Extr
em
e C
old
Extr
em
e H
eat
/ H
eat
Wav
e
Hai
lsto
rm
Hu
rric
ane
an
d T
rop
ical
Sto
rm
Seve
re T
hu
nd
ers
torm
/ H
igh
Win
d
Torn
ado
Win
ter
We
ath
er
Sea
Leve
l Ris
e-
3 f
ee
t
Fixe
d H
AZM
AT
– 0
.5 m
ile
Fixe
d H
AZM
AT
– 1
.0 m
ile
Mo
bile
HA
ZMA
T –
0.5
mile
(ro
ad)
Mo
bile
HA
ZMA
T –
1.0
mile
(ro
ad)
Mo
bile
HA
ZMA
T –
0.5
mile
(rai
l)
Mo
bile
HA
ZMA
T –
1.0
mile
(rai
l)
Infe
ctio
us
Dis
ea
se
FACILITY NAME CITY/TOWN
(if applicable) FACILITY TYPE
Police Department Pistol Range Gulfport Police Station
X X X X X X X X X X X X X X
Police Training Building Gulfport Police Station
X X X X X X X X X X X X X X
Robert J. Curry Public Safety Center Gulfport Police Station
X X X X X X X X X X X X X X X X X
Fuel Centers Gulfport Power/Gas X X X X X X X X X X X X
Building Supply Centers Gulfport
Private/Non-Profit
X X X X X X X X X X X X
Grocery Stores Gulfport Private/Non-Profit
X X X X X X X X X X X X
Humane Society Gulfport Private/Non-Profit
X X X X X X X X X X X X X X X X X X
Media Outlets Gulfport Private/Non-Profit
X X X X X X X X X X X X
Pharmacies Gulfport Private/Non-Profit
X X X X X X X X X X X X
19th St Recreation Center Gulfport Public Facility
X X X X X X X X X X X X X X X
Armory Building Gulfport Public Facility X X X X X X X X X X X X X X X
Building Maintenance Parks Facility Gulfport Public Facility
X X X X X X X X X X X X X X X
Carnegie Library Gulfport Public Facility X X X X X X X X X X X X X X X X X
Cemetery Admin Office Gulfport Public Facility
X X X X X X X X X X X X X X X X

SECTION 6: VULNERABILITY ASSESSMENT
MEMA District 9 Regional Hazard Mitigation Plan DRAFT – February 2017
6:83
Flood-Related Fire-Related G Wind-Related Other Hazards
Dam
an
d L
eve
e F
ailu
re
Ero
sio
n
Flo
od
– 1
00
ye
ar
Flo
od
– 5
00
ye
ar
Flo
od
– V
E-zo
ne
Dro
ugh
t
Ligh
tnin
g
Wild
fire
Eart
hq
uak
e
Extr
em
e C
old
Extr
em
e H
eat
/ H
eat
Wav
e
Hai
lsto
rm
Hu
rric
ane
an
d T
rop
ical
Sto
rm
Seve
re T
hu
nd
ers
torm
/ H
igh
Win
d
Torn
ado
Win
ter
We
ath
er
Sea
Leve
l Ris
e-
3 f
ee
t
Fixe
d H
AZM
AT
– 0
.5 m
ile
Fixe
d H
AZM
AT
– 1
.0 m
ile
Mo
bile
HA
ZMA
T –
0.5
mile
(ro
ad)
Mo
bile
HA
ZMA
T –
1.0
mile
(ro
ad)
Mo
bile
HA
ZMA
T –
0.5
mile
(rai
l)
Mo
bile
HA
ZMA
T –
1.0
mile
(rai
l)
Infe
ctio
us
Dis
ea
se
FACILITY NAME CITY/TOWN
(if applicable) FACILITY TYPE
Charles L Walker Senior Center Gulfport Public Facility
X X X X X X X X X X X X X X X X X
City Hall Gulfport Public Facility X X X X X X X X X X X X X X X X X
Feed My Sheep Gulfport Public Facility X X X X X X X X X X X X X X X X
Gaston Hewes Rec Center Gulfport Public Facility
X X X X X X X X X X X X X X X X
Gaston Point Community Center Gulfport Public Facility
X X X X X X X X X X X X X X X X
Goldin Park - Maintenance Facility Gulfport Public Facility
X X X X X X X X X X X X X
Grasslawn Museum Support Building Gulfport Public Facility
X X X X X X X X X X X X X X X X X
Handsboro Community Center Gulfport Public Facility
X X X X X X X X X X X X X X
Harbor Services Facility Gulfport Public Facility
X X X X X X X X X X X X X X X X X
Herbert Wilson Rec Center Gulfport Public Facility
X X X X X X X X X X X X X X
Horticulture Building Gulfport Public Facility
X X X X X X X X X X X X X X X X
Joseph T Jones Building Gulfport Public Facility
X X X X X X X X X X X X X X X X X
Katie Patterson Booth Rec Center Gulfport Public Facility
X X X X X X X X X X X X X X X X X
Leisure Service Admin Building Gulfport Public Facility
X X X X X X X X X X X X X X X X

SECTION 6: VULNERABILITY ASSESSMENT
MEMA District 9 Regional Hazard Mitigation Plan DRAFT – February 2017
6:84
Flood-Related Fire-Related G Wind-Related Other Hazards
Dam
an
d L
eve
e F
ailu
re
Ero
sio
n
Flo
od
– 1
00
ye
ar
Flo
od
– 5
00
ye
ar
Flo
od
– V
E-zo
ne
Dro
ugh
t
Ligh
tnin
g
Wild
fire
Eart
hq
uak
e
Extr
em
e C
old
Extr
em
e H
eat
/ H
eat
Wav
e
Hai
lsto
rm
Hu
rric
ane
an
d T
rop
ical
Sto
rm
Seve
re T
hu
nd
ers
torm
/ H
igh
Win
d
Torn
ado
Win
ter
We
ath
er
Sea
Leve
l Ris
e-
3 f
ee
t
Fixe
d H
AZM
AT
– 0
.5 m
ile
Fixe
d H
AZM
AT
– 1
.0 m
ile
Mo
bile
HA
ZMA
T –
0.5
mile
(ro
ad)
Mo
bile
HA
ZMA
T –
1.0
mile
(ro
ad)
Mo
bile
HA
ZMA
T –
0.5
mile
(rai
l)
Mo
bile
HA
ZMA
T –
1.0
mile
(rai
l)
Infe
ctio
us
Dis
ea
se
FACILITY NAME CITY/TOWN
(if applicable) FACILITY TYPE
Lyman Community Center Gulfport Public Facility
X X X X X X X X X X X X X X X X X
National Guard Complex Gulfport Public Facility
X X X X X X X X X X X X
Naval Battalion Construction Center Gulfport Gulfport Public Facility
X X X X X X X X X X X X X X
Orange Grove Community Center Gulfport Public Facility
X X X X X X X X X X X X X X
Public Works Building Gulfport Public Facility
X X X X X X X X X X X X X
Public Works Building 2 Gulfport Public Facility
X X X X X X X X X X X X X
Public Works Warehouse Gulfport Public Facility
X X X X X X X X X X X X X
Records Storage Facility Gulfport Public Facility
X X X X X X X X X X X X
Social Security Office Gulfport Public Facility
X X X X X X X X X X X X X X X X X X
Sportsplex Maintenance Shop 1 (West) Gulfport Public Facility
X X X X X X X X X X X X X X
Sportsplex Maintenance Shop 2 (East) Gulfport Public Facility
X X X X X X X X X X X X X X
U.S. Coast Guard Gulfport Public Facility X X X X X X X X X X X X X X X X X
U.S. Customs Gulfport Public Facility X X X X X X X X X X X X X X X
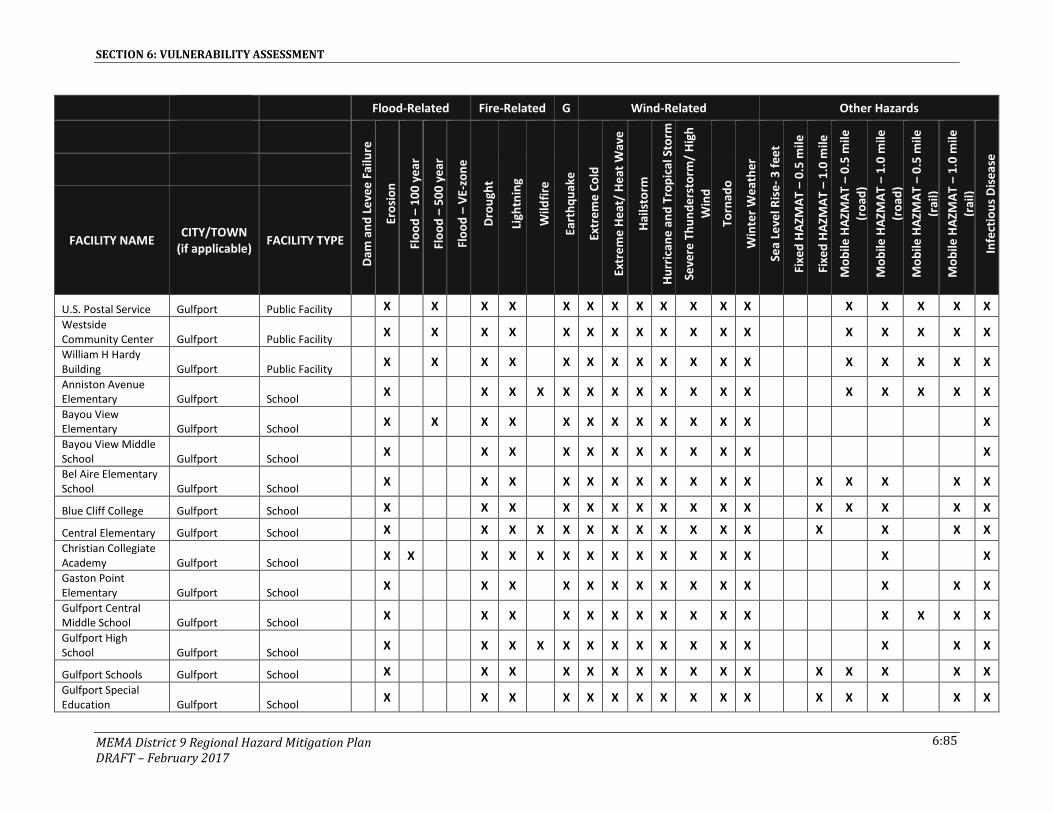
SECTION 6: VULNERABILITY ASSESSMENT
MEMA District 9 Regional Hazard Mitigation Plan DRAFT – February 2017
6:85
Flood-Related Fire-Related G Wind-Related Other Hazards
Dam
an
d L
eve
e F
ailu
re
Ero
sio
n
Flo
od
– 1
00
ye
ar
Flo
od
– 5
00
ye
ar
Flo
od
– V
E-zo
ne
Dro
ugh
t
Ligh
tnin
g
Wild
fire
Eart
hq
uak
e
Extr
em
e C
old
Extr
em
e H
eat
/ H
eat
Wav
e
Hai
lsto
rm
Hu
rric
ane
an
d T
rop
ical
Sto
rm
Seve
re T
hu
nd
ers
torm
/ H
igh
Win
d
Torn
ado
Win
ter
We
ath
er
Sea
Leve
l Ris
e-
3 f
ee
t
Fixe
d H
AZM
AT
– 0
.5 m
ile
Fixe
d H
AZM
AT
– 1
.0 m
ile
Mo
bile
HA
ZMA
T –
0.5
mile
(ro
ad)
Mo
bile
HA
ZMA
T –
1.0
mile
(ro
ad)
Mo
bile
HA
ZMA
T –
0.5
mile
(rai
l)
Mo
bile
HA
ZMA
T –
1.0
mile
(rai
l)
Infe
ctio
us
Dis
ea
se
FACILITY NAME CITY/TOWN
(if applicable) FACILITY TYPE
U.S. Postal Service Gulfport Public Facility X X X X X X X X X X X X X X X X X
Westside Community Center Gulfport Public Facility
X X X X X X X X X X X X X X X X X
William H Hardy Building Gulfport Public Facility
X X X X X X X X X X X X X X X X X
Anniston Avenue Elementary Gulfport School
X X X X X X X X X X X X X X X X X
Bayou View Elementary Gulfport School
X X X X X X X X X X X X X
Bayou View Middle School Gulfport School
X X X X X X X X X X X X
Bel Aire Elementary School Gulfport School
X X X X X X X X X X X X X X X X
Blue Cliff College Gulfport School X X X X X X X X X X X X X X X X
Central Elementary Gulfport School X X X X X X X X X X X X X X X X
Christian Collegiate Academy Gulfport School
X X X X X X X X X X X X X X X
Gaston Point Elementary Gulfport School
X X X X X X X X X X X X X X
Gulfport Central Middle School Gulfport School
X X X X X X X X X X X X X X X
Gulfport High School Gulfport School
X X X X X X X X X X X X X X X
Gulfport Schools Gulfport School X X X X X X X X X X X X X X X X
Gulfport Special Education Gulfport School
X X X X X X X X X X X X X X X X
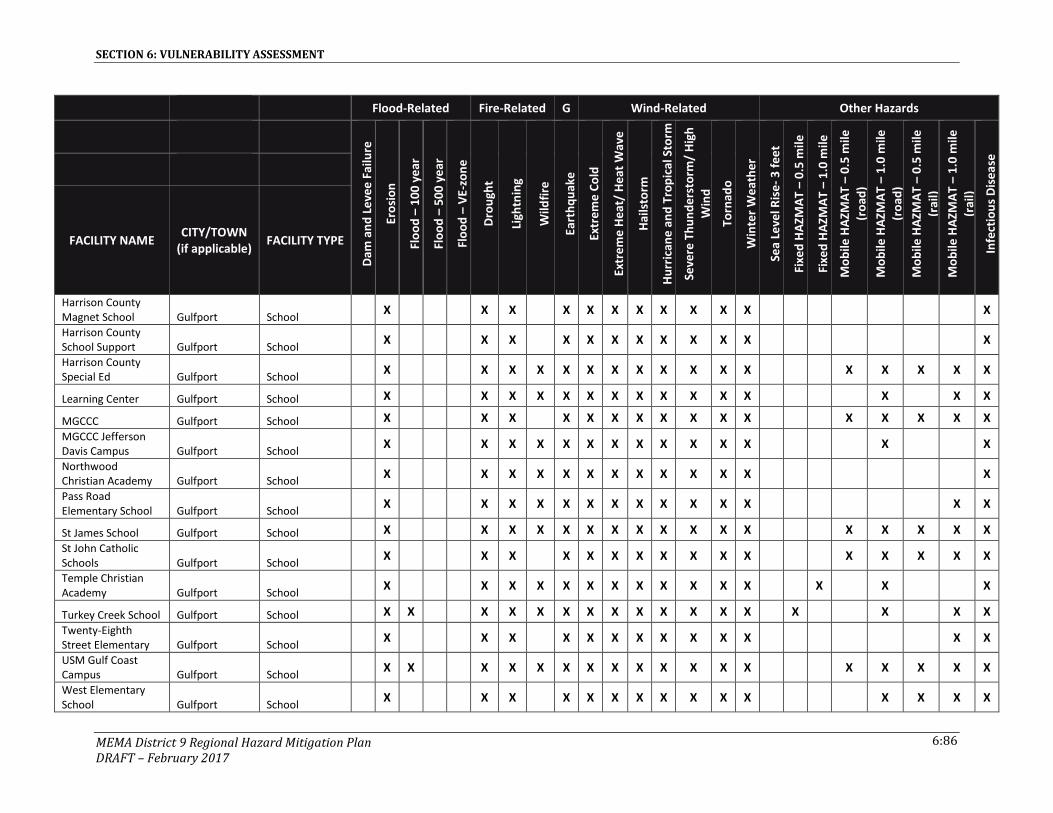
SECTION 6: VULNERABILITY ASSESSMENT
MEMA District 9 Regional Hazard Mitigation Plan DRAFT – February 2017
6:86
Flood-Related Fire-Related G Wind-Related Other Hazards
Dam
an
d L
eve
e F
ailu
re
Ero
sio
n
Flo
od
– 1
00
ye
ar
Flo
od
– 5
00
ye
ar
Flo
od
– V
E-zo
ne
Dro
ugh
t
Ligh
tnin
g
Wild
fire
Eart
hq
uak
e
Extr
em
e C
old
Extr
em
e H
eat
/ H
eat
Wav
e
Hai
lsto
rm
Hu
rric
ane
an
d T
rop
ical
Sto
rm
Seve
re T
hu
nd
ers
torm
/ H
igh
Win
d
Torn
ado
Win
ter
We
ath
er
Sea
Leve
l Ris
e-
3 f
ee
t
Fixe
d H
AZM
AT
– 0
.5 m
ile
Fixe
d H
AZM
AT
– 1
.0 m
ile
Mo
bile
HA
ZMA
T –
0.5
mile
(ro
ad)
Mo
bile
HA
ZMA
T –
1.0
mile
(ro
ad)
Mo
bile
HA
ZMA
T –
0.5
mile
(rai
l)
Mo
bile
HA
ZMA
T –
1.0
mile
(rai
l)
Infe
ctio
us
Dis
ea
se
FACILITY NAME CITY/TOWN
(if applicable) FACILITY TYPE
Harrison County Magnet School Gulfport School
X X X X X X X X X X X X
Harrison County School Support Gulfport School
X X X X X X X X X X X X
Harrison County Special Ed Gulfport School
X X X X X X X X X X X X X X X X X
Learning Center Gulfport School X X X X X X X X X X X X X X X
MGCCC Gulfport School X X X X X X X X X X X X X X X X
MGCCC Jefferson Davis Campus Gulfport School
X X X X X X X X X X X X X X
Northwood Christian Academy Gulfport School
X X X X X X X X X X X X X
Pass Road Elementary School Gulfport School
X X X X X X X X X X X X X X
St James School Gulfport School X X X X X X X X X X X X X X X X X
St John Catholic Schools Gulfport School
X X X X X X X X X X X X X X X X
Temple Christian Academy Gulfport School
X X X X X X X X X X X X X X X
Turkey Creek School Gulfport School X X X X X X X X X X X X X X X X X
Twenty-Eighth Street Elementary Gulfport School
X X X X X X X X X X X X X
USM Gulf Coast Campus Gulfport School
X X X X X X X X X X X X X X X X X X
West Elementary School Gulfport School
X X X X X X X X X X X X X X X

SECTION 6: VULNERABILITY ASSESSMENT
MEMA District 9 Regional Hazard Mitigation Plan DRAFT – February 2017
6:87
Flood-Related Fire-Related G Wind-Related Other Hazards
Dam
an
d L
eve
e F
ailu
re
Ero
sio
n
Flo
od
– 1
00
ye
ar
Flo
od
– 5
00
ye
ar
Flo
od
– V
E-zo
ne
Dro
ugh
t
Ligh
tnin
g
Wild
fire
Eart
hq
uak
e
Extr
em
e C
old
Extr
em
e H
eat
/ H
eat
Wav
e
Hai
lsto
rm
Hu
rric
ane
an
d T
rop
ical
Sto
rm
Seve
re T
hu
nd
ers
torm
/ H
igh
Win
d
Torn
ado
Win
ter
We
ath
er
Sea
Leve
l Ris
e-
3 f
ee
t
Fixe
d H
AZM
AT
– 0
.5 m
ile
Fixe
d H
AZM
AT
– 1
.0 m
ile
Mo
bile
HA
ZMA
T –
0.5
mile
(ro
ad)
Mo
bile
HA
ZMA
T –
1.0
mile
(ro
ad)
Mo
bile
HA
ZMA
T –
0.5
mile
(rai
l)
Mo
bile
HA
ZMA
T –
1.0
mile
(rai
l)
Infe
ctio
us
Dis
ea
se
FACILITY NAME CITY/TOWN
(if applicable) FACILITY TYPE
Westminster Academy School Gulfport School
X X X X X X X X X X X X X
Central Elementary School- Red Cross Shelter Gulfport Shelter
X X X X X X X X X X X X X X X X
Central Middle School- Secondary Shelter Gulfport Shelter
X X X X X X X X X X X X X X X
Orange Grove Community Center- FEMA Shelter Gulfport Shelter
X X X X X X X X X X X X X X
Advanced Psychotherapy Association Gulfport
Special Populations
X X X X X X X X X X X X X X X
All My Children Gulfport Special Populations
X X X X X X X X X X X X X X X
Alpha Personal Care Gulfport Special Populations
X X X X X X X X X X X X
Aunt Donna's Day Care Gulfport
Special Populations
X X X X X X X X X X X X X X X X
Aunt Donna's Daycare & Learning Gulfport
Special Populations
X X X X X X X X X X X X X X X X X
Boyington Pro Care Gulfport Special Populations
X X X X X X X X X X X X X X X X
Carey Jane Gulfport Special Populations
X X X X X X X X X X X X X X X X X
Center-Prevention-Child Abuse Gulfport
Special Populations
X X X X X X X X X X X X X X X X

SECTION 6: VULNERABILITY ASSESSMENT
MEMA District 9 Regional Hazard Mitigation Plan DRAFT – February 2017
6:88
Flood-Related Fire-Related G Wind-Related Other Hazards
Dam
an
d L
eve
e F
ailu
re
Ero
sio
n
Flo
od
– 1
00
ye
ar
Flo
od
– 5
00
ye
ar
Flo
od
– V
E-zo
ne
Dro
ugh
t
Ligh
tnin
g
Wild
fire
Eart
hq
uak
e
Extr
em
e C
old
Extr
em
e H
eat
/ H
eat
Wav
e
Hai
lsto
rm
Hu
rric
ane
an
d T
rop
ical
Sto
rm
Seve
re T
hu
nd
ers
torm
/ H
igh
Win
d
Torn
ado
Win
ter
We
ath
er
Sea
Leve
l Ris
e-
3 f
ee
t
Fixe
d H
AZM
AT
– 0
.5 m
ile
Fixe
d H
AZM
AT
– 1
.0 m
ile
Mo
bile
HA
ZMA
T –
0.5
mile
(ro
ad)
Mo
bile
HA
ZMA
T –
1.0
mile
(ro
ad)
Mo
bile
HA
ZMA
T –
0.5
mile
(rai
l)
Mo
bile
HA
ZMA
T –
1.0
mile
(rai
l)
Infe
ctio
us
Dis
ea
se
FACILITY NAME CITY/TOWN
(if applicable) FACILITY TYPE
Childhood Wonders Gulfport Special Populations
X X X X X X X X X X X X X X X
Christian Collegiate Academy Gulfport
Special Populations
X X X X X X X X X X X X X X
Crises Stabilization Unit Gulfport
Special Populations
X X X X X X X X X X X X X X X X X X
Dickson Rishel Dorothy Gulfport
Special Populations
X X X X X X X X X X X X X X X X
Divine Preschool Academy Gulfport
Special Populations
X X X X X X X X X X X X X X X X
Driftwood Nursing Home Gulfport
Special Populations
X X X X X X X X X X X X X X X X
Good Shepard Christian Academy Gulfport
Special Populations
X X X X X X X X X X X X X X
Gulf Coast Mental Health Center Gulfport
Special Populations
X X X X X X X X X X X X X X X
Gulf Coast Missionary Baptist Gulfport
Special Populations
X X X X X X X X X X X X
Gulfport Academy Child Care Gulfport
Special Populations
X X X X X X X X X X X X X X X X X X X
Gulfport Mental Health Gulfport
Special Populations
X X X X X X X X X X X X
Happy Times Child Care Inc Gulfport
Special Populations
X X X X X X X X X X X X X X X X
Harrison County Head Start Gulfport
Special Populations
X X X X X X X X X X X X X X X X
Jackson Personal Care Home Gulfport
Special Populations
X X X X X X X X X X X X X X X

SECTION 6: VULNERABILITY ASSESSMENT
MEMA District 9 Regional Hazard Mitigation Plan DRAFT – February 2017
6:89
Flood-Related Fire-Related G Wind-Related Other Hazards
Dam
an
d L
eve
e F
ailu
re
Ero
sio
n
Flo
od
– 1
00
ye
ar
Flo
od
– 5
00
ye
ar
Flo
od
– V
E-zo
ne
Dro
ugh
t
Ligh
tnin
g
Wild
fire
Eart
hq
uak
e
Extr
em
e C
old
Extr
em
e H
eat
/ H
eat
Wav
e
Hai
lsto
rm
Hu
rric
ane
an
d T
rop
ical
Sto
rm
Seve
re T
hu
nd
ers
torm
/ H
igh
Win
d
Torn
ado
Win
ter
We
ath
er
Sea
Leve
l Ris
e-
3 f
ee
t
Fixe
d H
AZM
AT
– 0
.5 m
ile
Fixe
d H
AZM
AT
– 1
.0 m
ile
Mo
bile
HA
ZMA
T –
0.5
mile
(ro
ad)
Mo
bile
HA
ZMA
T –
1.0
mile
(ro
ad)
Mo
bile
HA
ZMA
T –
0.5
mile
(rai
l)
Mo
bile
HA
ZMA
T –
1.0
mile
(rai
l)
Infe
ctio
us
Dis
ea
se
FACILITY NAME CITY/TOWN
(if applicable) FACILITY TYPE
Kare-It Patch Day Care Gulfport
Special Populations
X X X X X X X X X X X X X X X
Kid Academy Preschool Gulfport
Special Populations
X X X X X X X X X X X X X X
Kids Connection Gulfport Special Populations
X X X X X X X X X X X X X X X X X
Kids First Child Development Gulfport
Special Populations
X X X X X X X X X X X X X X X X
Kinder Care Learning Center Gulfport
Special Populations
X X X X X X X X X X X X X X X
Lakeview Nursing Center Gulfport
Special Populations
X X X X X X X X X X X X X X X
Lil-Tots Day Care Center Gulfport
Special Populations
X X X X X X X X X X X X X X X X X
Memorial Behavioral Health- 11150 US 49 Gulfport
Special Populations
X X X X X X X X X X X X X X X X
Memorial Behavioral Health- 12266 Ashley Dr Gulfport
Special Populations
X X X X X X X X X X X X X X X X X
Northwood Christian Academy Gulfport
Special Populations
X X X X X X X X X X X X X
Nugent Child Development Center Gulfport
Special Populations
X X X X X X X X X X X X X X X X X
Ovation Learning Center Gulfport
Special Populations
X X X X X X X X X X X X X X X X X

SECTION 6: VULNERABILITY ASSESSMENT
MEMA District 9 Regional Hazard Mitigation Plan DRAFT – February 2017
6:90
Flood-Related Fire-Related G Wind-Related Other Hazards
Dam
an
d L
eve
e F
ailu
re
Ero
sio
n
Flo
od
– 1
00
ye
ar
Flo
od
– 5
00
ye
ar
Flo
od
– V
E-zo
ne
Dro
ugh
t
Ligh
tnin
g
Wild
fire
Eart
hq
uak
e
Extr
em
e C
old
Extr
em
e H
eat
/ H
eat
Wav
e
Hai
lsto
rm
Hu
rric
ane
an
d T
rop
ical
Sto
rm
Seve
re T
hu
nd
ers
torm
/ H
igh
Win
d
Torn
ado
Win
ter
We
ath
er
Sea
Leve
l Ris
e-
3 f
ee
t
Fixe
d H
AZM
AT
– 0
.5 m
ile
Fixe
d H
AZM
AT
– 1
.0 m
ile
Mo
bile
HA
ZMA
T –
0.5
mile
(ro
ad)
Mo
bile
HA
ZMA
T –
1.0
mile
(ro
ad)
Mo
bile
HA
ZMA
T –
0.5
mile
(rai
l)
Mo
bile
HA
ZMA
T –
1.0
mile
(rai
l)
Infe
ctio
us
Dis
ea
se
FACILITY NAME CITY/TOWN
(if applicable) FACILITY TYPE
Pine Grove Coastal Care Center Gulfport
Special Populations
X X X X X X X X X X X X X X X X X X X
Renaissance Counseling Center Gulfport
Special Populations
X X X X X X X X X X X X X X X X X
Seasons Senior Behavioral Health Gulfport
Special Populations
X X X X X X X X X X X X X X X X X X X
Simone & Association PLLC Gulfport
Special Populations
X X X X X X X X X X X X X X X X X
Smith, Kelly - Crossroads Counseling Gulfport
Special Populations
X X X X X X X X X X X X X X X
Staley Teresa Gulfport Special Populations
X X X X X X X X X X X X X X X X X
Sullivan Teresa Gulfport Special Populations
X X X X X X X X X X X X X X X X X
Tate, Vivian - T & T Association LLC Gulfport
Special Populations
X X X X X X X X X X X X X X X
Temple Christian Academy Gulfport
Special Populations
X X X X X X X X X X X X X X
Three Rivers Academy Gulfport
Special Populations
X X X X X X X X X X X X X
Trinity United Methodist School Gulfport
Special Populations
X X X X X X X X X X X X X
Turkey Creek Head Start Program Gulfport
Special Populations
X X X X X X X X X X X X X X X X X
Twin Oaks Child Development Gulfport
Special Populations
X X X X X X X X X X X X X X

SECTION 6: VULNERABILITY ASSESSMENT
MEMA District 9 Regional Hazard Mitigation Plan DRAFT – February 2017
6:91
Flood-Related Fire-Related G Wind-Related Other Hazards
Dam
an
d L
eve
e F
ailu
re
Ero
sio
n
Flo
od
– 1
00
ye
ar
Flo
od
– 5
00
ye
ar
Flo
od
– V
E-zo
ne
Dro
ugh
t
Ligh
tnin
g
Wild
fire
Eart
hq
uak
e
Extr
em
e C
old
Extr
em
e H
eat
/ H
eat
Wav
e
Hai
lsto
rm
Hu
rric
ane
an
d T
rop
ical
Sto
rm
Seve
re T
hu
nd
ers
torm
/ H
igh
Win
d
Torn
ado
Win
ter
We
ath
er
Sea
Leve
l Ris
e-
3 f
ee
t
Fixe
d H
AZM
AT
– 0
.5 m
ile
Fixe
d H
AZM
AT
– 1
.0 m
ile
Mo
bile
HA
ZMA
T –
0.5
mile
(ro
ad)
Mo
bile
HA
ZMA
T –
1.0
mile
(ro
ad)
Mo
bile
HA
ZMA
T –
0.5
mile
(rai
l)
Mo
bile
HA
ZMA
T –
1.0
mile
(rai
l)
Infe
ctio
us
Dis
ea
se
FACILITY NAME CITY/TOWN
(if applicable) FACILITY TYPE
Watch Me Grow Learning Center Gulfport
Special Populations
X X X X X X X X X X X X X X
Wee Ones Child Care Inc Gulfport
Special Populations
X X X X X X X X X X X X X X
Wesley Academy Gulfport Special Populations
X X X X X X X X X X X X X X X X
Westminster Academy School Gulfport
Special Populations
X X X X X X X X X X X X X
Bernard Bayou Industrial District Gulfport
Water/ Wastewater
X X X X X X X X X X X X X X
Harrison County Wastewater And Solid Waste Gulfport
Water/ Wastewater
X X X X X X X X X X X X X
HC/Delisle Wastewater Treatment Gulfport
Water/ Wastewater
X X X X X X X X X X X X X X X X X
South Gulfport Wastewater Treatment Plan Gulfport
Water/ Wastewater
X X X X X X X X X X X X X X X
Fire Station #1 Long Beach Fire Station X X X X X X X X X X X X X
Fire Station #2 Long Beach Fire Station X X X X X X X X X X X X X X X X
Fire Station #3 Long Beach Fire Station X X X X X X X X X X X X X X
Police Department Long Beach Police Station X X X X X X X X X X X X X X X X
City Hall Building Long Beach Public Facility X X X X X X X X X X X X X X X X X
Public Works Center Long Beach Public Facility X X X X X X X X X X X X X X X X

SECTION 6: VULNERABILITY ASSESSMENT
MEMA District 9 Regional Hazard Mitigation Plan DRAFT – February 2017
6:92
Flood-Related Fire-Related G Wind-Related Other Hazards
Dam
an
d L
eve
e F
ailu
re
Ero
sio
n
Flo
od
– 1
00
ye
ar
Flo
od
– 5
00
ye
ar
Flo
od
– V
E-zo
ne
Dro
ugh
t
Ligh
tnin
g
Wild
fire
Eart
hq
uak
e
Extr
em
e C
old
Extr
em
e H
eat
/ H
eat
Wav
e
Hai
lsto
rm
Hu
rric
ane
an
d T
rop
ical
Sto
rm
Seve
re T
hu
nd
ers
torm
/ H
igh
Win
d
Torn
ado
Win
ter
We
ath
er
Sea
Leve
l Ris
e-
3 f
ee
t
Fixe
d H
AZM
AT
– 0
.5 m
ile
Fixe
d H
AZM
AT
– 1
.0 m
ile
Mo
bile
HA
ZMA
T –
0.5
mile
(ro
ad)
Mo
bile
HA
ZMA
T –
1.0
mile
(ro
ad)
Mo
bile
HA
ZMA
T –
0.5
mile
(rai
l)
Mo
bile
HA
ZMA
T –
1.0
mile
(rai
l)
Infe
ctio
us
Dis
ea
se
FACILITY NAME CITY/TOWN
(if applicable) FACILITY TYPE
Senior/Rec Center Long Beach Public Facility X X X X X X X X X X X X X X
South Mississippi Regional Center Long Beach Public Facility
X X X X X X X X X X X X X X X X
Harper McCaughn Elementary Long Beach School
X X X X X X X X X X X X X
High School Long Beach School X X X X X X X X X X X X X X X X
Middle School Long Beach School X X X X X X X X X X X X X X X
Quarles Elementary Long Beach School X X X X X X X X X X X X X
Reeves Elementary Long Beach School X X X X X X X X X X X X X X X X
Chapman Oaks, Inc. Long Beach Special Populations
X X X X X X X X X X X X X
Long Beach Industrial District Park Long Beach
Water/ Wastewater
X X X X X X X X X X X X
Sewage Collection System: Lift Stations, Water Treatment Facility Long Beach
Water/ Wastewater
X X X X X X X X X X X X
Water Distribution System: Wells, Tanks, Treatment Facilities Long Beach
Water/ Wastewater
X X X X X X X X X X X X
Emergency Operations Center Pass Christian EOC
X X X X X X X X X X X X X X X
Fire Station 1 Pass Christian Fire Station X X X X X X X X X X X X X X X X X X

SECTION 6: VULNERABILITY ASSESSMENT
MEMA District 9 Regional Hazard Mitigation Plan DRAFT – February 2017
6:93
Flood-Related Fire-Related G Wind-Related Other Hazards
Dam
an
d L
eve
e F
ailu
re
Ero
sio
n
Flo
od
– 1
00
ye
ar
Flo
od
– 5
00
ye
ar
Flo
od
– V
E-zo
ne
Dro
ugh
t
Ligh
tnin
g
Wild
fire
Eart
hq
uak
e
Extr
em
e C
old
Extr
em
e H
eat
/ H
eat
Wav
e
Hai
lsto
rm
Hu
rric
ane
an
d T
rop
ical
Sto
rm
Seve
re T
hu
nd
ers
torm
/ H
igh
Win
d
Torn
ado
Win
ter
We
ath
er
Sea
Leve
l Ris
e-
3 f
ee
t
Fixe
d H
AZM
AT
– 0
.5 m
ile
Fixe
d H
AZM
AT
– 1
.0 m
ile
Mo
bile
HA
ZMA
T –
0.5
mile
(ro
ad)
Mo
bile
HA
ZMA
T –
1.0
mile
(ro
ad)
Mo
bile
HA
ZMA
T –
0.5
mile
(rai
l)
Mo
bile
HA
ZMA
T –
1.0
mile
(rai
l)
Infe
ctio
us
Dis
ea
se
FACILITY NAME CITY/TOWN
(if applicable) FACILITY TYPE
Fire Station 2 Pass Christian Fire Station X X X X X X X X X X X X X X X X
Coastal Family Health Clinic Pass Christian Medical
X X X X X X X X X X X X X X X X X X
Police Station Pass Christian Police Station X X X X X X X X X X X X X X X
City Hall Pass Christian Public Facility X X X X X X X X X X X X X X X X X X
Pass Christian Library Pass Christian Public Facility
X X X X X X X X X X X X X X X X X X
Public Works Department Pass Christian Public Facility
X X X X X X X X X X X X X X X X X
High School Pass Christian School X X X X X X X X X X X X X X X X
Middle School Pass Christian School X X X X X X X X X X X X X X X X X X
Pass Christian Elementary School Pass Christian School
X X X X X X X X X X X X X X X X X X
Boys and Girls Club Gymnasium Pass Christian
Special Populations
X X X X X X X X X X X X X X X X X X
Dixie White House Pass Christian Special Populations
X X X X X X X X X X X X X X
Henderson Avenue Bridges Pass Christian Transportation
X X X X X X X X X X X X X X
Highway 90, Bay St. Louis Bridge Pass Christian Transportation
X X X X X X X X X X X X X X X
Menge Avenue Bridges Pass Christian Transportation
X X X X X X X X X X X X X X X X

SECTION 6: VULNERABILITY ASSESSMENT
MEMA District 9 Regional Hazard Mitigation Plan DRAFT – February 2017
6:94
Flood-Related Fire-Related G Wind-Related Other Hazards
Dam
an
d L
eve
e F
ailu
re
Ero
sio
n
Flo
od
– 1
00
ye
ar
Flo
od
– 5
00
ye
ar
Flo
od
– V
E-zo
ne
Dro
ugh
t
Ligh
tnin
g
Wild
fire
Eart
hq
uak
e
Extr
em
e C
old
Extr
em
e H
eat
/ H
eat
Wav
e
Hai
lsto
rm
Hu
rric
ane
an
d T
rop
ical
Sto
rm
Seve
re T
hu
nd
ers
torm
/ H
igh
Win
d
Torn
ado
Win
ter
We
ath
er
Sea
Leve
l Ris
e-
3 f
ee
t
Fixe
d H
AZM
AT
– 0
.5 m
ile
Fixe
d H
AZM
AT
– 1
.0 m
ile
Mo
bile
HA
ZMA
T –
0.5
mile
(ro
ad)
Mo
bile
HA
ZMA
T –
1.0
mile
(ro
ad)
Mo
bile
HA
ZMA
T –
0.5
mile
(rai
l)
Mo
bile
HA
ZMA
T –
1.0
mile
(rai
l)
Infe
ctio
us
Dis
ea
se
FACILITY NAME CITY/TOWN
(if applicable) FACILITY TYPE
Harrison County Wastewater And Solid Waste Management Authority, Long Beach And Pass Christian Pass Christian
Water/ Wastewater
X X X X X X X X X X X X X X X X X
Long Beach Pass Christian Wastewater Treatment Pass Christian
Water/ Wastewater
X X X X X X X X X X X X X X X X
Water System Pass Christian Water/ Wastewater
X X X X X X X X X X X X
JACKSON COUNTY EOC Radio Communication Tower Comm
X X X X X X X X X X X X X X X X X
Fontainebleau Radio Communication Tower Comm
X X X X X X X X X X X X X X X X X
Lily Orchard Radio Communication Tower Comm
X X X X X X X X X X X X X
Vancleave Radio Communication Tower Comm
X X X X X X X X X X X X X
County EOC EOC X X X X X X X X X X X X X X X X X

SECTION 6: VULNERABILITY ASSESSMENT
MEMA District 9 Regional Hazard Mitigation Plan DRAFT – February 2017
6:95
Flood-Related Fire-Related G Wind-Related Other Hazards
Dam
an
d L
eve
e F
ailu
re
Ero
sio
n
Flo
od
– 1
00
ye
ar
Flo
od
– 5
00
ye
ar
Flo
od
– V
E-zo
ne
Dro
ugh
t
Ligh
tnin
g
Wild
fire
Eart
hq
uak
e
Extr
em
e C
old
Extr
em
e H
eat
/ H
eat
Wav
e
Hai
lsto
rm
Hu
rric
ane
an
d T
rop
ical
Sto
rm
Seve
re T
hu
nd
ers
torm
/ H
igh
Win
d
Torn
ado
Win
ter
We
ath
er
Sea
Leve
l Ris
e-
3 f
ee
t
Fixe
d H
AZM
AT
– 0
.5 m
ile
Fixe
d H
AZM
AT
– 1
.0 m
ile
Mo
bile
HA
ZMA
T –
0.5
mile
(ro
ad)
Mo
bile
HA
ZMA
T –
1.0
mile
(ro
ad)
Mo
bile
HA
ZMA
T –
0.5
mile
(rai
l)
Mo
bile
HA
ZMA
T –
1.0
mile
(rai
l)
Infe
ctio
us
Dis
ea
se
FACILITY NAME CITY/TOWN
(if applicable) FACILITY TYPE
Central Jackson County Fire Dept - Fontainebleau Fire Station
X X X X X X X X X X X X X X X
Central Jackson County Fire Dept - Vancleave Fire Station
X X X X X X X X X X X X X X
East Central Nutbank Sub Sta. Fire Station
X X X X X X X X X X X X X X X
East Central Sub Sta. Fire Station X X X X X X X X X X X X X X X
East Central Sub Sta. Fire Station X X X X X X X X X X X X X X
Escatawpa Central Fire Sta. Fire Station
X X X X X X X X X X X X X X X
Fontainebleau Main Sta. Fire Station
X X X X X X X X X X X X X X X X
Fontainebleau Sub Sta. Fire Station
X X X X X X X X X X X X X X
Fort Bayou Volunteer Fire Dept - Station 1 Fire Station
X X X X X X X X X X X X X
Fort Bayou Volunteer Fire Dept - Station 2 Fire Station
X X X X X X X X X X X X X X X
Fort Bayou Volunteer Fire Dept - Station 3 Fire Station
X X X X X X X X X X X X X
Fort Ramsay Fire Sta. Fire Station
X X X X X X X X X X X X X

SECTION 6: VULNERABILITY ASSESSMENT
MEMA District 9 Regional Hazard Mitigation Plan DRAFT – February 2017
6:96
Flood-Related Fire-Related G Wind-Related Other Hazards
Dam
an
d L
eve
e F
ailu
re
Ero
sio
n
Flo
od
– 1
00
ye
ar
Flo
od
– 5
00
ye
ar
Flo
od
– V
E-zo
ne
Dro
ugh
t
Ligh
tnin
g
Wild
fire
Eart
hq
uak
e
Extr
em
e C
old
Extr
em
e H
eat
/ H
eat
Wav
e
Hai
lsto
rm
Hu
rric
ane
an
d T
rop
ical
Sto
rm
Seve
re T
hu
nd
ers
torm
/ H
igh
Win
d
Torn
ado
Win
ter
We
ath
er
Sea
Leve
l Ris
e-
3 f
ee
t
Fixe
d H
AZM
AT
– 0
.5 m
ile
Fixe
d H
AZM
AT
– 1
.0 m
ile
Mo
bile
HA
ZMA
T –
0.5
mile
(ro
ad)
Mo
bile
HA
ZMA
T –
1.0
mile
(ro
ad)
Mo
bile
HA
ZMA
T –
0.5
mile
(rai
l)
Mo
bile
HA
ZMA
T –
1.0
mile
(rai
l)
Infe
ctio
us
Dis
ea
se
FACILITY NAME CITY/TOWN
(if applicable) FACILITY TYPE
Forts Lake Main Sta. Fire Station X X X X X X X X X X X X X X
Forts Lake Orange Grove Sub Sta. Fire Station
X X X X X X X X X X X X X X X X X
Gulf Park Est. Fire Sta. Fire Station
X X X X X X X X X X X X X X
Helena Fire Sat. Fire Station X X X X X X X X X X X X X X X X
Latimer Main Sta. Fire Station X X X X X X X X X X X X X
Latimer Sub Sta. Fire Station X X X X X X X X X X X X X
North East Jackson County Fire Dept - East Central Station Fire Station
X X X X X X X X X X X X X X X
North East Jackson County Fire Dept - Three Rivers Station Fire Station
X X X X X X X X X X X X X X X
North Fire Sta. Fire Station X X X X X X X X X X X X X X
South Fire Sta. Fire Station X X X X X X X X X X X X X X
St. Andrews Fire Sta. Fire Station X X X X X X X X X X X X X X
Three Rivers North Sub Sta. Fire Station
X X X X X X X X X X X X X X X
Three Rivers Sub Sta. Fire Station
X X X X X X X X X X X X X X X X X
Vancleave May Lane Sta. Fire Station
X X X X X X X X X X X X X X

SECTION 6: VULNERABILITY ASSESSMENT
MEMA District 9 Regional Hazard Mitigation Plan DRAFT – February 2017
6:97
Flood-Related Fire-Related G Wind-Related Other Hazards
Dam
an
d L
eve
e F
ailu
re
Ero
sio
n
Flo
od
– 1
00
ye
ar
Flo
od
– 5
00
ye
ar
Flo
od
– V
E-zo
ne
Dro
ugh
t
Ligh
tnin
g
Wild
fire
Eart
hq
uak
e
Extr
em
e C
old
Extr
em
e H
eat
/ H
eat
Wav
e
Hai
lsto
rm
Hu
rric
ane
an
d T
rop
ical
Sto
rm
Seve
re T
hu
nd
ers
torm
/ H
igh
Win
d
Torn
ado
Win
ter
We
ath
er
Sea
Leve
l Ris
e-
3 f
ee
t
Fixe
d H
AZM
AT
– 0
.5 m
ile
Fixe
d H
AZM
AT
– 1
.0 m
ile
Mo
bile
HA
ZMA
T –
0.5
mile
(ro
ad)
Mo
bile
HA
ZMA
T –
1.0
mile
(ro
ad)
Mo
bile
HA
ZMA
T –
0.5
mile
(rai
l)
Mo
bile
HA
ZMA
T –
1.0
mile
(rai
l)
Infe
ctio
us
Dis
ea
se
FACILITY NAME CITY/TOWN
(if applicable) FACILITY TYPE
Vancleave Mt Pleasant Sub Sta. Fire Station
X X X X X X X X X X X X X
Vancleave River Rd Sta. Fire Station
X X X X X X X X X X X X X
Vancleave Waltman Rd. Sta. Fire Station
X X X X X X X X X X X X X X X
West Jackson Co. Big Ridge Rd Sta. Fire Station
X X X X X X X X X X X X X X X
West Jackson Co. Sub Fire Station
X X X X X X X X X X X X X X X
Jackson County Sheriff Dept Substation - St. Martin Police Station
X X X X X X X X X X X X X X X
Old School House Private/Non-Profit
X X X X X X X X X X X X X X X X
Aluminum Bleachers Public Facility X X X X X X X X X X X X X X X
Baseball Concesion Public Facility X X X X X X X X X X X X X X X
Batting Cage Public Facility X X X X X X X X X X X X X X X
Boat Ramp - Wood Public Facility X X X X X X X X X X X X X X X X X X
City Hall Annex S Public Facility X X X X X X X X X X X X X X X X X
City Park Pavillion D Public Facility X X X X X X X X X X X X X X X X X
City Park Pavillion E Public Facility X X X X X X X X X X X X X X X X X
City Park Restroom Public Facility X X X X X X X X X X X X X X X X X

SECTION 6: VULNERABILITY ASSESSMENT
MEMA District 9 Regional Hazard Mitigation Plan DRAFT – February 2017
6:98
Flood-Related Fire-Related G Wind-Related Other Hazards
Dam
an
d L
eve
e F
ailu
re
Ero
sio
n
Flo
od
– 1
00
ye
ar
Flo
od
– 5
00
ye
ar
Flo
od
– V
E-zo
ne
Dro
ugh
t
Ligh
tnin
g
Wild
fire
Eart
hq
uak
e
Extr
em
e C
old
Extr
em
e H
eat
/ H
eat
Wav
e
Hai
lsto
rm
Hu
rric
ane
an
d T
rop
ical
Sto
rm
Seve
re T
hu
nd
ers
torm
/ H
igh
Win
d
Torn
ado
Win
ter
We
ath
er
Sea
Leve
l Ris
e-
3 f
ee
t
Fixe
d H
AZM
AT
– 0
.5 m
ile
Fixe
d H
AZM
AT
– 1
.0 m
ile
Mo
bile
HA
ZMA
T –
0.5
mile
(ro
ad)
Mo
bile
HA
ZMA
T –
1.0
mile
(ro
ad)
Mo
bile
HA
ZMA
T –
0.5
mile
(rai
l)
Mo
bile
HA
ZMA
T –
1.0
mile
(rai
l)
Infe
ctio
us
Dis
ea
se
FACILITY NAME CITY/TOWN
(if applicable) FACILITY TYPE
City Park Storage Public Facility X X X X X X X X X X X X X X X X X
County Health Department Public Facility
X X X X X X X X X X X X X X X X X
Football Concession Public Facility X X X X X X X X X X X X X X X
Football Pressbox - N Public Facility
X X X X X X X X X X X X X X X
Football Pressbox - S Public Facility X X X X X X X X X X X X X X X
Jackson County Complex Public Facility
X X X X X X X X X X X X X X X X X X
Jackson County Complex - Jefferson Street Public Facility
X X X X X X X X X X X X X X X
Jackson County Fairgrounds (Primary POD site) Public Facility
X X X X X X X X X X X X X X X X X
Jackson County Main Road Office Public Facility
X X X X X X X X X X X X X
Outside Property Public Facility X X X X X X X X X X X X
Park Restrooms Public Facility X X X X X X X X X X X X X X X
PW Storage Barn Public Facility X X X X X X X X X X X X X X X X
PW Warehouse Public Facility X X X X X X X X X X X X X X X X X
Recreation Dept. Public Facility X X X X X X X X X X X X X X X
School Hse Storage Public Facility X X X X X X X X X X X X X X X X

SECTION 6: VULNERABILITY ASSESSMENT
MEMA District 9 Regional Hazard Mitigation Plan DRAFT – February 2017
6:99
Flood-Related Fire-Related G Wind-Related Other Hazards
Dam
an
d L
eve
e F
ailu
re
Ero
sio
n
Flo
od
– 1
00
ye
ar
Flo
od
– 5
00
ye
ar
Flo
od
– V
E-zo
ne
Dro
ugh
t
Ligh
tnin
g
Wild
fire
Eart
hq
uak
e
Extr
em
e C
old
Extr
em
e H
eat
/ H
eat
Wav
e
Hai
lsto
rm
Hu
rric
ane
an
d T
rop
ical
Sto
rm
Seve
re T
hu
nd
ers
torm
/ H
igh
Win
d
Torn
ado
Win
ter
We
ath
er
Sea
Leve
l Ris
e-
3 f
ee
t
Fixe
d H
AZM
AT
– 0
.5 m
ile
Fixe
d H
AZM
AT
– 1
.0 m
ile
Mo
bile
HA
ZMA
T –
0.5
mile
(ro
ad)
Mo
bile
HA
ZMA
T –
1.0
mile
(ro
ad)
Mo
bile
HA
ZMA
T –
0.5
mile
(rai
l)
Mo
bile
HA
ZMA
T –
1.0
mile
(rai
l)
Infe
ctio
us
Dis
ea
se
FACILITY NAME CITY/TOWN
(if applicable) FACILITY TYPE
Senior Bldg Public Facility X X X X X X X X X X X X X X X X
Storage Bldg Public Facility X X X X X X X X X X X X X X X
Storage Warehouse Public Facility X X X X X X X X X X X X X X X X
Vancleave Arena (Secondary POD site) Public Facility
X X X X X X X X X X X X X X
Warehouse (Maint) Public Facility X X X X X X X X X X X X X X X X
Alternative School School X X X X X X X X X X X X X X X
East Central High School School
X X X X X X X X X X X X X
East Central Lower Elementary School
X X X X X X X X X X X X X
East Central Middle School School
X X X X X X X X X X X X X
East Central Upper Elementary School
X X X X X X X X X X X X X
Jackson County Alternative School - Vancleave School
X X X X X X X X X X X X X X X
Jackson County Technology Center - Vancleave School
X X X X X X X X X X X X X X

SECTION 6: VULNERABILITY ASSESSMENT
MEMA District 9 Regional Hazard Mitigation Plan DRAFT – February 2017
6:100
Flood-Related Fire-Related G Wind-Related Other Hazards
Dam
an
d L
eve
e F
ailu
re
Ero
sio
n
Flo
od
– 1
00
ye
ar
Flo
od
– 5
00
ye
ar
Flo
od
– V
E-zo
ne
Dro
ugh
t
Ligh
tnin
g
Wild
fire
Eart
hq
uak
e
Extr
em
e C
old
Extr
em
e H
eat
/ H
eat
Wav
e
Hai
lsto
rm
Hu
rric
ane
an
d T
rop
ical
Sto
rm
Seve
re T
hu
nd
ers
torm
/ H
igh
Win
d
Torn
ado
Win
ter
We
ath
er
Sea
Leve
l Ris
e-
3 f
ee
t
Fixe
d H
AZM
AT
– 0
.5 m
ile
Fixe
d H
AZM
AT
– 1
.0 m
ile
Mo
bile
HA
ZMA
T –
0.5
mile
(ro
ad)
Mo
bile
HA
ZMA
T –
1.0
mile
(ro
ad)
Mo
bile
HA
ZMA
T –
0.5
mile
(rai
l)
Mo
bile
HA
ZMA
T –
1.0
mile
(rai
l)
Infe
ctio
us
Dis
ea
se
FACILITY NAME CITY/TOWN
(if applicable) FACILITY TYPE
Mississippi Gulf Coast Community College Gautier Campus School
X X X X X X X X X X X X X X X X
Orange Lake Elementary School
X X X X X X X X X X X X X X X X X
St. Martin East Elementary School School
X X X X X X X X X X X X X X X
St. Martin High School School
X X X X X X X X X X X X X
St. Martin Middle School School
X X X X X X X X X X X X
St. Martin North Elementary School School
X X X X X X X X X X X X X X X
St. Martin Upper Elementary School School
X X X X X X X X X X X X
Vancleave High School School
X X X X X X X X X X X X X X
Vancleave Lower Elementary School
X X X X X X X X X X X X X X
Vancleave Middle School School
X X X X X X X X X X X X X X
Vancleave Upper Elementary School
X X X X X X X X X X X X X X X
Vocational Technical Center School
X X X X X X X X X X X X X X
Central Jackson County Shelter Shelter
X X X X X X X X X X X X X X X

SECTION 6: VULNERABILITY ASSESSMENT
MEMA District 9 Regional Hazard Mitigation Plan DRAFT – February 2017
6:101
Flood-Related Fire-Related G Wind-Related Other Hazards
Dam
an
d L
eve
e F
ailu
re
Ero
sio
n
Flo
od
– 1
00
ye
ar
Flo
od
– 5
00
ye
ar
Flo
od
– V
E-zo
ne
Dro
ugh
t
Ligh
tnin
g
Wild
fire
Eart
hq
uak
e
Extr
em
e C
old
Extr
em
e H
eat
/ H
eat
Wav
e
Hai
lsto
rm
Hu
rric
ane
an
d T
rop
ical
Sto
rm
Seve
re T
hu
nd
ers
torm
/ H
igh
Win
d
Torn
ado
Win
ter
We
ath
er
Sea
Leve
l Ris
e-
3 f
ee
t
Fixe
d H
AZM
AT
– 0
.5 m
ile
Fixe
d H
AZM
AT
– 1
.0 m
ile
Mo
bile
HA
ZMA
T –
0.5
mile
(ro
ad)
Mo
bile
HA
ZMA
T –
1.0
mile
(ro
ad)
Mo
bile
HA
ZMA
T –
0.5
mile
(rai
l)
Mo
bile
HA
ZMA
T –
1.0
mile
(rai
l)
Infe
ctio
us
Dis
ea
se
FACILITY NAME CITY/TOWN
(if applicable) FACILITY TYPE
East Jackson County Shelter Shelter
X X X X X X X X X X X X X X
West Jackson County Shelter Shelter
X X X X X X X X X X X X X X X
Big Oaks Trailer Park - Moss Point
Special Populations
X X X X X X X X X X X X X X
Bluff Creek Campground
Special Populations
X X X X X X X X X X X X X X
Camp Journey's End Campground
Special Populations
X X X X X X X X X X X X X X X X
Martin Lake Resort Special Populations
X X X X X X X X X X X X X X
Presley's Outing Special Populations
X X X X X X X X X X X X X X
River Oaks Trailer Park - Moss Point
Special Populations
X X X X X X X X X X X X X X
Riverbend Park Resort
Special Populations
X X X X X X X X X X X X X
Santa Maria Campground
Special Populations
X X X X X X X X X X X X X X
White Sands Campground
Special Populations
X X X X X X X X X X X X X X
Woodland Park Mobile Home Village - Moss Point
Special Populations
X X X X X X X X X X X X X X X X X X
Jackson County Airport Transportation
X X X X X X X X X X X X X X X

SECTION 6: VULNERABILITY ASSESSMENT
MEMA District 9 Regional Hazard Mitigation Plan DRAFT – February 2017
6:102
Flood-Related Fire-Related G Wind-Related Other Hazards
Dam
an
d L
eve
e F
ailu
re
Ero
sio
n
Flo
od
– 1
00
ye
ar
Flo
od
– 5
00
ye
ar
Flo
od
– V
E-zo
ne
Dro
ugh
t
Ligh
tnin
g
Wild
fire
Eart
hq
uak
e
Extr
em
e C
old
Extr
em
e H
eat
/ H
eat
Wav
e
Hai
lsto
rm
Hu
rric
ane
an
d T
rop
ical
Sto
rm
Seve
re T
hu
nd
ers
torm
/ H
igh
Win
d
Torn
ado
Win
ter
We
ath
er
Sea
Leve
l Ris
e-
3 f
ee
t
Fixe
d H
AZM
AT
– 0
.5 m
ile
Fixe
d H
AZM
AT
– 1
.0 m
ile
Mo
bile
HA
ZMA
T –
0.5
mile
(ro
ad)
Mo
bile
HA
ZMA
T –
1.0
mile
(ro
ad)
Mo
bile
HA
ZMA
T –
0.5
mile
(rai
l)
Mo
bile
HA
ZMA
T –
1.0
mile
(rai
l)
Infe
ctio
us
Dis
ea
se
FACILITY NAME CITY/TOWN
(if applicable) FACILITY TYPE
Ocean Springs Airport (private) Transportation
X X X X X X X X X X X X X X
Jackson County Utility Authority WWTP - Moss Point
Water/ wastewater
X X X X X X X X X X X X X X X X
Jackson County Utility Authority WWTP - Pascagoula
Water/ wastewater
X X X X X X X X X X X X X X X X X
Jackson County Utility Authority WWTP - Vancleave
Water/ wastewater
X X X X X X X X X X X X
River Pump Station Water/ wastewater
X X X X X X X X X X X X X X X
Water Tower-Rear of 2502 College Circle
Water/ wastewater
X X X X X X X X X X X X X X X X
Water Tower-Next to 1416 Lark Dr.
Water/ wastewater
X X X X X X X X X X X X X X X
Water Tower (Mall)- W of 290 Dolphin Dr.
Water/ wastewater
X X X X X X X X X X X X X X X X X
Water Well #1 & #6 Water/ wastewater
X X X X X X X X X X X X X X X
Water Well #10 Water/ wastewater
X X X X X X X X X X X X X X X X X X
Water Well #11 Water/ wastewater
X X X X X X X X X X X X X X X

SECTION 6: VULNERABILITY ASSESSMENT
MEMA District 9 Regional Hazard Mitigation Plan DRAFT – February 2017
6:103
Flood-Related Fire-Related G Wind-Related Other Hazards
Dam
an
d L
eve
e F
ailu
re
Ero
sio
n
Flo
od
– 1
00
ye
ar
Flo
od
– 5
00
ye
ar
Flo
od
– V
E-zo
ne
Dro
ugh
t
Ligh
tnin
g
Wild
fire
Eart
hq
uak
e
Extr
em
e C
old
Extr
em
e H
eat
/ H
eat
Wav
e
Hai
lsto
rm
Hu
rric
ane
an
d T
rop
ical
Sto
rm
Seve
re T
hu
nd
ers
torm
/ H
igh
Win
d
Torn
ado
Win
ter
We
ath
er
Sea
Leve
l Ris
e-
3 f
ee
t
Fixe
d H
AZM
AT
– 0
.5 m
ile
Fixe
d H
AZM
AT
– 1
.0 m
ile
Mo
bile
HA
ZMA
T –
0.5
mile
(ro
ad)
Mo
bile
HA
ZMA
T –
1.0
mile
(ro
ad)
Mo
bile
HA
ZMA
T –
0.5
mile
(rai
l)
Mo
bile
HA
ZMA
T –
1.0
mile
(rai
l)
Infe
ctio
us
Dis
ea
se
FACILITY NAME CITY/TOWN
(if applicable) FACILITY TYPE
Water Well #4 Water/ wastewater
X X X X X X X X X X X X X
Water Well #7 Water/ wastewater
X X X X X X X X X X X X X X X X X
Water Well #8 Water/ wastewater
X X X X X X X X X X X X X X X X X X
Water Well #9 Water/ wastewater
X X X X X X X X X X X X X X X
Central Fire Sta. Gautier Fire Station X X X X X X X X X X X X X X X X
Martin Bluff Fire Sta. Gautier Fire Station
X X X X X X X X X X X X X X
Willie Ladnnier Fire Sta. Gautier Fire Station
X X X X X X X X X X X X X X
Gautier Police Dept. Gautier Police Station X X X X X X X X X X X X X X X X
City Hall North Gautier Public Facility X X X X X X X X X X X X X X X X
College Park Elementary Gautier School
X X X X X X X X X X X X X X X X
Gautier Elementary School Gautier School
X X X X X X X X X X X X X X X X X
Gautier High School Gautier School X X X X X X X X X X X X X
Gautier Middle School Gautier School
X X X X X X X X X X X X X X
Martin Bluff Elementary School Gautier School
X X X X X X X X X X X X X X
Singing River Elementary School Gautier School
X X X X X X X X X X X X

SECTION 6: VULNERABILITY ASSESSMENT
MEMA District 9 Regional Hazard Mitigation Plan DRAFT – February 2017
6:104
Flood-Related Fire-Related G Wind-Related Other Hazards
Dam
an
d L
eve
e F
ailu
re
Ero
sio
n
Flo
od
– 1
00
ye
ar
Flo
od
– 5
00
ye
ar
Flo
od
– V
E-zo
ne
Dro
ugh
t
Ligh
tnin
g
Wild
fire
Eart
hq
uak
e
Extr
em
e C
old
Extr
em
e H
eat
/ H
eat
Wav
e
Hai
lsto
rm
Hu
rric
ane
an
d T
rop
ical
Sto
rm
Seve
re T
hu
nd
ers
torm
/ H
igh
Win
d
Torn
ado
Win
ter
We
ath
er
Sea
Leve
l Ris
e-
3 f
ee
t
Fixe
d H
AZM
AT
– 0
.5 m
ile
Fixe
d H
AZM
AT
– 1
.0 m
ile
Mo
bile
HA
ZMA
T –
0.5
mile
(ro
ad)
Mo
bile
HA
ZMA
T –
1.0
mile
(ro
ad)
Mo
bile
HA
ZMA
T –
0.5
mile
(rai
l)
Mo
bile
HA
ZMA
T –
1.0
mile
(rai
l)
Infe
ctio
us
Dis
ea
se
FACILITY NAME CITY/TOWN
(if applicable) FACILITY TYPE
Moss Point Central Fire Station Moss Point Fire Station
X X X X X X X X X X X X X X X X X X
Moss Point Dr. M. L. K. Fire Station Moss Point Fire Station
X X X X X X X X X X X X X X X
Moss Point Kreole Fire Station Moss Point Fire Station
X X X X X X X X X X X X X X X X X X
Moss Point North Fire Station Moss Point Fire Station
X X X X X X X X X X X X X X X X X X
City of Moss Point Police Dept. Moss Point Police Station
X X X X X X X X X X X X X X X X X X
City of Moss Point (City Hall) Moss Point Public Facility
X X X X X X X X X X X X X X X X X X
City of Moss Point (Public Works) Moss Point Public Facility
X X X X X X X X X X X X X X X X X X
Alternative Learning Center Moss Point School
X X X X X X X X X X X X X X X X X
Charlotte Hyatt Elementary School Moss Point School
X X X X X X X X X X X X X X X X
East Park Elementary School Moss Point School
X X X X X X X X X X X X X X X X X
Escatawpa Elementary Moss Point School
X X X X X X X X X X X X X X X X X X
God's LIttle Angels Moss Point School X X X X X X X X X X X X X X X X X
Kidde Kollege Moss Point School X X X X X X X X X X X X X X X X X X
Kreole Elementary School Moss Point School
X X X X X X X X X X X X X X X X

SECTION 6: VULNERABILITY ASSESSMENT
MEMA District 9 Regional Hazard Mitigation Plan DRAFT – February 2017
6:105
Flood-Related Fire-Related G Wind-Related Other Hazards
Dam
an
d L
eve
e F
ailu
re
Ero
sio
n
Flo
od
– 1
00
ye
ar
Flo
od
– 5
00
ye
ar
Flo
od
– V
E-zo
ne
Dro
ugh
t
Ligh
tnin
g
Wild
fire
Eart
hq
uak
e
Extr
em
e C
old
Extr
em
e H
eat
/ H
eat
Wav
e
Hai
lsto
rm
Hu
rric
ane
an
d T
rop
ical
Sto
rm
Seve
re T
hu
nd
ers
torm
/ H
igh
Win
d
Torn
ado
Win
ter
We
ath
er
Sea
Leve
l Ris
e-
3 f
ee
t
Fixe
d H
AZM
AT
– 0
.5 m
ile
Fixe
d H
AZM
AT
– 1
.0 m
ile
Mo
bile
HA
ZMA
T –
0.5
mile
(ro
ad)
Mo
bile
HA
ZMA
T –
1.0
mile
(ro
ad)
Mo
bile
HA
ZMA
T –
0.5
mile
(rai
l)
Mo
bile
HA
ZMA
T –
1.0
mile
(rai
l)
Infe
ctio
us
Dis
ea
se
FACILITY NAME CITY/TOWN
(if applicable) FACILITY TYPE
Little People Learning Center Moss Point School
X X X X X X X X X X X X X X X X
Magnolia Junior High School Moss Point School
X X X X X X X X X X X X X X X X X
Moss Point High School Moss Point School
X X X X X X X X X X X X X X
The Punkin Patch Moss Point School X X X X X X X X X X X X X X X X X
University of Lil' Tots Moss Point School
X X X X X X X X X X X X X X X X X
West Elementary School Moss Point School
X X X X X X X X X X X X X X X X
1st Missionary Baptist Church Moss Point Shelter
X X X X X X X X X X X X X X X X X
2nd Missionary Baptist Church Moss Point Shelter
X X X X X X X X X X X X X X X X
East Park School Moss Point Shelter X X X X X X X X X X X X X X X X X
Emergency Shelter Moss Point Shelter X X X X X X X X X X X X X X X X X
Johnson House Personal Care Home Moss Point
Special Populations
X X X X X X X X X X X X X X X X X X
Pathway Personal Care Home Moss Point
Special Populations
X X X X X X X X X X X X X X X X X X
Providence Home Care Moss Point
Special Populations
X X X X X X X X X X X X X X
Rehabilitation Centers Moss Point
Special Populations
X X X X X X X X X X X X X X X X X

SECTION 6: VULNERABILITY ASSESSMENT
MEMA District 9 Regional Hazard Mitigation Plan DRAFT – February 2017
6:106
Flood-Related Fire-Related G Wind-Related Other Hazards
Dam
an
d L
eve
e F
ailu
re
Ero
sio
n
Flo
od
– 1
00
ye
ar
Flo
od
– 5
00
ye
ar
Flo
od
– V
E-zo
ne
Dro
ugh
t
Ligh
tnin
g
Wild
fire
Eart
hq
uak
e
Extr
em
e C
old
Extr
em
e H
eat
/ H
eat
Wav
e
Hai
lsto
rm
Hu
rric
ane
an
d T
rop
ical
Sto
rm
Seve
re T
hu
nd
ers
torm
/ H
igh
Win
d
Torn
ado
Win
ter
We
ath
er
Sea
Leve
l Ris
e-
3 f
ee
t
Fixe
d H
AZM
AT
– 0
.5 m
ile
Fixe
d H
AZM
AT
– 1
.0 m
ile
Mo
bile
HA
ZMA
T –
0.5
mile
(ro
ad)
Mo
bile
HA
ZMA
T –
1.0
mile
(ro
ad)
Mo
bile
HA
ZMA
T –
0.5
mile
(rai
l)
Mo
bile
HA
ZMA
T –
1.0
mile
(rai
l)
Infe
ctio
us
Dis
ea
se
FACILITY NAME CITY/TOWN
(if applicable) FACILITY TYPE
Serenity Assisted Living Manor Moss Point
Special Populations
X X X X X X X X X X X X X X X
Singing River Rehab & Nursing Moss Point
Special Populations
X X X X X X X X X X X X X X X X X
We Care Hospice Moss Point Special Populations
X X X X X X X X X X X X X X X X X
Lift stations, wells, and pumping stations in the City Moss Point
Water/ wastewater
X X X X X X X X X X X X
EOC Ocean Springs EOC X X X X X X X X X X X X X X X X X X
Fire Station 1--Central Ocean Springs Fire Station
X X X X X X X X X X X X X X X X X
Fire Station 2--Bernard Beaugez Ocean Springs Fire Station
X X X X X X X X X X X X X X X X X X
Fire Station 3--Champ Gay Ocean Springs Fire Station
X X X X X X X X X X X X X X X X X
Fire Station 4--Main/EOC Ocean Springs Fire Station
X X X X X X X X X X X X X X X X X X
Ocean Springs Hospital Ocean Springs Medical
X X X X X X X X X X X X X X X X X
On Call Urgent Care Center Ocean Springs Medical
X X X X X X X X X X X X X X X X
Ocean Springs Police Station Ocean Springs Police Station
X X X X X X X X X X X X X X X X X X
Ocean Springs Police Station Ocean Springs Police Station
X X X X X X X X X X X X X X X X X X

SECTION 6: VULNERABILITY ASSESSMENT
MEMA District 9 Regional Hazard Mitigation Plan DRAFT – February 2017
6:107
Flood-Related Fire-Related G Wind-Related Other Hazards
Dam
an
d L
eve
e F
ailu
re
Ero
sio
n
Flo
od
– 1
00
ye
ar
Flo
od
– 5
00
ye
ar
Flo
od
– V
E-zo
ne
Dro
ugh
t
Ligh
tnin
g
Wild
fire
Eart
hq
uak
e
Extr
em
e C
old
Extr
em
e H
eat
/ H
eat
Wav
e
Hai
lsto
rm
Hu
rric
ane
an
d T
rop
ical
Sto
rm
Seve
re T
hu
nd
ers
torm
/ H
igh
Win
d
Torn
ado
Win
ter
We
ath
er
Sea
Leve
l Ris
e-
3 f
ee
t
Fixe
d H
AZM
AT
– 0
.5 m
ile
Fixe
d H
AZM
AT
– 1
.0 m
ile
Mo
bile
HA
ZMA
T –
0.5
mile
(ro
ad)
Mo
bile
HA
ZMA
T –
1.0
mile
(ro
ad)
Mo
bile
HA
ZMA
T –
0.5
mile
(rai
l)
Mo
bile
HA
ZMA
T –
1.0
mile
(rai
l)
Infe
ctio
us
Dis
ea
se
FACILITY NAME CITY/TOWN
(if applicable) FACILITY TYPE
Ocean Springs Police Station/Jail/Court-Under Construction Ocean Springs Police Station
X X X X X X X X X X X X X X X X X X
Mary C. O’Keefe Cultural Center for Arts and Education Ocean Springs
Private/Non-Profit
X X X X X X X X X X X X X X X X X X
Walter Anderson Museum Ocean Springs
Private/Non-Profit
X X X X X X X X X X X X X X X X X X
Armory Building Ocean Springs Public Facility X X X X X X X X X X X X X X X X X X
Fort Maurepas Ocean Springs Public Facility X X X X X X X X X X X X X X X X
Ocean Springs City Hall Ocean Springs Public Facility
X X X X X X X X X X X X X X X X X X
Ocean Springs Civic Center Ocean Springs Public Facility
X X X X X X X X X X X X X X X X X X
Ocean Springs Community Center Ocean Springs Public Facility
X X X X X X X X X X X X X X X X X X
Ocean Springs Harbor--County Building Ocean Springs Public Facility
X X X X X X X X X X X X X X X X
Ocean Springs Human Resources Ocean Springs Public Facility
X X X X X X X X X X X X X X X X X
Ocean Springs Library Ocean Springs Public Facility
X X X X X X X X X X X X X X X X X X
Ocean Springs Parks & Recreation Ocean Springs Public Facility
X X X X X X X X X X X X X X X

SECTION 6: VULNERABILITY ASSESSMENT
MEMA District 9 Regional Hazard Mitigation Plan DRAFT – February 2017
6:108
Flood-Related Fire-Related G Wind-Related Other Hazards
Dam
an
d L
eve
e F
ailu
re
Ero
sio
n
Flo
od
– 1
00
ye
ar
Flo
od
– 5
00
ye
ar
Flo
od
– V
E-zo
ne
Dro
ugh
t
Ligh
tnin
g
Wild
fire
Eart
hq
uak
e
Extr
em
e C
old
Extr
em
e H
eat
/ H
eat
Wav
e
Hai
lsto
rm
Hu
rric
ane
an
d T
rop
ical
Sto
rm
Seve
re T
hu
nd
ers
torm
/ H
igh
Win
d
Torn
ado
Win
ter
We
ath
er
Sea
Leve
l Ris
e-
3 f
ee
t
Fixe
d H
AZM
AT
– 0
.5 m
ile
Fixe
d H
AZM
AT
– 1
.0 m
ile
Mo
bile
HA
ZMA
T –
0.5
mile
(ro
ad)
Mo
bile
HA
ZMA
T –
1.0
mile
(ro
ad)
Mo
bile
HA
ZMA
T –
0.5
mile
(rai
l)
Mo
bile
HA
ZMA
T –
1.0
mile
(rai
l)
Infe
ctio
us
Dis
ea
se
FACILITY NAME CITY/TOWN
(if applicable) FACILITY TYPE
Ocean Springs Planning Dept. Ocean Springs Public Facility
X X X X X X X X X X X X X X X X X X
Ocean Springs Public Works Ocean Springs Public Facility
X X X X X X X X X X X X
Ocean Springs Public Works Maintenance Bldg Ocean Springs Public Facility
X X X X X X X X X X X X X X X X X X
Ocean Springs Senior Center Ocean Springs Public Facility
X X X X X X X X X X X X X X X X X X
Alternative Education Center Ocean Springs School
X X X X X X X X X X X X X X X X
Elizabeth H. Keys Technology Center Ocean Springs School
X X X X X X X X X X X X X X X X X
Grace Baptist Academy Ocean Springs School
X X X X X X X X X X X X X X X X X
Greyhound Stadium Fieldhouse Ocean Springs School
X X X X X X X X X X X X X X X X X
Magnolia Park Elementary Ocean Springs School
X X X X X X X X X X X X X X X X
Oak Park Elementary Ocean Springs School
X X X X X X X X X X X X X X X X
Ocean Springs High School Ocean Springs School
X X X X X X X X X X X X X X X X
Ocean Springs Middle School Ocean Springs School
X X X X X X X X X X X X X X X X

SECTION 6: VULNERABILITY ASSESSMENT
MEMA District 9 Regional Hazard Mitigation Plan DRAFT – February 2017
6:109
Flood-Related Fire-Related G Wind-Related Other Hazards
Dam
an
d L
eve
e F
ailu
re
Ero
sio
n
Flo
od
– 1
00
ye
ar
Flo
od
– 5
00
ye
ar
Flo
od
– V
E-zo
ne
Dro
ugh
t
Ligh
tnin
g
Wild
fire
Eart
hq
uak
e
Extr
em
e C
old
Extr
em
e H
eat
/ H
eat
Wav
e
Hai
lsto
rm
Hu
rric
ane
an
d T
rop
ical
Sto
rm
Seve
re T
hu
nd
ers
torm
/ H
igh
Win
d
Torn
ado
Win
ter
We
ath
er
Sea
Leve
l Ris
e-
3 f
ee
t
Fixe
d H
AZM
AT
– 0
.5 m
ile
Fixe
d H
AZM
AT
– 1
.0 m
ile
Mo
bile
HA
ZMA
T –
0.5
mile
(ro
ad)
Mo
bile
HA
ZMA
T –
1.0
mile
(ro
ad)
Mo
bile
HA
ZMA
T –
0.5
mile
(rai
l)
Mo
bile
HA
ZMA
T –
1.0
mile
(rai
l)
Infe
ctio
us
Dis
ea
se
FACILITY NAME CITY/TOWN
(if applicable) FACILITY TYPE
Ocean Springs School District Administration Bldg Ocean Springs School
X X X X X X X X X X X X X X X X X
Pecan Park Elementary Ocean Springs School
X X X X X X X X X X X X X X X X X
St. Alphonsus Catholic School Ocean Springs School
X X X X X X X X X X X X X X X X X X
Taconi School Ocean Springs School X X X X X X X X X X X X X X X X X X
University of Southern Mississippi – Gulf Coast Research Ocean Springs School
X X X X X X X X X X X X X X
Dorchester Arms Ocean Springs Special Populations
X X X X X X X X X X X X X X X X X X
Ocean Springs Nursing Center Ocean Springs
Special Populations
X X X X X X X X X X X X X X X X X
Samaritan House Retirement Apartments Ocean Springs
Special Populations
X X X X X X X X X X X X X X X X X X
The Gardens Ocean Springs Special Populations
X X X X X X X X X X X X X X X X
Villa Maria Retirement Apartments Ocean Springs
Special Populations
X X X X X X X X X X X X X X X X X X
Ocean Springs Airport Ocean Springs Transportation
X X X X X X X X X X X X X X
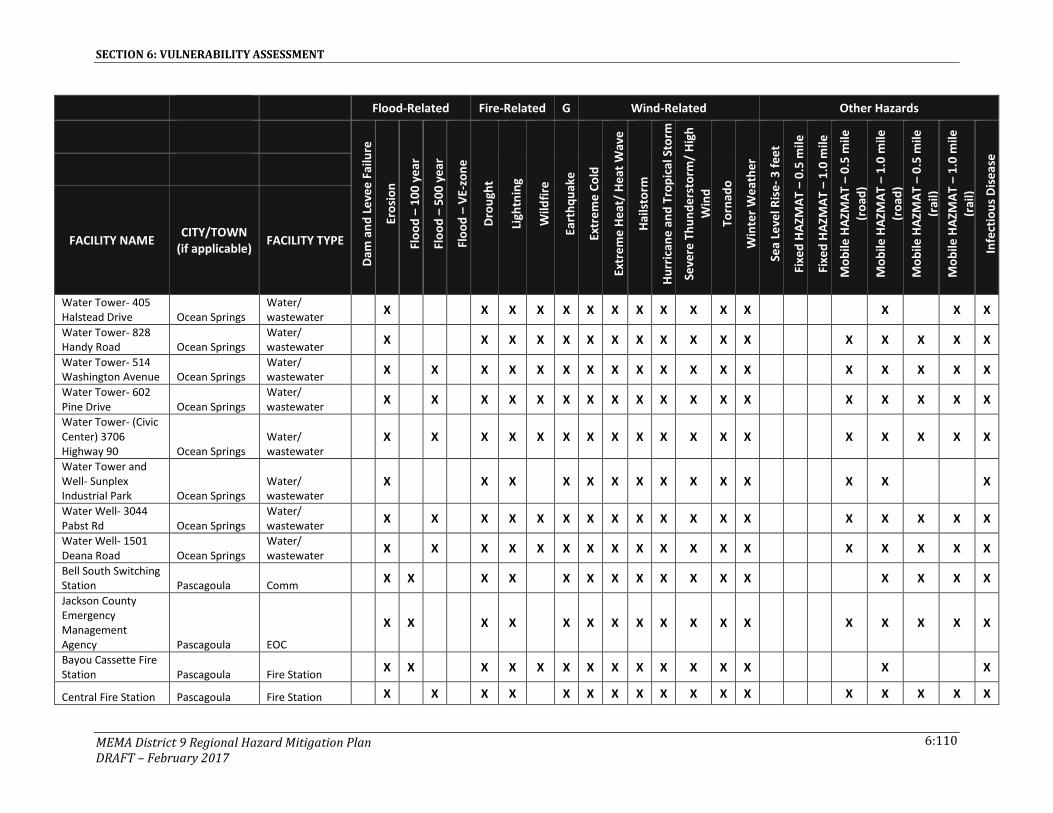
SECTION 6: VULNERABILITY ASSESSMENT
MEMA District 9 Regional Hazard Mitigation Plan DRAFT – February 2017
6:110
Flood-Related Fire-Related G Wind-Related Other Hazards
Dam
an
d L
eve
e F
ailu
re
Ero
sio
n
Flo
od
– 1
00
ye
ar
Flo
od
– 5
00
ye
ar
Flo
od
– V
E-zo
ne
Dro
ugh
t
Ligh
tnin
g
Wild
fire
Eart
hq
uak
e
Extr
em
e C
old
Extr
em
e H
eat
/ H
eat
Wav
e
Hai
lsto
rm
Hu
rric
ane
an
d T
rop
ical
Sto
rm
Seve
re T
hu
nd
ers
torm
/ H
igh
Win
d
Torn
ado
Win
ter
We
ath
er
Sea
Leve
l Ris
e-
3 f
ee
t
Fixe
d H
AZM
AT
– 0
.5 m
ile
Fixe
d H
AZM
AT
– 1
.0 m
ile
Mo
bile
HA
ZMA
T –
0.5
mile
(ro
ad)
Mo
bile
HA
ZMA
T –
1.0
mile
(ro
ad)
Mo
bile
HA
ZMA
T –
0.5
mile
(rai
l)
Mo
bile
HA
ZMA
T –
1.0
mile
(rai
l)
Infe
ctio
us
Dis
ea
se
FACILITY NAME CITY/TOWN
(if applicable) FACILITY TYPE
Water Tower- 405 Halstead Drive Ocean Springs
Water/ wastewater
X X X X X X X X X X X X X X X
Water Tower- 828 Handy Road Ocean Springs
Water/ wastewater
X X X X X X X X X X X X X X X X X
Water Tower- 514 Washington Avenue Ocean Springs
Water/ wastewater
X X X X X X X X X X X X X X X X X X
Water Tower- 602 Pine Drive Ocean Springs
Water/ wastewater
X X X X X X X X X X X X X X X X X X
Water Tower- (Civic Center) 3706 Highway 90 Ocean Springs
Water/ wastewater
X X X X X X X X X X X X X X X X X X
Water Tower and Well- Sunplex Industrial Park Ocean Springs
Water/ wastewater
X X X X X X X X X X X X X X
Water Well- 3044 Pabst Rd Ocean Springs
Water/ wastewater
X X X X X X X X X X X X X X X X X X
Water Well- 1501 Deana Road Ocean Springs
Water/ wastewater
X X X X X X X X X X X X X X X X X X
Bell South Switching Station Pascagoula Comm
X X X X X X X X X X X X X X X X
Jackson County Emergency Management Agency Pascagoula EOC
X X X X X X X X X X X X X X X X X
Bayou Cassette Fire Station Pascagoula Fire Station
X X X X X X X X X X X X X X X
Central Fire Station Pascagoula Fire Station X X X X X X X X X X X X X X X X X

SECTION 6: VULNERABILITY ASSESSMENT
MEMA District 9 Regional Hazard Mitigation Plan DRAFT – February 2017
6:111
Flood-Related Fire-Related G Wind-Related Other Hazards
Dam
an
d L
eve
e F
ailu
re
Ero
sio
n
Flo
od
– 1
00
ye
ar
Flo
od
– 5
00
ye
ar
Flo
od
– V
E-zo
ne
Dro
ugh
t
Ligh
tnin
g
Wild
fire
Eart
hq
uak
e
Extr
em
e C
old
Extr
em
e H
eat
/ H
eat
Wav
e
Hai
lsto
rm
Hu
rric
ane
an
d T
rop
ical
Sto
rm
Seve
re T
hu
nd
ers
torm
/ H
igh
Win
d
Torn
ado
Win
ter
We
ath
er
Sea
Leve
l Ris
e-
3 f
ee
t
Fixe
d H
AZM
AT
– 0
.5 m
ile
Fixe
d H
AZM
AT
– 1
.0 m
ile
Mo
bile
HA
ZMA
T –
0.5
mile
(ro
ad)
Mo
bile
HA
ZMA
T –
1.0
mile
(ro
ad)
Mo
bile
HA
ZMA
T –
0.5
mile
(rai
l)
Mo
bile
HA
ZMA
T –
1.0
mile
(rai
l)
Infe
ctio
us
Dis
ea
se
FACILITY NAME CITY/TOWN
(if applicable) FACILITY TYPE
Lake Fire Station Pascagoula Fire Station X X X X X X X X X X X X
Acadian Ambulance Service Pascagoula Medical
X X X X X X X X X X X X X X X X X
Singing River Hospital Pascagoula Medical
X X X X X X X X X X X X X X X X X
Jackson County Sheriff’s Department Pascagoula Police Station
X X X X X X X X X X X X X X X X X
Pascagoula Police Department Pascagoula Police Station
X X X X X X X X X X X X X X X X X
Mississippi Power Company Work Yard Pascagoula Power/Gas
X X X X X X X X X X X X X X X X X
American Red Cross Pascagoula Private/Non-Profit
X X X X X X X X X X X X X X X X X
Blossman Propane Pascagoula Private/Non-Profit
X X X X X X X X X X X X X X X X X X
Central Appliance Pascagoula Private/Non-Profit
X X X X X X X X X X X X X X X X X
Chevron Products Pascagoula Private/Non-Profit
X X X X X X X X X X X X X X X X X X X
First Chemical Pascagoula Private/Non-Profit
X X X X X X X X X X X X X X X X X X X
Gulf Concrete Pascagoula Private/Non-Profit
X X X X X X X X X X X X X X X X X X X
Gulf Sales and Supply Pascagoula
Private/Non-Profit
X X X X X X X X X X X X X X X X X
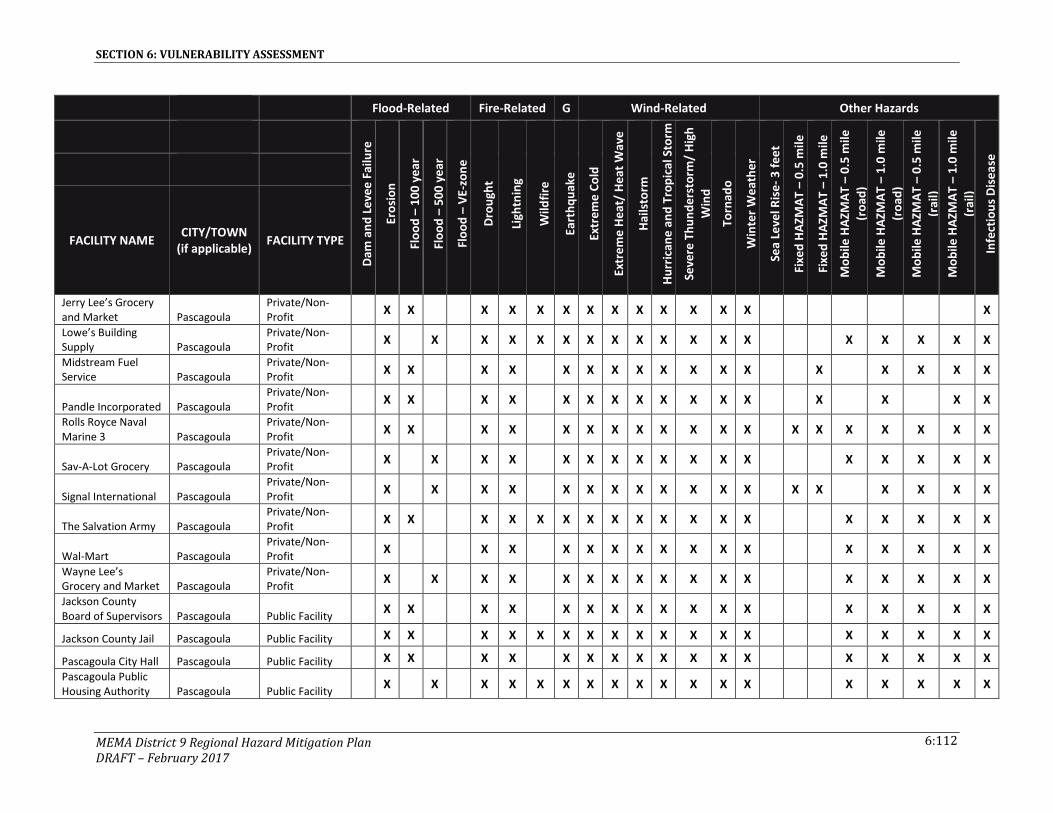
SECTION 6: VULNERABILITY ASSESSMENT
MEMA District 9 Regional Hazard Mitigation Plan DRAFT – February 2017
6:112
Flood-Related Fire-Related G Wind-Related Other Hazards
Dam
an
d L
eve
e F
ailu
re
Ero
sio
n
Flo
od
– 1
00
ye
ar
Flo
od
– 5
00
ye
ar
Flo
od
– V
E-zo
ne
Dro
ugh
t
Ligh
tnin
g
Wild
fire
Eart
hq
uak
e
Extr
em
e C
old
Extr
em
e H
eat
/ H
eat
Wav
e
Hai
lsto
rm
Hu
rric
ane
an
d T
rop
ical
Sto
rm
Seve
re T
hu
nd
ers
torm
/ H
igh
Win
d
Torn
ado
Win
ter
We
ath
er
Sea
Leve
l Ris
e-
3 f
ee
t
Fixe
d H
AZM
AT
– 0
.5 m
ile
Fixe
d H
AZM
AT
– 1
.0 m
ile
Mo
bile
HA
ZMA
T –
0.5
mile
(ro
ad)
Mo
bile
HA
ZMA
T –
1.0
mile
(ro
ad)
Mo
bile
HA
ZMA
T –
0.5
mile
(rai
l)
Mo
bile
HA
ZMA
T –
1.0
mile
(rai
l)
Infe
ctio
us
Dis
ea
se
FACILITY NAME CITY/TOWN
(if applicable) FACILITY TYPE
Jerry Lee’s Grocery and Market Pascagoula
Private/Non-Profit
X X X X X X X X X X X X X X
Lowe’s Building Supply Pascagoula
Private/Non-Profit
X X X X X X X X X X X X X X X X X X
Midstream Fuel Service Pascagoula
Private/Non-Profit
X X X X X X X X X X X X X X X X X
Pandle Incorporated Pascagoula Private/Non-Profit
X X X X X X X X X X X X X X X X
Rolls Royce Naval Marine 3 Pascagoula
Private/Non-Profit
X X X X X X X X X X X X X X X X X X X
Sav-A-Lot Grocery Pascagoula Private/Non-Profit
X X X X X X X X X X X X X X X X X
Signal International Pascagoula Private/Non-Profit
X X X X X X X X X X X X X X X X X X
The Salvation Army Pascagoula Private/Non-Profit
X X X X X X X X X X X X X X X X X X
Wal-Mart Pascagoula Private/Non-Profit
X X X X X X X X X X X X X X X X
Wayne Lee’s Grocery and Market Pascagoula
Private/Non-Profit
X X X X X X X X X X X X X X X X X
Jackson County Board of Supervisors Pascagoula Public Facility
X X X X X X X X X X X X X X X X X
Jackson County Jail Pascagoula Public Facility X X X X X X X X X X X X X X X X X X
Pascagoula City Hall Pascagoula Public Facility X X X X X X X X X X X X X X X X X
Pascagoula Public Housing Authority Pascagoula Public Facility
X X X X X X X X X X X X X X X X X X

SECTION 6: VULNERABILITY ASSESSMENT
MEMA District 9 Regional Hazard Mitigation Plan DRAFT – February 2017
6:113
Flood-Related Fire-Related G Wind-Related Other Hazards
Dam
an
d L
eve
e F
ailu
re
Ero
sio
n
Flo
od
– 1
00
ye
ar
Flo
od
– 5
00
ye
ar
Flo
od
– V
E-zo
ne
Dro
ugh
t
Ligh
tnin
g
Wild
fire
Eart
hq
uak
e
Extr
em
e C
old
Extr
em
e H
eat
/ H
eat
Wav
e
Hai
lsto
rm
Hu
rric
ane
an
d T
rop
ical
Sto
rm
Seve
re T
hu
nd
ers
torm
/ H
igh
Win
d
Torn
ado
Win
ter
We
ath
er
Sea
Leve
l Ris
e-
3 f
ee
t
Fixe
d H
AZM
AT
– 0
.5 m
ile
Fixe
d H
AZM
AT
– 1
.0 m
ile
Mo
bile
HA
ZMA
T –
0.5
mile
(ro
ad)
Mo
bile
HA
ZMA
T –
1.0
mile
(ro
ad)
Mo
bile
HA
ZMA
T –
0.5
mile
(rai
l)
Mo
bile
HA
ZMA
T –
1.0
mile
(rai
l)
Infe
ctio
us
Dis
ea
se
FACILITY NAME CITY/TOWN
(if applicable) FACILITY TYPE
Pascagoula Public Works Dept - Yard and Building Department Pascagoula Public Facility
X X X X X X X X X X X X X X X X X
U.S. Coast Guard Facility Pascagoula Public Facility
X X X X X X X X X X X X X X X X
Applied Technology Center Pascagoula School
X X X X X X X X X X X X X X X X
Arlington Heights Elementary School Pascagoula School
X X X X X X X X X X X X X X X X X
Beach Elementary School Pascagoula School
X X X X X X X X X X X X X X
Bethel Academy Pascagoula School X X X X X X X X X X X X X X X
Central Elementary School Pascagoula School
X X X X X X X X X X X X X X X X
Cherokee Elementary School Pascagoula School
X X X X X X X X X X X X X X
Colmer Middle School Pascagoula School
X X X X X X X X X X X X X X X
Eastlawn Elementary School Pascagoula School
X X X X X X X X X X X X X X
Fair Elementary School Pascagoula School
X X X X X X X X X X X X X X X X X X
Family Interactive Center Pascagoula School
X X X X X X X X X X X X X X X X

SECTION 6: VULNERABILITY ASSESSMENT
MEMA District 9 Regional Hazard Mitigation Plan DRAFT – February 2017
6:114
Flood-Related Fire-Related G Wind-Related Other Hazards
Dam
an
d L
eve
e F
ailu
re
Ero
sio
n
Flo
od
– 1
00
ye
ar
Flo
od
– 5
00
ye
ar
Flo
od
– V
E-zo
ne
Dro
ugh
t
Ligh
tnin
g
Wild
fire
Eart
hq
uak
e
Extr
em
e C
old
Extr
em
e H
eat
/ H
eat
Wav
e
Hai
lsto
rm
Hu
rric
ane
an
d T
rop
ical
Sto
rm
Seve
re T
hu
nd
ers
torm
/ H
igh
Win
d
Torn
ado
Win
ter
We
ath
er
Sea
Leve
l Ris
e-
3 f
ee
t
Fixe
d H
AZM
AT
– 0
.5 m
ile
Fixe
d H
AZM
AT
– 1
.0 m
ile
Mo
bile
HA
ZMA
T –
0.5
mile
(ro
ad)
Mo
bile
HA
ZMA
T –
1.0
mile
(ro
ad)
Mo
bile
HA
ZMA
T –
0.5
mile
(rai
l)
Mo
bile
HA
ZMA
T –
1.0
mile
(rai
l)
Infe
ctio
us
Dis
ea
se
FACILITY NAME CITY/TOWN
(if applicable) FACILITY TYPE
Instructional Administrative Service Center Pascagoula School
X X X X X X X X X X X X X X X X
Jackson County School for Exceptional Children Pascagoula School
X X X X X X X X X X X X X X X X X
Jackson Elementary School Pascagoula School
X X X X X X X X X X X X X X X
Lake Elementary School Pascagoula School
X X X X X X X X X X X X X X X X X
Opportunity Center Pascagoula School X X X X X X X X X X X X X X X X
Pascagoula High School Pascagoula School
X X X X X X X X X X X X X X X X
Pascagoula Opportunity Center Pascagoula School
X X X X X X X X X X X X X X X X
Pascagoula Vocational Technical Center Pascagoula School
X X X X X X X X X X X X X X X X
Resurrection Catholic Elementary School Pascagoula School
X X X X X X X X X X X X X X X
Resurrection Middle/High School Pascagoula School
X X X X X X X X X X X X X X X X X
St. Peter the Apostle Catholic School Pascagoula School
X X X X X X X X X X X X X X X X X X
Sugar Bear's Daycare Pascagoula School
X X X X X X X X X X X X X X X X X

SECTION 6: VULNERABILITY ASSESSMENT
MEMA District 9 Regional Hazard Mitigation Plan DRAFT – February 2017
6:115
Flood-Related Fire-Related G Wind-Related Other Hazards
Dam
an
d L
eve
e F
ailu
re
Ero
sio
n
Flo
od
– 1
00
ye
ar
Flo
od
– 5
00
ye
ar
Flo
od
– V
E-zo
ne
Dro
ugh
t
Ligh
tnin
g
Wild
fire
Eart
hq
uak
e
Extr
em
e C
old
Extr
em
e H
eat
/ H
eat
Wav
e
Hai
lsto
rm
Hu
rric
ane
an
d T
rop
ical
Sto
rm
Seve
re T
hu
nd
ers
torm
/ H
igh
Win
d
Torn
ado
Win
ter
We
ath
er
Sea
Leve
l Ris
e-
3 f
ee
t
Fixe
d H
AZM
AT
– 0
.5 m
ile
Fixe
d H
AZM
AT
– 1
.0 m
ile
Mo
bile
HA
ZMA
T –
0.5
mile
(ro
ad)
Mo
bile
HA
ZMA
T –
1.0
mile
(ro
ad)
Mo
bile
HA
ZMA
T –
0.5
mile
(rai
l)
Mo
bile
HA
ZMA
T –
1.0
mile
(rai
l)
Infe
ctio
us
Dis
ea
se
FACILITY NAME CITY/TOWN
(if applicable) FACILITY TYPE
Trent Lott Middle School Pascagoula School
X X X X X X X X X X X X X X X
William H. Colmer Jr. High Pascagoula School
X X X X X X X X X X X X X X X
Bay Tower Assisted Living Pascagoula
Special Populations
X X X X X X X X X X X X
Chateau Deville Nursing Home Pascagoula
Special Populations
X X X X X X X X X X X X X X X X X
Plaza Community Living Center Pascagoula
Special Populations
X X X X X X X X X X X X X X X X X
Restoration Adult Home Care Center Pascagoula
Special Populations
X X X X X X X X X X X X X X X X X X
Willow Creek Senior Housing Pascagoula
Special Populations
X X X X X X X X X X X X X X X
14th Street Well Pascagoula Water/ wastewater
X X X X X X X X X X X X X X X X X
A Blue Lake LiftStation Pascagoula
Water/ wastewater
X X X X X X X X X X X X X X X X X X
A North Market Well Pascagoula
Water/ wastewater
X X X X X X X X X X X X X X X X X
Bayou Cassotte Water Purification Plant and Well 3 Pascagoula
Water/ wastewater
X X X X X X X X X X X X X X X
Beach Well Pascagoula Water/ wastewater
X X X X X X X X X X X X X X X X
Belair/Monclair Lift Station Pascagoula
Water/ wastewater
X X X X X X X X X X X X X X X

SECTION 6: VULNERABILITY ASSESSMENT
MEMA District 9 Regional Hazard Mitigation Plan DRAFT – February 2017
6:116
Flood-Related Fire-Related G Wind-Related Other Hazards
Dam
an
d L
eve
e F
ailu
re
Ero
sio
n
Flo
od
– 1
00
ye
ar
Flo
od
– 5
00
ye
ar
Flo
od
– V
E-zo
ne
Dro
ugh
t
Ligh
tnin
g
Wild
fire
Eart
hq
uak
e
Extr
em
e C
old
Extr
em
e H
eat
/ H
eat
Wav
e
Hai
lsto
rm
Hu
rric
ane
an
d T
rop
ical
Sto
rm
Seve
re T
hu
nd
ers
torm
/ H
igh
Win
d
Torn
ado
Win
ter
We
ath
er
Sea
Leve
l Ris
e-
3 f
ee
t
Fixe
d H
AZM
AT
– 0
.5 m
ile
Fixe
d H
AZM
AT
– 1
.0 m
ile
Mo
bile
HA
ZMA
T –
0.5
mile
(ro
ad)
Mo
bile
HA
ZMA
T –
1.0
mile
(ro
ad)
Mo
bile
HA
ZMA
T –
0.5
mile
(rai
l)
Mo
bile
HA
ZMA
T –
1.0
mile
(rai
l)
Infe
ctio
us
Dis
ea
se
FACILITY NAME CITY/TOWN
(if applicable) FACILITY TYPE
Belair/Washington Lift Station Pascagoula
Water/ wastewater
X X X X X X X X X X X X X X
Briarwood Lift Station Pascagoula
Water/ wastewater
X X X X X X X X X X X X X X X X X X X X
Chicot and lngalls Lift Station Pascagoula
Water/ wastewater
X X X X X X X X X X X X X X X
Communy Water Purification Plant and Well #1, #2 & #3 Pascagoula
Water/ wastewater
X X X X X X X X X X X X X X X
Criswell Water Purification Plant Pascagoula
Water/ wastewater
X X X X X X X X X X X X X X X X X X
Delmas Lift Station Pascagoula Water/ wastewater
X X X X X X X X X X X X X X X X X
Douglas Well Pascagoula Water/ wastewater
X X X X X X X X X X X X X X X
Emerson Lift Station Pascagoula Water/ wastewater
X X X X X X X X X X X X X X X X
Ford Lift Station Pascagoula Water/ wastewater
X X X X X X X X X X X X X X X X X
Hospital! Old Mobile Lift Station Pascagoula
Water/ wastewater
X X X X X X X X X X X X X X X X X
Jackson County Utility Authority Wastewater Treatment Facility Pascagoula
Water/ wastewater
X X X X X X X X X X X X X X X X
Kenneth Lift Station Pascagoula Water/ wastewater
X X X X X X X X X X X X X X X X X

SECTION 6: VULNERABILITY ASSESSMENT
MEMA District 9 Regional Hazard Mitigation Plan DRAFT – February 2017
6:117
Flood-Related Fire-Related G Wind-Related Other Hazards
Dam
an
d L
eve
e F
ailu
re
Ero
sio
n
Flo
od
– 1
00
ye
ar
Flo
od
– 5
00
ye
ar
Flo
od
– V
E-zo
ne
Dro
ugh
t
Ligh
tnin
g
Wild
fire
Eart
hq
uak
e
Extr
em
e C
old
Extr
em
e H
eat
/ H
eat
Wav
e
Hai
lsto
rm
Hu
rric
ane
an
d T
rop
ical
Sto
rm
Seve
re T
hu
nd
ers
torm
/ H
igh
Win
d
Torn
ado
Win
ter
We
ath
er
Sea
Leve
l Ris
e-
3 f
ee
t
Fixe
d H
AZM
AT
– 0
.5 m
ile
Fixe
d H
AZM
AT
– 1
.0 m
ile
Mo
bile
HA
ZMA
T –
0.5
mile
(ro
ad)
Mo
bile
HA
ZMA
T –
1.0
mile
(ro
ad)
Mo
bile
HA
ZMA
T –
0.5
mile
(rai
l)
Mo
bile
HA
ZMA
T –
1.0
mile
(rai
l)
Infe
ctio
us
Dis
ea
se
FACILITY NAME CITY/TOWN
(if applicable) FACILITY TYPE
Live Oak Lift Station Pascagoula Water/ wastewater
X X X X X X X X X X X X X X X X X
Louise Lift Station Pascagoula Water/ wastewater
X X X X X X X X X X X X X X X X X
Magnolia Lift Station Pascagoula
Water/ wastewater
X X X X X X X X X X X X X X X X X
Market/Parsley Lift Station Pascagoula
Water/ wastewater
X X X X X X X X X X X X X X X
Moreland Lift Station Pascagoula
Water/ wastewater
X X X X X X X X X X X X X X X X X
North River Road Lift Station Pascagoula
Water/ wastewater
X X X X X X X X X X X X X X X X X
Orchard Lift Station Pascagoula Water/ wastewater
X X X X X X X X X X X X X X X X
Pine Lift Station Pascagoula Water/ wastewater
X X X X X X X X X X X X X X X X X
Poitevin Lift Station Pascagoula Water/ wastewater
X X X X X X X X X X X X X
Searstown Lift Station Pascagoula
Water/ wastewater
X X X X X X X X X X X X X X X X X X
Searstown Well Pascagoula Water/ wastewater
X X X X X X X X X X X X X X X X X X
Sherwood Lift Station Pascagoula
Water/ wastewater
X X X X X X X X X X X X X X X X
South River Road Lift Station Pascagoula
Water/ wastewater
X X X X X X X X X X X X X X X X X X
Telephone Well Pascagoula Water/ wastewater
X X X X X X X X X X X X X X X X X

SECTION 6: VULNERABILITY ASSESSMENT
MEMA District 9 Regional Hazard Mitigation Plan DRAFT – February 2017
6:118
Flood-Related Fire-Related G Wind-Related Other Hazards
Dam
an
d L
eve
e F
ailu
re
Ero
sio
n
Flo
od
– 1
00
ye
ar
Flo
od
– 5
00
ye
ar
Flo
od
– V
E-zo
ne
Dro
ugh
t
Ligh
tnin
g
Wild
fire
Eart
hq
uak
e
Extr
em
e C
old
Extr
em
e H
eat
/ H
eat
Wav
e
Hai
lsto
rm
Hu
rric
ane
an
d T
rop
ical
Sto
rm
Seve
re T
hu
nd
ers
torm
/ H
igh
Win
d
Torn
ado
Win
ter
We
ath
er
Sea
Leve
l Ris
e-
3 f
ee
t
Fixe
d H
AZM
AT
– 0
.5 m
ile
Fixe
d H
AZM
AT
– 1
.0 m
ile
Mo
bile
HA
ZMA
T –
0.5
mile
(ro
ad)
Mo
bile
HA
ZMA
T –
1.0
mile
(ro
ad)
Mo
bile
HA
ZMA
T –
0.5
mile
(rai
l)
Mo
bile
HA
ZMA
T –
1.0
mile
(rai
l)
Infe
ctio
us
Dis
ea
se
FACILITY NAME CITY/TOWN
(if applicable) FACILITY TYPE
Washington Bayou Lift Station Pascagoula
Water/ wastewater
X X X X X X X X X X X X X X X
PEARL RIVER COUNTY
Carriere Volunteer Fire Department 1 Fire Station
X X X X X X X X X X X X X X X X
Carriere Volunteer Fire Department 2 (Hide-A-Way Lake) Fire Station
X X X X X X X X X X X X X X X X
Carriere Volunteer Fire Department 3 Fire Station
X X X X X X X X X X X X
Carriere Volunteer Fire Department 4 (Anchor Lake) Fire Station
X X X X X X X X X X X X X X
Henleyfield Volunteer Fire Department 1 Fire Station
X X X X X X X X X X X X X X X
Leetown Volunteer Fire Department Fire Station
X X X X X X X X X X X X X X X
McNeill Volunteer Fire Department 1 Fire Station
X X X X X X X X X X X X X X X X X
North Central Volunteer Fire Department 2 Fire Station
X X X X X X X X X X X X
Northeast Volunteer Fire Department 1 Fire Station
X X X X X X X X X X X X
Northeast Volunteer Fire Department 2 Fire Station
X X X X X X X X X X X X

SECTION 6: VULNERABILITY ASSESSMENT
MEMA District 9 Regional Hazard Mitigation Plan DRAFT – February 2017
6:119
Flood-Related Fire-Related G Wind-Related Other Hazards
Dam
an
d L
eve
e F
ailu
re
Ero
sio
n
Flo
od
– 1
00
ye
ar
Flo
od
– 5
00
ye
ar
Flo
od
– V
E-zo
ne
Dro
ugh
t
Ligh
tnin
g
Wild
fire
Eart
hq
uak
e
Extr
em
e C
old
Extr
em
e H
eat
/ H
eat
Wav
e
Hai
lsto
rm
Hu
rric
ane
an
d T
rop
ical
Sto
rm
Seve
re T
hu
nd
ers
torm
/ H
igh
Win
d
Torn
ado
Win
ter
We
ath
er
Sea
Leve
l Ris
e-
3 f
ee
t
Fixe
d H
AZM
AT
– 0
.5 m
ile
Fixe
d H
AZM
AT
– 1
.0 m
ile
Mo
bile
HA
ZMA
T –
0.5
mile
(ro
ad)
Mo
bile
HA
ZMA
T –
1.0
mile
(ro
ad)
Mo
bile
HA
ZMA
T –
0.5
mile
(rai
l)
Mo
bile
HA
ZMA
T –
1.0
mile
(rai
l)
Infe
ctio
us
Dis
ea
se
FACILITY NAME CITY/TOWN
(if applicable) FACILITY TYPE
Pearl River County Courthouse Public Facility
X X X X X X X X X X X X X X X X X
Pearl River County Road Department Transportation
X X X X X X X X X X X X X X X X X
Sewer Lift Station Water/ Wastewater
X X X X X X X X X X X X X X X X
South Repeater Picayune Comm X X X X X X X X X X X X
Nicholson Volunteer Fire Department 1 Picayune Fire Station
X X X X X X X X X X X X X X X X X
Picayune Fire Department Central Station Picayune Fire Station
X X X X X X X X X X X X X X X X
Picayune Fire Station No. 1 Picayune Fire Station
X X X X X X X X X X X X X X X X X
Picayune Fire Station No. 3 Picayune Fire Station
X X X X X X X X X X X X X X X X X
Pine Grove Volunteer Fire Department 1 Picayune Fire Station
X X X X X X X X X X X X X X
Pine Grove Volunteer Fire Department 2 Picayune Fire Station
X X X X X X X X X X X X X X
Southeast Volunteer Fire Department 1 Picayune Fire Station
X X X X X X X X X X X X X
Southeast Volunteer Fire Department 2 Picayune Fire Station
X X X X X X X X X X X X X X X

SECTION 6: VULNERABILITY ASSESSMENT
MEMA District 9 Regional Hazard Mitigation Plan DRAFT – February 2017
6:120
Flood-Related Fire-Related G Wind-Related Other Hazards
Dam
an
d L
eve
e F
ailu
re
Ero
sio
n
Flo
od
– 1
00
ye
ar
Flo
od
– 5
00
ye
ar
Flo
od
– V
E-zo
ne
Dro
ugh
t
Ligh
tnin
g
Wild
fire
Eart
hq
uak
e
Extr
em
e C
old
Extr
em
e H
eat
/ H
eat
Wav
e
Hai
lsto
rm
Hu
rric
ane
an
d T
rop
ical
Sto
rm
Seve
re T
hu
nd
ers
torm
/ H
igh
Win
d
Torn
ado
Win
ter
We
ath
er
Sea
Leve
l Ris
e-
3 f
ee
t
Fixe
d H
AZM
AT
– 0
.5 m
ile
Fixe
d H
AZM
AT
– 1
.0 m
ile
Mo
bile
HA
ZMA
T –
0.5
mile
(ro
ad)
Mo
bile
HA
ZMA
T –
1.0
mile
(ro
ad)
Mo
bile
HA
ZMA
T –
0.5
mile
(rai
l)
Mo
bile
HA
ZMA
T –
1.0
mile
(rai
l)
Infe
ctio
us
Dis
ea
se
FACILITY NAME CITY/TOWN
(if applicable) FACILITY TYPE
Covenant Health and Rehab Picayune Medical
X X X X X X X X X X X X X X X X
Highland Community Hospital Picayune Medical
X X X X X X X X X X X X X X X X X
Pearl River Dialysis Unit Picayune Medical
X X X X X X X X X X X X X X
Picayune Criminal Justice Center Picayune Police Station
X X X X X X X X X X X X X X X X X
Picayune Police Department Picayune Police Station
X X X X X X X X X X X X X X X X X
County Office Building Picayune Public Facility
X X X X X X X X X X X X X X X X X
National Guard Amory Picayune Public Facility
X X X X X X X X X X X X X X X X X
Picayune City Hall Picayune Public Facility X X X X X X X X X X X X X X X X
Picayune Public Works Picayune Public Facility
X X X X X X X X X X X X X X X
Pearl River County Resource Center/Manna Ministries Picayune Shelter
X X X X X X X X X X X X X X X X X
Picayune 1st Baptist Church Picayune Shelter
X X X X X X X X X X X X X X X X
Roseland Park Elementary Picayune Shelter
X X X X X X X X X X X X X X X X
Sewer Lift Station- 203 Memorial Blvd. Picayune
Water/ Wastewater
X X X X X X X X X X X X X X X X X

SECTION 6: VULNERABILITY ASSESSMENT
MEMA District 9 Regional Hazard Mitigation Plan DRAFT – February 2017
6:121
Flood-Related Fire-Related G Wind-Related Other Hazards
Dam
an
d L
eve
e F
ailu
re
Ero
sio
n
Flo
od
– 1
00
ye
ar
Flo
od
– 5
00
ye
ar
Flo
od
– V
E-zo
ne
Dro
ugh
t
Ligh
tnin
g
Wild
fire
Eart
hq
uak
e
Extr
em
e C
old
Extr
em
e H
eat
/ H
eat
Wav
e
Hai
lsto
rm
Hu
rric
ane
an
d T
rop
ical
Sto
rm
Seve
re T
hu
nd
ers
torm
/ H
igh
Win
d
Torn
ado
Win
ter
We
ath
er
Sea
Leve
l Ris
e-
3 f
ee
t
Fixe
d H
AZM
AT
– 0
.5 m
ile
Fixe
d H
AZM
AT
– 1
.0 m
ile
Mo
bile
HA
ZMA
T –
0.5
mile
(ro
ad)
Mo
bile
HA
ZMA
T –
1.0
mile
(ro
ad)
Mo
bile
HA
ZMA
T –
0.5
mile
(rai
l)
Mo
bile
HA
ZMA
T –
1.0
mile
(rai
l)
Infe
ctio
us
Dis
ea
se
FACILITY NAME CITY/TOWN
(if applicable) FACILITY TYPE
Sewer Lift Station- 703 Hwy. 11 North Picayune
Water/ Wastewater
X X X X X X X X X X X X X X X X X X
Sewer Lift Station-Read Road Picayune
Water/ Wastewater
X X X X X X X X X X X X X X X X
Sewer Lift Station-South Beech Picayune
Water/ Wastewater
X X X X X X X X X X X X X X X X X
Sewer Lift Station-900 S. Beech Picayune
Water/ Wastewater
X X X X X X X X X X X X X X X X X X X
Sewer Treatment Plant-Airport Road Picayune
Water/ Wastewater
X X X X X X X X X X X X X X X X X
Sewer Treatment Plant-Neal Road Picayune
Water/ Wastewater
X X X X X X X X X X X X X X X
Central Repeater Poplarville Comm X X X X X X X X X X X X
Emergency Communication’s Tower Poplarville Comm
X X X X X X X X X X X X
Poplarville Repeater Poplarville Comm X X X X X X X X X X X X
West Repeater Poplarville Comm X X X X X X X X X X X X
Pearl River County Emergency Management Poplarville EOC
X X X X X X X X X X X X X X X X
Amackertown Volunteer Fire Department Station 1 Poplarville Fire Station
X X X X X X X X X X X X

SECTION 6: VULNERABILITY ASSESSMENT
MEMA District 9 Regional Hazard Mitigation Plan DRAFT – February 2017
6:122
Flood-Related Fire-Related G Wind-Related Other Hazards
Dam
an
d L
eve
e F
ailu
re
Ero
sio
n
Flo
od
– 1
00
ye
ar
Flo
od
– 5
00
ye
ar
Flo
od
– V
E-zo
ne
Dro
ugh
t
Ligh
tnin
g
Wild
fire
Eart
hq
uak
e
Extr
em
e C
old
Extr
em
e H
eat
/ H
eat
Wav
e
Hai
lsto
rm
Hu
rric
ane
an
d T
rop
ical
Sto
rm
Seve
re T
hu
nd
ers
torm
/ H
igh
Win
d
Torn
ado
Win
ter
We
ath
er
Sea
Leve
l Ris
e-
3 f
ee
t
Fixe
d H
AZM
AT
– 0
.5 m
ile
Fixe
d H
AZM
AT
– 1
.0 m
ile
Mo
bile
HA
ZMA
T –
0.5
mile
(ro
ad)
Mo
bile
HA
ZMA
T –
1.0
mile
(ro
ad)
Mo
bile
HA
ZMA
T –
0.5
mile
(rai
l)
Mo
bile
HA
ZMA
T –
1.0
mile
(rai
l)
Infe
ctio
us
Dis
ea
se
FACILITY NAME CITY/TOWN
(if applicable) FACILITY TYPE
Amackertown Volunteer Fire Department Station 2 Poplarville Fire Station
X X X X X X X X X X X X
Crossroads Fire Department 1 Poplarville Fire Station
X X X X X X X X X X X X
Derby/Whitesand Volunteer Fire Department 1 Poplarville Fire Station
X X X X X X X X X X X X X X X X X
Derby/Whitesand Volunteer Fire Department 2 Poplarville Fire Station
X X X X X X X X X X X X
North Central Volunteer Fire Department 1 Poplarville Fire Station
X X X X X X X X X X X X X
Poplarville Fire Department Poplarville Fire Station
X X X X X X X X X X X X X X X X
Steephollow Volunteer Fire Department 1 Poplarville Fire Station
X X X X X X X X X X X X
Steephollow Volunteer Fire Department 2 Poplarville Fire Station
X X X X X X X X X X X X
Steephollow Volunteer Fire Department 3 Poplarville Fire Station
X X X X X X X X X X X X

SECTION 6: VULNERABILITY ASSESSMENT
MEMA District 9 Regional Hazard Mitigation Plan DRAFT – February 2017
6:123
Flood-Related Fire-Related G Wind-Related Other Hazards
Dam
an
d L
eve
e F
ailu
re
Ero
sio
n
Flo
od
– 1
00
ye
ar
Flo
od
– 5
00
ye
ar
Flo
od
– V
E-zo
ne
Dro
ugh
t
Ligh
tnin
g
Wild
fire
Eart
hq
uak
e
Extr
em
e C
old
Extr
em
e H
eat
/ H
eat
Wav
e
Hai
lsto
rm
Hu
rric
ane
an
d T
rop
ical
Sto
rm
Seve
re T
hu
nd
ers
torm
/ H
igh
Win
d
Torn
ado
Win
ter
We
ath
er
Sea
Leve
l Ris
e-
3 f
ee
t
Fixe
d H
AZM
AT
– 0
.5 m
ile
Fixe
d H
AZM
AT
– 1
.0 m
ile
Mo
bile
HA
ZMA
T –
0.5
mile
(ro
ad)
Mo
bile
HA
ZMA
T –
1.0
mile
(ro
ad)
Mo
bile
HA
ZMA
T –
0.5
mile
(rai
l)
Mo
bile
HA
ZMA
T –
1.0
mile
(rai
l)
Infe
ctio
us
Dis
ea
se
FACILITY NAME CITY/TOWN
(if applicable) FACILITY TYPE
Steephollow Volunteer Fire Department 4 Poplarville Fire Station
X X X X X X X X X X X X X X X
Pearl River County Hospital & Nursing Home Poplarville Medical
X X X X X X X X X X X X X X X X
Poplarville Police Department Poplarville Police Station
X X X X X X X X X X X X X X X X X
National Guard Amory Poplarville Public Facility
X X X X X X X X X X X X X X X X X
Poplarville City Hall Poplarville Public Facility X X X X X X X X X X X X X X X X X
Poplarville Public Works Poplarville Public Facility
X X X X X X X X X X X X X X X X X
Poplarville 1st Baptist Church Poplarville Shelter
X X X X X X X X X X X X X X X X X
Poplarville Middle School Poplarville Shelter
X X X X X X X X X X X X X X X X
Sewer Treatment Plant Poplarville
Water/ Wastewater
X X X X X X X X X X X X X X X X X
STONE COUNTY Wiggins Fire Department Fire Station
X X X X X X X X X X X X X X X X X
Stone County Hospital Medical
X X X X X X X X X X X X X X
Stone Co. Sheriff Department Police Station
X X X X X X X X X X X X X X X X X X X

SECTION 6: VULNERABILITY ASSESSMENT
MEMA District 9 Regional Hazard Mitigation Plan DRAFT – February 2017
6:124
Flood-Related Fire-Related G Wind-Related Other Hazards
Dam
an
d L
eve
e F
ailu
re
Ero
sio
n
Flo
od
– 1
00
ye
ar
Flo
od
– 5
00
ye
ar
Flo
od
– V
E-zo
ne
Dro
ugh
t
Ligh
tnin
g
Wild
fire
Eart
hq
uak
e
Extr
em
e C
old
Extr
em
e H
eat
/ H
eat
Wav
e
Hai
lsto
rm
Hu
rric
ane
an
d T
rop
ical
Sto
rm
Seve
re T
hu
nd
ers
torm
/ H
igh
Win
d
Torn
ado
Win
ter
We
ath
er
Sea
Leve
l Ris
e-
3 f
ee
t
Fixe
d H
AZM
AT
– 0
.5 m
ile
Fixe
d H
AZM
AT
– 1
.0 m
ile
Mo
bile
HA
ZMA
T –
0.5
mile
(ro
ad)
Mo
bile
HA
ZMA
T –
1.0
mile
(ro
ad)
Mo
bile
HA
ZMA
T –
0.5
mile
(rai
l)
Mo
bile
HA
ZMA
T –
1.0
mile
(rai
l)
Infe
ctio
us
Dis
ea
se
FACILITY NAME CITY/TOWN
(if applicable) FACILITY TYPE
MS Power Main Sub-Station Power/Gas
X X X X X X X X X X X X X X X X X X X
MS Power Sub-Station Power/Gas
X X X X X X X X X X X X X
MS Power Sub-Station Power/Gas
X X X X X X X X X X X X X X X X X X X
Flint Creek Reservoir Dam Public Facility
X X X X X X X X X X X X X X X
Regional Correctional Facility Public Facility
X X X X X X X X X X X X X X X X X X X
Stone County Courthouse Public Facility
X X X X X X X X X X X X X X X X X X
Stone County Health Department Public Facility
X X X X X X X X X X X X X X X X X X
US Postal Perkinston Public Facility X X X X X X X X X X X X X X X X
US Postal Wiggins Public Facility X X X X X X X X X X X X X X X X X X
MS Gulf Coast Community College School
X X X X X X X X X X X X X X X X
Perkinston Elementary School School
X X X X X X X X X X X X X X X X X
Stone Elementary School School
X X X X X X X X X X X X X X X
Stone High School School X X X X X X X X X X X X X X X X X X
Stone Middle School School X X X X X X X X X X X X X X X X X X

SECTION 6: VULNERABILITY ASSESSMENT
MEMA District 9 Regional Hazard Mitigation Plan DRAFT – February 2017
6:125
Flood-Related Fire-Related G Wind-Related Other Hazards
Dam
an
d L
eve
e F
ailu
re
Ero
sio
n
Flo
od
– 1
00
ye
ar
Flo
od
– 5
00
ye
ar
Flo
od
– V
E-zo
ne
Dro
ugh
t
Ligh
tnin
g
Wild
fire
Eart
hq
uak
e
Extr
em
e C
old
Extr
em
e H
eat
/ H
eat
Wav
e
Hai
lsto
rm
Hu
rric
ane
an
d T
rop
ical
Sto
rm
Seve
re T
hu
nd
ers
torm
/ H
igh
Win
d
Torn
ado
Win
ter
We
ath
er
Sea
Leve
l Ris
e-
3 f
ee
t
Fixe
d H
AZM
AT
– 0
.5 m
ile
Fixe
d H
AZM
AT
– 1
.0 m
ile
Mo
bile
HA
ZMA
T –
0.5
mile
(ro
ad)
Mo
bile
HA
ZMA
T –
1.0
mile
(ro
ad)
Mo
bile
HA
ZMA
T –
0.5
mile
(rai
l)
Mo
bile
HA
ZMA
T –
1.0
mile
(rai
l)
Infe
ctio
us
Dis
ea
se
FACILITY NAME CITY/TOWN
(if applicable) FACILITY TYPE
Perkinston Elementary School/Shelter Shelter
X X X X X X X X X X X X X X X X X
Stone Elementary School/Shelter Shelter
X X X X X X X X X X X X X X X
Stone High School/Shelter Shelter
X X X X X X X X X X X X X X X X X
Stone Middle School/Shelter Shelter
X X X X X X X X X X X X X X X X X
MS Hwy 26/ Hwy 49 Intersection Transportation
X X X X X X X X X X X X X X
US Highway 49 Transportation X X X X X X X X X X X X
Stone County 911 Center Wiggins Comm
X X X X X X X X X X X X X X X X X X
Stone Co. Emergency Operation/Communication Center Wiggins EOC
X X X X X X X X X X X X X X X X X X
Wiggins Police Department Wiggins Police Station
X X X X X X X X X X X X X X X X X X
Wiggins City Hall Wiggins Public Facility X X X X X X X X X X X X X X X X X

SECTION 6: VULNERABILITY ASSESSMENT
MEMA District 9 Regional Hazard Mitigation Plan DRAFT – February 2017
6:126