section 3. asic industry trends - smithsonian...
TRANSCRIPT

ASSPs AND ASICs
The term ASIC (Application Specific IC) has been a misnomer from the very beginning. ASICs, asnow known in the IC industry, are really customer specific ICs. In other words, the gate array orstandard cell device is specifically made for one customer. ASIC, if taken literally, would meanthe device was created for one particular type of system (e.g., a disk-drive), even if this device issold to numerous customers and/or is put in the IC manufacturer’s catalog.
Currently, a device type that is sold to more than one user, even if it is produced using ASIC tech-nology, is considered a standard IC or ASSP (Application Specific Standard Product). Thus, weare left with the following nomenclature guidelines (Figure 3-1).
INTEGRATED CIRCUIT ENGINEERING CORPORATION 3-1
3 ASIC INDUSTRY TRENDS
Figure 3-1. ASIC Industry Terminology
ASIC: A device produced for only one customer. PLDs are included as ASICs because the customer “programs” that device for its needs only. CSIC: What ASICs should have been called from the beginning. Some companies differentiate an ASIC from a CSIC by who completes or is responsible for the majority of the IC design effort. If it is the IC producer, the part is labeled a CSIC, if it is the end-user, the device is called an ASIC. This term is not currently used very often in the IC industry. ASSP: A relatively new term for ICs targeting specific types of systems. In many cases the IC will be manufactured using ASIC technology (e.g., gate or linear array or standard cell techniques) but will ultimately be sold as a standard device type to numerous users (i.e., put into a product catolog). If the end-user helped the IC producer design the ASSP, that user is typically given a market leadtime (i.e., window of opportunity) to use the device before it is made available to its competitors. CSP: Customizable Standard Products are 70 to 90 percent standard with 10 to 30 percent of the chip available for user-specified logic, memory, or peripheral functions.
19181ASource: ICE, "Status 1996"

One problem many IC producers have run into while producing ASSPs is that in order to providethe optimum part, the IC producer must understand the system application at least as well as theend-user. Because this system-level expertise is not easy to acquire, most ASSP vendors haveformed close relationships or partnerships with end-users. In this way, the IC vendor and end-user work closely together early in the system design cycle in order to properly define the ASSPdevice.
In general, as standard ICs take aim at ever finer segments of the marketplace, they ultimatelyevolve into ASSPs. In other words, at some point in time there could be very few standard ICs;most devices produced would be aimed at specific system needs. An example would be certainDRAMs architecturally optimized for a hand-held telecom system, laptop PC, or HDTV set. Thisis precisely the direction the IC industry is now heading.
Figure 3-2 shows some of the devices that National Semiconductor considers ASSPs. As IC pro-ducers customize their devices for specific system needs, the list of ICs labeled as ASSPs contin-ues to expand. In 1995, Sharp Corporation plans to release an ASSP product based upon the33MHz ARM RISC 32-bit MPU core. The ARM ASSP will include a 480x320 monochrome LCDcontroller, 115-kbaud serial data infrared transceiver, write-back cache controller, on-board SRAMoptimized for real-time interrupt, and pulse-width modulators. As was mentioned earlier, 20years from now there may be few “standard” ICs produced.
Although the 1995 ASIC market is estimated to have been $15.7 billion, the ASSP-type products(which are part of the special purpose MOS Logic category) are taking away some of its momen-tum (Figure 3-3). Overall, the ASIC market (not including full custom) is forecast to follow totalIC industry growth rates fairly closely.
ASIC Industry Trends
INTEGRATED CIRCUIT ENGINEERING CORPORATION3-2
Figure 3-2. Sampling of ASSPs from National Semiconductor
• Mainframe connectivity solutions • FDDI devices • Local area network (LAN) ICs • Telecommunications products (e.g., CODECs) • Graphics ICs • Mass storage devices • Real-time clocks • DRAM management ICs • Floppy-disk devices • UARTs
17776Source: ICE, "Status 1996"

Does the proliferation of ASSPs and more customer-specific standard products mean an end to theASIC market? No. This is because most of the pros and cons of ASICs versus ASSPs or standardproducts still exist.
The primary advantage of ASSPs or standard products is the ability to immediately (most of thetime) purchase the ICs and get the system to market quickly. However, ASIC devices allow thesystem producer to differentiate its product from the competition. The result is that many timesthe system producer is able to gain marketshare and/or better profit margins.
In some cases standard products and ASICs are merging in an attempt to offer the benefits of bothapproaches. In 1993, TI announced that it was merging an enhanced version of its standard fixed-point TMS320C25 DSP chip and 15,000 usable and customizable 0.8-micron CMOS gate-arraygates on one device. Thus, the user is able to take advantage of well characterized high-perfor-mance DSP circuitry while at the same time adding unique features to give its system a differen-tial advantage over its competitors. TI estimated that 30 percent of its total DSP IC sales in 1995would be in customizable version form.* This percentage was expected to rise to 50 percent in2000.
ASIC Industry Trends
INTEGRATED CIRCUIT ENGINEERING CORPORATION 3-3
0
1
2
3
4
5
6
7
8
1995 (EST)
199419931992
Year
Bill
ion
s o
f D
olla
rs
26%
26%
28%
20204ASource: ICE, "Status 1996"
3.75
4.74
5.98
7.63
Figure 3-3. Special Purpose MOS Logic Market (1992-1995)
* Through 1995 TI’s belief in the success of its customizable DSP was well founded. TI’s big jump in gate array sales in1994 and 1995 was greatly due to the success of its gate array DSP program.

Another grey area is where Cirrus Logic takes one of its ASSP ICs and customizes a portion of itfor one of its customers. Typically only about 5-10 percent of the new design is customized for theend-user. This “tweaked” device is still normally classified as an ASSP since the majority of thecircuitry is still ASSP-based.
There is no question that the IC industry will continue to evolve toward devices that are specifi-cally suited for the customers’ needs. ICE believes that various versions of ASICs and ASSPs willco-exist to help serve those needs in the most economical and efficient manner possible.
ASIC Definitions
Some basic definitions and classifications are shown below in order to define what ICE meanswhen using the various terms used to describe today’s ASIC devices. ASIC stands for ApplicationSpecific Integrated Circuit and according to ICE’s definition includes gate arrays, standard cells(sometimes called cell-based), full custom, and programmable logic devices (PLDs). Thesedevices are classified as either semicustom, custom, or PLDs. Formal definitions are given inFigure 3-4.
ASIC Industry Trends
INTEGRATED CIRCUIT ENGINEERING CORPORATION3-4
I. Semicustom IC - A monolithic circuit that has one or more customized mask layers, but does not have all mask layers customized, and is sold to only one customer.
Gate Array - A monolithic IC usually composed of columns and rows of transistors (organized in blocks of gates). One or more layers of metal interconnect are used to customize the chip. Sometimes called an uncommitted logic array (ULA). Linear Array - An array of transistors and resistors that performs the functions of several linear ICs and discrete devices.
II. Custom IC - A monolithic circuit that is customized on all mask
layers and is sold to only one customer.
Standard Cell IC - A monolithic IC that is customized on all mask levels using a cell library that embodies pre-characterized circuit structures. ICs that are designed with a silicon compiler are included in this category. Most "embedded" arrays are included in this category. Full Custom IC - A monolithic IC that is at least partially "handcrafted". Handcrafting refers to custom layout and connection work that is accomplished without the aid of a silicon compiler or standard cells.
13660ESource: ICE, "Status 1996"
Figure 3-4. ASIC Definitions

ICE does not include ASSPs in its ASIC market figures. An example of an ASSP part that is notclassified as an ASIC by ICE is Hitachi’s H8/300H Series of microcontrollers. Although theH8/300H user is able to customize this MCU using an extensive Hitachi cell library, the finisheddevices are almost always allowed to be sold to other Hitachi customers after a certain period oftime (Motorola has a similar program using its 68HC05 MCUs).
In mid-1994, Motorola announced its FlexCore program that allows the end-user to use Motorola’s32-bit MPUs as cores in cell-based designs. This program is significantly different from its, andHitachi’s, MCU ASSP offerings in that the finished devices will most likely stay proprietary to theoriginal customer. Thus, these devices are considered to be standard cell ASICs.
The FlexCore-type ASIC program* is a prime example why ASSPs will not eliminate the marketfor ASICs. As was mentioned earlier, ASSPs will still hold an advantage in time-to-market, butthey will never be able to compete with the product differentiation capability of robust ASIC offer-ings such as FlexCore.
Another ASIC segment that needs additional clarification and discussion is the PLD category. ICEincludes under the generic term PLD the simple bipolar fuse-programmable PAL devices (e.g., the22V10) produced by AMD, TI, and National, the complex programmable (CPLD) devices (thattypically have configurable macrocells, multiple feedback paths, etc.) that are usually MOS mem-ory cell-based, and what are called field programmable gate arrays (FPGAs). Figure 3-5 comparesthe architectures of a typical CPLD and a typical FPGA.
ASIC Industry Trends
INTEGRATED CIRCUIT ENGINEERING CORPORATION 3-5
Figure 3-4. ASIC Definitions (continued)
III. Programmable Logic Device (PLD) - A monolithic circuit with fuse, antifuse, or memory cell-based circuitry that may be programmed (customized), and in some cases, reprogrammed by the user (in-system or prototype form).
Simple PLD (SPLD) - Usually a PAL or PLA, typically contains less than 750 logic gates. Complex PLD (CPLD) - A hierarchical arrangement of multiple PAL-like blocks. Field Programmable Gate Array (FPGA) - A PLD that offers fully flexible interconnects, fully flexible logic arrays, and requires functional placement and routing. Electrically Programmable Analog Circuit (EPAC) - A PLD that allows the user to program and reprogram basic analog functions.
13660ESource: ICE, "Status 1996"
* Zilog has a similar program for its Z80 MCU devices.

The FPGAs are produced using MOS memory cell (and thus are usually reprogrammable) or anti-fuse technology. The physical (e.g., line lengths) and electrical characteristics of the interconnectsare unknown before programming, just like a gate array.
As was shown, the PLD classification now encompasses a broad range of products and most peo-ple in the IC industry are aware that the term PLD is no longer synonymous with the nearly obso-lete bipolar fuse-programmable PAL.
Another definitional clarification that should be mentioned is in the standard cell category. Manyof the standard cell designs produced in the ASIC industry use a combination of pre-characterizedand “handcrafted” circuit structures. ICE categorizes an ASIC that has 50 percent or more of itscircuitry composed of cells as a standard cell IC. If less than 50 percent of the circuitry is from pre-characterized cells (with the majority of the design being handcrafted), the IC is considered a fullcustom ASIC.
ASIC Industry Trends
INTEGRATED CIRCUIT ENGINEERING CORPORATION3-6
20205Source: CICC 1995/ICE, "Status 1996"
SPLD Block
SPLD Block
CPLD
SPLD Block
SPLD Block
Global Bus
Logic Block
Interconnect
I/O Cell
FPGA
Figure 3-5. CPLD Versus FPGA Structures
Another device that deserves some further discussion is the embedded array ASIC. When design-ing with this device, the customer first identifies any megacell functions that will be needed. TheASIC producer optimizes the layout of the cell-based design and then begins producing basewafers. While the base wafers are being fabricated, the customer is finishing design work for theuncommitted random logic area (gate array portion) that was set aside in the initial design. Afterthe base wafer is finished being processed, the gate array area of the base wafer is metallized.
The ultimate goal of the parallel random logic design and cell-based wafer fabrication efforts ofthe embedded array program is to shorten the turnaround time encountered with standard celldevices. Many embedded array producers are achieving turnaround times very close to those ofgate arrays.
Although both standard cell and gate array design and fabrication techniques are used on theembedded array, because all of the mask layers of the device are customized for the user, ICE willclassify the embedded array ASICs (e.g., VLSI Technology’s Flex-Arrays) as standard cells.
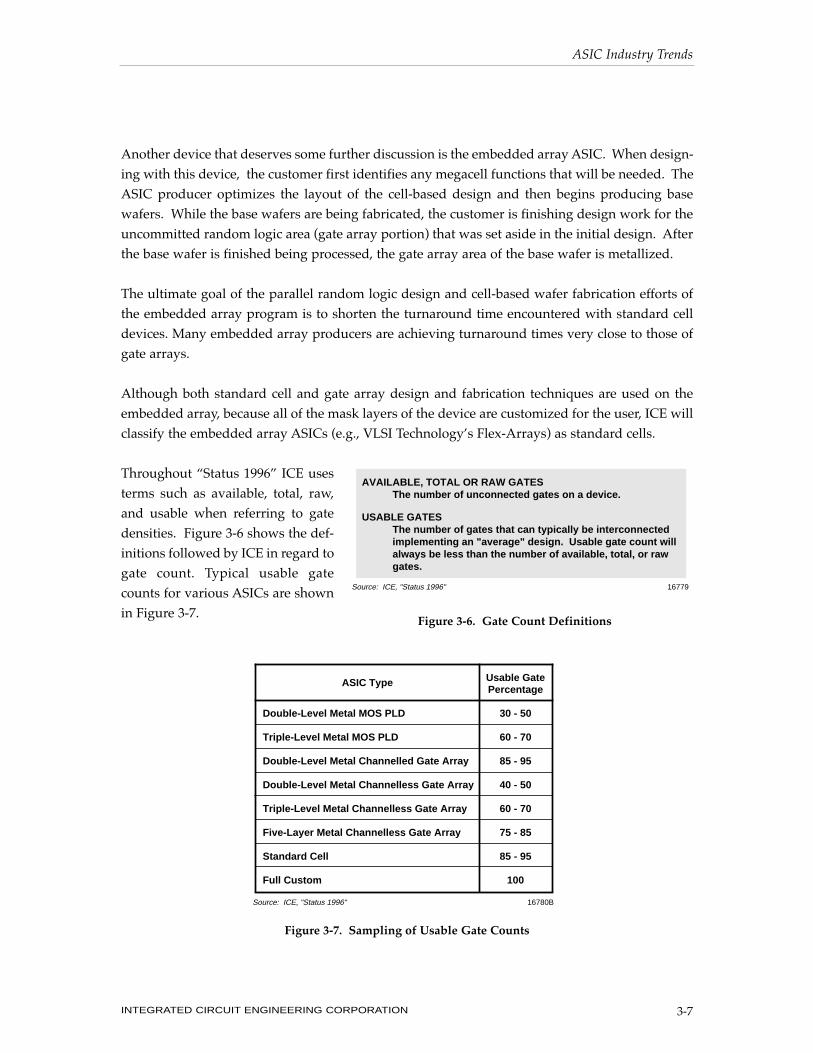
Throughout “Status 1996” ICE usesterms such as available, total, raw,and usable when referring to gatedensities. Figure 3-6 shows the def-initions followed by ICE in regard togate count. Typical usable gatecounts for various ASICs are shownin Figure 3-7.
ASIC Industry Trends
INTEGRATED CIRCUIT ENGINEERING CORPORATION 3-7
AVAILABLE, TOTAL OR RAW GATES The number of unconnected gates on a device.
USABLE GATES The number of gates that can typically be interconnected implementing an "average" design. Usable gate count will always be less than the number of available, total, or raw gates.
16779Source: ICE, "Status 1996"
Figure 3-6. Gate Count Definitions
ASIC Type Usable Gate Percentage
Double-Level Metal MOS PLD
Triple-Level Metal MOS PLD
Double-Level Metal Channelled Gate Array
Double-Level Metal Channelless Gate Array
Triple-Level Metal Channelless Gate Array
Five-Layer Metal Channelless Gate Array
Standard Cell
Full Custom
30 - 50
60 - 70
85 - 95
40 - 50
60 - 70
75 - 85
85 - 95
100
16780BSource: ICE, "Status 1996"
Figure 3-7. Sampling of Usable Gate Counts

As total gate densities have increased, the IC manufacturer has had to go to a greater number ofinterconnect levels (i.e., metal layers) to keep die size and usable gate counts manageable. Thishas been especially evident with the new triple-level metal PLDs. As will be discussed, the newPLD technologies are helping reduce PLD die size dramatically, and in turn, significantly reducemanufacturing costs.
Of course the move to a greater number of metal layers comes with cost and complexity problems.With an increasing number of ASIC designs being pad limited (i.e., the die size is dictated by thenumber of I/O pads rather than the logic gate area) the move to more layers of metal has pro-ceeded very slowly in the ASIC user base.
ASIC Product Lifecycle
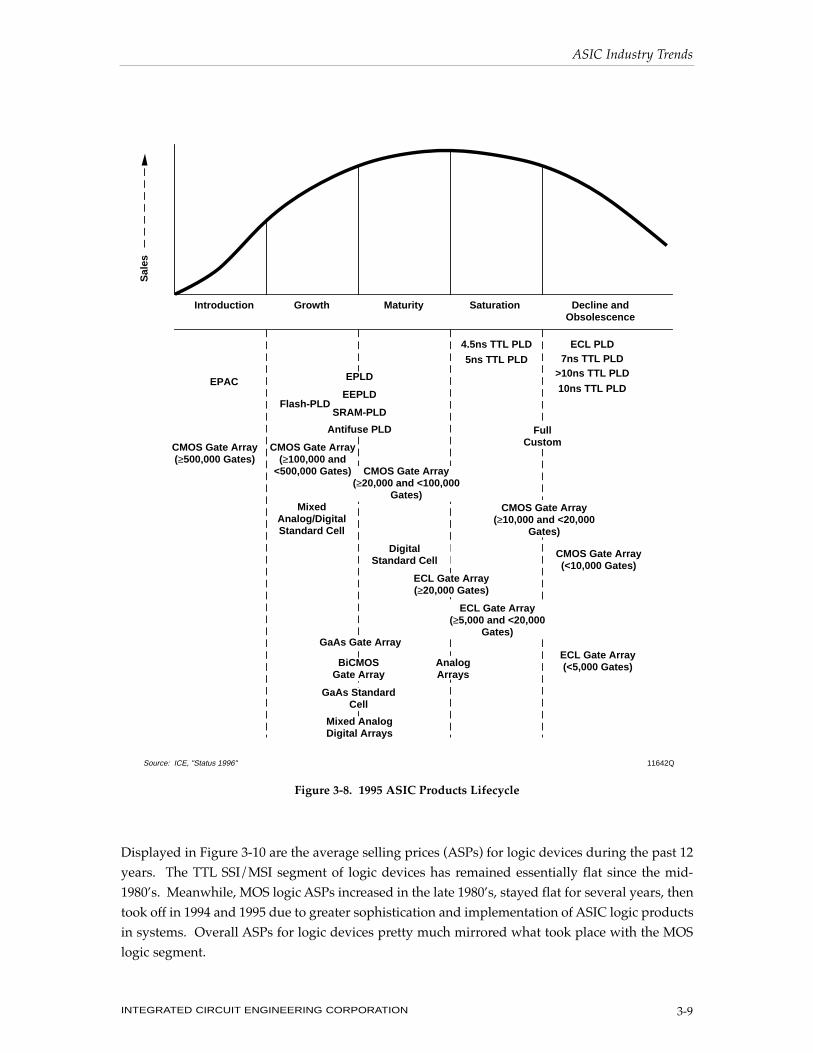
Figure 3-8 shows the 1995 location of each of the major ASIC families on the product lifecyclecurve. It is interesting to note that most of the classifications still reside on the growth side of thecurve. As the ASIC market matures, the majority of the ASIC product types will be in orapproaching the maturity stage of their lifecycles in the late 1990’s.
Low density (i.e., less than 10,000 gates) gate arrays are considered to be in the saturation/declinestage. In 1995, many gate array vendors were shying away from accepting designs for low gatecount arrays. As veteran IC buyers know, once products enter the latter stages of the lifecycle,price becomes a secondary concern to availability. Likewise, slow bipolar TTL PALs are quicklylosing marketshare and are now in the decline stage. As shown, replacement products for theslow bipolar TTL PAL and low density gate array, such as MOS PLDs, are currently in the intro-duction or growth/maturity stage.
THE LOGIC MARKET
An analysis of the logic market provides a good background to the study of the ASIC market sincea vast majority of ASIC products perform some basic logic function within a system.Approximately 20 percent of 1994 and 1995 worldwide IC output was for some form of logic device.
Figure 3-9 shows the logic trends by technology. The most obvious trend shown on the graph isthe tremendous growth of CMOS logic. In eight years (1987-1995), CMOS technology grew from55 percent of the logic market to 85 percent. On the other hand, older technologies such as NMOSand bipolar are quickly being phased out. ECL technology, after maintaining about eight percentof the logic marketshare for several years, declined to around three percent in 1995 and is forecastto drop to a smaller marketshare percentage through the year 2000. Many of the better perfor-mance characteristics of ECL and other older technologies have been replicated in CMOS andBiCMOS technologies in recent years. These two technologies will dominate not only the logicmarket (98 percent in the year 2000), but all digital IC production in the foreseeable future.
ASIC Industry Trends
INTEGRATED CIRCUIT ENGINEERING CORPORATION3-8
Displayed in Figure 3-10 are the average selling prices (ASPs) for logic devices during the past 12years. The TTL SSI/MSI segment of logic devices has remained essentially flat since the mid-1980’s. Meanwhile, MOS logic ASPs increased in the late 1980’s, stayed flat for several years, thentook off in 1994 and 1995 due to greater sophistication and implementation of ASIC logic productsin systems. Overall ASPs for logic devices pretty much mirrored what took place with the MOSlogic segment.
ASIC Industry Trends
INTEGRATED CIRCUIT ENGINEERING CORPORATION 3-9
CMOS Gate Array (≥10,000 and <20,000
Gates)
Introduction Growth Maturity Saturation Decline and Obsolescence
Sal
es
ECL PLD
>10ns TTL PLD
11642Q
EPLD
EEPLD
SRAM-PLD
Full CustomCMOS Gate Array
(≥100,000 and <500,000 Gates) CMOS Gate Array
(≥20,000 and <100,000 Gates)
Digital Standard Cell
Mixed Analog/Digital Standard Cell
ECL Gate Array (≥20,000 Gates)
ECL Gate Array (≥5,000 and <20,000
Gates)
ECL Gate Array (<5,000 Gates)
GaAs Gate Array
BiCMOS Gate Array
Analog Arrays
Source: ICE, "Status 1996"
Antifuse PLD
GaAs Standard Cell
5ns TTL PLD 7ns TTL PLD
10ns TTL PLD
4.5ns TTL PLD
Mixed Analog Digital Arrays
CMOS Gate Array (<10,000 Gates)
Flash-PLD
CMOS Gate Array (≥500,000 Gates)
EPAC
Figure 3-8. 1995 ASIC Products Lifecycle

ASIC Industry Trends
INTEGRATED CIRCUIT ENGINEERING CORPORATION3-10
0
10
20
30
40
50
60
70
80
90
100
2000 $50.0B
1995 $24.5B
1994 $19.7B
1987 $11.6B
1982 $3.3B
Per
cen
t o
f T
ota
l Lo
gic
Mar
ket
*Includes 1% for GaAs
51%
8%
18%
23%
27%
8%
10%
55%
10% 8%4%
<1%4%
4%
3% 2%
<1%
5%
93%*85%
82%
12875N
TTL and Other Bipolar
ECL
NMOSCMOS
BiCMOS
Source: ICE, "Status 1996"
Figure 3-9. Logic Market Trends
0.00
0.20
0.40
0.60
0.80
1.00
1.20
1.40
1.60
1.80
2.00
1995199419931992199119901989198819871986198519841983
TTL SSI/MSI
MOS Logic
Total Logic
AS
P (
$)
(EST)
20197A
Year
Source: WSTS/ICE, "Status 1996"
Figure 3-10. Average Selling Price for Logic Devices
ASIC MARKET FORECAST
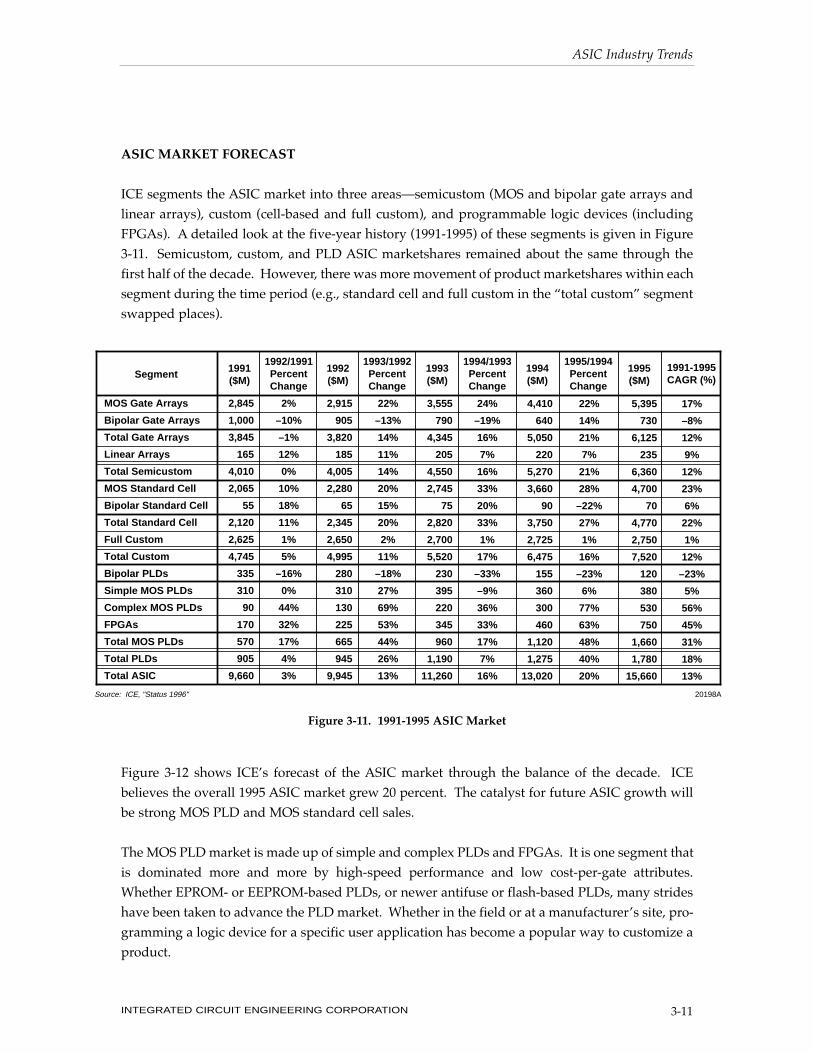
ICE segments the ASIC market into three areas—semicustom (MOS and bipolar gate arrays andlinear arrays), custom (cell-based and full custom), and programmable logic devices (includingFPGAs). A detailed look at the five-year history (1991-1995) of these segments is given in Figure3-11. Semicustom, custom, and PLD ASIC marketshares remained about the same through thefirst half of the decade. However, there was more movement of product marketshares within eachsegment during the time period (e.g., standard cell and full custom in the “total custom” segmentswapped places).
Figure 3-12 shows ICE’s forecast of the ASIC market through the balance of the decade. ICEbelieves the overall 1995 ASIC market grew 20 percent. The catalyst for future ASIC growth willbe strong MOS PLD and MOS standard cell sales.
The MOS PLD market is made up of simple and complex PLDs and FPGAs. It is one segment thatis dominated more and more by high-speed performance and low cost-per-gate attributes.Whether EPROM- or EEPROM-based PLDs, or newer antifuse or flash-based PLDs, many strideshave been taken to advance the PLD market. Whether in the field or at a manufacturer’s site, pro-gramming a logic device for a specific user application has become a popular way to customize aproduct.
ASIC Industry Trends
INTEGRATED CIRCUIT ENGINEERING CORPORATION 3-11
MOS Gate Arrays
Bipolar Gate Arrays
Total Gate Arrays
Linear Arrays
Total Semicustom
MOS Standard Cell
Bipolar Standard Cell
Total Standard Cell
Full Custom
Total Custom
Bipolar PLDs
Simple MOS PLDs
Complex MOS PLDs
FPGAs
Total MOS PLDs
Total PLDs
Total ASIC
2,845
1,000
3,845
165
4,010
2,065
55
2,120
2,625
4,745
335
310
90
170
570
905
9,660
2%
–10%
–1%
12%
0%
10%
18%
11%
1%
5%
–16%
0%
44%
32%
17%
4%
3%
2,915
905
3,820
185
4,005
2,280
65
2,345
2,650
4,995
280
310
130
225
665
945
9,945
22%
–13%
14%
11%
14%
20%
15%
20%
2%
11%
–18%
27%
69%
53%
44%
26%
13%
3,555
790
4,345
205
4,550
2,745
75
2,820
2,700
5,520
230
395
220
345
960
1,190
11,260
24%
–19%
16%
7%
16%
33%
20%
33%
1%
17%
–33%
–9%
36%
33%
17%
7%
16%
4,410
640
5,050
220
5,270
3,660
90
3,750
2,725
6,475
155
360
300
460
1,120
1,275
13,020
22%�
14%�
21%�
7%�
21%�
28%�
–22%�
27%�
1%�
16%�
–23%�
6%�
77%�
63%�
48%�
40%�
20%
5,395�
730�
6,125�
235�
6,360�
4,700�
70�
4,770�
2,750�
7,520�
120�
380�
530�
750�
1,660�
1,780�
15,660
17%�
–8%�
12%�
9%�
12%�
23%�
6%�
22%�
1%�
12%�
–23%�
5%�
56%�
45%�
31%�
18%�
13%
Segment
1991 ($M)
1992/1991 Percent Change
1992 ($M)
1993/1992 Percent Change
1993 ($M)
1994/1993 Percent Change
1994 ($M)
1995/1994 Percent Change
1995 ($M)
1991-1995 CAGR (%)
20198ASource: ICE, "Status 1996"
Figure 3-11. 1991-1995 ASIC Market

The future of the total custom segment (specifically, the standard cell market) also appears brightin ICE’s ASIC forecast. ICE anticipates the standard cell market more than doubling from an esti-mated $4.8 billion in 1995 to approximately $12.7 billion in the year 2000. In fact, ICE forecaststhat the MOS standard cell market will be the largest ASIC product category (surpassing MOSgate arrays) beginning in 1998.
With few exceptions, growth in most product areas appears promising through the year 2000.However, if the word “bipolar” is associated with a category, it spells doom. The mainstream ICmarket has moved away from bipolar-based products toward MOS-based technology. As a result,bipolar gate arrays and bipolar PLDs are forecast to be the poorest performing of all ASIC seg-ments.
Despite the ASIC market forecast calling for sustained growth, the ASIC market will representonly nine percent of the total worldwide IC market in the year 2000. This will be down from 12percent of the IC market in 1995 and 21 percent of the IC market in 1991.
Perhaps a better way of determining the performance of the ASIC market is to view cumulativeannual growth rates (CAGRs, Figure 3-13). Here, the “hot” markets such as complex PLDs,FPGAs, MOS standard cells, and MOS gate arrays are exposed. At the same time, the demise ofbipolar ASICs is evident as well. The total ASIC market is forecast to grow at a healthy 15 percentCAGR through the end of the decade, with four categories equaling or bettering that performanceand six categories not growing at the same rate as the overall market.
ASIC Industry Trends
INTEGRATED CIRCUIT ENGINEERING CORPORATION3-12
MOS Gate Arrays
Bipolar Gate Arrays
Total Gate Arrays
Linear Arrays
Total Semicustom
MOS Standard Cell
Bipolar Standard Cell
Total Standard Cell
Full Custom
Total Custom
Bipolar PLDs
Simple MOS PLDs
Complex MOS PLDs
FPGAs
Total MOS PLDs
Total PLDs
Total ASIC
Segment
6,200�
600�
6,800�
240�
7,040�
5,700�
75�
5,775�
2,800�
8,575�
90�
360�
675�
905�
1,940�
2,030�
17,645
13%�
–25%�
10%�
2%�
9%�
17%�
7%�
17%�
2%�
12%�
–22%�
–3%�
23%�
19%�
16%�
15%�
11%
1996 ($M)
15%�
–18%�
11%�
2%�
11%�
21%�
7%�
21%�
2%�
14%�
–25%�
–5%�
27%�
21%�
17%�
14%�
13%
1996/1995 Percent Change
1997/1996 Percent Change
1997 ($M)
7,000�
450�
7,450�
245�
7,695�
6,650�
80�
6,730�
2,850�
9,580�
70�
350�
830�
1,075�
2,255�
2,325�
19,600
1998/1997 Percent Change
15%�
–24%�
13%�
4%�
12%�
23%�
6%�
23%�
2%�
17%�
–14%�
–4%�
28%�
27%�
22%�
21%�
15%
1998 ($M)
8,050�
340�
8,390�
255�
8,645�
8,180�
85�
8,265�
2,900�
11,165�
60�
335�
1,060�
1,365�
2,760�
2,820�
22,630
1999/1998 Percent Change
17%�
–26%�
15%�
4%�
15%�
23%
6%�
23%�
2%�
17%�
–17%�
–4%�
29%�
28%�
24%�
24%�
17%
1999 ($M)
9,400�
250�
9,650�
265�
9,915�
10,050�
90�
10,140�
2,950�
13,090�
50�
320�
1,365�
1,750�
3,435�
3,485�
26,490
2000/1999 Percent Change
18%�
–26%�
17%�
4%�
17%�
25%�
11%�
25%�
2%�
20%�
–20%�
–6%�
30%�
30%�
27%�
26%�
19%
2000 ($M)
11,100�
185�
11,285�
275�
11,560�
12,550�
100�
12,650�
3,000�
15,650�
40�
300�
1,775�
2,275�
4,350�
4,390�
31,600
1991-2000 CAGR (%)
16%�
–17%�
13%�
6%�
12%�
22%�
7%�
22%�
1%�
14%�
–21%�
0%�
39%�
33%�
25%�
19%�
14%
1995-2000 CAGR (%)
16%�
–24%�
13%�
3%�
13%�
22%�
7%�
22%�
2%�
16%�
–20%�
–5%�
27%�
25%�
21%�
20%�
15%
20199ASource: ICE, "Status 1996"
Figure 3-12. 1996-2000 ASIC Market Forecast

At one time (1986) full custom products accounted for more than half of ASIC marketshare. Now,though this segment is growing ever so slightly in terms of dollars, it is being replaced by devicessuch as standard cells. Full custom ASICs are forecast to represent only nine percent of total ASICproduct marketshare in the year 2000 (Figure 3-14). Supercomputer manufacturers and the mili-tary are the best examples of full custom users. Since overall military spending is down and withsupercomputer power in desktop systems, it stands to reason that there will be less demand forfull custom devices. Meanwhile, standard cell devices, which held 31 percent ASIC marketsharein 1995, are forecast to account for 40 percent in the year 2000.
ASIC Industry Trends
INTEGRATED CIRCUIT ENGINEERING CORPORATION 3-13
Product1991-2000 CAGR (%)
1991-1995 CAGR (%)
1995-2000 CAGR (%)
Complex PLDs
FPGAs
MOS Standard Cell
MOS Gate Arrays
Total ASIC
Bipolar Standard Cell
Linear Arrays
Full Custom
Simple PLDs
Bipolar PLDs
Bipolar Gate Arrays
39�
33�
22�
16�
14�
7�
6�
1�
—�
–21�
–17
56�
45�
23�
17�
13�
6�
9�
1�
5�
–23�
–8
27�
25�
22�
16�
15�
7�
3�
2�
–5�
–20�
–24
20195ASource: ICE, "Status 1996"
Figure 3-13. ASIC Product CAGRs
Gate and Linear Arrays
30%
Standard Cell 11%
Full Custom 52%
PLDs 7%
Gate and Linear Arrays
41%
Standard Cell 31%
Full Custom 17%
PLDs* 11%
Gate and Linear Arrays 37%
Standard Cell 40%
Full Custom 9%
PLDs* 14%
1986 $4.7B
1995 $15.7B
2000 $31.6B
16278J
*FPGAs 5% in 1995, 7% in 2000.Source: ICE, "Status 1996"
Figure 3-14. ASIC Product Marketshare

As touched upon earlier, the market forecast for MOS standard cell and gate array devices appearspromising, but other older technologies are forecast to continue their trek toward obsolescence. InFigure 3-15, forecasts for several logic technologies are shown—and most are in a steady decline.The graphs point out that most designers (and users) have made the switch to MOS technologiesto achieve the desired effects of their ASIC devices. Of the non-MOS segments, only TTL/OtherLogic still shows some signs of life. This mainstream technology of a few years ago was used innumerous applications and remained a rather large market even in 1995. Due to its sheer size andrelatively widespread use, this market segment will be the slowest to decline.
ASIC Industry Trends
INTEGRATED CIRCUIT ENGINEERING CORPORATION3-14
0
500
1000
1500
2000
19951994199319921991
YearTTL/Other Standard Logic Market
Mill
ion
s o
f D
olla
rs
0
200
400
600
800
1000
19951994199319921991
1,000
905
YearBipolar Gate Array Market
Mill
ion
s o
f D
olla
rs
0
100
200
300
400
19951994199319921991
335
280
230
155120
–16%
–18%
–23%
–33%
YearBipolar PLD Market
Mill
ion
s o
f D
olla
rs
0
1,000
2,000
3,000
4,000
5,000
19951994199319921991
2,0652,280
2,745
3,660
4,700
10%20%
33%
28%
YearMOS* Standard Cell Market
Mill
ion
s o
f D
olla
rs
0
1000
2000
3000
4000
5000
6000
19951994199319921991
2,845 2,915
3,555
4,410
5,395
2% 22%
24%
22%
YearMOS* Gate Array Market
Mill
ion
s o
f D
olla
rs
0
100
200
300
400
500
19951994199319921991
500
390
315
150
200
–22%
–19%
–36%
–25%
YearNMOS Logic Market
Mill
ion
s o
f D
olla
rs
18928DSource: ICE, "Status 1996"
*Includes BiCMOS and GaAs
1,505 1,455
1,7301,630 1,620
–3% 19%
–6%–1%
(EST) (EST)
(EST)(EST)
(EST) (EST)
790
640730
–10%
–13%
–19% 14%
Figure 3-15. Selected 1991-1995 Logic Markets

Quarterly market size for each of the four main ASIC products is shown in the next several charts.In Figure 3-16, the MOS gate array market is shown as a gradually upward sloping curve. Recenthistory shows this market performing best during the second and third quarters of each year.
The MOS standard cell market is shown on a quarterly basis in Figure 3-17. Much more dramat-ic growth characterized this segment during the past few years. Besides being used in more wide-spread applications, the sizable market increase for standard cells might be explained in the factthat many companies re-classified their full custom devices as standard cell products in 1994 and1995.
Figure 3-18 portrays the rise in quarterly MOS PLD sales dating back to 1989. For the time peri-od shown, this market steadily increased. At least it did so until severe pricing pressures kept themarket size flat from 3Q93 through 2Q94. New product offerings from several suppliers helpedrevive the MOS PLD market in late 1994 and throughout 1995.
Meanwhile, the theme for bipolar ASIC devices—in this case, for bipolar PLDs—is repeated inFigure 3-19. Since 1989, the bipolar PLD market has dropped steeply. This market shows a ten-dency to rebound slightly every once in a while, but overall, the trend is still down.
ASIC Industry Trends
INTEGRATED CIRCUIT ENGINEERING CORPORATION 3-15
1989 1990 1991 1992
Do
llars
(M
illio
ns)
Year17778JSource: WSTS/ICE, "Status 1996"
1993
1994
1995
400
500
600
700
800
900
1,000
1,100
1,200
1,300
4Q3Q2Q1Q4Q3Q2Q1Q4Q3Q2Q1Q4Q3Q2Q1Q4Q3Q2Q1Q4Q3Q2Q1Q4Q3Q2Q1Q(EST)
Figure 3-16. Quarterly MOS Gate Array Market (1989-1995)

ASIC Industry Trends
INTEGRATED CIRCUIT ENGINEERING CORPORATION3-16
250
350
450
550
650
750
850
950
4Q3Q2Q1Q4Q3Q2Q1Q4Q3Q2Q1Q4Q3Q2Q1Q
1992 1993 1994 1995
YearSource: WSTS/ICE, "Status 1996" 18930E
Do
llars
(M
illio
ns)
(EST)
Figure 3-17. Quarterly MOS Standard Cell Market (1992-1995)
0
50
100
150
200
250
300
350
400
450
500
4Q3Q2Q1Q4Q3Q2Q1Q4Q3Q2Q1Q4Q3Q2Q1Q4Q3Q2Q1Q4Q3Q2Q1Q4Q3Q2Q1Q
1993 1994 19951992199119901989
Source: WSTS/ICE, "Status 1996" 18929E
Do
llars
(M
illio
ns)
Year
(EST)
Figure 3-18. Quarterly MOS PLD Market (1989-1995)

TOP TEN ASIC VENDOR SALES
Before listing any ASIC vendor sales, it should be noted that the ICE ASIC sales estimates do notinclude standard products designed from standard cell libraries or with silicon compilers. Onlygate and linear arrays, full custom, and standard cell devices not listed in a catalog, as well asPLDs, are considered ASICs.
Figure 3-20 provides a list of the top 10 ASIC (not including full custom) suppliers for 1995. Withtotal ASIC sales of $1.27 billion, NEC held on to the top spot on the leading ASIC supplier list in1995. NEC posted strong gate and linear array sales, but also made an effort to strengthen its stan-dard cell sales as well. In doing so, it captured just under 10 percent of the total ASIC market.
ICE estimates that LSI Logic moved ahead of Fujitsu into the number two spot in the 1995 ASICranking. LSI Logic’s standard cell ASIC sales have increased from $105 million in 1993 to an esti-mated $555 million in 1995. It would not be surprising to see LSI Logic overtake NEC as theworldwide leading ASIC vendor in 1996!
A newcomer to the top ten ASIC ranking in 1995 is Xilinx*, the longtime leader in the FPGA mar-ketplace. ICE believes that Xilinx has a chance of passing Hitachi in ASIC sales in 1996.
ASIC Industry Trends
INTEGRATED CIRCUIT ENGINEERING CORPORATION 3-17
1989 1990 1991 1992Year
17777K
Do
llars
(M
illio
ns)
Source: WSTS/ICE, "Status 1996"
1993 1994 1995
20
30
40
50
60
70
80
90
100
110
120
130
4Q3Q2Q1Q4Q3Q2Q1Q4Q3Q2Q1Q4Q3Q2Q1Q4Q3Q2Q1Q4Q3Q2Q1Q4Q3Q2Q1Q(EST)
Figure 3-19. Quarterly Bipolar PLD Market (1989-1995)
* Longtime ASIC top ten vendor VLSI Technology slipped out of the top ten ranking in 1995 with $440 million in ASICsales.

Also in the top 10 list is Symbios Logic, Inc. Symbios is the former NCR facility in Colorado thatwas purchased (and renamed) by Hyundai. In purchasing the NCR ASIC business, Symbios(Hyundai) became an immediate contender in the worldwide ASIC market.
GATE AND LINEAR ARRAY SUPPLIERS
Displayed in Figure 3-21 are the top gate array manufacturers and their sales for 1994 and 1995.Four companies, Fujitsu, NEC, Toshiba, and LSI Logic, accounted for about 50 percent of all gatearray sales in 1995. The top ten gate array suppliers accounted for 80 percent of sales. In the caseof the top four players, each has been a steady player in the gate array business for many years.A new entry into the top ten gate array ranking in 1995 was IBM. The figures listed for IBM areonly its merchant sales and do not include internal transfers.
At the number six position in 1995 was TI. It reported an increase in gate array sales of 46 percentduring the year. This large increase was partly due to it providing customizable DSP devices. TIwill build a device that features its DSP core surrounded by gate array technology. While this canbe labeled as either a DSP or an ASIC, ICE classifies the product as an ASIC device.
Of the 35 companies listed in the gate array supplier chart, eight posted flat or declining revenuein 1995. Some, such as Raytheon were phasing out of the bipolar gate array business. Meanwhile,Siemens was phasing out of the MOS gate array market.
ASIC Industry Trends
INTEGRATED CIRCUIT ENGINEERING CORPORATION3-18
*Not including full custom **Includes FPGA Sales
NEC
LSI Logic
Fujitsu
Toshiba
TI
AT&T
Hitachi
Xilinx
Motorola
Symbios
Top Ten Total
Other Suppliers
Total Market
Top Ten Marketshare
CompanyPercent Of Total ASIC
Market
Gate And Linear Array Sales ($M)
Standard Cell Sales
($M)
PLD** Sales ($M)
925�
615�
940�
635�
490�
94�
500�
—�
355�
35�
4,589�
1,771�
6,360�
73%
340�
555�
225�
235�
315�
655�
75�
—�
125�
410�
2,935�
1,835�
4,770�
61%
—
—
—
—�
38�
82�
—�
530�
10�
—�
660�
1,120�
1,780�
37%
10%�
9%�
9%�
7%�
7%�
6%�
4%�
4%�
4%�
3%�
63%�
37%�
100%�
63%
20194ASource: ICE, "Status 1996"
Total ASIC Sales
($M)
1,265�
1,170�
1,165�
870�
843�
831�
575�
530�
490�
445�
8,184�
4,726�
12,910�
63%
1
2
3
4
5
6
7
8
9
10
1995 Rank
Figure 3-20. 1995 Top Ten ASIC Leaders

Gate arrays have found their way into more small, electronic sets with advanced functions. Speedand low power, two of the most preferred performance characteristics in ICs, are especiallydesired in gate arrays. Manufacturers have been quick to respond to these needs while addingdensity as well. Typically, 0.8-micron technology is used to manufacture the majority of gatearrays. However, companies have pushed the process technology envelope to 0.5 micron andsmaller for the more-than-one-million-gate gate arrays that have been built in limited quantities.Some research prototype gate arrays have been built using 0.2-micron technology.
ASIC Industry Trends
INTEGRATED CIRCUIT ENGINEERING CORPORATION 3-19
1995 Rank
Company1994 Sales ($M) 1995 Sales ($M, EST)
MOS Bipolar Total MOS Bipolar Total
1995/1994 Percent Change
1995 Percent
Marketshare
1 2 3 4 5 6 7 8 9
10 11 12 13 14 15 16 17 18 19 20 21 22 23 24 25 26 27 28 29 30 31 32 33 34 35
Fujitsu NEC Toshiba LSI Logic Hitachi TI Motorola IBM Mitsubishi Samsung VLSI Technology GEC Plessey S-MOS/Seiko Oki SGS-Thomson AMI AT&T Matsushita National ROHM AMCC Symbios Sanyo Sharp Atmel Siemens* Vitesse** Orbit MHS Ricoh Sony*** Chip Express Kawasaki Steel LG Semicon Raytheon*** Others Total
550�685�525�575�305�335�182�
80 139�
90�108�
93�75�78�80�38�50�44�39�36�12�32�28�30
6�5�
25�12�22�19�15�10�10�10� —�67�
4,410
250�50�— —
115�—
125�— — — —�8
— — — — 10�— — — 28 — — — —�25 — — —�— 5�
— — — 15�
9�640
800�735�525�575�420�335�307�
80 139�
90�108�101�
75�78�80�38�60�44�39�36�40�32�28�30
6�30�25�12�22�19�20�10�10�10�15�76�
5,050
645�830�635�615�360�490�200�160 155�155�130�121�105�
87�83�61�50�53�42�40�14�35�31�30 30�
3�27�27�26�21�20�20�15�10�—�69�
5,395
295�65�—�—�
140�—�
155�— — — — — — — — — 10 — — — 25 — — — — 25�— — — — — — — — 5�
10�730
940�895�635�615�500�490�355�160�155 155�130�121�105�
87�83�61�
60�53�42�40�39�35�31�30 30�28�27�27�26�21�20�20�15�10�
5�79�
6,125
18�22�21�
7�19�46�16�
100�12�72�20�20�40�12�
4�61�—�20�
8�11�–3�
9�11�—
400�–7�
8�125�
18�11�—�
100�50�—�
–67�4�
21
15.3�14.6�10.4�10.0�
8.2�8.0�5.8�2.6�2.5�2.5�2.1�2.0�1.7�1.4�1.4�1.0�1.0�0.9�0.7�0.7�0.6�0.6�0.5�0.5 0.5�0.5�0.4�0.4�0.4�0.3�0.3�0.3�0.2�0.2�0.1�1.2�
100.0
13636P
*Phasing out CMOS gate arrays **GaAs ***Phasing out bipolar gate arraysSource: ICE, "Status 1996"
Figure 3-21. Merchant Gate Array Leaders

It seems gate array implementation has grown as the average number of gates per device hasincreased. As recently as five years ago, average gate array density was in the 10,000-gate range.In 1995, ICE estimates that 90 percent of all gate arrays were shipped with greater than 10,000gates. More specifically, ICE believes that 40 percent of gate arrays were shipped with between20,000 and 50,000 gates in 1995 (Figure 3-22). By the year 2000, ICE anticipates the majority of gatearrays will have an average usable gate count closer to 100,000 gates.
Placing large numbers of gates on a gate array has not been an insurmountable hurdle. Manycompanies have developed gate arrays with over one million available gates. At these densities,it becomes increasingly possible to incorporate large-scale circuitry in a single chip. Circuit den-sity and manufacturing have brought gate arrays to a higher level of acceptance and integration.The biggest challenges facing designers of these “mega” gate arrays are test and packaging issues.
The gate array market by region is shown in Figure 3-23. In 1995, the increased value of the yenhelped Japan become the largest market for gate arrays. Japan had a 35 percent share of the MOSgate array market in 1994 (estimated at 40 percent in 1995), while the North American market was39 percent in 1994 (estimated at 36 percent in 1995).
In the year 2000, ICE expects the North American and Japanese markets to remain the largest forgate array products. Pacific Rim countries, excluding Japan but including Korea, Taiwan, and oth-ers, will garner an increasing percentage of marketshare.
The trend toward MOS technology (CMOS and BiCMOS) will continue in the gate array market(Figure 3-24). In some cases, designers and manufacturers will take advantage of the low powerconsumption and high speed characteristics of BiCMOS technology in the coming five years.However, CMOS technology continues to be refined to the point where it can perform at a levelapproaching BiCMOS. Therefore, it will continue to expand as the preferred technology whenbuilding gate arrays.
ASIC Industry Trends
INTEGRATED CIRCUIT ENGINEERING CORPORATION3-20
≤10K Gates 10% 10K - 20K
Gates 30%
20K - 50K Gates 40%
>50K Gates 20% 1995
$5.4B
18931DSource: ICE, "Status 1996"
Figure 3-22. 1995 MOS Gate Array Market by Gate Count (Usable)

ASIC Industry Trends
INTEGRATED CIRCUIT ENGINEERING CORPORATION 3-21
Europe 14%
Japan 43%
North America
34%
ROW 9%
1995
Total Market = $6.1B
Europe 15%
Japan 39%
North America
34%
ROW 12%
2000
Total Market = $11.3B
8881XSource: ICE, "Status 1996"
Europe 14%
Japan 40%
North America
36%
ROW 10%
1995
Europe 15%
Japan 38%
North America
35%
ROW 12%
2000
Europe 10%
Japan 65%
North America
23%
ROW 2%
1995
Europe 9%
Japan 72%
North America
18%
ROW 1%
2000
Total MOS Market = $5.4B Total MOS Market = $11.1B
Total Bipolar Market = $730M Total Bipolar Market = $185M
Figure 3-23. Worldwide Digital Gate Array Market by Region
Figure 3-24. Digital Gate Array Market by Process Technology
BiCMOS 8%
CMOS* 80%
Bipolar 12%
1995
BiCMOS 9%
CMOS 87%
Bipolar 2%
2000
GaAs 2%
Total Market = $6.1B Total Market = $11.3B
8870ZSource: ICE, "Status 1996"
*Includes GaAs

In contrast, bipolar’s share of the gate array market is forecast to slide from 12 percent in 1995 totwo percent in the year 2000. This steep drop is due to the slumping military IC market as wellas the replacement of ECL arrays in large-scale computing systems with GaAs, BiCMOS, andCMOS ICs.
The worldwide gate array market by end use is segmented in five categories and shown in Figure3-25. Data processing applications are where most gate arrays were destined in 1995. By the year2000, the picture will not change much. Data processing and telecom applications will expandslightly, while other applications decline. The military segment will be a smaller player despitethe fact the Defense Department is very encouraged about further incorporating gate arrays intoits systems.
Linear arrays put the functions of several analog ICs and discrete products onto a single chip.Most linear arrays consist of bipolar transistors and resistors, but can also include capacitors, junc-tion field-effect transistors, and Schottky diodes.
Linear arrays have had a difficult time gaining significant market acceptance. One reason for thisis design difficulties. Other concerns include noise isolation, isolating the substrate, interfacingthe chip with external circuitry, and keeping NRE costs and schedules short. Also, the lack of stan-dardized test methods has traditionally been a stumbling block for linear ASICs.
The leading linear array manufacturers and their sales are provided in Figure 3-26. For the sec-ond straight year sales of linear arrays increased only seven percent. The “other” categoryshowed a steep decline due to Micro Linear and Raytheon phasing out their analog array busi-nesses.
ASIC Industry Trends
INTEGRATED CIRCUIT ENGINEERING CORPORATION3-22
Data Processing
55%
1995
Telecom 19%
Industrial 13%
Consumer 10%
Military 3%
2000 Industrial 11%
Telecom 21%
Consumer 9%
Military 1%
Data Processing
58%
Total Market = $11.3B9933TSource: ICE, "Status 1996"
Total Market = $6.1B
Figure 3-25. Gate Array Market by Application

STANDARD CELL SUPPLIERS
Leading standard cell ASIC manufacturers and their 1994 and 1995 sales numbers are shown inFigure 3-27. AT&T and LSI Logic were the only companies that posted more than 10 percent mar-ketshare in 1995. It should be noted that, being a former “captive” supplier, AT&T did a lot ofinternal business. The internal business represented approximately 30 percent of its total standardcell sales in 1995.
LSI Logic moved from sixth place in 1994 to second place in 1995! Given LSI’s recent standard cellsales surge, it is likely to capture the number one ranking in 1996.
Similar to the gate array ranking, IBM’s standard cell figures only include its merchant sales. ICEexpects that IBM will break into the top ten standard cell sales ranking in 1997.
Five companies among the 38 listed increased sales by triple-digit amounts in 1995. Among themwas LSI Logic, which saw its standard cell business increase 124 percent. LSI Logic took severalsteps to improve its product line, including its first move into the mixed-signal arena. Its firstmixed-signal standard cells focus on data-conversion cells, but will be expanded over time toinclude a wide range of functions. LSI claims an advantage in the mixed-signal market because itmanufactures its devices using a digital CMOS process designed to keep costs down.
Motorola increased its cell-based ASIC sales 116 percent in 1995, mostly by using its FlexCore pro-gram to grow its standard cell business. FlexCore combines a standard product with functionsdesired by a user to create a quasi-application-specific chip. FlexCore takes Motorola’s 68000-fam-
ASIC Industry Trends
INTEGRATED CIRCUIT ENGINEERING CORPORATION 3-23
Company1993 Sales ($M)
Maxim
SGS-Thomson
AT&T
NEC
GEC Plessey
Ricoh
Universal
Gennum
Exar
Cherry
Others
Total
32�
30�
22�
20�
22�
12�
11�
7�
8�
7�
34�
205
13649QSource: ICE, "Status 1996"
1994 Sales ($M)
38�
35�
26�
25�
18�
15�
12�
10�
9�
8�
24�
220
1995 Sales
($M, EST)
42�
38�
34�
30�
20�
17�
13�
12�
10�
9�
10�
235
1995/1994 Percent Change
11�
9�
31�
20�
11�
13�
8�
20�
11�
13�
–58�
7
1995�Percent
Marketshare
18�
16�
14�
13�
9
7�
6�
5�
4�
4�
4�
100
1995 Rank
1
2
3
4
5
6
7
8
9
10
—
—
Figure 3-26. Linear Array Leaders

ily core processor and allows a designer to integrate desired features such as up to 100,000 gatesof custom logic, memory, and peripheral modules. It is a feature that is very attractive and verywell understood by the design community. Customers get what looks like an ASIC device, butuses industry-standard third-party design tools. The bottom line for Motorola was a very nicegain in standard cell sales.
ASIC Industry Trends
INTEGRATED CIRCUIT ENGINEERING CORPORATION3-24
1995 Rank
Company1994 Sales ($M) 1995 Sales ($M, EST)
MOS Bipolar Total MOS Bipolar Total
1995/1994 Percent Change
1995 Percent
Marketshare
1 2 3 4 5 6 7 8 9
10 11 12 13 14 15 16 17 18 19 20 21 22 23 24 25 26 27 28 29 30 31 32 33 34 35 36 37 38
AT&T LSI Logic Symbios NEC TI VLSI Technology Toshiba Fujitsu Alcatel Mietec Motorola SGS-Thomson IBM Matsushita AMS Exar GEC Plessey Harris Hitachi Sharp National ES2 Ricoh Atmel LG Semicon Mitsubishi S-MOS/Seiko Dialog MHS Triquint* Samsung Hughes Sanyo AMI Oki Siemens** Kawasaki Steel Elex ABB Hafo Others Total
600�248�322�260�345�262�173�180�159�
58 64�40�68�75�74�75�60�30�50�58�36�40 —�18�31�31�27�22�20�15�20�20�17�15�20�10 11
9�97�
3,660
— — — — — — — 5
— — — — — — — 65�15 — — — — — — — — — — — — — — — — — — — — — 5
90
600�248�322�260�345�262�173�185�159�
58 64�40�68�75�74�
140�75�30�50�58�36�40 —�18�31�31�27�22�20�15�20�20�17�15�20�10 11
9�102�
3,750
655�555�410�340�315�310�235�220�166�125 100�100�
98�97�95�45�54�75�55�50�48�45 45�40�35�35�33�26�25�25�24�24�23�20�15�15 14 11�97�
4,700
— — — — — — —�5
— — — — —�— — 35�26 — — — — — — — — —�— — — — — — — — — — — — 4�
70
655�555�410�
340�315�310�235�225�166�125 100�100�
98�97�95�80�80�75�55�50�48�45 45�40�35�35�33�26�25�25�24�24�23�20�15�15 14 11�
101�4,770
9�124�
27�31�–9�18�36�22�
4�116
56�150�
44�29�28�
–43�7�
150�10�
–14�33�13
N/A�122�
13�13�22�18�25�67�20�20�35�33�
–25�50 27 22�–1�27
13.7�11.6�
8.6�7.1�6.6�6.5�4.9�4.7�3.5�2.6 2.1�2.1�2.1�2.0�2.0�1.7�1.7�1.6�1.2�1.0�1.0�0.9 0.9�0.8�0.7�0.7�0.7�0.5�0.5�0.5�0.5�0.5�0.5�0.5�0.4�0.3 0.3 0.2�2.1�
100.0�
13638N
*GaAs **Phasing out of standard cell businessSource: ICE, "Status 1996"
Figure 3-27. Standard Cell IC Leaders

In the number three position was Symbios Logic, Inc. (formerly NCR). It increased its standardcell business 27 percent in 1995. It continued to emphasize its cell-based library—one that is 0.5micron and based on a 3V optimized, triple-level metal, CMOS process providing functionalitythat is 20 percent faster and consumes 50 percent less power than the company’s previous best-performing standard cell family.
Overall, the standard cell market grew 27 percent in 1995 and is forecast to continue to grow at astrong pace through the balance of the decade.
As shown in Figure 3-28, CMOS standard cells dominated the market in 1995 and are forecast todo so again in the year 2000. As in the gate array market, there will likely be marginal increasesin the use of BiCMOS technology. Even GaAs technology may see a small increase in use through-out the industry. However, CMOS devices will dominate.
The worldwide standard cell market by geographic sector is displayed in Figure 3-29. In 1994,Japan’s share of the standard cell market was 35 percent; 34 percent in North America. In 1995,Japan’s share grew, while it slipped for North America. There is no denying that Japanese firmsperformed well in the 1995 standard cell market, but some of the 1995 growth in the Japanese mar-ket is attributable to the rise in the value of the yen. Continuing through the year 2000, the ROWregion will gain additional marketshare, at the expense of the Japanese region.
The 1995 and 2000 standard cell markets by application are provided in Figure 3-30. Much likethe gate array market, data processing and telecom will continue to be the leading consuming seg-ments for standard cell devices through the year 2000. Marginal expansion is forecast for the con-sumer/auto sector. Automobiles are incorporating ever-increasing electronic sophistication intotheir systems and standard cells will be a big part of that business. Meanwhile, the industrial andmilitary segments will decline to account for slightly more than three percent by the year 2000.
ASIC Industry Trends
INTEGRATED CIRCUIT ENGINEERING CORPORATION 3-25
CMOS 93%
BiCMOS 4%Bipolar
2%
1995
CMOS 91%
BiCMOS 6%
Bipolar <1%GaAs
2%
GaAs 1%
Total Market $12.7BTotal Market $4.8B12907PSource: ICE, "Status 1996"
2000
Figure 3-28. Standard Cell Market by Process Technology

Within the standard cell segment is the mixed-mode (or mixed-signal) cell-based market. Figure3-31 lists the top mixed-mode standard cell suppliers and their sales for 1994 and 1995.
Rising performance and increasing integration has opened up new avenues for mixed-signalASICs. Accordingly, the number of companies involved in the mixed-signal market keeps grow-ing. The mixed-signal market used to be the playground of the small or mid-size company. In1993, Alcatel Mietec was the leading mixed-signal supplier. More recently, some large firms haveseen the value of being a part of this market and have moved in. AT&T (the largest supplier in1995), Symbios, TI, and SGS-Thomson are four large corporations that saw their mixed-mode salesincrease nicely in 1995. Overall, the mixed-signal market grew 22 percent in 1995.
The mixed-mode standard cell market forecast is shown in Figure 3-32. ICE estimates that mixed-mode devices accounted for 26 percent of the $4.8 billion standard cell market in 1995. By the year2000, mixed-mode devices are forecast to increase to 30 percent of the $12.7 billion standard cellmarket. That amounts to a 26 percent cumulative annual growth rate over the five-year period.
ASIC Industry Trends
INTEGRATED CIRCUIT ENGINEERING CORPORATION3-26
Japan 38%
Europe 24%
North America
30%
ROW 8%
1995
Japan 35%
Europe 24%
North America
30%
ROW 11%
2000
Total Market = $4.8B Total Market = $12.7B10403VSource: ICE, "Status 1996"
Figure 3-29. Worldwide Standard Cell Market by Region
Telecom 30%Data
Processing 51%
1995
Military 1%
Consumer/Auto 14%
Industrial 4%
Telecom 33%Data
Processing 48%
2000
Military <1%
Consumer/Auto 16%
Industrial 3%
12906NSource: ICE, "Status 1996"Total Market = $12.7BTotal Market = $4.8B
Figure 3-30. Standard Cell Market by Application

PLD SUPPLIERS
The top players in the PLD market and their sales for 1994 and 1995 are shown in Figure 3-33. Thenumbers displayed do not include software and development system sales. This list is dominat-ed by North American companies (nine of the top ten). In fact, the nine U.S. suppliers shown inthe list accounted for 95 percent of the 1995 PLD market. There are several small-to-medium sizecompanies that vigorously compete for PLD marketshare. Firms such as Xilinx (which, with anaggressive strategy, took over the leading position in 1994), Altera, Lattice, and Actel have allfound a particular niche in the marketplace.
Lively competition in the PLD market led to at least three “marginal” players announcing theirintentions to exit the PLD market in 1994 and 1995. National started by proclaiming that itstopped taking new orders for programmable logic. Next, Intel announced that it sold its pro-grammable logic business to Altera for $50 million in cash and stock. Lastly, Actel declared thatit purchased the FPGA business of its second-source partner, Texas Instruments.
ASIC Industry Trends
INTEGRATED CIRCUIT ENGINEERING CORPORATION 3-27
Company1993 Sales ($M)
AT&T
Alcatel Mietec
Symbios
TI
GEC Plessey
AMS
Exar
SGS-Thomson
Harris
NEC
Others
Total
96�
116�
70�
70�
88�
46�
19�
18�
26�
10�
211�
770
20400Source: ICE, "Status 1996"
1994 Sales ($M)
138�
130�
90�
86�
120�
58�
48�
30�
36�
25�
249�
1,010
1995 Total Standard
Cell
655�
166�
410�
315�
80�
97�
95�
100�
80�
340�
2,432�
4,770
Mixed-Signal Percent of Total
26�
78�
30�
37�
94�
76�
76�
50�
60�
13�
13�
26
1995 Sales
($M, EST)
170�
130�
125�
115�
75�
74�
72�
50�
48�
45�
326�
1,230
1995/1994 Percent Change
23�
—�
39�
34�
–38�
28�
50�
67�
33�
80�
31�
22
1995�Percent
Marketshare
14�
11�
10�
9�
6�
6�
6�
4�
4�
4�
27�
100
1995 Rank
1
2
3
4
5
6
7
8
9
10
—
—
Figure 3-31. Mixed-Signal Standard Cell Leaders
15431LSource: ICE, "Status 1996"
Digital 74%
Mixed-Mode 26%
1995 $4.8B
2000 $12.7B
Digital 70%
Mixed-Mode 30%
Figure 3-32. Mixed-Mode Standard Cell Market Forecast

The competition never sleeps in the PLD market. During 1994 and 1995, suppliers continued tobattle for increased marketshare by adding special features or making devices faster or more com-plex. The result was a steep decline in prices. For example, in 2Q95, Cypress Semiconductorannounced price reductions of as much as 40 percent on many of its CPLDs and FPGAs. Cypresshas an advantage over many other PLD suppliers in that it owns several wafer fabs. Therefore, ithas the flexibility to adjust manufacturing schedules to meet PLD demand and with high-volumeruns is often able to charge less than other vendors.
Falling prices (20-25 percent in 1994) resulted in slow PLD market growth in 1994. The PLD mar-ket increased just seven percent to $1.275 billion in 1994 but recovered with a 40 percent increasein 1995. The forecast through the end of the decade calls for greater market expansion. As shownearlier in this section, the overall PLD market is forecast to have a cumulative annual growth rateof 20 percent from 1995 through the year 2000. Complex PLDs and FPGAs will contribute themost to the expected growth.
One the major benefits driving PLD usage continues to be the time-to-market factor. Of three prof-itability factors (including excessive production costs and development cost overrun), time-to-market is oftentimes the most critical in an electronics industry where market windows seem tobe continually shrinking.
PLD marketshare for 1995 is displayed in Figure 3-34. AMD, which held a 46 percent PLD mar-ketshare in 1988, secured only 18 percent in 1995. Its PLD market grip loosened quickly becauseof aggressive competition from some of the “younger” suppliers mentioned previously. In addi-
ASIC Industry Trends
INTEGRATED CIRCUIT ENGINEERING CORPORATION3-28
1995 ($M, EST)1994 ($M)
305�
181�
270�
120�
68�
43�
64�
83�
16
21�
104�
1,275
530�
355�
242�
165�
100�
82�
81�
5�
30
10�
60�
1,660
Xilinx
Altera*
AMD
Lattice
Actel
AT&T
Cypress
TI
Atmel
Philips
Others**
Total
305�
181�
178�
120�
68�
43�
64�
40�
16
3�
102�
1,120
—
—
73
—
—�
—
—
33�
—
13
1�
120
530�
355�
315�
165�
100�
82�
81�
38�
30
23�
61�
1,780
COMPANYMOS TOTAL BIPOLARBIPOLAR MOS TOTAL
13601P
—�
—
92
—
—�
—
—
43�
—
18
2
155
Source: ICE, "Status 1996"
1995/1994 PERCENT CHANGE
74�
96�
17�
38�
47�
91�
27�
–54�
88
10�
–41�
40
1995 PERCENT
MARKETSHARE
30�
20�
18�
9�
6�
5�
4�
2�
2
1�
3
100
1995 RANK
1
2
3
4
5
6
7
8
9
10
1Does not include software and development system sales. *Purchased Intel's PLD business in 1994. **National is phasing out both MOS and bipolar PLDs by the end of 1995.
Figure 3-33. PLD Sales Leaders1

tion, up until around 1990, AMD emphasized bipolar PLDs. In fact, 1993 was the first year AMDproduced a greater percentage of CMOS PLDs than bipolar PLDs (AMD is still the leading bipo-lar PLD supplier). AMD now vigorously pursues CMOS technology.
Figure 3-35 shows the 1994 and 1995FPGA sales leaders. Xilinx stillholds a commanding 70 percentshare of the FPGA market.However, companies like Actel,AT&T, IBM, and Motorola all havebig plans to take larger percentagesof the future FPGA market.
ASIC Industry Trends
INTEGRATED CIRCUIT ENGINEERING CORPORATION 3-29
AMD 18%
AT&T 4%
Altera 20%
Lattice 9%
Xilinx 30%
Cypress 5%
Other 8%
$1,720M
Altera 21%
Lattice 10%
Xilinx 32%
Cypress 5%
AMD 15%
Other 6%
$1,660M
BIPOLARCMOS
TOTAL PLD MARKET
13602PSource: ICE, "Status 1996"
Actel 6%
Actel 6%
AT&T 5%
AMD 61%
TI 28%
Philips 11%
National <1%
$120M
Figure 3-34. 1995 PLD Marketshare
Company
Xilinx
Actel*
AT&T
Cypress
Others
Total
20401Source: ICE, "Status 1996"
1994 Sales ($M)
300�
68�
43�
2�
47�
460
1995 Sales
($M, EST)
525�
100�
75�
13�
37�
750
1995/1994 Percent Change
75�
47�
74�
550�
–22�
63
1995�Percent
Marketshare
70�
13�
10�
2�
5�
100
1995 Rank
1
2
3
4
—
—
*Purchased TI's antifuse FPGA business in 1995.
Figure 3-35. Leading FPGA Suppliers
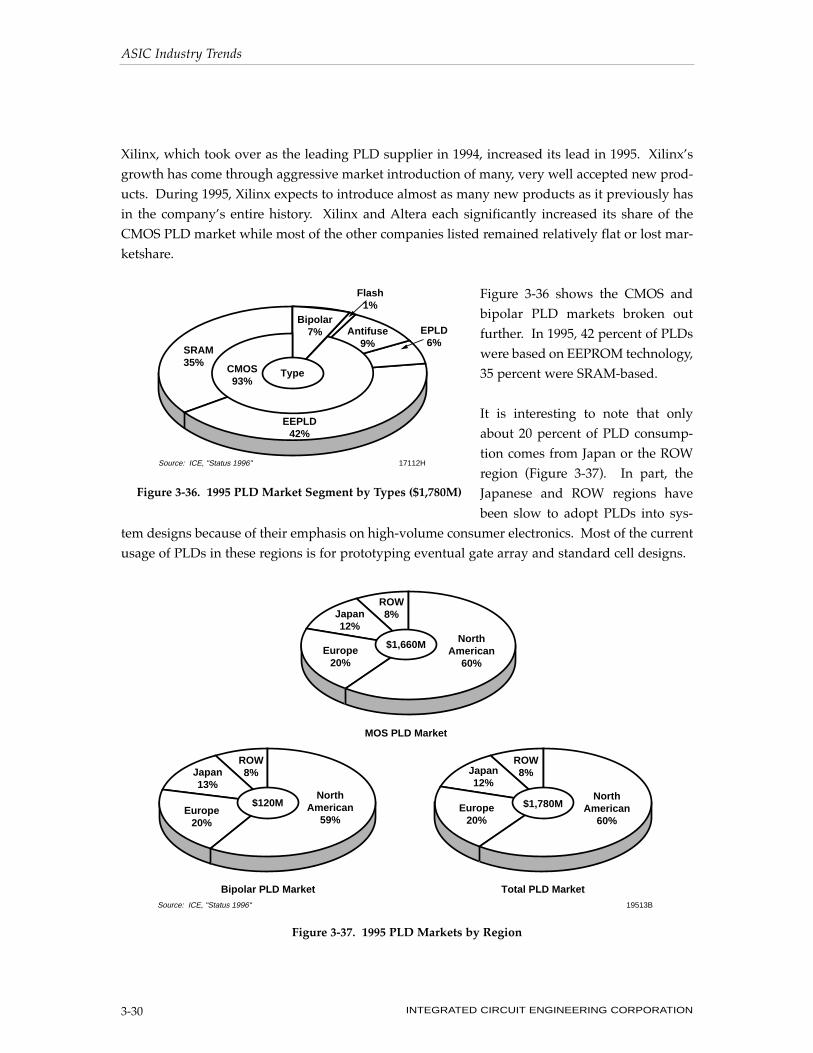
Xilinx, which took over as the leading PLD supplier in 1994, increased its lead in 1995. Xilinx’sgrowth has come through aggressive market introduction of many, very well accepted new prod-ucts. During 1995, Xilinx expects to introduce almost as many new products as it previously hasin the company’s entire history. Xilinx and Altera each significantly increased its share of theCMOS PLD market while most of the other companies listed remained relatively flat or lost mar-ketshare.
Figure 3-36 shows the CMOS andbipolar PLD markets broken outfurther. In 1995, 42 percent of PLDswere based on EEPROM technology,35 percent were SRAM-based.
It is interesting to note that onlyabout 20 percent of PLD consump-tion comes from Japan or the ROWregion (Figure 3-37). In part, theJapanese and ROW regions havebeen slow to adopt PLDs into sys-
tem designs because of their emphasis on high-volume consumer electronics. Most of the currentusage of PLDs in these regions is for prototyping eventual gate array and standard cell designs.
ASIC Industry Trends
INTEGRATED CIRCUIT ENGINEERING CORPORATION3-30
Antifuse 9%
EPLD 6%
EEPLD 42%
SRAM 35%
Bipolar 7%
17112HSource: ICE, "Status 1996"
Flash 1%
CMOS 93%
Type
Figure 3-36. 1995 PLD Market Segment by Types ($1,780M)
North American
60%
North American
59%
North American
60%
ROW 8%
ROW 8%
ROW 8%
Japan 12%
Japan 13%
Japan 12%
Europe 20%
Europe 20%
Europe 20%
$1,660M
$120M $1,780M
MOS PLD Market
Bipolar PLD Market Total PLD Market19513BSource: ICE, "Status 1996"
Figure 3-37. 1995 PLD Markets by Region

Throughout 1995 many PLD suppliers reported that the market for PLDs in Japan was picking upsteam. It seems that the tight supply of less-than-10K-gate gate arrays is partially responsible forthis increased PLD usage.
REGIONAL ASIC MARKETSHARE
The 1995 company marketshare for various ASIC segments is shown in Figure 3-38. The areasinclude North America, Japan, Europe, and the Rest of the World (ROW). A company’s sales areclassified into one of the categories based on the location of its headquarters. So, even though acompany such as Texas Instruments has fabs located around the world, its headquarters are inNorth America and therefore all sales are credited to that region.
When it comes to ASIC devices, North American manufacturers have control in three of the fourmajor ASIC segments. With the exception of gate arrays, North American manufacturers domi-nated production in each major ASIC category in 1995.
Though North American firms can boast of significant ASIC production, the sum dollar total of allthree markets in which it dominates is only slightly more than the gate array market—the marketin which the Japanese have the highest share. Hyundai’s purchase of NCR (now Symbios) in 1994accounted for the large increase (to 11 percent in 1995 from less than one percent in 1995) in ROWshare of the standard cell market.
ASIC Industry Trends
INTEGRATED CIRCUIT ENGINEERING CORPORATION 3-31
0
10
20
30
40
50
60
70
80
90
100
���������������������������������
������������������������������������������������������������������
����������������������
���������������������������������������������������������������������������������������������������
����������������������������������������
Gate Arrays
($6,125M)
Standard Cells
($4,770M)
PLDs ($1,780M)
Analog Arrays ($235M)
Total ASIC* ($12,910M)
Per
cen
tag
e
34%
58%
49%
26%
14%
98%
57%
23%
49%
38%
8%
3%1% 5%
North American Companies
Japanese Companies
��������������������European
CompaniesRest of World Companies
*Not including full custom12910VSource: ICE, "Status 1996"
20%
11%
1%
5%
Figure 3-38. 1995 ASIC Segment Marketshare

Japanese companies have been most successful in the gate array market. Figure 3-39 shows thatalmost three-fourths of Japanese companies’ ASIC sales are gate arrays. North American sales in1995 were roughly split between the standard cell, gate array, and PLD business segments.European and ROW companies both emphasized standard cell products.
The total worldwide ASIC market (not including full custom) forecast by region is shown inFigure 3-40. By the year 2000, the North American market is expected to be the largest consumerof ASICs. It should be noted that, although the Japanese ASIC market is very large, much of theASIC IC value “consumed” in Japan is from internal transfers at the large electronics conglomer-ates (e.g., Fujitsu, Hitachi, NEC, etc.).
ASIC Industry Trends
INTEGRATED CIRCUIT ENGINEERING CORPORATION3-32
Gate Arrays 73%
Standard Cells 26%
PLDs <1% Analog Arrays 1%
$4.9B
Japanese Companies
European Companies
Gate Arrays 33%
Standard Cells 38%
PLDs 27%
Analog Arrays 2%
$6.3B
Standard Cells 64%
Gate Arrays 29%
Analog Arrays 5%
PLDs 2%
$1.0B
North American Companies
17794FSource: ICE, "Status 1996"
*Not including full custom
$0.7BStandard
Cells 74%
Gate Arrays
26%
ROW Companies
Figure 3-39. 1995 ASIC* Sales by Product Type
Japan 37%
North America 36%
Europe 19%
ROW 8%
Japan 33%
North America 36%
Europe 20%
ROW 11%
1995�$12.9B
2000�$28.6B
20402Source: ICE, "Status 1996"
Figure 3-40. Worldwide ASIC Markets by Region (Not Including Full Custom)

ASIC TECHNOLOGY TRENDS
Standard Cells (i.e., Cell-Based)
The two main technology thrusts in the standard cell ASIC segment in 1995 were the announce-ments and early implementation of 0.35µm, or finer, three- to five-layer metal CMOS technologyand the addition of sophisticated specialty cells and cores to the cell-based libraries. As wasshown earlier, the standard cell portion of the ASIC market is one of the fastest growing segments.The fast-paced technology improvements in the cell-based segment mentioned above are respon-sible for this growth surge.
While 0.35µm cell-based ASICs will represent only a small portion of the total ASIC marketthrough 1996, VLSI technology and Hitachi envision fast rising demand for the technology, frommany different system segments. As shown in Figure 3-41, the average gate density of the fivesegments listed is forecast to go from about 35K gates in 1993 to 1.4M gates in 1997. Moreover,average performance of these five segments is forecast to surge from 35MHz in 1993 to 150MHzin 1997! There is little doubt that million plus gate devices operating at 150MHz or higher willdemand 0.35µm technology.
ASIC Industry Trends
INTEGRATED CIRCUIT ENGINEERING CORPORATION 3-33
0.01 0.1 1.0 100
50
100
150
200
250
Network Computing Systems
Mobile PC
Consumer
Wireless
CY '97CY '95
CY '93
Per
form
ance
(M
Hz)
Integration (millions of gates)
20056Source: Hitachi/VLSI Technology/ICE, "Status 1996"
Figure 3-41. New Digital Markets for Advanced Cell-Based ASICs

Shown below are some selected standard cell offerings that are serving the diverse ASIC needs ofthe system manufacturer. Many of the process-related announcements (e.g., LSI Logic’s G10 tech-nology) are not standard cell specific but will be used for gate arrays as well.
• In 2Q94 Motorola announced its 0.65µm FlexCore program for customizing MPU-basedASICs using its cell-based technology. Typical NREs are $125K. The first processor coresavailable were the 68EC000 and 68020. A 68030 core (12 MIPS) surfaced in late 1994 and a 36MIPS 68040 was due in 1995. Power PC601 and 68060 cores are expected in 1996 (Figure 3-42). The FlexCore devices are targeting applications that typically use more than 100K unitsper year. Motorola states that turnaround time from concept to silicon for FlexCore deviceswill be about 6-9 engineering months.
• LSI Logic licensed the Rambus ASIC cell for use in its CoreWare cell-based library.
• Mitsubishi plans to incorporate its M36066A 64-bit Alpha MPU (licensed from DEC) as a corecell for internal use in 1996 and external cell-based sales in 1997.
• In 4Q94 LSI Logic introduced three MIPS R4000-architecture core MPUs into its cell-basedlibrary (CoreWare). Figure 3-43 describes these three cores.
ASIC Industry Trends
INTEGRATED CIRCUIT ENGINEERING CORPORATION3-34
EC000 1992
'020 1Q94
'030 4Q94
'040 1995
'060 1996
Source: Motorola/ICE, "Status 1996" 19185
Per
form
ance
(M
IPS
)
0
10
100
Figure 3-42. FlexCore Core Processor Performance/Availability

• In 2Q95 VLSI Technology announced it had included a DSP core cell (Pine—from DSPGroup) into its standard cell library. DSP Group’s second-generation DSP cell “Oak” is alsoexpected to be licensed by VLSI at a later date.
• NEC introduced its cell-based 0.35µm CMOS ASIC technology (CB-C9) in 4Q95. Volumeproduction of the CB-C9 devices is expected in 2Q96. Some key aspects of the process areshown below.
Technology: 0.35µm drawn (0.27µm Leff) CMOSMetal Layers: 2 or 3Raw Gates: 80K to 3.5MUsable Gates: 50K to 1.6MPad Count: 104 to 1,200Performance: 113ps at F/O=2, L=0.44mm, Vdd= 3.3V
151ps at F/O=2, L=0.44mm, Vdd= 2.5VSpecial Macros: ARM7TDMI, RISC CPU, V30MX (Intel 80286 compatible),
Multiplier, PLL, A/D +D/A, Rambus interface cell
• In 3Q95 SGS-Thomson introduced the first member (ST20C4) of its 0.5µm 32-bit RISC coreprocessor (40MIPS at 50MHz) family.
• In 4Q95 Hitachi began offering its SH-1 32-bit RISC CPUs as part of its 0.5µm cell-based ASIClibrary. Hitachi also licensed an MPEG-3 decompression core from CompCore MultimediaInc. for use in its cell-based library.
• In 4Q95 IBM unveiled an extensive plan to target the cell-based ASIC marketplace using awide range of what it calls “system building blocks” (Figure 3-44). Figure 3-45 shows theadvanced technologies IBM will use to target the leading-edge ASIC market.
• LSI Logic introduced its G10™ ASIC process in 3Q95. Figure 3-46 shows some of the newG10 characteristics as well as a history of previous LSI Logic ASIC technologies. Figure 3-47shows the various sub-families of the G10 technology and their targeted applications.Volume production of ASICs using the new process is due in 1Q96.
ASIC Industry Trends
INTEGRATED CIRCUIT ENGINEERING CORPORATION 3-35
Uses 0.5µ technology, 5K gates, 4mm2 in size, operates up to 60MHz, targeting cost sensitive applications (e.g., portable telecom, consumer multimedia, etc.). Uses 0.5µ technology, 9K gates, superscalar RISC MIPS-II processor, operates up to 80MHz, targeting data processing applications. Will use 0.35µ technology, was due out in 2H95, 64-bit internal data path.
CW4001 CW4010 CW4100
20057ASource: ICE, "Status 1996"
Figure 3-43. LSI Logic’s “Mini RISC” MIPS R4000 Cores

ASIC Industry Trends
INTEGRATED CIRCUIT ENGINEERING CORPORATION3-36
Processors
PPC Periph.
DSP Periph.
I/O Ports
Functions
Memory**
Analog
CISC CMC 186
PPC 602
PPC 603
PPC* 401
Mwave* DSP
403 586
SRAM Ctrl
DRAM Ctrl
OPB Ctrl
DMA Ctrl
Serial Port
INTRPT Ctrl
Tele Codec
Audio Codec
PC Bus
PCI UART PCMCIA SSA SCSI Fiber Channel
ENET
DATA/IMAGE Compression
ATM MPEG ECC IIC NTSC/PAL
ROM RAM
PLL DAC ADC Volt Reg
Source: IBM/ICE, "Status 1996" 20403
= Available in 1995
*Available in 1996 **Researching Flash Memory
Figure 3-44. IBM’s System Building Block Roadmap
CMOS 5 16M CMOS 5L 3.3V 0.46µm Leff 1,470K Gates CMOS 5S 3.3V 0.36µm Leff 1,600K Gates
CMOS 5X 2.5V 0.25µm Leff 1,600K Gates
CMOS 6 64M CMOS 6S 2.5V
CMOS 6X 1.8V
CMOS 4 4M CMOS 4L 5.0V 0.87µm Leff 260K Gates CMOS 4LP 3.3V 0.45µm Leff 260K Gates
DRAM ASIC Enhanced ASIC
0.5µm 0.35µm0.8µmLithographic Generations
Source: IBM/ICE, "Status 1996" 20404
Figure 3-45. IBM’s Silicon Evolution

ASIC Industry Trends
INTEGRATED CIRCUIT ENGINEERING CORPORATION 3-37
0.35µm
0.25µm
Cell Based Embedded Array Gate Array
2, 3, 4, & 5 Layer
3.3 & 2.5 Volts
GTL/NTL/HSTL PECL to 622 MHz PCI Impedance Controlled LVTTL LVDS to 1.2GHz Mixed Signal
5,000,000
100K to 2,500K
0.4-0.7µW/Gate/MHz
Drawn
Effective
Architectures
Metal Interconnect
Operating Voltages
I/O Options
Gate Capacities
Usable (max)
Typical (used)
Power Dissipation
0.5µm
0.38µm
Cell Based Embedded Array Gate Array
2, 3, & 4 Layer
3.3 Volts
GTL/NTL/HSTL PECL to 622MHz PCI Mixed Signal
1,500,000
60 to 500K
1.0µW/Gate/MHz
0.6µm
0.45µm
Cell Based
2 & 3 Layer
3.3 Volts
GTL/NTL PECL to 155MHz PCI Mixed Signal
1,200,000
40 to 400K
1.5µW/Gate/MHz
0.7µm
0.55µm
Gate Array
2 Layer
3.3 Volts
GTL/NTL Universal PCI Mixed Signal
165,000
20 to 75K
1.4µW/Gate/MHz
0.8µm
0.65µm
Cell Based Embedded Array Gate Array
2 Layer
5.0 Volts
GTL/NTL PCI Mixed Signal
250,000
20 to 100,000K
5.0µW/Gate/MHz
0.6µm
0.45µm
Cell Based Embedded Array Gate Array
2 & 3 Layer
5.0 Volts
GTL/NTL PECL to 155MHz PCI Mixed Signal
600,000
40 to 300K
3.2µW/Gate/MHz
Source: LSI Logic/ICE, "Status 1996" 20405
LSI CMOS Process G10™ Family 500K 600K 400K 405K 300K
Figure 3-46. LSI Logic ASIC Technology Trends
Product Focus
Target Applications
Secondary Markets
Core Voltage
I/O Voltages
Target Design Size (gates)
Maximum Capacity Random Logic (gates) Memory (half die, Mbits)
Performance (gate speed)
Workstations and desktop,
telecomm
Digital video encoding
3.3V
5V compatible, 3.3V, 2.5V
100,000 to 500,000
3.5 million
8
Maximum integration
Servers, supercomputers,
workststions
Mobile computing
2.5V
3.3V, 2.5V
500,000 to 2 million
5 million
10
Mainstream, low power
Desktop, digital video,
mobile telecomm
High-end consumer
3.3V
5V compatible, 3.3V, 2.5V
100,000 to 1 million
5 million
10
G10-p G10-i G10-m
Source: LSI Logic/EDN/ICE, "Status 1996" 20406
Figure 3-47. LSI Logic’s G10 Product Sub-Families

• Toshiba described its new 0.3µm drawn CMOS ASIC process in 4Q95. Some characteristicsof this technology are shown below.
Production Volumes: 3Q96Technology: 0.3µm drawn CMOSMetal Layers: 2 or 3Raw Gates: Up to 3MUsable Gates: 1.9M on 17.5mm x 17.5mm die
• In 3Q95 Toshiba introduced its TC203 0.4µm CMOS family of ASICs for mixed 3/5V opera-tion. The family contains up to 690K usable gates.
Gate Arrays
With the ASIC industry being such a large portion of the total IC market, it is well worth the timeand money spent for the IC manufacturer to quickly move leading-edge process technologies intothe ASIC arena or develop processes specifically for ASICs. In the mid-1980’s, ASIC devices weretypically using processing technology that was 2-3 years behind the high-volume memory parttypes. Currently, ASIC process technology is oftentimes equal to state-of-the-art memory devices.
One example of the narrowing technology gap between memory and ASICs is the ASIC produc-er’s use of a 0.5/0.35-micron CMOS process for its gate arrays, and cell-based ICs. This is the samefeature size used for 16M and 64M DRAMs, which are now in the growth stages of their lifecycles.Figure 3-48 shows Toshiba’s DRAM and ASIC technology convergence.
ASIC Industry Trends
INTEGRATED CIRCUIT ENGINEERING CORPORATION3-38
0.1
0.2
0.5
1.0
2.0
1984 1986 1988 1990 1992 1994 1996 1998 2000
Fiscal Year19170ASource: Toshiba/JEE/ICE, "Status 1996"
Des
ign
Ru
le (
µm)
DRAM Toshiba's gate array
1M-Bit DRAM
4M-Bit DRAM
16M-Bit DRAM
64M-Bit DRAM
TC110G
TC140G
TC160G
TC180G
TC200GTC220G
Figure 3-48. Transition of the DRAM and Toshiba’s Gate Array Development

As was shown in the previous sub-section concerning standard cell technology trends, there arenumerous system types that will be demanding gate counts from 100K to over a million. The gatearray vendors are hoping to gain a significant portion of this market. By the end of 1995 there werefifteen gate array vendors that offered arrays with greater than 500K usable gates!
In order to increase the efficiency of gate usage (and also increase performance by about 20 per-cent), almost all of the leading manufacturers of high-density (greater than 50,000 gates) gatearrays have begun implementing at least three-layer metal processes for non-pad-limited designs.Gate array manufacturers using three layers of metal interconnection are now able to offer up to70 percent gate utilization as opposed to about 35-45 percent for double-layer metal arrays. Intoday’s VLSI era, interconnect technology has become more of a limiting factor than feature sizefor ASIC performance.
As IC producers continue to advance the density and performance of their ASIC offerings, thedesign environment has struggled to keep pace. It is estimated that as ASIC technology movedfrom 1.0µm to 0.3µm, interconnect delays, as a percent of total delay, went from 20 percent to over80 percent (Figure 3-49). Since actual interconnect delay is dependent upon the layout of the ICitself, physical layout information is needed very early in the design cycle in order to accuratelyestimate timing conditions.
Overall, the major thrusts in the leading-edge non-bipolar gate array market continue to be theuse of new embedded functions, three-, four-, or five-layer metal, 0.35µm and finer feature sizes,usable gate densities surpassing 1,000,000, and low-voltage and mixed-voltage operation.
ASIC Industry Trends
INTEGRATED CIRCUIT ENGINEERING CORPORATION 3-39
Del
ay, n
s
1.5µm
20
1.2µm
30
1.0µm
60
0.8µm
150
0.5µm
500
0.3µm
1,000
Feature Size:
Circuit Size: (thousands of gates)
0.1
1
Average Wiring Delay
Typical Gate Delay
Source: OKI Semiconductor/ICE, "Status 1996" 20407
Figure 3-49. Wiring Delay (Interconnect) Versus Gate Delay

A good example of a leading-edge gate array is NEC’s 0.35-micron 2.0 million-gate gate array*introduced at CICC 1995 (Figure 3-50). Imagine the advanced design tools needed for this array(which has more transistors than Intel’s P6 MPU). The device supports high-speed I/O interfacestandards at voltages from 5V to 1.4V using a unique I/O power ring structure. The IC die con-tains up to 1,188 I/O and 1,204 bonding pads (staggered in two rows)! NEC began shipping pro-totypes using this technology in June of 1995 (it stated at that time it had 15 designs completed).
A couple of significant 4Q95 gate array technology announcements are shown below.
• NEC announced its QB-8 ASIC technology incorporating a new proprietary gate architecturecalled “PUZZLE.” The QB-8 technology is a 3.3V 0.5µm drawn (0.35µm Leff) simplified(“epi-less”) three-layer metal BiCMOS process that offers up to 379K raw gates (223Kusable).
The gate architecture is comprised of three differently sized transistors that can be tightlyinterlocked (like puzzle pieces). Production of QB-8 devices is expected in early 1996.
• Vitesse introduced a new GLX™ family of 0.5µm GaAs-based gate arrays. The GLX familyoffers up to 250K raw gates with utilization of up to 70 percent. Prototypes are to be avail-able beginning in 1Q96 with volume pricing at 0.10¢ per gate.
ASIC Industry Trends
INTEGRATED CIRCUIT ENGINEERING CORPORATION3-40
Density : 2.0 million gates Process : 0.35µ, triple-level metal, CMOS I/O : 1188 I/O cells, 1204 pads in two staggered rows (60µ pitch) Voltage Level : 1.4V to 5V Performance : 156MHz at 3.3V, 112ps (F/O = 1, 0.47mm wire) Power Dissipation : 0.8µW/MHz/gate at 3.3V Packaging : Up to 696-pin BGA
Source: CICC 1995/ICE, "Status 1996" 20203
Figure 3-50. NEC’s Two-Million-Gate Gate Array
* It is estimated that only about 20 percent of the 1995 MOS gate array market was for arrays having more than 50K gates.

PLDs/FPGAs
Overview
The first field programmable logic devices were introduced almost 25 years ago. Basically, thebenefits of using programmable logic have been shortening time to market and risk reduction.This has been true for over 20 years and will continue to be true in the foreseeable future.
Over the twenty years of programmable logic offerings, the term PLD has evolved to encompassmore than just low-density bipolar products. The PLD industry has gone from using strictly bipo-lar technology and simple architecture to using CMOS EPROM, EEPROM, SRAM, Flash, and anti-fuse processing with very elaborate circuit designs.
In an industry as dynamic as the IC industry, the natural trend has been toward high-density andhigh-performance technologies. In the PLD market this is very obvious as simple bipolar PLDsare now steadily losing marketshare to the more flexible and higher density CMOS PLD tech-nologies.
As was mentioned earlier, ASSPs (Application Specific Standard Products) are taking away someof the market previously served by traditional ASIC devices. Along these same lines, there is anincreasing number of PLDs that are being tailored for specific applications. The ASSP-type PLDsinclude:
- address decoding,- state machine, and- system functions.
Overall, PLDs are moving away from being used only as peripheral logic and more toward corelogic at the heart of the system. As PLD technology and capabilities increase, ICE expects the PLDlogic segment to be a cornerstone of the ASIC industry.
As was discussed earlier, the CMOS CPLD and FPGA markets have been and will continue to bethe star performers in the ASIC marketplace. This stellar growth has caused a significant increasein competition, which in turn has spurred a steady stream of new product innovations and intro-ductions.
PLD Pricing Considerations
The 1995 price-per-gate for the PLD device was six times the price of a similar density CMOS gatearray. In 1993, the PLD was 15 times the cost of a similar density CMOS gate array.
ASIC Industry Trends
INTEGRATED CIRCUIT ENGINEERING CORPORATION 3-41

Using a total cost formula, the breakeven point for the gate array and PLD can be derived. At the10,000 usable gate level, the PLD solution was more cost effective at unit volumes below 1,386 in1995 (Figure 3-51). This figure was 660 in 1993 for comparable 5,000 gate devices.
As shown, it does not take a large number of units for the gate array approach to amortize its largefixed cost to the point where it becomes more cost effective than the PLD. The $39 PLD unit priceversus the $6.50 gate array device price assures a fairly low-volume crossover point given almostany reasonable gate array NRE charge.
Because the NRE charge is such a small part of the total cost make-up of an FPGA, the total unitprice of the 1995 10,000 usable gate device decreases only 42 percent when going from using 100units to using 1,500 units. However, because such a large portion of the gate array total cost isNRE, the amortization of the NRE causes the 1995 10,000 usable gate array total unit price todecrease about 92 percent when going from using 100 units to 1,500 units.
Figure 3-52 shows that whether at 100 or 1500 units, a very high percentage of the gate array’s costis due to fixed (i.e., NRE) costs. When the IC industry was slumping (1989-1991) and heavily dis-counted NRE charges were the norm, the choice to use a gate array was very clear from the begin-ning. However, now that NRE charges have firmed, the PLD choice looks more attractive, espe-cially at low unit volumes.
As shown, 95 percent of the cost of using PLDs at 1500 units is from variable costs (i.e., the unitprice). This is the reason it is so critical for the PLD producer to reduce device costs by usingadvance processes (0.6µm or less) and interconnect (3 layers of metal or more) schemes, both ofwhich result in reduced die sizes and lower unit costs.
ASIC Industry Trends
INTEGRATED CIRCUIT ENGINEERING CORPORATION3-42
100 2000
0
10
20
30
40
50
60
70
300 400 500 600 700 800 900 1,000 1,100 1,200 1,300 1,400 1,500
38,115
7,100
8,800
59,20061,700
41,400
5K-Gate 1993 Gate Array
5K-Gate 1993 PLD
1995 Breakeven Units 1,3861993
Breakeven Units 660
Project Units
To
tal C
ost
(T
ho
usa
nd
s o
f D
olla
rs)
16723DSource: ICE, "Status 1996"
58,00048,900
10K-Gate 1995
Gate Array
10K-Gate 1995 PLD
Figure 3-51. 1993 5,000 and 1995 10,000 Usable Gate Total Cost

If the FPGA and gate array price trends continue as mentioned in the previous paragraph, the rel-ative FPGA/gate array price ratio by the end of the decade would be less than 2:1 (Figure 3-53).Given the time-to-market benefits of FPGAs, and less than a 2x price difference, it would be safeto assume that FPGAs would serve the vast majority of low gate count (²40,000 gates) needs atthat time.
PLDs will continue to increase in density to compete with “low-end” gate arrays. Figure 3-54shows ICE’s estimate for the 1995 PLD market by gate count. The current definition of low-endfor the gate array market is devices with less than 20,000 gates and speeds of less than 40MHz.
ICE estimates that about 20 percent of the total CMOS gate array market in 1995 was “low-end.”Thus, advanced PLD producers are attempting to use their 3-layer metal 0.6µm PLDs to target the$1.1 billion low-end business of the CMOS gate array supplier.
ASIC Industry Trends
INTEGRATED CIRCUIT ENGINEERING CORPORATION 3-43
0
10
20
30
40
50
60
70
80
90
100
99%
45%
83%
5%
1%
55%
17%
95%
Gate Array PLD Gate Array PLD
Per
cen
t
100 Units 1,500 Units
= Fixed Cost
= Variable Cost20101Source: ICE, "Status 1996"
Figure 3-52. 1995 10K-Gate PLD Versus Gate Array Cost Make-Up

ASIC Industry Trends
INTEGRATED CIRCUIT ENGINEERING CORPORATION3-44
0.8
0.6
0.4
0.2
0.1
108
6
4
2
1
0.08
0.06
0.04
0.02
1990 1991 1992 1993 1994 1995 1996 1997 1998 1999 2000
CMOS Gate Array Price Per Gate
Trend
FPGA Price Per Gate
Trend
18551CSource: ICE, "Status 1996"Year
Cen
ts P
er U
sab
le G
ate
33X
15X 12X
7X
2X
•
6X
1995 Actual
Figure 3-53. Relative Price Per Gate for FPGAs Versus Low Gate Count Gate Arrays
<1,500 10%
1,500 to 3,000 33%
>3,000 to 5,000 40%
>5,000 to 10,000 10%
>10,000 7%
20408Source: ICE, "Status 1996"
$1.7B
Figure 3-54. 1995 MOS PLD Revenue by Gate Count

It is interesting to note that in most cases the CMOS gate array suppler is not fighting the PLDs’attack on the low-end market. Most CMOS gate array suppliers are concentrating on the high-density, high-performance, and high unit volume segment of the gate array market. With busi-ness booming since 1992, gate array vendors have become very “selective” of the contracts theytake for gate array devices. Oftentimes turning down business in the process!
What this now means as far as the trend lines shown in Figure 3-53 is that the low-end CMOS gatearray price per gate may stay flat in the future. With little competitive pressure, the low-endCMOS gate array price per gate could even increase in the late 1990’s.
While an annual 30 percent or greater decline in the PLD price per gate may be difficult to sustaininto the late 1990’s, there is little doubt that PLDs will become more competitive in price comparedto low-end gate arrays. This is one reason that ICE is bullish about the future of the PLD/FPGAbusiness.
There is no doubt that, when comparing specific unit costs of gate arrays (even including NREs)and PLDs, gate array devices look favorable at all but the lowest volume levels. Why then hasthere been a surge in the PLD market over the past few years? The answer is the increasing impor-tance of the “time to market” factor. For example, in today’s high-end disk-drive market, lifecy-cles of six months to a year are fairly common.
PLD Technology Trends
Over the last few years the PLD market has been the most dynamic of all IC markets with regardto new product introductions. Shown below is a sampling of some of the major PLD technologyannouncements made in 1995.
• Xilinx began taking production orders for its 0.6µm three-layer metal antifuse-based PLDs(XC8100) in June of 1995. The antifuse devices contain from 1,000 to 9,000 usable gates withall routing resources located above the underlying sea-of-gates logic.
• Xilinx introduced its flash-based (5V-only) PLDs in late 1995. The 0.6µm devices allow10,000 program/erase cycles and in-system programming. The devices are offered in usablegate densities of 800 to 12K.
• In 4Q95 Xilinx introduced its XC4000E series of SRAM-based FPGAs that offer 2.5K to 25Kusable gates as well as on-chip dual-port SRAM capability. The devices are produced using0.5µm three-layer metal CMOS technology. One-hundred piece quantities of the XC4020E(20,000 usable gates) cost $300 in 4Q95 and were expected to sell for $125 in volume in 2H96.
ASIC Industry Trends
INTEGRATED CIRCUIT ENGINEERING CORPORATION 3-45

• Xilinx is working on an optimized in-system reconfigurable SRAM-based PLD family(XC6200) that reconfigures in microseconds. The release date for these devices has not beengiven.
• Beginning in 2Q95, Xilinx began phasing-in its 0.5µm technology (from 0.6µm) for its XC5000SRAM-based FPGA family. The 0.6µm XC5000 family is shown in Figure 3-55.
Xilinx’s long-term PLD density roadmap is shown Figure 3-56.
• In 1Q95 Xilinx purchased NeoCAD Inc., a developer of high performance design softwarefor FPGAs.
• In 1Q95 AMD announced that it signed a five-year deal with software developer Minc, Inc.(Boulder, CO.). The deal calls for Minc to develop and sell all of AMD’s PLD design softwarefor its MACH CPLDs and PALs.
ASIC Industry Trends
INTEGRATED CIRCUIT ENGINEERING CORPORATION3-46
Figure 3-55. Xilinx’s XC5000 Family
Feature Size (µm) Die Size (mm) Number of Gates Metal Layers Wafer Size (mm)
1985/6 1994 1995 1996/7Plan 2001
"Perhaps" 2001
2.0
7.5 x 7.5
800
2
100
0.6
17 x 17
25,000
3
150
0.5
17 x 17
50,000
3
150
0.35
17 x 17
100,000
3-4
200
0.20
25 x 25
500,000
4-5
200
0.15
38 x 38
1.25M
5-6
300
20346ASource: Xilinx/ICE, "Status 1996"
Figure 3-56. Xilinx’s PLD Technology Roadmap
20177ASource: ICE, "Status 1996"
XC5202 XC5204 XC5206 XC5210 XC5215
Usable Gates
Max I/O
Flip-Flops
Pricing* (10K Quantity)
2,200 - 2,700
84�
256�
$9
3,900 - 4,800�
124�
480�
$15
6,000 - 7,500�
148�
784�
$25
10,000 - 12,000
196�
1296�
$38
14,000 - 18,000�
244�
1936�
$68
* 2Q95 prices for the XC5202, XC5204, XC5206 and XC5210 devices are in PC84 packages; the XC5215 device is in PQ208.

• In 1Q95 Altera described its FLEX 10K family of devices that are architecturally optimizedfor implementing memory on the PLD. The FLEX 10K is also designed to support on-chipROM, multipliers, ALUs, and DSP functions. Figure 3-57 shows how the FLEX 10K is at theleading-edge of Altera’s broad line of PLD products.
• In 4Q95 Altera announced sampling of its EPF10K50 (50K gates) SRAM-based PLD. Thedevice offers up to 20K bits of RAM or ROM. One-hundred unit pricing was $850 in 4Q95with 1997 pricing projected to be $150 in 5,000-unit quantities.
• In 3Q95 Altera introduced its MegaFunctions Partners Program (AMPP). The program is analliance between Altera and intellectual property providers that will develop synthesizablefunctional blocks (e.g., display controllers, 8-bit 6502 processors, etc.) for insertion intoAltera’s FLEX 10K family of SRAM-based PLDs. As of 3Q95 Altera was working with over20 suppliers in the AMPP project.
• In 3Q95 aftermarket IC supplier Rochester Electronics agreed to carry Altera’s discontinuedhigh-density PLD devices.
ASIC Industry Trends
INTEGRATED CIRCUIT ENGINEERING CORPORATION 3-47
Usable Gates
Performance (MHz)
Pin count
Technology
150 - 900�
50 - 125�
24 - 68
EPROM
600 - 3,750�
50 - 100�
24 - 100
EPROM
600 - 5,000
70 - 150�
44 - 208
EEPROM
6,000 - 12,000�
50 - 100�
84 - 304
EEPROM
2,500 - 50,000�
75�
84 - 304
SRAM
10,000 - 100,000�
75�
84 - 560
SRAM
Source: Altera/ICE, "Status 1996" 20182
I/O
Usable Gates
Classic and
MAX 5000
FLASH- logic
MAX 7000
MAX 9000
FLEX 8000
FLEX 10K
Classic MAX 5000 FLASHlogic MAX 7000 MAX 9000 FLEX 8000 FLEX 10K
800 - 3,200
50 - 100�
44 - 208
FLASH
Figure 3-57. Altera’s PLD Product Line

• In 1Q95 Altera began shipping its gate array-to-PLD design conversion tools. The tools sup-port LSI Logic and Fujitsu gate arrays. Additional gate array vendors are to be announced.
• Actel introduced its 3200DX family in 3Q95. The 6,500-gate 3265DX was available in 3Q95with the 20,000-gate A32200DX available in January of 1996. Initially offered in 0.6µm tech-nology , the family will move to 0.5µm processing in early 1996. Members of the 3200DXfamily of PLDs will be able to incorporate blocks of high-speed (5ns) dual-port SRAM(Figure 3-58).
• AMD introduced its 0.5µm MACH 5 PLDs in 3Q95. The devices offer 7.5ns performance,PCI compliance, and JTAG capability. The family is expected to move to 0.35µm processingin 1996.
ASIC Industry Trends
INTEGRATED CIRCUIT ENGINEERING CORPORATION3-48
SRAM 32 x 8
or 64 x 4
SRAM 32 x 8
or 64 x 4
SRAM 32 x 8
or 64 x 4
SRAM 32 x 8
or 64 x 4
SRAM 32 x 8
or 64 x 4
SRAM 32 x 8
or 64 x 4
SRAM 32 x 8
or 64 x 4
SRAM 32 x 8
or 64 x 4
SRAM 32 x 8
or 64 x 4
SRAM 32 x 8
or 64 x 4
SRAM 32 x 8
or 64 x 4
SRAM 32 x 8
or 64 x 4
JTAG
JTAG
JTAGJTAG
Fast Decode Module
Source: Actel/ICE, "Status 1996" 20409
Logic Modules
Logic Modules
Logic Modules
Figure 3-58. Actel’s 3200DX FPGA Architecture

• AT&T introduced its 0.35µm ORCA™ Family of SRAM-based FPGAs in 4Q95. A 15K-gatedevice is due out in 1Q96 with densities of up to 60K-gates to follow (Figure 3-59).
• In 4Q95 Lattice introduced a 3.5ns 3.3V 20-pin 16LV8 EEPROM-based PLD using 0.5µmtechnology. A 3.5ns 22V10 device is expected by 2Q96.
• In 4Q95 Hitachi began selling FPGAs based on Crosspoint Solutions’ antifuse-based tech-nology in Japan. Hitachi will also co-develop libraries to convert Crosspoint FPGAs toHitachi gate arrays.
• A new entrant emerged in the FPGA market in 2Q95—Gate Field, a division of EDA soft-ware supplier Zycad. The FPGAs are produced by Rohm using a 0.6µm flash-based process.Its 9K total gates (2.2K usable) devices were expected to be priced at $30/25K at the end of1995. A 100K total gate device was due late in 1995.
• Production quantities of IMP’s electrically programmable analog circuit (EPAC) began ship-ping in 1Q95. The EPACs are produced using a mixed-signal 1.2µm CMOS process with on-chip EEPROM. The EPACs cost $25 (100) and are available in a mask-programmed version(MPAC).
ASIC Industry Trends
INTEGRATED CIRCUIT ENGINEERING CORPORATION 3-49
0.1
0.2
0.3
0.4
0.5
0.6
0.7
0.8
0.9
1.0
1.1
1.2
1.3
1.4
1.5
1.6
1.7
1.8
05,00010,00015,00020,00025,00030,00035,00040,00045,00050,00055,00060,00065,00070,00075,00080,00085,00090,00095,000100,000+
199719961995199419931992
Year
Min
imu
m G
eom
etry
(µm
)
Usa
ble
Gat
es/C
hip
Geometry
Gates
Source: AT&T Microelectronics/ICE, "Status 1996" 20431
4,000 gates 7,000 gates
26,000 gates
40,000 gates
60,000 gates
0.8µm
0.6µm
0.5µm 0.35µm
Figure 3-59. AT&T FPGA Density and Feature Size Trends

As discussed above, with a movement to high density PLD devices, the PLD producers are beingasked to offer functions other than pure logic on-chip. Many PLD suppliers have begun offeringPLDs with on-chip SRAM or ROM (e.g., Altera, Xilinx, etc.). Altera and Motorola are even con-templating adding MCU embedded functions to their PLD devices!
The in-system reprogrammable PLD topic is one that has only recently surfaced (1994). Some ofthe early players in this area include:
- AT&T (SRAM-based)- Altera (SRAM-based, MCM and monolithic)- AMD (EEPROM-based)- Atmel (SRAM-based)- Lattice (EEPROM-based)- Xilinx (SRAM-based and flash-based)
As an example of a reconfigurable application, Altera states that its reprogrammable PLD can beconfigured as a display accelerator or circuit simulator as needed. Altera says, “. . . that by usingreprogrammable logic the potential exists to configure the hardware for more direct processing ofthe data.”
Chris DeMonico of AT&T states that there are three major reasons for logic reconfigurability.“First, to meet standards, which are evolving and therefore are in a constant state of flux; second,to keep up with system functionality changes; and third, to accommodate multiple data formatsin a single device.” There is little doubt that reconfigurability will be a powerful tool to enhancea system’s efficiency.
Some possible early system applications for reprogrammable logic include telecommunications,geophysical information processing, medical imaging, and computer architecture simulation.
In the telecommunications area one can easily envision the need for a PLD device to dynamicallyreconfigure itself to accommodate multiple interface or telecommunications protocols and stan-dards (Figure 3-60).
Atmel describes its reconfigurable logic as “cache logic.” Since much of a system’s hardware logicis idle at a given time, the ability to reconfigure the logic on-the-fly to optimally serve the software’simmediate computational requirements can greatly accelerate the performance of the system.
It should be noted that reconfigurable PLD logic is still in its infancy. 1995 design tools and pro-grams were still not sufficient to manage dynamically reconfigurable hardware efficiently.However, as system designers continue to explore ways to increase system performance, ICEexpects that reconfigurable PLDs will find an increasing market to serve.
ASIC Industry Trends
INTEGRATED CIRCUIT ENGINEERING CORPORATION3-50

ASIC Industry Trends
INTEGRATED CIRCUIT ENGINEERING CORPORATION 3-51
(a) Telecom T1/T1E
(b) Sonet/Synchronous Networks
(c) Algorithm Engine
(d) ATM
(e) Graphics-Accelerator Card
DSP Algorithm Engine Line Interface Card
Line Interface Card
Line Interface Card
Synchronizer
DSP Algorithm Engine
Fixed Algorithm Engine
Dual-Port RAM DSP Core Microcontroller
ATM Switch Fabric
Hard Disk Compression/Decompression FPGA Video Engine
Synchronizer
2.048 Mbits/s (Europe) 1.544 Mbits/s (U.S.)
Extract timing from T1/T1E source
Extract timing from T1/T1E source or bits
DS3: 45 Mbits/s STS1E: 52 Mbits/s
Overhead channels Framing
Source: AT&T Microelectronics/ICE, "Status 1996" 20180
Figure 3-60. FPGA Can Reconfigure to Meet Various Standards

ASIC Industry Trends
INTEGRATED CIRCUIT ENGINEERING CORPORATION3-52