section 25 construction and housing - census.gov · section 25 construction and housing ... a...
TRANSCRIPT
Section 25
Construction and HousingThis section presents data on theconstruction industry and on various indi-cators of its activity and costs; on housingunits and their characteristics and occu-pants; and on the characteristics and vacancy rates for commercial buildings.There are new data on industrial buildingsand the construction value series changedits base year to 1992 dollars for itsconstant dollar series.
The principal source of these data is theU.S. Bureau of the Census, which issues avariety of current publications. Constructionstatistics compiled by the Bureau appear inits monthly Current Construction Reportsseries with various quarterly or annual supplements; Housing Starts and HousingCompletions present data by type of struc-ture and by four major census regions;New One-Family Houses Sold and ForSale also provides statistics annually onphysical and financial characteristics for all new housing by the four major censusregions; Price Index of New One-FamilyHouses Sold presents quarterly figuresand annual regional data; and HousingUnits Authorized by Building Permits cov-ers approximately 19,000 permit-issuingjurisdictions in the United States (prior to 1995, 17,000 places). Statistics on ex-penditures by owners of residential proper-ties are issued quarterly and annually inExpenditures for Residential Upkeep andImprovements. Value of New ConstructionPut in Place presents data on all types ofconstruction and includes monthly com-posite cost indexes. Reports of the cen-suses of construction industries (see below) are also issued on various topics.
Other Census Bureau publications includethe Current Housing Reports series, whichcomprises the quarterly Housing Vacan-cies, the quarterly Market Absorption ofApartments, the American Housing Survey(formerly Annual Housing Survey) and re-ports of the censuses of housing and ofconstruction industries. Construction Re-view, published quarterly by the Interna-tional Trade Administration, U.S. Depart-ment of Commerce, contains many of thecensus series and other construction sta-tistics series from the Federal Governmentand private agencies.
In BriefValue of new construction inconstant (1992) dollars reached$470 billion in 1995, its highest levelsince 1986.Sales of existing one-family homesdeclined 3.6% between 1994 and1995 to just over 3.8 million units.The Nation’s office vacancy rate de-clined to 14.3% at yearend 1995, thelowest rate since 1984.
Other sources include the monthlyDodge Construction Potentials of F. W.Dodge Division, McGraw-Hill InformationSystems Company, New York, NY, whichpresents national and State data onconstruction contracts; the NationalAssociation of Home Builders with–State-level data on housing starts; theNATIONAL ASSOCIATION OF REAL-TORS, which presents data on existinghome sales; the Society of Industrial andOffice Realtors and Oncor Internationalon commercial 2nd industrial officespace; the Bureau of Economic Analysis,which presents data on residential capi-tal and gross housing product; and theU.S. Energy Information Administration,which provides data on commercialbuildings through its periodic sample surveys.
Censuses and surveys— Censuses ofthe construction industry were first con-ducted by the Bureau of the Census for1929, 1935, and 1939; beginning in1967, a census has been taken everyfive years (for years ending in “2” and“7”). The latest reports are for 1992.
The 1992 Census of Construction Indus-tries, in accordance with the 1987 Stan-dard Industrial Classification Manual (seetext, section 13), covers all employer es-tablishments primarily engaged in (1)building construction by general contrac-tors or operative builders; (2) heavy(nonbuilding) construction by generalcontractors; and (3) construction by spe-cial trade contractors.
Construction and Housing708
From 1850 through 1930, the Bureau ofthe Census collected some housing dataas part of its censuses of population andagriculture. Beginning in 1940, separatecensuses of housing have been taken at10-year intervals. For the 1970 and 1980censuses, data on year-round housingunits were collected and issued on occu-pancy and structural characteristics,plumbing facilities, value, and rent; for1990 such characteristics were pres-ented for all housing units.
The American Housing Survey (CurrentHousing Reports series H-150 andH-170), which began in 1973, providedan annual and ongoing series of data onselected housing and demographic char-acteristics until 1983. In 1984 the nameof the survey was changed from theAnnual Housing Survey. It is currentlybased on a biennial national sample andon 11 annual MSA samples. All samplesrepresent a cross section of the housingstock in their respective areas. Estimatesare subject to both sampling and non-sampling errors; caution should there-fore, be used in making comparisonswith 1970 and 1980 census data.
Data on residential mortgages were col-lected continuously from 1890 to 1970,
except 1930, as part of the decennialcensus by the Bureau of the Census.Since 1973, mortgage status data, lim-ited to single family homes on less thanten acres with no business on the prop-erty, have been presented in the Ameri-can Housing Survey. Data on mortgageactivity are covered in section 16.
Housing units— In general, a housingunit is a group of rooms or a single roomoccupied or intended for occupancy asseparate living quarters; that is, the occu-pants do not live and eat with any otherpersons in the structure and there is di-rect access from the outside or through acommon hall. Transient accommoda-tions, barracks for workers, and institutional-type quarters are notcounted as housing units.
Statistical reliability— For a discussionof statistical collection and estimation,sampling procedures, and measures ofstatistical reliability applicable to CensusBureau data, see Appendix III.
Historical statistics— Tabular head-notes provide cross-references, whereapplicable, to Historical Statistics of theUnited States, Colonial Times to 1970.See Appendix IV.
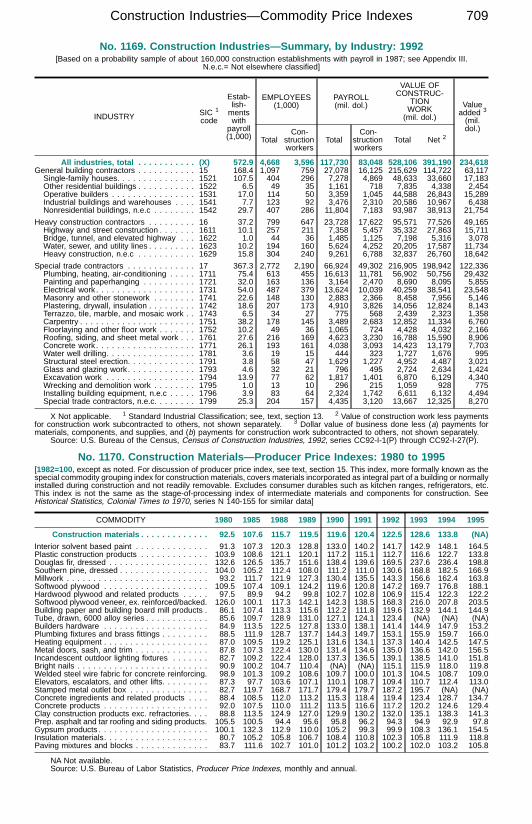
No. 1169. Construction Industries—Summary, by Industry: 1992[Based on a probability sample of about 160,000 construction establishments with payroll in 1987; see Appendix III.
N.e.c.= Not elsewhere classified]
INDUSTRY SIC 1
code
Estab-lish-mentswithpayroll(1,000)
EMPLOYEES(1,000)
PAYROLL(mil. dol.)
VALUE OFCONSTRUC-
TIONWORK(mil. dol.)
Valueadded 3
(mil.dol.)
TotalCon-
structionworkers
TotalCon-
structionworkers
Total Net 2
All industries, total . . . . . . . . . . . (X) 572.9 4,668 3,596 117,730 83,048 528,106 391,190 234,618General building contractors . . . . . . . . . . . 15 168.4 1,097 759 27,078 16,125 215,629 114,722 63,117Single-family houses. . . . . . . . . . . . . . . 1521 107.5 404 296 7,278 4,869 48,633 33,660 17,183Other residential buildings . . . . . . . . . . . 1522 6.5 49 35 1,161 718 7,835 4,338 2,454Operative builders . . . . . . . . . . . . . . . . 1531 17.0 114 50 3,359 1,045 44,588 26,843 15,289Industrial buildings and warehouses . . . . 1541 7.7 123 92 3,476 2,310 20,586 10,967 6,438Nonresidential buildings, n.e.c . . . . . . . . 1542 29.7 407 286 11,804 7,183 93,987 38,913 21,754
Heavy construction contractors . . . . . . . . . 16 37.2 799 647 23,728 17,622 95,571 77,526 49,165Highway and street construction . . . . . . . 1611 10.1 257 211 7,358 5,457 35,332 27,863 15,711Bridge, tunnel, and elevated highway . . . 1622 1.0 44 36 1,485 1,125 7,198 5,316 3,078Water, sewer, and utility lines . . . . . . . . . 1623 10.2 194 160 5,624 4,252 20,205 17,587 11,734Heavy construction, n.e.c . . . . . . . . . . . 1629 15.8 304 240 9,261 6,788 32,837 26,760 18,642
Special trade contractors . . . . . . . . . . . . . 17 367.3 2,772 2,190 66,924 49,302 216,905 198,942 122,336Plumbing, heating, air-conditioning . . . . . 1711 75.4 613 455 16,613 11,781 56,902 50,756 29,432Painting and paperhanging . . . . . . . . . . 1721 32.0 163 136 3,164 2,470 8,690 8,095 5,855Electrical work. . . . . . . . . . . . . . . . . . . 1731 54.0 487 379 13,624 10,039 40,259 38,541 23,548Masonry and other stonework . . . . . . . . 1741 22.6 148 130 2,883 2,366 8,458 7,956 5,146Plastering, drywall, insulation . . . . . . . . . 1742 18.6 207 173 4,910 3,826 14,056 12,824 8,143Terrazzo, tile, marble, and mosaic work . . 1743 6.5 34 27 775 568 2,439 2,323 1,358Carpentry . . . . . . . . . . . . . . . . . . . . . . 1751 38.2 178 145 3,489 2,683 12,852 11,334 6,760Floorlaying and other floor work . . . . . . . 1752 10.2 49 36 1,065 724 4,428 4,032 2,166Roofing, siding, and sheet metal work . . . 1761 27.6 216 169 4,623 3,230 16,788 15,590 8,906Concrete work. . . . . . . . . . . . . . . . . . . 1771 26.1 193 161 4,038 3,093 14,423 13,179 7,703Water well drilling. . . . . . . . . . . . . . . . . 1781 3.6 19 15 444 323 1,727 1,676 995Structural steel erection. . . . . . . . . . . . . 1791 3.8 58 47 1,629 1,227 4,952 4,487 3,021Glass and glazing work. . . . . . . . . . . . . 1793 4.6 32 21 796 495 2,724 2,634 1,424Excavation work . . . . . . . . . . . . . . . . . 1794 13.9 77 62 1,817 1,401 6,870 6,129 4,340Wrecking and demolition work . . . . . . . . 1795 1.0 13 10 296 215 1,059 928 775Installing building equipment, n.e.c . . . . . 1796 3.9 83 64 2,324 1,742 6,611 6,132 4,494Special trade contractors, n.e.c. . . . . . . . 1799 25.3 204 157 4,435 3,120 13,667 12,325 8,270
X Not applicable. 1 Standard Industrial Classification; see, text, section 13. 2 Value of construction work less paymentsfor construction work subcontracted to others, not shown separately. 3 Dollar value of business done less (a) payments formaterials, components, and supplies, and (b) payments for construction work subcontracted to others, not shown separately.
Source: U.S. Bureau of the Census, Census of Construction Industries, 1992, series CC92-I-1(P) through CC92-I-27(P).
No. 1170. Construction Materials—Producer Price Indexes: 1980 to 1995[1982=100, except as noted. For discussion of producer price index, see text, section 15. This index, more formally known as thespecial commodity grouping index for construction materials, covers materials incorporated as integral part of a building or normallyinstalled during construction and not readily removable. Excludes consumer durables such as kitchen ranges, refrigerators, etc.This index is not the same as the stage-of-processing index of intermediate materials and components for construction. SeeHistorical Statistics, Colonial Times to 1970, series N 140-155 for similar data]
COMMODITY 1980 1985 1988 1989 1990 1991 1992 1993 1994 1995
Construction materials . . . . . . . . . . . . . 92.5 107.6 115.7 119.5 119.6 120.4 122.5 128.6 133.8 (NA)
Interior solvent based paint . . . . . . . . . . . . . . 91.3 107.3 120.3 128.8 133.0 140.2 141.7 142.9 148.1 164.5Plastic construction products . . . . . . . . . . . . . 103.9 108.6 121.1 120.1 117.2 115.1 112.7 116.6 122.7 133.8Douglas fir, dressed . . . . . . . . . . . . . . . . . . . 132.6 126.5 135.7 151.6 138.4 139.6 169.5 237.6 236.4 198.8Southern pine, dressed . . . . . . . . . . . . . . . . . 104.0 105.2 112.4 108.0 111.2 111.0 130.6 168.8 182.5 166.9Millwork . . . . . . . . . . . . . . . . . . . . . . . . . . . 93.2 111.7 121.9 127.3 130.4 135.5 143.3 156.6 162.4 163.8Softwood plywood . . . . . . . . . . . . . . . . . . . . 109.5 107.4 109.1 124.2 119.6 120.8 147.2 169.7 176.8 188.1Hardwood plywood and related products . . . . . 97.5 89.9 94.2 99.8 102.7 102.8 106.9 115.4 122.3 122.2Softwood plywood veneer, ex. reinforced/backed. 126.0 100.1 117.3 142.1 142.3 138.5 168.3 216.0 207.8 203.5Building paper and building board mill products . 86.1 107.4 113.3 115.6 112.2 111.8 119.6 132.9 144.1 144.9Tube, drawn, 6000 alloy series . . . . . . . . . . . . 85.6 109.7 128.9 131.0 127.1 124.1 123.4 (NA) (NA) (NA)Builders hardware . . . . . . . . . . . . . . . . . . . . 84.9 113.5 122.5 127.8 133.0 138.1 141.4 144.9 147.9 153.2Plumbing fixtures and brass fittings . . . . . . . . . 88.5 111.9 128.7 137.7 144.3 149.7 153.1 155.9 159.7 166.0Heating equipment . . . . . . . . . . . . . . . . . . . . 87.0 109.5 119.2 125.1 131.6 134.1 137.3 140.4 142.5 147.5Metal doors, sash, and trim . . . . . . . . . . . . . . 87.8 107.3 122.4 130.0 131.4 134.6 135.0 136.6 142.0 156.5Incandescent outdoor lighting fixtures . . . . . . . 82.7 109.2 122.4 128.0 137.3 136.5 139.1 138.5 141.0 151.8Bright nails . . . . . . . . . . . . . . . . . . . . . . . . . 90.9 100.2 104.7 110.4 (NA) (NA) 115.1 115.9 118.0 119.8Welded steel wire fabric for concrete reinforcing. 98.9 101.3 109.2 108.6 109.7 100.0 101.3 104.5 108.7 109.0Elevators, escalators, and other lifts. . . . . . . . . 87.3 97.7 103.6 107.1 110.1 108.7 109.4 110.7 112.4 113.0Stamped metal outlet box . . . . . . . . . . . . . . . 82.7 119.7 168.7 171.7 179.4 179.7 187.2 195.7 (NA) (NA)Concrete ingredients and related products . . . . 88.4 108.5 112.0 113.2 115.3 118.4 119.4 123.4 128.7 134.7Concrete products . . . . . . . . . . . . . . . . . . . . 92.0 107.5 110.0 111.2 113.5 116.6 117.2 120.2 124.6 129.4Clay construction products exc. refractories. . . . 88.8 113.5 124.9 127.0 129.9 130.2 132.0 135.1 138.3 141.3Prep. asphalt and tar roofing and siding products. 105.5 100.5 94.4 95.6 95.8 96.2 94.3 94.9 92.9 97.8Gypsum products . . . . . . . . . . . . . . . . . . . . . 100.1 132.3 112.9 110.0 105.2 99.3 99.9 108.3 136.1 154.5Insulation materials. . . . . . . . . . . . . . . . . . . . 80.7 105.2 105.8 106.7 108.4 110.8 102.3 105.8 111.9 118.8Paving mixtures and blocks . . . . . . . . . . . . . . 83.7 111.6 102.7 101.0 101.2 103.2 100.2 102.0 103.2 105.8
NA Not available.Source: U.S. Bureau of Labor Statistics, Producer Price Indexes, monthly and annual.
Construction Industries—Commodity Price Indexes 709
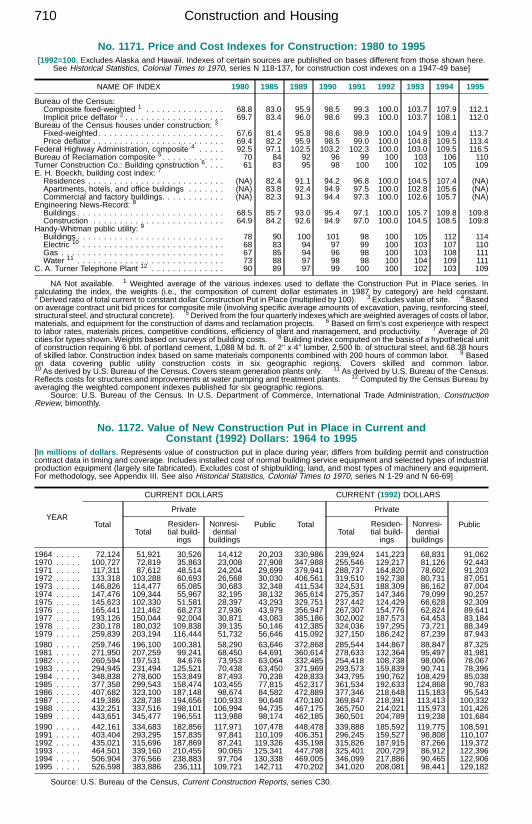
No. 1171. Price and Cost Indexes for Construction: 1980 to 1995[1992=100. Excludes Alaska and Hawaii. Indexes of certain sources are published on bases different from those shown here.
See Historical Statistics, Colonial Times to 1970, series N 118-137, for construction cost indexes on a 1947-49 base]
NAME OF INDEX 1980 1985 1989 1990 1991 1992 1993 1994 1995
Bureau of the Census:Composite fixed-weighted 1 . . . . . . . . . . . . . . . 68.8 83.0 95.9 98.5 99.3 100.0 103.7 107.9 112.1Implicit price deflator 2 . . . . . . . . . . . . . . . . . . . 69.7 83.4 96.0 98.6 99.3 100.0 103.7 108.1 112.0
Bureau of the Census houses under construction: 3Fixed-weighted . . . . . . . . . . . . . . . . . . . . . . . . 67.6 81.4 95.8 98.6 98.9 100.0 104.9 109.4 113.7Price deflator . . . . . . . . . . . . . . . . . . . . . . . . . 69.4 82.2 95.9 98.5 99.0 100.0 104.8 109.5 113.4
Federal Highway Administration, composite 4 . . . . . 92.5 97.1 102.5 103.2 102.3 100.0 103.0 109.5 116.5Bureau of Reclamation composite 5 . . . . . . . . . . . . 70 84 92 96 99 100 103 106 110Turner Construction Co.: Building construction 6. . . . 61 83 95 98 100 100 102 105 109E. H. Boeckh, building cost index: 7Residences . . . . . . . . . . . . . . . . . . . . . . . . . . (NA) 82.4 91.1 94.2 96.8 100.0 104.5 107.4 (NA)Apartments, hotels, and office buildings . . . . . . . (NA) 83.8 92.4 94.9 97.5 100.0 102.8 105.6 (NA)Commercial and factory buildings. . . . . . . . . . . . (NA) 82.3 91.3 94.4 97.3 100.0 102.6 105.7 (NA)
Engineering News-Record: 8Buildings . . . . . . . . . . . . . . . . . . . . . . . . . . . . 68.5 85.7 93.0 95.4 97.1 100.0 105.7 109.8 109.8Construction . . . . . . . . . . . . . . . . . . . . . . . . . 64.9 84.2 92.6 94.9 97.0 100.0 104.5 108.5 109.8
Handy-Whitman public utility: 9Buildings . . . . . . . . . . . . . . . . . . . . . . . . . . . . 78 90 100 101 98 100 105 112 114Electric 10 . . . . . . . . . . . . . . . . . . . . . . . . . . . 68 83 94 97 99 100 103 107 110Gas . . . . . . . . . . . . . . . . . . . . . . . . . . . . . . . 67 85 94 96 98 100 103 108 111Water 11 . . . . . . . . . . . . . . . . . . . . . . . . . . . . 73 88 97 98 98 100 104 109 111
C. A. Turner Telephone Plant 12 . . . . . . . . . . . . . . 90 89 97 99 100 100 102 103 109
NA Not available. 1 Weighted average of the various indexes used to deflate the Construction Put in Place series. Incalculating the index, the weights (i.e., the composition of current dollar estimates in 1987 by category) are held constant.2 Derived ratio of total current to constant dollar Construction Put in Place (multiplied by 100). 3 Excludes value of site. 4 Basedon average contract unit bid prices for composite mile (involving specific average amounts of excavation, paving, reinforcing steel,structural steel, and structural concrete). 5 Derived from the four quarterly indexes which are weighted averages of costs of labor,materials, and equipment for the construction of dams and reclamation projects. 6 Based on firm’s cost experience with respectto labor rates, materials prices, competitive conditions, efficiency of plant and management, and productivity. 7 Average of 20cities for types shown. Weights based on surveys of building costs. 8 Building index computed on the basis of a hypothetical unitof construction requiring 6 bbl. of portland cement, 1,088 M bd. ft. of 2‘‘ x 4’’ lumber, 2,500 lb. of structural steel, and 68.38 hoursof skilled labor. Construction index based on same materials components combined with 200 hours of common labor. 9 Basedon data covering public utility construction costs in six geographic regions. Covers skilled and common labor.10 As derived by U.S. Bureau of the Census. Covers steam generation plants only. 11 As derived by U.S. Bureau of the Census.Reflects costs for structures and improvements at water pumping and treatment plants. 12 Computed by the Census Bureau byaveraging the weighted component indexes published for six geographic regions.
Source: U.S. Bureau of the Census. In U.S. Department of Commerce, International Trade Administration, ConstructionReview, bimonthly.
No. 1172. Value of New Construction Put in Place in Current andConstant (1992) Dollars: 1964 to 1995
[In millions of dollars . Represents value of construction put in place during year; differs from building permit and constructioncontract data in timing and coverage. Includes installed cost of normal building service equipment and selected types of industrialproduction equipment (largely site fabricated). Excludes cost of shipbuilding, land, and most types of machinery and equipment.For methodology, see Appendix III. See also Historical Statistics, Colonial Times to 1970, series N 1-29 and N 66-69]
YEAR
CURRENT DOLLARS CURRENT (1992) DOLLARS
Total
Private
Public Total
Private
PublicTotal
Residen-tial build-ings
Nonresi-dentialbuildings
TotalResiden-tial build-ings
Nonresi-dentialbuildings
1964 . . . . . 72,124 51,921 30,526 14,412 20,203 330,986 239,924 141,223 68,831 91,0621970 . . . . . 100,727 72,819 35,863 23,008 27,908 347,988 255,546 129,217 81,126 92,4431971 . . . . . 117,311 87,612 48,514 24,204 29,699 379,941 288,737 164,820 78,602 91,2031972 . . . . . 133,318 103,288 60,693 26,568 30,030 406,561 319,510 192,738 80,731 87,0511973 . . . . . 146,826 114,477 65,085 30,683 32,348 411,534 324,531 188,309 86,162 87,0041974 . . . . . 147,476 109,344 55,967 32,195 38,132 365,614 275,357 147,346 79,099 90,2571975 . . . . . 145,623 102,330 51,581 28,397 43,293 329,751 237,442 124,429 66,628 92,3091976 . . . . . 165,441 121,462 68,273 27,936 43,979 356,947 267,307 154,776 62,824 89,6411977 . . . . . 193,126 150,044 92,004 30,871 43,083 385,186 302,002 187,573 64,453 83,1841978 . . . . . 230,178 180,032 109,838 39,135 50,146 412,385 324,036 197,295 73,721 88,3491979 . . . . . 259,839 203,194 116,444 51,732 56,646 415,092 327,150 186,242 87,239 87,9431980 . . . . . 259,746 196,100 100,381 58,290 63,646 372,868 285,544 144,867 88,847 87,3251981 . . . . . 271,950 207,259 99,241 68,450 64,691 360,614 278,633 132,364 95,497 81,9811982 . . . . . 260,594 197,531 84,676 73,953 63,064 332,485 254,418 108,738 98,006 78,0671983 . . . . . 294,945 231,494 125,521 70,438 63,450 371,969 293,573 159,839 90,741 78,3961984 . . . . . 348,838 278,600 153,849 87,493 70,238 428,833 343,795 190,762 108,429 85,0381985 . . . . . 377,358 299,543 158,474 103,455 77,815 452,317 361,534 192,633 124,868 90,7831986 . . . . . 407,682 323,100 187,148 98,674 84,582 472,889 377,346 218,648 115,183 95,5431987 . . . . . 419,386 328,738 194,656 100,933 90,648 470,180 369,847 218,391 113,413 100,3321988 . . . . . 432,251 337,516 198,101 106,994 94,735 467,175 365,750 214,021 115,973 101,4261989 . . . . . 443,651 345,477 196,551 113,988 98,174 462,185 360,501 204,789 119,238 101,6841990 . . . . . 442,161 334,683 182,856 117,971 107,478 448,478 339,888 185,592 119,775 108,5911991 . . . . . 403,404 293,295 157,835 97,841 110,109 406,351 296,245 159,527 98,808 110,1071992 . . . . . 435,021 315,696 187,869 87,241 119,326 435,198 315,826 187,915 87,266 119,3721993 . . . . . 464,501 339,160 210,455 90,065 125,341 447,798 325,401 200,729 86,912 122,3961994 . . . . . 506,904 376,566 238,883 97,704 130,338 469,005 346,099 217,886 90,465 122,9061995 . . . . . 526,598 383,886 236,111 109,721 142,711 470,202 341,020 208,081 98,441 129,182
Source: U.S. Bureau of the Census, Current Construction Reports, series C30.
Construction and Housing710
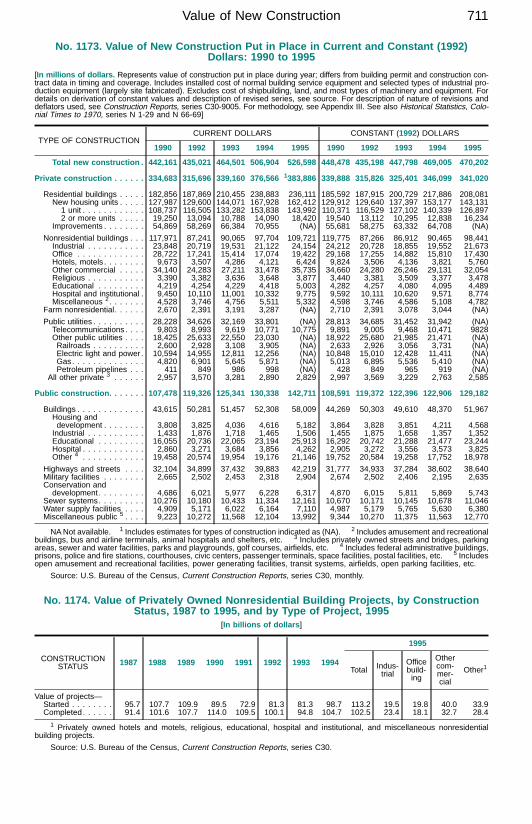
No. 1173. Value of New Construction Put in Place in Current and Constant (1992)Dollars: 1990 to 1995
[In millions of dollars. Represents value of construction put in place during year; differs from building permit and construction con-tract data in timing and coverage. Includes installed cost of normal building service equipment and selected types of industrial pro-duction equipment (largely site fabricated). Excludes cost of shipbuilding, land, and most types of machinery and equipment. Fordetails on derivation of constant values and description of revised series, see source. For description of nature of revisions anddeflators used, see Construction Reports, series C30-9005. For methodology, see Appendix III. See also Historical Statistics, Colo-nial Times to 1970, series N 1-29 and N 66-69]
TYPE OF CONSTRUCTIONCURRENT DOLLARS CONSTANT (1992) DOLLARS
1990 1992 1993 1994 1995 1990 1992 1993 1994 1995
Total new construction . 442,161 435,021 464,501 506,904 526,598 448,478 435,198 447,798 469,005 470,202
Private construction . . . . . . 334,683 315,696 339,160 376,566 1383,886 339,888 315,826 325,401 346,099 341,020
Residential buildings . . . . . 182,856 187,869 210,455 238,883 236,111 185,592 187,915 200,729 217,886 208,081New housing units . . . . . 127,987 129,600 144,071 167,928 162,412 129,912 129,640 137,397 153,177 143,1311 unit . . . . . . . . . . . . 108,737 116,505 133,282 153,838 143,992 110,371 116,529 127,102 140,339 126,8972 or more units . . . . . 19,250 13,094 10,788 14,090 18,420 19,540 13,112 10,295 12,838 16,234
Improvements . . . . . . . . 54,869 58,269 66,384 70,955 (NA) 55,681 58,275 63,332 64,708 (NA)
Nonresidential buildings . . . 117,971 87,241 90,065 97,704 109,721 119,775 87,266 86,912 90,465 98,441Industrial . . . . . . . . . . . 23,848 20,719 19,531 21,122 24,154 24,212 20,728 18,855 19,552 21,673Office . . . . . . . . . . . . . 28,722 17,241 15,414 17,074 19,422 29,168 17,255 14,882 15,810 17,430Hotels, motels . . . . . . . . 9,673 3,507 4,286 4,121 6,424 9,824 3,506 4,136 3,821 5,760Other commercial . . . . . 34,140 24,283 27,211 31,478 35,735 34,660 24,280 26,246 29,131 32,054Religious . . . . . . . . . . . 3,390 3,382 3,636 3,648 3,877 3,440 3,381 3,509 3,377 3,478Educational . . . . . . . . . 4,219 4,254 4,229 4,418 5,003 4,282 4,257 4,080 4,095 4,489Hospital and institutional . 9,450 10,110 11,001 10,332 9,775 9,592 10,111 10,620 9,571 8,774Miscellaneous 2. . . . . . . 4,528 3,746 4,756 5,511 5,332 4,598 3,746 4,586 5,108 4,782
Farm nonresidential. . . . . . 2,670 2,391 3,191 3,287 (NA) 2,710 2,391 3,078 3,044 (NA)
Public utilities . . . . . . . . . . 28,228 34,626 32,169 33,801 (NA) 28,813 34,685 31,452 31,942 (NA)Telecommunications. . . . 9,803 8,993 9,619 10,771 10,775 9,891 9,005 9,468 10,471 9828Other public utilities . . . . 18,425 25,633 22,550 23,030 (NA) 18,922 25,680 21,985 21,471 (NA)Railroads . . . . . . . . . . 2,600 2,928 3,108 3,905 (NA) 2,633 2,926 3,056 3,731 (NA)Electric light and power . 10,594 14,955 12,811 12,256 (NA) 10,848 15,010 12,428 11,411 (NA)Gas. . . . . . . . . . . . . . 4,820 6,901 5,645 5,871 (NA) 5,013 6,895 5,536 5,410 (NA)Petroleum pipelines . . . 411 849 986 998 (NA) 428 849 965 919 (NA)
All other private 3 . . . . . . 2,957 3,570 3,281 2,890 2,829 2,997 3,569 3,229 2,763 2,585
Public construction . . . . . . . 107,478 119,326 125,341 130,338 142,711 108,591 119,372 122,396 122,906 129,182
Buildings . . . . . . . . . . . . . 43,615 50,281 51,457 52,308 58,009 44,269 50,303 49,610 48,370 51,967Housing anddevelopment . . . . . . . . 3,808 3,825 4,036 4,616 5,182 3,864 3,828 3,851 4,211 4,568Industrial . . . . . . . . . . . 1,433 1,876 1,718 1,465 1,506 1,455 1,875 1,658 1,357 1,352Educational . . . . . . . . . 16,055 20,736 22,065 23,194 25,913 16,292 20,742 21,288 21,477 23,244Hospital . . . . . . . . . . . . 2,860 3,271 3,684 3,856 4,262 2,905 3,272 3,556 3,573 3,825Other 4 . . . . . . . . . . . . 19,458 20,574 19,954 19,176 21,146 19,752 20,584 19,258 17,752 18,978
Highways and streets . . . . 32,104 34,899 37,432 39,883 42,219 31,777 34,933 37,284 38,602 38,640Military facilities . . . . . . . . 2,665 2,502 2,453 2,318 2,904 2,674 2,502 2,406 2,195 2,635Conservation anddevelopment . . . . . . . . . 4,686 6,021 5,977 6,228 6,317 4,870 6,015 5,811 5,869 5,743
Sewer systems. . . . . . . . . 10,276 10,180 10,433 11,334 12,161 10,670 10,171 10,145 10,678 11,046Water supply facilities . . . . 4,909 5,171 6,022 6,164 7,110 4,987 5,179 5,765 5,630 6,380Miscellaneous public 5 . . . . 9,223 10,272 11,568 12,104 13,992 9,344 10,270 11,375 11,563 12,770
NANot available. 1 Includes estimates for types of construction indicated as (NA). 2 Includes amusement and recreationalbuildings, bus and airline terminals, animal hospitals and shelters, etc. 3 Includes privately owned streets and bridges, parkingareas, sewer and water facilities, parks and playgrounds, golf courses, airfields, etc. 4 Includes federal administrative buildings,prisons, police and fire stations, courthouses, civic centers, passenger terminals, space facilities, postal facilities, etc. 5 Includesopen amusement and recreational facilities, power generating facilities, transit systems, airfields, open parking facilities, etc.
Source: U.S. Bureau of the Census, Current Construction Reports, series C30, monthly.
No. 1174. Value of Privately Owned Nonresidential Building Projects, by ConstructionStatus, 1987 to 1995, and by Type of Project, 1995
[In billions of dollars ]
CONSTRUCTIONSTATUS 1987 1988 1989 1990 1991 1992 1993 1994
1995
Total Indus-trial
Officebuild-ing
Othercom-mer-cial
Other1
Value of projects—Started . . . . . . . . 95.7 107.7 109.9 89.5 72.9 81.3 81.3 98.7 113.2 19.5 19.8 40.0 33.9Completed. . . . . . 91.4 101.6 107.7 114.0 109.5 100.1 94.8 104.7 102.5 23.4 18.1 32.7 28.4
1 Privately owned hotels and motels, religious, educational, hospital and institutional, and miscellaneous nonresidentialbuilding projects.
Source: U.S. Bureau of the Census, Current Construction Reports, series C30.
Value of New Construction 711
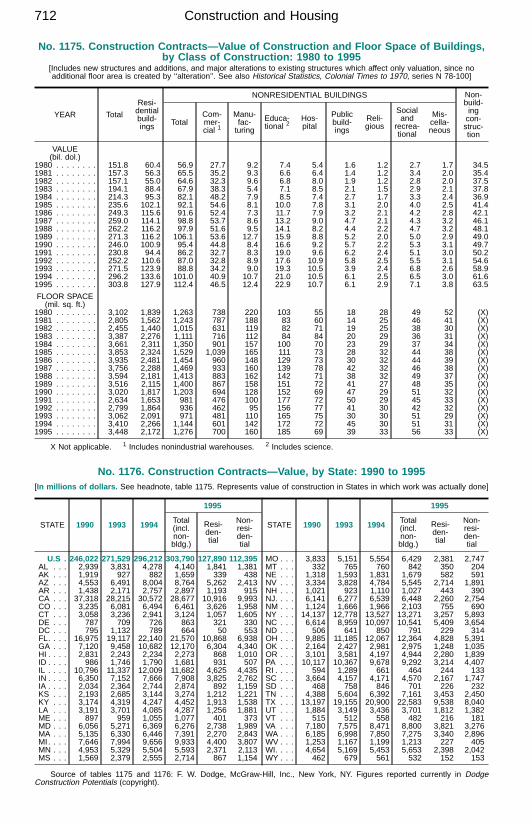
No. 1175. Construction Contracts—Value of Construction and Floor Space of Buildings,by Class of Construction: 1980 to 1995
[Includes new structures and additions, and major alterations to existing structures which affect only valuation, since noadditional floor area is created by ‘‘alteration’’. See also Historical Statistics, Colonial Times to 1970, series N 78-100]
YEAR Total
Resi-dentialbuild-ings
NONRESIDENTIAL BUILDINGS Non-build-ingcon-struc-tion
TotalCom-mer-cial 1
Manu-fac-turing
Educa-tional 2
Hos-pital
Publicbuild-ings
Reli-gious
Socialand
recrea-tional
Mis-cella-neous
VALUE(bil. dol.)
1980 . . . . . . . . 151.8 60.4 56.9 27.7 9.2 7.4 5.4 1.6 1.2 2.7 1.7 34.51981 . . . . . . . . 157.3 56.3 65.5 35.2 9.3 6.6 6.4 1.4 1.2 3.4 2.0 35.41982 . . . . . . . . 157.1 55.0 64.6 32.3 9.6 6.8 8.0 1.9 1.2 2.8 2.0 37.51983 . . . . . . . . 194.1 88.4 67.9 38.3 5.4 7.1 8.5 2.1 1.5 2.9 2.1 37.81984 . . . . . . . . 214.3 95.3 82.1 48.2 7.9 8.5 7.4 2.7 1.7 3.3 2.4 36.91985 . . . . . . . . 235.6 102.1 92.1 54.6 8.1 10.0 7.8 3.1 2.0 4.0 2.5 41.41986 . . . . . . . . 249.3 115.6 91.6 52.4 7.3 11.7 7.9 3.2 2.1 4.2 2.8 42.11987 . . . . . . . . 259.0 114.1 98.8 53.7 8.6 13.2 9.0 4.7 2.1 4.3 3.2 46.11988 . . . . . . . . 262.2 116.2 97.9 51.6 9.5 14.1 8.2 4.4 2.2 4.7 3.2 48.11989 . . . . . . . . 271.3 116.2 106.1 53.6 12.7 15.9 8.8 5.2 2.0 5.0 2.9 49.01990 . . . . . . . . 246.0 100.9 95.4 44.8 8.4 16.6 9.2 5.7 2.2 5.3 3.1 49.71991 . . . . . . . . 230.8 94.4 86.2 32.7 8.3 19.0 9.6 6.2 2.4 5.1 3.0 50.21992 . . . . . . . . 252.2 110.6 87.0 32.8 8.9 17.6 10.9 5.8 2.5 5.5 3.1 54.61993 . . . . . . . . 271.5 123.9 88.8 34.2 9.0 19.3 10.5 3.9 2.4 6.8 2.6 58.91994 . . . . . . . . 296.2 133.6 101.0 40.9 10.7 21.0 10.5 6.1 2.5 6.5 3.0 61.61995 . . . . . . . . 303.8 127.9 112.4 46.5 12.4 22.9 10.7 6.1 2.9 7.1 3.8 63.5
FLOOR SPACE(mil. sq. ft.)
1980 . . . . . . . . 3,102 1,839 1,263 738 220 103 55 18 28 49 52 (X)1981 . . . . . . . . 2,805 1,562 1,243 787 188 83 60 14 25 46 41 (X)1982 . . . . . . . . 2,455 1,440 1,015 631 119 82 71 19 25 38 30 (X)1983 . . . . . . . . 3,387 2,276 1,111 716 112 84 84 20 29 36 31 (X)1984 . . . . . . . . 3,661 2,311 1,350 901 157 100 70 23 29 37 34 (X)1985 . . . . . . . . 3,853 2,324 1,529 1,039 165 111 73 28 32 44 38 (X)1986 . . . . . . . . 3,935 2,481 1,454 960 148 129 73 30 32 44 39 (X)1987 . . . . . . . . 3,756 2,288 1,469 933 160 139 78 42 32 46 38 (X)1988 . . . . . . . . 3,594 2,181 1,413 883 162 142 71 38 32 49 37 (X)1989 . . . . . . . . 3,516 2,115 1,400 867 158 151 72 41 27 48 35 (X)1990 . . . . . . . . 3,020 1,817 1,203 694 128 152 69 47 29 51 32 (X)1991 . . . . . . . . 2,634 1,653 981 476 100 177 72 50 29 45 33 (X)1992 . . . . . . . . 2,799 1,864 936 462 95 156 77 41 30 42 32 (X)1993 . . . . . . . . 3,062 2,091 971 481 110 165 75 30 30 51 29 (X)1994 . . . . . . . . 3,410 2,266 1,144 601 142 172 72 45 30 51 31 (X)1995 . . . . . . . . 3,448 2,172 1,276 700 160 185 69 39 33 56 33 (X)
X Not applicable. 1 Includes nonindustrial warehouses. 2 Includes science.
No. 1176. Construction Contracts—Value, by State: 1990 to 1995[In millions of dollars. See headnote, table 1175. Represents value of construction in States in which work was actually done]
STATE 1990 1993 1994
1995
Total(incl.non-bldg.)
Resi-den-tial
Non-resi-den-tial
U.S . 246,022 271,529 296,212 303,790 127,890 112,395AL . . . 2,939 3,831 4,278 4,140 1,841 1,381AK . . . 1,919 927 882 1,659 339 438AZ . . . 4,553 6,491 8,004 8,764 5,262 2,413AR . . . 1,438 2,171 2,757 2,897 1,193 915CA . . . 37,318 28,215 30,572 28,677 10,916 9,993CO . . . 3,235 6,081 6,494 6,461 3,626 1,958CT . . . 3,058 3,236 2,941 3,124 1,057 1,605DE . . . 787 709 726 863 321 330DC . . . 795 1,132 789 664 50 553FL. . . . 16,975 19,117 22,140 21,570 10,868 6,938GA . . . 7,120 9,458 10,682 12,170 6,304 4,340HI . . . . 2,831 2,243 2,234 2,273 868 1,010ID . . . . 986 1,746 1,790 1,681 931 507IL . . . . 10,796 11,337 12,009 11,682 4,625 4,435IN . . . . 6,350 7,152 7,666 7,908 3,825 2,762IA . . . . 2,034 2,364 2,744 2,874 892 1,159KS . . . 2,193 2,685 3,144 3,274 1,212 1,221KY . . . 3,174 4,319 4,247 4,452 1,913 1,538LA . . . 3,191 3,701 4,085 4,287 1,256 1,881ME . . . 897 959 1,055 1,077 401 373MD . . . 6,056 5,271 6,369 6,276 2,738 1,989MA . . . 5,135 6,330 6,446 7,391 2,270 2,843MI. . . . 7,646 7,994 9,656 9,933 4,400 3,807MN . . . 4,953 5,329 5,504 5,593 2,371 2,113MS . . . 1,569 2,379 2,555 2,714 867 1,154
STATE 1990 1993 1994
1995
Total(incl.non-bldg.)
Resi-den-tial
Non-resi-den-tial
MO . . . 3,833 5,151 5,554 6,429 2,381 2,747MT . . . 332 765 760 842 350 204NE . . . 1,318 1,593 1,831 1,679 582 591NV . . . 3,334 3,828 4,784 5,545 2,714 1,891NH . . . 1,021 923 1,110 1,027 443 390NJ. . . . 6,141 6,277 6,539 6,448 2,260 2,754NM . . . 1,124 1,666 1,966 2,103 755 690NY . . . 14,137 12,778 13,527 13,271 3,257 5,893NC . . . 6,614 8,959 10,097 10,541 5,409 3,654ND . . . 506 641 850 791 229 314OH . . . 9,885 11,185 12,067 12,364 4,828 5,391OK . . . 2,164 2,427 2,981 2,975 1,248 1,035OR . . . 3,101 3,581 4,197 4,944 2,280 1,839PA . . . 10,117 10,367 9,678 9,292 3,214 4,407RI . . . . 594 1,289 661 464 244 133SC . . . 3,664 4,157 4,171 4,570 2,167 1,747SD . . . 468 758 846 701 226 232TN . . . 4,388 5,604 6,392 7,161 3,453 2,450TX . . . 13,197 19,155 20,900 22,583 9,538 8,040UT . . . 1,884 3,149 3,436 3,701 1,812 1,382VT . . . 515 512 558 482 216 181VA . . . 7,180 7,575 8,471 8,800 3,821 3,276WA . . . 6,185 6,998 7,850 7,275 3,340 2,896WV . . . 1,253 1,167 1,199 1,213 227 405WI. . . . 4,654 5,169 5,453 5,653 2,398 2,042WY . . . 462 679 561 532 152 153
Source of tables 1175 and 1176: F. W. Dodge, McGraw-Hill, Inc., New York, NY. Figures reported currently in DodgeConstruction Potentials (copyright).
Construction and Housing712

No. 1177. New Privately-Owned Housing Units Authorized, by State: 1994 and 1995
[Based on about 19,000 places in United States having building permit systems]
STATE
HOUSING UNITS(1,000)
VALUATION(mil. dol.)
19941995
19941995
Total 1 unit Total 1 unit
U.S . 1,371.6 1,332.5 997.3 123,278 120,811 104,739
AL . . . 19.1 20.1 13.4 1,357 1,429 1,142AK . . . 2.1 2.2 1.7 230 257 213AZ . . . 51.8 52.7 39.9 5,075 5,133 4,431AR . . . 12.4 11.7 7.3 795 766 614CA . . . 97.0 83.9 68.1 11,937 10,836 9,687CO . . . 37.2 38.6 28.4 3,906 3,859 3,302CT . . . 9.5 8.6 7.6 1,030 956 909DE . . . 5.0 4.6 4.3 337 332 321DC . . . 0.2 (Z) (Z) 18 5 5FL. . . . 128.6 122.9 84.1 11,076 10,827 8,403GA . . . 64.9 72.2 55.0 5,095 5,581 4,904HI . . . . 7.3 6.6 3.9 801 752 498ID . . . . 12.6 10.7 8.4 1,043 944 840IL . . . . 49.3 47.5 35.4 5,012 4,844 4,220IN . . . . 34.4 35.7 27.9 3,324 3,378 3,056IA . . . . 12.5 11.3 7.3 998 976 799KS . . . 13.0 12.7 8.7 1,177 1,175 1,008KY . . . 18.6 17.6 12.8 1,370 1,276 1,121LA . . . 14.8 14.7 12.5 1,141 1,141 1,056ME . . . 4.6 4.4 4.2 377 391 376MD . . . 29.0 26.6 23.2 2,395 2,293 2,142MA . . . 18.1 16.4 14.4 2,046 1,895 1,752MI. . . . 46.5 47.2 39.3 4,149 4,411 4,065MN . . . 25.6 25.5 20.7 2,558 2,590 2,304MS . . . 10.9 10.8 7.3 660 651 538
STATE
HOUSING UNITS(1,000)
VALUATION(mil. dol.)
19941995
19941995
Total 1 unit Total 1 unit
MO . . . 26.4 24.3 19.0 2,149 2,033 1,818MT . . . 3.0 3.1 1.7 233 224 160NE . . . 7.9 8.2 5.2 574 570 471NV . . . 31.1 32.8 22.5 2,185 2,738 2,246NH . . . 4.7 4.4 4.1 454 464 446NJ. . . . 25.4 21.5 18.3 2,318 1,947 1,815NM . . . 11.5 11.0 8.6 969 899 800NY . . . 31.1 28.1 19.9 2,787 2,616 2,189NC . . . 62.9 60.9 47.7 5,277 5,275 4,774ND . . . 3.4 3.2 1.5 211 201 141OH . . . 47.2 44.8 32.6 4,799 4,375 3,901OK . . . 9.5 10.1 7.8 903 878 794OR . . . 24.1 26.2 15.4 2,276 2,492 1,945PA . . . 40.2 36.3 32.0 3,728 3,318 3,124RI . . . . 2.5 2.3 2.1 233 214 203SC . . . 24.6 24.0 19.3 2,019 1,984 1,784SD . . . 4.6 3.8 2.2 288 258 189TN . . . 31.9 35.1 27.7 2,539 2,838 2,581TX . . . 102.6 105.1 70.4 8,098 8,324 7,066UT . . . 18.6 20.9 15.2 1,717 1,870 1,564VT . . . 2.4 2.3 2.0 220 205 190VA . . . 46.8 43.1 34.7 3,965 3,658 3,354WA . . . 44.0 38.2 26.8 4,018 3,578 2,918WV . . . 3.9 3.7 2.9 283 261 232WI. . . . 34.6 32.4 20.7 2,917 2,727 2,177WY . . . 2.0 1.7 1.4 210 168 155
Z Less than 50 units.
Source: U.S. Bureau of the Census, Construction Reports, series C40, annual.
No. 1178. New Privately-Owned Housing Units Started—Selected Characteristics:1970 to 1995
[In thousands. For composition of regions, see table 27. See also Historical Statistics, Colonial Times to 1970,series N 156-163 and 170]
YEAR Totalunits
STRUCTURES WITH— REGION CONDOMINIUM UNITS 1
Oneunit
2 to4
units
5 ormoreunits
North-east
Mid-west South West Total Single-
familyMulti-family
1970 . . . . . . . . 1,434 813 85 536 218 294 612 311 (NA) (NA) (NA)1971 . . . . . . . . 2,052 1,151 120 781 264 434 869 486 (NA) (NA) (NA)1972 . . . . . . . . 2,357 1,309 141 906 330 443 1,057 527 (NA) (NA) (NA)1973 . . . . . . . . 2,045 1,132 118 795 277 440 899 429 241 69 1721974 . . . . . . . . 1,338 888 68 382 183 317 553 285 175 46 130
1975 . . . . . . . . 1,160 892 64 204 149 294 442 275 65 20 451976 . . . . . . . . 1,538 1,162 86 289 169 400 569 400 95 30 641977 . . . . . . . . 1,987 1,451 122 414 202 465 783 538 118 41 771978 . . . . . . . . 2,020 1,433 125 462 200 451 824 545 156 42 1141979 . . . . . . . . 1,745 1,194 122 429 178 349 748 470 198 43 156
1980 . . . . . . . . 1,292 852 110 331 125 218 643 306 186 35 1501981 . . . . . . . . 1,084 705 91 288 117 165 562 240 181 36 1451982 . . . . . . . . 1,062 663 80 320 117 149 591 205 170 40 1301983 . . . . . . . . 1,703 1,068 113 522 168 218 935 382 276 77 1991984 . . . . . . . . 1,750 1,084 121 544 204 243 866 436 291 96 194
1985 . . . . . . . . 1,742 1,072 93 576 252 240 782 468 225 79 1461986 . . . . . . . . 1,805 1,179 84 542 294 296 733 483 214 80 1341987 . . . . . . . . 1,620 1,146 65 409 269 298 634 420 196 73 1231988 . . . . . . . . 1,488 1,081 59 348 235 274 575 404 148 53 951989 . . . . . . . . 1,376 1,003 55 318 179 266 536 396 118 37 82
1990 . . . . . . . . 1,193 895 37 260 131 253 479 329 75 22 531991 . . . . . . . . 1,014 840 36 138 113 233 414 254 60 21 391992 . . . . . . . . 1,200 1,030 31 139 127 288 497 288 74 35 401993 . . . . . . . . 1,288 1,126 29 133 126 298 562 302 86 45 411994 . . . . . . . . 1,457 1,198 35 224 138 329 639 351 96 48 481995 . . . . . . . . 1,354 1,076 38 244 118 290 615 331 93 47 47
NA Not available. 1 Type of ownership under which the owners of the individual housing units are also joint owners of thecommon areas of the building or community. Includes a small number of cooperatively-owned units.
Source: U.S. Bureau of the Census, Current Construction Reports, series C20, monthly.
Building Permits—Housing Starts 713
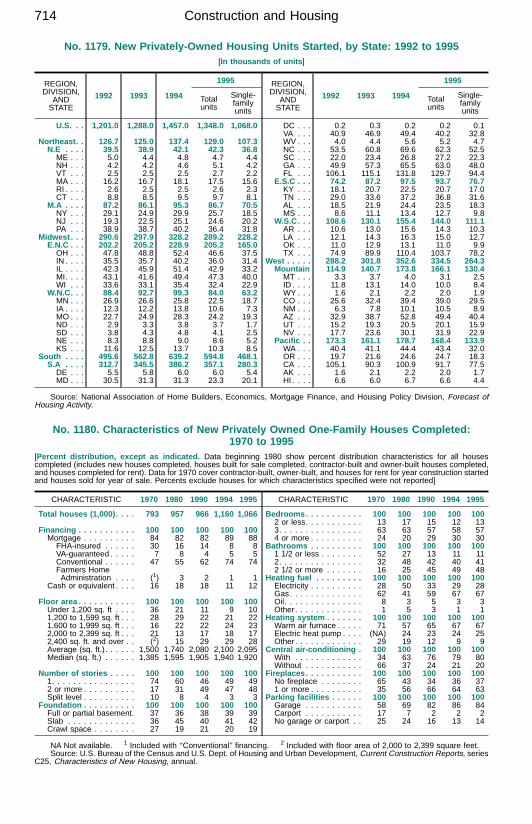
No. 1179. New Privately-Owned Housing Units Started, by State: 1992 to 1995[In thousands of units ]
REGION,DIVISION,
ANDSTATE
1992 1993 1994
1995
Totalunits
Single-familyunits
U.S. . . 1,201.0 1,288.0 1,457.0 1,348.0 1,068.0
Northeast. . 126.7 125.0 137.4 129.0 107.3N.E . . . . 39.5 38.9 42.1 42.3 36.8ME . . . 5.0 4.4 4.8 4.7 4.4NH . . . 4.2 4.2 4.6 5.1 4.2VT . . . 2.5 2.5 2.5 2.7 2.2MA . . . 16.2 16.7 18.1 17.5 15.6RI . . . . 2.6 2.5 2.5 2.6 2.3CT . . . 8.8 8.5 9.5 9.7 8.1
M.A . . . . 87.2 86.1 95.3 86.7 70.5NY . . . 29.1 24.9 29.9 25.7 18.5NJ . . . 19.3 22.5 25.1 24.6 20.2PA . . . 38.9 38.7 40.2 36.4 31.8
Midwest . . . 290.6 297.9 328.2 289.2 228.2E.N.C . . . 202.2 205.2 228.9 205.2 165.0OH . . . 47.8 48.8 52.4 46.6 37.5IN . . . . 35.5 35.7 40.2 36.0 31.4IL . . . . 42.3 45.9 51.4 42.9 33.2MI. . . . 43.1 41.6 49.4 47.3 40.0WI . . . 33.6 33.1 35.4 32.4 22.9
W.N.C. . . 88.4 92.7 99.3 84.0 63.2MN . . . 26.9 26.6 25.8 22.5 18.7IA . . . . 12.3 12.2 13.8 10.6 7.3MO . . . 22.7 24.9 28.3 24.2 19.3ND . . . 2.9 3.3 3.8 3.7 1.7SD . . . 3.8 4.3 4.8 4.1 2.5NE . . . 8.3 8.8 9.0 8.6 5.2KS . . . 11.6 12.5 13.7 10.3 8.5
South . . . . 495.6 562.8 639.2 594.8 468.1S.A . . . . 312.7 345.5 386.2 357.1 280.3DE . . . 5.5 5.8 6.0 6.0 5.4MD . . . 30.5 31.3 31.3 23.3 20.1
REGION,DIVISION,
ANDSTATE
1992 1993 1994
1995
Totalunits
Single-familyunits
DC . . . 0.2 0.3 0.2 0.2 0.1VA . . . 40.9 46.9 49.4 40.2 32.8WV . . . 4.0 4.4 5.6 5.2 4.7NC . . . 53.5 60.8 69.6 62.3 52.5SC . . . 22.0 23.4 26.8 27.2 22.3GA . . . 49.9 57.3 65.5 63.0 48.0FL . . . 106.1 115.1 131.8 129.7 94.4
E.S.C . . . 74.2 87.2 97.5 93.7 76.7KY . . . 18.1 20.7 22.5 20.7 17.0TN . . . 29.0 33.6 37.2 36.8 31.6AL . . . 18.5 21.9 24.4 23.5 18.3MS . . . 8.6 11.1 13.4 12.7 9.8
W.S.C. . . 108.6 130.1 155.4 144.0 111.1AR . . . 10.6 13.0 15.6 14.3 10.3LA . . . 12.1 14.3 16.3 15.0 12.7OK . . . 11.0 12.9 13.1 11.0 9.9TX . . . 74.9 89.9 110.4 103.7 78.2
West . . . . . 288.2 301.8 352.6 334.5 264.3Mountain 114.9 140.7 173.8 166.1 130.4MT . . . 3.3 3.7 4.0 3.1 2.5ID . . . . 11.8 13.1 14.0 10.0 8.4WY . . . 1.6 2.1 2.2 2.0 1.9CO . . . 25.6 32.4 39.4 39.0 29.5NM . . . 6.3 7.8 10.1 10.5 8.9AZ . . . 32.9 38.7 52.8 49.4 40.4UT . . . 15.2 19.3 20.5 20.1 15.9NV . . . 17.7 23.6 30.1 31.9 22.9
Pacific . . 173.3 161.1 178.7 168.4 133.9WA . . . 40.4 41.1 44.4 43.4 32.0OR . . . 19.7 21.6 24.6 24.7 18.3CA . . . 105.1 90.3 100.9 91.7 77.5AK . . . 1.6 2.1 2.2 2.0 1.7HI . . . . 6.6 6.0 6.7 6.6 4.4
Source: National Association of Home Builders, Economics, Mortgage Finance, and Housing Policy Division, Forecast ofHousing Activity.
No. 1180. Characteristics of New Privately Owned One-Family Houses Completed:1970 to 1995
[Percent distribution, except as indicated. Data beginning 1980 show percent distribution characteristics for all housescompleted (includes new houses completed, houses built for sale completed, contractor-built and owner-built houses completed,and houses completed for rent). Data for 1970 cover contractor-built, owner-built, and houses for rent for year construction startedand houses sold for year of sale. Percents exclude houses for which characteristics specified were not reported]
CHARACTERISTIC 1970 1980 1990 1994 1995
Total houses (1,000) . . . . 793 957 966 1,160 1,066
Financing . . . . . . . . . . . 100 100 100 100 100Mortgage . . . . . . . . . . 84 82 82 89 88FHA-insured . . . . . . 30 16 14 8 8VA-guaranteed . . . . . 7 8 4 5 5Conventional . . . . . . 47 55 62 74 74Farmers HomeAdministration . . . . (1) 3 2 1 1
Cash or equivalent . . . . 16 18 18 11 12
Floor area . . . . . . . . . . . 100 100 100 100 100Under 1,200 sq. ft . . . . 36 21 11 9 101,200 to 1,599 sq. ft . . . 28 29 22 21 221,600 to 1,999 sq. ft . . . 16 22 22 24 232,000 to 2,399 sq. ft . . . 21 13 17 18 172,400 sq. ft. and over . . (2) 15 29 29 28Average (sq. ft.). . . . . . 1,500 1,740 2,080 2,100 2,095Median (sq. ft.) . . . . . . 1,385 1,595 1,905 1,940 1,920
Number of stories . . . . . 100 100 100 100 1001. . . . . . . . . . . . . . . . 74 60 46 49 492 or more . . . . . . . . . . 17 31 49 47 48Split level . . . . . . . . . . 10 8 4 3 3
Foundation . . . . . . . . . . 100 100 100 100 100Full or partial basement. 37 36 38 39 39Slab . . . . . . . . . . . . . 36 45 40 41 42Crawl space . . . . . . . . 27 19 21 20 19
CHARACTERISTIC 1970 1980 1990 1994 1995
Bedrooms . . . . . . . . . . . 100 100 100 100 1002 or less. . . . . . . . . . . 13 17 15 12 133. . . . . . . . . . . . . . . . 63 63 57 58 574 or more . . . . . . . . . . 24 20 29 30 30
Bathrooms . . . . . . . . . . 100 100 100 100 1001 1/2 or less . . . . . . . . 52 27 13 11 112. . . . . . . . . . . . . . . . 32 48 42 40 412 1/2 or more . . . . . . . 16 25 45 49 48
Heating fuel . . . . . . . . . 100 100 100 100 100Electricity . . . . . . . . . . 28 50 33 29 28Gas. . . . . . . . . . . . . . 62 41 59 67 67Oil. . . . . . . . . . . . . . . 8 3 5 3 3Other . . . . . . . . . . . . . 1 5 3 1 1
Heating system . . . . . . . 100 100 100 100 100Warm air furnace . . . . . 71 57 65 67 67Electric heat pump . . . . (NA) 24 23 24 25Other . . . . . . . . . . . . . 29 19 12 9 9
Central air-conditioning . 100 100 100 100 100With . . . . . . . . . . . . . 34 63 76 79 80Without . . . . . . . . . . . 66 37 24 21 20
Fireplaces . . . . . . . . . . . 100 100 100 100 100No fireplace . . . . . . . . 65 43 34 36 371 or more . . . . . . . . . . 35 56 66 64 63
Parking facilities . . . . . . 100 100 100 100 100Garage . . . . . . . . . . . 58 69 82 86 84Carport . . . . . . . . . . . 17 7 2 2 2No garage or carport . . 25 24 16 13 14
NA Not available. 1 Included with ‘‘Conventional’’ financing. 2 Included with floor area of 2,000 to 2,399 square feet.Source: U.S. Bureau of the Census and U.S. Dept. of Housing and Urban Development, Current Construction Reports, series
C25, Characteristics of New Housing, annual.
Construction and Housing714
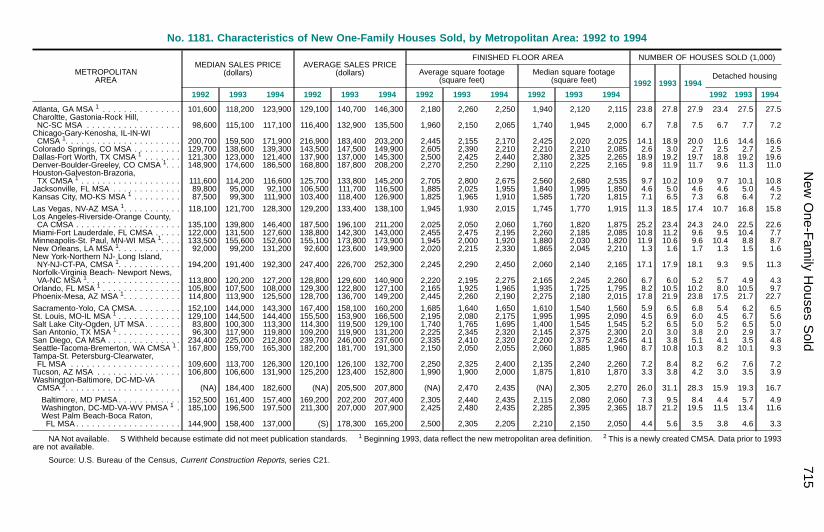
No. 1181. Characteristics of New One-Family Houses Sold, by Metropolitan Area: 1992 to 1994
METROPOLITANAREA
MEDIAN SALES PRICE(dollars)
AVERAGE SALES PRICE(dollars)
FINISHED FLOOR AREA NUMBER OF HOUSES SOLD (1,000)
Average square footage(square feet)
Median square footage(square feet) 1992 1993 1994
Detached housing
1992 1993 1994 1992 1993 1994 1992 1993 1994 1992 1993 1994 1992 1993 1994
Atlanta, GA MSA 1 . . . . . . . . . . . . . . . 101,600 118,200 123,900 129,100 140,700 146,300 2,180 2,260 2,250 1,940 2,120 2,115 23.8 27.8 27.9 23.4 27.5 27.5Charoltte, Gastonia-Rock Hill,NC-SC MSA . . . . . . . . . . . . . . . . . . 98,600 115,100 117,100 116,400 132,900 135,500 1,960 2,150 2,065 1,740 1,945 2,000 6.7 7.8 7.5 6.7 7.7 7.2Chicago-Gary-Kenosha, IL-IN-WICMSA 1. . . . . . . . . . . . . . . . . . . . . . 200,700 159,500 171,900 216,900 183,400 203,200 2,445 2,155 2,170 2,425 2,020 2,025 14.1 18.9 20.0 11.6 14.4 16.6Colorado Springs, CO MSA . . . . . . . . . 129,700 138,600 139,300 143,500 147,500 149,900 2,605 2,390 2,210 2,210 2,210 2,085 2.6 3.0 2.7 2.5 2.7 2.5Dallas-Fort Worth, TX CMSA 1 . . . . . . . 121,300 123,000 121,400 137,900 137,000 145,300 2,500 2,425 2,440 2,380 2,325 2,265 18.9 19.2 19.7 18.8 19.2 19.6Denver-Boulder-Greeley, CO CMSA 1. . . 148,900 174,600 186,500 168,800 187,800 208,200 2,270 2,250 2,290 2,110 2,225 2,165 9.8 11.9 11.7 9.6 11.3 11.0Houston-Galveston-Brazoria,TX CMSA 1 . . . . . . . . . . . . . . . . . . . 111,600 114,200 116,600 125,700 133,800 145,200 2,705 2,800 2,675 2,560 2,680 2,535 9.7 10.2 10.9 9.7 10.1 10.8Jacksonville, FL MSA . . . . . . . . . . . . . 89,800 95,000 92,100 106,500 111,700 116,500 1,885 2,025 1,955 1,840 1,995 1,850 4.6 5.0 4.6 4.6 5.0 4.5Kansas City, MO-KS MSA 1 . . . . . . . . . 87,500 99,300 111,900 103,400 118,400 126,900 1,825 1,965 1,910 1,585 1,720 1,815 7.1 6.5 7.3 6.8 6.4 7.2
Las Vegas, NV-AZ MSA 1. . . . . . . . . . . 118,100 121,700 128,300 129,200 133,400 138,100 1,945 1,930 2,015 1,745 1,770 1,915 11.3 18.5 17.4 10.7 16.8 15.8Los Angeles-Riverside-Orange County,CA CMSA . . . . . . . . . . . . . . . . . . . . 135,100 139,800 146,400 187,500 196,100 211,200 2,025 2,050 2,060 1,760 1,820 1,875 25.2 23.4 24.3 24.0 22.5 22.6Miami-Fort Lauderdale, FL CMSA . . . . . 122,000 131,500 127,600 138,800 142,300 143,000 2,455 2,475 2,195 2,260 2,185 2,085 10.8 11.2 9.6 9.5 10.4 7.7Minneapolis-St. Paul, MN-WI MSA 1. . . . 133,500 155,600 152,600 155,100 173,800 173,900 1,945 2,000 1,920 1,880 2,030 1,820 11.9 10.6 9.6 10.4 8.8 8.7New Orleans, LA MSA 1. . . . . . . . . . . . 92,000 99,200 131,200 92,600 123,600 149,900 2,020 2,215 2,330 1,865 2,045 2,210 1.3 1.6 1.7 1.3 1.5 1.6New York-Northern NJ- Long Island,NY-NJ-CT-PA, CMSA 1. . . . . . . . . . . . 194,200 191,400 192,300 247,400 226,700 252,300 2,245 2,290 2,450 2,060 2,140 2,165 17.1 17.9 18.1 9.3 9.5 11.3Norfolk-Virginia Beach- Newport News,VA-NC MSA 1. . . . . . . . . . . . . . . . . . 113,800 120,200 127,200 128,800 129,600 140,900 2,220 2,195 2,275 2,165 2,245 2,260 6.7 6.0 5.2 5.7 4.9 4.3Orlando, FL MSA 1 . . . . . . . . . . . . . . . 105,800 107,500 108,000 129,300 122,800 127,100 2,165 1,925 1,965 1,935 1,725 1,795 8.2 10.5 10.2 8.0 10.5 9.7Phoenix-Mesa, AZ MSA 1. . . . . . . . . . . 114,800 113,900 125,500 128,700 136,700 149,200 2,445 2,260 2,190 2,275 2,180 2,015 17.8 21.9 23.8 17.5 21.7 22.7
Sacramento-Yolo, CA CMSA. . . . . . . . . 152,100 144,000 143,300 167,400 158,100 160,200 1,685 1,640 1,650 1,610 1,540 1,560 5.9 6.5 6.8 5.4 6.2 6.5St. Louis, MO-IL MSA 1 . . . . . . . . . . . . 129,100 144,500 144,400 155,500 153,900 166,500 2,195 2,080 2,175 1,995 1,995 2,090 4.5 6.9 6.0 4.5 6.7 5.6Salt Lake City-Ogden, UT MSA. . . . . . . 83,800 100,300 113,300 114,300 119,500 129,100 1,740 1,765 1,695 1,400 1,545 1,545 5.2 6.5 5.0 5.2 6.5 5.0San Antonio, TX MSA 1 . . . . . . . . . . . . 96,300 117,900 119,800 109,200 119,900 131,200 2,225 2,345 2,320 2,145 2,375 2,300 2.0 3.0 3.8 2.0 2.9 3.7San Diego, CA MSA . . . . . . . . . . . . . . 234,400 225,000 212,800 239,700 246,000 237,600 2,335 2,410 2,320 2,200 2,375 2,245 4.1 3.8 5.1 4.1 3.5 4.8Seattle-Tacoma-Bremerton, WA CMSA 1 . 167,800 159,700 165,300 182,200 181,700 191,300 2,150 2,050 2,055 2,060 1,885 1,960 8.7 10.8 10.3 8.2 10.1 9.3Tampa-St. Petersburg-Clearwater,FL MSA . . . . . . . . . . . . . . . . . . . . . 109,600 113,700 126,300 120,100 126,100 132,700 2,250 2,325 2,400 2,135 2,240 2,260 7.2 8.4 8.2 6.2 7.6 7.2Tucson, AZ MSA . . . . . . . . . . . . . . . . 106,800 106,600 131,900 125,200 123,400 152,800 1,990 1,900 2,000 1,875 1,810 1,870 3.3 3.8 4.2 3.0 3.5 3.9Washington-Baltimore, DC-MD-VACMSA 2. . . . . . . . . . . . . . . . . . . . . . (NA) 184,400 182,600 (NA) 205,500 207,800 (NA) 2,470 2,435 (NA) 2,305 2,270 26.0 31.1 28.3 15.9 19.3 16.7
Baltimore, MD PMSA. . . . . . . . . . . . 152,500 161,400 157,400 169,200 202,200 207,400 2,305 2,440 2,435 2,115 2,080 2,060 7.3 9.5 8.4 4.4 5.7 4.9Washington, DC-MD-VA-WV PMSA 1 . 185,100 196,500 197,500 211,300 207,000 207,900 2,425 2,480 2,435 2,285 2,395 2,365 18.7 21.2 19.5 11.5 13.4 11.6West Palm Beach-Boca Raton,FL MSA . . . . . . . . . . . . . . . . . . . . 144,900 158,400 137,000 (S) 178,300 165,200 2,500 2,305 2,205 2,210 2,150 2,050 4.4 5.6 3.5 3.8 4.6 3.3
NANot available. S Withheld because estimate did not meet publication standards. 1 Beginning 1993, data reflect the new metropolitan area definition. 2 This is a newly created CMSA. Data prior to 1993are not available.
Source: U.S. Bureau of the Census, Current Construction Reports, series C21.
New
One-F
amily
Houses
Sold
715
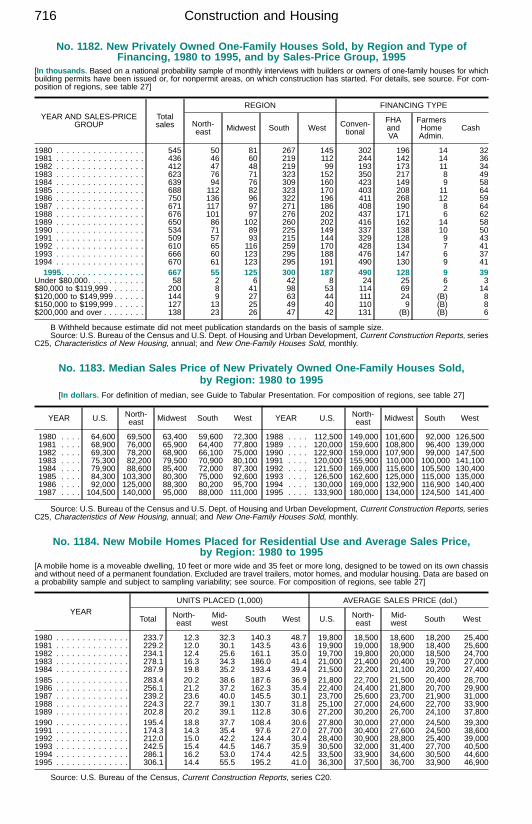
No. 1182. New Privately Owned One-Family Houses Sold, by Region and Type ofFinancing, 1980 to 1995, and by Sales-Price Group, 1995
[In thousands. Based on a national probability sample of monthly interviews with builders or owners of one-family houses for whichbuilding permits have been issued or, for nonpermit areas, on which construction has started. For details, see source. For com-position of regions, see table 27]
YEAR AND SALES-PRICEGROUP
Totalsales
REGION FINANCING TYPE
North-east Midwest South West Conven-
tional
FHAandVA
FarmersHomeAdmin.
Cash
1980 . . . . . . . . . . . . . . . . . 545 50 81 267 145 302 196 14 321981 . . . . . . . . . . . . . . . . . 436 46 60 219 112 244 142 14 361982 . . . . . . . . . . . . . . . . . 412 47 48 219 99 193 173 11 341983 . . . . . . . . . . . . . . . . . 623 76 71 323 152 350 217 8 491984 . . . . . . . . . . . . . . . . . 639 94 76 309 160 423 149 9 581985 . . . . . . . . . . . . . . . . . 688 112 82 323 170 403 208 11 641986 . . . . . . . . . . . . . . . . . 750 136 96 322 196 411 268 12 591987 . . . . . . . . . . . . . . . . . 671 117 97 271 186 408 190 8 641988 . . . . . . . . . . . . . . . . . 676 101 97 276 202 437 171 6 621989 . . . . . . . . . . . . . . . . . 650 86 102 260 202 416 162 14 581990 . . . . . . . . . . . . . . . . . 534 71 89 225 149 337 138 10 501991 . . . . . . . . . . . . . . . . . 509 57 93 215 144 329 128 9 431992 . . . . . . . . . . . . . . . . . 610 65 116 259 170 428 134 7 411993 . . . . . . . . . . . . . . . . . 666 60 123 295 188 476 147 6 371994 . . . . . . . . . . . . . . . . . 670 61 123 295 191 490 130 9 411995. . . . . . . . . . . . . . . . 667 55 125 300 187 490 128 9 39
Under $80,000. . . . . . . . . . . 58 2 6 42 8 24 25 6 3$80,000 to $119,999 . . . . . . . 200 8 41 98 53 114 69 2 14$120,000 to $149,999 . . . . . . 144 9 27 63 44 111 24 (B) 8$150,000 to $199,999 . . . . . . 127 13 25 49 40 110 9 (B) 8$200,000 and over . . . . . . . . 138 23 26 47 42 131 (B) (B) 6
B Withheld because estimate did not meet publication standards on the basis of sample size.Source: U.S. Bureau of the Census and U.S. Dept. of Housing and Urban Development, Current Construction Reports, series
C25, Characteristics of New Housing, annual; and New One-Family Houses Sold, monthly.
No. 1183. Median Sales Price of New Privately Owned One-Family Houses Sold,by Region: 1980 to 1995
[In dollars. For definition of median, see Guide to Tabular Presentation. For composition of regions, see table 27]
YEAR U.S. North-east Midwest South West
1980 . . . . 64,600 69,500 63,400 59,600 72,3001981 . . . . 68,900 76,000 65,900 64,400 77,8001982 . . . . 69,300 78,200 68,900 66,100 75,0001983 . . . . 75,300 82,200 79,500 70,900 80,1001984 . . . . 79,900 88,600 85,400 72,000 87,3001985 . . . . 84,300 103,300 80,300 75,000 92,6001986 . . . . 92,000 125,000 88,300 80,200 95,7001987 . . . . 104,500 140,000 95,000 88,000 111,000
YEAR U.S. North-east Midwest South West
1988 . . . . 112,500 149,000 101,600 92,000 126,5001989 . . . . 120,000 159,600 108,800 96,400 139,0001990 . . . . 122,900 159,000 107,900 99,000 147,5001991 . . . . 120,000 155,900 110,000 100,000 141,1001992 . . . . 121,500 169,000 115,600 105,500 130,4001993 . . . . 126,500 162,600 125,000 115,000 135,0001994 . . . . 130,000 169,000 132,900 116,900 140,4001995 . . . . 133,900 180,000 134,000 124,500 141,400
Source: U.S. Bureau of the Census and U.S. Dept. of Housing and Urban Development, Current Construction Reports, seriesC25, Characteristics of New Housing, annual; and New One-Family Houses Sold, monthly.
No. 1184. New Mobile Homes Placed for Residential Use and Average Sales Price,by Region: 1980 to 1995
[A mobile home is a moveable dwelling, 10 feet or more wide and 35 feet or more long, designed to be towed on its own chassisand without need of a permanent foundation. Excluded are travel trailers, motor homes, and modular housing. Data are based ona probability sample and subject to sampling variability; see source. For composition of regions, see table 27]
YEARUNITS PLACED (1,000) AVERAGE SALES PRICE (dol.)
Total North-east
Mid-west South West U.S. North-
eastMid-west South West
1980 . . . . . . . . . . . . . . 233.7 12.3 32.3 140.3 48.7 19,800 18,500 18,600 18,200 25,4001981 . . . . . . . . . . . . . . 229.2 12.0 30.1 143.5 43.6 19,900 19,000 18,900 18,400 25,6001982 . . . . . . . . . . . . . . 234.1 12.4 25.6 161.1 35.0 19,700 19,800 20,000 18,500 24,7001983 . . . . . . . . . . . . . . 278.1 16.3 34.3 186.0 41.4 21,000 21,400 20,400 19,700 27,0001984 . . . . . . . . . . . . . . 287.9 19.8 35.2 193.4 39.4 21,500 22,200 21,100 20,200 27,4001985 . . . . . . . . . . . . . . 283.4 20.2 38.6 187.6 36.9 21,800 22,700 21,500 20,400 28,7001986 . . . . . . . . . . . . . . 256.1 21.2 37.2 162.3 35.4 22,400 24,400 21,800 20,700 29,9001987 . . . . . . . . . . . . . . 239.2 23.6 40.0 145.5 30.1 23,700 25,600 23,700 21,900 31,0001988 . . . . . . . . . . . . . . 224.3 22.7 39.1 130.7 31.8 25,100 27,000 24,600 22,700 33,9001989 . . . . . . . . . . . . . . 202.8 20.2 39.1 112.8 30.6 27,200 30,200 26,700 24,100 37,8001990 . . . . . . . . . . . . . . 195.4 18.8 37.7 108.4 30.6 27,800 30,000 27,000 24,500 39,3001991 . . . . . . . . . . . . . . 174.3 14.3 35.4 97.6 27.0 27,700 30,400 27,600 24,500 38,6001992 . . . . . . . . . . . . . . 212.0 15.0 42.2 124.4 30.4 28,400 30,900 28,800 25,400 39,0001993 . . . . . . . . . . . . . . 242.5 15.4 44.5 146.7 35.9 30,500 32,000 31,400 27,700 40,5001994 . . . . . . . . . . . . . . 286.1 16.2 53.0 174.4 42.5 33,500 33,900 34,600 30,500 44,6001995 . . . . . . . . . . . . . . 306.1 14.4 55.5 195.2 41.0 36,300 37,500 36,700 33,900 46,900
Source: U.S. Bureau of the Census, Current Construction Reports, series C20.
Construction and Housing716
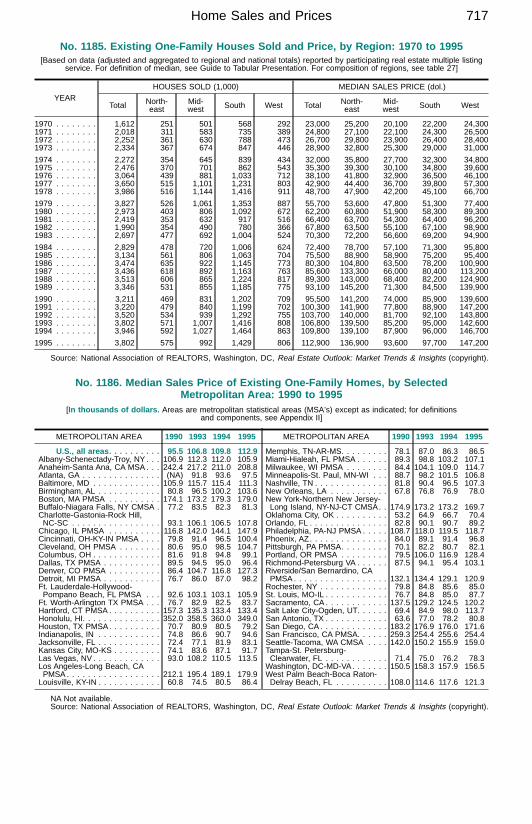
No. 1185. Existing One-Family Houses Sold and Price, by Region: 1970 to 1995[Based on data (adjusted and aggregated to regional and national totals) reported by participating real estate multiple listing
service. For definition of median, see Guide to Tabular Presentation. For composition of regions, see table 27]
YEARHOUSES SOLD (1,000) MEDIAN SALES PRICE (dol.)
Total North-east
Mid-west South West Total North-
eastMid-west South West
1970 . . . . . . . . 1,612 251 501 568 292 23,000 25,200 20,100 22,200 24,3001971 . . . . . . . . 2,018 311 583 735 389 24,800 27,100 22,100 24,300 26,5001972 . . . . . . . . 2,252 361 630 788 473 26,700 29,800 23,900 26,400 28,4001973 . . . . . . . . 2,334 367 674 847 446 28,900 32,800 25,300 29,000 31,000
1974 . . . . . . . . 2,272 354 645 839 434 32,000 35,800 27,700 32,300 34,8001975 . . . . . . . . 2,476 370 701 862 543 35,300 39,300 30,100 34,800 39,6001976 . . . . . . . . 3,064 439 881 1,033 712 38,100 41,800 32,900 36,500 46,1001977 . . . . . . . . 3,650 515 1,101 1,231 803 42,900 44,400 36,700 39,800 57,3001978 . . . . . . . . 3,986 516 1,144 1,416 911 48,700 47,900 42,200 45,100 66,700
1979 . . . . . . . . 3,827 526 1,061 1,353 887 55,700 53,600 47,800 51,300 77,4001980 . . . . . . . . 2,973 403 806 1,092 672 62,200 60,800 51,900 58,300 89,3001981 . . . . . . . . 2,419 353 632 917 516 66,400 63,700 54,300 64,400 96,2001982 . . . . . . . . 1,990 354 490 780 366 67,800 63,500 55,100 67,100 98,9001983 . . . . . . . . 2,697 477 692 1,004 524 70,300 72,200 56,600 69,200 94,900
1984 . . . . . . . . 2,829 478 720 1,006 624 72,400 78,700 57,100 71,300 95,8001985 . . . . . . . . 3,134 561 806 1,063 704 75,500 88,900 58,900 75,200 95,4001986 . . . . . . . . 3,474 635 922 1,145 773 80,300 104,800 63,500 78,200 100,9001987 . . . . . . . . 3,436 618 892 1,163 763 85,600 133,300 66,000 80,400 113,2001988 . . . . . . . . 3,513 606 865 1,224 817 89,300 143,000 68,400 82,200 124,9001989 . . . . . . . . 3,346 531 855 1,185 775 93,100 145,200 71,300 84,500 139,900
1990 . . . . . . . . 3,211 469 831 1,202 709 95,500 141,200 74,000 85,900 139,6001991 . . . . . . . . 3,220 479 840 1,199 702 100,300 141,900 77,800 88,900 147,2001992 . . . . . . . . 3,520 534 939 1,292 755 103,700 140,000 81,700 92,100 143,8001993 . . . . . . . . 3,802 571 1,007 1,416 808 106,800 139,500 85,200 95,000 142,6001994 . . . . . . . . 3,946 592 1,027 1,464 863 109,800 139,100 87,900 96,000 146,700
1995 . . . . . . . . 3,802 575 992 1,429 806 112,900 136,900 93,600 97,700 147,200
Source: National Association of REALTORS, Washington, DC, Real Estate Outlook: Market Trends & Insights (copyright).
No. 1186. Median Sales Price of Existing One-Family Homes, by SelectedMetropolitan Area: 1990 to 1995
[In thousands of dollars. Areas are metropolitan statistical areas (MSA’s) except as indicated; for definitionsand components, see Appendix II]
METROPOLITAN AREA 1990 1993 1994 1995
U.S., all areas . . . . . . . . . . 95.5 106.8 109.8 112.9Albany-Schenectady-Troy, NY . . . 106.9 112.3 112.0 105.9Anaheim-Santa Ana, CA MSA . . . 242.4 217.2 211.0 208.8Atlanta, GA . . . . . . . . . . . . . . . (NA) 91.8 93.6 97.5Baltimore, MD . . . . . . . . . . . . . 105.9 115.7 115.4 111.3Birmingham, AL . . . . . . . . . . . . 80.8 96.5 100.2 103.6Boston, MA PMSA . . . . . . . . . . 174.1 173.2 179.3 179.0Buffalo-Niagara Falls, NY CMSA . 77.2 83.5 82.3 81.3Charlotte-Gastonia-Rock Hill,NC-SC . . . . . . . . . . . . . . . . . 93.1 106.1 106.5 107.8Chicago, IL PMSA . . . . . . . . . . 116.8 142.0 144.1 147.9Cincinnati, OH-KY-IN PMSA . . . . 79.8 91.4 96.5 100.4Cleveland, OH PMSA . . . . . . . . 80.6 95.0 98.5 104.7Columbus, OH . . . . . . . . . . . . . 81.6 91.8 94.8 99.1Dallas, TX PMSA . . . . . . . . . . . 89.5 94.5 95.0 96.4Denver, CO PMSA . . . . . . . . . . 86.4 104.7 116.8 127.3Detroit, MI PMSA . . . . . . . . . . . 76.7 86.0 87.0 98.2Ft. Lauderdale-Hollywood-Pompano Beach, FL PMSA . . . 92.6 103.1 103.1 105.9Ft. Worth-Arlington TX PMSA . . . 76.7 82.9 82.5 83.7Hartford, CT PMSA . . . . . . . . . . 157.3 135.3 133.4 133.4Honolulu, HI. . . . . . . . . . . . . . . 352.0 358.5 360.0 349.0Houston, TX PMSA. . . . . . . . . . 70.7 80.9 80.5 79.2Indianapolis, IN . . . . . . . . . . . . 74.8 86.6 90.7 94.6Jacksonville, FL . . . . . . . . . . . . 72.4 77.1 81.9 83.1Kansas City, MO-KS . . . . . . . . . 74.1 83.6 87.1 91.7Las Vegas, NV . . . . . . . . . . . . . 93.0 108.2 110.5 113.5Los Angeles-Long Beach, CAPMSA . . . . . . . . . . . . . . . . . . 212.1 195.4 189.1 179.9Louisville, KY-IN . . . . . . . . . . . . 60.8 74.5 80.5 86.4
METROPOLITAN AREA 1990 1993 1994 1995
Memphis, TN-AR-MS. . . . . . . . . 78.1 87.0 86.3 86.5Miami-Hialeah, FL PMSA . . . . . . 89.3 98.8 103.2 107.1Milwaukee, WI PMSA . . . . . . . . 84.4 104.1 109.0 114.7Minneapolis-St. Paul, MN-WI . . . 88.7 98.2 101.5 106.8Nashville, TN . . . . . . . . . . . . . . 81.8 90.4 96.5 107.3New Orleans, LA . . . . . . . . . . . 67.8 76.8 76.9 78.0New York-Northern New Jersey-Long Island, NY-NJ-CT CMSA. . 174.9 173.2 173.2 169.7Oklahoma City, OK . . . . . . . . . . 53.2 64.9 66.7 70.4Orlando, FL . . . . . . . . . . . . . . . 82.8 90.1 90.7 89.2Philadelphia, PA-NJ PMSA . . . . . 108.7 118.0 119.5 118.7Phoenix, AZ. . . . . . . . . . . . . . . 84.0 89.1 91.4 96.8Pittsburgh, PA PMSA. . . . . . . . . 70.1 82.2 80.7 82.1Portland, OR PMSA . . . . . . . . . 79.5 106.0 116.9 128.4Richmond-Petersburg VA . . . . . . 87.5 94.1 95.4 103.1Riverside/San Bernardino, CAPMSA . . . . . . . . . . . . . . . . . . 132.1 134.4 129.1 120.9Rochester, NY . . . . . . . . . . . . . 79.8 84.8 85.6 85.0St. Louis, MO-IL . . . . . . . . . . . . 76.7 84.8 85.0 87.7Sacramento, CA . . . . . . . . . . . . 137.5 129.2 124.5 120.2Salt Lake City-Ogden, UT. . . . . . 69.4 84.9 98.0 113.7San Antonio, TX . . . . . . . . . . . . 63.6 77.0 78.2 80.8San Diego, CA . . . . . . . . . . . . . 183.2 176.9 176.0 171.6San Francisco, CA PMSA. . . . . . 259.3 254.4 255.6 254.4Seattle-Tacoma, WA CMSA . . . . 142.0 150.2 155.9 159.0Tampa-St. Petersburg-Clearwater, FL . . . . . . . . . . . . 71.4 75.0 76.2 78.3Washington, DC-MD-VA. . . . . . . 150.5 158.3 157.9 156.5West Palm Beach-Boca Raton-Delray Beach, FL . . . . . . . . . . 108.0 114.6 117.6 121.3
NA Not available.Source: National Association of REALTORS, Washington, DC, Real Estate Outlook: Market Trends & Insights (copyright).
Home Sales and Prices 717
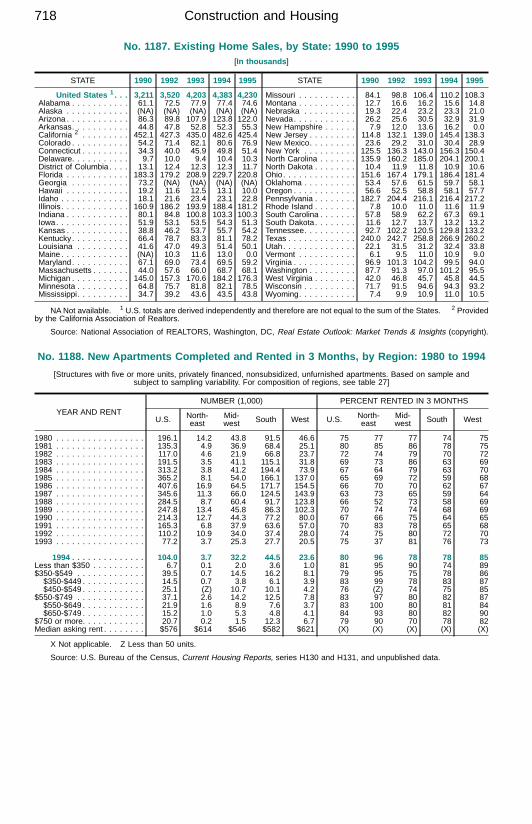
No. 1187. Existing Home Sales, by State: 1990 to 1995[In thousands ]
STATE 1990 1992 1993 1994 1995
United States 1 . . . 3,211 3,520 4,203 4,383 4,230Alabama . . . . . . . . . . . 61.1 72.5 77.9 77.4 74.6Alaska . . . . . . . . . . . . (NA) (NA) (NA) (NA) (NA)Arizona . . . . . . . . . . . . 86.3 89.8 107.9 123.8 122.0Arkansas. . . . . . . . . . . 44.8 47.8 52.8 52.3 55.3California 2 . . . . . . . . . 452.1 427.3 435.0 482.6 425.4Colorado . . . . . . . . . . . 54.2 71.4 82.1 80.6 76.9Connecticut . . . . . . . . . 34.3 40.0 45.9 49.8 51.4Delaware. . . . . . . . . . . 9.7 10.0 9.4 10.4 10.3District of Columbia. . . . 13.1 12.4 12.3 12.3 11.7Florida . . . . . . . . . . . . 183.3 179.2 208.9 229.7 220.8Georgia . . . . . . . . . . . 73.2 (NA) (NA) (NA) (NA)Hawaii . . . . . . . . . . . . 19.2 11.6 12.5 13.1 10.0Idaho . . . . . . . . . . . . . 18.1 21.6 23.4 23.1 22.8Illinois . . . . . . . . . . . . . 160.9 186.2 193.9 188.4 181.2Indiana . . . . . . . . . . . . 80.1 84.8 100.8 103.3 100.3Iowa. . . . . . . . . . . . . . 51.9 53.1 53.5 54.3 51.3Kansas . . . . . . . . . . . . 38.8 46.2 53.7 55.7 54.2Kentucky. . . . . . . . . . . 66.4 78.7 83.3 81.1 78.2Louisiana . . . . . . . . . . 41.6 47.0 49.3 51.4 50.1Maine . . . . . . . . . . . . . (NA) 10.3 11.6 13.0 0.0Maryland. . . . . . . . . . . 67.1 69.0 73.4 69.5 59.2Massachusetts . . . . . . . 44.0 57.6 66.0 68.7 68.1Michigan . . . . . . . . . . . 145.0 157.3 170.6 184.2 176.3Minnesota . . . . . . . . . . 64.8 75.7 81.8 82.1 78.5Mississippi. . . . . . . . . . 34.7 39.2 43.6 43.5 43.8
STATE 1990 1992 1993 1994 1995
Missouri . . . . . . . . . . . 84.1 98.8 106.4 110.2 108.3Montana . . . . . . . . . . . 12.7 16.6 16.2 15.6 14.8Nebraska . . . . . . . . . . 19.3 22.4 23.2 23.3 21.0Nevada. . . . . . . . . . . . 26.2 25.6 30.5 32.9 31.9New Hampshire . . . . . . 7.9 12.0 13.6 16.2 0.0New Jersey . . . . . . . . . 114.8 132.1 139.0 145.4 138.3New Mexico. . . . . . . . . 23.6 29.2 31.0 30.4 28.9New York . . . . . . . . . . 125.5 136.3 143.0 156.3 150.4North Carolina . . . . . . . 135.9 160.2 185.0 204.1 200.1North Dakota . . . . . . . . 10.4 11.9 11.8 10.9 10.6Ohio. . . . . . . . . . . . . . 151.6 167.4 179.1 186.4 181.4Oklahoma . . . . . . . . . . 53.4 57.6 61.5 59.7 58.1Oregon . . . . . . . . . . . . 56.6 52.5 58.8 58.1 57.7Pennsylvania . . . . . . . . 182.7 204.4 216.1 216.4 217.2Rhode Island . . . . . . . . 7.8 10.0 11.0 11.6 11.9South Carolina . . . . . . . 57.8 58.9 62.2 67.3 69.1South Dakota. . . . . . . . 11.6 12.7 13.7 13.2 13.2Tennessee. . . . . . . . . . 92.7 102.2 120.5 129.8 133.2Texas . . . . . . . . . . . . . 240.0 242.7 258.8 266.9 260.2Utah. . . . . . . . . . . . . . 22.1 31.5 31.2 32.4 33.8Vermont . . . . . . . . . . . 6.1 9.5 11.0 10.9 9.0Virginia . . . . . . . . . . . . 96.9 101.3 104.2 99.5 94.0Washington . . . . . . . . . 87.7 91.3 97.0 101.2 95.5West Virginia . . . . . . . . 42.0 46.8 45.7 45.8 44.5Wisconsin . . . . . . . . . . 71.7 91.5 94.6 94.3 93.2Wyoming. . . . . . . . . . . 7.4 9.9 10.9 11.0 10.5
NA Not available. 1 U.S. totals are derived independently and therefore are not equal to the sum of the States. 2 Providedby the California Association of Realtors.
Source: National Association of REALTORS, Washington, DC, Real Estate Outlook: Market Trends & Insights (copyright).
No. 1188. New Apartments Completed and Rented in 3 Months, by Region: 1980 to 1994
[Structures with five or more units, privately financed, nonsubsidized, unfurnished apartments. Based on sample andsubject to sampling variability. For composition of regions, see table 27]
YEAR AND RENTNUMBER (1,000) PERCENT RENTED IN 3 MONTHS
U.S. North-east
Mid-west South West U.S. North-
eastMid-west South West
1980 . . . . . . . . . . . . . . . . . 196.1 14.2 43.8 91.5 46.6 75 77 77 74 751981 . . . . . . . . . . . . . . . . . 135.3 4.9 36.9 68.4 25.1 80 85 86 78 751982 . . . . . . . . . . . . . . . . . 117.0 4.6 21.9 66.8 23.7 72 74 79 70 721983 . . . . . . . . . . . . . . . . . 191.5 3.5 41.1 115.1 31.8 69 73 86 63 691984 . . . . . . . . . . . . . . . . . 313.2 3.8 41.2 194.4 73.9 67 64 79 63 701985 . . . . . . . . . . . . . . . . . 365.2 8.1 54.0 166.1 137.0 65 69 72 59 681986 . . . . . . . . . . . . . . . . . 407.6 16.9 64.5 171.7 154.5 66 70 70 62 671987 . . . . . . . . . . . . . . . . . 345.6 11.3 66.0 124.5 143.9 63 73 65 59 641988 . . . . . . . . . . . . . . . . . 284.5 8.7 60.4 91.7 123.8 66 52 73 58 691989 . . . . . . . . . . . . . . . . . 247.8 13.4 45.8 86.3 102.3 70 74 74 68 691990 . . . . . . . . . . . . . . . . . 214.3 12.7 44.3 77.2 80.0 67 66 75 64 651991 . . . . . . . . . . . . . . . . . 165.3 6.8 37.9 63.6 57.0 70 83 78 65 681992 . . . . . . . . . . . . . . . . . 110.2 10.9 34.0 37.4 28.0 74 75 80 72 701993 . . . . . . . . . . . . . . . . . 77.2 3.7 25.3 27.7 20.5 75 37 81 76 73
1994 . . . . . . . . . . . . . . 104.0 3.7 32.2 44.5 23.6 80 96 78 78 85Less than $350 . . . . . . . . . . 6.7 0.1 2.0 3.6 1.0 81 95 90 74 89$350-$549 . . . . . . . . . . . . . 39.5 0.7 14.5 16.2 8.1 79 95 75 78 86$350-$449 . . . . . . . . . . . . 14.5 0.7 3.8 6.1 3.9 83 99 78 83 87$450-$549 . . . . . . . . . . . . 25.1 (Z) 10.7 10.1 4.2 76 (Z) 74 75 85
$550-$749 . . . . . . . . . . . . . 37.1 2.6 14.2 12.5 7.8 83 97 80 82 87$550-$649 . . . . . . . . . . . . 21.9 1.6 8.9 7.6 3.7 83 100 80 81 84$650-$749 . . . . . . . . . . . . 15.2 1.0 5.3 4.8 4.1 84 93 80 82 90
$750 or more. . . . . . . . . . . . 20.7 0.2 1.5 12.3 6.7 79 90 70 78 82Median asking rent . . . . . . . . $576 $614 $546 $582 $621 (X) (X) (X) (X) (X)
X Not applicable. Z Less than 50 units.
Source: U.S. Bureau of the Census, Current Housing Reports, series H130 and H131, and unpublished data.
Construction and Housing718

No. 1189. Housing Units—Historical Trends for Selected Characteristics: 1950 to 1993[As of April 1, except 1993, as of fall. Based on the Census of Population and Housing and
American Housing Survey; see Appendix III]
CHARACTERISTICNUMBER OF UNITS PERCENT DISTRIBUTION
1950 1960 1970 1980 1990 1993 1950 1960 1970 1980 1990 1993
UNITS IN STRUCTUREAll housing units 1 . . . . . 45,983 58,315 67,699 86,759 102,264 106,611 100.0 100.0 100.0 100.0 100.0 100.0
1 detached . . . . . . . . . . . . 29,116 40,103 44,801 53,596 60,383 64,283 63.3 68.8 66.2 61.8 59.0 60.31 attached . . . . . . . . . . . . . 22,799 3,655 1,990 3,587 5,378 6,079 26.1 6.3 2.9 4.1 5.3 5.72 . . . . . . . . . . . . . . . . . . . 5,302 4,464 5,444 5,309 4,948 (3) 11.5 7.7 8.0 6.1 4.8 (3)3 or 4 . . . . . . . . . . . . . . . . 3,374 3,088 3,563 4,373 4,928 3 10,732 7.3 5.3 5.3 5.0 4.8 310.15 or more . . . . . . . . . . . . . 5,078 6,238 9,829 15,478 18,105 18,444 11.0 10.7 14.5 17.8 17.7 17.3Mobile home or trailer . . . . . 315 767 2,073 4,416 7,400 7,072 0.7 1.3 3.1 5.1 7.2 6.6Other . . . . . . . . . . . . . . . . (NA) (NA) (NA) (NA) 1,121 (NA) (NA) (NA) (NA) (NA) 1.1 (NA)PLUMBING FACILITIESAll housing units 1 . . . . . 44,502 58,315 67,657 86,693 102,264 106,611 100.0 100.0 100.0 100.0 100.0 100.0
Complete plumbing facilities . 28,729 48,537 62,984 84,359 101,162 104,302 64.6 83.2 93.1 97.3 98.9 97.8Lacking completeplumbing facilities . . . . . . . 15,773 9,778 4,672 2,334 1,102 1,854 35.4 16.8 6.9 2.7 1.1 1.7Not reported . . . . . . . . . . . 1,481 (NA) (NA) (NA) (NA) (NA) (X) (NA) (NA) (NA) (NA) (NA)
TELEPHONE INHOUSING UNIT 4
Occupied housing units . 41,829 53,024 63,450 80,390 91,947 94,724 (NA) 100.0 100.0 100.0 100.0 100.0With telephone . . . . . . . . . . (NA) 41,618 55,177 74,720 87,130 88,442 (NA) 78.5 87.0 92.9 94.8 93.4No telephone . . . . . . . . . . . (NA) 11,406 8,273 5,670 4,817 6,282 (NA) 21.5 13.0 7.1 5.2 6.6
NANot available. X Not applicable. 1 Data for 1970 and 1980 are ‘‘Year-round housing units,’’ which exclude seasonal andmigratory vacant units. 2 Includes 1,588,902 units classified as ‘‘1 and 2 dwelling unit.’’ 3 Structures with ‘‘2 units’’ included withunits of ‘‘3 or 4.’’ 4 Beginning 1980, data are not completely comparable with earlier years due to change in question asked.
Source: U.S. Bureau of the Census, 1990 Census of Housing, series CH-1, and earlier census reports; and Current HousingReports, series H150/93, American Housing Survey in the United States.
No. 1190. Occupied Housing Units—Tenure, by Race of Householder: 1920 to 1993[In thousands, except as indicated. As of April 1, except 1991, as of fall. Prior to 1960, excludes Alaska and Hawaii. Statisticson the number of occupied units are essentially comparable although identified by various terms. See also Historical Statistics,Colonial Times to 1970, series N 238-245]
RACE AND TENURE 1920 1930 1940 1950 1960 1970 1980 1990 1993
ALL RACESOccupied units, total . . . . . . . . 24,352 29,905 34,855 42,826 53,024 63,445 80,390 91,947 94,724
Owner occupied. . . . . . . . . . . . . . . . 11,114 14,280 15,196 23,560 32,797 39,886 51,795 59,025 61,252Percent of occupied . . . . . . . . . . . 45.6 47.8 43.6 55.0 61.9 62.9 64.4 64.2 64.7
Renter occupied. . . . . . . . . . . . . . . . 13,238 15,624 19,659 19,266 20,227 23,560 28,595 32,923 33,472WHITE
Occupied units, total . . . . . . . . 21,826 26,983 31,561 39,044 47,880 56,606 68,810 76,880 80,029Owner occupied. . . . . . . . . . . . . . . . 10,511 13,544 14,418 22,241 30,823 37,005 46,671 52,433 54,878Percent of occupied . . . . . . . . . . . 48.2 50.2 45.7 57.0 64.4 65.4 67.8 68.2 68.6
Renter occupied. . . . . . . . . . . . . . . . 11,315 13,439 17,143 16,803 17,057 19,601 22,139 24,447 25,151BLACK AND OTHER
Occupied units, total . . . . . . . . 2,526 2,922 3,293 3,783 5,144 6,839 11,580 15,067 14,695Owner occupied. . . . . . . . . . . . . . . . 603 737 778 1,319 1,974 2,881 5,124 6,592 6,374Percent of occupied . . . . . . . . . . . 23.9 25.2 23.6 34.9 38.4 42.1 44.2 43.8 43.4
Renter occupied. . . . . . . . . . . . . . . . 1,923 2,185 2,516 2,464 3,170 3,959 6,456 8,475 8,321
Source: U.S. Bureau of the Census, Census of Housing: 1960, vol. 1; 1970, vol. 1; 1980 Census of Housing, vol. 1, chapterA (HC80-1-A); and 1990 Census of Housing, General Housing Characteristics, series CH-90-1; 1993 data, Current HousingReports, series H150/93, American Housing Survey in the United States.
No. 1191. Occupied Housing Units—Tenure, by Race and Hispanic Origin ofHouseholder: 1980 and 1990
[As of April 1 . Based on the Census of Population and Housing; see Appendix III]
RACE AND HISPANICORIGIN
OF HOUSEHOLDER
ALL HOUSEHOLDS OWNEROCCUPIED
PERCENTOWNER
OCCUPIED
RENTEROCCUPIED
1980 1990
Percentchange,1980-1990
1980 1990 1980 1990 1980 1990
Total units . . . . . . . 80,389,673 91,947,410 14.4 51,794,545 59,024,811 64.4 64.2 28,595,128 32,922,599White . . . . . . . . . . . . . . 68,810,123 76,880,105 11.7 46,670,775 52,432,648 67.8 68.2 22,139,348 24,447,457Black . . . . . . . . . . . . . . 8,381,668 9,976,161 19.0 3,724,251 4,327,265 44.4 43.4 4,657,417 5,648,896American Indian, Eskimo,or Aleut. . . . . . . . . . . . 397,252 591,372 48.9 212,209 318,001 53.4 53.8 185,043 273,371Asian or Pacific Islander . 993,458 2,013,735 102.7 521,230 1,050,182 52.5 52.2 472,228 963,553Other race . . . . . . . . . . 1,807,172 2,486,037 37.6 666,080 896,715 36.9 36.1 1,141,092 1,589,322Hispanic origin 1. . . . . . . 4,007,896 6,001,718 49.7 1,738,920 2,545,584 43.4 42.4 2,268,976 3,456,134
1 Persons of Hispanic origin may be of any race.U.S. Bureau of the Census, 1980 Census of Housing, vol. 1, chapter A (HC80-1-A); and 1990 Census of Housing, General
Housing Characteristics, series CH-90-1.
Housing Units—Tenure—Home Ownership 719
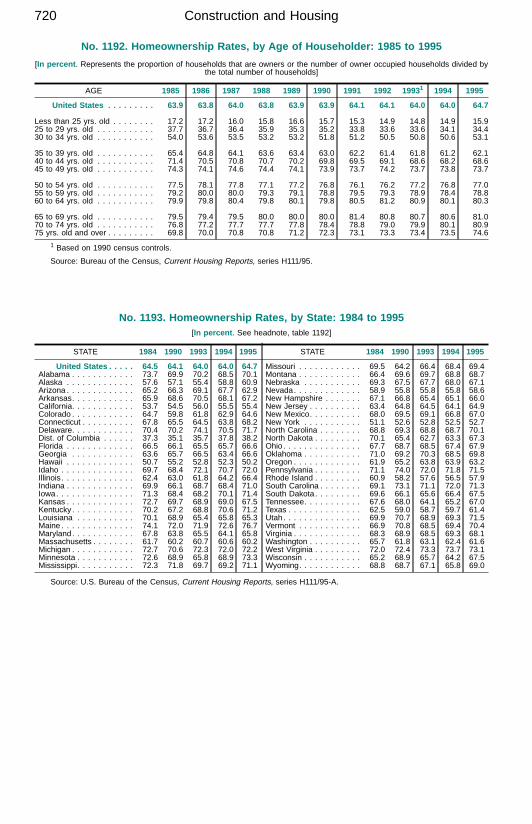
No. 1192. Homeownership Rates, by Age of Householder: 1985 to 1995
[In percent . Represents the proportion of households that are owners or the number of owner occupied households divided bythe total number of households]
AGE 1985 1986 1987 1988 1989 1990 1991 1992 19931 1994 1995
United States . . . . . . . . . 63.9 63.8 64.0 63.8 63.9 63.9 64.1 64.1 64.0 64.0 64.7
Less than 25 yrs. old . . . . . . . . 17.2 17.2 16.0 15.8 16.6 15.7 15.3 14.9 14.8 14.9 15.925 to 29 yrs. old . . . . . . . . . . . 37.7 36.7 36.4 35.9 35.3 35.2 33.8 33.6 33.6 34.1 34.430 to 34 yrs. old . . . . . . . . . . . 54.0 53.6 53.5 53.2 53.2 51.8 51.2 50.5 50.8 50.6 53.1
35 to 39 yrs. old . . . . . . . . . . . 65.4 64.8 64.1 63.6 63.4 63.0 62.2 61.4 61.8 61.2 62.140 to 44 yrs. old . . . . . . . . . . . 71.4 70.5 70.8 70.7 70.2 69.8 69.5 69.1 68.6 68.2 68.645 to 49 yrs. old . . . . . . . . . . . 74.3 74.1 74.6 74.4 74.1 73.9 73.7 74.2 73.7 73.8 73.7
50 to 54 yrs. old . . . . . . . . . . . 77.5 78.1 77.8 77.1 77.2 76.8 76.1 76.2 77.2 76.8 77.055 to 59 yrs. old . . . . . . . . . . . 79.2 80.0 80.0 79.3 79.1 78.8 79.5 79.3 78.9 78.4 78.860 to 64 yrs. old . . . . . . . . . . . 79.9 79.8 80.4 79.8 80.1 79.8 80.5 81.2 80.9 80.1 80.3
65 to 69 yrs. old . . . . . . . . . . . 79.5 79.4 79.5 80.0 80.0 80.0 81.4 80.8 80.7 80.6 81.070 to 74 yrs. old . . . . . . . . . . . 76.8 77.2 77.7 77.7 77.8 78.4 78.8 79.0 79.9 80.1 80.975 yrs. old and over . . . . . . . . . 69.8 70.0 70.8 70.8 71.2 72.3 73.1 73.3 73.4 73.5 74.6
1 Based on 1990 census controls.
Source: Bureau of the Census, Current Housing Reports, series H111/95.
No. 1193. Homeownership Rates, by State: 1984 to 1995[In percent . See headnote, table 1192]
STATE 1984 1990 1993 1994 1995
United States . . . . . 64.5 64.1 64.0 64.0 64.7Alabama . . . . . . . . . . . . 73.7 69.9 70.2 68.5 70.1Alaska . . . . . . . . . . . . . 57.6 57.1 55.4 58.8 60.9Arizona . . . . . . . . . . . . . 65.2 66.3 69.1 67.7 62.9Arkansas. . . . . . . . . . . . 65.9 68.6 70.5 68.1 67.2California. . . . . . . . . . . . 53.7 54.5 56.0 55.5 55.4Colorado . . . . . . . . . . . . 64.7 59.8 61.8 62.9 64.6Connecticut . . . . . . . . . . 67.8 65.5 64.5 63.8 68.2Delaware. . . . . . . . . . . . 70.4 70.2 74.1 70.5 71.7Dist. of Columbia . . . . . . 37.3 35.1 35.7 37.8 38.2Florida . . . . . . . . . . . . . 66.5 66.1 65.5 65.7 66.6Georgia . . . . . . . . . . . . 63.6 65.7 66.5 63.4 66.6Hawaii . . . . . . . . . . . . . 50.7 55.2 52.8 52.3 50.2Idaho . . . . . . . . . . . . . . 69.7 68.4 72.1 70.7 72.0Illinois . . . . . . . . . . . . . . 62.4 63.0 61.8 64.2 66.4Indiana . . . . . . . . . . . . . 69.9 66.1 68.7 68.4 71.0Iowa. . . . . . . . . . . . . . . 71.3 68.4 68.2 70.1 71.4Kansas . . . . . . . . . . . . . 72.7 69.7 68.9 69.0 67.5Kentucky. . . . . . . . . . . . 70.2 67.2 68.8 70.6 71.2Louisiana . . . . . . . . . . . 70.1 68.9 65.4 65.8 65.3Maine . . . . . . . . . . . . . . 74.1 72.0 71.9 72.6 76.7Maryland. . . . . . . . . . . . 67.8 63.8 65.5 64.1 65.8Massachusetts . . . . . . . . 61.7 60.2 60.7 60.6 60.2Michigan . . . . . . . . . . . . 72.7 70.6 72.3 72.0 72.2Minnesota . . . . . . . . . . . 72.6 68.9 65.8 68.9 73.3Mississippi. . . . . . . . . . . 72.3 71.8 69.7 69.2 71.1
STATE 1984 1990 1993 1994 1995
Missouri . . . . . . . . . . . . 69.5 64.2 66.4 68.4 69.4Montana . . . . . . . . . . . . 66.4 69.6 69.7 68.8 68.7Nebraska . . . . . . . . . . . 69.3 67.5 67.7 68.0 67.1Nevada. . . . . . . . . . . . . 58.9 55.8 55.8 55.8 58.6New Hampshire . . . . . . . 67.1 66.8 65.4 65.1 66.0New Jersey . . . . . . . . . . 63.4 64.8 64.5 64.1 64.9New Mexico. . . . . . . . . . 68.0 69.5 69.1 66.8 67.0New York . . . . . . . . . . . 51.1 52.6 52.8 52.5 52.7North Carolina . . . . . . . . 68.8 69.3 68.8 68.7 70.1North Dakota . . . . . . . . . 70.1 65.4 62.7 63.3 67.3Ohio. . . . . . . . . . . . . . . 67.7 68.7 68.5 67.4 67.9Oklahoma . . . . . . . . . . . 71.0 69.2 70.3 68.5 69.8Oregon . . . . . . . . . . . . . 61.9 65.2 63.8 63.9 63.2Pennsylvania . . . . . . . . . 71.1 74.0 72.0 71.8 71.5Rhode Island . . . . . . . . . 60.9 58.2 57.6 56.5 57.9South Carolina . . . . . . . . 69.1 73.1 71.1 72.0 71.3South Dakota. . . . . . . . . 69.6 66.1 65.6 66.4 67.5Tennessee. . . . . . . . . . . 67.6 68.0 64.1 65.2 67.0Texas . . . . . . . . . . . . . . 62.5 59.0 58.7 59.7 61.4Utah. . . . . . . . . . . . . . . 69.9 70.7 68.9 69.3 71.5Vermont . . . . . . . . . . . . 66.9 70.8 68.5 69.4 70.4Virginia . . . . . . . . . . . . . 68.3 68.9 68.5 69.3 68.1Washington . . . . . . . . . . 65.7 61.8 63.1 62.4 61.6West Virginia . . . . . . . . . 72.0 72.4 73.3 73.7 73.1Wisconsin . . . . . . . . . . . 65.2 68.9 65.7 64.2 67.5Wyoming. . . . . . . . . . . . 68.8 68.7 67.1 65.8 69.0
Source: U.S. Bureau of the Census, Current Housing Reports, series H111/95-A.
Construction and Housing720
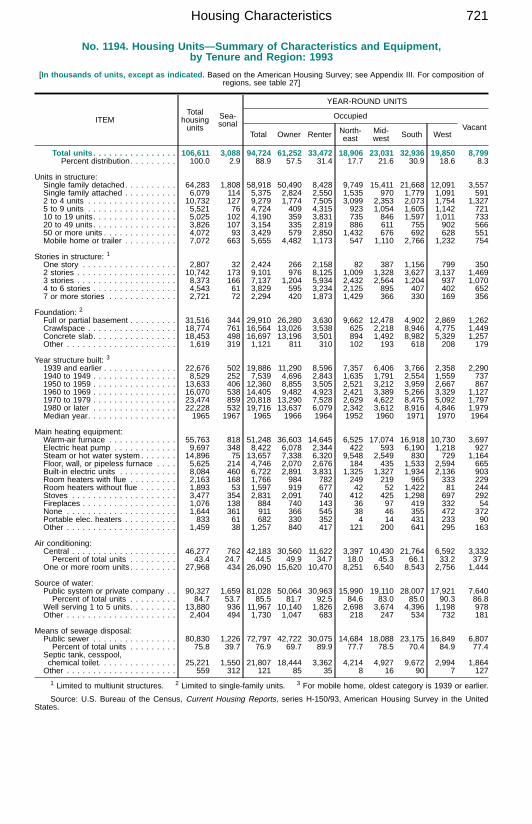
No. 1194. Housing Units—Summary of Characteristics and Equipment,by Tenure and Region: 1993
[In thousands of units, except as indicated. Based on the American Housing Survey; see Appendix III. For composition ofregions, see table 27]
ITEMTotal
housingunits
Sea-sonal
YEAR-ROUND UNITS
OccupiedVacant
Total Owner Renter North-east
Mid-west South West
Total units . . . . . . . . . . . . . . . . 106,611 3,088 94,724 61,252 33,472 18,906 23,031 32,936 19,850 8,799Percent distribution. . . . . . . . . 100.0 2.9 88.9 57.5 31.4 17.7 21.6 30.9 18.6 8.3
Units in structure:Single family detached. . . . . . . . . . 64,283 1,808 58,918 50,490 8,428 9,749 15,411 21,668 12,091 3,557Single family attached . . . . . . . . . . 6,079 114 5,375 2,824 2,550 1,535 970 1,779 1,091 5912 to 4 units . . . . . . . . . . . . . . . . . 10,732 127 9,279 1,774 7,505 3,099 2,353 2,073 1,754 1,3275 to 9 units . . . . . . . . . . . . . . . . . 5,521 76 4,724 409 4,315 923 1,054 1,605 1,142 72110 to 19 units . . . . . . . . . . . . . . . . 5,025 102 4,190 359 3,831 735 846 1,597 1,011 73320 to 49 units . . . . . . . . . . . . . . . . 3,826 107 3,154 335 2,819 886 611 755 902 56650 or more units . . . . . . . . . . . . . . 4,072 93 3,429 579 2,850 1,432 676 692 628 551Mobile home or trailer . . . . . . . . . . 7,072 663 5,655 4,482 1,173 547 1,110 2,766 1,232 754
Stories in structure: 1One story . . . . . . . . . . . . . . . . . . 2,807 32 2,424 266 2,158 82 387 1,156 799 3502 stories . . . . . . . . . . . . . . . . . . . 10,742 173 9,101 976 8,125 1,009 1,328 3,627 3,137 1,4693 stories . . . . . . . . . . . . . . . . . . . 8,373 166 7,137 1,204 5,934 2,432 2,564 1,204 937 1,0704 to 6 stories . . . . . . . . . . . . . . . . 4,543 61 3,829 595 3,234 2,125 895 407 402 6527 or more stories . . . . . . . . . . . . . 2,721 72 2,294 420 1,873 1,429 366 330 169 356
Foundation: 2Full or partial basement . . . . . . . . . 31,516 344 29,910 26,280 3,630 9,662 12,478 4,902 2,869 1,262Crawlspace . . . . . . . . . . . . . . . . . 18,774 761 16,564 13,026 3,538 625 2,218 8,946 4,775 1,449Concrete slab. . . . . . . . . . . . . . . . 18,453 498 16,697 13,196 3,501 894 1,492 8,982 5,329 1,257Other . . . . . . . . . . . . . . . . . . . . . 1,619 319 1,121 811 310 102 193 618 208 179
Year structure built: 31939 and earlier . . . . . . . . . . . . . . 22,676 502 19,886 11,290 8,596 7,357 6,406 3,766 2,358 2,2901940 to 1949 . . . . . . . . . . . . . . . . 8,529 252 7,539 4,696 2,843 1,635 1,791 2,554 1,559 7371950 to 1959 . . . . . . . . . . . . . . . . 13,633 406 12,360 8,855 3,505 2,521 3,212 3,959 2,667 8671960 to 1969 . . . . . . . . . . . . . . . . 16,070 538 14,405 9,482 4,923 2,421 3,389 5,266 3,329 1,1271970 to 1979 . . . . . . . . . . . . . . . . 23,474 859 20,818 13,290 7,528 2,629 4,622 8,475 5,092 1,7971980 or later . . . . . . . . . . . . . . . . 22,228 532 19,716 13,637 6,079 2,342 3,612 8,916 4,846 1,979Median year. . . . . . . . . . . . . . . . . 1965 1967 1965 1966 1964 1952 1960 1971 1970 1964
Main heating equipment:Warm-air furnace . . . . . . . . . . . . . 55,763 818 51,248 36,603 14,645 6,525 17,074 16,918 10,730 3,697Electric heat pump . . . . . . . . . . . . 9,697 348 8,422 6,078 2,344 422 593 6,190 1,218 927Steam or hot water system . . . . . . . 14,896 75 13,657 7,338 6,320 9,548 2,549 830 729 1,164Floor, wall, or pipeless furnace . . . . 5,625 214 4,746 2,070 2,676 184 435 1,533 2,594 665Built-in electric units . . . . . . . . . . . 8,084 460 6,722 2,891 3,831 1,325 1,327 1,934 2,136 903Room heaters with flue . . . . . . . . . 2,163 168 1,766 984 782 249 219 965 333 229Room heaters without flue . . . . . . . 1,893 53 1,597 919 677 42 52 1,422 81 244Stoves . . . . . . . . . . . . . . . . . . . . 3,477 354 2,831 2,091 740 412 425 1,298 697 292Fireplaces . . . . . . . . . . . . . . . . . . 1,076 138 884 740 143 36 97 419 332 54None . . . . . . . . . . . . . . . . . . . . . 1,644 361 911 366 545 38 46 355 472 372Portable elec. heaters . . . . . . . . . . 833 61 682 330 352 4 14 431 233 90Other . . . . . . . . . . . . . . . . . . . . . 1,459 38 1,257 840 417 121 200 641 295 163
Air conditioning:Central . . . . . . . . . . . . . . . . . . . . 46,277 762 42,183 30,560 11,622 3,397 10,430 21,764 6,592 3,332Percent of total units . . . . . . . . . 43.4 24.7 44.5 49.9 34.7 18.0 45.3 66.1 33.2 37.9
One or more room units . . . . . . . . . 27,968 434 26,090 15,620 10,470 8,251 6,540 8,543 2,756 1,444
Source of water:Public system or private company . . 90,327 1,659 81,028 50,064 30,963 15,990 19,110 28,007 17,921 7,640Percent of total units . . . . . . . . . 84.7 53.7 85.5 81.7 92.5 84.6 83.0 85.0 90.3 86.8
Well serving 1 to 5 units. . . . . . . . . 13,880 936 11,967 10,140 1,826 2,698 3,674 4,396 1,198 978Other . . . . . . . . . . . . . . . . . . . . . 2,404 494 1,730 1,047 683 218 247 534 732 181
Means of sewage disposal:Public sewer . . . . . . . . . . . . . . . . 80,830 1,226 72,797 42,722 30,075 14,684 18,088 23,175 16,849 6,807Percent of total units . . . . . . . . . 75.8 39.7 76.9 69.7 89.9 77.7 78.5 70.4 84.9 77.4
Septic tank, cesspool,chemical toilet. . . . . . . . . . . . . . . 25,221 1,550 21,807 18,444 3,362 4,214 4,927 9,672 2,994 1,864Other . . . . . . . . . . . . . . . . . . . . . 559 312 121 85 35 8 16 90 7 127
1 Limited to multiunit structures. 2 Limited to single-family units. 3 For mobile home, oldest category is 1939 or earlier.
Source: U.S. Bureau of the Census, Current Housing Reports, series H-150/93, American Housing Survey in the UnitedStates.
Housing Characteristics 721
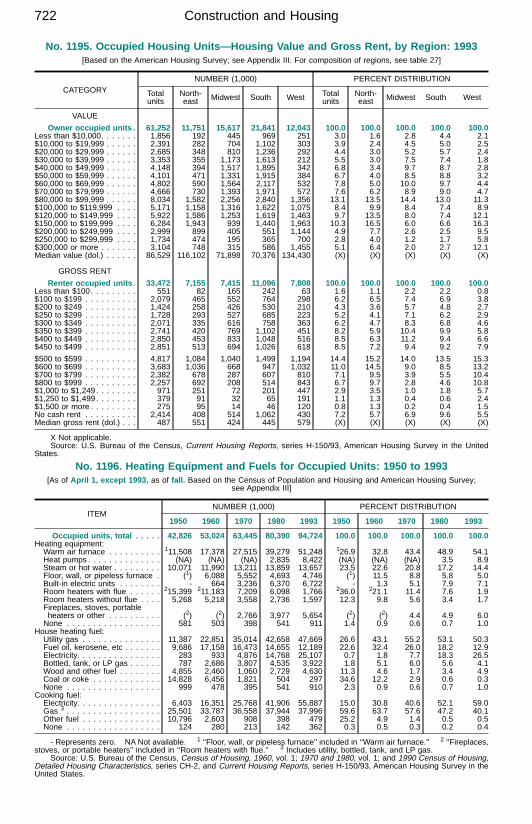
No. 1195. Occupied Housing Units—Housing Value and Gross Rent, by Region: 1993[Based on the American Housing Survey; see Appendix III. For composition of regions, see table 27]
CATEGORYNUMBER (1,000) PERCENT DISTRIBUTION
Totalunits
North-east Midwest South West Total
unitsNorth-east Midwest South West
VALUE
Owner occupied units . 61,252 11,751 15,617 21,841 12,043 100.0 100.0 100.0 100.0 100.0Less than $10,000. . . . . . . 1,856 192 445 969 251 3.0 1.6 2.8 4.4 2.1$10,000 to $19,999 . . . . . . 2,391 282 704 1,102 303 3.9 2.4 4.5 5.0 2.5$20,000 to $29,999 . . . . . . 2,685 348 810 1,236 292 4.4 3.0 5.2 5.7 2.4$30,000 to $39,999 . . . . . . 3,353 355 1,173 1,613 212 5.5 3.0 7.5 7.4 1.8$40,000 to $49,999 . . . . . . 4,148 394 1,517 1,895 342 6.8 3.4 9.7 8.7 2.8$50,000 to $59,999 . . . . . . 4,101 471 1,331 1,915 384 6.7 4.0 8.5 8.8 3.2$60,000 to $69,999 . . . . . . 4,802 590 1,564 2,117 532 7.8 5.0 10.0 9.7 4.4$70,000 to $79,999 . . . . . . 4,666 730 1,393 1,971 572 7.6 6.2 8.9 9.0 4.7$80,000 to $99,999 . . . . . . 8,034 1,582 2,256 2,840 1,356 13.1 13.5 14.4 13.0 11.3$100,000 to $119,999 . . . . 5,171 1,158 1,316 1,622 1,075 8.4 9.9 8.4 7.4 8.9$120,000 to $149,999 . . . . 5,922 1,586 1,253 1,619 1,463 9.7 13.5 8.0 7.4 12.1$150,000 to $199,999 . . . . 6,284 1,943 939 1,440 1,963 10.3 16.5 6.0 6.6 16.3$200,000 to $249,999 . . . . 2,999 899 405 551 1,144 4.9 7.7 2.6 2.5 9.5$250,000 to $299,999 . . . . 1,734 474 195 365 700 2.8 4.0 1.2 1.7 5.8$300,000 or more . . . . . . . 3,104 748 315 586 1,455 5.1 6.4 2.0 2.7 12.1Median value (dol.) . . . . . . 86,529 116,102 71,898 70,376 134,430 (X) (X) (X) (X) (X)
GROSS RENT
Renter occupied units . 33,472 7,155 7,415 11,096 7,808 100.0 100.0 100.0 100.0 100.0Less than $100. . . . . . . . . 551 82 165 242 63 1.6 1.1 2.2 2.2 0.8$100 to $199 . . . . . . . . . . 2,079 465 552 764 298 6.2 6.5 7.4 6.9 3.8$200 to $249 . . . . . . . . . . 1,424 258 426 530 210 4.3 3.6 5.7 4.8 2.7$250 to $299 . . . . . . . . . . 1,728 293 527 685 223 5.2 4.1 7.1 6.2 2.9$300 to $349 . . . . . . . . . . 2,071 335 616 758 363 6.2 4.7 8.3 6.8 4.6$350 to $399 . . . . . . . . . . 2,741 420 769 1,102 451 8.2 5.9 10.4 9.9 5.8$400 to $449 . . . . . . . . . . 2,850 453 833 1,048 516 8.5 6.3 11.2 9.4 6.6$450 to $499 . . . . . . . . . . 2,851 513 694 1,026 618 8.5 7.2 9.4 9.2 7.9
$500 to $599 . . . . . . . . . . 4,817 1,084 1,040 1,499 1,194 14.4 15.2 14.0 13.5 15.3$600 to $699 . . . . . . . . . . 3,683 1,036 668 947 1,032 11.0 14.5 9.0 8.5 13.2$700 to $799 . . . . . . . . . . 2,382 678 287 607 810 7.1 9.5 3.9 5.5 10.4$800 to $999 . . . . . . . . . . 2,257 692 208 514 843 6.7 9.7 2.8 4.6 10.8$1,000 to $1,249. . . . . . . . 971 251 72 201 447 2.9 3.5 1.0 1.8 5.7$1,250 to $1,499. . . . . . . . 379 91 32 65 191 1.1 1.3 0.4 0.6 2.4$1,500 or more . . . . . . . . . 275 95 14 46 120 0.8 1.3 0.2 0.4 1.5No cash rent . . . . . . . . . . 2,414 408 514 1,062 430 7.2 5.7 6.9 9.6 5.5Median gross rent (dol.) . . . 487 551 424 445 579 (X) (X) (X) (X) (X)
X Not applicable.Source: U.S. Bureau of the Census, Current Housing Reports, series H-150/93, American Housing Survey in the United
States.
No. 1196. Heating Equipment and Fuels for Occupied Units: 1950 to 1993[As of April 1, except 1993, as of fall. Based on the Census of Population and Housing and American Housing Survey;
see Appendix III]
ITEMNUMBER (1,000) PERCENT DISTRIBUTION
1950 1960 1970 1980 1993 1950 1960 1970 1980 1993
Occupied units, total . . . . . 42,826 53,024 63,445 80,390 94,724 100.0 100.0 100.0 100.0 100.0Heating equipment:Warm air furnace . . . . . . . . . . 111,508 17,378 27,515 39,279 51,248 126.9 32.8 43.4 48.9 54.1Heat pumps . . . . . . . . . . . . . . (NA) (NA) (NA) 2,835 8,422 (NA) (NA) (NA) 3.5 8.9Steam or hot water . . . . . . . . . 10,071 11,990 13,211 13,859 13,657 23.5 22.6 20.8 17.2 14.4Floor, wall, or pipeless furnace . (1) 6,088 5,552 4,693 4,746 (1) 11.5 8.8 5.8 5.0Built-in electric units . . . . . . . . - 664 3,236 6,370 6,722 - 1.3 5.1 7.9 7.1Room heaters with flue . . . . . . 215,399 211,183 7,209 6,098 1,766 236.0 221.1 11.4 7.6 1.9Room heaters without flue . . . . 5,268 5,218 3,558 2,736 1,597 12.3 9.8 5.6 3.4 1.7Fireplaces, stoves, portableheaters or other . . . . . . . . . . (2) (2) 2,766 3,977 5,654 (2) (2) 4.4 4.9 6.0None . . . . . . . . . . . . . . . . . . 581 503 398 541 911 1.4 0.9 0.6 0.7 1.0
House heating fuel:Utility gas . . . . . . . . . . . . . . . 11,387 22,851 35,014 42,658 47,669 26.6 43.1 55.2 53.1 50.3Fuel oil, kerosene, etc . . . . . . . 9,686 17,158 16,473 14,655 12,189 22.6 32.4 26.0 18.2 12.9Electricity. . . . . . . . . . . . . . . . 283 933 4,876 14,768 25,107 0.7 1.8 7.7 18.3 26.5Bottled, tank, or LP gas . . . . . . 787 2,686 3,807 4,535 3,922 1.8 5.1 6.0 5.6 4.1Wood and other fuel . . . . . . . . 4,855 2,460 1,060 2,729 4,630 11.3 4.6 1.7 3.4 4.9Coal or coke . . . . . . . . . . . . . 14,828 6,456 1,821 504 297 34.6 12.2 2.9 0.6 0.3None . . . . . . . . . . . . . . . . . . 999 478 395 541 910 2.3 0.9 0.6 0.7 1.0
Cooking fuel:Electricity. . . . . . . . . . . . . . . . 6,403 16,351 25,768 41,906 55,887 15.0 30.8 40.6 52.1 59.0Gas 3 . . . . . . . . . . . . . . . . . . 25,501 33,787 36,558 37,944 37,996 59.6 63.7 57.6 47.2 40.1Other fuel . . . . . . . . . . . . . . . 10,796 2,603 908 398 479 25.2 4.9 1.4 0.5 0.5None . . . . . . . . . . . . . . . . . . 124 280 213 142 362 0.3 0.5 0.3 0.2 0.4
- Represents zero. NA Not available. 1 ‘‘Floor, wall, or pipeless furnace’’ included in ‘‘Warm air furnace.’’ 2 ‘‘Fireplaces,stoves, or portable heaters’’ included in ‘‘Room heaters with flue.’’ 3 Includes utility, bottled, tank, and LP gas.
Source: U.S. Bureau of the Census, Census of Housing, 1960, vol. 1; 1970 and 1980, vol. 1; and 1990 Census of Housing,Detailed Housing Characteristics, series CH-2, and Current Housing Reports, series H-150/93, American Housing Survey in theUnited States.
Construction and Housing722
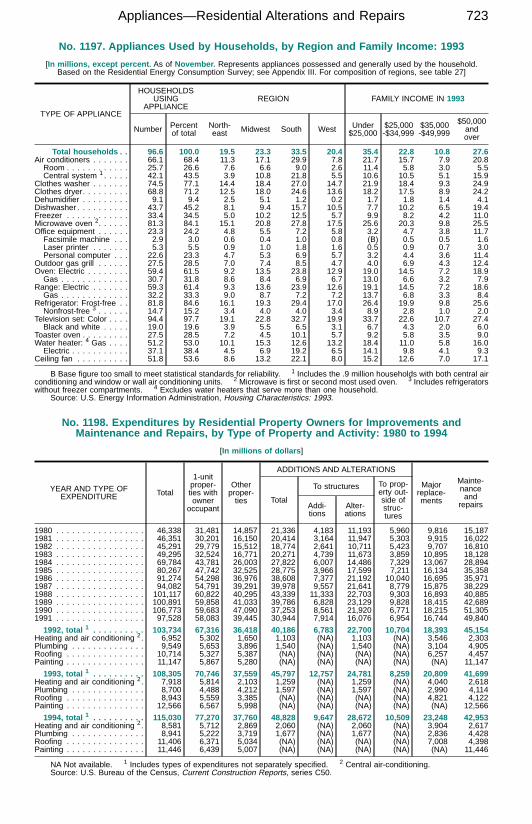
No. 1197. Appliances Used by Households, by Region and Family Income: 1993
[In millions, except percent. As of November. Represents appliances possessed and generally used by the household.Based on the Residential Energy Consumption Survey; see Appendix III. For composition of regions, see table 27]
TYPE OF APPLIANCE
HOUSEHOLDSUSING
APPLIANCEREGION FAMILY INCOME IN 1993
Number Percentof total
North-east Midwest South West Under
$25,000$25,000-$34,999
$35,000-$49,999
$50,000andover
Total households . . 96.6 100.0 19.5 23.3 33.5 20.4 35.4 22.8 10.8 27.6Air conditioners . . . . . . . 66.1 68.4 11.3 17.1 29.9 7.8 21.7 15.7 7.9 20.8Room . . . . . . . . . . . . 25.7 26.6 7.6 6.6 9.0 2.6 11.4 5.8 3.0 5.5Central system 1 . . . . . 42.1 43.5 3.9 10.8 21.8 5.5 10.6 10.5 5.1 15.9
Clothes washer . . . . . . . 74.5 77.1 14.4 18.4 27.0 14.7 21.9 18.4 9.3 24.9Clothes dryer. . . . . . . . . 68.8 71.2 12.5 18.0 24.6 13.6 18.2 17.5 8.9 24.2Dehumidifier . . . . . . . . . 9.1 9.4 2.5 5.1 1.2 0.2 1.7 1.8 1.4 4.1Dishwasher . . . . . . . . . . 43.7 45.2 8.1 9.4 15.7 10.5 7.7 10.2 6.5 19.4Freezer . . . . . . . . . . . . 33.4 34.5 5.0 10.2 12.5 5.7 9.9 8.2 4.2 11.0Microwave oven 2. . . . . . 81.3 84.1 15.1 20.8 27.8 17.5 25.6 20.3 9.8 25.5Office equipment . . . . . . 23.3 24.2 4.8 5.5 7.2 5.8 3.2 4.7 3.8 11.7Facsimile machine . . . 2.9 3.0 0.6 0.4 1.0 0.8 (B) 0.5 0.5 1.6Laser printer . . . . . . . 5.3 5.5 0.9 1.0 1.8 1.6 0.5 0.9 0.7 3.0Personal computer . . . 22.6 23.3 4.7 5.3 6.9 5.7 3.2 4.4 3.6 11.4
Outdoor gas grill . . . . . . 27.5 28.5 7.0 7.4 8.5 4.7 4.0 6.9 4.3 12.4Oven: Electric . . . . . . . . 59.4 61.5 9.2 13.5 23.8 12.9 19.0 14.5 7.2 18.9Gas . . . . . . . . . . . . . 30.7 31.8 8.6 8.4 6.9 6.7 13.0 6.6 3.2 7.9
Range: Electric . . . . . . . 59.3 61.4 9.3 13.6 23.9 12.6 19.1 14.5 7.2 18.6Gas . . . . . . . . . . . . . 32.2 33.3 9.0 8.7 7.2 7.2 13.7 6.8 3.3 8.4
Refrigerator: Frost-free . . 81.8 84.6 16.1 19.3 29.4 17.0 26.4 19.9 9.8 25.6Nonfrost-free 3 . . . . . . 14.7 15.2 3.4 4.0 4.0 3.4 8.9 2.8 1.0 2.0
Television set: Color . . . . 94.4 97.7 19.1 22.8 32.7 19.9 33.7 22.6 10.7 27.4Black and white . . . . . 19.0 19.6 3.9 5.5 6.5 3.1 6.7 4.3 2.0 6.0
Toaster oven . . . . . . . . . 27.5 28.5 7.2 4.5 10.1 5.7 9.2 5.8 3.5 9.0Water heater: 4 Gas . . . . 51.2 53.0 10.1 15.3 12.6 13.2 18.4 11.0 5.8 16.0Electric . . . . . . . . . . . 37.1 38.4 4.5 6.9 19.2 6.5 14.1 9.8 4.1 9.3
Ceiling fan . . . . . . . . . . 51.8 53.6 8.6 13.2 22.1 8.0 15.2 12.6 7.0 17.1
B Base figure too small to meet statistical standards for reliability. 1 Includes the .9 million households with both central airconditioning and window or wall air conditioning units. 2 Microwave is first or second most used oven. 3 Includes refrigeratorswithout freezer compartments. 4 Excludes water heaters that serve more than one household.
Source: U.S. Energy Information Administration, Housing Characteristics: 1993.
No. 1198. Expenditures by Residential Property Owners for Improvements andMaintenance and Repairs, by Type of Property and Activity: 1980 to 1994
[In millions of dollars ]
YEAR AND TYPE OFEXPENDITURE Total
1-unitproper-ties withowner
occupant
Otherproper-ties
ADDITIONS AND ALTERATIONS
Majorreplace-ments
Mainte-nanceand
repairsTotal
To structures To prop-erty out-side ofstruc-tures
Addi-tions
Alter-ations
1980 . . . . . . . . . . . . . . . . . 46,338 31,481 14,857 21,336 4,183 11,193 5,960 9,816 15,1871981 . . . . . . . . . . . . . . . . . 46,351 30,201 16,150 20,414 3,164 11,947 5,303 9,915 16,0221982 . . . . . . . . . . . . . . . . . 45,291 29,779 15,512 18,774 2,641 10,711 5,423 9,707 16,8101983 . . . . . . . . . . . . . . . . . 49,295 32,524 16,771 20,271 4,739 11,673 3,859 10,895 18,1281984 . . . . . . . . . . . . . . . . . 69,784 43,781 26,003 27,822 6,007 14,486 7,329 13,067 28,8941985 . . . . . . . . . . . . . . . . . 80,267 47,742 32,525 28,775 3,966 17,599 7,211 16,134 35,3581986 . . . . . . . . . . . . . . . . . 91,274 54,298 36,976 38,608 7,377 21,192 10,040 16,695 35,9711987 . . . . . . . . . . . . . . . . . 94,082 54,791 39,291 39,978 9,557 21,641 8,779 15,875 38,2291988 . . . . . . . . . . . . . . . . . 101,117 60,822 40,295 43,339 11,333 22,703 9,303 16,893 40,8851989 . . . . . . . . . . . . . . . . . 100,891 59,858 41,033 39,786 6,828 23,129 9,828 18,415 42,6891990 . . . . . . . . . . . . . . . . . 106,773 59,683 47,090 37,253 8,561 21,920 6,771 18,215 51,3051991 . . . . . . . . . . . . . . . . . 97,528 58,083 39,445 30,944 7,914 16,076 6,954 16,744 49,840
1992, total 1 . . . . . . . . . . 103,734 67,316 36,418 40,186 6,783 22,700 10,704 18,393 45,154Heating and air conditioning 2. 6,952 5,302 1,650 1,103 (NA) 1,103 (NA) 3,546 2,303Plumbing . . . . . . . . . . . . . . 9,549 5,653 3,896 1,540 (NA) 1,540 (NA) 3,104 4,905Roofing . . . . . . . . . . . . . . . 10,714 5,327 5,387 (NA) (NA) (NA) (NA) 6,257 4,457Painting . . . . . . . . . . . . . . . 11,147 5,867 5,280 (NA) (NA) (NA) (NA) (NA) 11,147
1993, total 1 . . . . . . . . . . 108,305 70,746 37,559 45,797 12,757 24,781 8,259 20,809 41,699Heating and air conditioning 2. 7,918 5,814 2,103 1,259 (NA) 1,259 (NA) 4,040 2,618Plumbing . . . . . . . . . . . . . . 8,700 4,488 4,212 1,597 (NA) 1,597 (NA) 2,990 4,114Roofing . . . . . . . . . . . . . . . 8,943 5,559 3,385 (NA) (NA) (NA) (NA) 4,821 4,122Painting . . . . . . . . . . . . . . . 12,566 6,567 5,998 (NA) (NA) (NA) (NA) (NA) 12,566
1994, total 1 . . . . . . . . . . 115,030 77,270 37,760 48,828 9,647 28,672 10,509 23,248 42,953Heating and air conditioning 2. 8,581 5,712 2,869 2,060 (NA) 2,060 (NA) 3,904 2,617Plumbing . . . . . . . . . . . . . . 8,941 5,222 3,719 1,677 (NA) 1,677 (NA) 2,836 4,428Roofing . . . . . . . . . . . . . . . 11,406 6,371 5,034 (NA) (NA) (NA) (NA) 7,008 4,398Painting . . . . . . . . . . . . . . . 11,446 6,439 5,007 (NA) (NA) (NA) (NA) (NA) 11,446
NA Not available. 1 Includes types of expenditures not separately specified. 2 Central air-conditioning.Source: U.S. Bureau of the Census, Current Construction Reports, series C50.
Appliances—Residential Alterations and Repairs 723
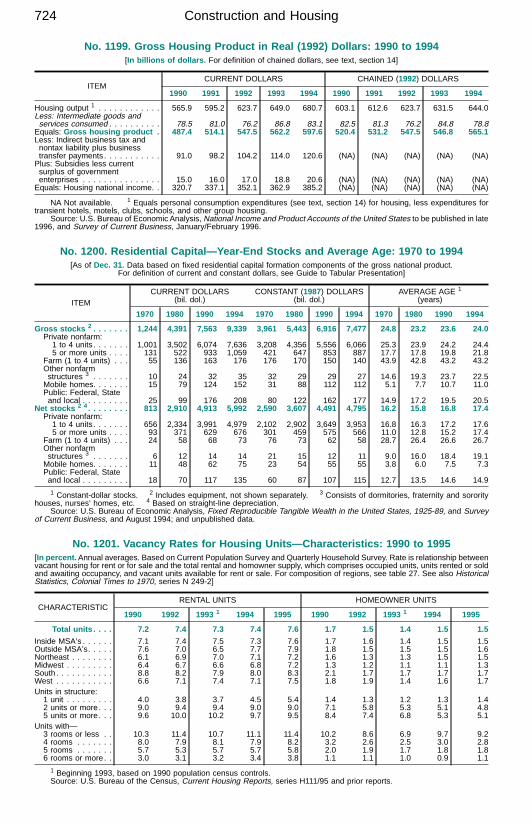
No. 1199. Gross Housing Product in Real (1992) Dollars: 1990 to 1994[In billions of dollars. For definition of chained dollars, see text, section 14]
ITEMCURRENT DOLLARS CHAINED (1992) DOLLARS
1990 1991 1992 1993 1994 1990 1991 1992 1993 1994
Housing output 1 . . . . . . . . . . . . 565.9 595.2 623.7 649.0 680.7 603.1 612.6 623.7 631.5 644.0Less: Intermediate goods andservices consumed . . . . . . . . . . 78.5 81.0 76.2 86.8 83.1 82.5 81.3 76.2 84.8 78.8Equals: Gross housing product . 487.4 514.1 547.5 562.2 597.6 520.4 531.2 547.5 546.8 565.1Less: Indirect business tax andnontax liability plus businesstransfer payments. . . . . . . . . . . 91.0 98.2 104.2 114.0 120.6 (NA) (NA) (NA) (NA) (NA)Plus: Subsidies less currentsurplus of governmententerprises . . . . . . . . . . . . . . . 15.0 16.0 17.0 18.8 20.6 (NA) (NA) (NA) (NA) (NA)Equals: Housing national income. . 320.7 337.1 352.1 362.9 385.2 (NA) (NA) (NA) (NA) (NA)
NA Not available. 1 Equals personal consumption expenditures (see text, section 14) for housing, less expenditures fortransient hotels, motels, clubs, schools, and other group housing.
Source: U.S. Bureau of Economic Analysis, National Income and Product Accounts of the United States to be published in late1996, and Survey of Current Business, January/February 1996.
No. 1200. Residential Capital—Year-End Stocks and Average Age: 1970 to 1994[As of Dec. 31. Data based on fixed residential capital formation components of the gross national product.
For definition of current and constant dollars, see Guide to Tabular Presentation]
ITEMCURRENT DOLLARS
(bil. dol.)CONSTANT (1987) DOLLARS
(bil. dol.)AVERAGE AGE 1
(years)
1970 1980 1990 1994 1970 1980 1990 1994 1970 1980 1990 1994
Gross stocks 2 . . . . . . . 1,244 4,391 7,563 9,339 3,961 5,443 6,916 7,477 24.8 23.2 23.6 24.0Private nonfarm:1 to 4 units . . . . . . . 1,001 3,502 6,074 7,636 3,208 4,356 5,556 6,066 25.3 23.9 24.2 24.45 or more units . . . . 131 522 933 1,059 421 647 853 887 17.7 17.8 19.8 21.8
Farm (1 to 4 units) . . . 55 136 163 176 176 170 150 140 43.9 42.8 43.2 43.2Other nonfarmstructures 3 . . . . . . . 10 24 32 35 32 29 29 27 14.6 19.3 23.7 22.5Mobile homes. . . . . . . 15 79 124 152 31 88 112 112 5.1 7.7 10.7 11.0Public: Federal, Stateand local . . . . . . . . . 25 99 176 208 80 122 162 177 14.9 17.2 19.5 20.5
Net stocks 2 4 . . . . . . . . 813 2,910 4,913 5,992 2,590 3,607 4,491 4,795 16.2 15.8 16.8 17.4Private nonfarm:1 to 4 units . . . . . . . 656 2,334 3,991 4,979 2,102 2,902 3,649 3,953 16.8 16.3 17.2 17.65 or more units . . . . 93 371 629 676 301 459 575 566 11.0 12.8 15.2 17.4
Farm (1 to 4 units) . . . 24 58 68 73 76 73 62 58 28.7 26.4 26.6 26.7Other nonfarmstructures 3 . . . . . . . 6 12 14 14 21 15 12 11 9.0 16.0 18.4 19.1Mobile homes. . . . . . . 11 48 62 75 23 54 55 55 3.8 6.0 7.5 7.3Public: Federal, Stateand local . . . . . . . . . 18 70 117 135 60 87 107 115 12.7 13.5 14.6 14.9
1 Constant-dollar stocks. 2 Includes equipment, not shown separately. 3 Consists of dormitories, fraternity and sororityhouses, nurses’ homes, etc. 4 Based on straight-line depreciation.
Source: U.S. Bureau of Economic Analysis, Fixed Reproducible Tangible Wealth in the United States, 1925-89, and Surveyof Current Business, and August 1994; and unpublished data.
No. 1201. Vacancy Rates for Housing Units—Characteristics: 1990 to 1995[In percent. Annual averages. Based on Current Population Survey and Quarterly Household Survey. Rate is relationship betweenvacant housing for rent or for sale and the total rental and homowner supply, which comprises occupied units, units rented or soldand awaiting occupancy, and vacant units available for rent or sale. For composition of regions, see table 27. See also HistoricalStatistics, Colonial Times to 1970, series N 249-2]
CHARACTERISTICRENTAL UNITS HOMEOWNER UNITS
1990 1992 1993 1 1994 1995 1990 1992 1993 1 1994 1995
Total units . . . . 7.2 7.4 7.3 7.4 7.6 1.7 1.5 1.4 1.5 1.5
Inside MSA’s . . . . . . 7.1 7.4 7.5 7.3 7.6 1.7 1.6 1.4 1.5 1.5Outside MSA’s. . . . . 7.6 7.0 6.5 7.7 7.9 1.8 1.5 1.5 1.5 1.6Northeast . . . . . . . . 6.1 6.9 7.0 7.1 7.2 1.6 1.3 1.3 1.5 1.5Midwest . . . . . . . . . 6.4 6.7 6.6 6.8 7.2 1.3 1.2 1.1 1.1 1.3South. . . . . . . . . . . 8.8 8.2 7.9 8.0 8.3 2.1 1.7 1.7 1.7 1.7West . . . . . . . . . . . 6.6 7.1 7.4 7.1 7.5 1.8 1.9 1.4 1.6 1.7Units in structure:1 unit . . . . . . . . . 4.0 3.8 3.7 4.5 5.4 1.4 1.3 1.2 1.3 1.42 units or more. . . 9.0 9.4 9.4 9.0 9.0 7.1 5.8 5.3 5.1 4.85 units or more. . . 9.6 10.0 10.2 9.7 9.5 8.4 7.4 6.8 5.3 5.1
Units with—3 rooms or less . . 10.3 11.4 10.7 11.1 11.4 10.2 8.6 6.9 9.7 9.24 rooms . . . . . . . 8.0 7.9 8.1 7.9 8.2 3.2 2.6 2.5 3.0 2.85 rooms . . . . . . . 5.7 5.3 5.7 5.7 5.8 2.0 1.9 1.7 1.8 1.86 rooms or more. . 3.0 3.1 3.2 3.4 3.8 1.1 1.1 1.0 0.9 1.1
1 Beginning 1993, based on 1990 population census controls.Source: U.S. Bureau of the Census, Current Housing Reports, series H111/95 and prior reports.
Construction and Housing724
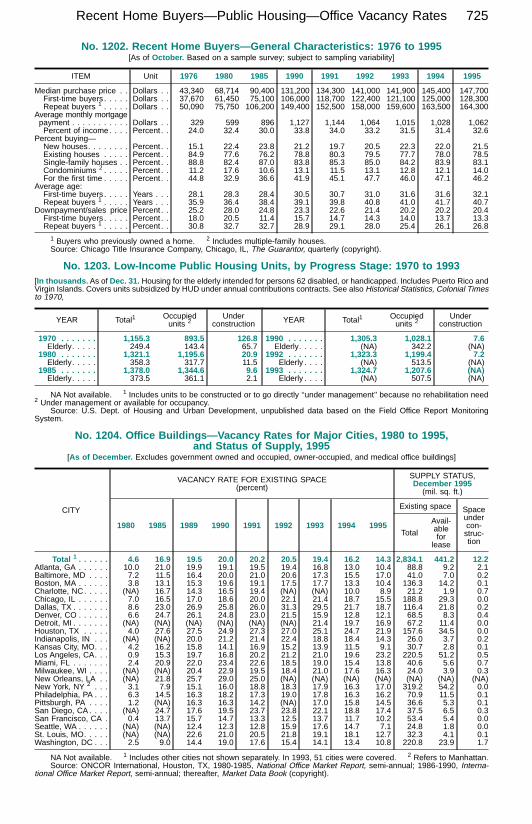
No. 1202. Recent Home Buyers—General Characteristics: 1976 to 1995[As of October. Based on a sample survey; subject to sampling variability]
ITEM Unit 1976 1980 1985 1990 1991 1992 1993 1994 1995
Median purchase price . . Dollars . . 43,340 68,714 90,400 131,200 134,300 141,000 141,900 145,400 147,700First-time buyers . . . . . Dollars . . 37,670 61,450 75,100 106,000 118,700 122,400 121,100 125,000 128,300Repeat buyers 1 . . . . . Dollars . . 50,090 75,750 106,200 149,400 152,500 158,000 159,600 163,500 164,300
Average monthly mortgagepayment . . . . . . . . . . . Dollars . . 329 599 896 1,127 1,144 1,064 1,015 1,028 1,062Percent of income. . . . Percent . . 24.0 32.4 30.0 33.8 34.0 33.2 31.5 31.4 32.6
Percent buying—New houses. . . . . . . . Percent . . 15.1 22.4 23.8 21.2 19.7 20.5 22.3 22.0 21.5Existing houses . . . . . Percent . . 84.9 77.6 76.2 78.8 80.3 79.5 77.7 78.0 78.5Single-family houses . . Percent . . 88.8 82.4 87.0 83.8 85.3 85.0 84.2 83.9 83.1Condominiums 2 . . . . . Percent . . 11.2 17.6 10.6 13.1 11.5 13.1 12.8 12.1 14.0For the first time . . . . . Percent . . 44.8 32.9 36.6 41.9 45.1 47.7 46.0 47.1 46.2
Average age:First-time buyers . . . . . Years . . . 28.1 28.3 28.4 30.5 30.7 31.0 31.6 31.6 32.1Repeat buyers 1 . . . . . Years . . . 35.9 36.4 38.4 39.1 39.8 40.8 41.0 41.7 40.7
Downpayment/sales price Percent . . 25.2 28.0 24.8 23.3 22.6 21.4 20.2 20.2 20.4First-time buyers . . . . . Percent . . 18.0 20.5 11.4 15.7 14.7 14.3 14.0 13.7 13.3Repeat buyers 1 . . . . . Percent . . 30.8 32.7 32.7 28.9 29.1 28.0 25.4 26.1 26.8
1 Buyers who previously owned a home. 2 Includes multiple-family houses.Source: Chicago Title Insurance Company, Chicago, IL, The Guarantor, quarterly (copyright).
No. 1203. Low-Income Public Housing Units, by Progress Stage: 1970 to 1993[In thousands. As of Dec. 31. Housing for the elderly intended for persons 62 disabled, or handicapped. Includes Puerto Rico andVirgin Islands. Covers units subsidized by HUD under annual contributions contracts. See also Historical Statistics, Colonial Timesto 1970,
YEAR Total1 Occupiedunits 2
Underconstruction
1970 . . . . . . . 1,155.3 893.5 126.8Elderly. . . . . 249.4 143.4 65.7
1980 . . . . . . . 1,321.1 1,195.6 20.9Elderly. . . . . 358.3 317.7 11.5
1985 . . . . . . . 1,378.0 1,344.6 9.6Elderly. . . . . 373.5 361.1 2.1
YEAR Total1 Occupiedunits 2
Underconstruction
1990 . . . . . . . 1,305.3 1,028.1 7.6Elderly. . . . . (NA) 342.2 (NA)
1992 . . . . . . . 1,323.3 1,199.4 7.2Elderly . . . . (NA) 513.5 (NA)
1993 . . . . . . . 1,324.7 1,207.6 (NA)Elderly . . . . (NA) 507.5 (NA)
NA Not available. 1 Includes units to be constructed or to go directly ‘‘under management’’ because no rehabilitation need2 Under management or available for occupancy.
Source: U.S. Dept. of Housing and Urban Development, unpublished data based on the Field Office Report MonitoringSystem.
No. 1204. Office Buildings—Vacancy Rates for Major Cities, 1980 to 1995,and Status of Supply, 1995
[As of December. Excludes government owned and occupied, owner-occupied, and medical office buildings]
CITY
VACANCY RATE FOR EXISTING SPACE(percent)
SUPPLY STATUS,December 1995
(mil. sq. ft.)
1980 1985 1989 1990 1991 1992 1993 1994 1995
Existing space Spaceundercon-struc-tion
Total
Avail-ablefor
lease
Total 1 . . . . . . 4.6 16.9 19.5 20.0 20.2 20.5 19.4 16.2 14.3 2,834.1 441.2 12.2Atlanta, GA . . . . . . 10.0 21.0 19.9 19.1 19.5 19.4 16.8 13.0 10.4 88.8 9.2 2.1Baltimore, MD . . . . 7.2 11.5 16.4 20.0 21.0 20.6 17.3 15.5 17.0 41.0 7.0 0.2Boston, MA . . . . . . 3.8 13.1 15.3 19.6 19.1 17.5 17.7 13.3 10.4 136.3 14.2 0.1Charlotte, NC. . . . . (NA) 16.7 14.3 16.5 19.4 (NA) (NA) 10.0 8.9 21.2 1.9 0.7Chicago, IL . . . . . . 7.0 16.5 17.0 18.6 20.0 22.1 21.4 18.7 15.5 188.8 29.3 0.0Dallas, TX . . . . . . . 8.6 23.0 26.9 25.8 26.0 31.3 29.5 21.7 18.7 116.4 21.8 0.2Denver, CO . . . . . . 6.6 24.7 26.1 24.8 23.0 21.5 15.9 12.8 12.1 68.5 8.3 0.4Detroit, MI . . . . . . . (NA) (NA) (NA) (NA) (NA) (NA) 21.4 19.7 16.9 67.2 11.4 0.0Houston, TX . . . . . 4.0 27.6 27.5 24.9 27.3 27.0 25.1 24.7 21.9 157.6 34.5 0.0Indianapolis, IN . . . (NA) (NA) 20.0 21.2 21.4 22.4 18.8 18.4 14.3 26.0 3.7 0.2Kansas City, MO. . . 4.2 16.2 15.8 14.1 16.9 15.2 13.9 11.5 9.1 30.7 2.8 0.1Los Angeles, CA. . . 0.9 15.3 19.7 16.8 20.2 21.2 21.0 19.6 23.2 220.5 51.2 0.5Miami, FL . . . . . . . 2.4 20.9 22.0 23.4 22.6 18.5 19.0 15.4 13.8 40.6 5.6 0.7Milwaukee, WI . . . . (NA) (NA) 20.4 22.9 19.5 18.4 21.0 17.6 16.3 24.0 3.9 0.3New Orleans, LA . . (NA) 21.8 25.7 29.0 25.0 (NA) (NA) (NA) (NA) (NA) (NA) (NA)New York, NY 2 . . . 3.1 7.9 15.1 16.0 18.8 18.3 17.9 16.3 17.0 319.2 54.2 0.0Philadelphia, PA . . . 6.3 14.5 16.3 18.2 17.3 19.0 17.8 16.3 16.2 70.9 11.5 0.1Pittsburgh, PA . . . . 1.2 (NA) 16.3 16.3 14.2 (NA) 17.0 15.8 14.5 36.6 5.3 0.1San Diego, CA . . . . (NA) 24.7 17.6 19.5 23.7 23.8 22.1 18.8 17.4 37.5 6.5 0.3San Francisco, CA . 0.4 13.7 15.7 14.7 13.3 12.5 13.7 11.7 10.2 53.4 5.4 0.0Seattle, WA . . . . . . (NA) (NA) 12.4 12.3 12.8 15.9 17.6 14.7 7.1 24.8 1.8 0.0St. Louis, MO. . . . . (NA) (NA) 22.6 21.0 20.5 21.8 19.1 18.1 12.7 32.3 4.1 0.1Washington, DC . . . 2.5 9.0 14.4 19.0 17.6 15.4 14.1 13.4 10.8 220.8 23.9 1.7
NA Not available. 1 Includes other cities not shown separately. In 1993, 51 cities were covered. 2 Refers to Manhattan.Source: ONCOR International, Houston, TX, 1980-1985, National Office Market Report, semi-annual; 1986-1990, Interna-
tional Office Market Report, semi-annual; thereafter, Market Data Book (copyright).
Recent Home Buyers—Public Housing—Office Vacancy Rates 725

No. 1206. Commercial Buildings—Selected Characteristics, by Square Footage ofFloorspace: 1992
[Excludes buildings 1,000 square feet or smaller. Building type based on predominant activity in which the occupants were engaged.Based on a sample survey of building representatives conducted between August and December 1992; therefore, subject to sam-pling variability. For composition of regions, see table 27]
CHARACTERISTIC
Numberof
build-ings
(1,000)
FLOORSPACE (mil. sq. ft.)Meansq. ft.per
building(1,000)
Mediansq. ft.per
building(1,000)
Total
Within all buildings having square footage of—
5,000or less
5,001to
10,000
10,001to
25,000
25,001to
50,000
50,001to
100,000
100,001andover
All buildings . . . . . . . . 4,806 67,876 7,327 7,199 10,375 10,069 8,062 24,845 14.1 4.5
Region:Northeast . . . . . . . . . . . . 771 13,400 1,074 1,337 1,663 1,976 1,752 5,597 17.4 5.2Midwest . . . . . . . . . . . . . 1,202 17,280 1,889 1,763 2,689 2,353 2,097 6,488 14.4 4.5South . . . . . . . . . . . . . . . 1,963 24,577 3,155 2,723 3,782 3,696 2,842 8,379 12.5 4.0West. . . . . . . . . . . . . . . . 870 12,619 1,208 1,376 2,241 2,043 1,371 4,380 14.5 5.0
Year constructed:1899 or before . . . . . . . . . 169 1,721 251 397 297 431 (S) (S) 10.2 5.51900 to 1919 . . . . . . . . . . 255 3,608 336 523 503 522 319 (S) 14.1 5.01920 to 1945 . . . . . . . . . . 724 8,712 1,150 1,106 1,507 1,267 927 1,934 12.0 4.21946 to 1959 . . . . . . . . . . 880 10,421 1,352 1,255 1,775 1,792 1,236 2,531 11.8 4.21960 to 1969 . . . . . . . . . . 783 12,612 1,167 986 1,892 1,856 1,625 5,085 16.1 4.51970 to 1979 . . . . . . . . . . 982 14,014 1,536 1,505 1,902 2,216 1,776 5,079 14.3 4.51980 to 1989 . . . . . . . . . . 884 14,287 1,339 1,251 2,189 1,658 1,717 6,132 16.2 4.81990 to 1992 . . . . . . . . . . 128 2,502 197 176 309 327 268 1,224 19.6 4.8
Principal activity withinbuilding:Public assembly 1 . . . . . . . 644 8,303 1,002 1,056 1,742 1,278 378 418 12.9 (NA)Education . . . . . . . . . . . . 301 8,470 292 307 997 1,551 2,045 3,262 28.2 9.0Food sales . . . . . . . . . . . 130 757 286 (S) (S) (S) (S) (S) 5.8 2.6Food service . . . . . . . . . . 260 1,491 485 343 325 (S) (S) (S) 5.7 3.4Health care . . . . . . . . . . . 63 1,763 108 (S) (S) (S) (S) 1,286 27.9 4.3Lodging. . . . . . . . . . . . . . 154 2,891 159 294 412 711 420 758 18.8 8.0Mercantile/services . . . . . . 1,272 12,402 2,203 1,987 2,003 1,369 1,268 3,570 9.7 4.0
Office . . . . . . . . . . . . . . . 749 12,319 1,018 1,248 1,656 1,823 1,355 5,218 16.4 5.0Parking garage. . . . . . . . . 24 1,652 (S) (S) (S) (S) (S) 694 69.9 6.0Public order and safety . . . 60 820 91 (S) (S) (S) (S) (S) 13.7 5.0Warehouse . . . . . . . . . . . 761 11,484 1,089 1,106 2,066 1,631 1,250 4,343 15.1 5.0Other . . . . . . . . . . . . . . . 69 1,130 99 (S) 110 (S) (S) (S) 16.4 4.0Vacant . . . . . . . . . . . . . . 319 4,396 473 459 635 768 503 821 13.8 4.2
Government owned . . . . . . 599 15,124 689 848 1,735 1,953 2,241 7,659 25.2 6.7Nongovernment owned . . . 4,206 52,752 6,638 6,351 8,640 8,116 5,821 17,186 12.5 4.3
Fuels used alone or incombination:Electricity. . . . . . . . . . . . . 4,616 66,549 6,996 7,057 10,097 9,856 7,936 24,607 14.4 4.7Natural gas . . . . . . . . . . . 2,665 45,097 3,761 4,266 6,865 6,510 5,735 17,959 16.9 5.1Fuel oil . . . . . . . . . . . . . . 559 13,218 829 925 978 1,377 1,539 7,570 23.7 5.0Propane . . . . . . . . . . . . . 337 3,393 573 466 456 501 411 500 10.1 3.5District heat . . . . . . . . . . . 95 5,339 56 73 450 545 653 3,562 56.0 17.0District chilled water . . . . . 28 2,066 (S) (S) 115 311 (S) 1,504 72.6 26.5Any other . . . . . . . . . . . . 163 1,551 250 311 (S) (S) (S) (S) 9.5 3.6
Workers:Fewer than 5 . . . . . . . . . . 2,718 17,944 5,095 3,329 3,053 2,107 910 (S) 6.6 3.05 to 9 . . . . . . . . . . . . . . . 895 7,524 1,554 1,612 1,801 1,348 595 (S) 8.4 4.810 to 19 . . . . . . . . . . . . . 561 8,077 537 1,446 2,323 1,538 643 (S) 14.4 8.020 to 49 . . . . . . . . . . . . . 405 10,556 120 757 2,608 3,049 1,899 (S) 26.1 16.350 to 99 . . . . . . . . . . . . . 130 7,763 (S) (S) 450 1,445 2,151 (S) 59.7 38.5100 to 249. . . . . . . . . . . . 64 7,378 (S) (S) (S) 517 1,303 5,433 114.6 79.0250 or more. . . . . . . . . . . 31 8,633 (S) (S) (S) (S) 561 7,992 274.4 150.0
Weekly operating hours:39 or less . . . . . . . . . . . . 1,039 8,246 1,797 1,341 1,592 1,309 1,007 (S) 7.9 3.540 to 48 . . . . . . . . . . . . . 1,278 14,998 1,904 2,186 2,994 2,553 1,698 3,662 11.7 4.949 to 60 . . . . . . . . . . . . . 1,004 14,046 1,430 1,610 2,549 2,536 1,440 4,482 14.0 5.061 to 84 . . . . . . . . . . . . . 645 12,062 926 1,098 1,408 1,443 1,769 5,418 18.7 5.085 to 167 . . . . . . . . . . . . 478 8,467 772 492 1,022 1,151 1,132 3,897 17.7 4.0168 (open continuously) . . . 362 10,057 498 472 810 1,077 1,015 6,185 27.8 5.0
NA Not available. S Figure does not meet publication standards. 1 Includes religious worship.
Source: U.S. Energy Information Administration, Commercial Buildings Characteristics, 1992.
Commercial Buildings 727
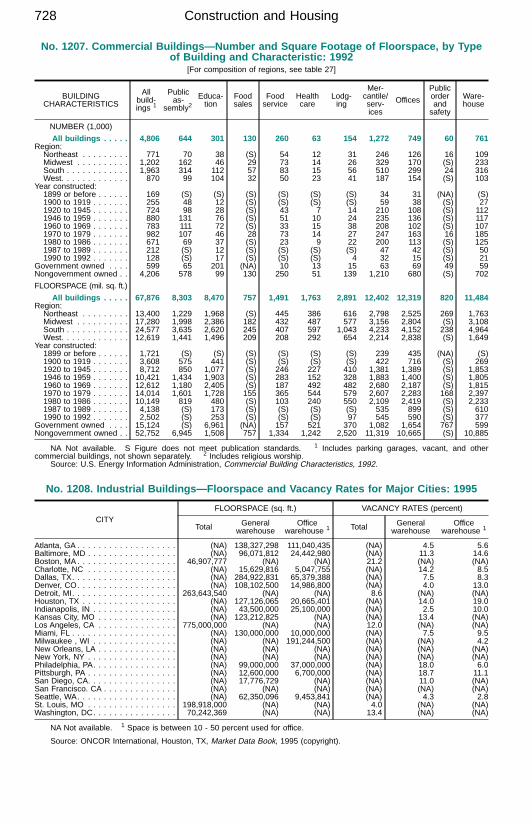
No. 1207. Commercial Buildings—Number and Square Footage of Floorspace, by Typeof Building and Characteristic: 1992
[For composition of regions, see table 27]
BUILDINGCHARACTERISTICS
Allbuild-ings 1
Publicas-
sembly2Educa-tion
Foodsales
Foodservice
Healthcare
Lodg-ing
Mer-cantile/serv-ices
Offices
Publicorderandsafety
Ware-house
NUMBER (1,000)
All buildings . . . . . 4,806 644 301 130 260 63 154 1,272 749 60 761Region:Northeast . . . . . . . . . 771 70 38 (S) 54 12 31 246 126 16 109Midwest . . . . . . . . . . 1,202 162 46 29 73 14 26 329 170 (S) 233South . . . . . . . . . . . . 1,963 314 112 57 83 15 56 510 299 24 316West. . . . . . . . . . . . . 870 99 104 32 50 23 41 187 154 (S) 103
Year constructed:1899 or before . . . . . . 169 (S) (S) (S) (S) (S) (S) 34 31 (NA) (S)1900 to 1919 . . . . . . . 255 48 12 (S) (S) (S) (S) 59 38 (S) 271920 to 1945 . . . . . . . 724 98 28 (S) 43 7 14 210 108 (S) 1121946 to 1959 . . . . . . . 880 131 76 (S) 51 10 24 235 136 (S) 1171960 to 1969 . . . . . . . 783 111 72 (S) 33 15 38 208 102 (S) 1071970 to 1979 . . . . . . . 982 107 46 28 73 14 27 247 163 16 1851980 to 1986 . . . . . . . 671 69 37 (S) 23 9 22 200 113 (S) 1251987 to 1989 . . . . . . . 212 (S) 12 (S) (S) (S) (S) 47 42 (S) 501990 to 1992 . . . . . . . 128 (S) 17 (S) (S) (S) 4 32 15 (S) 21
Government owned . . . . 599 65 201 (NA) 10 13 15 63 69 49 59Nongovernment owned . . 4,206 578 99 130 250 51 139 1,210 680 (S) 702
FLOORSPACE (mil. sq. ft.)
All buildings . . . . . 67,876 8,303 8,470 757 1,491 1,763 2,891 12,402 12,319 820 11,484Region:Northeast . . . . . . . . . 13,400 1,229 1,968 (S) 445 386 616 2,798 2,525 269 1,763Midwest . . . . . . . . . . 17,280 1,998 2,386 182 432 487 577 3,156 2,804 (S) 3,108South . . . . . . . . . . . . 24,577 3,635 2,620 245 407 597 1,043 4,233 4,152 238 4,964West. . . . . . . . . . . . . 12,619 1,441 1,496 209 208 292 654 2,214 2,838 (S) 1,649
Year constructed:1899 or before . . . . . . 1,721 (S) (S) (S) (S) (S) (S) 239 435 (NA) (S)1900 to 1919 . . . . . . . 3,608 575 441 (S) (S) (S) (S) 422 716 (S) 2691920 to 1945 . . . . . . . 8,712 850 1,077 (S) 246 227 410 1,381 1,389 (S) 1,8531946 to 1959 . . . . . . . 10,421 1,434 1,903 (S) 283 152 328 1,883 1,400 (S) 1,8051960 to 1969 . . . . . . . 12,612 1,180 2,405 (S) 187 492 482 2,680 2,187 (S) 1,8151970 to 1979 . . . . . . . 14,014 1,601 1,728 155 365 544 579 2,607 2,283 168 2,3971980 to 1986 . . . . . . . 10,149 819 480 (S) 103 240 550 2,109 2,419 (S) 2,2331987 to 1989 . . . . . . . 4,138 (S) 173 (S) (S) (S) (S) 535 899 (S) 6101990 to 1992 . . . . . . . 2,502 (S) 253 (S) (S) (S) 97 545 590 (S) 377
Government owned . . . . 15,124 (S) 6,961 (NA) 157 521 370 1,082 1,654 767 599Nongovernment owned . . 52,752 6,945 1,508 757 1,334 1,242 2,520 11,319 10,665 (S) 10,885
NA Not available. S Figure does not meet publication standards. 1 Includes parking garages, vacant, and othercommercial buildings, not shown separately. 2 Includes religious worship.
Source: U.S. Energy Information Administration, Commercial Building Characteristics, 1992.
No. 1208. Industrial Buildings—Floorspace and Vacancy Rates for Major Cities: 1995
CITYFLOORSPACE (sq. ft.) VACANCY RATES (percent)
Total Generalwarehouse
Officewarehouse 1 Total General
warehouseOffice
warehouse 1
Atlanta, GA . . . . . . . . . . . . . . . . . . . (NA) 138,327,298 111,040,435 (NA) 4.5 5.6Baltimore, MD . . . . . . . . . . . . . . . . . (NA) 96,071,812 24,442,980 (NA) 11.3 14.6Boston, MA . . . . . . . . . . . . . . . . . . . 46,907,777 (NA) (NA) 21.2 (NA) (NA)Charlotte, NC . . . . . . . . . . . . . . . . . (NA) 15,629,816 5,047,755 (NA) 14.2 8.5Dallas, TX. . . . . . . . . . . . . . . . . . . . (NA) 284,922,831 65,379,388 (NA) 7.5 8.3Denver, CO. . . . . . . . . . . . . . . . . . . (NA) 108,102,500 14,986,800 (NA) 4.0 13.0Detroit, MI. . . . . . . . . . . . . . . . . . . . 263,643,540 (NA) (NA) 8.6 (NA) (NA)Houston, TX . . . . . . . . . . . . . . . . . . (NA) 127,126,065 20,665,401 (NA) 14.0 19.0Indianapolis, IN . . . . . . . . . . . . . . . . (NA) 43,500,000 25,100,000 (NA) 2.5 10.0Kansas City, MO . . . . . . . . . . . . . . . (NA) 123,212,825 (NA) (NA) 13.4 (NA)Los Angeles, CA . . . . . . . . . . . . . . . 775,000,000 (NA) (NA) 12.0 (NA) (NA)Miami, FL . . . . . . . . . . . . . . . . . . . . (NA) 130,000,000 10,000,000 (NA) 7.5 9.5Milwaukee , WI . . . . . . . . . . . . . . . . (NA) (NA) 191,244,500 (NA) (NA) 4.2New Orleans, LA . . . . . . . . . . . . . . . (NA) (NA) (NA) (NA) (NA) (NA)New York, NY . . . . . . . . . . . . . . . . . (NA) (NA) (NA) (NA) (NA) (NA)Philadelphia, PA. . . . . . . . . . . . . . . . (NA) 99,000,000 37,000,000 (NA) 18.0 6.0Pittsburgh, PA . . . . . . . . . . . . . . . . . (NA) 12,600,000 6,700,000 (NA) 18.7 11.1San Diego, CA. . . . . . . . . . . . . . . . . (NA) 17,776,729 (NA) (NA) 11.0 (NA)San Francisco. CA . . . . . . . . . . . . . . (NA) (NA) (NA) (NA) (NA) (NA)Seattle, WA. . . . . . . . . . . . . . . . . . . (NA) 62,350,096 9,453,841 (NA) 4.3 2.8St. Louis, MO . . . . . . . . . . . . . . . . . 198,918,000 (NA) (NA) 4.0 (NA) (NA)Washington, DC. . . . . . . . . . . . . . . . 70,242,369 (NA) (NA) 13.4 (NA) (NA)
NA Not available. 1 Space is between 10 - 50 percent used for office.
Source: ONCOR International, Houston, TX, Market Data Book, 1995 (copyright).
Construction and Housing728