section 2 part 1 ohio hiraema.ohio.gov/documents/ohiomitigationplan/sohmp_sec_2_2.pdf · section 2:...
TRANSCRIPT

State of Ohio Hazard Mitigation Plan
Section 2: Hazard Identification & Risk Assessment 65
2.2 FLOOD
Floods are a natural and beneficial function of stream and lacustrine systems. Floods occur when streams or lakes overflow their banks and spill onto the adjoining land area, which is called a floodplain. Loss of life and property can result when people build structures and develop in flood hazard areas. Numerous factors can cause or exacerbate flooding in Ohio including: heavy and/or prolonged periods of rainfall, snowmelt, soil saturation, ground freeze, severe wind events, and inadequate drainage systems. Floods damage private and public property and infrastructure in Ohio every year. Flooding is the most frequently occurring natural disaster in Ohio and the United States.
RISK ASSESSMENT
The two major drainage basins in Ohio are the Lake Erie and Ohio River basins. Streams in the northern third of the state flow into Lake Erie and eventually into the Atlantic Ocean. Streams in the southern two-thirds of the state flow into the Ohio River and eventually into the Gulf of Mexico. Map 2.2.2.1.a displays the major Ohio watersheds.
There are many types of flooding that occur in Ohio including: riverine, flash flooding, coastal flooding, and shallow flooding. Riverine flooding is generally characterized by slower rising water, which allows for increased warning time but has the potential to last for longer periods of time. Ohio communities experience riverine flooding on both large basins and smaller tributary streams throughout the state. Major sources of riverine flooding in Ohio include the Ohio River, Scioto River, Great Miami River, Muskingum River, Hocking River, Maumee River, Sandusky River, Cuyahoga River, Grand River, Little Miami River, the Mahoning River and their larger tributaries.
Flash flooding can occur when a severe storm produces large amounts of rainfall in a short time. Flash flooding is generally characterized by high velocity water that rises and recedes quickly allowing little or no warning time to evacuate. Ohio’s Appalachian Region is particularly vulnerable to flash flooding because of the steep terrain and narrow stream valleys. Ohio’s urban areas also experience flash flooding that may be attributed to inadequate or poorly maintained storm water infrastructure, increase in impervious area, and loss of wetland areas. The U.S. Geological Survey has concluded that urbanization generally increases the size and frequency of floods and may increase a community’s flood risk.
Coastal flooding occurs in the counties that border Lake Erie. Flooding in coastal areas can be caused by stream overflow, wave run-up caused by strong winds, and higher than normal lake levels. Annual fluctuations in Lake Erie water levels are the result of seasonal changes and the amount of water flowing into and out of the lake. In-flow for Lake Erie includes drainage from the upper portion of the Great Lakes basin through the Detroit River, water from streams flowing directly into the lake, contribution from ground water, and from precipitation falling directly into the lake. Out-flow includes discharge into Lake Ontario through the Niagara River, evaporation, and any diversion or other withdrawals. Lake Erie

State of Ohio Hazard Mitigation Plan
Section 2: Hazard Identification & Risk Assessment 66
levels also exhibit a wider range of long-term fluctuations that are the result of prolonged and persistent deviation from average climatic conditions.
Shallow flooding occurs in flat areas with inadequate channels that prevent water from draining easily. There are four types of shallow flooding: sheet flow, ponding, urban drainage and rural drainage. Sheet flow flooding occurs in areas where channels are not defined. Sheet flow flooding moves downhill and covers a large area under a relatively uniform depth.
Ponding occurs in flat areas where runoff collects in depressions and cannot drain out. Ponding can occur where glaciers carved out depressions in the landscape, and where man-made features such as roads have blocked drainage outlets.
Urban drainage systems can include combinations of ditches, storm sewers, detention ponds, house gutters, and yard swales. When a rainfall event exceeds the design capacity of the drainage system, it can result in sewer back up and overflowing ditches. Basements are highly susceptible to flood damage caused by overloaded sewer and drainage systems. Urban drainage flooding can also occur behind levees when rainfall amounts exceed the capacity of pumps or other man-made systems designed to drain the areas protected by the levee.
Rural drainage flooding in northwest Ohio is similar to urban drainage flooding in Ohio’s cities and villages. Most of northwest Ohio was covered by a large swamp prior to European settlement that was subsequently drained and since used mainly for agriculture. The flat topography of this area is drained by an extensive system of ditches, swales, and small meandering streams. Rural flooding occurs when rainfall exceeds the design capacity of the drainage system.
Ohio’s river systems offer many benefits that have contributed to the development of the state such as: transportation, waste disposal, energy, commerce, recreation, and water supply. As a result, most major communities include development in flood hazard areas. Wetland areas have been developed, streamside forests have been removed, and streams have been straightened and channelized to allow for faster and increased runoff. After two centuries, these development patterns have drastically changed Ohio’s riparian ecosystems, and resulted in escalating flood damages.
Historical responses to flooding can be divided into three major era’s according to the Federal Interagency Floodplain Management Task Force. The Frontier Era (Pre-1917) is characterized by limited federal involvement in flood control or relief. During this time, many federal policies and programs encouraged land development with the common goal being “to conquer the wild landscape and to promote productive use of the land”. Flood hazards were the problem of the individual property owner, or dealt with cooperatively at the local level.
The Structural Era (1917-1959) is characterized by attempts to modify and control floodwater and get water off the land as quickly as possible. The federal government began assuming the costs to construct dams, levees, reservoirs, and
State of Ohio Hazard Mitigation Plan
Section 2: Hazard Identification & Risk Assessment 67
other large structural flood control projects. Near the end of this era resource managers began to realize that flood control projects were not eliminating flood damage and may be harming the environment.
During the Stewardship Era (1960-present), people began to recognize the important benefits and natural functions provided by floodplain areas such as natural flood and erosion control, water quality maintenance, groundwater recharge, recreation, wildlife habitat, agricultural production and many others. The responsibility of floodplain management began to shift from the federal government back to the local level. The federal government began to focus on providing financial assistance to reduce and recover from the impacts of flooding. Congress created the National Flood Insurance Program in 1968 as a response to mounting flood losses and increasing disaster relief costs. The intent of the program is to reduce future flood damage through community floodplain management ordinances, and provide an insurance alternative to federal disaster relief.
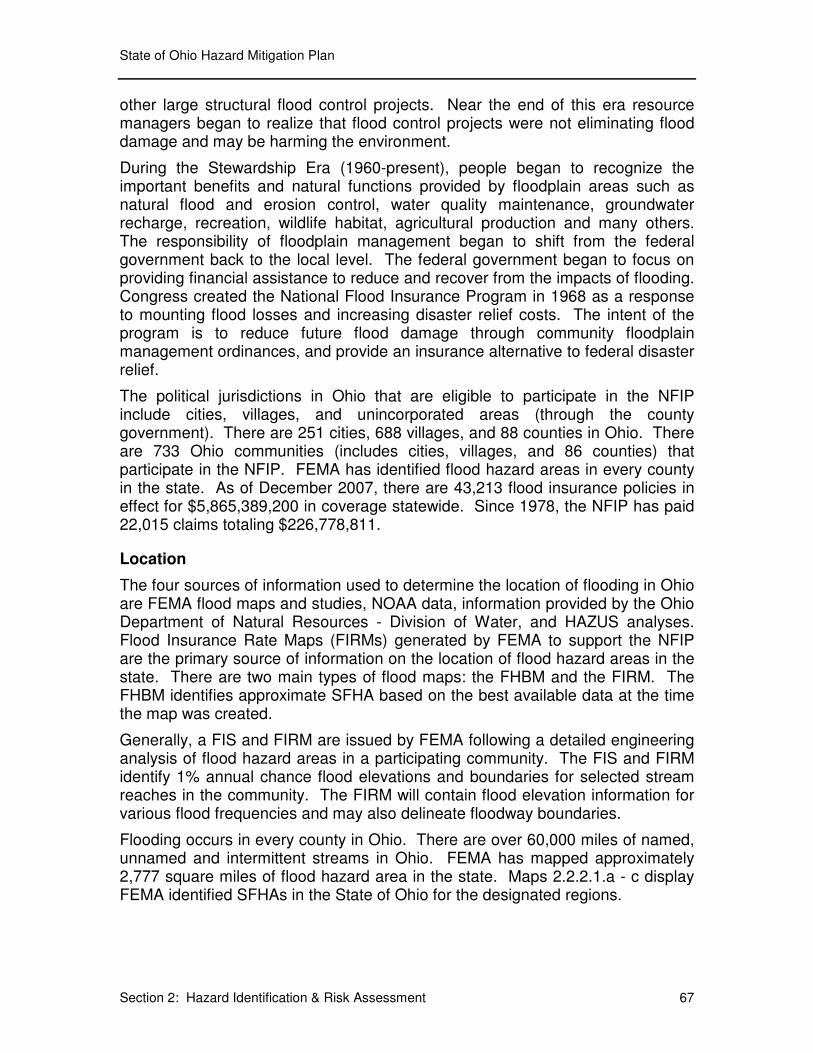
The political jurisdictions in Ohio that are eligible to participate in the NFIP include cities, villages, and unincorporated areas (through the county government). There are 251 cities, 688 villages, and 88 counties in Ohio. There are 733 Ohio communities (includes cities, villages, and 86 counties) that participate in the NFIP. FEMA has identified flood hazard areas in every county in the state. As of December 2007, there are 43,213 flood insurance policies in effect for $5,865,389,200 in coverage statewide. Since 1978, the NFIP has paid 22,015 claims totaling $226,778,811.
Location
The four sources of information used to determine the location of flooding in Ohio are FEMA flood maps and studies, NOAA data, information provided by the Ohio Department of Natural Resources - Division of Water, and HAZUS analyses. Flood Insurance Rate Maps (FIRMs) generated by FEMA to support the NFIP are the primary source of information on the location of flood hazard areas in the state. There are two main types of flood maps: the FHBM and the FIRM. The FHBM identifies approximate SFHA based on the best available data at the time the map was created.
Generally, a FIS and FIRM are issued by FEMA following a detailed engineering analysis of flood hazard areas in a participating community. The FIS and FIRM identify 1% annual chance flood elevations and boundaries for selected stream reaches in the community. The FIRM will contain flood elevation information for various flood frequencies and may also delineate floodway boundaries.
Flooding occurs in every county in Ohio. There are over 60,000 miles of named, unnamed and intermittent streams in Ohio. FEMA has mapped approximately 2,777 square miles of flood hazard area in the state. Maps 2.2.2.1.a - c display FEMA identified SFHAs in the State of Ohio for the designated regions.

State of Ohio Hazard Mitigation Plan
Section 2: Hazard Identification & Risk Assessment 68
Produced by Ohio EMA using HAZUS-MH 9/15/2004
Disclaimer: The information presented on this mapis the property of the Ohio Departments ofTransportation and Natural Resources. The OhioEMA does not guarantee its accuracy.
Legend
100_ year
County
(HAZUS-MH Build 31)
Region 1100 Year Floodplain
Scale 1 : 80,000
Map 2.2.2.1.a

State of Ohio Hazard Mitigation Plan
Section 2: Hazard Identification & Risk Assessment 69
Produced by Ohio EMA using HAZUS-MH 9/15/2004
Disclaimer: The information presented on this mapis the property of the Ohio Departments ofTransportation and Natural Resources. The OhioEMA does not guarantee its accuracy.
Region 2100 Year Floodplain
Legend
100_ year
County
(HAZUS-MH Build 31)
Map 2.2.2.1.b
Scale 1 : 80,000

State of Ohio Hazard Mitigation Plan
Section 2: Hazard Identification & Risk Assessment 70
Produced by Ohio EMA using HAZUS-MH 9/15/2004
Disclaimer: The information presented on this mapis the property of the Ohio Departments ofTransportation and Natural Resources. The OhioEMA does not guarantee its accuracy.
Region 3100 Year Floodplain
Legend
100_ year
County
(HAZUS-MH Build 31)Scale 1 : 80,000
Map 2.2.2.1.c

State of Ohio Hazard Mitigation Plan
Section 2: Hazard Identification & Risk Assessment 71
The National Oceanic and Atmospheric Administration’s NCDC Storm Events Database contains information on the location of flood events in Ohio. The database can be searched by county and includes a written description of the location of flood events reported in the state. The database also contains latitude and longitude values for some events. The database can be found on the NCDC website.
The Ohio Department of Natural Resources, Division of Water is mandated to be a state repository for flood hazard information in the Ohio Revised Code Section 1521.13(C)(2). The Floodplain Management Program maintains copies of flood hazard data generated by various federal, state, local, and private entities.
Past Occurrences
Profiling past occurrences of flooding at the state level involves gathering and compiling data from many different sources. The data sources used to profile the past occurrences of flooding include the Federal Emergency Management Agency, the Ohio Department Natural Resources, the Ohio Emergency Management Agency, the NOAA and the book Thunder in the Heartland by Thomas W. and Jeanne Applehans Schmidlin, 1996. Table 2.2.a displays a summary of historic flooding information from 1860 to 1990 based on the chronicle Thunder in the Heartland A Chronicle of Outstanding Weather Events in Ohio. More specific information on these events as well as events post 1990 can be found in the narrative of this section.

State of Ohio Hazard Mitigation Plan
Section 2: Hazard Identification & Risk Assessment 72
Table 2.2.a
Summary of Historic Flood Events 1860-19901
Date of Event Affected Area(s) Water Bodies Affected Event Description
8/12/1861 Columbiana County, Elkton, Lisbon
Beaver Creek, Elk Run Every home in Elkton was damaged and four persons drowned when one home was washed off its foundation.
2/17/1867 Toledo, Maumee Maumee River Ice jams destroyed one bridge and damaged several others. Flooding in downtown Toledo.
2/11/1881 Toledo, Grand Rapids, Columbus, Findlay
Maumee River, Scioto River, Blanchard River
Four bridges were damaged by ice jams and debris in Toledo. Flooding in downtown Toledo.
2/1883 Statewide Auglaize, Blanchard, Maumee, Portage, and Sandusky Rivers
A combination of snowmelt, ice jams, frozen ground and heavy rains caused flooding statewide.
2/14/1884 Statewide Ohio, Hocking, Maumee, and Muskingum Rivers
Second highest stage on the Ohio River in Cincinnati. Thousands were evacuated and 3000 buildings were submerged.
5/12/1886 Xenia Shawnee Creek Flash flooding washed away several homes killing 21 people and destroying one bridge.
1/23/1904 Lorain, Toledo, Waverly Black, Scioto, Mahoning and Maumee Rivers
Ships, bridges, and structures were damaged by ice jams and flooding.
3/14-18/1907 Ohio River Watershed Southern 2/3 of Ohio Large scale flooding in the Ohio River Watershed resulted in 32 casualties, hundreds of flooded structures, utility and infrastructure damage.
3/23-27/1913 Statewide Statewide
Described as "Ohio's Greatest Weather Disaster". Four days of heavy rain on saturated soils resulted in 467 casualties, over 2,200 homes destroyed, over 40,000 damaged, and over $2.5 Billion damage in 2003 dollars.
7/16/1914 Cambridge Wills Creek Watershed Over 7.09 inches of rain in 1.5 hours causing flash flooding.
8/16/1920 Toledo Maumee River Flash flooding in downtown Toledo damaged homes, businesses and infrastructure.

State of Ohio Hazard Mitigation Plan
Section 2: Hazard Identification & Risk Assessment 73
2/26/1929 Cleveland, Dayton, Mt. Vernon, Bridgeport, Springfield
Little Miami, Maumee, Miami, Rocky, Mad, and Kokosing Rivers, Wheeling and Buck Creeks
Two to three inches of rain, melting snow, and ice jams caused widespread flooding.
3/21/1933 Cincinnati and Southern Ohio
Ohio River Two periods of heavy rain cause widespread minor flooding.
8/7/1935 Coshocton and surrounding counties
Tuscarawas Watershed Heavy rain on saturated soils saturated soils caused flash flooding.
3/19/1936 Ohio River Communities from Pittsburgh to Steubenville
Upper Ohio River Snowmelt and heavy rains in Penn. and W. Virginia caused the Ohio River to rise 20 feet in two days.
1/26/1937 All Ohio River Communities Ohio River Described as the "Greatest Flood on the Ohio River". Record levels on the Ohio River from Gallipolis to the confluence with the Mississippi.
7/7/1943 Akron and Steubenville Cuyahoga River, Cross and Wills Creeks
Six to seven inches of rain in several hours caused flash flooding and landslides.
6/16/1946 Wayne and Holmes Counties
Killbuck and Salt Creeks Heavy rain caused flash flooding resulting in one death, a train wreck destroying 5 bridges and seriously damaging 55 others.
6/8/1947 Adams, Lawrence and Scioto Counties
South Fork of Scioto Brush Creek and other small tributaries to the south emptying into the Ohio River
Flash flooding damaged many homes, bridges, roads, and crops.
3/21/1948 Counties in the Lake Erie Watershed
Lake Erie Watershed The most severe damage was reported in along the Chagrin River in Cleveland. Twenty buildings were destroyed and 153 were damaged.
6/16/1950 Crooksville, Roseville Moxahala Creek Watershed One of the most intense rainfalls ever known in Ohio caused severe flood damages to homes and businesses.

State of Ohio Hazard Mitigation Plan
Section 2: Hazard Identification & Risk Assessment 74
1/21/1959 Statewide Statewide
Rainfall in January 1959 ranging from 3-6 inches on snow-covered, frozen ground caused the most severe statewide flooding since 1913. Streams reached flood stage from January 21-24 killing 16 people, forcing 49,000 people from their homes, and causing extensive damage to homes, businesses and infrastructure.
6/5/1963 Guernsey County Wills Creek Watershed
Official records indicate 7.95 inches of rainfall in 16-hours in Cambridge. One railroad bridge was destroyed, all major highways were inundated, and water supplies were polluted.
3/10/1964 Southern and Central Ohio All Streams in Southern and Central Ohio
Two periods of heavy rain cause widespread flooding resulting in eight deaths, thousands evacuated, 84 homes destroyed, and 8,200 damaged.
7/21/1964 Akron Ohio Canal and Little Cuyahoga River
Official records indicate 3.05 inches of rain in 75 minutes, but rain distribution was variable. The resulting flooding caused a sewer line to collapse a large section of road killing 3 people.
4/27/1966 Communities Along Lake Erie's Western Basin
Lake Erie's Western Basin
Several hours of winds up to 55 mph from the northeast pushed the western end of Lake Erie to flood stage. Fifteen hundred were evacuated, hundreds of homes were damaged, and utility services were interrupted.
7/12/1966 Erie, Ottawa, and Huron Counties
Sandusky and Huron River Watersheds
Rainfall totals ranging from 9-12 inches of rainfall over and approximately one-day period. Total damages exceed $27 million in 2003 dollars, including damages to 12,000 homes and businesses in Sandusky.
5/23-27/1968 Central and Southern Ohio Hocking, Scioto, Little Miami Two periods of heavy rain within 5 days on already saturated soils caused flooding on many streams. Four deaths have been attributed to this event.

State of Ohio Hazard Mitigation Plan
Section 2: Hazard Identification & Risk Assessment 75
7/4/1969 Northern Ohio Lake Erie Watershed
Severe thunderstorms moved from Lake Erie into Ohio’s coastal communities on July 4, 1969. Flooding combined with strong wind and tornadoes caused 41 deaths and injured 559 people. Loss estimates for this event totaled $65 million dollars in 1969, or over $328 billion in 2003 dollars.
11/14/1972 Coastal communities from Toledo to Cedar Point
Lake Erie
Northeast wind setup caused Lake Erie to rise 3 feet at Toledo and fall 4 feet at Buffalo resulting in coastal flooding. Total damages were estimated at $22 million in 1972 dollars.
4/9/1973 Coastal communities from Toledo to Port Clinton
Lake Erie Northeast winds caused 8 to 10 foot waves and flooding.
9/14/1979 Southeastern half of the state
The remains of Hurricane Frederic brought six inches of rain in a band from Cincinnati to Youngstown causing widespread flooding.
3/12/1982 Communities in the Maumee River Watershed
Maumee River Watershed Two inches of rainfall on snow covered, frozen ground caused flooding. Loss estimates totaled $11 million in 1982 dollars with Defiance County being the hardest hit.
6/14/1990 Shadyside in Belmont County
Pipe Creek and Wegee Creek
Twenty-six people died in a flash flood near Shadyside. Approximately 80 homes were destroyed and 250 were damaged. An estimated that 3-4 inches of rain fell in a little over an hour.
12/31/1990 Widespread Widespread The wettest year on record ended with extensive flooding on New Year's Eve causing $50 million (1990 dollars) in damages.
1 - Information summarized from the book: Thunder in the Heartland A Chronicle of Outstanding Weather Events in Ohio, Schmidlin, Thomas W., and Jeanne A., Kent State University Press, 1996.

State of Ohio Hazard Mitigation Plan
Section 2: Hazard Identification & Risk Assessment 76
Historically significant floods in Ohio occurred in 1913, 1937, 1959 and 1969. Heavy rain on saturated soils caused flooding throughout Ohio during March 23-27, 1913 killing 467 people, destroying 2,200 homes, and flooding 40,637 residences. Losses totaled $113 million in 1913 dollars ($2.28 billion in 2006 dollars) including; $78 million to buildings and personal property, $12 million to roads and bridges, $12 million to railroad property, which includes lost profit, $6 million to the agricultural industry, and $4 million dollars to machinery. This flood set record water levels on many Ohio streams. The Miami River watershed experienced the highest casualties and damages during this event.
The flood of record for the Ohio River occurred the last two weeks in January 1937. Normal January precipitation in Ohio is 2-3 inches. The statewide average rainfall in January 1937 was 9.57 inches, with some stations recording over 14 inches. Ohio River levels on January 26-27 were the highest ever recorded from Gallipolis, Ohio to the confluence with the Mississippi River. Every Ohio community along the river was flooded resulting in 10 casualties, 16 injuries, thousands of damaged structures, and over 54,000 evacuations statewide.
Rainfall in January 1959 ranging from 3-6 inches on snow-covered, frozen ground caused the most severe statewide flooding since 1913. Streams reached flood stage from January 21-24 killing 16 people, forcing 49,000 people from their homes, and causing extensive damage to homes, businesses and infrastructure. Loss estimates for this event totaled $100 million in 1959, or over $673 million in 2006 dollars. Some of the factors that reduced casualties and damages from the 1913 flood include: less intense rainfall amounts, the construction of flood-control reservoirs built after 1913, and improved emergency management procedures and capabilities.
Severe thunderstorms moved from Lake Erie into Ohio’s coastal communities on July 4, 1969. This line of storms became nearly stationary for more than eight hours aligned from Toledo southeast to Wooster. Official records indicate over 10 inches of over a 2-day period. Flooding combined with strong wind and tornadoes caused 41 deaths and injured 559 people. Loss estimates for this event totaled $65 million dollars in 1969, or over $364 million in 2006 dollars. This flood caused extensive damage to homes, businesses, infrastructure, utilities, boats and automobiles.
Twenty-six people died in a flash flood near Shadyside, Ohio on June 14, 1990. The National Weather Service estimated that 3-4 inches of rain fell in a little over an hour near Pipe Creek and Wegee Creek. Total rainfall is estimated at 5.5 inches in 3 hours. The saturated soils and narrow, steep-sided valleys caused the water to drain quickly into the creeks. Flash flooding began at 9:30 pm and was over in thirty minutes. During that time a wall of water six feet high (reported to be 20 feet in some areas) rushed through the valley at seven to ten miles per hour. Approximately 80 homes were destroyed and 250 were damaged.
Storms that produced heavy rains during March 1-2, 1997, resulted in severe flooding in southern Ohio. The largest accumulations of rainfall were recorded in

State of Ohio Hazard Mitigation Plan
Section 2: Hazard Identification & Risk Assessment 77
southern Adams and Brown Counties and ranged from 10-12 inches over the two-day period. Generally, rainfall amounts of 4 or more inches fell on most of the counties along or near the southern border of Ohio. Widespread damages to private and public property occurred throughout the area. Preliminary loss estimates totaled nearly $180 million in 1997, or over $224 million in 2006 dollars. Approximately 20,000 people were evacuated and 6,500 residences and 833 businesses were affected. Five deaths were attributed to flooding, all of the fatalities the result of attempts to drive through flooded roads.
Storms during June 26-30, 1998, resulted in flooding and widespread damage throughout much of central, east-central and southeastern Ohio. More than 10 inches of rain fell during a 4-day period in parts of southeast Ohio. Twelve storm or flood-related fatalities were reported and infrastructure and utilities were heavily impacted. Loss estimates totaled nearly $178 million in 1998, or over $217 million in 2006 dollars.
Since the last plan update, three flood events have resulted in Presidential disaster declarations. These three events are described below.
DR-1651-OH declared July 2, 2006
Severe thunderstorms and tornado touchdowns caused two deaths and widespread damage in northern Ohio from June 21-23, 2006. The primary causes of damage in this event were flash flooding, which overwhelmed urban stormwater infrastructure, and riverine flooding. Huron County and the City of Brecksville were especially hard hit. The communities of Toledo, Norwalk, Valley View and Independence also experienced significant flooding.
U.S. Geological Survey estimated flood recurrence intervals for gauged streams based on flood stage for this event. The flooding on the Vermilion River was estimated to be a 50-year event. The flooding on the Cuyahoga River and Tinkers Creek were estimated to be 25 to 50-year events.
DR-1656-OH declared August 1, 2006
Two separate weather systems produced storms resulting in more than 11 inches of rain in parts of Lake County, Ohio on July 27-28, 2006. As a result of the storms and ensuing flooding, the counties of Lake, Geauga and Ashtabula were declared Federal disaster areas. The flooding caused one fatality and 600 evacuations in Lake County. Over all of Lake County, 100 homes and businesses were destroyed and an additional 731 homes and businesses were damaged. Flooding destroyed five bridges in Lake County and closed 13 roads. The City of Painesville experienced heavy damages.
The U.S. Geological Survey streamflow-gaging station at the Grand River near Painesville, Ohio had record peak streamflow and peak stage. The recurrence interval for this event was estimated to be 500 years (Ebner, A.D.; Sherwood, J.M.; Astifan, Brian; and Lombardy, Kirk, 2007, Flood of July 27-31, 2006, on the Grand River near Painesville, Ohio: U.S. Geological Survey Open-File Report 2007-1164).

State of Ohio Hazard Mitigation Plan
Section 2: Hazard Identification & Risk Assessment 78
DR-1720-OH declared August 26, 2007
Heavy rainfall inundated multiple communities across northern Ohio during a 2-day period. The rain developed along a nearly stationary frontal boundary that was oriented from west to east across north central Ohio. Moisture from the Gulf of Mexico, as well as the remnants of Tropical Depression Erin, was drawn northward resulting in tropical downpours. The heaviest rains redeveloped each night, starting Sunday night August 19, 2007 into Monday morning and then again on Monday night into the early morning hours of Tuesday, August 21, 2007. Stream gage reports from four locations in the affected area indicate that 24-hour rainfall totals ending at 8 a.m. on August 21, 2007 exceeded the 1000 year/24 hour rainfall frequency. Peak flood stage of the Blanchard River in the City of Findlay was 0.04 less than the flood of record in 1913 (National Weather Service Forecast Office in Cleveland, Ohio).
Communities in the Blanchard, Sandusky and Mohican River watersheds were heavily impacted. There were approximately 2,500 flooded structures in the City of Findlay. Ottawa, Bucyrus, Shelby, Lima, Carey, and Bluffton also had many flooded structures. Recovery efforts are still progressing in these areas.
NOAA Data Summary
Table 2.2.b lists the number of reported floods in Ohio since the year 2000, and associated loss totals according to the NOAA’s NCDC Storm Events Database. The information in this database comes from NWS, which receives their data from a variety of sources including: county, state, and federal emergency management officials, local law enforcement officials, weather spotters, NWS damage surveys, newspaper clipping service, the insurance industry and the public. An effort is made to use the best available information but because of time and resource constraints, information from these sources may be unverified by the NWS.

State of Ohio Hazard Mitigation Plan
Section 2: Hazard Identification & Risk Assessment 79
Table 2.2.b
Year
Number of
Reported
Flood Events 2
Deaths Injuries
Estimated
Property
Damage ($) 3
Crop Damage
($)
2000 44 3 2 10.60 Million None Reported
2001 37 3 1 14.60 Million None Reported
2002 38 1 None Reported 2.56 Million None Reported
2003 63 4 None Reported 353.64 Million 2.95 Million
2004 40 2 None Reported 148.82 Million .97 Million
2005 39 3 None Reported 65.08 Million None Reported
2006 33 4 1 561.16 Million 38.36 Million
2007 1 21 None Reported None Reported 279.22 Million 16.50 Million
Total: 315 20 4 1.81707 Billion 58.78 Million
Ohio Flood Data Summary from the National Climatic Data Center
1 - The data for 2004 is from 1/1/07 to 8/31/07.
2 - The number of reported flood events was calculated by adding one record for each date in the data set.
3 - Property damage values prior to 2007 were converted to 2007 dollars.
Source: NOAA, NCDC, Storm Events Database
Probability of Future Events
The probability of occurrence of flooding is the likelihood that a specific event will happen. The likelihood of a flood event happening is usually expressed in terms of frequency. The NFIP provides maps and studies that use the 1% annual chance floodplain area (area inundated during a 100-year flood) as the national standard for regulating floodplain development. It is critical to establish the probability of occurrence for flooding so that the state and local communities can make informed decisions about the sustainability of future development, and determine the feasibility of proposed mitigation projects.
The primary sources of data for determining the probability of occurrence of flooding are the FEMA FIS and FIRM’s. Nearly every community that participates in the NFIP has a map that identifies at least some area of flood hazard in the community that has a 1% chance of being equaled or exceeded in any given year. This area is referred to as the 1% annual chance floodplain, or the 100-year floodplain and is graphically represented on a FIRM.
Communities that do not have a FIS, usually have a FHBM or FIRM that shows the approximate area that would be inundated by the 1% annual chance flood. A FHBM was intended for interim use in most communities, until a FIS could be completed. FHBM’s are still being used in some Ohio communities where a detailed FIS could not be justified. In some cases, FEMA issued a letter to the community converting the FHBM to a FIRM. Therefore, some FIRM’s contain the approximate area that would be inundated during the 1% annual chance flood.

State of Ohio Hazard Mitigation Plan
Section 2: Hazard Identification & Risk Assessment 80
Approximately 62% of Ohio communities that participate in the NFIP have a portion of their flood hazard areas identified in a FIS. The purpose of a FIS is to investigate the existence and severity of flood hazards in a certain geographic area. The information in a FIS is used to establish actuarial flood insurance rates and assist the community in its efforts to regulate flood hazard areas. A FIS contains data on: historical flood events, the area and flood sources studied, and the engineering methods employed to generate the flood hazard data. A FIS will have flood elevation profiles for the 100-year recurrence probability flood, and usually the 10-, 50-, and/or 500-year floods. A FIS may also contain tables summarizing floodway data and other flood hazard information. A FIS does not usually contain data for every flood hazard area in a community. The remaining areas may have approximate flood hazard data, or none at all.
There are several other possible data sources for determining the area affected by a particular probability flood event. The Ohio Department of Natural Resources, Division of Water is the state repository for flood hazard information and has copies of flood hazard information generated by various federal, state, local and private entities. The Floodplain Management Program maintains current copies of all FEMA Flood Insurance Studies and Flood Insurance Rate Map’s in the state.
LHMP Data
Based on a review of 30 county plans, flooding is identified as both the most widespread hazard and the one to which most communities are vulnerable.
Environmental Impacts
Flooding affects not only the local communities but also the environment. The impact to the environment is usually negative; but flooding also benefits the ecosystem. When a flood occurs, it carries with it sediment with vital nutrients for the soil. The sediment that revitalizes the soil, though, is a result of soil loss and erosion that has occurred upstream. In addition to the vital nutrients, floods help maintain vital wetland and floodplain ecosystems. The harm that a flood does to the environment comes mainly in the form of hazardous materials. Hazardous materials are carried away from flooded out properties and distributed throughout the floodplain. Industrial and agricultural chemicals and wastes, solid wastes, raw sewage, and common household chemicals comprise the majority of hazardous materials spread by flood waters. The pollution from these chemicals and wastes not only cost a considerable amount to clean up, but contaminate everything that they come in contact with, ranging from buildings to wildlife to a community’s water supply.

State of Ohio Hazard Mitigation Plan
Section 2: Hazard Identification & Risk Assessment 81
VULNERABILITY ANALYSIS
Flooding vulnerability is the likelihood of something to be damaged in a flood. A vulnerability analysis is a measurement of a community’s flood risk. Vulnerability can be measured using many different methods. The method selected is highly dependent on the type and format of available data. If site-specific information on flood elevation, lowest floor elevation, structure type, and replacement value exist, a detailed vulnerability analysis can be performed using flood damage curves. The State of Ohio, and most communities in the state lack all or a component of the data required for a detailed analysis and must use more simplified methods. Several different data sources are utilized in this discussion to help develop a clear picture of Ohio’s flood vulnerability including: data from local natural hazard mitigation plans, presidential disaster declaration data, the statewide Structure Inventory, NFIP repetitive loss data, and HAZUS-MH.
ODNR Structure Inventory
The ODNR, Division of Water, Floodplain Management Program has developed a statewide coverage of the federally identified 100-year floodplains. The 100-year flood hazard area coverage was combined with Digital Ortho Quarter Quadrangles to identify the structures located within the flood hazard area. Every structure in or near the 100-year floodplain is identified by a checkmark centered on the rooftop and has been assigned a unique structure ID number. The number assigned to each structure has been entered into a database. The database contains attribute fields for each structure including: structure use (residential, commercial etc.), lowest floor elevation, and Base Flood Elevation. The initial baseline of flood-prone structures and the accompanying database provide a tool that communities can use to develop comprehensive flood vulnerability analyses.
The Structure Inventory was created for each county in Ohio, and packaged on a compact disc (CD). Each county’s CD contains maps of their county’s digitized FEMA SFHA overlaid onto Digital Ortho Quarter Quadrangles. Each county’s map sets are clipped into 8.5 x 11 sheets that can be printed or viewed using free software provided on the CD.
According to the Structure Inventory, there are 139,644 structures in FEMA identified SFHA in the State of Ohio. Once a county’s structure inventory database is populated, it can be used to complete a risk assessment by: classifying flood-prone structures by address, use category, repetitive loss status, construction date, foundation type, construction type and several other categories. A populated structure inventory database can also distinguish between structures that have reduced risk because they are built in compliance with local flood damage prevention regulations, and those that are not. This will allow communities to track how and where they are reducing future flood risks. This tool can also be used to identify structures that may be good candidates for future mitigation projects.

State of Ohio Hazard Mitigation Plan
Section 2: Hazard Identification & Risk Assessment 82
The structure inventory can be used by counties to conduct a vulnerability analysis. This vulnerability analysis should include an accurate estimate of the value of flood-prone assets. The most accurate assessment of structure values in the State of Ohio is maintained at the individual county auditor’s offices. Each county auditor’s office maintains the current tax assessed value of structures in their county. However, most counties do not have this data available in a GIS format. Some counties do not have any computerized tax records, which makes this information difficult to access and compile. If a county auditor can provide the value of structures in the SFHA, it can be used with the structure inventory to provide improved vulnerability analyses.
Communities that are beginning the mitigation planning process, or updating their plan, will be encouraged to use the Structure Inventory to collect data about flood-prone structures in their community. Copies of the Structure Inventory were delivered to all county emergency management agency directors and every local floodplain administrator in the state prior to November 2004. As communities populate the structure inventory database and submit the data to the ODNR, Division of Water, Floodplain Management Program the accuracy of Ohio’s flood vulnerability analysis will improve.
For the purposes of the state plan, the structure inventory provides the most accurate quantification of potential structures as risk from flooding.
Presidential Disaster Declaration Data
Flood vulnerability can also be expressed as historic expenditures on disaster recovery for flood events. Total expenditures for programs triggered by a Presidential Disaster Declarations are tracked and summarized by Ohio EMA (Appendix A).
NFIP Repetitive Loss Properties
The NFIP has identified a subset of structures covered by flood insurance policies that are referred to as “repetitive loss” and “severe repetitive loss.”(see Appendix B). For this analysis, a repetitive loss structure is any property covered under an NFIP flood insurance policy with two or more losses in any 10-year rolling period. The NFIP has identified 1,707 structures in Ohio that meet this definition with a total combine building and content losses of $78,916,271.
Severe repetitive loss structures are defined as residential structures that are covered under an NFIP flood insurance policy and a) that has at least four NFIP claim payments (including building and contents) over $5,000 each, and the cumulative amount of such claims payments exceeds $20,000; or b) for which at least two separate claims payments (building payments only) have been made with the cumulative amount of the building portion of such claims exceeding the market value of the building. For both (a) and (b) above, at least two of the referenced claims must have occurred within any ten-year period, and must be greater than 10 days apart.

State of Ohio Hazard Mitigation Plan
Section 2: Hazard Identification & Risk Assessment 83
NFIP repetitive loss data can be used to identify some of the structures in the state vulnerable to flooding. In Ohio, it is estimated that approximately 75% of the structures in the SFHA are not covered by flood insurance for any number of reasons. Some reasons include: ignorance about flood insurance as a mitigation option; the structure is not required to be covered by flood insurance because there is no current mortgage; lack of resources to purchase coverage.
Recent legislation is focused on reducing the number of repetitive loss structures by offering mitigation options to the owners. FEMA mitigation grant programs have also prioritized the mitigation of repetitive loss structures including Severe Repetitive Loss, Repetitive Flood Claims, HMGP, FMA, and the PDM-C. The repetitive loss data should be used to identify areas that are repetitively flooded in a community. Given the current prioritization of repetitive loss structures, these structures should be considered when developing mitigation projects that utilize FEMA funding.
HAZUS-MH MR2 & MR3
For this update, Ohio EMA and ODNR cooperated with the US Army Corps of Engineers (USACE) to undertake a HAZUS analysis project under the USACE’s Planning Assistance to States program (50/50 cost share program). In this project, the ODNR-FPM and USACE combined to complete Level 1 flood analysis for 49 counties. The Corps analyzed Adams, Ashland, Athens, Coshocton, Delaware, Fairfield, Fayette, Franklin, Gallia, Guernsey, Harrison, Highland, Hocking, Holmes, Jackson, Knox, Lawrence, Licking, Madison, Marion, Medina, Meigs, Monroe, Morgan, Morrow, Muskingum, Noble, Perry, Pickaway, Pike, Richland, Ross, Scioto, Stark, Tuscarawas, Union, Vinton, Washington and Wayne Counties. The ODNR analyzed Belmont, Carroll, Columbiana, Jefferson, Mahoning, Portage, Summit and Trumbull. The goal was to complete 100 year and 25 year flood interval HAZUS analysis based on a 4 square mile drainage area. HAZUS periodically has difficulty processing specific stream segments and both project participants adjusted there efforts as needed to facilitate the final project. Copies of the HAZUS Global Summary Reports with detailed explanations and loss estimates for all runs are located in Appendix G. The remaining 39 counties are anticipated to have the same HAZUS analysis completed over the course of the next update cycle.
NOTE: It is important to interpret HAZUS-MH MR3 results with the clear understanding they are estimates and cannot be considered precise losses.
LOSS ESTIMATION
ODNR Structure Inventory
Each county (and communities within) is now able to identify the baseline number of structures at risk in identified flood hazard areas of their community. The attribute database will support the measurement of structures with reduced risk through NFIP compliance or mitigation actions (e.g. acquisitions, retrofits, and elevations).

State of Ohio Hazard Mitigation Plan
Section 2: Hazard Identification & Risk Assessment 84
Presidential Disaster Declaration Data
Since 1964 there has been $317,866,809 in Public Assistance funds, $350,061,597 in Individual Assistance funds, $51,357,235 in Hazard Mitigation Grant Program funds, $8,928,501 in State Controlling Board funds, $4,148,190 in State Disaster Relief Program funds, $20,151,111 in Natural Resources Conservation funds, $350,000 in Community Development Block Grant funds, and $27,920,664 in State funds used as to match federal funds spent as a result of disaster declarations related to floods within Ohio. The dollar totals listed above are not in current dollars and exclude insured and unreported losses.
NFIP Repetitive Loss Data
Appendix B list the repetitive loss properties by county and region, indicate the status of flood insurance, estimate the structure and content value, and demonstrate the number of flood losses per structure.
Region 1 has the lowest number of repetitive loss structures as identified by the NFIP (479). The amount paid out for repair of there structures through February 6, 2008 is $16,777,646. Within Region 1 the most significant concentration of repetitive loss structures is located in Ottawa and Erie Counties along Lake Erie. In total, Ottawa County has 128 repetitive loss structures identified, which have had $2,681,035 paid out for repairs from multiple losses. Erie County has 84 repetitive loss structures identified with 268 claims resulting in $2,439,345 in repairs paid out.
Region 2 is identified as having the second largest number of repetitive loss structures in the State. All of the counties within the region have identified repetitive loss structures. As a whole Region 2 has 571 repetitive loss structures identified. In total there has been $31,450,258, in repairs paid out for the identified properties. There are two areas of significant loss identified with in the region. Hamilton County is located in the southern portion of the state on the Ohio River. It has 119 repetitive loss structures with 327 claims for with $7,413,682, in repairs paid out. The second area includes Cuyahoga County and Lake County both situated in the northern portion of the state on Lake Erie. Cuyahoga County has 84 identified repetitive loss structures with 314 claims, which have had $12,023,828, paid out for repairs. Lake County has 52 identified repetitive loss structures with 154 claims for a total repair paid out value of $2,022,568.
Region 3 has the highest number of repetitive loss structures within the state. In total there are 657 repetitive loss structures with 1,595 reported claims totaling $30,988,366 in repairs paid out. The City of Marietta alone has 115 repetitive loss structures with 279 reported claims representing $7,523,951 in repairs paid out. Collectively the counties which boarder the Ohio River represent the largest exposure.

State of Ohio Hazard Mitigation Plan
Section 2: Hazard Identification & Risk Assessment 85
HAZUS-MH
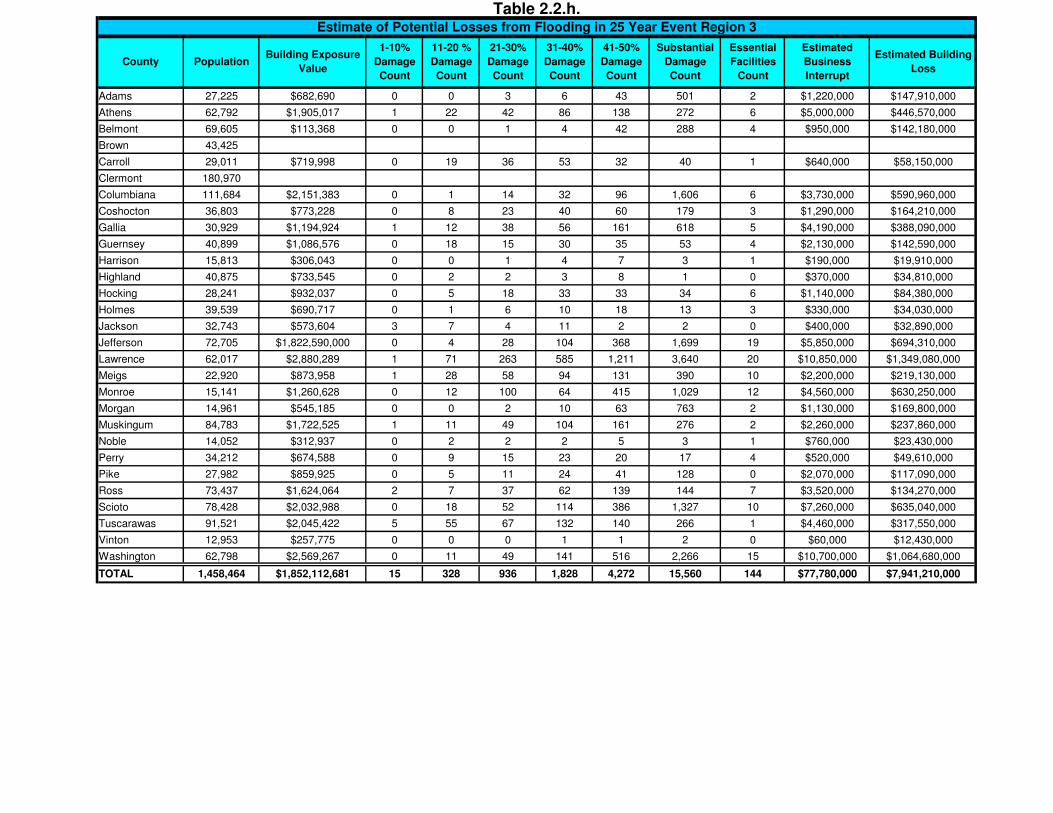
The results of the HAZUS-MH runs have been broken down by region and are reported by county for total building exposure, number of structures impacted by percentage damaged, number of critical facilities impacted, total business interruption losses and the total building loss (See Tables 2.2.c, 2.2.d, 2.2.e, 2.2.f, 2.2.g and 2.2.h). Tables ending in c, d and e contain the results based on a 100 year event while f, g and h contain the 25 year results. Here again it is important to remember all the information reported by HAZUS-MH is an estimate and cannot be interpreted as precise losses.
The counties not covered under the Level 1 analysis in this plan update were previously studied in a 2003 State-wide HAZUS analysis. The results from the 2003 analysis were deemed to be faulty and abandoned after repeated software failures and conversations with the software developer, who was aware of a problem with the loss estimation component and would be fixing it with the next version. A “Best Data Available” study, Appendix Z, was then conducted using the number of structures located within each county’s SFHA and multiplied that number by the median value of homes for that county. The analysis assumed that all the structures in the SFHA were residential, because the number of non-residential structures and their value could not be accurately determined at that time. The commercial structures and associate losses are an estimate only.

Allen 108,522
Auglaize 46,453
Champaign 39,210
Clark 143,969
Clinton 41,277
Craw ford 46,695 $1,027,247 0 8 15 23 23 19 0 $450,000 $53,320,000
Darke 53,178
Defiance 39,195
Erie 79,321
Fayette 28,387 $720,173 0 4 26 49 52 13 2 $400,000 $65,680,000
Fulton 42,334
Hancock 71,745
Hardin 31,945 $729,078 0 7 14 24 17 14 0 $540,000 $36,690,000
Henry 29,090
Huron 59,775
Logan 46,115
Lucas 454,029
Madison 40,158 $993,168 0 4 17 31 46 42 0 $300,000 $53,840,000
Marion 65,639 $949,651 1 5 29 66 88 40 6 $870,000 $86,980,000
Mercer 40,886
Miami 99,329
Morrow 32,319 $604,955 0 2 6 12 15 7 0 $230,000 $42,840,000
Ottaw a 41,036
Paulding 20,163
Preble 42,344
Putnam 34,741
Sandusky 61,653
Seneca 58,314 $1,708,396 0 11 44 74 102 88 0 $1,020,000 $152,990,000
Shelby 48,233
Union 40,909 $1,013,990 0 1 18 40 64 50 1 $480,000 $68,580,000
Van Wert 29,432
Williams 39,200
Wood 121,680
Wyandot 22,956 $711,737 0 5 17 17 23 8 0 $360,000 $41,800,000
TOTAL 2,200,232 $8,458,395 1 47 186 336 430 281 9 $4,650,000 $602,720,000
County Population
Building
Exposure
Value
1-10%
Damage
Count
Table 2.2.cEstimate of Potential Losses from Flooding in 100 Year Event Region 1
Substantial
Damage
Count
Essential
Facilities
Count
Estimated
Business
Interrupt
Estimated
Building Loss
11-20 %
Damage
Count
21-30%
Damage
Count
31-40%
Damage
Count
41-50%
Damage
Count

Ashland 52,786 $983,692 1 5 9 17 22 31 1 $1,220,000 $81,790,000
Ashtabula 102,729
Butler 335,992
Cuyahoga 1,384,252
Delaware 118,215 $2,648,854 0 9 24 44 89 131 4 $2,820,000 $168,200,000
Fairfield 125,109 $2,408,997 0 55 147 216 285 97 0 $2,720,000 $271,740,000
Franklin 1,081,784 $12,346,646 13 350 607 850 700 618 13 $21,160,000 $1,679,900,000
Geauga 92,294
Greene 148,530
Hamilton 838,134
Knox 55,250 $1,551,108 9 36 34 51 33 18 4 $1,370,000 $236,500,000
Lake 227,324
Licking 149,080 $3,341,506 5 68 108 157 198 185 4 $3,120,000 $331,060,000
Lorain 285,798
Mahoning 254,810 $3,047,225,000 2 23 30 46 28 9 0 $910,000 $129,110,000
Medina 154,718 1
Montgomery 553,579
Pickaway 52,840 0
Portage 153,056 $2,513,342,000 1 9 28 66 54 57 1 $990,000 $139,080,000
Richland 128,549 $1,712,439 0 11 17 29 35 12 3 $1,110,000 $157,290,000
Stark 378,098 $5,239,841 18 108 119 184 155 92 0 $6,030,000 $463,210,000
Summit 542,899 $6,441,938,000 4 119 151 180 147 66 5 $4,620,000 $487,190,000
Trumbull 223,513 $3,618,659,000 0 7 47 115 353 1,110 5 $4,860,000 $733,140,000
Warren 168,229
Wayne 112,274 $1,981,029 1 18 17 36 24 16 2 $1,030,000 $131,120,000
TOTAL 7,719,842 $15,653,378,112 54 818 1,338 1,991 2,123 2,442 43 $51,960,000 $5,009,330,000
Table 2.2.dEstimate of Potential Losses from Flooding in 100 Year Event Region 2
Substantial
Damage
Count
Essential
Facilities
Count
Estimated
Business
Interrupt
Estimated Building
Loss
11-20 %
Damage
Count
21-30%
Damage
Count
31-40%
Damage
Count
41-50%
Damage
Count
County PopulationBuilding Exposure
Value
1-10%
Damage
Count

Adams 27,225 $682,584 0 0 0 7 36 559 2 $1,240,000 $155,190,000
Athens 62,792 $1,765,399 0 28 51 88 156 316 11 $6,060,000 $511,860,000
Belmont 69,605 $1,138,503,000 0 0 1 6 46 332 3 $960,000 $154,830,000
Brown 43,425
Carroll 29,011 $730,209,000 2 18 46 64 52 49 3 $650,000 $66,270,000
Clermont 180,970
Columbiana 111,684 $2,177,124,000 0 2 14 27 85 1,795 7 $3,860,000 $634,560,000
Coshocton 36,803 $857,993 0 10 24 53 67 213 3 $1,510,000 $192,490,000
Gallia 30,929 $1,220,816 1 24 45 91 203 719 5 $5,160,000 $461,650,000
Guernsey 40,899 $1,107,630 1 13 16 50 47 84 3 $2,810,000 $152,520,000
Harrison 15,813 $306,687 0 0 1 6 11 5 1 $210,000 $22,990,000
Highland 40,875 $742,915 0 2 2 5 8 1 0 $410,000 $40,590,000
Hocking 28,241 $946,995 0 7 30 41 45 51 6 $1,290,000 $103,020,000
Holmes 39,539 $712,710 0 1 6 12 26 15 2 $360,000 $40,950,000
Jackson 32,743 $611,569 1 7 7 12 11 3 0 $400,000 $39,520,000
Jefferson 72,705 $1,932,238,000 0 5 26 78 353 1,992 25 $7,380,000 $817,470,000
Lawrence 62,017 $2,930,308 1 58 236 522 1,355 4,306 21 $12,060,000 $1,528,600,000
Meigs 22,920 $896,860 0 14 50 83 221 549 10 $2,510,000 $271,900,000
Monroe 15,141 $1,887,497 0 8 116 88 552 1,562 14 $6,750,000 $875,790,000
Morgan 14,961 $575,845 0 1 2 10 48 894 2 $1,440,000 $201,710,000
Muskingum 84,783 $1,770,099 1 8 49 107 206 368 3 $2,670,000 $286,340,000
Noble 14,052 $317,128 0 2 2 3 6 6 1 $840,000 $27,600,000
Perry 34,212 $695,152 0 8 16 32 27 26 6 $590,000 $58,400,000
Pike 27,982 $890,437 0 5 11 28 52 172 1 $2,360,000 $144,500,000
Ross 73,437 $1,655,760 4 11 39 87 146 224 7 $4,400,000 $178,740,000
Scioto 78,428 $2,448,603 0 62 136 242 532 1,689 15 $13,330,000 $1,090,740,000
Tuscarawas 91,521 $2,142,377 5 67 81 142 187 311 2 $4,760,000 $362,750,000
Vinton 12,953 $269,073 0 0 1 2 2 4 0 $70,000 $14,700,000
Washington 62,798 $2,604,032 0 2 22 71 420 2,839 15 $11,950,000 $1,230,710,000
TOTAL 1,458,464 $6,006,112,469 16 363 1,030 1,957 4,900 19,084 168 $96,030,000 $9,666,390,000
County PopulationBuilding Exposure
Value
1-10%
Damage
Count
Table 2.2.eEstimate of Potential Losses from Flooding in 100 Year Event Region 3
Substantial
Damage
Count
Essential
Facilities
Count
Estimated
Business
Interrupt
Estimated Building
Loss
11-20 %
Damage
Count
21-30%
Damage
Count
31-40%
Damage
Count
41-50%
Damage
Count

Allen 108,522
Auglaize 46,453
Champaign 39,210
Clark 143,969
Clinton 41,277
Crawford 46,695
Darke 53,178
Defiance 39,195
Erie 79,321
Fayette 28,387 $689,367 0 6 24 44 33 6 2 $350,000 $55,560,000
Fulton 42,334
Hancock 71,745
Hardin 31,945
Henry 29,090
Huron 59,775
Logan 46,115
Lucas 454,029
Madison 40,158 $962,701 0 4 17 29 35 25 0 $250,000 $44,830,000
Marion 65,639 $925,897 0 8 24 69 49 35 6 $770,000 $73,150,000
Mercer 40,886
Miami 99,329
Morrow 32,319 $604,955 0 2 4 9 11 2 0 $210,000 $35,210,000
Ottawa 41,036
Paulding 20,163
Preble 42,344
Putnam 34,741
Sandusky 61,653
Seneca 58,314
Shelby 48,233
Union 40,909 $1,002,502 0 2 19 40 50 32 1 $390,000 $56,720,000
Van Wert 29,432
Williams 39,200
Wood 121,680
Wyandot 22,956
TOTAL 2,200,232 $4,185,422 0 22 88 191 178 100 9 $1,970,000 $265,470,000
County PopulationBuilding
Exposure Value
1-10%
Damage
Count
Table 2.2.fEstimate of Potential Losses from Flooding in 25 Year Event Region 1
Substantial
Damage
Count
Essential
Facilities
Count
Estimated
Business
Interrupt
Estimated
Building Loss
11-20 %
Damage
Count
21-30%
Damage
Count
31-40%
Damage
Count
41-50%
Damage
Count

Ashland 52,786 $917,082 0 4 8 14 22 23 1 $1,060,000 $68,630,000
Ashtabula 102,729
Butler 335,992
Cuyahoga 1,384,252
Delaware 118,215 $2,563,361 1 9 22 35 88 108 2 $2,500,000 $142,790,000
Fairfield 125,109 $2,394,111 0 70 120 188 129 39 0 $2,410,000 $212,350,000
Franklin 1,081,784 $11,773,875 17 309 515 714 574 483 11 $18,180,000 $1,398,090,000
Geauga 92,294
Greene 148,530
Hamilton 838,134
Knox 55,250 $1,525,703 9 43 32 53 22 10 4 $1,270,000 $210,650,000
Lake 227,324
Licking 149,080 $3,248,406 6 53 91 122 155 126 4 $2,670,000 $270,130,000
Lorain 285,798
Mahoning 254,810 $4,530,347,000 2 23 24 29 24 9 1 $1,290,000 $146,360,000
Medina 154,718 $1,944,407 0 10 16 31 22 8 0 $600,000 $82,070,000
Montgomery 553,579
Pickaway 52,840 $1,058,796 2 7 22 37 35 34 0 $1,310,000 $76,490,000
Portage 153,056 $2,504,064 1 12 37 65 48 59 1 $940,000 $130,740,000
Richland 128,549 $1,669,181 0 10 15 33 18 6 3 $930,000 $128,920,000
Stark 378,098 $5,033,947 20 83 111 156 120 63 11 $5,310,000 $385,790,000
Summit 542,899 $6,621,053,000 6 94 103 112 74 33 5 $4,140,000 $404,480,000
Trumbull 223,513 $3,415,604,000 0 9 47 92 272 857 5 $4,210,000 $616,500,000
Warren 168,229 $1,929,834 3 12 11 27 12 11 2 $930,000 $107,800,000
Wayne 112,274
TOTAL 7,719,842 $14,603,566,767 67 748 1,174 1,708 1,615 1,869 50 $47,750,000 $4,381,790,000
County PopulationBuilding
Exposure Value
1-10%
Damage
Count
Table 2.2.gEstimate of Potential Losses from Flooding in 25 Year Event Region 2
Substantial
Damage
Count
Essential
Facilities
Count
Estimated
Business
Interrupt
Estimated Building
Loss
11-20 %
Damage
Count
21-30%
Damage
Count
31-40%
Damage
Count
41-50%
Damage
Count
Adams 27,225 $682,690 0 0 3 6 43 501 2 $1,220,000 $147,910,000
Athens 62,792 $1,905,017 1 22 42 86 138 272 6 $5,000,000 $446,570,000
Belmont 69,605 $113,368 0 0 1 4 42 288 4 $950,000 $142,180,000
Brown 43,425
Carroll 29,011 $719,998 0 19 36 53 32 40 1 $640,000 $58,150,000
Clermont 180,970
Columbiana 111,684 $2,151,383 0 1 14 32 96 1,606 6 $3,730,000 $590,960,000
Coshocton 36,803 $773,228 0 8 23 40 60 179 3 $1,290,000 $164,210,000
Gallia 30,929 $1,194,924 1 12 38 56 161 618 5 $4,190,000 $388,090,000
Guernsey 40,899 $1,086,576 0 18 15 30 35 53 4 $2,130,000 $142,590,000
Harrison 15,813 $306,043 0 0 1 4 7 3 1 $190,000 $19,910,000
Highland 40,875 $733,545 0 2 2 3 8 1 0 $370,000 $34,810,000
Hocking 28,241 $932,037 0 5 18 33 33 34 6 $1,140,000 $84,380,000
Holmes 39,539 $690,717 0 1 6 10 18 13 3 $330,000 $34,030,000
Jackson 32,743 $573,604 3 7 4 11 2 2 0 $400,000 $32,890,000
Jefferson 72,705 $1,822,590,000 0 4 28 104 368 1,699 19 $5,850,000 $694,310,000
Lawrence 62,017 $2,880,289 1 71 263 585 1,211 3,640 20 $10,850,000 $1,349,080,000
Meigs 22,920 $873,958 1 28 58 94 131 390 10 $2,200,000 $219,130,000
Monroe 15,141 $1,260,628 0 12 100 64 415 1,029 12 $4,560,000 $630,250,000
Morgan 14,961 $545,185 0 0 2 10 63 763 2 $1,130,000 $169,800,000
Muskingum 84,783 $1,722,525 1 11 49 104 161 276 2 $2,260,000 $237,860,000
Noble 14,052 $312,937 0 2 2 2 5 3 1 $760,000 $23,430,000
Perry 34,212 $674,588 0 9 15 23 20 17 4 $520,000 $49,610,000
Pike 27,982 $859,925 0 5 11 24 41 128 0 $2,070,000 $117,090,000
Ross 73,437 $1,624,064 2 7 37 62 139 144 7 $3,520,000 $134,270,000
Scioto 78,428 $2,032,988 0 18 52 114 386 1,327 10 $7,260,000 $635,040,000
Tuscarawas 91,521 $2,045,422 5 55 67 132 140 266 1 $4,460,000 $317,550,000
Vinton 12,953 $257,775 0 0 0 1 1 2 0 $60,000 $12,430,000
Washington 62,798 $2,569,267 0 11 49 141 516 2,266 15 $10,700,000 $1,064,680,000
TOTAL 1,458,464 $1,852,112,681 15 328 936 1,828 4,272 15,560 144 $77,780,000 $7,941,210,000
Table 2.2.h.Estimate of Potential Losses from Flooding in 25 Year Event Region 3
Substantial
Damage
Count
Essential
Facilities
Count
Estimated
Business
Interrupt
Estimated Building
Loss
11-20 %
Damage
Count
21-30%
Damage
Count
31-40%
Damage
Count
41-50%
Damage
Count
County PopulationBuilding Exposure
Value
1-10%
Damage
Count

State of Ohio Hazard Mitigation Plan
Section 2: Hazard Identification & Risk Assessment 92
Region 1 collectively has $4,281,937 in total building exposure to flooding for 100 year event. A total of 152 structures are estimated to be substantially damaged meaning 50 percent or more of the structures values has been impacted by the event. There are an estimated 9 critical facilities impacted which include police, fire, hospitals and schools. The overall estimated building loss is $317,920,000 with an additional $2,280,000 in business interruption. Changing to a 25 year event, the region has $4,185,422 in total building exposure to flooding. A total of 100 structures are estimated to be substantially damaged. There are an estimated 9 critical facilities impacted. Finally, the overall estimated building loss is $265,470,000, with an additional $1,970,000 in business interruption.
Region 2 collectively has $15,653,378,112 in total building exposure to flooding for 100 year event. A total of 2,442 structures are estimated to be substantially damaged, meaning 50 percent or more of the structures values has been impacted by the event. There are an estimated 43 critical facilities impacted which include police, fire, hospitals and schools. The overall estimated building loss is $5,009,330,000, with an additional $51,960,000 in business interruption. Changing to a 25 year event, the region has $14,603,566,767 in total building exposure to flooding. A total of 1,869 structures are estimated to be substantially damaged. There are an estimated 50 critical facilities impacted. Finally, the overall estimated building loss is $4,381,790,000 with an additional $47,750,000 in business interruption. According to the HAZUS-MH runs, there appears to be more critical facilities impacted during a 25 year event than a 100 year event. We have no explanation for this occurrence.
Region 3 collectively has $6,006,112,469 in total building exposure to flooding for 100 year event. A total of 19,084 structures are estimated to be substantially damaged, meaning 50 percent or more of the structures values has been impacted by the event. There are an estimated 168 critical facilities impacted which include police, fire, hospitals and schools. The overall estimated building loss is $9,666,390,000 with an additional $96,030,000 in business interruption. Changing to a 25 year event, the region has $1,852,112,681 in total building exposure to flooding. A total of 15,560 structures are estimated to be substantially damaged. There are an estimated 144 critical facilities impacted. Finally, the overall estimated building loss is $7,941,210,000 with an additional $77,780,000 in business interruption.
STATE OWNED / CRITICAL FACILITIES VULNERABILITY ANALYSIS & LOSS ESTIMATION
The estimate for losses to state owned facilities was developed using the existing state owned structure inventory geolayer and ODNR county floodplain geolayers. Table 2.1.a presents the total exposure of state owned facilities collected to date for Ohio.
Region 1 has two structures valued at $2,751,961 in the 100-year floodplain. Based on a 25 percent lost estimate the cost would be $687,990. Both structures are part of the Seneca county MRDD campus located near Tiffin. This region contains the largest number of counties yet to be inventoried. Once

State of Ohio Hazard Mitigation Plan
Section 2: Hazard Identification & Risk Assessment 93
significant Lake Erie coastal counties are included there may be significant changes.
Region 2 has four structures valued at $7,180,500 in the 100-year floodplain. Three structures are in the Delaware State Park and the remaining structure is a medical corrections center in Columbus. Losses to these structures at an estimated 25% would be $1,795,125. There are two anomalies in the analysis of Region 2. First, there are seven Halls on the OSU campus, associated with OSU Hospitals, which are in the floodplain. The value of the buildings was not provided to URS during their inventory. Structural damage to the buildings would be minimal; however, if flooded, the cost of emergency operations and repairing flooded underground connecting tunnels would cause an economic loss. The OSU Medical Hospitals are one of four major hospital campuses in the area. There is no indication that the remaining medical facilities would be overwhelmed during a flood event. The second anomaly is a collection of buildings in Columbus, which is located in an area that was removed from the floodplain by the construction of a floodwall. The ODNR floodplain map does not reflect this change, but the structures are no longer considered flood prone.
Region 3 has six structures across four counties in the floodplain. The first is a rest area on OH I77 in Guernsey County. Second is a correctional dormitory in Tuscarawas County. Third, is Washington County with the Office of Jobs and Family Services in the heavily exposed City to Marietta and a portion of an ODOT compound. Finally, Columbiana County has two pottery museums. In Combined the risk exposure is $5,066,888 with an anticipated loss (at 25%) of $1,266,788.