2.6 dam/levee failure - odps | ohio emergency...
TRANSCRIPT
State of Ohio Enhanced Hazard Mitigation Plan Rev. January 2011
Section 2: HIRA 149
2.6 DAM/LEVEE FAILURE
Dam Failure
A dam is defined as an artificial barrier that is usually constructed across a stream channel to impound water. A dam failure is defined as an uncontrolled release of that impounded water. The causes of dam failures can be divided into three groups: dam overtopping, excessive seepage, and structural failure of a component. Despite efforts to provide sufficient structural integrity and to perform inspection and maintenance, problems can develop that can lead to failure. While most dams have storage volumes small enough that failures would have little or no consequences, dams with large storage amounts could cause significant flooding downstream.
Dam failures can result from any one or a combination of the following causes:
Prolonged periods of rainfall and flooding;
Inadequate spillway capacity, resulting in excess overtopping flows;
Internal erosion caused by embankment or foundation leakage or piping;
Improper maintenance, including failure to remove trees, repair internal seepage problems, replace lost material from the cross section of the dam and abutments, or maintain gates, valves, and other operational components;
Improper design, including the use of improper construction materials and construction practices;
Improper operation, including the failure to remove or open gates or valves during high flow periods;
Failure of upstream dams on the same waterway that release water to a downstream dam;
Earthquakes, which typically cause longitudinal cracks at the tops of the embankments that can weaken entire structures.
In terms of emergency management, dam failures are categorized as either sunny day failures or rainy day failures. Sunny day failures occur during a non-flooding situation with the reservoir near normal pool level. Rainy day failures usually involve periods of rainfall and flooding, and can exacerbate inadequate spillway capacity. Improper design of a spillway or operation of gates during high flows can lead to excessive water pressure and subsequent failure as well. Even though both types of failures can be disastrous, it can be assumed that a sunny day failure would be more catastrophic due to its unanticipated occurrence and the lack of time to warn residents downstream.
Dams are complicated structures, and it can be difficult to predict how a structure will respond to distress. ―… the modes and causes of failure are varied, multiple, and often complex and interrelated, i.e., often the triggering cause may not truly have resulted in failure had the dam not had a secondary weakness. These
State of Ohio Enhanced Hazard Mitigation Plan Rev. January 2011
Section 2: HIRA 150
causes illustrate the need for careful, critical review of all facets of a dam‖ (Safety of Existing Dams, 1983).
Levee Failure
A levee is any artificial barrier together with appurtenant works that will divert or restrain the flow of a stream or other body of water for the purpose of protecting an area from inundation by flood waters. Generally, a levee is subjected to water loading during a few days or weeks in a given year; unlike a dam that is retaining water most days in the same year.
A levee breach results when a portion of the levee breaks away, providing an opening for water to flood the landward side of the structure. Such breaches can be caused by surface erosion due to water velocities, or they can be the result of subsurface actions. Subsurface actions usually involve sand boils whereby the upward pressure of water flowing through porous soil under the levee exceeds the static pressure of the soil weight above it (i.e., underseepage). These boils can indicate instability of the levee foundation given the liquefied substrate below it, leading way to breaching. Levee overtopping is similar to dam overtopping in that the flood waters simply exceed the design capacity of the structure, thus flowing over the lowest crest of the system. Such overtopping can lead to erosion on the landward side which, subsequently, can lead to breaching. In order to prevent this type landward erosion, many levees are reinforced or armored with rocks or concrete.
Authority and Responsibility
The Ohio Department of Natural Resources, Division of Soil and Water Resources - Dam Safety Program (DSP) has the responsibility to ensure that human life, health and property are protected from dam and levee failures. The program achieves its core purpose by performing five main functions:
Emergency response – Assessing the conditions of dams during severe floods and emergency’s, taking action to correct dams that pose an immediate threat to public safety, providing timely and best-available information to other agencies and the public during disasters, and supporting mandate Ohio Revised Code (ORC) Section 1521.062;
Construction permits – Ensuring that dams and levees are designed and constructed in accordance with proper engineering standards and OAC rules, reviewing construction plans and specifications, performing calculations and investigations, issuing permits, and monitoring/approving construction;
Repairs and modifications -- Ensuring that dams and levees are repaired in accordance with proper engineering standards and OAC rules, reviewing construction plans and specifications, performing calculations and investigations, issuing permits, and monitoring/approving construction, and supporting mandate ORC Section 1521.062;
State of Ohio Enhanced Hazard Mitigation Plan Rev. January 2011
Section 2: HIRA 151
Periodic safety inspections –Inspecting Class I-III dams once every five years, monitoring the overall condition of Ohio’s dams, providing data for the National Performance of Dams Program (NPDP), and supporting mandate ORC Section 1521.062; Enforcement – Requiring dam and levee owners to improve safety when efforts for voluntary compliance have been unsuccessful and focusing on Class I dams with dense populations downstream; and
Public information – Providing data security for Ohio EMA, US Army Corps of Engineers (USACE), the National Guard, Ohio EPA, as well as the state and federal legislatures, providing dam and levee owners and engineers with technical information and access to division files, educating the public about dam safety and providing quality data, and giving presentations for EPA, Water Management Association of Ohio (WMAO), and the Ohio Legislative Correspondents Association (OLCA).
The ORC provides the authority for the program to regulate dam and levee safety and dictates the responsibilities of the program as well as the responsibilities of the dam and levee owners. The program has jurisdiction over approximately 2,701 dams in Ohio, of which 416 are Class I (highest hazard); DSP does not have jurisdiction over Federal dams. USACE presides over most of those Federal dams, and ensures they are operated and maintained properly. An accurate inventory of levees is not completed currently. However, there are several systems that have been inventoried by the State, and several being assessed through FEMA’s Risk Analysis Division. They will be discussed later in this section.
RISK ASSESSMENT
Dams—Location
In Ohio there are 5,786 known structures that retain or detain water, and these are included in ODNR’s inventory of dams (DSP data, September, 2010). The volume of water impounded, and the density, type, and value of development downstream determine the potential severity and potential classification of dam. The 2008 Update analyzed data from USACE’s National Inventory of Dams (NID). However, these data only represented a portion of the dams regulated by the State of Ohio. Therefore, a more complete list was obtained from ODNR’s inventory for this 2011 Update, and these data are dated September, 2010.
The ODNR DSP classifies dams as Class I, Class II, Class III, and Class IV dams, with Class I being the highest and Class IV the lowest (see Table 2.6.a). The classification of a dam is based on three factors: the dam’s height, storage capacity, and potential downstream hazard. The height of the dam is the vertical distance from the crest to the downstream toe. The storage capacity is the volume of water that the dam can impound at the top of dam (crest) elevation. The downstream hazard consists of roads, buildings, homes, and other structures that would be damaged in the event of a dam failure. Potential for loss of life is also evaluated. Various dam failure scenarios must be considered, and
State of Ohio Enhanced Hazard Mitigation Plan Rev. January 2011
Section 2: HIRA 152
they include failures when the dam is at normal pool level (sunny day) and failures during significant flood events (rainy day). Each of the three factors is evaluated, and the final classification of the dam is based on the highest individual factor. The classification of a dam can change based on future development along the downstream channel. It is important to note all classes are required to have EAPs and Class I’s are required to include dam failure inundation mapping. The 2008 Plan Update evaluated the dams throughout the State by their corresponding Federal Classification (Table 2.6.a). However, dam data are provided to county EMA directors by DSP and are classified using the Ohio Classification System. Therefore, the 2011 Update will evaluate the most current DSP data (September, 2010) and will maintain the Ohio Classification so as to limit confusion for local EMA directors.
Table 2.6.a
Ohio and Federal Dam Classification Systems
Ohio Dam Classification
Description Corresponding Federal Classification
Class I Probable loss of life, serious hazard to health, structural damage to high value property (i.e., homes, industries, major public utilities)
High
Class II Flood water damage to homes, businesses, industrial structures (no loss of life envisioned), damage to state and interstate highways, railroads, only access to residential areas
Significant
Class III Damage to low value non- residential structures, local roads, agricultural crops and livestock
Significant
Class IV Losses restricted mainly to the dam Low
Source: http://www.dnr.state.oh.us/tabid/3342/Default.aspx
This Update will focus on Class I dams as they are deemed as having the most potential for loss of life, greatest hazards to health, and causing the most structural damage should any of them fail. Classes II and III also will be evaluated to a slight degree since their failure would most likely result in damages to homes, businesses, infrastructure, but no loss of life is likely.
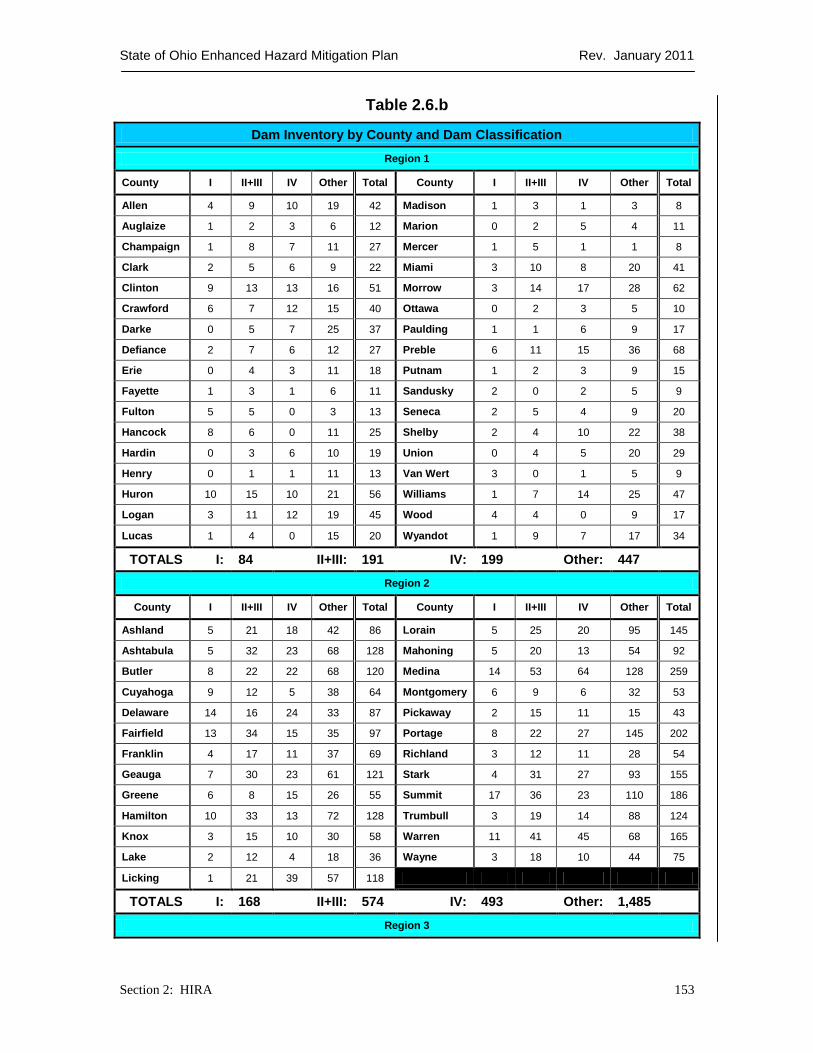
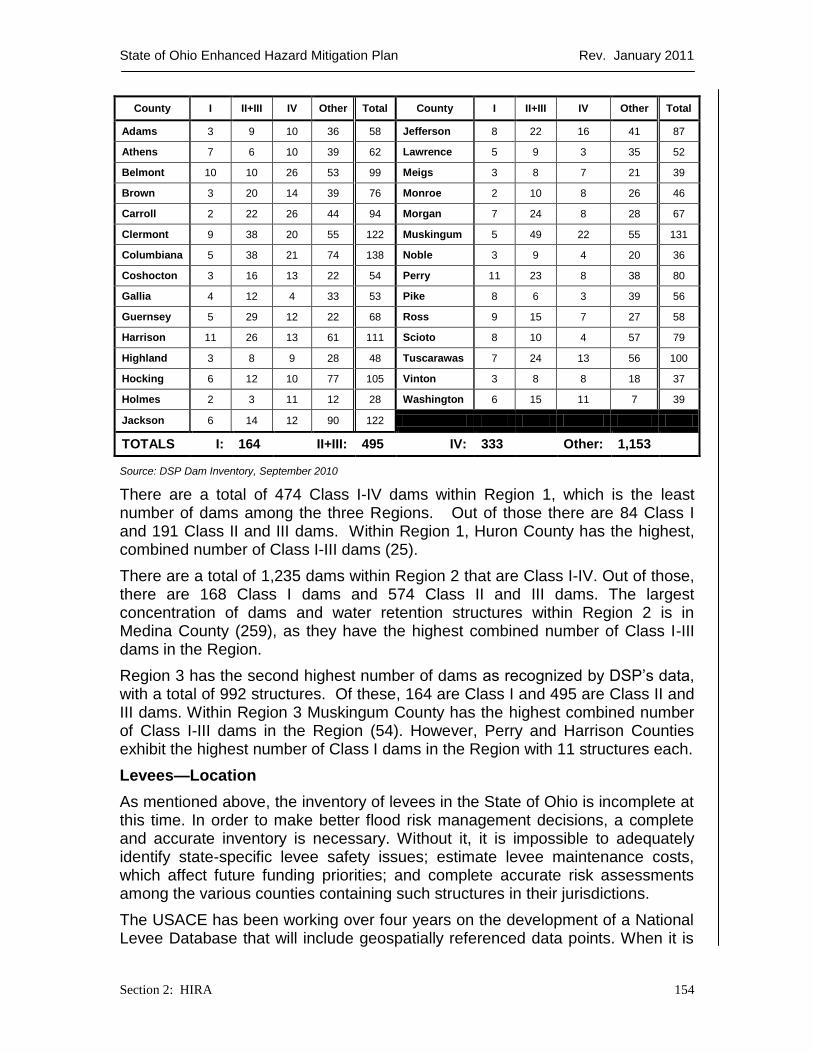
As mentioned above, there are 416 Class I dams, 1,260 Class II and III, and 1,025 Class IV dams in Ohio. Also, there are approximately 3,085 structures throughout the state that are unclassified, exempt from ORC regulations, or are abandoned, and they are categorized as Other (Table 2.6.b).
State of Ohio Enhanced Hazard Mitigation Plan Rev. January 2011
Section 2: HIRA 153
Table 2.6.b
Dam Inventory by County and Dam Classification
Region 1
County I II+III IV Other Total County I II+III IV Other Total
Allen 4 9 10 19 42 Madison 1 3 1 3 8
Auglaize 1 2 3 6 12 Marion 0 2 5 4 11
Champaign 1 8 7 11 27 Mercer 1 5 1 1 8
Clark 2 5 6 9 22 Miami 3 10 8 20 41
Clinton 9 13 13 16 51 Morrow 3 14 17 28 62
Crawford 6 7 12 15 40 Ottawa 0 2 3 5 10
Darke 0 5 7 25 37 Paulding 1 1 6 9 17
Defiance 2 7 6 12 27 Preble 6 11 15 36 68
Erie 0 4 3 11 18 Putnam 1 2 3 9 15
Fayette 1 3 1 6 11 Sandusky 2 0 2 5 9
Fulton 5 5 0 3 13 Seneca 2 5 4 9 20
Hancock 8 6 0 11 25 Shelby 2 4 10 22 38
Hardin 0 3 6 10 19 Union 0 4 5 20 29
Henry 0 1 1 11 13 Van Wert 3 0 1 5 9
Huron 10 15 10 21 56 Williams 1 7 14 25 47
Logan 3 11 12 19 45 Wood 4 4 0 9 17
Lucas 1 4 0 15 20 Wyandot 1 9 7 17 34
TOTALS I: 84 II+III: 191 IV: 199
Other: 447
Region 2
County I II+III IV Other Total County I II+III IV Other Total
Ashland 5 21 18 42 86 Lorain 5 25 20 95 145
Ashtabula 5 32 23 68 128 Mahoning 5 20 13 54 92
Butler 8 22 22 68 120 Medina 14 53 64 128 259
Cuyahoga 9 12 5 38 64 Montgomery 6 9 6 32 53
Delaware 14 16 24 33 87 Pickaway 2 15 11 15 43
Fairfield 13 34 15 35 97 Portage 8 22 27 145 202
Franklin 4 17 11 37 69 Richland 3 12 11 28 54
Geauga 7 30 23 61 121 Stark 4 31 27 93 155
Greene 6 8 15 26 55 Summit 17 36 23 110 186
Hamilton 10 33 13 72 128 Trumbull 3 19 14 88 124
Knox 3 15 10 30 58 Warren 11 41 45 68 165
Lake 2 12 4 18 36 Wayne 3 18 10 44 75
Licking 1 21 39 57 118
TOTALS I: 168 II+III: 574 IV: 493 Other: 1,485
Region 3
State of Ohio Enhanced Hazard Mitigation Plan Rev. January 2011
Section 2: HIRA 154
County I II+III IV Other Total County I II+III IV Other Total
Adams 3 9 10 36 58 Jefferson 8 22 16 41 87
Athens 7 6 10 39 62 Lawrence 5 9 3 35 52
Belmont 10 10 26 53 99 Meigs 3 8 7 21 39
Brown 3 20 14 39 76 Monroe 2 10 8 26 46
Carroll 2 22 26 44 94 Morgan 7 24 8 28 67
Clermont 9 38 20 55 122 Muskingum 5 49 22 55 131
Columbiana 5 38 21 74 138 Noble 3 9 4 20 36
Coshocton 3 16 13 22 54 Perry 11 23 8 38 80
Gallia 4 12 4 33 53 Pike 8 6 3 39 56
Guernsey 5 29 12 22 68 Ross 9 15 7 27 58
Harrison 11 26 13 61 111 Scioto 8 10 4 57 79
Highland 3 8 9 28 48 Tuscarawas 7 24 13 56 100
Hocking 6 12 10 77 105 Vinton 3 8 8 18 37
Holmes 2 3 11 12 28 Washington 6 15 11 7 39
Jackson 6 14 12 90 122
TOTALS I: 164 II+III: 495 IV: 333 Other: 1,153
Source: DSP Dam Inventory, September 2010
There are a total of 474 Class I-IV dams within Region 1, which is the least number of dams among the three Regions. Out of those there are 84 Class I and 191 Class II and III dams. Within Region 1, Huron County has the highest, combined number of Class I-III dams (25).
There are a total of 1,235 dams within Region 2 that are Class I-IV. Out of those, there are 168 Class I dams and 574 Class II and III dams. The largest concentration of dams and water retention structures within Region 2 is in Medina County (259), as they have the highest combined number of Class I-III dams in the Region.
Region 3 has the second highest number of dams as recognized by DSP’s data, with a total of 992 structures. Of these, 164 are Class I and 495 are Class II and III dams. Within Region 3 Muskingum County has the highest combined number of Class I-III dams in the Region (54). However, Perry and Harrison Counties exhibit the highest number of Class I dams in the Region with 11 structures each.
Levees—Location
As mentioned above, the inventory of levees in the State of Ohio is incomplete at this time. In order to make better flood risk management decisions, a complete and accurate inventory is necessary. Without it, it is impossible to adequately identify state-specific levee safety issues; estimate levee maintenance costs, which affect future funding priorities; and complete accurate risk assessments among the various counties containing such structures in their jurisdictions.
The USACE has been working over four years on the development of a National Levee Database that will include geospatially referenced data points. When it is
State of Ohio Enhanced Hazard Mitigation Plan Rev. January 2011
Section 2: HIRA 155
complete, it will contain such information as levee condition, reliability, and vulnerability landward of the system. Until those data are developed, this plan will utilize NFIP levee information as collected during FEMA’s various flood and risk mapping initiatives (2003 to present), and those data maintained by DSP.
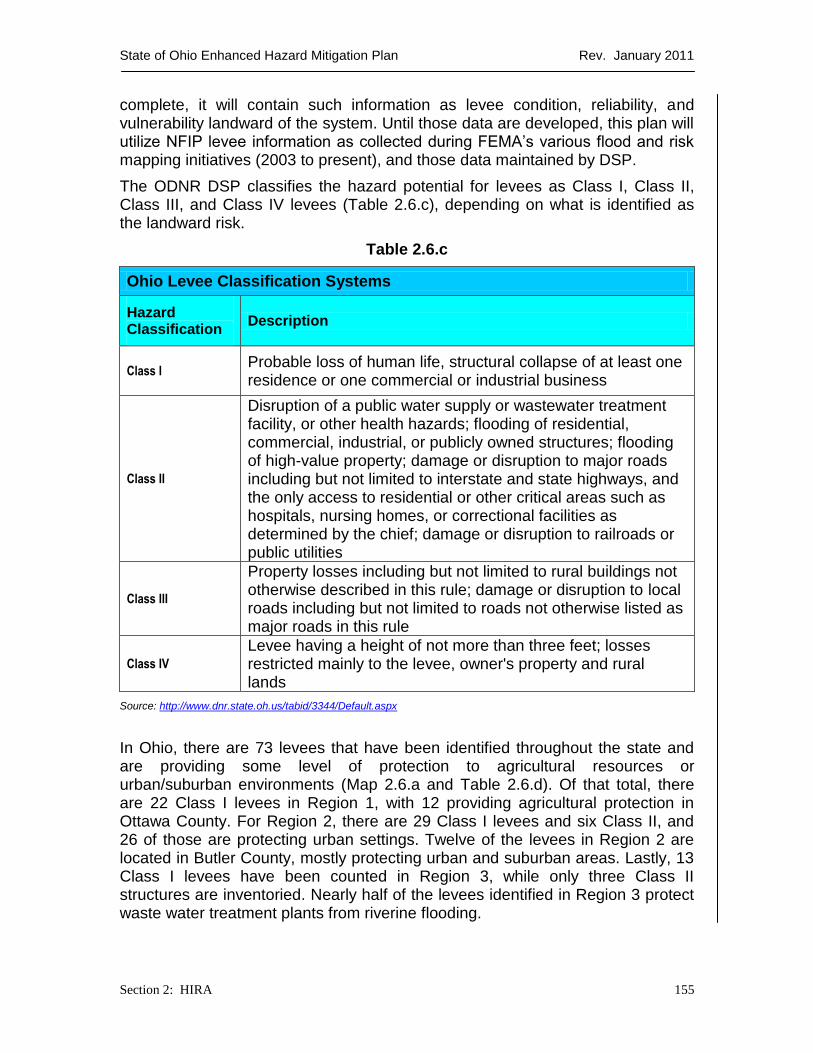
The ODNR DSP classifies the hazard potential for levees as Class I, Class II, Class III, and Class IV levees (Table 2.6.c), depending on what is identified as the landward risk.
Table 2.6.c
Ohio Levee Classification Systems
Hazard Classification
Description
Class I Probable loss of human life, structural collapse of at least one residence or one commercial or industrial business
Class II
Disruption of a public water supply or wastewater treatment facility, or other health hazards; flooding of residential, commercial, industrial, or publicly owned structures; flooding of high-value property; damage or disruption to major roads including but not limited to interstate and state highways, and the only access to residential or other critical areas such as hospitals, nursing homes, or correctional facilities as determined by the chief; damage or disruption to railroads or public utilities
Class III
Property losses including but not limited to rural buildings not otherwise described in this rule; damage or disruption to local roads including but not limited to roads not otherwise listed as major roads in this rule
Class IV
Levee having a height of not more than three feet; losses restricted mainly to the levee, owner's property and rural lands
Source: http://www.dnr.state.oh.us/tabid/3344/Default.aspx
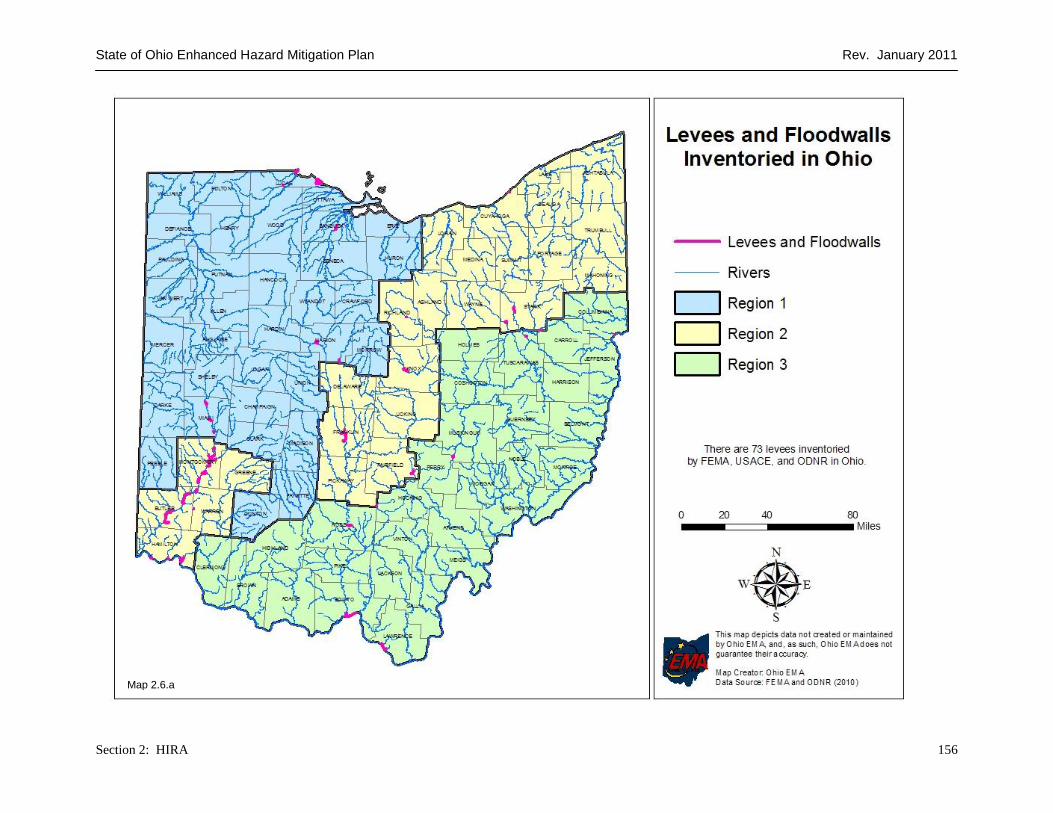
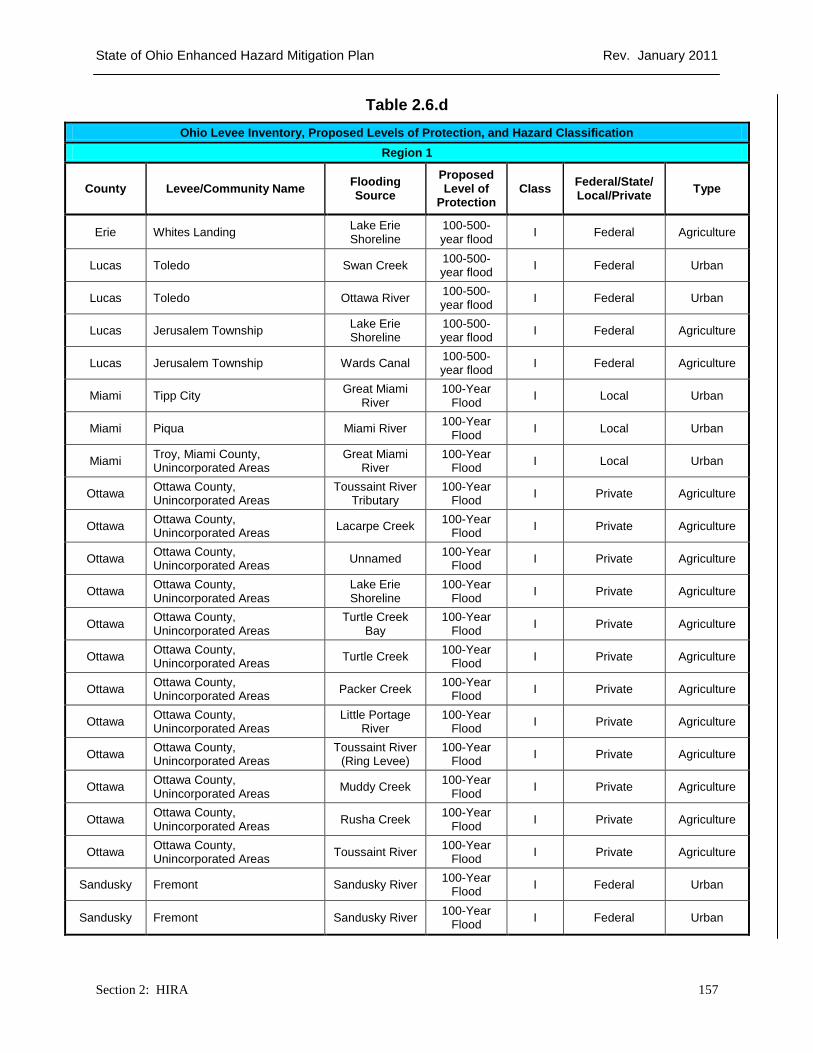
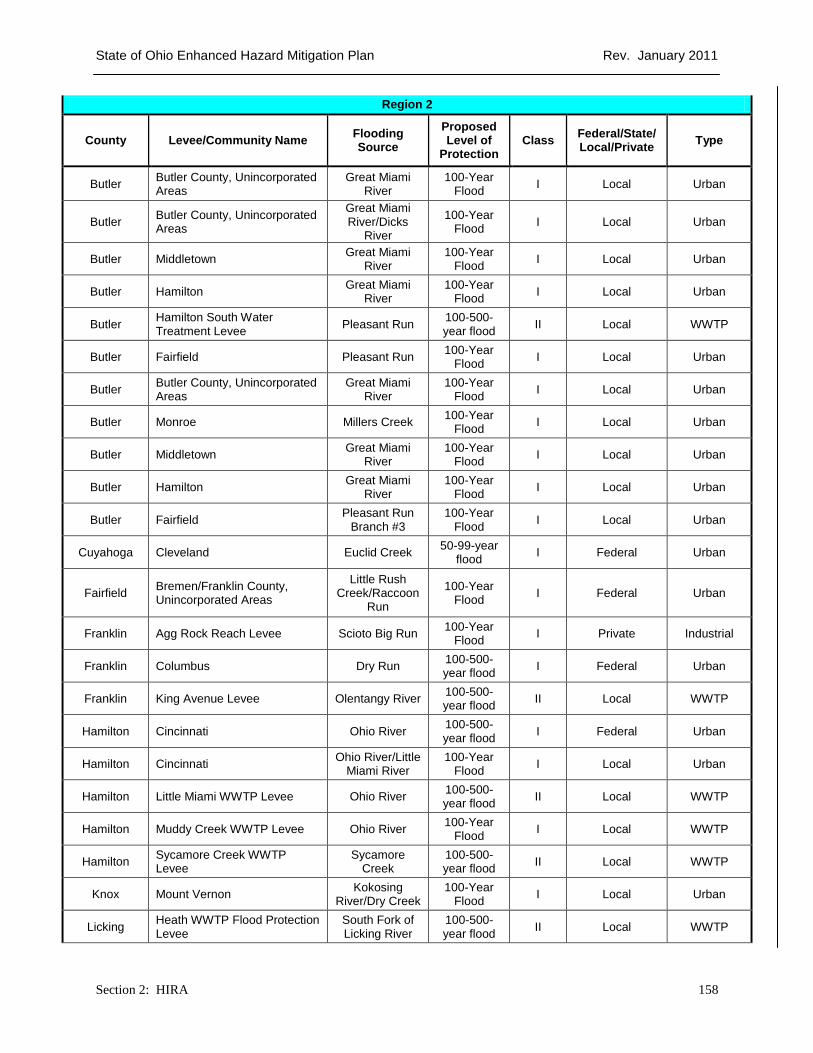
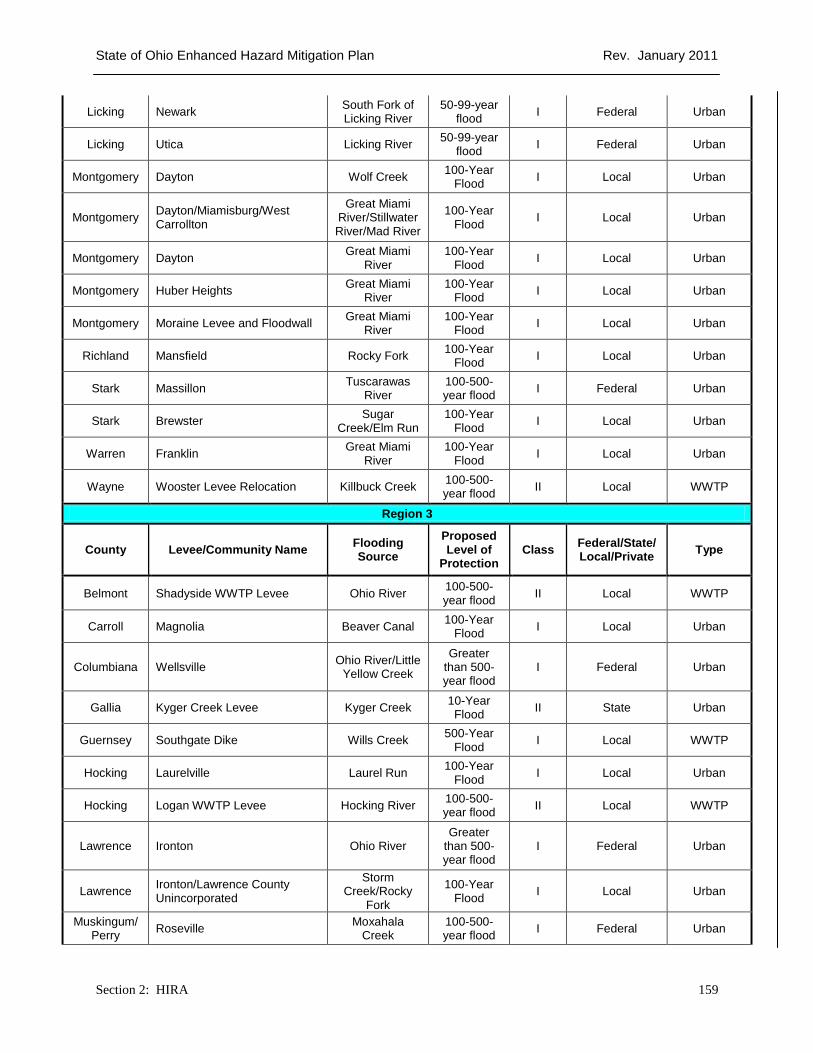
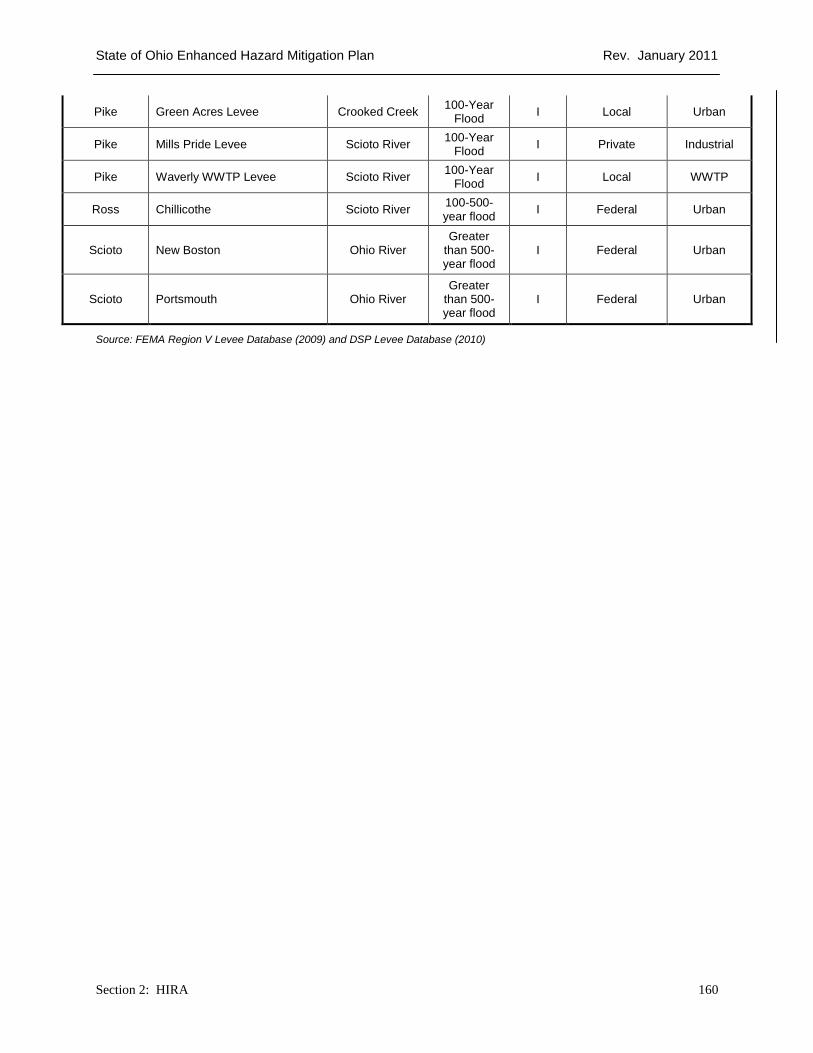
In Ohio, there are 73 levees that have been identified throughout the state and are providing some level of protection to agricultural resources or urban/suburban environments (Map 2.6.a and Table 2.6.d). Of that total, there are 22 Class I levees in Region 1, with 12 providing agricultural protection in Ottawa County. For Region 2, there are 29 Class I levees and six Class II, and 26 of those are protecting urban settings. Twelve of the levees in Region 2 are located in Butler County, mostly protecting urban and suburban areas. Lastly, 13 Class I levees have been counted in Region 3, while only three Class II structures are inventoried. Nearly half of the levees identified in Region 3 protect waste water treatment plants from riverine flooding.
State of Ohio Enhanced Hazard Mitigation Plan Rev. January 2011
Section 2: HIRA 156
Map 2.6.a
State of Ohio Enhanced Hazard Mitigation Plan Rev. January 2011
Section 2: HIRA 157
Table 2.6.d
Ohio Levee Inventory, Proposed Levels of Protection, and Hazard Classification
Region 1
County Levee/Community Name Flooding Source
Proposed Level of
Protection Class
Federal/State/ Local/Private
Type
Erie Whites Landing Lake Erie Shoreline
100-500-year flood
I Federal Agriculture
Lucas Toledo Swan Creek 100-500-year flood
I Federal Urban
Lucas Toledo Ottawa River 100-500-year flood
I Federal Urban
Lucas Jerusalem Township Lake Erie Shoreline
100-500-year flood
I Federal Agriculture
Lucas Jerusalem Township Wards Canal 100-500-year flood
I Federal Agriculture
Miami Tipp City Great Miami
River 100-Year
Flood I Local Urban
Miami Piqua Miami River 100-Year
Flood I Local Urban
Miami Troy, Miami County, Unincorporated Areas
Great Miami River
100-Year Flood
I Local Urban
Ottawa Ottawa County, Unincorporated Areas
Toussaint River Tributary
100-Year Flood
I Private Agriculture
Ottawa Ottawa County, Unincorporated Areas
Lacarpe Creek 100-Year
Flood I Private Agriculture
Ottawa Ottawa County, Unincorporated Areas
Unnamed 100-Year
Flood I Private Agriculture
Ottawa Ottawa County, Unincorporated Areas
Lake Erie Shoreline
100-Year Flood
I Private Agriculture
Ottawa Ottawa County, Unincorporated Areas
Turtle Creek Bay
100-Year Flood
I Private Agriculture
Ottawa Ottawa County, Unincorporated Areas
Turtle Creek 100-Year
Flood I Private Agriculture
Ottawa Ottawa County, Unincorporated Areas
Packer Creek 100-Year
Flood I Private Agriculture
Ottawa Ottawa County, Unincorporated Areas
Little Portage River
100-Year Flood
I Private Agriculture
Ottawa Ottawa County, Unincorporated Areas
Toussaint River (Ring Levee)
100-Year Flood
I Private Agriculture
Ottawa Ottawa County, Unincorporated Areas
Muddy Creek 100-Year
Flood I Private Agriculture
Ottawa Ottawa County, Unincorporated Areas
Rusha Creek 100-Year
Flood I Private Agriculture
Ottawa Ottawa County, Unincorporated Areas
Toussaint River 100-Year
Flood I Private Agriculture
Sandusky Fremont Sandusky River 100-Year
Flood I Federal Urban
Sandusky Fremont Sandusky River 100-Year
Flood I Federal Urban
State of Ohio Enhanced Hazard Mitigation Plan Rev. January 2011
Section 2: HIRA 158
Region 2
County Levee/Community Name Flooding Source
Proposed Level of
Protection Class
Federal/State/ Local/Private
Type
Butler Butler County, Unincorporated Areas
Great Miami River
100-Year Flood
I Local Urban
Butler Butler County, Unincorporated Areas
Great Miami River/Dicks
River
100-Year Flood
I Local Urban
Butler Middletown Great Miami
River 100-Year
Flood I Local Urban
Butler Hamilton Great Miami
River 100-Year
Flood I Local Urban
Butler Hamilton South Water Treatment Levee
Pleasant Run 100-500-year flood
II Local WWTP
Butler Fairfield Pleasant Run 100-Year
Flood I Local Urban
Butler Butler County, Unincorporated Areas
Great Miami River
100-Year Flood
I Local Urban
Butler Monroe Millers Creek 100-Year
Flood I Local Urban
Butler Middletown Great Miami
River 100-Year
Flood I Local Urban
Butler Hamilton Great Miami
River 100-Year
Flood I Local Urban
Butler Fairfield Pleasant Run
Branch #3 100-Year
Flood I Local Urban
Cuyahoga Cleveland Euclid Creek 50-99-year
flood I Federal Urban
Fairfield Bremen/Franklin County, Unincorporated Areas
Little Rush Creek/Raccoon
Run
100-Year Flood
I Federal Urban
Franklin Agg Rock Reach Levee Scioto Big Run 100-Year
Flood I Private Industrial
Franklin Columbus Dry Run 100-500-year flood
I Federal Urban
Franklin King Avenue Levee Olentangy River 100-500-year flood
II Local WWTP
Hamilton Cincinnati Ohio River 100-500-year flood
I Federal Urban
Hamilton Cincinnati Ohio River/Little
Miami River 100-Year
Flood I Local Urban
Hamilton Little Miami WWTP Levee Ohio River 100-500-year flood
II Local WWTP
Hamilton Muddy Creek WWTP Levee Ohio River 100-Year
Flood I Local WWTP
Hamilton Sycamore Creek WWTP Levee
Sycamore Creek
100-500-year flood
II Local WWTP
Knox Mount Vernon Kokosing
River/Dry Creek 100-Year
Flood I Local Urban
Licking Heath WWTP Flood Protection Levee
South Fork of Licking River
100-500-year flood
II Local WWTP
State of Ohio Enhanced Hazard Mitigation Plan Rev. January 2011
Section 2: HIRA 159
Licking Newark South Fork of Licking River
50-99-year flood
I Federal Urban
Licking Utica Licking River 50-99-year
flood I Federal Urban
Montgomery Dayton Wolf Creek 100-Year
Flood I Local Urban
Montgomery Dayton/Miamisburg/West Carrollton
Great Miami River/Stillwater River/Mad River
100-Year Flood
I Local Urban
Montgomery Dayton Great Miami
River 100-Year
Flood I Local Urban
Montgomery Huber Heights Great Miami
River 100-Year
Flood I Local Urban
Montgomery Moraine Levee and Floodwall Great Miami
River 100-Year
Flood I Local Urban
Richland Mansfield Rocky Fork 100-Year
Flood I Local Urban
Stark Massillon Tuscarawas
River 100-500-year flood
I Federal Urban
Stark Brewster Sugar
Creek/Elm Run 100-Year
Flood I Local Urban
Warren Franklin Great Miami
River 100-Year
Flood I Local Urban
Wayne Wooster Levee Relocation Killbuck Creek 100-500-year flood
II Local WWTP
Region 3
County Levee/Community Name Flooding Source
Proposed Level of
Protection Class
Federal/State/ Local/Private
Type
Belmont Shadyside WWTP Levee Ohio River 100-500-year flood
II Local WWTP
Carroll Magnolia Beaver Canal 100-Year
Flood I Local Urban
Columbiana Wellsville Ohio River/Little
Yellow Creek
Greater than 500-year flood
I Federal Urban
Gallia Kyger Creek Levee Kyger Creek 10-Year Flood
II State Urban
Guernsey Southgate Dike Wills Creek 500-Year
Flood I Local WWTP
Hocking Laurelville Laurel Run 100-Year
Flood I Local Urban
Hocking Logan WWTP Levee Hocking River 100-500-year flood
II Local WWTP
Lawrence Ironton Ohio River Greater
than 500-year flood
I Federal Urban
Lawrence Ironton/Lawrence County Unincorporated
Storm Creek/Rocky
Fork
100-Year Flood
I Local Urban
Muskingum/ Perry
Roseville Moxahala
Creek 100-500-year flood
I Federal Urban
State of Ohio Enhanced Hazard Mitigation Plan Rev. January 2011
Section 2: HIRA 160
Pike Green Acres Levee Crooked Creek 100-Year
Flood I Local Urban
Pike Mills Pride Levee Scioto River 100-Year
Flood I Private Industrial
Pike Waverly WWTP Levee Scioto River 100-Year
Flood I Local WWTP
Ross Chillicothe Scioto River 100-500-year flood
I Federal Urban
Scioto New Boston Ohio River Greater
than 500-year flood
I Federal Urban
Scioto Portsmouth Ohio River Greater
than 500-year flood
I Federal Urban
Source: FEMA Region V Levee Database (2009) and DSP Levee Database (2010)
State of Ohio Enhanced Hazard Mitigation Plan Rev. January 2011
Section 2: HIRA 161
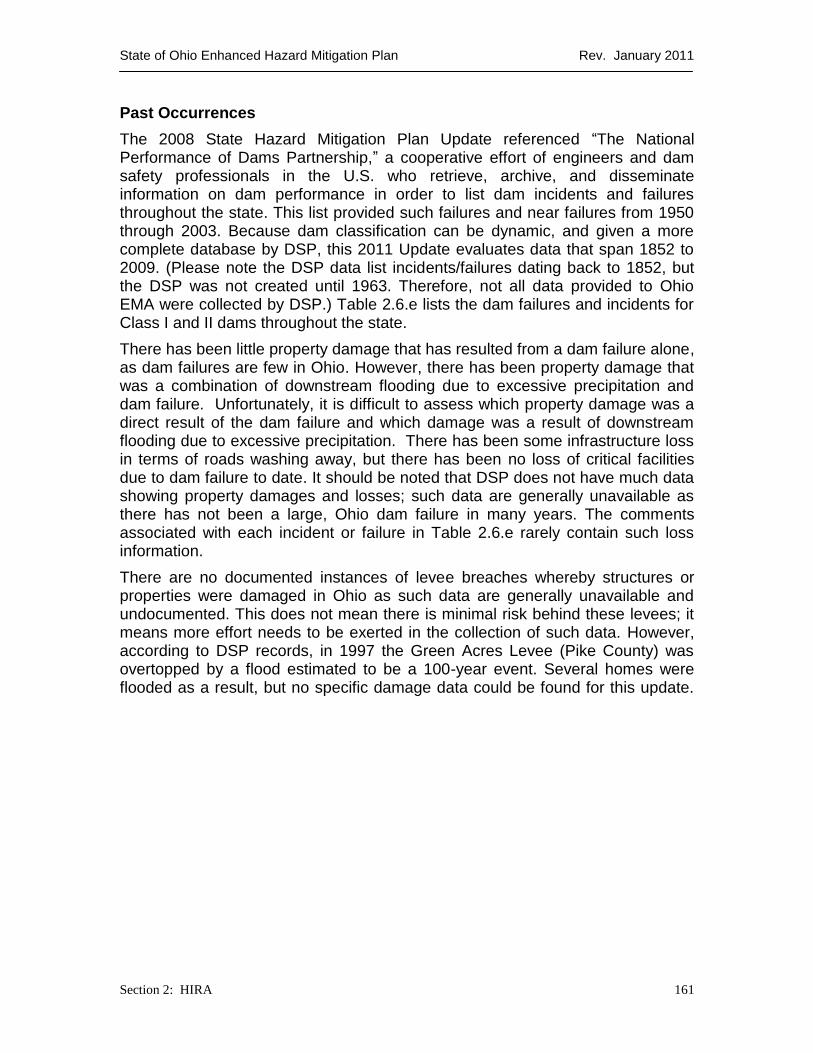
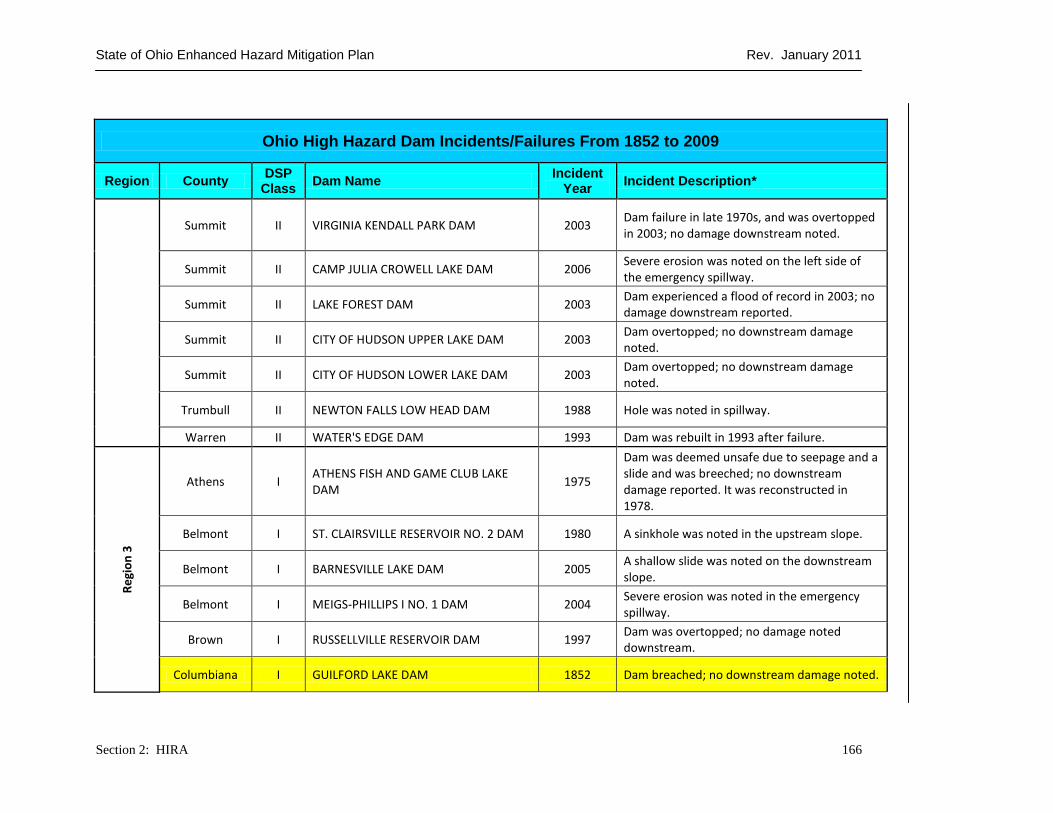
Past Occurrences
The 2008 State Hazard Mitigation Plan Update referenced ―The National Performance of Dams Partnership,‖ a cooperative effort of engineers and dam safety professionals in the U.S. who retrieve, archive, and disseminate information on dam performance in order to list dam incidents and failures throughout the state. This list provided such failures and near failures from 1950 through 2003. Because dam classification can be dynamic, and given a more complete database by DSP, this 2011 Update evaluates data that span 1852 to 2009. (Please note the DSP data list incidents/failures dating back to 1852, but the DSP was not created until 1963. Therefore, not all data provided to Ohio EMA were collected by DSP.) Table 2.6.e lists the dam failures and incidents for Class I and II dams throughout the state.
There has been little property damage that has resulted from a dam failure alone, as dam failures are few in Ohio. However, there has been property damage that was a combination of downstream flooding due to excessive precipitation and dam failure. Unfortunately, it is difficult to assess which property damage was a direct result of the dam failure and which damage was a result of downstream flooding due to excessive precipitation. There has been some infrastructure loss in terms of roads washing away, but there has been no loss of critical facilities due to dam failure to date. It should be noted that DSP does not have much data showing property damages and losses; such data are generally unavailable as there has not been a large, Ohio dam failure in many years. The comments associated with each incident or failure in Table 2.6.e rarely contain such loss information.
There are no documented instances of levee breaches whereby structures or properties were damaged in Ohio as such data are generally unavailable and undocumented. This does not mean there is minimal risk behind these levees; it means more effort needs to be exerted in the collection of such data. However, according to DSP records, in 1997 the Green Acres Levee (Pike County) was overtopped by a flood estimated to be a 100-year event. Several homes were flooded as a result, but no specific damage data could be found for this update.
State of Ohio Enhanced Hazard Mitigation Plan Rev. January 2011
Section 2: HIRA 162
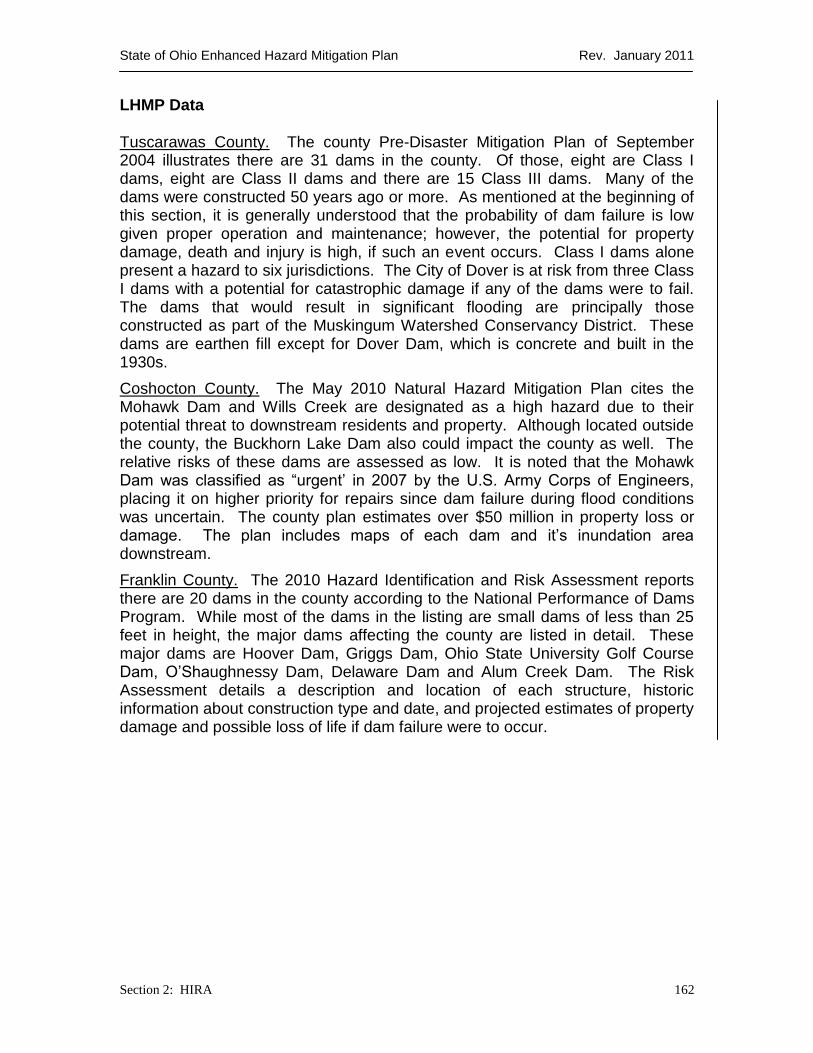
LHMP Data
Tuscarawas County. The county Pre-Disaster Mitigation Plan of September 2004 illustrates there are 31 dams in the county. Of those, eight are Class I dams, eight are Class II dams and there are 15 Class III dams. Many of the dams were constructed 50 years ago or more. As mentioned at the beginning of this section, it is generally understood that the probability of dam failure is low given proper operation and maintenance; however, the potential for property damage, death and injury is high, if such an event occurs. Class I dams alone present a hazard to six jurisdictions. The City of Dover is at risk from three Class I dams with a potential for catastrophic damage if any of the dams were to fail. The dams that would result in significant flooding are principally those constructed as part of the Muskingum Watershed Conservancy District. These dams are earthen fill except for Dover Dam, which is concrete and built in the 1930s.
Coshocton County. The May 2010 Natural Hazard Mitigation Plan cites the Mohawk Dam and Wills Creek are designated as a high hazard due to their potential threat to downstream residents and property. Although located outside the county, the Buckhorn Lake Dam also could impact the county as well. The relative risks of these dams are assessed as low. It is noted that the Mohawk Dam was classified as ―urgent’ in 2007 by the U.S. Army Corps of Engineers, placing it on higher priority for repairs since dam failure during flood conditions was uncertain. The county plan estimates over $50 million in property loss or damage. The plan includes maps of each dam and it’s inundation area downstream.
Franklin County. The 2010 Hazard Identification and Risk Assessment reports there are 20 dams in the county according to the National Performance of Dams Program. While most of the dams in the listing are small dams of less than 25 feet in height, the major dams affecting the county are listed in detail. These major dams are Hoover Dam, Griggs Dam, Ohio State University Golf Course Dam, O’Shaughnessy Dam, Delaware Dam and Alum Creek Dam. The Risk Assessment details a description and location of each structure, historic information about construction type and date, and projected estimates of property damage and possible loss of life if dam failure were to occur.

State of Ohio Enhanced Hazard Mitigation Plan Rev. January 2011
Section 2: HIRA 163
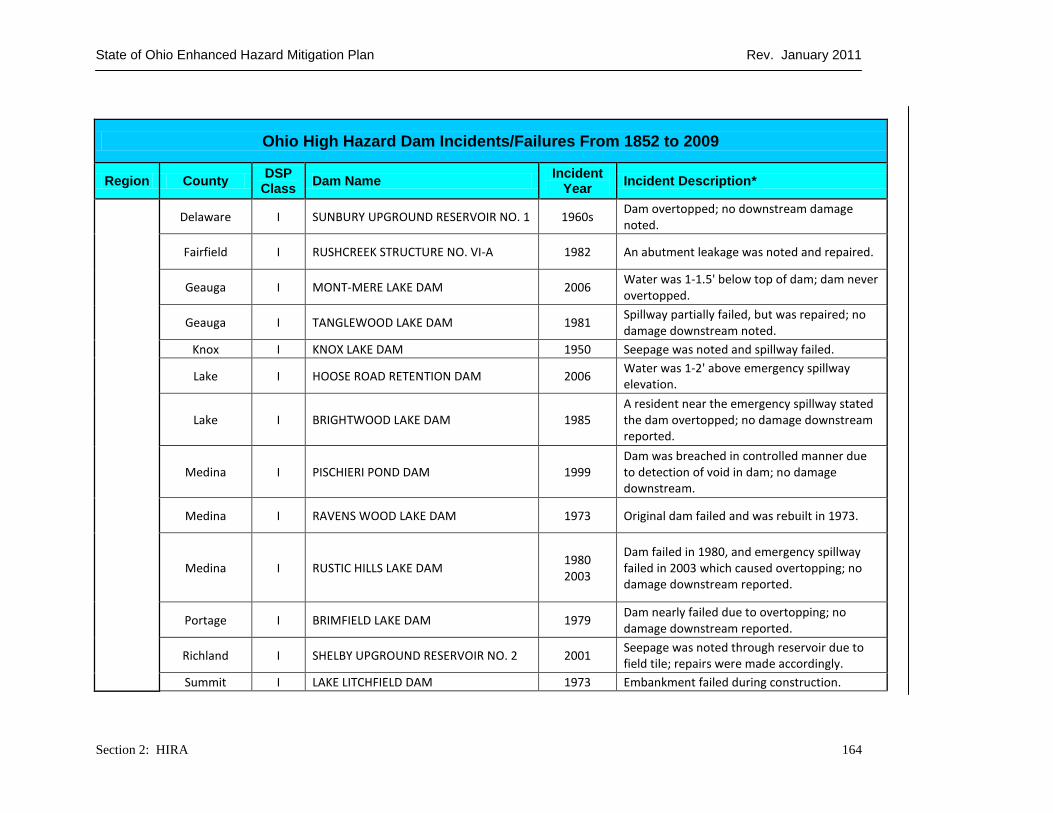
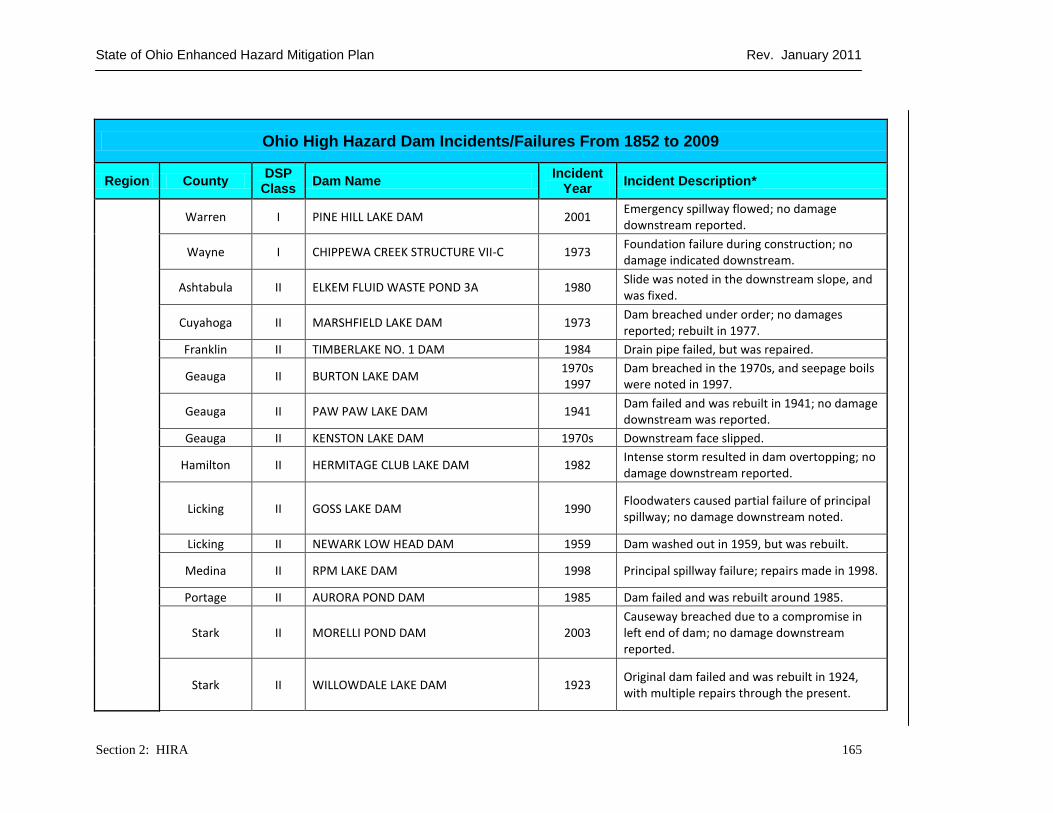
Table 2.6.e
Ohio High Hazard Dam Incidents/Failures From 1852 to 2009
Region County DSP
Class Dam Name
Incident Year
Incident Description*
Re
gio
n 1
Huron I NORWALK LOWER RESERVOIR 1969 Dam failed; no damage downstream noted. Dam was rebuilt with berm and drainage.
Huron I GREENWICH RESERVOIR DAM 1969 Dam partially failed; no damage downstream noted.
Huron I HOLIDAY LAKE DAM 1982 2007
Left sidewall failed in 1882. A shallow slide was noted in 2007.
Morrow I CANDLEWOOD LAKE DAM 1998 Approximately 3-4' noted in the emergency spillway.
Sandusky I BALLVILLE DAM 1913 Dam failed with 1913 flood; no damage downstream reported.
Williams I LAKE SENECA DAM 1973 1996
Overflow spillway failed in 1973 and 1996; no damage downstream reported.
Wyandot I KILLDEER UPGROUND RESERVOIR 1979 2004
Leak and slide indicated in 1979, and multiple slides indicated in 2004.
Defiance II INDEPENDENCE DAM 1982 Left abutment was overtopped and damaged.
Lucas II SWANTON UPGROUND RESERVOIR 1970 Dam failure in 1970, but was repaired.
Seneca II MOHAWK LAKE DAM 1910 1963
Dam failure in 1910 resulted in replacement; dam failure in 1963 resulted in repairs. No damage downstream reported.
Re
gio
n 2
Cuyahoga I BRIAR HILL LAKE DAM 2006 Dam possibly overtopped; no damage downstream noted.
Delaware I LEXINGTON GLEN DAM 1987 Dam failed due to erosion on the emergency spillway and four erosion rills on the downstream slope.
State of Ohio Enhanced Hazard Mitigation Plan Rev. January 2011
Section 2: HIRA 164
Ohio High Hazard Dam Incidents/Failures From 1852 to 2009
Region County DSP
Class Dam Name
Incident Year
Incident Description*
Delaware I SUNBURY UPGROUND RESERVOIR NO. 1 1960s Dam overtopped; no downstream damage noted.
Fairfield I RUSHCREEK STRUCTURE NO. VI-A 1982 An abutment leakage was noted and repaired.
Geauga I MONT-MERE LAKE DAM 2006 Water was 1-1.5' below top of dam; dam never overtopped.
Geauga I TANGLEWOOD LAKE DAM 1981 Spillway partially failed, but was repaired; no damage downstream noted.
Knox I KNOX LAKE DAM 1950 Seepage was noted and spillway failed.
Lake I HOOSE ROAD RETENTION DAM 2006 Water was 1-2' above emergency spillway elevation.
Lake I BRIGHTWOOD LAKE DAM 1985 A resident near the emergency spillway stated the dam overtopped; no damage downstream reported.
Medina I PISCHIERI POND DAM 1999 Dam was breached in controlled manner due to detection of void in dam; no damage downstream.
Medina I RAVENS WOOD LAKE DAM 1973 Original dam failed and was rebuilt in 1973.
Medina I RUSTIC HILLS LAKE DAM 1980 2003
Dam failed in 1980, and emergency spillway failed in 2003 which caused overtopping; no damage downstream reported.
Portage I BRIMFIELD LAKE DAM 1979 Dam nearly failed due to overtopping; no damage downstream reported.
Richland I SHELBY UPGROUND RESERVOIR NO. 2 2001 Seepage was noted through reservoir due to field tile; repairs were made accordingly.
Summit I LAKE LITCHFIELD DAM 1973 Embankment failed during construction.
State of Ohio Enhanced Hazard Mitigation Plan Rev. January 2011
Section 2: HIRA 165
Ohio High Hazard Dam Incidents/Failures From 1852 to 2009
Region County DSP
Class Dam Name
Incident Year
Incident Description*
Warren I PINE HILL LAKE DAM 2001 Emergency spillway flowed; no damage downstream reported.
Wayne I CHIPPEWA CREEK STRUCTURE VII-C 1973 Foundation failure during construction; no damage indicated downstream.
Ashtabula II ELKEM FLUID WASTE POND 3A 1980 Slide was noted in the downstream slope, and was fixed.
Cuyahoga II MARSHFIELD LAKE DAM 1973 Dam breached under order; no damages reported; rebuilt in 1977.
Franklin II TIMBERLAKE NO. 1 DAM 1984 Drain pipe failed, but was repaired.
Geauga II BURTON LAKE DAM 1970s 1997
Dam breached in the 1970s, and seepage boils were noted in 1997.
Geauga II PAW PAW LAKE DAM 1941 Dam failed and was rebuilt in 1941; no damage downstream was reported.
Geauga II KENSTON LAKE DAM 1970s Downstream face slipped.
Hamilton II HERMITAGE CLUB LAKE DAM 1982 Intense storm resulted in dam overtopping; no damage downstream reported.
Licking II GOSS LAKE DAM 1990 Floodwaters caused partial failure of principal spillway; no damage downstream noted.
Licking II NEWARK LOW HEAD DAM 1959 Dam washed out in 1959, but was rebuilt.
Medina II RPM LAKE DAM 1998 Principal spillway failure; repairs made in 1998.
Portage II AURORA POND DAM 1985 Dam failed and was rebuilt around 1985.
Stark II MORELLI POND DAM 2003 Causeway breached due to a compromise in left end of dam; no damage downstream reported.
Stark II WILLOWDALE LAKE DAM 1923 Original dam failed and was rebuilt in 1924, with multiple repairs through the present.
State of Ohio Enhanced Hazard Mitigation Plan Rev. January 2011
Section 2: HIRA 166
Ohio High Hazard Dam Incidents/Failures From 1852 to 2009
Region County DSP
Class Dam Name
Incident Year
Incident Description*
Summit II VIRGINIA KENDALL PARK DAM 2003 Dam failure in late 1970s, and was overtopped in 2003; no damage downstream noted.
Summit II CAMP JULIA CROWELL LAKE DAM 2006 Severe erosion was noted on the left side of the emergency spillway.
Summit II LAKE FOREST DAM 2003 Dam experienced a flood of record in 2003; no damage downstream reported.
Summit II CITY OF HUDSON UPPER LAKE DAM 2003 Dam overtopped; no downstream damage noted.
Summit II CITY OF HUDSON LOWER LAKE DAM 2003 Dam overtopped; no downstream damage noted.
Trumbull II NEWTON FALLS LOW HEAD DAM 1988 Hole was noted in spillway.
Warren II WATER'S EDGE DAM 1993 Dam was rebuilt in 1993 after failure.
Re
gio
n 3
Athens I ATHENS FISH AND GAME CLUB LAKE DAM
1975
Dam was deemed unsafe due to seepage and a slide and was breeched; no downstream damage reported. It was reconstructed in 1978.
Belmont I ST. CLAIRSVILLE RESERVOIR NO. 2 DAM 1980 A sinkhole was noted in the upstream slope.
Belmont I BARNESVILLE LAKE DAM 2005 A shallow slide was noted on the downstream slope.
Belmont I MEIGS-PHILLIPS I NO. 1 DAM 2004 Severe erosion was noted in the emergency spillway.
Brown I RUSSELLVILLE RESERVOIR DAM 1997 Dam was overtopped; no damage noted downstream.
Columbiana I GUILFORD LAKE DAM 1852 Dam breached; no downstream damage noted.
State of Ohio Enhanced Hazard Mitigation Plan Rev. January 2011
Section 2: HIRA 167
Ohio High Hazard Dam Incidents/Failures From 1852 to 2009
Region County DSP
Class Dam Name
Incident Year
Incident Description*
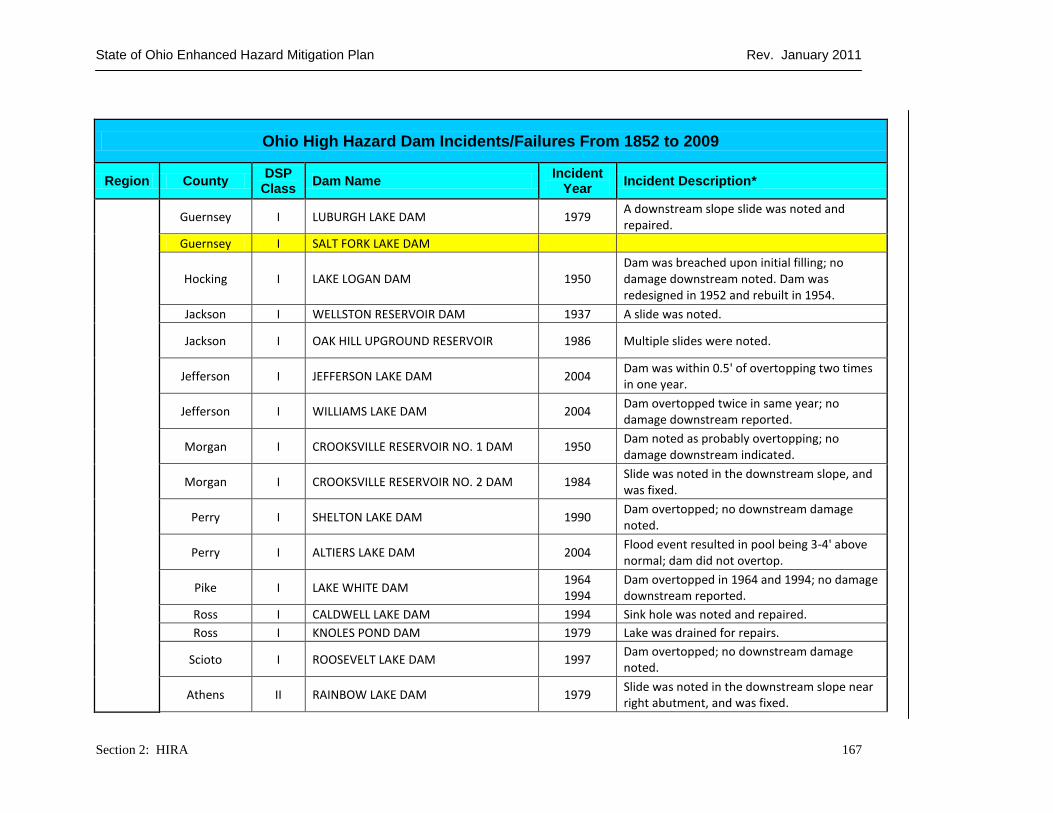
Guernsey I LUBURGH LAKE DAM 1979 A downstream slope slide was noted and repaired.
Guernsey I SALT FORK LAKE DAM
Hocking I LAKE LOGAN DAM 1950 Dam was breached upon initial filling; no damage downstream noted. Dam was redesigned in 1952 and rebuilt in 1954.
Jackson I WELLSTON RESERVOIR DAM 1937 A slide was noted.
Jackson I OAK HILL UPGROUND RESERVOIR 1986 Multiple slides were noted.
Jefferson I JEFFERSON LAKE DAM 2004 Dam was within 0.5' of overtopping two times in one year.
Jefferson I WILLIAMS LAKE DAM 2004 Dam overtopped twice in same year; no damage downstream reported.
Morgan I CROOKSVILLE RESERVOIR NO. 1 DAM 1950 Dam noted as probably overtopping; no damage downstream indicated.
Morgan I CROOKSVILLE RESERVOIR NO. 2 DAM 1984 Slide was noted in the downstream slope, and was fixed.
Perry I SHELTON LAKE DAM 1990 Dam overtopped; no downstream damage noted.
Perry I ALTIERS LAKE DAM 2004 Flood event resulted in pool being 3-4' above normal; dam did not overtop.
Pike I LAKE WHITE DAM 1964 1994
Dam overtopped in 1964 and 1994; no damage downstream reported.
Ross I CALDWELL LAKE DAM 1994 Sink hole was noted and repaired.
Ross I KNOLES POND DAM 1979 Lake was drained for repairs.
Scioto I ROOSEVELT LAKE DAM 1997 Dam overtopped; no downstream damage noted.
Athens II RAINBOW LAKE DAM 1979 Slide was noted in the downstream slope near right abutment, and was fixed.
State of Ohio Enhanced Hazard Mitigation Plan Rev. January 2011
Section 2: HIRA 168
Ohio High Hazard Dam Incidents/Failures From 1852 to 2009
Region County DSP
Class Dam Name
Incident Year
Incident Description*
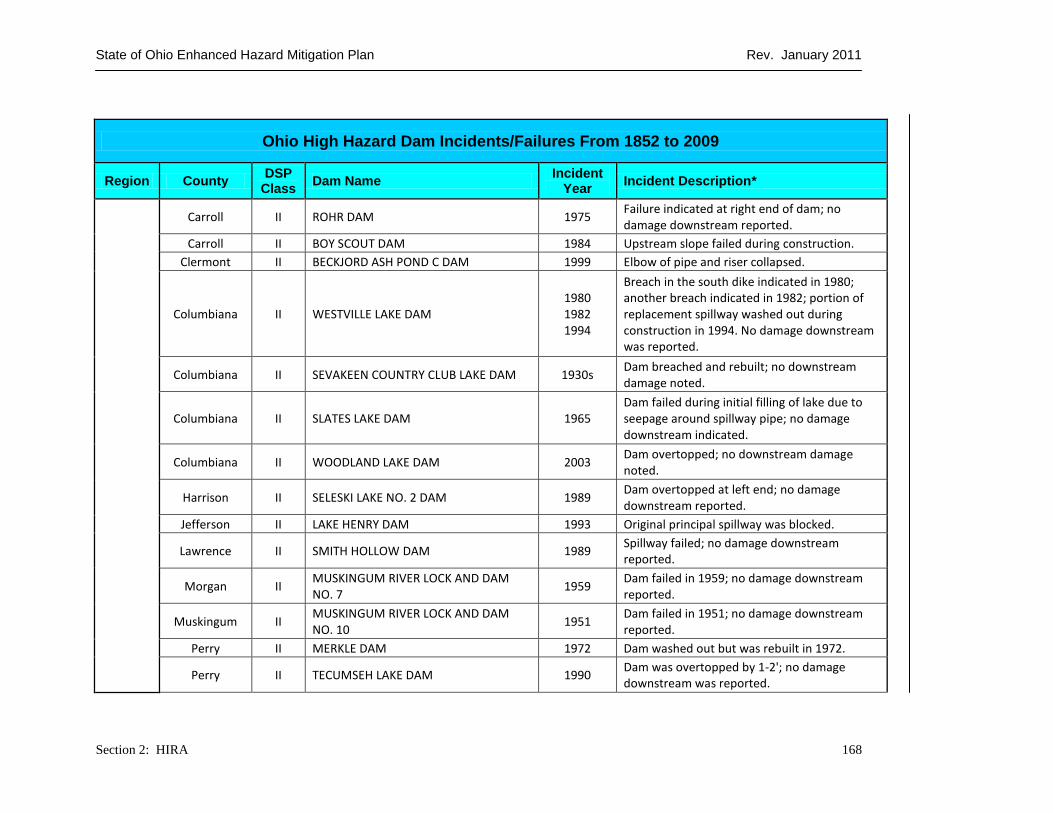
Carroll II ROHR DAM 1975 Failure indicated at right end of dam; no damage downstream reported.
Carroll II BOY SCOUT DAM 1984 Upstream slope failed during construction.
Clermont II BECKJORD ASH POND C DAM 1999 Elbow of pipe and riser collapsed.
Columbiana II WESTVILLE LAKE DAM 1980 1982 1994
Breach in the south dike indicated in 1980; another breach indicated in 1982; portion of replacement spillway washed out during construction in 1994. No damage downstream was reported.
Columbiana II SEVAKEEN COUNTRY CLUB LAKE DAM 1930s Dam breached and rebuilt; no downstream damage noted.
Columbiana II SLATES LAKE DAM 1965 Dam failed during initial filling of lake due to seepage around spillway pipe; no damage downstream indicated.
Columbiana II WOODLAND LAKE DAM 2003 Dam overtopped; no downstream damage noted.
Harrison II SELESKI LAKE NO. 2 DAM 1989 Dam overtopped at left end; no damage downstream reported.
Jefferson II LAKE HENRY DAM 1993 Original principal spillway was blocked.
Lawrence II SMITH HOLLOW DAM 1989 Spillway failed; no damage downstream reported.
Morgan II MUSKINGUM RIVER LOCK AND DAM NO. 7
1959 Dam failed in 1959; no damage downstream reported.
Muskingum II MUSKINGUM RIVER LOCK AND DAM NO. 10
1951 Dam failed in 1951; no damage downstream reported.
Perry II MERKLE DAM 1972 Dam washed out but was rebuilt in 1972.
Perry II TECUMSEH LAKE DAM 1990 Dam was overtopped by 1-2'; no damage downstream was reported.
State of Ohio Enhanced Hazard Mitigation Plan Rev. January 2011
Section 2: HIRA 169
Ohio High Hazard Dam Incidents/Failures From 1852 to 2009
Region County DSP
Class Dam Name
Incident Year
Incident Description*
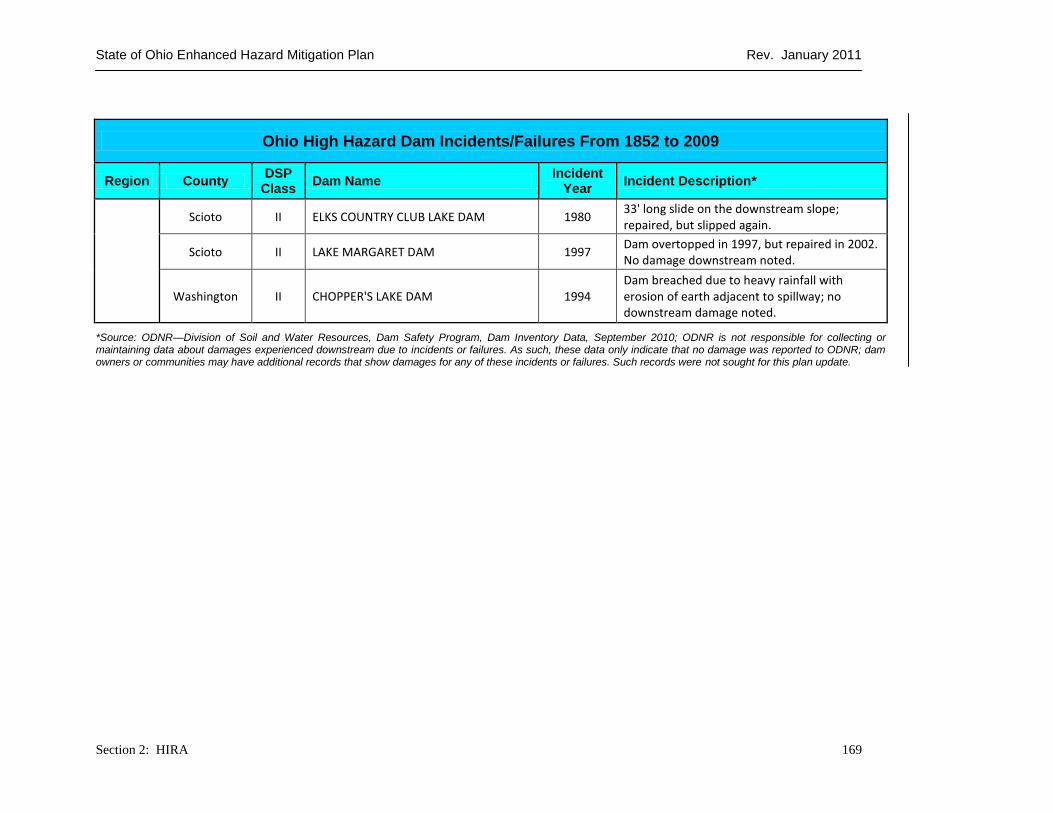
Scioto II ELKS COUNTRY CLUB LAKE DAM 1980 33' long slide on the downstream slope; repaired, but slipped again.
Scioto II LAKE MARGARET DAM 1997 Dam overtopped in 1997, but repaired in 2002. No damage downstream noted.
Washington II CHOPPER'S LAKE DAM 1994 Dam breached due to heavy rainfall with erosion of earth adjacent to spillway; no downstream damage noted.
*Source: ODNR—Division of Soil and Water Resources, Dam Safety Program, Dam Inventory Data, September 2010; ODNR is not responsible for collecting or maintaining data about damages experienced downstream due to incidents or failures. As such, these data only indicate that no damage was reported to ODNR; dam owners or communities may have additional records that show damages for any of these incidents or failures. Such records were not sought for this plan update.
State of Ohio Enhanced Hazard Mitigation Plan Rev. January 2011
Section 2: HIRA 170
Probability of Occurrence
For reasons previously mentioned, and some of which are uncontrollable by humans, it is possible a dam or levee can fail at any time, given the right circumstances. However, the probability of future occurrence is reduced due to proactive preventative action on the part of ODNR – DSP and individual dam and levee owners. As previously discussed in this section, the DSP provides oversight to dam/levee repairs, oversees and issues construction permits, enforces safety standards and mandates, conducts periodic safety inspections, and provides public information to levee owners, engineers, and the general public. This proactive approach to managing dam and levee safety in Ohio reduces the number of losses to property and life as a result of dam or levee failures or near failures.
VULNERABILITY ANALYSIS & LOSS ESTIMATION
Dams—Methodology
Assessing the hazard that a dam poses to downstream areas can be divided into three analyses: (1) analysis of an uncontrolled release of the reservoir, (2) analysis of the inundation from the uncontrolled release, and (3) analysis of the consequence of the release. In other words, a dam fails, the failure causes flooding downstream, and the flooding has negative impacts on people or property. Each of these analyses includes substantial uncertainty. Legitimate estimates of discharge from a breach can differ by over 200%. Discharge from a dam breach is usually several times the 1% chance flood, and, therefore, typical flood studies are of limited use in estimating the extent of flooding. Dam failure inundation studies require specialized hydraulic modeling software and experience. Determining the impact of flooding is also difficult to accomplish, especially for estimating loss of life. Loss of life is a function of the time of day, warning time, awareness of those affected, and particular failure scenario. Many dam safety agencies have used ―population at risk‖ (PAR), a more quantifiable measurement of the impact to human life, rather than ―loss of life.‖ PAR is the number of people in structures within the inundation area that would be subject to significant, personal danger, if they took no action to evacuate.
As mentioned at the beginning of this section, emergency managers usually categorize dam failures as either sunny day failures or rainy day failures. Sunny day failures occur during a non-flooding situation with the reservoir near normal pool level. Rainy day failures usually involve periods of rainfall and flooding, and can exacerbate inadequate spillway capacity. Improper design of a spillway or careless operation of gates during high flows can lead to excessive water pressure and subsequent failure as well. Even though both types of failures can be disastrous, it can be assumed that a sunny day failure would be more catastrophic due to its unanticipated occurrence and the lack of time to warn residents downstream.
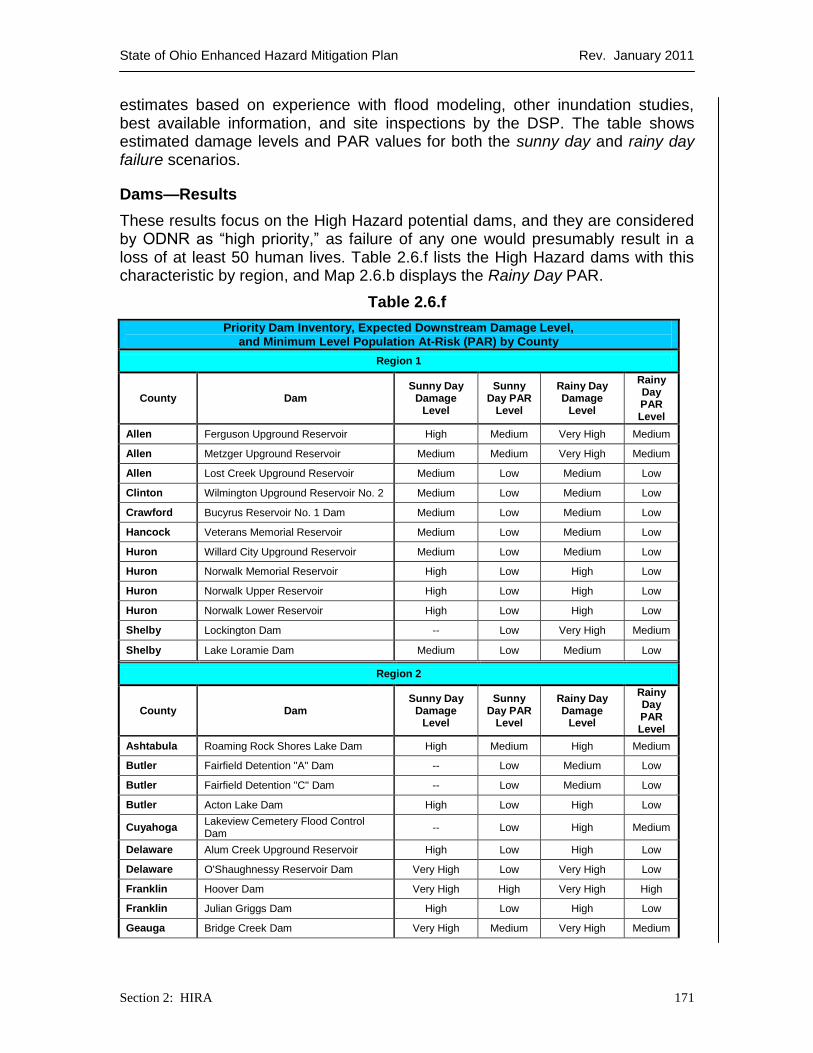
The impacts of a dam failure are contingent on many factors and, therefore, cannot be concisely described. The assessments in Table 2.6.f are rough
State of Ohio Enhanced Hazard Mitigation Plan Rev. January 2011
Section 2: HIRA 171
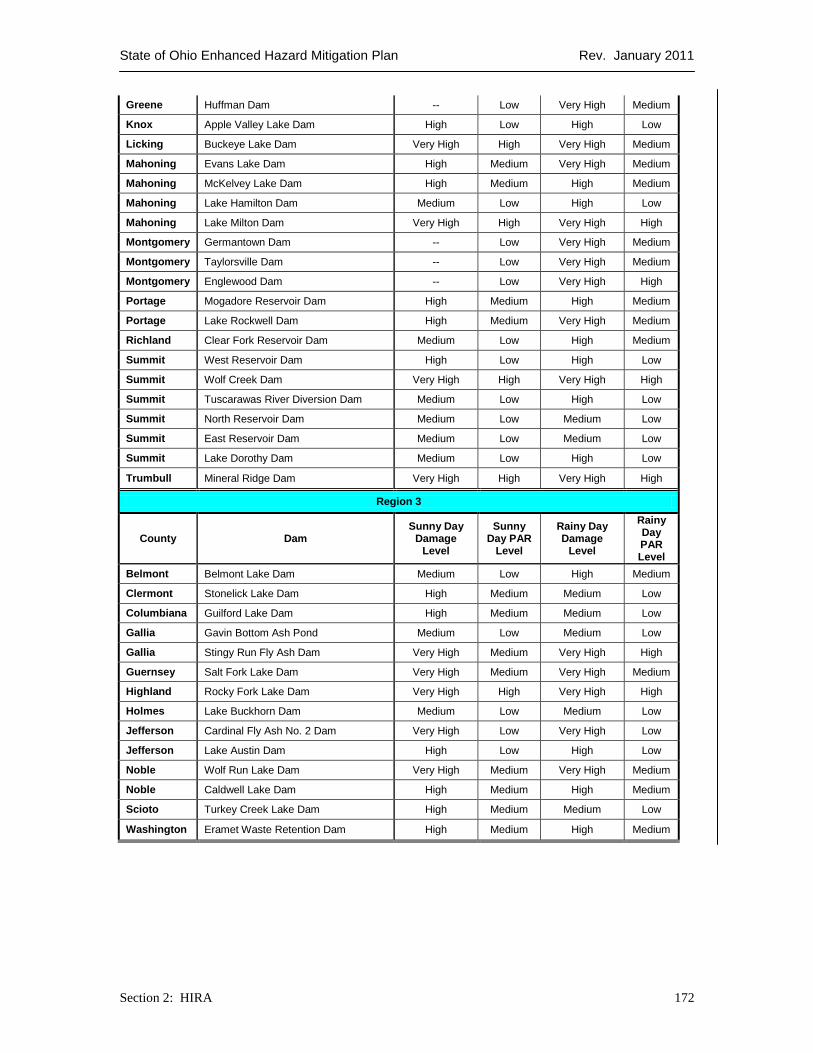
estimates based on experience with flood modeling, other inundation studies, best available information, and site inspections by the DSP. The table shows estimated damage levels and PAR values for both the sunny day and rainy day failure scenarios.
Dams—Results
These results focus on the High Hazard potential dams, and they are considered by ODNR as ―high priority,‖ as failure of any one would presumably result in a loss of at least 50 human lives. Table 2.6.f lists the High Hazard dams with this characteristic by region, and Map 2.6.b displays the Rainy Day PAR.
Table 2.6.f
Priority Dam Inventory, Expected Downstream Damage Level, and Minimum Level Population At-Risk (PAR) by County
Region 1
County Dam Sunny Day
Damage Level
Sunny Day PAR
Level
Rainy Day Damage
Level
Rainy Day PAR Level
Allen Ferguson Upground Reservoir High Medium Very High Medium
Allen Metzger Upground Reservoir Medium Medium Very High Medium
Allen Lost Creek Upground Reservoir Medium Low Medium Low
Clinton Wilmington Upground Reservoir No. 2 Medium Low Medium Low
Crawford Bucyrus Reservoir No. 1 Dam Medium Low Medium Low
Hancock Veterans Memorial Reservoir Medium Low Medium Low
Huron Willard City Upground Reservoir Medium Low Medium Low
Huron Norwalk Memorial Reservoir High Low High Low
Huron Norwalk Upper Reservoir High Low High Low
Huron Norwalk Lower Reservoir High Low High Low
Shelby Lockington Dam -- Low Very High Medium
Shelby Lake Loramie Dam Medium Low Medium Low
Region 2
County Dam Sunny Day
Damage Level
Sunny Day PAR
Level
Rainy Day Damage
Level
Rainy Day PAR Level
Ashtabula Roaming Rock Shores Lake Dam High Medium High Medium
Butler Fairfield Detention "A" Dam -- Low Medium Low
Butler Fairfield Detention "C" Dam -- Low Medium Low
Butler Acton Lake Dam High Low High Low
Cuyahoga Lakeview Cemetery Flood Control Dam
-- Low High Medium
Delaware Alum Creek Upground Reservoir High Low High Low
Delaware O'Shaughnessy Reservoir Dam Very High Low Very High Low
Franklin Hoover Dam Very High High Very High High
Franklin Julian Griggs Dam High Low High Low
Geauga Bridge Creek Dam Very High Medium Very High Medium
State of Ohio Enhanced Hazard Mitigation Plan Rev. January 2011
Section 2: HIRA 172
Greene Huffman Dam -- Low Very High Medium
Knox Apple Valley Lake Dam High Low High Low
Licking Buckeye Lake Dam Very High High Very High Medium
Mahoning Evans Lake Dam High Medium Very High Medium
Mahoning McKelvey Lake Dam High Medium High Medium
Mahoning Lake Hamilton Dam Medium Low High Low
Mahoning Lake Milton Dam Very High High Very High High
Montgomery Germantown Dam -- Low Very High Medium
Montgomery Taylorsville Dam -- Low Very High Medium
Montgomery Englewood Dam -- Low Very High High
Portage Mogadore Reservoir Dam High Medium High Medium
Portage Lake Rockwell Dam High Medium Very High Medium
Richland Clear Fork Reservoir Dam Medium Low High Medium
Summit West Reservoir Dam High Low High Low
Summit Wolf Creek Dam Very High High Very High High
Summit Tuscarawas River Diversion Dam Medium Low High Low
Summit North Reservoir Dam Medium Low Medium Low
Summit East Reservoir Dam Medium Low Medium Low
Summit Lake Dorothy Dam Medium Low High Low
Trumbull Mineral Ridge Dam Very High High Very High High
Region 3
County Dam Sunny Day
Damage Level
Sunny Day PAR
Level
Rainy Day Damage
Level
Rainy Day PAR Level
Belmont Belmont Lake Dam Medium Low High Medium
Clermont Stonelick Lake Dam High Medium Medium Low
Columbiana Guilford Lake Dam High Medium Medium Low
Gallia Gavin Bottom Ash Pond Medium Low Medium Low
Gallia Stingy Run Fly Ash Dam Very High Medium Very High High
Guernsey Salt Fork Lake Dam Very High Medium Very High Medium
Highland Rocky Fork Lake Dam Very High High Very High High
Holmes Lake Buckhorn Dam Medium Low Medium Low
Jefferson Cardinal Fly Ash No. 2 Dam Very High Low Very High Low
Jefferson Lake Austin Dam High Low High Low
Noble Wolf Run Lake Dam Very High Medium Very High Medium
Noble Caldwell Lake Dam High Medium High Medium
Scioto Turkey Creek Lake Dam High Medium Medium Low
Washington Eramet Waste Retention Dam High Medium High Medium

State of Ohio Enhanced Hazard Mitigation Plan Rev. January 2011
Section 2: HIRA 173
Map 2.6.b
State of Ohio Enhanced Hazard Mitigation Plan Rev. January 2011
Section 2: HIRA 174
Of the 56 ―high priority‖ dams, 41 are categorized as large since they have more than 5,000 acre-feet of storage, or they have more than 100 acres of surface area at the dams’ normal pools. The remaining 15 dams have less storage, but still represent a real risk to more than 50 people per dam.
Region 1 includes 12 ―high priority‖ dams, seven of which reside in Allen (3) and Huron (4) Counties combined. Even though no dams in this Region have a High PAR level, three of the dams exhibit a Medium PAR level. Two of the dams in Allen County (Ferguson Upground Reservoir and Metzger Upground Reservoir) do not have approved EAPs. A failure of these structures could prove to be even more catastrophic than represented in Table 2.6.f since the proper preparedness has not been accomplished. However, both have draft inundation mapping, which could aid local officials in outreach initiatives for the public.
In terms of damages, the dams upstream of larger populations exhibit higher estimated damages with both the sunny day and rainy day scenarios. For instance, Lockington Dam (Shelby County) shows no evidence of downstream damage during a sunny day failure, as the dam does not impound any pool—flood control dam. Very High damage estimates should be expected during a large storm event as the channel would most likely be overwhelmed.
Considering the relationship between Table 2.6.e and 2.6.f, it should be noted that Norwalk Lower Reservoir (Huron County) had a documented failure in 1969 and is listed as a ―high priority‖ by the State, as it exhibits High expected damage levels for both sunny day and rainy day scenarios. However, the failure resulted in a rebuild that included a berm and updated drainage, and an EAP was developed. Any future incidents should be managed by this plan.
Also, there is only one Class I dam in Region 1 that has had a documented incident or failure but lacks an EAP—Greenwich Reservoir Dam (Huron County). An EAP would provide the added preparedness to reduce future losses; this should be considered by the dam owner.
Region 2 is distinguished as having the most ―high priority‖ dams among the State’s regions with 30 dams. Six dams in the Region exhibit High PAR levels when considering both scenarios, including Lake Milton Dam (Trumbull County), which does not have an approved EAP. A failure of this structure could prove to be even more catastrophic than represented in Table 2.6.f since the proper preparedness has not been accomplished. Additionally, Buckeye Lake Dam (Licking County) does not have an approved EAP, but draft inundation mapping is available for outreach to people within the community.
Considering potential damage levels given a dam failure in this Region (Table 2.6.f), the dams exhibiting High or Very High damage estimates during a sunny day failure should be points of interest, especially those without EAPs. An example of this would be Lake Rockwell Dam (Portage County) whereby the sunny day scenario is projected to result in High damage levels downstream of the failure. Without an EAP, there may not be adequate preparedness to handle such an event in an efficient and effective manner.
State of Ohio Enhanced Hazard Mitigation Plan Rev. January 2011
Section 2: HIRA 175
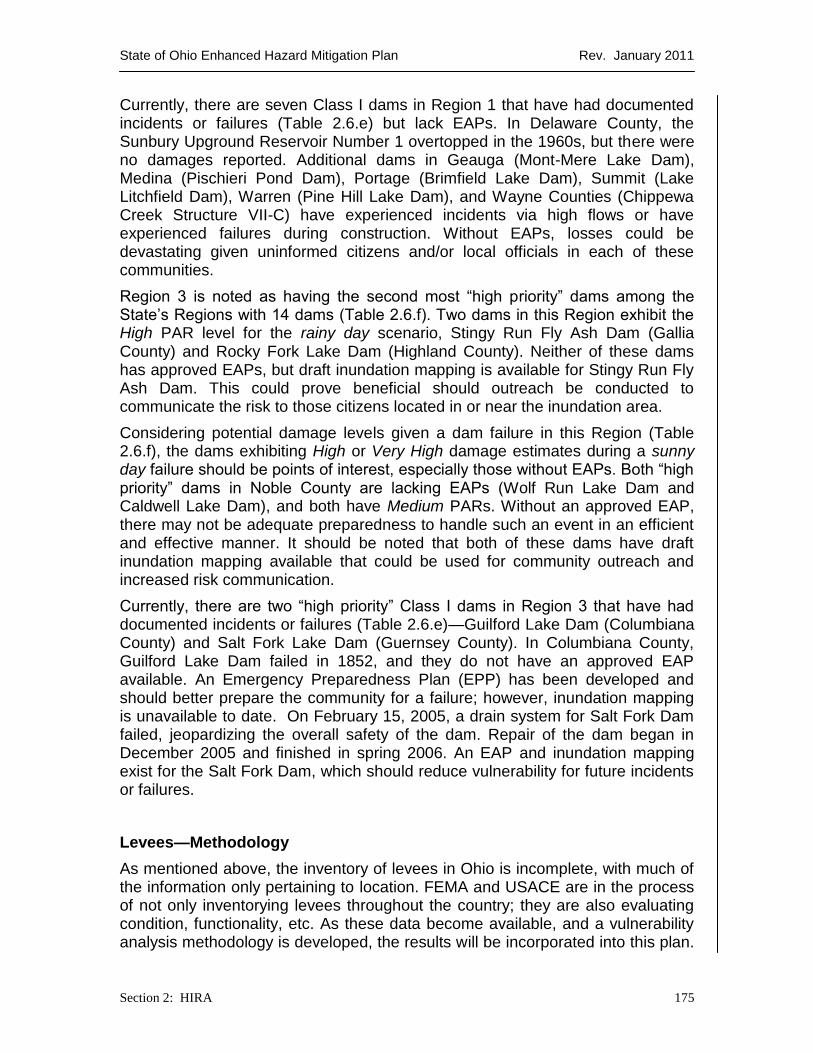
Currently, there are seven Class I dams in Region 1 that have had documented incidents or failures (Table 2.6.e) but lack EAPs. In Delaware County, the Sunbury Upground Reservoir Number 1 overtopped in the 1960s, but there were no damages reported. Additional dams in Geauga (Mont-Mere Lake Dam), Medina (Pischieri Pond Dam), Portage (Brimfield Lake Dam), Summit (Lake Litchfield Dam), Warren (Pine Hill Lake Dam), and Wayne Counties (Chippewa Creek Structure VII-C) have experienced incidents via high flows or have experienced failures during construction. Without EAPs, losses could be devastating given uninformed citizens and/or local officials in each of these communities.
Region 3 is noted as having the second most ―high priority‖ dams among the State’s Regions with 14 dams (Table 2.6.f). Two dams in this Region exhibit the High PAR level for the rainy day scenario, Stingy Run Fly Ash Dam (Gallia County) and Rocky Fork Lake Dam (Highland County). Neither of these dams has approved EAPs, but draft inundation mapping is available for Stingy Run Fly Ash Dam. This could prove beneficial should outreach be conducted to communicate the risk to those citizens located in or near the inundation area.
Considering potential damage levels given a dam failure in this Region (Table 2.6.f), the dams exhibiting High or Very High damage estimates during a sunny day failure should be points of interest, especially those without EAPs. Both ―high priority‖ dams in Noble County are lacking EAPs (Wolf Run Lake Dam and Caldwell Lake Dam), and both have Medium PARs. Without an approved EAP, there may not be adequate preparedness to handle such an event in an efficient and effective manner. It should be noted that both of these dams have draft inundation mapping available that could be used for community outreach and increased risk communication.
Currently, there are two ―high priority‖ Class I dams in Region 3 that have had documented incidents or failures (Table 2.6.e)—Guilford Lake Dam (Columbiana County) and Salt Fork Lake Dam (Guernsey County). In Columbiana County, Guilford Lake Dam failed in 1852, and they do not have an approved EAP available. An Emergency Preparedness Plan (EPP) has been developed and should better prepare the community for a failure; however, inundation mapping is unavailable to date. On February 15, 2005, a drain system for Salt Fork Dam failed, jeopardizing the overall safety of the dam. Repair of the dam began in December 2005 and finished in spring 2006. An EAP and inundation mapping exist for the Salt Fork Dam, which should reduce vulnerability for future incidents or failures.
Levees—Methodology
As mentioned above, the inventory of levees in Ohio is incomplete, with much of the information only pertaining to location. FEMA and USACE are in the process of not only inventorying levees throughout the country; they are also evaluating condition, functionality, etc. As these data become available, and a vulnerability analysis methodology is developed, the results will be incorporated into this plan.
State of Ohio Enhanced Hazard Mitigation Plan Rev. January 2011
Section 2: HIRA 176
Such analyses will include evaluating vulnerability considering the with levee and without levee scenarios. More information on these scenarios can be found in FEMA’s Guidelines and Specifications for Flood Hazard Mapping Partners, Appendix H.
STATE OWNED / CRITICAL FACILITIES VULNERABILITY ANALYSIS & LOSS ESTIMATION
Methodology
Comparing the state-owned and critical facility structure inventory identified and discussed in Section 2.1 of this plan with the inundation information discussed in Section 2.5 and the dam hazard information in Section 2.6 of this plan, an assessment of vulnerable state-owned structures and critical facilities was completed for the ―high priority‖ dams in Ohio (listed in Table 2.6.f).
For the 2008 update, dams located in the counties that were not inventoried and listed in Section 2.1 were visited to determine if state-owned structures or critical facilities over $1M were in the potential inundation area if the dams were to fail. This resulted in few site visits as most counties were inventoried, as shown in Section 2.1. For the 2011 update, no new site visits were conducted. For those dams in counties not inventoried, most have EAPs or EPPs, and some have draft or approved inundation mapping. However, the dams in Noble County and the one in Clinton will have to be prioritized for inventory given the next plan update in 2014, as no location-specific numbers have been collected to date in these areas.
The estimate of potential loss (EPL) for all state-owned structures and critical facilities, except for that of state-owned dams, was determined using the methodology identified in Section 2.1 of this plan. The estimate of potential loss of state-owned dams includes costs associated with dam construction after construction plans were finalized. That estimate is then increased using a 2-percent interest to bring the EPL to present day value. The estimates of potential loss of these structures are lower-end estimates of replacement costs with the assumption of complete dam failure through its maximum section and losing its principal spillway.
Vulnerability data for state-owned structures and critical facilities behind levees are in the same state as the statewide levee inventory--incomplete. FEMA’s efforts to assess existing levees and their residual and real risks hinge on updated hydrology and hydraulics for each system. Such studies are being developed as levee owners are being held to the standards in 44CFR§65.10 in order for their levee to be shown on their local Flood Insurance Rate Maps as protecting lands from the 100-year flood. Therefore, once these data are developed and released, they will become part of this plan.
Results
This plan update included a new methodology for identifying the hazard and prioritizing dams across the state. Some of the dams have inundation mapping
State of Ohio Enhanced Hazard Mitigation Plan Rev. January 2011
Section 2: HIRA 177
available, but the majority do not. Additionally, the inventory of georeferenced state structures is incomplete to date. Therefore, accurate state facility vulnerability is not available at this time. The next plan update will involve review of available inundation mapping with updated inventories of state-owned structures and critical facilities.
As mentioned above, currently there are no data to evaluate potential inundation areas behind levees. As these data are developed, they will become part of this plan.
State of Ohio Enhanced Hazard Mitigation Plan Rev. January 2011
Section 2: HIRA 178
2.7 WILDFIRE
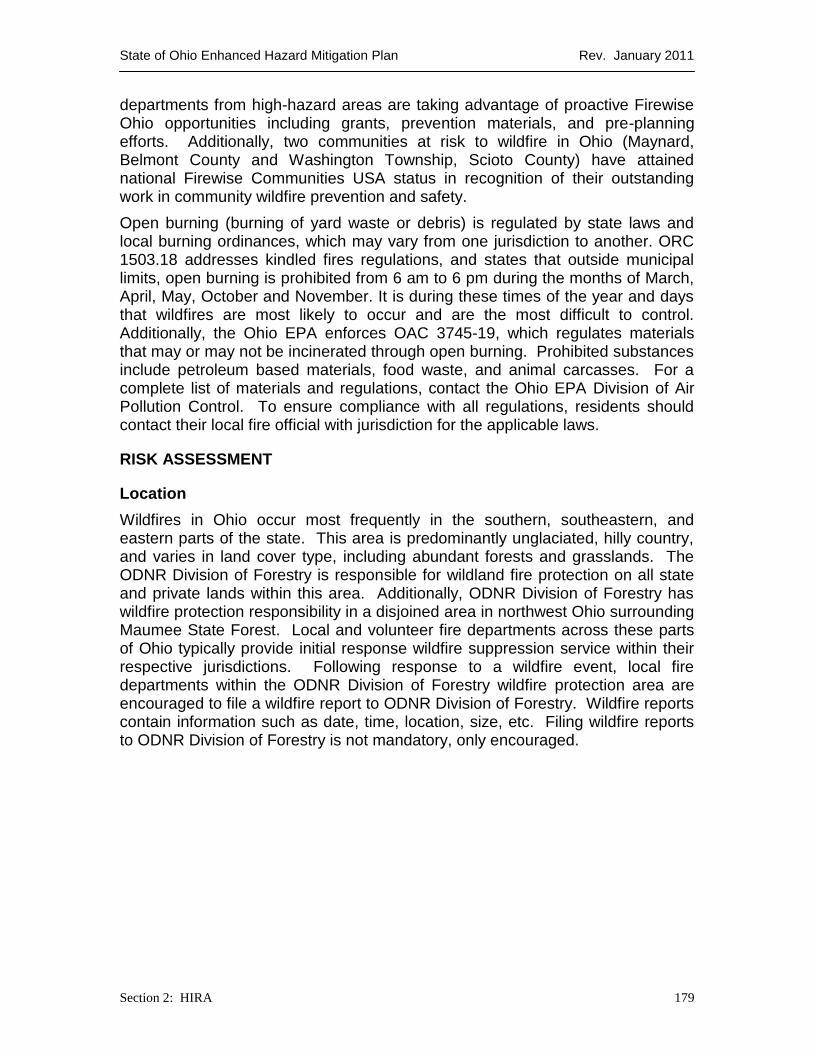
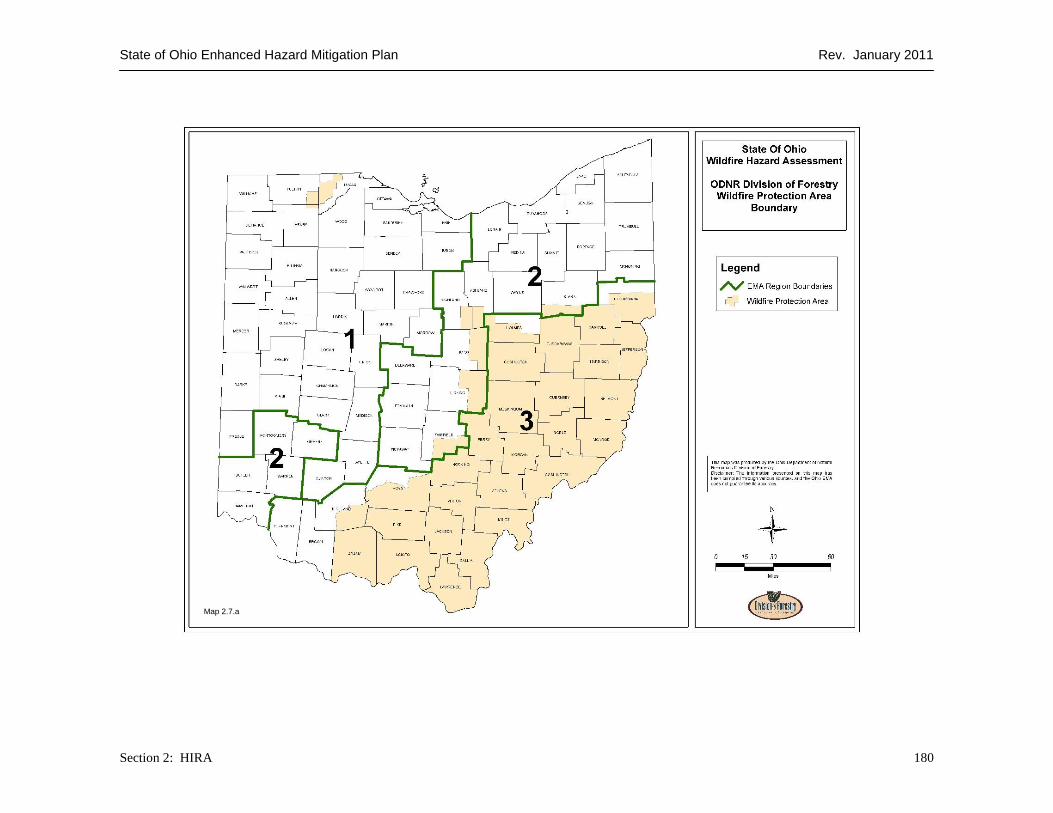
Each year in Ohio, an average of 800 wildfires burn 4,000 to 5,000 acres of forest and grassland within ODNR Division of Forestry’s Wildfire Protection Area (Map 2.7.a). The protection area includes all 185,000 acres of Ohio’s 20 State Forests, as well as all privately owned lands within the district boundaries. The forest fire protection district corresponds mostly to the state’s unglaciated hill country (southern and eastern Ohio), and also encompasses a section of northwest Ohio (Maumee State Forest area). Ohio’s wildfire seasons occur primarily in the spring (March, April and May) before vegetation has ―greened-up‖, and the fall (October and November) when leaf drop occurs. During these times, and especially when weather conditions are warm, windy and with low humidity, cured vegetation is particularly susceptible to burning. When combined, fuel (vegetation, woody debris), weather (wind, temperature, humidity) and topography (hills and valleys) present an unpredictable danger to unwary citizens and firefighters in the path of a wildfire.
While Ohio government agencies and local fire departments are accustomed to handling seasonal wildfires, occasional extreme events can make conditions dangerous and disruptive. Heavy fuel accumulations oftentimes make wildfire suppression extremely difficult due to more intense blazes. Occasionally, heavy fuel loadings and topography create problems in limiting access to fires, and lead to heavy equipment use for suppression. Prolonged drought may cause an exceptionally long or active wildfire season, as well as contribute to extreme wildfire behavior or burning conditions. Multiple concurrent fires can tax resources and quickly create a lack of manpower and other resources and retard the ability to suppress fires rapidly and safely.
Wildland Urban Interface (WUI) conditions may create a serious issue of concern in Ohio, as well. WUI is defined as the situation where homes, residences, and structures are in close proximity to forested lands and grasslands prone to wildfire. This creates a situation where, in the event of a wildfire, personal and property safety are put in jeopardy. Additionally, WUI situations force fire departments to shift focus from fire suppression to structure protection, consequently increasing exposure time and risk. WUI situations are most effectively addressed prior to wildfire occurrence by individual homeowners. Mitigation strategies include reducing flammable vegetation and debris within 30 feet of the structure, choosing less flammable landscape species, using fire resistant building materials, and practicing safe open burning techniques. Currently in Ohio, there are no building codes that require wildfire safety considerations in construction, nor do insurance companies offer premium breaks for homeowners who do include wildfire safety measures around their homes.
In the fall of 2003, ODNR Division of Forestry implemented Firewise Ohio, a statewide WUI safety initiative, in response to the growing WUI situation in Ohio. Firewise Ohio is focused on cooperating with local fire departments to create effective WUI and wildfire prevention and safety programs at the community level. To this point, Firewise Ohio has been very successful, and many fire
State of Ohio Enhanced Hazard Mitigation Plan Rev. January 2011
Section 2: HIRA 179
departments from high-hazard areas are taking advantage of proactive Firewise Ohio opportunities including grants, prevention materials, and pre-planning efforts. Additionally, two communities at risk to wildfire in Ohio (Maynard, Belmont County and Washington Township, Scioto County) have attained national Firewise Communities USA status in recognition of their outstanding work in community wildfire prevention and safety.
Open burning (burning of yard waste or debris) is regulated by state laws and local burning ordinances, which may vary from one jurisdiction to another. ORC 1503.18 addresses kindled fires regulations, and states that outside municipal limits, open burning is prohibited from 6 am to 6 pm during the months of March, April, May, October and November. It is during these times of the year and days that wildfires are most likely to occur and are the most difficult to control. Additionally, the Ohio EPA enforces OAC 3745-19, which regulates materials that may or may not be incinerated through open burning. Prohibited substances include petroleum based materials, food waste, and animal carcasses. For a complete list of materials and regulations, contact the Ohio EPA Division of Air Pollution Control. To ensure compliance with all regulations, residents should contact their local fire official with jurisdiction for the applicable laws.
RISK ASSESSMENT
Location
Wildfires in Ohio occur most frequently in the southern, southeastern, and eastern parts of the state. This area is predominantly unglaciated, hilly country, and varies in land cover type, including abundant forests and grasslands. The ODNR Division of Forestry is responsible for wildland fire protection on all state and private lands within this area. Additionally, ODNR Division of Forestry has wildfire protection responsibility in a disjoined area in northwest Ohio surrounding Maumee State Forest. Local and volunteer fire departments across these parts of Ohio typically provide initial response wildfire suppression service within their respective jurisdictions. Following response to a wildfire event, local fire departments within the ODNR Division of Forestry wildfire protection area are encouraged to file a wildfire report to ODNR Division of Forestry. Wildfire reports contain information such as date, time, location, size, etc. Filing wildfire reports to ODNR Division of Forestry is not mandatory, only encouraged.
State of Ohio Enhanced Hazard Mitigation Plan Rev. January 2011
Section 2: HIRA 180
Map 2.7.a
State of Ohio Enhanced Hazard Mitigation Plan Rev. January 2011
Section 2: HIRA 181
Counties that lie outside of the ODNR Division of Forestry wildfire protection area typically do not experience many wildfire events due to land use and land cover type (agricultural, developed urban/suburban). Fire departments from these counties do not file any wildfire reports; therefore ODNR Division of Forestry does not have a dataset for wildfire occurrence in these areas.
Region 1 ODNR Division of Forestry collects wildfire data from fire departments in Lucas, Henry, and Fulton Counties in Region 1, as these counties contain parts of Maumee State Forest. ODNR Division of Forestry does not collect wildfire report data in the remainder of Region 1 counties. Land cover type in Region 1 is predominantly agricultural land, and generally unforested; therefore, wildfire occurrence and risk are not as great. From 1/1/1997 – 11/20/2007, 227 wildfires burning 679 acres were reported in Lucas, Henry, and Fulton Counties.
Region 2 The majority of Region 2 lies outside of the ODNR Division of Forestry wildfire protection area – six counties straddle the wildfire protection area boundary. Ashland County contains Mohican State Forest, which is located completely within Region 2. Ashland and neighboring Richland Counties reported 57 wildfires burning 172 acres from 1/1/1997 – 11/20/2007. Additional portions of Region 2 counties that report wildfires to ODNR Division of Forestry include southeastern Fairfield, western Licking, western Knox, and southern Stark. Region 2 contains Ohio’s most developed metropolitan hubs, as well as areas of highest population density. Wildland fuel types (woodland, grasslands) are not as abundant; accordingly, wildfire risk and occurrence are not as great. One notable location for potential large scale and damaging wildfire in Region 2 is the Mentor Marsh in Lake County, east of Cleveland. Mentor Marsh is a 691-acre nature preserve that has converted to nearly a monoculture of 8-12 foot high non-native Phragmites grass. This area is highly flammable, especially in spring with high winds coming off Lake Erie. Mentor Marsh has experienced 10 wildfire events since 1979, four of these being extremely noteworthy: May 1982 – 200 acres, May 1987 – 120 acres, May 1992 – 400 acres, April 2003 – 375 acres. All of these large-scale events were determined to be arson caused. Many homes, businesses, and high valued property are at risk from wildfire events in Mentor Marsh.
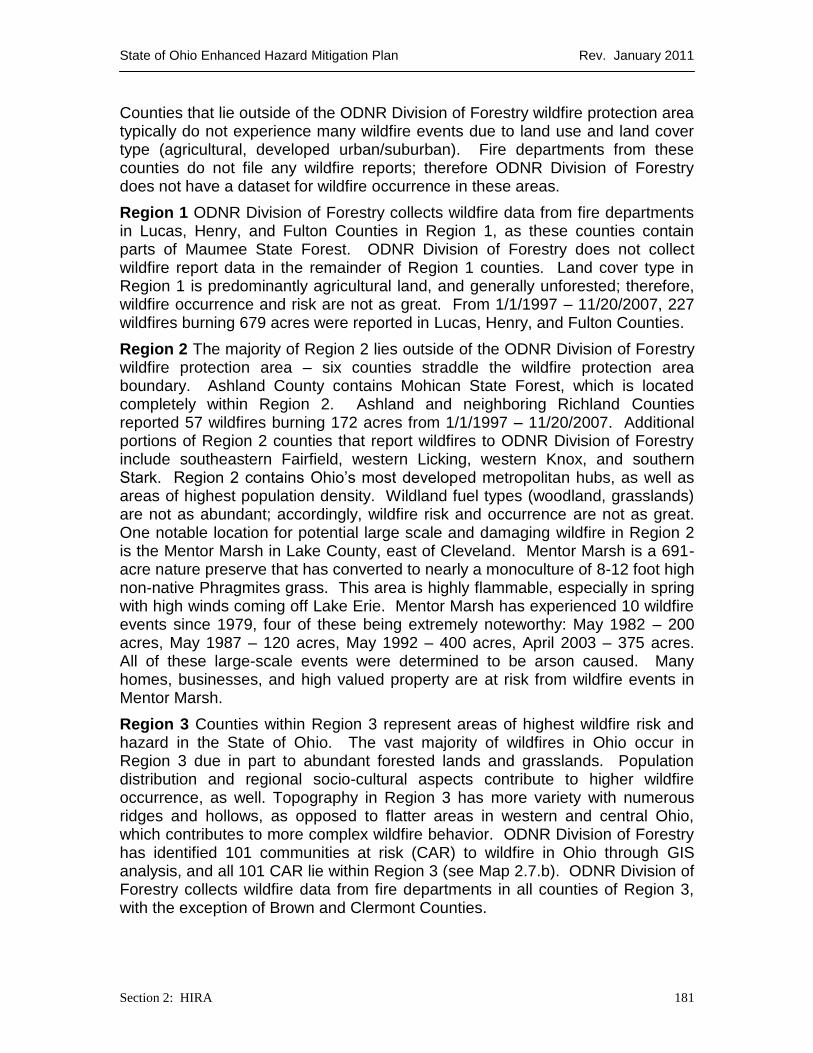
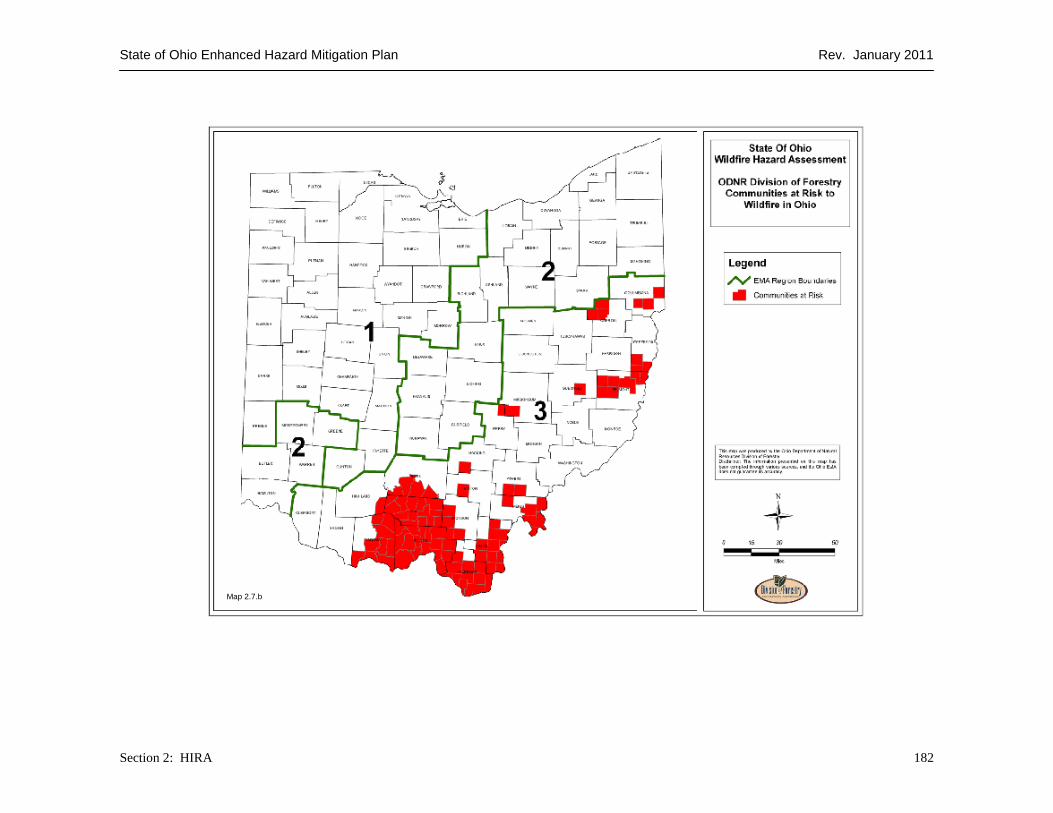
Region 3 Counties within Region 3 represent areas of highest wildfire risk and hazard in the State of Ohio. The vast majority of wildfires in Ohio occur in Region 3 due in part to abundant forested lands and grasslands. Population distribution and regional socio-cultural aspects contribute to higher wildfire occurrence, as well. Topography in Region 3 has more variety with numerous ridges and hollows, as opposed to flatter areas in western and central Ohio, which contributes to more complex wildfire behavior. ODNR Division of Forestry has identified 101 communities at risk (CAR) to wildfire in Ohio through GIS analysis, and all 101 CAR lie within Region 3 (see Map 2.7.b). ODNR Division of Forestry collects wildfire data from fire departments in all counties of Region 3, with the exception of Brown and Clermont Counties.
State of Ohio Enhanced Hazard Mitigation Plan Rev. January 2011
Section 2: HIRA 182
Map 2.7.b
State of Ohio Enhanced Hazard Mitigation Plan Rev. January 2011
Section 2: HIRA 183
Past Occurrences
Ohio has experienced 8,235 wildfires that have burned 42,622 acres between 1/1/1997 and 11/20/2007. These statistics were taken from wildfire reports filed by local and volunteer fire departments in southern, southeastern, eastern, as well as the disjoined northwestern Ohio section within the ODNR Division of Forestry Wildfire Protection Area. Wildfires that have occurred on federal lands in Ohio are not included in these data. It can be safely assumed that less than 100% of all wildfires on state and public land are reported; consequently, actual total occurrence and acres burned are suspected to be higher than data indicate.
Weather is the primary factor that determines the severity of fall and spring wildfire seasons in Ohio. Drought condition, combined with windy days create red flag, or extremely high fire danger. Consequently, the past fire occurrence record can be closely linked to historical weather data. Weather conditions leading up to and in 1930 resulted in the worst year to date for wildfires in Ohio, as 15,400 acres were recorded as burning over the course of the year. Extreme drought in 1950 that continued for the next several years provided for very active wildfire seasons. March 27, 1950 is considered the worst day in Ohio fire control history – 65 fires burned a total of 5,900 acres. In 1952, continued summer drought spurred a record fall fire season in Ohio and neighboring states. ODNR Division of Parks and Division of Wildlife employees assisted in suppression efforts, and the Ohio National Guard also provided assistance. A total of 680 wildfires burned 22,445 acres in the fall of 1952. Drought conditions in 1963 required placing on alert the ODNR Division of Forestry’s pilots, 2000 fire wardens, 150 ODNR Division of Forestry employees, as well as several thousand volunteer firefighters and the Ohio National Guard. One or more fires were reported everyday from September 17 through November 29, and October showed a record number of fires for that month. 1988 was another severe wildfire year, as drought conditions required that Civilian Conservation Corps crews be mobilized, as well as all other trained Division employees. More recently, 1999 proved to be a busy year for wildfire in Ohio, as an above average 7,836 acres were burned by nearly 1,500 wildfires.
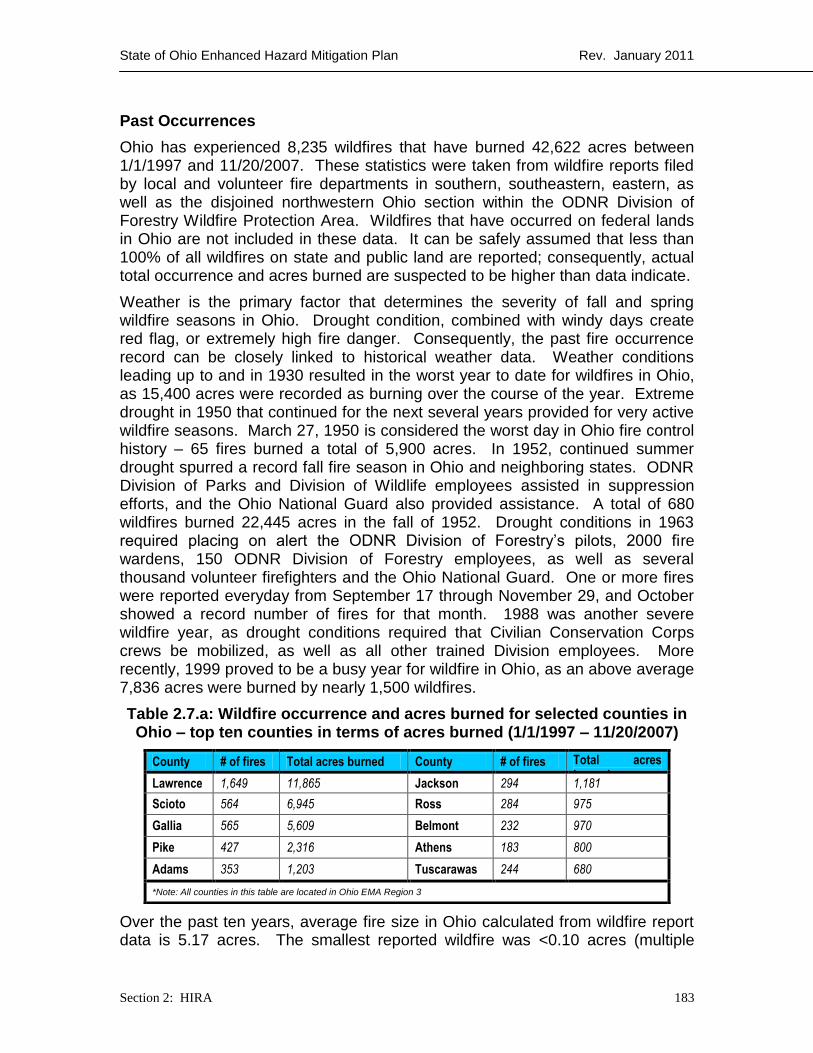
Table 2.7.a: Wildfire occurrence and acres burned for selected counties in Ohio – top ten counties in terms of acres burned (1/1/1997 – 11/20/2007)
Over the past ten years, average fire size in Ohio calculated from wildfire report data is 5.17 acres. The smallest reported wildfire was <0.10 acres (multiple
County # of fires Total acres burned County # of fires Total acres burned
Lawrence 1,649 11,865 Jackson 294 1,181
Scioto 564 6,945 Ross 284 975
Gallia 565 5,609 Belmont 232 970
Pike 427 2,316 Athens 183 800
Adams 353 1,203 Tuscarawas 244 680
*Note: All counties in this table are located in Ohio EMA Region 3
State of Ohio Enhanced Hazard Mitigation Plan Rev. January 2011
Section 2: HIRA 184
counties and dates), while the largest reported fire was 1,016 acres (Scioto County, 4/14/2003).
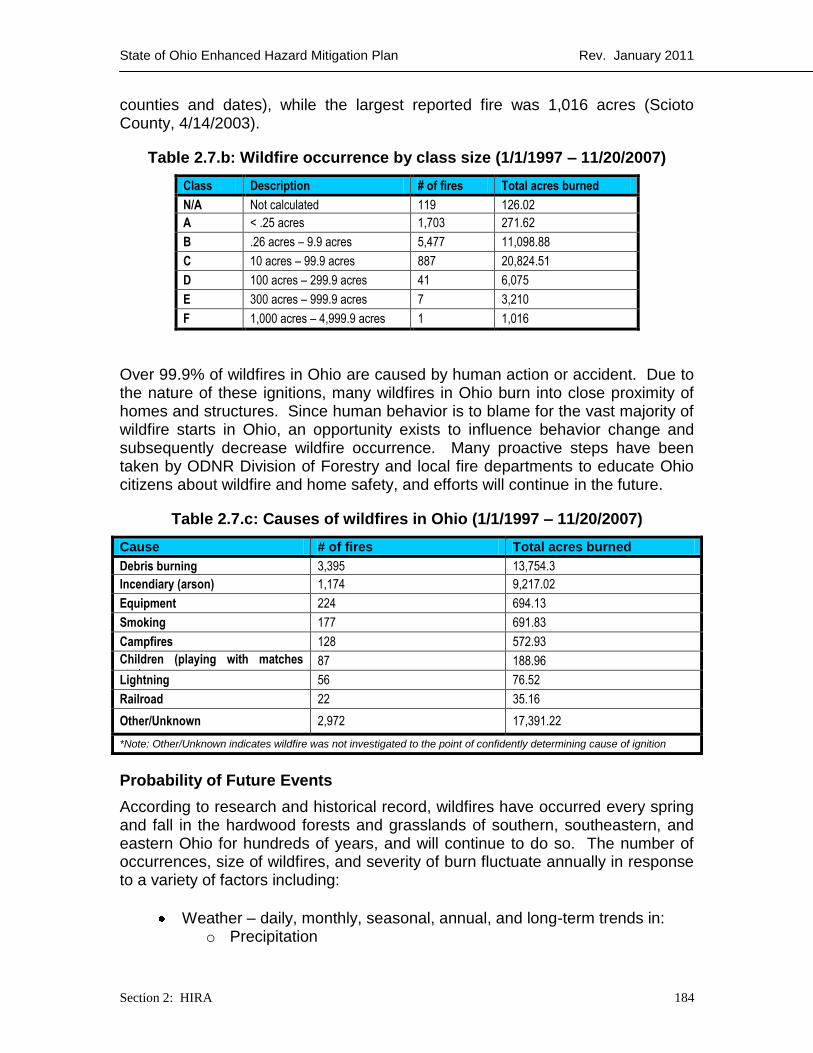
Table 2.7.b: Wildfire occurrence by class size (1/1/1997 – 11/20/2007)
Class Description # of fires Total acres burned
N/A Not calculated 119 126.02
A < .25 acres 1,703 271.62
B .26 acres – 9.9 acres 5,477 11,098.88
C 10 acres – 99.9 acres 887 20,824.51
D 100 acres – 299.9 acres 41 6,075
E 300 acres – 999.9 acres 7 3,210
F 1,000 acres – 4,999.9 acres 1 1,016
Over 99.9% of wildfires in Ohio are caused by human action or accident. Due to the nature of these ignitions, many wildfires in Ohio burn into close proximity of homes and structures. Since human behavior is to blame for the vast majority of wildfire starts in Ohio, an opportunity exists to influence behavior change and subsequently decrease wildfire occurrence. Many proactive steps have been taken by ODNR Division of Forestry and local fire departments to educate Ohio citizens about wildfire and home safety, and efforts will continue in the future.
Table 2.7.c: Causes of wildfires in Ohio (1/1/1997 – 11/20/2007)
Cause # of fires Total acres burned
Debris burning 3,395 13,754.3
Incendiary (arson) 1,174 9,217.02
Equipment 224 694.13
Smoking 177 691.83
Campfires 128 572.93
Children (playing with matches etc.)
87 188.96
Lightning 56 76.52
Railroad 22 35.16
Other/Unknown 2,972 17,391.22
*Note: Other/Unknown indicates wildfire was not investigated to the point of confidently determining cause of ignition
Probability of Future Events
According to research and historical record, wildfires have occurred every spring and fall in the hardwood forests and grasslands of southern, southeastern, and eastern Ohio for hundreds of years, and will continue to do so. The number of occurrences, size of wildfires, and severity of burn fluctuate annually in response to a variety of factors including:
Weather – daily, monthly, seasonal, annual, and long-term trends in: o Precipitation
State of Ohio Enhanced Hazard Mitigation Plan Rev. January 2011
Section 2: HIRA 185
o Relative Humidity o Temperature o Wind
Fuels – condition of 1, 10, 100, 1000 hour fuels in terms of: o Moisture content o Arrangement o Accumulation level o Availability
Ignitions – presence or absence of wildfire starts: o Human caused
Debris burning – compliance with ORC 1503.18, and safe debris burning techniques
Incendiary – arsonists at large Wildfire prevention and awareness efforts
Suppression Response – Capability and timeliness of initial attack: o Quickness of response to the incident o Local / Volunteer fire department capability o Availability of state and local resources
Number of concurrent wildfires
VULNERABILITY ANALYSIS & LOSS ESTIMATION
Methodology
In order to accurately and quantitatively determine statewide wildfire risk, ODNR Division of Forestry combined several available datasets, using GIS tools and extensions, to complete a wildfire hazard assessment. Datasets integrated in the wildfire assessment include historic wildfire occurrence (all available wildfire reports submitted to ODNR Division of Forestry from Ohio fire departments), land use / land cover (LULC) data (1994 Landsat TM coverage data), and statewide population density. These three datasets were chosen to represent a risk (wildfire occurrence), hazard (land cover/fuel type), and value (population/homes). The township level was chosen to assign wildfire risk because rural fire departments in Ohio are typically organized at the township level. Evaluating wildfire hazard at the township level better illustrates the areas that need to increase wildfire prevention and awareness programs. It also indicates the local fire departments that are responsible for particular high-risk jurisdictions.
Each of these respective datasets was converted to a raster format, and categorical values were reclassified accordingly. For example, hardwood LULC type was given a value of 8 while urban cover type was given a value of 0 (to indicate flammability), ―0 – 10‖ wildfires was valued at 1 while ―500 – 650‖ wildfires was valued at 10 (to indicate occurrence risk), etc. A weighted calculation was then performed using the ArcGIS raster calculator function, whereby a total wildfire hazard value was computed from the reclassified values as such: historic reported wildfire occurrence 50%, LULC 37.50%, population density 12.50%. The calculation resulted in a new raster. The calculated wildfire
State of Ohio Enhanced Hazard Mitigation Plan Rev. January 2011
Section 2: HIRA 186
hazard value was broken into four categories and labeled low, moderate, high, and very high. Factors pertinent to overall wildfire hazard level not incorporated into the calculation include fire department capability and water availability. The ODNR Division of Forestry wildfire hazard assessment was most recently updated on December 15, 2006.
Results
The product of this project, the Ohio wildfire hazard assessment map, accurately indicates wildfire hazard level for all townships in Ohio (see map 2.7.c). Communities at risk to wildfire in Ohio are those townships that were attributed with a calculated wildfire hazard value equal to High or Very High.
Region 1 and Region 2 are assessed as having generally low wildfire hazard, with several pockets of moderate risk of wildfire. Region 3 is assessed as having generally moderate risk of wildfire, with a sizeable section of southern Ohio having high or very high wildfire risk (Gallia, Lawrence, Scioto, Adams, Pike, southern Ross Counties). Southeastern and eastern Ohio were assessed as having an additional 29 communities rated as having high wildfire hazard. Particular high-risk groups in southeastern and eastern Ohio occur in southern Athens and Meigs Counties, as well as in Belmont and southern Jefferson Counties.
High valued personal property, including homes, machinery, agricultural crops, and tree plantations in areas of high or very high wildfire hazard are more vulnerable to damage by wildfire. Fire engines belonging to local fire departments are occasionally damaged while suppressing wildfires. A great amount of personal property has been saved by fire departments through effective and safe wildfire suppression
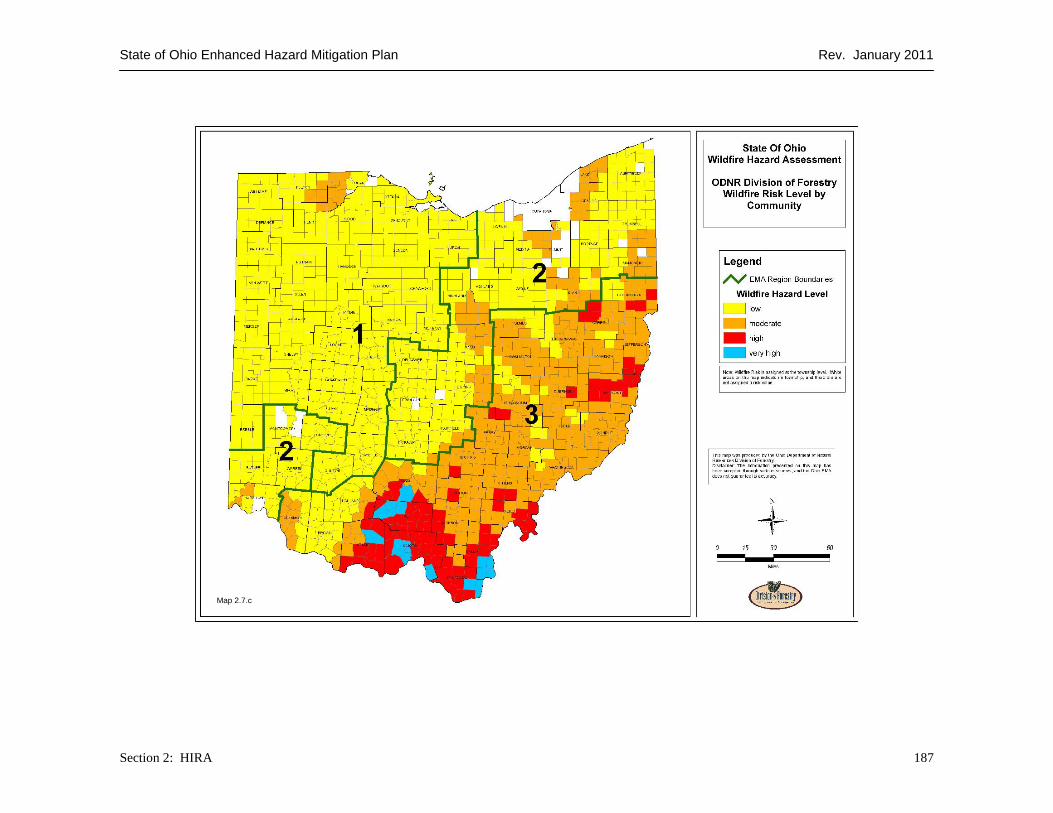
State of Ohio Enhanced Hazard Mitigation Plan Rev. January 2011
Section 2: HIRA 187
Map 2.7.c
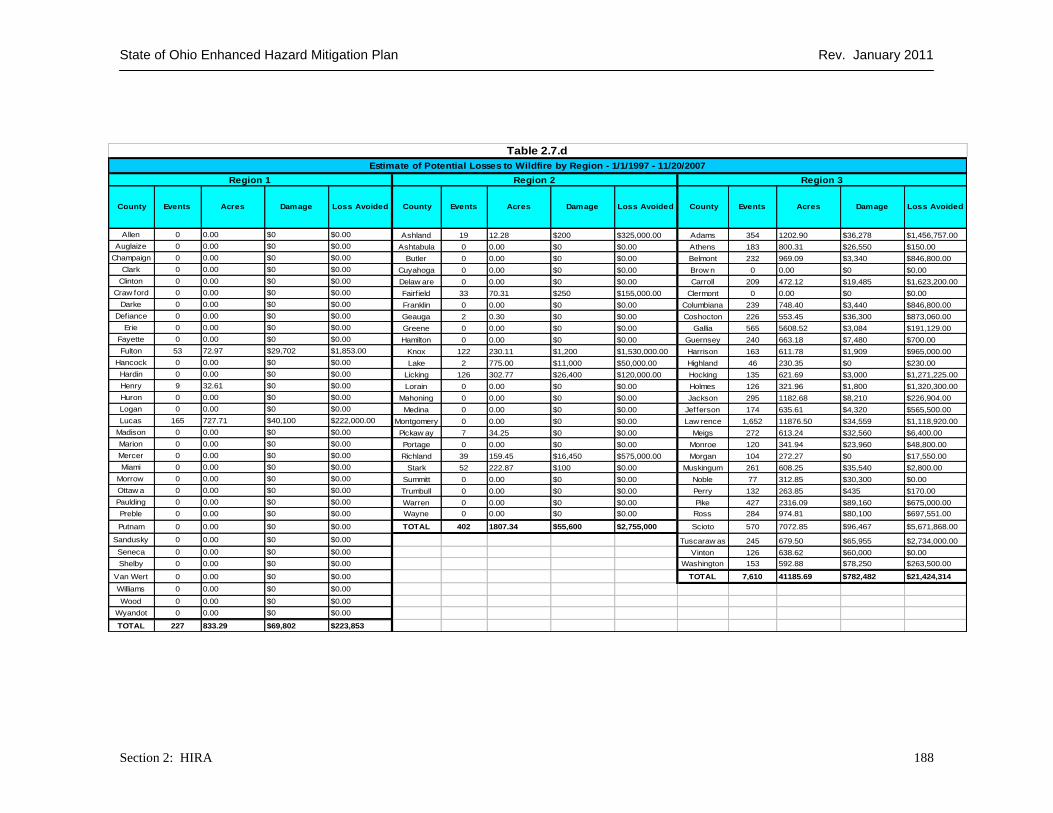
State of Ohio Enhanced Hazard Mitigation Plan Rev. January 2011
Section 2: HIRA 188
Allen 0 0.00 $0 $0.00 Ashland 19 12.28 $200 $325,000.00 Adams 354 1202.90 $36,278 $1,456,757.00
Auglaize 0 0.00 $0 $0.00 Ashtabula 0 0.00 $0 $0.00 Athens 183 800.31 $26,550 $150.00
Champaign 0 0.00 $0 $0.00 Butler 0 0.00 $0 $0.00 Belmont 232 969.09 $3,340 $846,800.00
Clark 0 0.00 $0 $0.00 Cuyahoga 0 0.00 $0 $0.00 Brow n 0 0.00 $0 $0.00
Clinton 0 0.00 $0 $0.00 Delaw are 0 0.00 $0 $0.00 Carroll 209 472.12 $19,485 $1,623,200.00
Craw ford 0 0.00 $0 $0.00 Fairf ield 33 70.31 $250 $155,000.00 Clermont 0 0.00 $0 $0.00
Darke 0 0.00 $0 $0.00 Franklin 0 0.00 $0 $0.00 Columbiana 239 748.40 $3,440 $846,800.00
Defiance 0 0.00 $0 $0.00 Geauga 2 0.30 $0 $0.00 Coshocton 226 553.45 $36,300 $873,060.00
Erie 0 0.00 $0 $0.00 Greene 0 0.00 $0 $0.00 Gallia 565 5608.52 $3,084 $191,129.00
Fayette 0 0.00 $0 $0.00 Hamilton 0 0.00 $0 $0.00 Guernsey 240 663.18 $7,480 $700.00
Fulton 53 72.97 $29,702 $1,853.00 Knox 122 230.11 $1,200 $1,530,000.00 Harrison 163 611.78 $1,909 $965,000.00
Hancock 0 0.00 $0 $0.00 Lake 2 775.00 $11,000 $50,000.00 Highland 46 230.35 $0 $230.00
Hardin 0 0.00 $0 $0.00 Licking 126 302.77 $26,400 $120,000.00 Hocking 135 621.69 $3,000 $1,271,225.00
Henry 9 32.61 $0 $0.00 Lorain 0 0.00 $0 $0.00 Holmes 126 321.96 $1,800 $1,320,300.00
Huron 0 0.00 $0 $0.00 Mahoning 0 0.00 $0 $0.00 Jackson 295 1182.68 $8,210 $226,904.00
Logan 0 0.00 $0 $0.00 Medina 0 0.00 $0 $0.00 Jefferson 174 635.61 $4,320 $565,500.00
Lucas 165 727.71 $40,100 $222,000.00 Montgomery 0 0.00 $0 $0.00 Law rence 1,652 11876.50 $34,559 $1,118,920.00
Madison 0 0.00 $0 $0.00 Pickaw ay 7 34.25 $0 $0.00 Meigs 272 613.24 $32,560 $6,400.00
Marion 0 0.00 $0 $0.00 Portage 0 0.00 $0 $0.00 Monroe 120 341.94 $23,960 $48,800.00
Mercer 0 0.00 $0 $0.00 Richland 39 159.45 $16,450 $575,000.00 Morgan 104 272.27 $0 $17,550.00
Miami 0 0.00 $0 $0.00 Stark 52 222.87 $100 $0.00 Muskingum 261 608.25 $35,540 $2,800.00
Morrow 0 0.00 $0 $0.00 Summitt 0 0.00 $0 $0.00 Noble 77 312.85 $30,300 $0.00
Ottaw a 0 0.00 $0 $0.00 Trumbull 0 0.00 $0 $0.00 Perry 132 263.85 $435 $170.00
Paulding 0 0.00 $0 $0.00 Warren 0 0.00 $0 $0.00 Pike 427 2316.09 $89,160 $675,000.00
Preble 0 0.00 $0 $0.00 Wayne 0 0.00 $0 $0.00 Ross 284 974.81 $80,100 $697,551.00
Putnam 0 0.00 $0 $0.00 TOTAL 402 1807.34 $55,600 $2,755,000 Scioto 570 7072.85 $96,467 $5,671,868.00
Sandusky 0 0.00 $0 $0.00 Tuscaraw as 245 679.50 $65,955 $2,734,000.00
Seneca 0 0.00 $0 $0.00 Vinton 126 638.62 $60,000 $0.00
Shelby 0 0.00 $0 $0.00 Washington 153 592.88 $78,250 $263,500.00
Van Wert 0 0.00 $0 $0.00 TOTAL 7,610 41185.69 $782,482 $21,424,314
Williams 0 0.00 $0 $0.00
Wood 0 0.00 $0 $0.00
Wyandot 0 0.00 $0 $0.00
TOTAL 227 833.29 $69,802 $223,853
Damage
Table 2.7.d
Estimate of Potential Losses to Wildfire by Region - 1/1/1997 - 11/20/2007
Region 2
County Events Acres Loss Avoided
Region 1
County Events Acres Loss Avoided
Region 3
County Events Acres Loss AvoidedDamage Damage
State of Ohio Enhanced Hazard Mitigation Plan Rev. January 2011
Section 2: HIRA 189
VULNERABILITY ANALYSIS & LOSS ESTIMATION OF STATE-OWNED / CRITICAL FACILITIES
State-owned structures and property within areas of high and very high wildfire hazard are obviously more at risk to damage by wildfire than those in urban or low risk areas (Map 2.7.c).
High valued state-owned property has been damaged in the past by wildfire. Thousands of acres of merchantable timber and tree plantations have been lost or damaged by wildfire. In February 2002, a wildfire in Crown City Wildlife Area, Gallia County, burned approximately 709 acres through a hardwood plantation reclamation project. Damages were estimated at nearly $100,000. Machinery, such as bulldozers and trucks, belonging to state agencies are occasionally damaged while suppressing wildfires.
Exposure to wildfire, regardless of size, creates an inherently hazardous situation. In 1989, a state employee lost their life while battling a wildfire in southern Ohio, and a second person was severely burned. Local firefighters have incurred numerous injuries, both severe and minor, while en route to and during suppression of wildfire in Ohio.
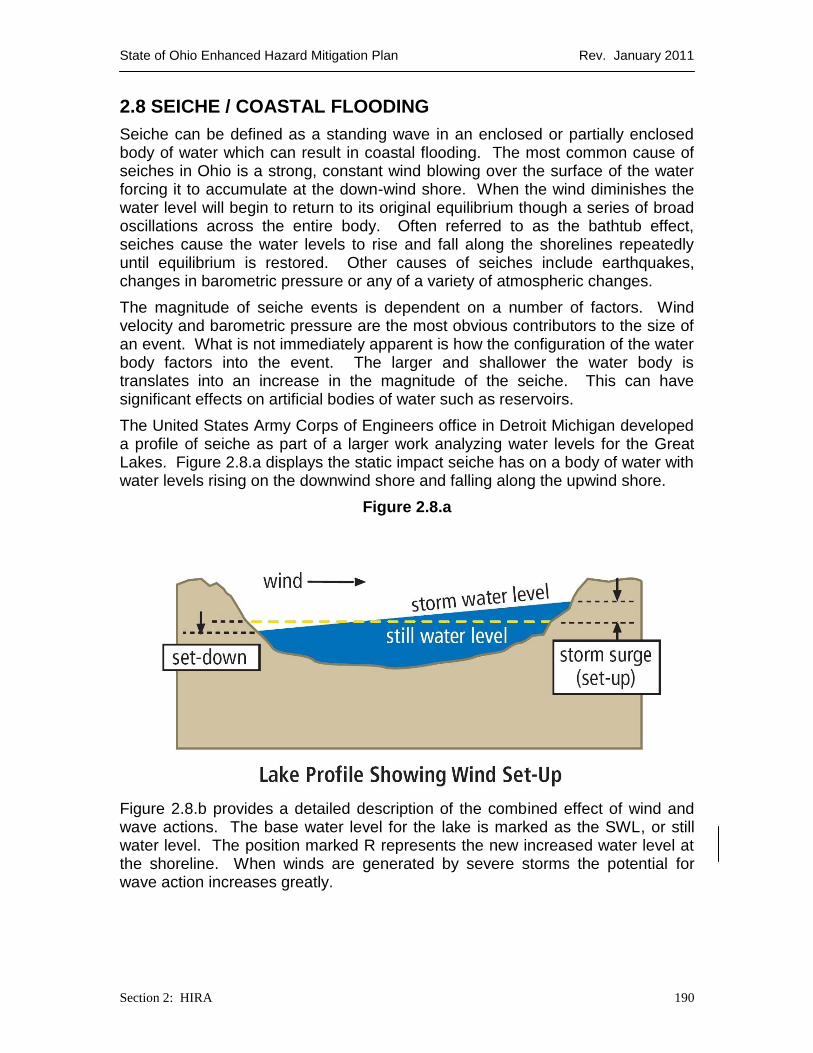
State of Ohio Enhanced Hazard Mitigation Plan Rev. January 2011
Section 2: HIRA 190
2.8 SEICHE / COASTAL FLOODING
Seiche can be defined as a standing wave in an enclosed or partially enclosed body of water which can result in coastal flooding. The most common cause of seiches in Ohio is a strong, constant wind blowing over the surface of the water forcing it to accumulate at the down-wind shore. When the wind diminishes the water level will begin to return to its original equilibrium though a series of broad oscillations across the entire body. Often referred to as the bathtub effect, seiches cause the water levels to rise and fall along the shorelines repeatedly until equilibrium is restored. Other causes of seiches include earthquakes, changes in barometric pressure or any of a variety of atmospheric changes.
The magnitude of seiche events is dependent on a number of factors. Wind velocity and barometric pressure are the most obvious contributors to the size of an event. What is not immediately apparent is how the configuration of the water body factors into the event. The larger and shallower the water body is translates into an increase in the magnitude of the seiche. This can have significant effects on artificial bodies of water such as reservoirs.
The United States Army Corps of Engineers office in Detroit Michigan developed a profile of seiche as part of a larger work analyzing water levels for the Great Lakes. Figure 2.8.a displays the static impact seiche has on a body of water with water levels rising on the downwind shore and falling along the upwind shore.
Figure 2.8.a
Figure 2.8.b provides a detailed description of the combined effect of wind and wave actions. The base water level for the lake is marked as the SWL, or still water level. The position marked R represents the new increased water level at the shoreline. When winds are generated by severe storms the potential for wave action increases greatly.
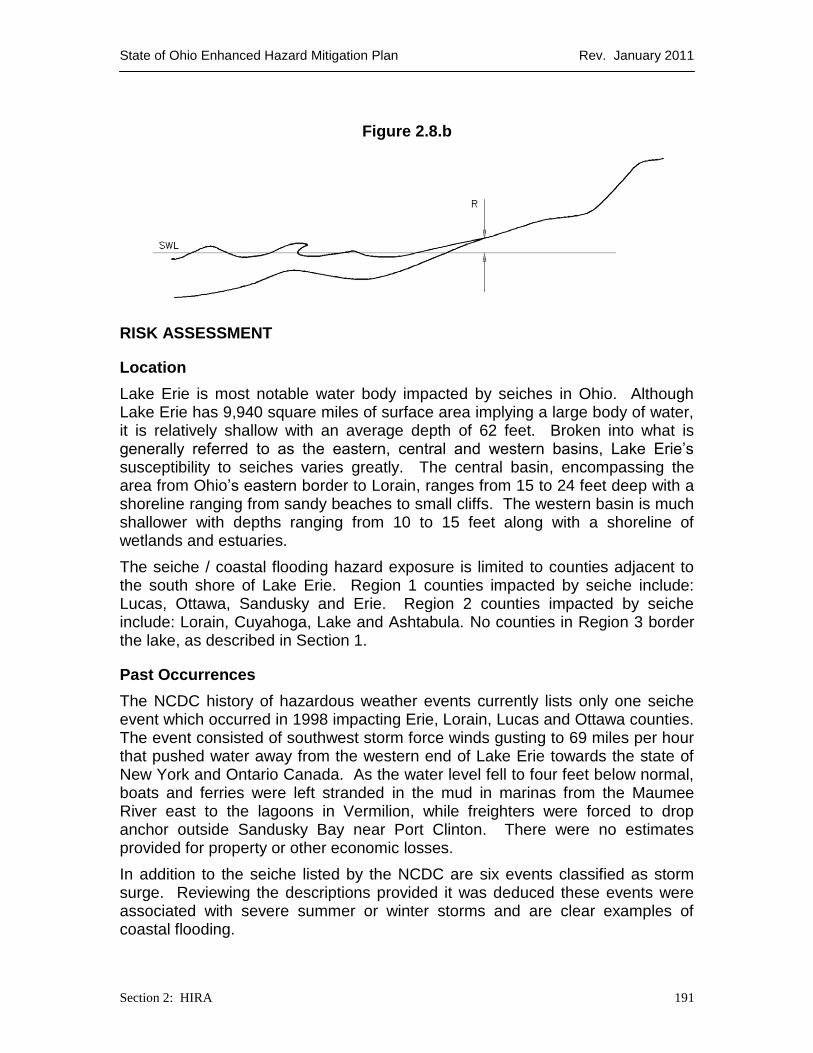
State of Ohio Enhanced Hazard Mitigation Plan Rev. January 2011
Section 2: HIRA 191
Figure 2.8.b
RISK ASSESSMENT
Location
Lake Erie is most notable water body impacted by seiches in Ohio. Although Lake Erie has 9,940 square miles of surface area implying a large body of water, it is relatively shallow with an average depth of 62 feet. Broken into what is generally referred to as the eastern, central and western basins, Lake Erie’s susceptibility to seiches varies greatly. The central basin, encompassing the area from Ohio’s eastern border to Lorain, ranges from 15 to 24 feet deep with a shoreline ranging from sandy beaches to small cliffs. The western basin is much shallower with depths ranging from 10 to 15 feet along with a shoreline of wetlands and estuaries.
The seiche / coastal flooding hazard exposure is limited to counties adjacent to the south shore of Lake Erie. Region 1 counties impacted by seiche include: Lucas, Ottawa, Sandusky and Erie. Region 2 counties impacted by seiche include: Lorain, Cuyahoga, Lake and Ashtabula. No counties in Region 3 border the lake, as described in Section 1.
Past Occurrences
The NCDC history of hazardous weather events currently lists only one seiche event which occurred in 1998 impacting Erie, Lorain, Lucas and Ottawa counties. The event consisted of southwest storm force winds gusting to 69 miles per hour that pushed water away from the western end of Lake Erie towards the state of New York and Ontario Canada. As the water level fell to four feet below normal, boats and ferries were left stranded in the mud in marinas from the Maumee River east to the lagoons in Vermilion, while freighters were forced to drop anchor outside Sandusky Bay near Port Clinton. There were no estimates provided for property or other economic losses.
In addition to the seiche listed by the NCDC are six events classified as storm surge. Reviewing the descriptions provided it was deduced these events were associated with severe summer or winter storms and are clear examples of coastal flooding.
State of Ohio Enhanced Hazard Mitigation Plan Rev. January 2011
Section 2: HIRA 192
March 13, 1997 Storm Surge - Gale force east winds to 35 knots caused the water level at the west end of Lake Erie to rise to 79 inches above low water datum, around 35 inches above the recent average lake level. Flooding and considerable beach erosion occurred along the lakeshores of Lucas, Ottawa, Sandusky and Erie Counties. In Toledo (Lucas County), roads and a parking lot were inundated, including Monroe and Second Streets, and at Point Place on Maumee Bay. Water also overtopped a road in Jerusalem Township. In Ottawa County, roads were flooded in Port Clinton and sandbagging was performed at some local businesses. Also, on Catawba Island, waves were recorded as overtopping at least one road. At Bayview (Sandusky County), County Road 259 was flooded. Losses approached $50,000 from this coastal event.
June 1, 1997 Storm Surge - Businesses and homes were flooded when strong northeasterly winds and near record high lake levels produced waves of six to eight feet, aggravating shoreline erosion and slowing discharge of stream outflow into Lake Erie. In Erie County, 75 – 100 families evacuated near the Vermilion and Huron Rivers, while those on Mudbrook Road moved to their second floors to escape the flood waters. Also in Erie County, Riverside Avenue residents were evacuated as well as those in Franklin Flats, Rye Beach and White's Landing. Roads along the shoreline were flooded and covered with so much sand and debris that they had to be cleared with snow plows in Port Clinton and Marblehead. On Catawba Island, rising water flooded buildings and cars were submerged. Charter services cancelled trips and hundreds of travelers were stranded on South Bass Island when most ferry trips were also cancelled. In Erie County, the north end of Jackson Pier collapsed. As the water receded, a large number of fish were left behind in people’s yards. Losses were estimated at $525,000 from the event which encompassed Erie, Lorain, Lucas, Ottawa and Sandusky Counties.
February 4, 1998 Storm Surge - Northeast winds up to 35 miles per hour caused flooding of the immediate lakeshore and beach erosion in Lucas, Erie, and Ottawa Counties. Losses were estimated at $75,000 from the event.
February 17, 1998 Storm Surge - Northeast winds up to 40 miles per hour increased the water level at the Toledo Coast Guard Station (Lucas County) to around seven feet above low water datum. Waves of seven to ten feet caused major flooding and beach erosion along the western shoreline of Lake Erie, particularly at Crystal Rock and Whites Landing (Erie County), where homes and yards were flooded. Losses were estimated at $700,000 from the event which impacted Erie, Lucas and Ottawa Counties.
March 20, 1998 Storm Surge - North to northeast gales of 35 knots, with higher gusts, produced 11 to 14 foot waves on Lake Erie. Also, the water level at Toledo (Lucas County) was seven feet above low water datum. This combination resulted in major flooding and beach erosion. Many streets were flooded around Sandusky Bay (Ottawa, Sandusky, and Erie Counties) and Maumee Bay (Lucas County) and flooding had progressed further inland in some areas. In Sandusky and Huron (Erie County), several streets were flooded. At Beachwood Cove in Huron, the 30 foot high breakwall was destroyed and just a

State of Ohio Enhanced Hazard Mitigation Plan Rev. January 2011
Section 2: HIRA 193
few feet of land separated the homes from the lake. Losses were estimated at $400,000 from the event which impacted Sandusky, Lorain, Ottawa, Erie and Lucas counties.
November 11, 1998 Storm Surge - Northeast gales of 35 knots and water levels that peaked just below 100 inches above low water datum produced 10 to 14 foot waves which caused major damage along the lakeshore. Many lakeshore roads were not only flooded, but also covered with rocks and other debris that, in some places, had to be removed by bulldozers. In Ottawa County, ten houses were destroyed and over 200 others were damaged, streets in downtown Port Clinton were flooded and the dike system and gravel roads in the Ottawa National Wildlife Refuge were badly damaged. Some evacuations took place at Whites Landing in Erie and Sandusky Counties and also at Wightmans Grove and Memory Marina in Sandusky County. A State of Emergency was declared and standing flood water persisted for several days in some areas. Losses were estimated at $3,700,000 from the event which impacted Erie, Ottawa, Lucas and Sandusky Counties.
There are two observations which can be made reviewing the NCDC data. First, none of the events impacted Region 2 counties. This could be due to size of the area impacted by the wind or due to the type of shoreline for those counties. Second, the only seiche event noted depicts a westerly wind lowering the water level in the western basin. It can be speculated that the displaced water was moved to the eastern basin which is beyond the Ohio and Pennsylvania border. This could be an additional factor resulting in Region 2 counties have no record of seiche or storm surge impacts.
Probability of Future Events
Although the NCDC data covers only two years of events in the late 1990s, it is clear seiche and storm surge coastal flooding have a significant impact in Ohio. Based on the seven event profiles, it appears these events may occur between two and five times in a given year. The only seasonal limitation to events on Lake Erie would be during the height of winter when portions of the water surface can be covered by ice. It should be noted that ice coverage on Lake Erie varies from year to year, making it impossible to indicate any definitive time period when events cannot occur.
LHMP Data.
Cuyahoga County – Seiche. The Countywide All Natural Hazards Mitigation Plan states their northern coastline has a high frequency of seiche no matter if it caused by storms or not. This shoreline has a moderate vulnerability to seiches. The roads and highways along the coast can become flooded due to seiche waves. Most damage caused by seiches is to boat docks, low-lying areas along the lake shore and river inlets to Lake Erie. The most severe seiche that hit the Cleveland area was an eight-foot seiche in the early 1990s.
Lucas County – Coastal Flooding. The Plan states that lake surges (also referred to as storm surges) are associated with extreme weather event and are
State of Ohio Enhanced Hazard Mitigation Plan Rev. January 2011
Section 2: HIRA 194
responsible for coastal flooding and erosion (along Lake Erie within Lucas County.) The storms that generate large waves and lake surges can develop year-round, however within Lucas County, these events have typically occurred in the early spring and late fall months. Storm surges inundate coastal floodplains by dune over wash, the rise in water levels in inland bays and harbors, and backwater flooding through river mouths. Storm systems also generate large waves that run up and flood coastal beaches. The problem of lake surges and associated inland flooding is compounded by adjacent low-lying floodplains. The Plan’s history provides information that lake surges cause coastal flooding in the cities of Toledo, Oregon, the Village of Harbor View and the unincorporated Jerusalem Township. The total damages attributed to lake surges are $665,981.92, which equates to approximately $110,996.99 per event. There are limited data to calculate the probability of occurrence; however, records indicate multiple occurrences during the early spring and late fall months. It is fair to assume that future events would likely result in localized property damage to only specific areas within Lucas County, and that there is only a small potential for future events to result in injuries or deaths.
VULNERABILITY ANALYSIS & LOSS ESTIMATION
Methodology
Loss estimates for Ohio’s seiche hazard were developed using FEMA’s hazard analysis and loss estimation software HAZUS-MH MR3 coastal flooding application within the flood module. This application was updated in HAZUS-MH MR3 to reflect the unique issues associated with the Great Lakes. Still pool lake water elevations for each county were taken the US Army Corps of Engineers report Revised Report on Great Lakes Open-Coast Flood Levels published April 1988.
HAZUS-MH MR3 analysis was run for each county bordering Lake Erie based on a 100-year return event. Each run was specifically adjusted to take into consideration the type of shoreline associated with each county. Sandusky County could not be analyzed due to the software failing to recognize any coastal exposure. Upon closer review, the exposure which does exist within the county was assessed as part of the two neighboring county evaluations.
Results
Region 1 exposure to seiche is limited to the coastal counties of Erie, Lucas, Ottawa and Sandusky. The total building exposure is estimated at $8,743,489,700. The numbers of impacted structures by percent of the structure damaged are estimated to be: 1 to 10 percent damaged at 455, 11 to 20 percent damaged at 2,184, 21 to 30 percent damaged at 1,476, 31 to 40 percent damaged at 1,059, 41 to 50 percent damaged at 309 and substantially damaged at 914. There are an estimated 4 essential facilities, which will experience at
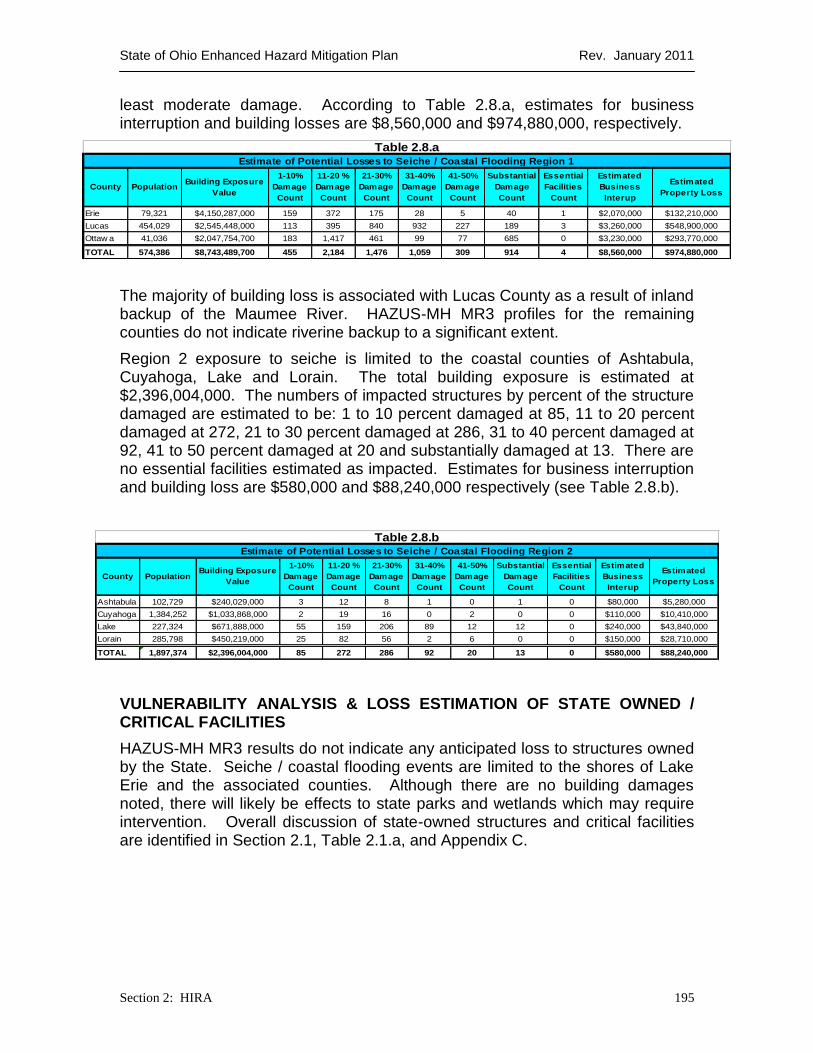
State of Ohio Enhanced Hazard Mitigation Plan Rev. January 2011
Section 2: HIRA 195
least moderate damage. According to Table 2.8.a, estimates for business interruption and building losses are $8,560,000 and $974,880,000, respectively.
The majority of building loss is associated with Lucas County as a result of inland backup of the Maumee River. HAZUS-MH MR3 profiles for the remaining counties do not indicate riverine backup to a significant extent.
Region 2 exposure to seiche is limited to the coastal counties of Ashtabula, Cuyahoga, Lake and Lorain. The total building exposure is estimated at $2,396,004,000. The numbers of impacted structures by percent of the structure damaged are estimated to be: 1 to 10 percent damaged at 85, 11 to 20 percent damaged at 272, 21 to 30 percent damaged at 286, 31 to 40 percent damaged at 92, 41 to 50 percent damaged at 20 and substantially damaged at 13. There are no essential facilities estimated as impacted. Estimates for business interruption and building loss are $580,000 and $88,240,000 respectively (see Table 2.8.b).
VULNERABILITY ANALYSIS & LOSS ESTIMATION OF STATE OWNED / CRITICAL FACILITIES
HAZUS-MH MR3 results do not indicate any anticipated loss to structures owned by the State. Seiche / coastal flooding events are limited to the shores of Lake Erie and the associated counties. Although there are no building damages noted, there will likely be effects to state parks and wetlands which may require intervention. Overall discussion of state-owned structures and critical facilities are identified in Section 2.1, Table 2.1.a, and Appendix C.
Erie 79,321 $4,150,287,000 159 372 175 28 5 40 1 $2,070,000 $132,210,000
Lucas 454,029 $2,545,448,000 113 395 840 932 227 189 3 $3,260,000 $548,900,000
Ottaw a 41,036 $2,047,754,700 183 1,417 461 99 77 685 0 $3,230,000 $293,770,000
TOTAL 574,386 $8,743,489,700 455 2,184 1,476 1,059 309 914 4 $8,560,000 $974,880,000
31-40%
Damage
Count
41-50%
Damage
Count
County PopulationBuilding Exposure
Value
1-10%
Damage
Count
Table 2.8.aEstimate of Potential Losses to Seiche / Coastal Flooding Region 1
Substantial
Damage
Count
Essential
Facilities
Count
Estimated
Business
Interup
Estimated
Property Loss
11-20 %
Damage
Count
21-30%
Damage
Count
Ashtabula 102,729 $240,029,000 3 12 8 1 0 1 0 $80,000 $5,280,000
Cuyahoga 1,384,252 $1,033,868,000 2 19 16 0 2 0 0 $110,000 $10,410,000
Lake 227,324 $671,888,000 55 159 206 89 12 12 0 $240,000 $43,840,000
Lorain 285,798 $450,219,000 25 82 56 2 6 0 0 $150,000 $28,710,000
TOTAL 1,897,374 $2,396,004,000 85 272 286 92 20 13 0 $580,000 $88,240,000
Table 2.8.bEstimate of Potential Losses to Seiche / Coastal Flooding Region 2
11-20 %
Damage
Count
21-30%
Damage
Count
31-40%
Damage
Count
41-50%
Damage
Count
County PopulationBuilding Exposure
Value
1-10%
Damage
Count
Substantial
Damage
Count
Essential
Facilities
Count
Estimated
Business
Interup
Estimated
Property Loss

State of Ohio Enhanced Hazard Mitigation Plan Rev. January 2011
Section 2: HIRA 196
2.9 EARTHQUAKE
Earthquakes occur as a result of the constant motion of the earth. Current science describes the earth in three major regions: the core, mantle and crust. Figure 2.9.a provides a three dimensional representation of the earth’s regions.
The core is hot and consists of two subsections. The very center of the planet’s core is hottest and solid. Surrounding the solid center is a liquid (i.e. molten material / magma) layer.
The mantle is cooler than the core and although solid, circulates with the consistency of malleable plastic. Through convection, the portion of the mantle closest to the core heats and subsequently rises in the same manner as the air in the earth’s atmosphere. Conversely, the upper portion of the mantle transfers its heat to the crust, cools and descends back toward the core.
The crust is also solid; however, unlike the mantle it is rigid and brittle. The crust consists of a number of individual plates, each in constant motion, resting on the mantle. The boundaries where plates meet are the locations where new crust develops (spreading boundary) and alternately existing crust material returns to the mantle (convergent boundary.)
Understanding the composition of the earth is crucial because earthquakes are often associated with boundaries where the plates slide against, rise over or sink under each other. The movement at many of the plate boundaries is not smooth and consistent, but rather grinds and jerks. As entire plates move the boundaries become locked together and enormous amounts of tension build until a sudden release occurs, realigning the plate edges and creating the observed earthquake.
The locations where the crust is fractured and sliding are called faults. California has several famous faults (e.g. the San Andreas Fault), which can be clearly observed though aerial photography. In cases where the crust is pulling apart, the location is called a rift. The Reelfoot Rift and associated rift valley located in Missouri is one of the largest in North America. Ohio geologically contains both fault and rift zones.
Figure 2.9.a
Source: Educational Leaflet No. 9 Revised Edition 2007 Division of Geological Survey
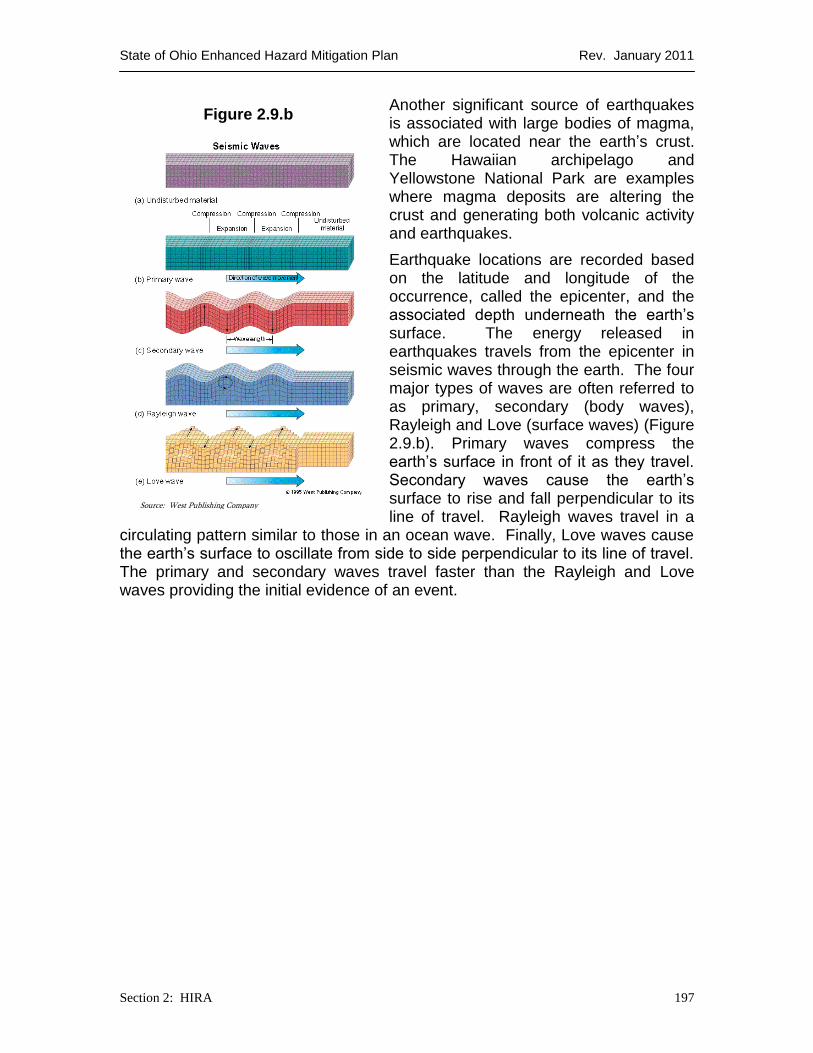
State of Ohio Enhanced Hazard Mitigation Plan Rev. January 2011
Section 2: HIRA 197
Another significant source of earthquakes is associated with large bodies of magma, which are located near the earth’s crust. The Hawaiian archipelago and Yellowstone National Park are examples where magma deposits are altering the crust and generating both volcanic activity and earthquakes.
Earthquake locations are recorded based on the latitude and longitude of the occurrence, called the epicenter, and the associated depth underneath the earth’s surface. The energy released in earthquakes travels from the epicenter in seismic waves through the earth. The four major types of waves are often referred to as primary, secondary (body waves), Rayleigh and Love (surface waves) (Figure 2.9.b). Primary waves compress the earth’s surface in front of it as they travel. Secondary waves cause the earth’s surface to rise and fall perpendicular to its line of travel. Rayleigh waves travel in a
circulating pattern similar to those in an ocean wave. Finally, Love waves cause the earth’s surface to oscillate from side to side perpendicular to its line of travel. The primary and secondary waves travel faster than the Rayleigh and Love waves providing the initial evidence of an event.
Source: West Publishing Company
Figure 2.9.b
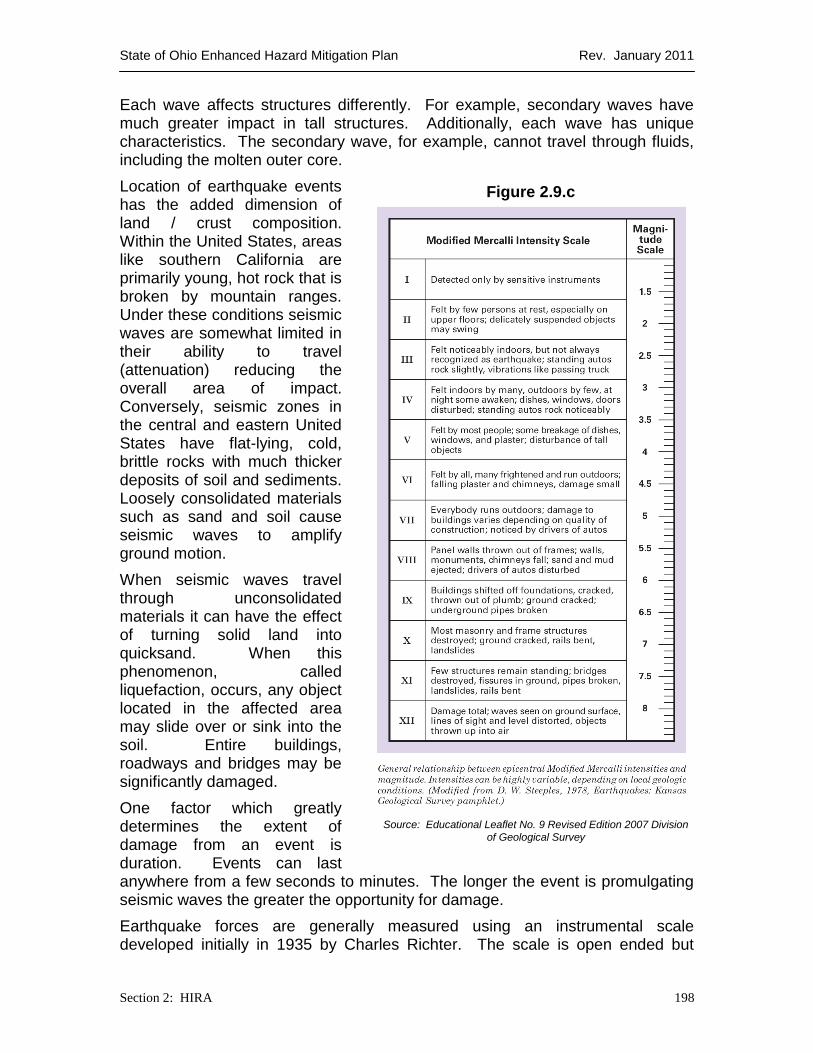
State of Ohio Enhanced Hazard Mitigation Plan Rev. January 2011
Section 2: HIRA 198
Each wave affects structures differently. For example, secondary waves have much greater impact in tall structures. Additionally, each wave has unique characteristics. The secondary wave, for example, cannot travel through fluids, including the molten outer core.
Location of earthquake events has the added dimension of land / crust composition. Within the United States, areas like southern California are primarily young, hot rock that is broken by mountain ranges. Under these conditions seismic waves are somewhat limited in their ability to travel (attenuation) reducing the overall area of impact. Conversely, seismic zones in the central and eastern United States have flat-lying, cold, brittle rocks with much thicker deposits of soil and sediments. Loosely consolidated materials such as sand and soil cause seismic waves to amplify ground motion.
When seismic waves travel through unconsolidated materials it can have the effect of turning solid land into quicksand. When this phenomenon, called liquefaction, occurs, any object located in the affected area may slide over or sink into the soil. Entire buildings, roadways and bridges may be significantly damaged.
One factor which greatly determines the extent of damage from an event is duration. Events can last anywhere from a few seconds to minutes. The longer the event is promulgating seismic waves the greater the opportunity for damage.
Earthquake forces are generally measured using an instrumental scale developed initially in 1935 by Charles Richter. The scale is open ended but
Source: Educational Leaflet No. 9 Revised Edition 2007 Division
of Geological Survey
Figure 2.9.c

State of Ohio Enhanced Hazard Mitigation Plan Rev. January 2011
Section 2: HIRA 199
Source: Educational Leaflet No. 9 Revised Edition 2007. ODNR - Division of
Geological Survey
Map 2.9.a
generally ranges to 9+ (severe damage and ground deformation). The scale is logarithmic which can be confusing. For example, an earthquake of magnitude 2.0 is 30 times more powerful, in terms of energy released, than one rated 1.0.
Another method of measuring an earthquake event is by describing its intensity. Italian volcanologist Giuseppi Mercalli developed a widely used scale in 1902 based on the previous Rossi-Forel scale. Over time experts have altered the original scale creating the currently used version named the Modified Mercalli Intensity Scale (MMI).
Looking at Figure 2.9.c the exponential increases in damage for each single digit increase in the intensity scale is apparent. For example, MMI IX discusses
shifted and damaged building while X describes mass destruction of masonry (brick) and frame (wood) buildings.
RISK ASSESSMENT
Location
Earthquakes in Ohio are primarily located the northeast and far west-central portions of the state and historically have not exceed 5.4 magnitude (Map 2.9.a). The map of historical epicenters lists all the events with magnitudes greater than 2.0. The size of the location marker increases with the magnitude of the event. Red circles represent instrumentally recorded events. Blue circles represent non-instrument recorded.
The epicenter map clearly identifies the northeast Ohio counties of Ashtabula, Geauga and Lake in Region 1 as one of
the most earthquake-prone areas. Similarly, another earthquake-prone area is located in the west-central Counties of Auglaize, Champaign, Logan, Mercer, and
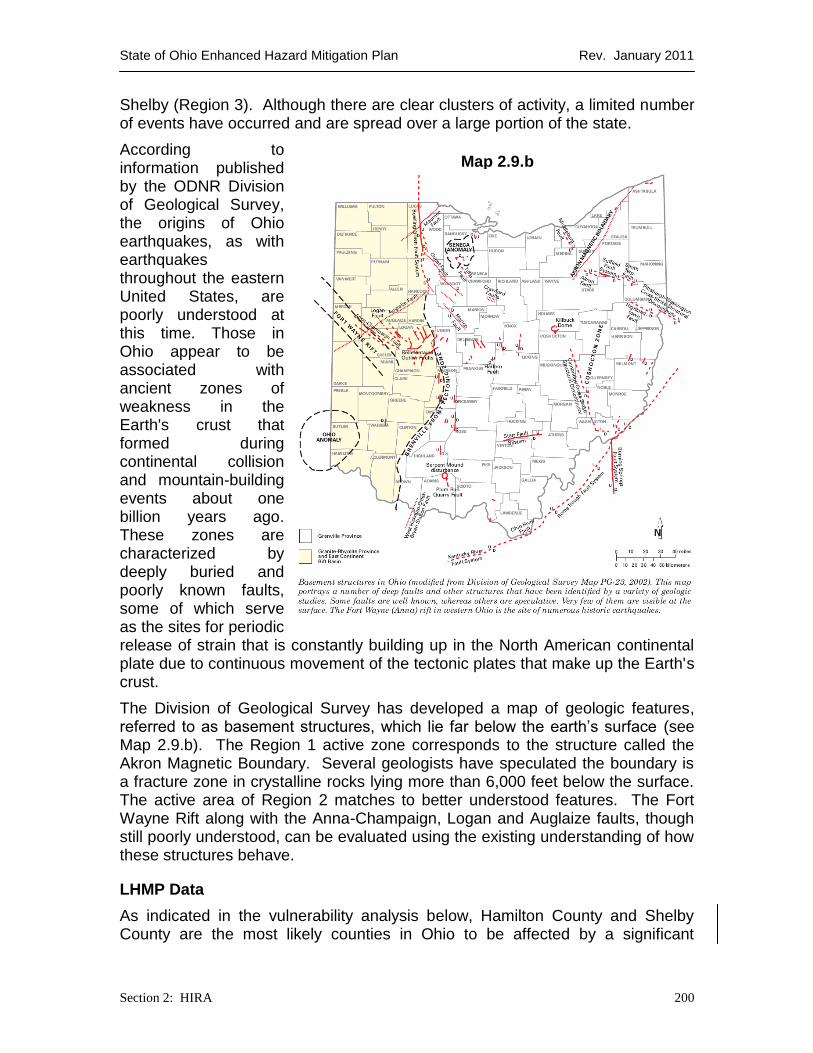
State of Ohio Enhanced Hazard Mitigation Plan Rev. January 2011
Section 2: HIRA 200
Map 2.9.b
Shelby (Region 3). Although there are clear clusters of activity, a limited number of events have occurred and are spread over a large portion of the state.
According to information published by the ODNR Division of Geological Survey, the origins of Ohio earthquakes, as with earthquakes throughout the eastern United States, are poorly understood at this time. Those in Ohio appear to be associated with ancient zones of weakness in the Earth's crust that formed during continental collision and mountain-building events about one billion years ago. These zones are characterized by deeply buried and poorly known faults, some of which serve as the sites for periodic release of strain that is constantly building up in the North American continental plate due to continuous movement of the tectonic plates that make up the Earth's crust.
The Division of Geological Survey has developed a map of geologic features, referred to as basement structures, which lie far below the earth’s surface (see Map 2.9.b). The Region 1 active zone corresponds to the structure called the Akron Magnetic Boundary. Several geologists have speculated the boundary is a fracture zone in crystalline rocks lying more than 6,000 feet below the surface. The active area of Region 2 matches to better understood features. The Fort Wayne Rift along with the Anna-Champaign, Logan and Auglaize faults, though still poorly understood, can be evaluated using the existing understanding of how these structures behave.
LHMP Data
As indicated in the vulnerability analysis below, Hamilton County and Shelby County are the most likely counties in Ohio to be affected by a significant
State of Ohio Enhanced Hazard Mitigation Plan Rev. January 2011
Section 2: HIRA 201
earthquake (Hamilton County’s issues are compounded by the county’s susceptibility to landslide and soil liquefaction). Both the Hamilton County and the Shelby County LHMP considers earthquakes, ranked fifth and sixth, respectively, to be a high ranking hazard for them. They acknowledge that an earthquake is a low probability, high consequence event. The lack of public awareness, building standards, and aging infrastructure were the reasons cited by Hamilton County for ranking earthquakes within their top five concerns. Shelby County, considered to be one of the most active seismic zones within the state, experiencing more than 40 since 1875, ranked earthquakes sixth based on its history of earthquakes, which includes the most damaging earthquake to strike the state.
National Level Exercise, 2011 (NLE-11)
In September 2010, Ohio EMA’s Mitigation Section was consulted to provide HAZUS runs for an earthquake tabletop exercise scenario. The scenario was designed for selected counties in southwest Ohio in preparation for NLE-11 (National Level Exercise 2011). The purpose is to test critical resource logistics and catastrophic planning in conjunction with FEMA Region V and participating States. HAZUS runs were produced for Hamilton, Butler, Clermont, Darke, Scioto and Warren Counties with a 5.7 moment magnitude scale epicenter in downtown Cincinnati to a depth of 10 kilometers. The aggregate HAZUS runs resulted in 79,070 buildings with moderate damage and 4,418 buildings beyond repair. 487 essential facilities would be less than 50% functional. 1,468 transportation systems and 201 utility systems would be damaged. Destruction is projected to produce 3.513 million tons of debris and 93 fire ignitions resulting 13,490 people displaced from their residences with $1,248,000,000 in damage. The social impact estimates 179 fatalities, 123 people with life-threatening injuries, 901 people would have to be hospitalized and 3,871 would have to be treated with first aid or at an aid station. 8,806 people would seek temporary shelter. The economic impact is projected to result in $10,828,490,000 in lost income and, $2,050,500,000 in capital stock loss. It is estimated to take 15 years for economic recovery from this event.
Past Occurrences
Earthquakes are a continuously occurring hazard in Ohio. Eleven events were recorded by the Division of Geological Survey for the first 11 months of 2007. Data are available for events dating back over 200 years.
Most of Ohio’s earthquake events are small, registering between 2 and 4 magnitudes. Significant events are discussed in Geological Survey document Educational Leaflet No. 9, which follows.
Summer 1776: The earliest Ohio earthquake to be noted occurred at 8 a.m. sometime in the summer of 1776 and was chronicled by John Heckewelder, a Moravian missionary, who reported that ―the southwest side of the house was raised with such violence that the furniture of the room was nearly overturned.‖
State of Ohio Enhanced Hazard Mitigation Plan Rev. January 2011
Section 2: HIRA 202
Heckewelder spent the summer of 1776 at the Moravian mission of Lichtenau, which was in present-day Coshocton County. Because his report is the only account of this event, it is impossible to determine an epicentral location with any certainty. It should be noted the epicenter of this earthquake may not have been in Ohio.
1811 and 1812: On December 16, 1811, and January 23 and February 7, 1812, the largest earthquakes ever to strike the continental United States occurred at New Madrid, Missouri. These events were felt throughout an area of about 2 million square miles, including all of Ohio. In Ohio, some chimneys were toppled in the Cincinnati area, which experienced the strongest shaking from these events. Should earthquakes of this intensity be repeated at New Madrid, they would probably cause considerable damage in southwestern Ohio.
June 18, 1875: This earthquake was felt throughout an area of at least 40,000 square miles and was most intense at Sidney (Shelby County) and Urbana (Champaign County), where masonry walls were cracked and chimneys toppled. It has been interpreted to have had an MMI of VII.
September 19, 1884: An earthquake in the vicinity of Lima (Allen County) had an epicentral MMI of VI. There were reports of fallen ceiling plaster as far away as Zanesville (Muskingum County) and Parkersburg, West Virginia. On the basis of area feeling the earthquake (140,000 square miles), it is estimated to have had a magnitude of 4.8. Workmen on top of the Washington Monument in Washington, D.C., reported feeling this earthquake.
May 17, 1901: During this earthquake, bricks were dislodged from chimneys and some windows were cracked in Portsmouth (Scioto County) and chimneys were damaged in Sciotoville. Modified Mercalli intensities of VI were generated in the epicentral area. Based on felt area, this earthquake was assigned a magnitude of 4.3.
November 5, 1926: This earthquake was centered near Pomeroy and Keno, in Meigs County, where chimneys were toppled. A stove was over turned at Chester. Modified Mercalli intensities of VII were generated in the epicentral area, but the earthquake was felt only in portions of Meigs County and adjacent parts of West Virginia. On the basis of this small felt area, this event has been assigned a magnitude of 3.6. Explosive earth sounds were reported to have accompanied this earthquake.
September 30, 1930: This earthquake cracked plaster and toppled a chimney in Anna (Shelby County). An epicentral MMI of VII and a magnitude of 4.2 have been assigned to this event.
September 20, 1931: In this event, Anna and Sidney in Shelby County experienced toppled chimneys and cracked plaster. Store merchandise and crockery were knocked off shelves, and stones were jarred loose from the foundation of the Lutheran church in Anna. A ceiling collapsed in a school at Botkins, north of Anna. An MMI of VII and a magnitude of 4.7 have been assigned to this earthquake.
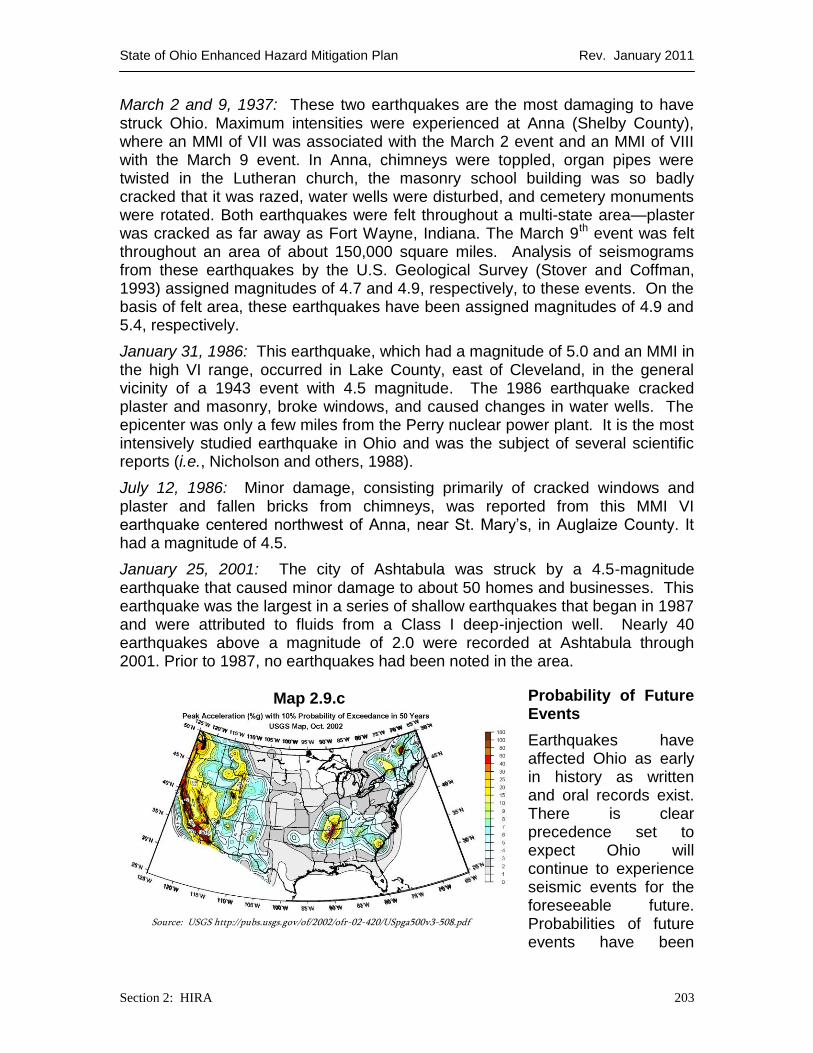
State of Ohio Enhanced Hazard Mitigation Plan Rev. January 2011
Section 2: HIRA 203
March 2 and 9, 1937: These two earthquakes are the most damaging to have struck Ohio. Maximum intensities were experienced at Anna (Shelby County), where an MMI of VII was associated with the March 2 event and an MMI of VIII with the March 9 event. In Anna, chimneys were toppled, organ pipes were twisted in the Lutheran church, the masonry school building was so badly cracked that it was razed, water wells were disturbed, and cemetery monuments were rotated. Both earthquakes were felt throughout a multi-state area—plaster was cracked as far away as Fort Wayne, Indiana. The March 9th event was felt throughout an area of about 150,000 square miles. Analysis of seismograms from these earthquakes by the U.S. Geological Survey (Stover and Coffman, 1993) assigned magnitudes of 4.7 and 4.9, respectively, to these events. On the basis of felt area, these earthquakes have been assigned magnitudes of 4.9 and 5.4, respectively.
January 31, 1986: This earthquake, which had a magnitude of 5.0 and an MMI in the high VI range, occurred in Lake County, east of Cleveland, in the general vicinity of a 1943 event with 4.5 magnitude. The 1986 earthquake cracked plaster and masonry, broke windows, and caused changes in water wells. The epicenter was only a few miles from the Perry nuclear power plant. It is the most intensively studied earthquake in Ohio and was the subject of several scientific reports (i.e., Nicholson and others, 1988).
July 12, 1986: Minor damage, consisting primarily of cracked windows and plaster and fallen bricks from chimneys, was reported from this MMI VI earthquake centered northwest of Anna, near St. Mary’s, in Auglaize County. It had a magnitude of 4.5.
January 25, 2001: The city of Ashtabula was struck by a 4.5-magnitude earthquake that caused minor damage to about 50 homes and businesses. This earthquake was the largest in a series of shallow earthquakes that began in 1987 and were attributed to fluids from a Class I deep-injection well. Nearly 40 earthquakes above a magnitude of 2.0 were recorded at Ashtabula through 2001. Prior to 1987, no earthquakes had been noted in the area.
Probability of Future Events
Earthquakes have affected Ohio as early in history as written and oral records exist. There is clear precedence set to expect Ohio will continue to experience seismic events for the foreseeable future. Probabilities of future events have been
Source: USGS http://pubs.usgs.gov/of/2002/ofr-02-420/USpga500v3-508.pdfSource: USGS http://pubs.usgs.gov/of/2002/ofr-02-420/USpga500v3-508.pdf
Map 2.9.c
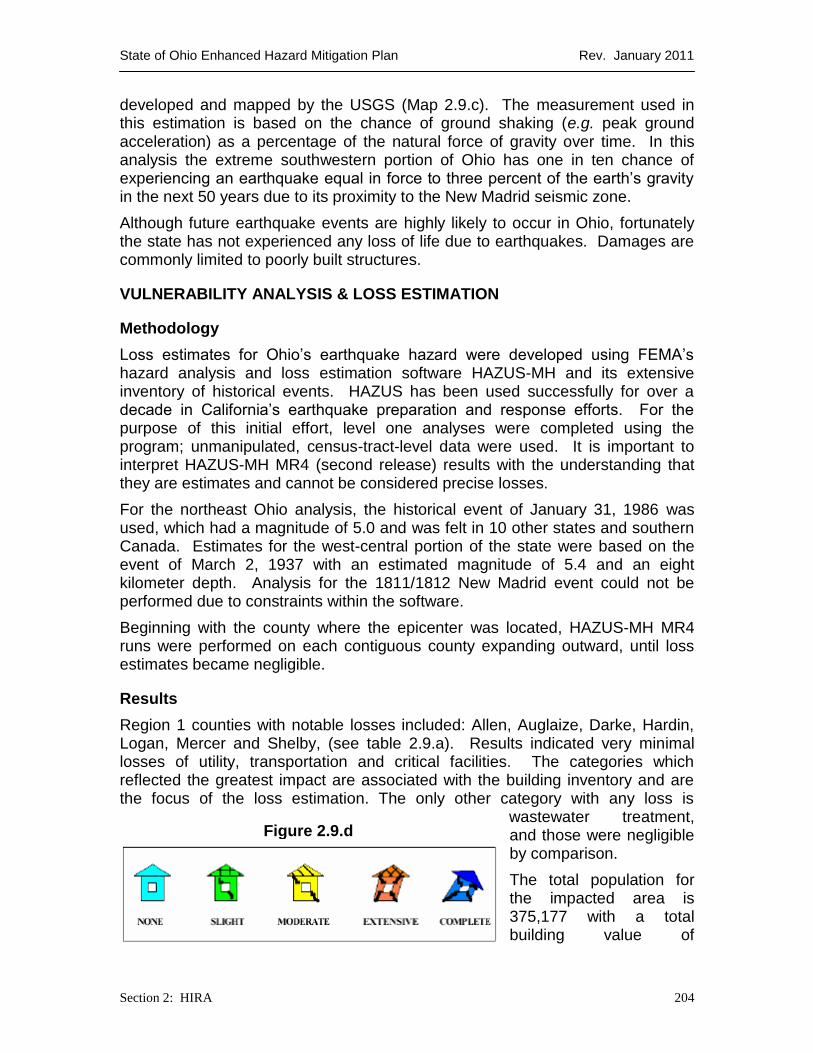
State of Ohio Enhanced Hazard Mitigation Plan Rev. January 2011
Section 2: HIRA 204
developed and mapped by the USGS (Map 2.9.c). The measurement used in this estimation is based on the chance of ground shaking (e.g. peak ground acceleration) as a percentage of the natural force of gravity over time. In this analysis the extreme southwestern portion of Ohio has one in ten chance of experiencing an earthquake equal in force to three percent of the earth’s gravity in the next 50 years due to its proximity to the New Madrid seismic zone.
Although future earthquake events are highly likely to occur in Ohio, fortunately the state has not experienced any loss of life due to earthquakes. Damages are commonly limited to poorly built structures.
VULNERABILITY ANALYSIS & LOSS ESTIMATION
Methodology
Loss estimates for Ohio’s earthquake hazard were developed using FEMA’s hazard analysis and loss estimation software HAZUS-MH and its extensive inventory of historical events. HAZUS has been used successfully for over a decade in California’s earthquake preparation and response efforts. For the purpose of this initial effort, level one analyses were completed using the program; unmanipulated, census-tract-level data were used. It is important to interpret HAZUS-MH MR4 (second release) results with the understanding that they are estimates and cannot be considered precise losses.
For the northeast Ohio analysis, the historical event of January 31, 1986 was used, which had a magnitude of 5.0 and was felt in 10 other states and southern Canada. Estimates for the west-central portion of the state were based on the event of March 2, 1937 with an estimated magnitude of 5.4 and an eight kilometer depth. Analysis for the 1811/1812 New Madrid event could not be performed due to constraints within the software.
Beginning with the county where the epicenter was located, HAZUS-MH MR4 runs were performed on each contiguous county expanding outward, until loss estimates became negligible.
Results
Region 1 counties with notable losses included: Allen, Auglaize, Darke, Hardin, Logan, Mercer and Shelby, (see table 2.9.a). Results indicated very minimal losses of utility, transportation and critical facilities. The categories which reflected the greatest impact are associated with the building inventory and are the focus of the loss estimation. The only other category with any loss is
wastewater treatment, and those were negligible by comparison.
The total population for the impacted area is 375,177 with a total building value of
Figure 2.9.d
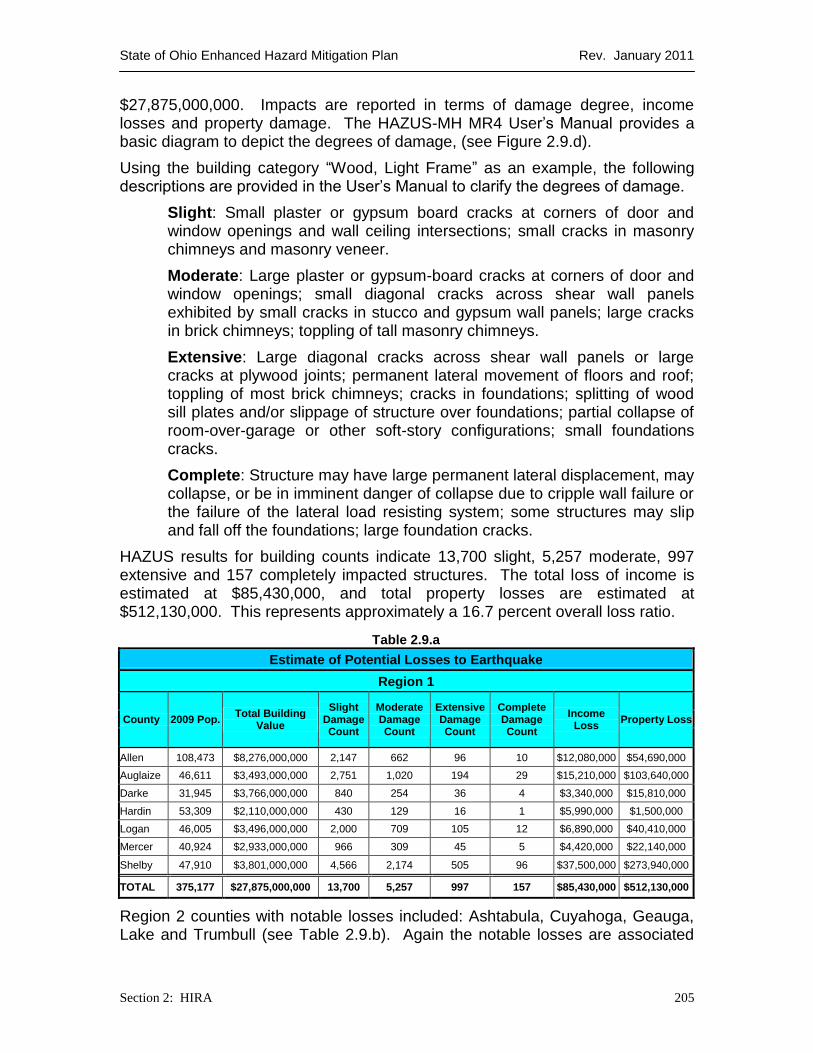
State of Ohio Enhanced Hazard Mitigation Plan Rev. January 2011
Section 2: HIRA 205
$27,875,000,000. Impacts are reported in terms of damage degree, income losses and property damage. The HAZUS-MH MR4 User’s Manual provides a basic diagram to depict the degrees of damage, (see Figure 2.9.d).
Using the building category ―Wood, Light Frame‖ as an example, the following descriptions are provided in the User’s Manual to clarify the degrees of damage.
Slight: Small plaster or gypsum board cracks at corners of door and window openings and wall ceiling intersections; small cracks in masonry chimneys and masonry veneer.
Moderate: Large plaster or gypsum-board cracks at corners of door and window openings; small diagonal cracks across shear wall panels exhibited by small cracks in stucco and gypsum wall panels; large cracks in brick chimneys; toppling of tall masonry chimneys.
Extensive: Large diagonal cracks across shear wall panels or large cracks at plywood joints; permanent lateral movement of floors and roof; toppling of most brick chimneys; cracks in foundations; splitting of wood sill plates and/or slippage of structure over foundations; partial collapse of room-over-garage or other soft-story configurations; small foundations cracks.
Complete: Structure may have large permanent lateral displacement, may collapse, or be in imminent danger of collapse due to cripple wall failure or the failure of the lateral load resisting system; some structures may slip and fall off the foundations; large foundation cracks.
HAZUS results for building counts indicate 13,700 slight, 5,257 moderate, 997 extensive and 157 completely impacted structures. The total loss of income is estimated at $85,430,000, and total property losses are estimated at $512,130,000. This represents approximately a 16.7 percent overall loss ratio.
Table 2.9.a
Estimate of Potential Losses to Earthquake
Region 1
County 2009 Pop. Total Building
Value
Slight Damage Count
Moderate Damage Count
Extensive Damage Count
Complete Damage Count
Income Loss
Property Loss
Allen 108,473 $8,276,000,000 2,147 662 96 10 $12,080,000 $54,690,000
Auglaize 46,611 $3,493,000,000 2,751 1,020 194 29 $15,210,000 $103,640,000
Darke 31,945 $3,766,000,000 840 254 36 4 $3,340,000 $15,810,000
Hardin 53,309 $2,110,000,000 430 129 16 1 $5,990,000 $1,500,000
Logan 46,005 $3,496,000,000 2,000 709 105 12 $6,890,000 $40,410,000
Mercer 40,924 $2,933,000,000 966 309 45 5 $4,420,000 $22,140,000
Shelby 47,910 $3,801,000,000 4,566 2,174 505 96 $37,500,000 $273,940,000
TOTAL 375,177 $27,875,000,000 13,700 5,257 997 157 $85,430,000 $512,130,000
Region 2 counties with notable losses included: Ashtabula, Cuyahoga, Geauga, Lake and Trumbull (see Table 2.9.b). Again the notable losses are associated
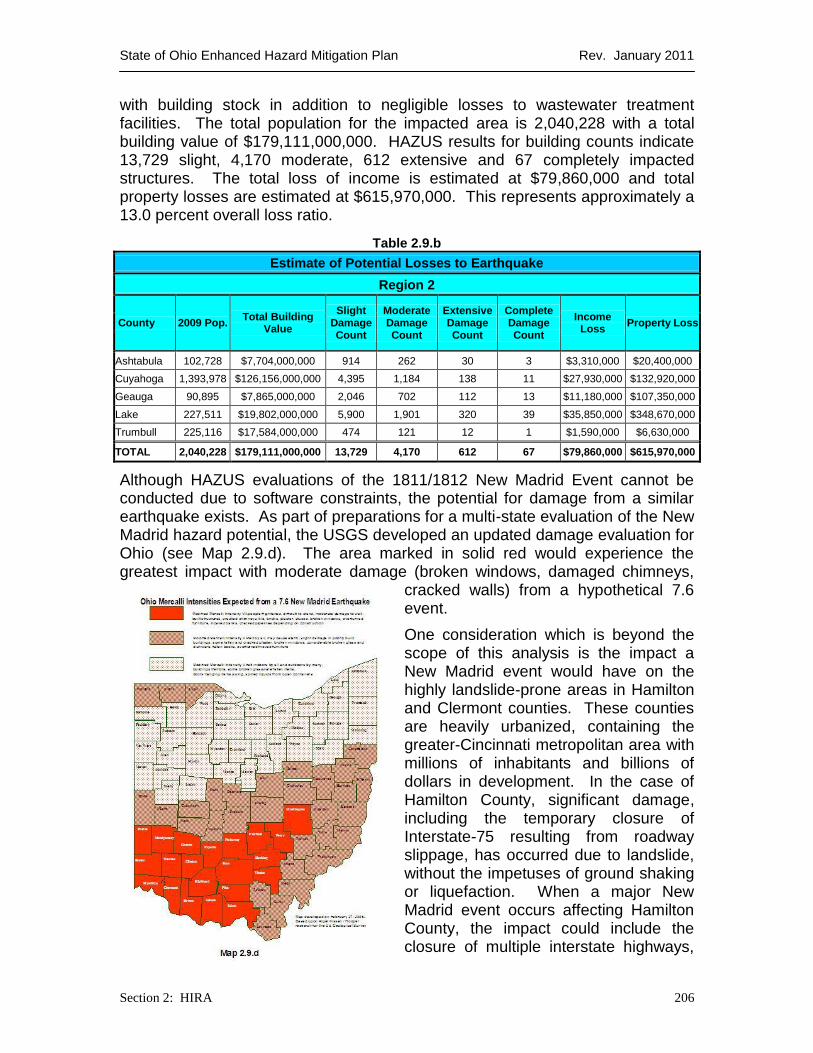
State of Ohio Enhanced Hazard Mitigation Plan Rev. January 2011
Section 2: HIRA 206
with building stock in addition to negligible losses to wastewater treatment facilities. The total population for the impacted area is 2,040,228 with a total building value of $179,111,000,000. HAZUS results for building counts indicate 13,729 slight, 4,170 moderate, 612 extensive and 67 completely impacted structures. The total loss of income is estimated at $79,860,000 and total property losses are estimated at $615,970,000. This represents approximately a 13.0 percent overall loss ratio.
Table 2.9.b
Estimate of Potential Losses to Earthquake
Region 2
County 2009 Pop. Total Building
Value
Slight Damage Count
Moderate Damage Count
Extensive Damage Count
Complete Damage Count
Income Loss
Property Loss
Ashtabula 102,728 $7,704,000,000 914 262 30 3 $3,310,000 $20,400,000
Cuyahoga 1,393,978 $126,156,000,000 4,395 1,184 138 11 $27,930,000 $132,920,000
Geauga 90,895 $7,865,000,000 2,046 702 112 13 $11,180,000 $107,350,000
Lake 227,511 $19,802,000,000 5,900 1,901 320 39 $35,850,000 $348,670,000
Trumbull 225,116 $17,584,000,000 474 121 12 1 $1,590,000 $6,630,000
TOTAL 2,040,228 $179,111,000,000 13,729 4,170 612 67 $79,860,000 $615,970,000
Although HAZUS evaluations of the 1811/1812 New Madrid Event cannot be conducted due to software constraints, the potential for damage from a similar earthquake exists. As part of preparations for a multi-state evaluation of the New Madrid hazard potential, the USGS developed an updated damage evaluation for Ohio (see Map 2.9.d). The area marked in solid red would experience the greatest impact with moderate damage (broken windows, damaged chimneys,
cracked walls) from a hypothetical 7.6 event.
One consideration which is beyond the scope of this analysis is the impact a New Madrid event would have on the highly landslide-prone areas in Hamilton and Clermont counties. These counties are heavily urbanized, containing the greater-Cincinnati metropolitan area with millions of inhabitants and billions of dollars in development. In the case of Hamilton County, significant damage, including the temporary closure of Interstate-75 resulting from roadway slippage, has occurred due to landslide, without the impetuses of ground shaking or liquefaction. When a major New Madrid event occurs affecting Hamilton County, the impact could include the closure of multiple interstate highways,
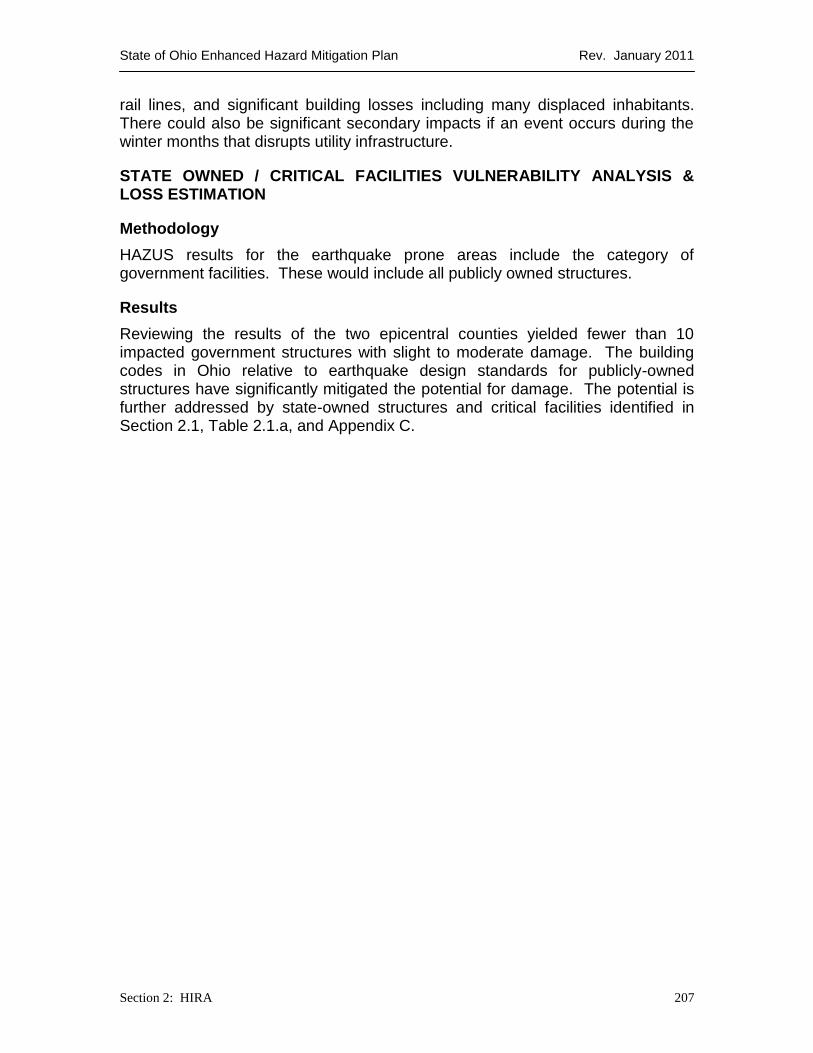
State of Ohio Enhanced Hazard Mitigation Plan Rev. January 2011
Section 2: HIRA 207
rail lines, and significant building losses including many displaced inhabitants. There could also be significant secondary impacts if an event occurs during the winter months that disrupts utility infrastructure.
STATE OWNED / CRITICAL FACILITIES VULNERABILITY ANALYSIS & LOSS ESTIMATION
Methodology
HAZUS results for the earthquake prone areas include the category of government facilities. These would include all publicly owned structures.
Results
Reviewing the results of the two epicentral counties yielded fewer than 10 impacted government structures with slight to moderate damage. The building codes in Ohio relative to earthquake design standards for publicly-owned structures have significantly mitigated the potential for damage. The potential is further addressed by state-owned structures and critical facilities identified in Section 2.1, Table 2.1.a, and Appendix C.