section-2 739 kb
TRANSCRIPT

16 Geochemistry of the Madison and Minnelusa Aquifers in the Black Hills Area, South Dakota
METHODS USED AND DATA SETSCONSIDERED
Most of the data used in this study were collected as part of the U.S. Geological Survey Regional Aquifer System Analysis Program (Busby and others, 1983, 1991) or the Black Hills Hydrology Study, using appli-cable methods and protocols. Data sets considered primarily include samples collected prior to the end of water year 1998, when data collection for the Black Hills Hydrology Study was completed. However, several isotope samples collected during water year 2000 also are considered. Additional chemical data for precipitation in Newcastle, Wyoming, were obtained from the National Atmospheric Deposition Program/National Trends Network (1999).
For geochemical analyses involving major ions, a cation/anion balance within 10 percent was used as a general sample selection criterion. For some selected single constituents, all applicable data were used. For geochemical analyses based on pH or results of specia-tion calculations, only samples collected specifically for the Black Hills Hydrology Study were used because these samples were collected using a closed-system device, thereby avoiding reaction with the atmosphere during sampling. Field measurement of pH values included temperature compensation to correct for the effect of temperature on electrode response.
For some samples used in speciation calcula-tions, an estimated temperature was calculated from a linear regression of temperature with distance from outcrop area. The geochemical program PHREEQC (Parkhurst and Appelo, 1999) was used for speciation calculations and for conducting forward geochemical modeling to illustrate relations among chemical param-eters that would be expected for certain chemical reactions.
Selected site information for all samples consid-ered in this report is presented in table 7 in the Supple-mental Information section at the end of this report. The same site numbers are used consistently throughout the report.
GEOCHEMISTRY OF MADISON ANDMINNELUSA AQUIFERS
The major-ion and isotope chemistry of the Madison and Minnelusa aquifers are discussed in the following sections. The discussion of major-ion chemistry includes information regarding distribution of major ions, saturation state, and evolutionary
processes. Stable isotopes of oxygen and hydrogen are used to evaluate ground-water recharge areas and flow-paths. Tritium, which is an unstable hydrogen isotope, is used for analysis of ground-water ages.
Major-Ion Chemistry
Major reactive minerals in the Madison and Minnelusa aquifers are calcite (CaCO3), dolomite (CaMg(CO3)2), and anhydrite (CaSO4). The inter-actions of these minerals with water and dissolved gases, to a large extent, defines the chemical composi-tion of ground water in the two aquifers. An important consequence of the presence of both calcite and anhy-drite in the Madison and Minnelusa aquifers is the potential for precipitation of calcite by the common-ion effect, which can be represented as
CaSO4 + 2HCO3- → CaCO3 + SO4
2- + CO2
(Langmuir, 1997). (1)
In partially dolomitized limestone, dolomite dissolu-tion also can lead to precipitation of calcite:
CaMg(CO3)2 → CaCO3 + Mg2+ + CO32-
(Krauskopf and Bird, 1995). (2)
The term “dedolomite” was originally used to describe the replacement of dolomite by calcite during near-surface chemical weathering (von Morlot, 1847). Strictly speaking, “dedolomitization” describes the for-mation of the mineral phase dedolomite, which is calcite pseudomorphous after dolomite. In this report, “dedolomitization” is used to describe a combination of the above two reactions (eqs. 1 and 2), in which the irreversible dissolution of anhydrite in waters saturated with calcite and dolomite drives additional dissolution of dolomite and concurrent precipitation of calcite (Back and others, 1983). The dedolomitization reaction can be represented as:
CaSO4 + 1/2 CaMg(CO3)2 → CaCO3
+ 1/2 Ca2++ 1/2 Mg2+ + SO42-. (3)
The extent to which dedolomitization occurs in the Madison and Minnelusa aquifers can be illustrated through the major-ion chemistry and saturation indices of the ground water as well as through identification of trends in pH and calcium, magnesium, and sulfate concentrations.

Major-Ion Chemistry 17
Distribution of Major Ions
The major-ion chemistry of water in the Madison and Minnelusa aquifers can be illustrated with trilinear and Stiff (1951) diagrams, which show spatial varia-tions and possible trends in the major-ion chemistry of the waters. In constructing Stiff diagrams, the average milliequivalent value was used where more than one sample existed for a site. For clarity, not all diagrams were plotted on the maps, but an effort was made to include diagrams representative of the water chemistry in a particular area.
A trilinear diagram showing percentages of major ions in the Madison aquifer is shown in figure 9, and the distribution of major-ion chemistry in the Madison aquifer throughout the study area is shown in figure 10. Figure 9 shows two main types of water in the Madison aquifer: calcium magnesium bicarbonate type and calcium sodium chloride sulfate type. Figure 10 shows that water in the Madison aquifer is dominated by calcium, magnesium, and bicarbonate ions throughout most of the study area. The high con-centrations of chloride, sulfate, and sodium in the southwestern part of the study area relative to the rest of the study area probably reflect the presence of more evolved ground water and regional flow, or greater amounts of evaporite minerals available for
dissolution. Ion chemistry is somewhat anomalous for site 188 (Rapid City area), which has high chloride with calcium and magnesium, rather than sodium.
A trilinear diagram showing percentages of major ions in the Minnelusa aquifer is shown in figure 9, and Stiff diagrams representative of the major-ion chemistry in water from Minnelusa wells are shown in figure 11. Figure 9 illustrates three main types of water in the Minnelusa aquifer: calcium mag-nesium bicarbonate type, calcium magnesium sulfate type, and calcium magnesium bicarbonate sulfate chlo-ride type. Figure 11 shows that water in the Minnelusa aquifer generally evolves downgradient from a calcium magnesium bicarbonate type to a calcium magnesium sulfate type due to dissolution of anhydrite. In the Hot Springs area, ground water in the Minnelusa aquifer is characterized by higher concentrations of sodium and chloride. Because chloride is conservative in water, it can be used to identify leakage between aquifers (Busby and others, 1995). The high chloride concen-trations in this area in both the Madison and Minnelusa aquifers could reflect hydraulic connection between the aquifers. The dissolution of evaporite minerals and the presence of more evolved ground water contributed by regional flow also are possible explanations for the occurrence of this water type in the Minnelusa aquifer.
Figure 9. Trilinear diagrams showing proportional concentrations of major ions in the Madison and Minnelusaaquifers.
Calcium
+ Magnesium
Sulfate
Sodium + Potassium
Chl
orid
e +
Fluo
ride
+ S
ulfa
te
Chl
orid
e +
Fluo
ride
+ S
ulfa
te
Bic
arbo
nate
+ C
arbo
nate
Mag
nesi
um
Calcium Chloride + Fluoride Chloride + Fluoride
PERCENT OF REACTING VALUESPERCENT OF REACTING VALUES
80
60
40
20
80
8060
4020
20
20 40 60 80
4060
80
60
40
20
20
20406080
40
60
80
80
60
40
20
Number of samples = 127
Calcium
+ Magnesium
Sulfate
Sodium + Potassium
Bic
arbo
nate
+ C
arbo
nate
Mag
nesi
um
Calcium
80
60
40
20
80
8060
4020
20
20 40 60 80
4060
80
60
40
20
20
20406080
40
60
80
80
60
40
20
Number of samples = 241
Madison Aquifer Minnelusa Aquifer

18 Geochemistry of the Madison and Minnelusa Aquifers in the Black Hills Area, South Dakota
Whitewood
Spearfish
SaintOnge
DEADWOOD
Lead
BELLE FOURCHE
Newell
STURGIS
Blackhawk
Piedmont
Tilford
Box Elder
RAPID CITY
Hill City
Hermosa
CUSTER
HOT SPRINGS
Edgemont
Minnekahta
Tinton
Maurice
Nemo
Hayward
Keystone
Rochford
Pringle
Fairburn
Buffalo Gap
Oral
Provo
N. F
orkR
apidC
r
Belle FourcheReservoir
FOURCHE
VictoriaSpring
Rhoa
dsFork
Coolidge
AngosturaReservoir
Castl eC
r
N. Fork Castle Cr
Can
yon
Red
BearG
ulch
Creek
Crow
SheridanLake
Hot BrookCanyon
DeerfieldReservoir
PactolaReservoir
Horse
Creek
OwlCreek
Crow
CreekBELLE
RIVER
REDWATER R I VE
R
Cre
ek
Cr
Lit
tle
Spea
rfis
h
Spea
rfis
h
Whi
tewoo
d
Cre
ek
Creek
Bear
Butte
Elk
Elk
Creek
Creek
Creek
Boxelder
Rapid
Rapid
Creek
CreekCreek
Spri
ng
Creek
French
Creek
Creek
CreekG
race
Creek
Cre
ek
S. Fork
S. Fork Rapid Cr
Battle
French
Beaver
Creek
Creek
Creek
FallR
Hat
Cre
ek
Creek
Horsehead
CHEYENNE
RIVER
Cot
tonw
ood
CreekHay
Bot
tom
False
Creek
Lame
Johnny
Hig
gins
Bea
ver
Cre
ek
Gulch
Castle
Cas
tleCreek
C reek
Meadow
Cr
Creek
Pass
Hel
lCan
yon
Boles
Can
yon
Wind CaveNational Park
Jewel CaveNational Monument
Mt. RushmoreNationalMemorial
CUSTER
STATE
PARK
WindCave
EllsworthAir ForceBase
BUTTE CO
LAWRENCE CO MEADE CO
PENNINGTON CO
CUSTER CO
FALL RIVER CO
WY
OM
ING
SO
UT
H
DA
KO
TA
LIM
ES
TO
NE
PL
AT
EA
U
282
284
286
283
278
4
68
12
1720
36
39
47
5859
61
69
7382
83
858990
95
100104
106
107
108 110
117123
124
126 138
140143
145
150
164172 182
188
189195
191
201
203
206210
215
217220
221
222
231 233
237238
242
253
256
257258
260
261262
197
247
108
Figure 10. Selected Stiff diagrams showing the distribution of major-ion chemistry in the Madison aquifer.
0 10 20
0 10 20 MILES
KILOMETERS
EXPLANATIONOUTCROP OF MADISON LIME- STONE (from Strobel and others, 1999)
MADISON LIMESTONE ABSENT (from Carter and Redden, 1999d)
STIFF DIAGRAM--
WELL COMPLETED IN THE MADISON AQUIFER--Number is site number from table 7
Sodium + Potassium
Calcium
Magnesium
Chloride + Fluoride
Bicarbonate + Carbonate
Sulfate
10 100CONCENTRATION, IN MILLIEQUIVALENTS PER LITER
SPRING--Number is site number from table 7
276
104o 45' 103o30'
15' 103o
30'
44o45'
15'
44o
45'
30'
43o15'
Base modified from U.S. Geological Survey digital data, 1:100,000Rapid City, Office of City Engineer map, 1:18,000, 1996Universal Transverse Mercator projection, zone 13

Major-Ion Chemistry 19
BUTTE CO
LAWRENCE CO MEADE CO
PENNINGTON CO
CUSTER CO
FALL RIVER CO
WY
OM
ING
SO
UT
H
DA
KO
TA
LIM
ES
TO
NE
PL
AT
EA
U
N. F
orkR
apidC
r
Belle FourcheReservoir
FOURCHE
VictoriaSpring
Rhoa
dsFork
Coolidge
AngosturaReservoir
Castl eC
r
N. Fork Castle Cr
Can
yon
Red
BearG
ulch
Creek
Crow
SheridanLake
Hot BrookCanyon
DeerfieldReservoir
PactolaReservoir
Horse
Creek
OwlCreek
Crow
CreekBELLE
RIVER
REDWATER R I VE
R
Cre
ek
Cr
Lit
tle
Spea
rfis
h
Spea
rfis
h
Whi
tewoo
d
Cre
ek
Creek
Bear
Butte
Elk
Elk
Creek
Creek
Creek
Boxelder
Rapid
Rapid
Creek
CreekCreek
Spri
ng
Creek
French
Creek
Creek
CreekG
race
Creek
Cre
ek
S. Fork
S. Fork Rapid Cr
Battle
French
Beaver
Creek
Creek
Creek
FallR
Hat
Cre
ek
Creek
Horsehead
CHEYENNE
RIVER
Cot
tonw
ood
CreekHay
Bot
tom
False
Creek
Lame
Johnny
Hig
gins
Bea
ver
Cre
ek
Gulch
Castle
Cas
tleCreek
C reek
Meadow
Cr
Creek
Pass
Hel
lCan
yon
Boles
Can
yon
Whitewood
Spearfish
SaintOnge
DEADWOOD
Lead
BELLE FOURCHE
Newell
STURGIS
Blackhawk
Piedmont
Tilford
Box Elder
RAPID CITY
Hill City
Hermosa
CUSTER
HOT SPRINGS
Edgemont
Minnekahta
Tinton
Maurice
Nemo
Hayward
Keystone
Rochford
Pringle
Fairburn
Buffalo Gap
Oral
Provo
Wind CaveNational Park
Jewel CaveNational Monument
Mt. RushmoreNationalMemorial
CUSTER
STATE
PARK
WindCave
EllsworthAir ForceBase
287
289288
276
3
9
11
13
14
151622
29
32
33
35
41 43
44
48
4951
52
53
5455
576264
68
727679
8081
86
88
9798
105
101
109113
119
125
129139
155157
179183
192194
198
199
200
204 205
207 208209
211212
213
214
216
218
219
223
227
228
230234
235
236
239
243
244
245 248249250
251252
254
202
0 10 20
0 10 20 MILES
KILOMETERS
Less than 250 milligrams per liter
ESTIMATED SULFATE CONCEN- TRATIONS IN MINNELUSA AQUIFER
Between 250 and 1,000 milligrams per literGreater than 1,000 milligrams per liter
EXPLANATIONOUTCROP OF MINNELUSA FORMATION (from Strobel and others, 1999)
MINNELUSA FORMATION ABSENT (from Carter and Redden, 1999c)
Figure 11. Selected Stiff diagrams showing the distribution of major-ion chemistry in the Minnelusa aquifer.Approximate location of anhydrite dissolution front showing transition between low and high sulfate concentrationsalso is shown.
STIFF DIAGRAM--
WELL COMPLETED IN THE MINNELUSA AQUIFER--Number is site number from table 7
Sodium + Potassium
Calcium
Magnesium
Chloride + Fluoride
Bicarbonate + Carbonate
Sulfate
10 100
CONCENTRATION, IN MILLIEQUIVALENTS PER LITER
204
SPRING--Number is site number from table 7
276
104o 45' 103o30'
15' 103o
30'
44o45'
15'
44o
45'
30'
43o15'
Base modified from U.S. Geological Survey digital data, 1:100,000Rapid City, Office of City Engineer map, 1:18,000, 1996Universal Transverse Mercator projection, zone 13

20 Geochemistry of the Madison and Minnelusa Aquifers in the Black Hills Area, South Dakota
Sulfate concentrations in the Madison aquifer generally are low and increase slightly with increasing distance from outcrop areas (fig. 10). In contrast, an extremely sharp gradation in sulfate concentrations occurs in the Minnelusa aquifer, such as near sites 22, 29, 32, and 33 in the northern part of the study area. Sulfate concentrations in the Minnelusa aquifer are dependent on the amount of anhydrite present in the Minnelusa Formation. Thick anhydrite beds were observed in cores from Minnelusa Formation drill holes in the southern Black Hills (Braddock and Bowles, 1963; Brobst and Epstein, 1963). These thick anhydrite deposits are mostly absent in and near out-crops because of earlier removal by dissolution in the subsurface (Epstein, 2000).
Where dissolution of anhydrite currently is taking place (Epstein, 2000), a transition zone from low to high sulfate concentrations is postulated, as shown in figure 11. Sulfate concentrations less than 250 mg/L delineate a zone in which anhydrite probably has been largely removed by dissolution. The zone in which sulfate concentrations are between 250 and 1,000 mg/L marks the position of the “anhydrite dissolution front,” an area of active removal of anhydrite by dissolution. Downgradient from the anhydrite dissolution front, sulfate concentrations are greater than 1,000 mg/L, which delineates a zone in which thick anhydrite beds remain in the formation. A similar approach was pre-sented by Klemp (1995), who used specific conduc-tance of ground-water samples from the Minnelusa aquifer to identify a line of dissolution of anhydrite. Brobst and Epstein (1963), Gott and others (1974), Kyllonen and Peter (1987), and Epstein (2000) also presented models of this anhydrite dissolution front, wherein the Minnelusa Formation is thinner near the outcrop area because of removal of the anhydrite and thicker where the anhydrite still remains. Epstein (2000) proposed that sinkholes in overlying formations are caused by collapses in the Minnelusa Formation because of removal of anhydrite, and that the sinkholes mark the zone of active dissolution of anhydrite.
Dissolution of anhydrite cements could increase hydraulic conductivity and secondary porosity in the Minnelusa aquifer; thus, low sulfate concentrations may indicate areas of greater hydraulic conductivity and enhanced secondary porosity where anhydrite has been removed from the aquifer. The anhydrite dissolu-tion front in the northern Black Hills generally is located farther from outcrop areas than in other loca-tions, although basinward deflections of the front also
are apparent in the Rapid City area and along the south-eastern flank of the uplift. In some areas, basinward deflections may correspond with structural features where enhanced hydraulic conductivity can occur; however, available data are insufficient for conclusive determinations.
Saturation State
Saturation indices measure departures from thermodynamic equilibrium and can be used to develop hypotheses related to the reactivity of minerals in an aquifer. The saturation index (SI) for a particular mineral generally indicates whether the ground water is undersaturated (SI < 0), at equilibrium (SI = 0), or supersaturated (SI > 0) with respect to that particular mineral. If ground water is undersaturated with respect to a mineral, as indicated by a negative SI, the ground water would theoretically dissolve the mineral if present. Conversely, if ground water is supersaturated with respect to a mineral, then the mineral would theo-retically precipitate from the ground water. There is some uncertainty associated with the range in SI values that indicates equilibrium because of uncertainties in field-measured pH, laboratory-analyzed concentra-tions, and ionic strength and equilibrium constants involved in calculations of SI values (Langmuir, 1997).
The geochemical program PHREEQC (Parkhurst and Appelo, 1999) was used to calculate SI values for 41 samples (35 wells) from the Madison aquifer and 25 samples (24 wells) from the Minnelusa aquifer (table 1). The default thermodynamic data-base, phreeqc.dat (Parkhurst, 1995), provided the ther-modynamic data for calculations. Although anhydrite is more common than gypsum in the Madison and Minnelusa aquifers, gypsum (CaSO4•2H2O) is the more stable phase. Therefore, SIgypsum is used as an indicator for both anhydrite and gypsum throughout the remainder of this report.
Calculated SI values show that water in the Madison aquifer is greatly undersaturated with respect to halite (NaCl) and, to a lesser extent, with respect to gypsum. These minerals should, if present, continue to dissolve in the Madison aquifer. However, ground water in the Madison aquifer remains undersaturated with respect to gypsum even at the highest sulfate con-centrations (fig. 12). Figure 13 shows that most waters in the Madison aquifer are in equilibrium with respect to calcite and are slightly undersaturated with respect to dolomite.

Major-Ion Chemistry 21
Table 1. Saturation indices for selected samples from wells completed in the Madison and Minnelusa aquifers
[SIcalcite, calcite saturation index; SIdolomite, dolomite saturation index; SIgypsum, gypsum saturation index; SIhalite, halite saturation index;e, estimated; --, no data]
Sitenumber
Station identification number
Temperature(degrees Celsius)
pH(standard
units)SIcalcite SIdolomite SIgypsum SIhalite
Madison Aquifer
6 444129103514801 29.4 7.2 0.0 0.0 -1.6 -10.2
36 443100104002001 11.3 7.4 .1 -.3 -1.3 -10.3
58 442802103544601 11.3 7.3 .1 -.1 -1.8 -7.7
59 442919103511601 12.3 7.4 -.1 -.4 -2.3 -9.6
61 442842103505501 7.8 7.6 -.1 -.4 -2.4 -9.4
83 442435103571101 e10.9 7.2 .0 -.4 -3.1 -10.5
85 441759103261202 11.5 7.5 -.1 -.4 -2.1 -10.6
95 441055103230501 13.8 7.4 .1 .2 -3.2 -11.0
100 441337103225002 12.5 7.3 -.1 -.3 -2.7 -10.5
106 440629103040901 47.5 6.9 -.2 -.3 -1.5 -9.9
112 440519103160701 20.6 7.7 .1 .2 -2.8 -10.2
116 440526103173001 13.6 7.7 .0 -.1 -2.7 -9.7
116 440526103173001 13.2 7.6 .0 -.2 -2.6 -9.2
121 440500103193601 13.8 7.6 .0 -.1 -2.5 -9.4
123 440612103152001 15.3 7.5 -.2 -.4 -2.7 -10.1
123 440612103152001 15.2 7.5 -.1 -.3 -2.6 -8.9
124 440655103140501 20.0 7.5 -.1 -.1 -2.7 -9.4
138 440931103141401 20.3 7.3 -.1 .0 -2.7 -10.4
145 440811103222201 16.8 7.3 -.1 -.1 -3.0 -10.2
161 440205103172001 13.7 7.6 -.1 -.5 -2.4 -8.9
164 440308103184601 7.0 7.6 -.2 -.8 -2.3 -9.0
168 440300103173501 e12.7 7.0 -.7 -1.7 -2.4 -9.1
168 440300103173501 18.4 7.7 .1 .0 -2.3 -8.9
169 440220103164001 15.2 7.7 .0 -.2 -2.3 -9.2
169 440220103164001 16.0 7.6 -.1 -.4 -2.4 -9.1
172 440342103160701 16.5 7.6 -.1 -.2 -2.3 -9.1
172 440342103160701 17.8 7.7 .1 .1 -2.0 -9.4
176 440310103173802 14.8 7.7 -.1 -.2 -2.0 -9.2
178 440338103173302 12.0 7.7 .0 -.2 -2.3 -9.3
182 440430103160202 15.5 7.7 .0 .0 -2.5 -9.6
185 440443103161301 16.2 7.7 .1 .0 -2.7 -9.7
186 440446103161701 e16.3 7.4 -.3 -.6 -2.7 -10.2
186 440446103161701 16.4 7.7 .1 .0 -2.7 -10.4
188 440427103131701 26.4 6.1 -.3 -.8 -2.1 -6.9

22 Geochemistry of the Madison and Minnelusa Aquifers in the Black Hills Area, South Dakota
Madison Aquifer—Continued
195 435851103143501 13.3 7.5 -0.3 -0.8 -2.4 -8.7
201 434700104021401 10.1 8.1 .6 1.0 -2.7 -9.8
210 434350103201901 14.5 7.9 .2 .3 -2.4 -9.6
215 433517103534201 14.5 8.3 .6 .6 -1.4 -7.9
238 433115103251401 17.2 7.7 .1 .0 -2.4 -8.6
242 432548103414801 21.0 7.5 .2 .3 -2.0 -8.7
253 432136103321001 21.3 7.3 .2 .0 -1.0 -6.5
Minnelusa Aquifer
29 443515103513901 13.4 7.3 .4 .3 -.1 -9.8
35 443100104002002 10.4 7.4 .0 -.4 -1.7 -10.6
44 443320104004501 11.5 7.4 .1 -.2 -1.4 -10.3
48 443515103572501 18.3 7.1 .2 -.1 .0 -9.7
65 443100103543001 13.0 8.6 1.3 2.1 -2.5 -10.4
81 442545103343701 12.5 8.6 1.2 2.0 -2.2 -10.3
86 441759103261201 11.2 7.5 -.1 -.4 -2.7 -10.3
113 440528103155201 15.2 7.5 -.1 -.3 -2.4 -10.3
118 440544103180001 10.8 7.9 .2 .1 -2.3 -9.1
119 440516103194001 19.6 7.6 .2 .3 -2.4 -9.2
129 440818103180801 18.5 7.6 .2 .2 -2.5 -10.3
177 440310103173801 12.6 7.8 .1 .0 -2.3 -9.4
179 440338103173301 12.0 7.8 .2 .1 -2.4 -9.8
181 440414103164601 16.1 7.5 .1 .0 -1.6 -9.2
183 440430103160201 11.7 7.7 .0 -.2 -2.6 --
183 440430103160201 14.2 7.7 .1 .1 -2.2 -9.6
187 440452103155301 14.8 7.7 .1 .2 -2.2 --
192 435916103161802 12.4 7.2 -.4 -1.1 -2.5 -9.7
199 435018103155801 12.8 7.7 -.2 -.7 -2.7 -9.6
211 434350103201902 e11.5 7.7 .0 -.3 -2.1 -9.0
216 433517103534202 13.6 7.4 .3 .0 -.7 -8.7
227 433003103420701 13.8 7.5 .1 -.1 -2.5 -9.5
239 433115103251402 14.2 7.8 .1 .0 -2.3 -8.8
243 432548103414802 17.2 7.3 .2 .0 .0 -7.8
254 432127103325601 19.6 7.0 .2 .0 .0 -7.4
Table 1. Saturation indices for selected samples from wells completed in the Madison and Minnelusa aquifers—Continued
[SIcalcite, calcite saturation index; SIdolomite, dolomite saturation index; SIgypsum, gypsum saturation index; SIhalite, halite saturation index;e, estimated; --, no data]
Sitenumber
Station identification number
Temperature(degrees Celsius)
pH(standard
units)SIcalcite SIdolomite SIgypsum SIhalite

Major-Ion Chemistry 23
0.01 1000.02 0.05 0.1 0.2 0.5 1 2 5 10 20 50
DISSOLVED SULFATE, IN MILLIMOLES PER LITER
-4
1
-3
-2
-1
0
GY
PS
UM
SA
TU
RA
TIO
N IN
DE
XMadison aquifer
Minnelusa aquifer
Figure 12. Relation between gypsum saturation index and dissolved sulfate in the Madison and Minnelusaaquifers.
2541
Madison MinnelusaAQUIFER
-1.0
1.5
-1.0
-0.5
0
0.5
1.0
CA
LCIT
E S
ATU
RAT
ION
IND
EX
Figure 13. Boxplots showing calcite and dolomite saturation indices for selected samples from the Madison andMinnelusa aquifers.
2541
Madison MinnelusaAQUIFER
-2
3
-2
-1
0
1
2
DO
LOM
ITE
SAT
UR
ATIO
N IN
DE
X
25th percentile
Median
75th percentile
Data value less than or equal to 1.5 timesthe interquartile range outside the quartile
Outlier data value less than or equal to 3and more than 1.5 times theinterquartile range outside the quartile
Outlier data value more than 3 times theinterquartile range outside the quartile
41 Number of samples
X
X
X
XX
EXPLANATION

24 Geochemistry of the Madison and Minnelusa Aquifers in the Black Hills Area, South Dakota
All samples from the Minnelusa aquifer are undersaturated with respect to halite, and most are undersaturated with respect to gypsum. In some sam-ples, SI values for gypsum approach zero, indicating near equilibrium with respect to gypsum at high sulfate concentrations (fig. 12). Most samples in the Min-nelusa aquifer are near equilibrium to slightly super-saturated with respect to calcite and are saturated with respect to dolomite (fig. 13).
For most samples in both the Madison and Minnelusa aquifers, SI values for gypsum, calcite, and dolomite are indicative of the occurrence of dedolo-mitization. Busby and others (1983) noted that condi-tions consistent with the dedolomitization process generally include waters that are in equilibrium with respect to calcite, undersaturated but approaching satu-ration with respect to dolomite, and undersaturated with respect to gypsum. Samples that are undersatu-rated with respect to gypsum, calcite, or dolomite may be indicative of large hydraulic conductivity, especially in the Madison aquifer, where fast flow velocities and short ground-water residence times in karst conduits may limit the extent of mineral dissolution. Undersat-uration with respect to these minerals also could result from the influence of streamflow recharge for samples collected near loss zones in outcrops of the Madison Limestone and Minnelusa Formation. The contribu-tion of calcium from anhydrite dissolution could cause slight supersaturation with respect to calcite or dolo-mite due to the common-ion effect. Samples with high SI values for calcite and dolomite may reflect errors in pH measurements, which are not uncommon primarily because of instrumentation problems. All of the posi-tive outlier values in figure 13 are associated with pH values greater than 8 (table 1), which may be of questionable validity.
The saturation state with respect to gypsum of water in the Madison and Minnelusa aquifers may pro-vide insight into mechanisms controlling hydraulic connection between the aquifers. Because water in the Madison aquifer remains undersaturated with respect to gypsum even at the highest sulfate concentrations (fig. 12), upward leakage could drive increased disso-lution of anhydrite in the Minnelusa Formation, especially where Minnelusa aquifer water is nearly saturated with respect to gypsum.
Evolutionary Processes
As shown in figures 10 and 11, dissolved sulfate concentrations generally increase with distance from
outcrops in the Madison and Minnelusa aquifers, indi-cating that sulfate can be used as a measure of the reac-tion progress. Variations in pH and concentrations of calcium and magnesium as a function of dissolved sulfate can be used to evaluate chemical processes occurring in the aquifers.
Forward geochemical modeling was used in this study to illustrate trends in pH and calcium and magne-sium concentrations with increasing dissolution of anhydrite. It is assumed in the modeling that the aquifer contains calcite, dolomite, and anhydrite and is recharged by rainwater. Hypothetical recharge water was created by defining water with a temperature of 15°C and a pH of 5.4, which was the average pH of rainwater at Newcastle, Wyoming, from August 1981 through December 1998 (National Atmospheric Depo-sition Program/National Trends Network, 1999). The recharge water was allowed to equilibrate with calcite and dolomite at a of 10-2 bar, typical of values in the soil zone (Freeze and Cherry, 1979). Conceptually, the recharge water then moved into a saturated zone containing calcite, dolomite, and anhydrite. The satu-ration index of dolomite was fixed at -0.2 to represent slight undersaturation with respect to dolomite, and the saturation index of calcite was fixed at 0 to represent equilibrium conditions. These values are consistent with the dedolomitization process and reflect median SI values in the Madison aquifer (fig. 13). Dissolution of anhydrite occurred incrementally and was limited not to exceed gypsum equilibrium. Reactions were carried out at a constant temperature of 15°C, which is representative of average temperatures in the Madison and Minnelusa aquifers in the study area (table 1).
For the simulated reactions occurring in the saturated zone, changes in modeled pH values and concentrations of calcium and magnesium, relative to increasing sulfate concentrations, are summarized in table 2 and figure 14. Table 2 shows the pH; molality of calcium (mCa), magnesium (mMg), and sulfate (mSO4) in solution; number of moles of anhy-drite (∆manhydrite), calcite (∆mcalcite), and dolomite (∆mdolomite) dissolved or precipitated (negative values indicate precipitation); and saturation index for gypsum (SIgypsum) for each reaction step. Figure 14 shows how the modeled pH, calcium molality, and magnesium molality change with reaction progress. Calcite precipitated while dolomite dissolved, pH decreased, and concentrations of dissolved magnesium and sulfate increased during reaction with anhydrite. In the ninth model reaction step, the solution reached saturation with respect to gypsum.
PCO2
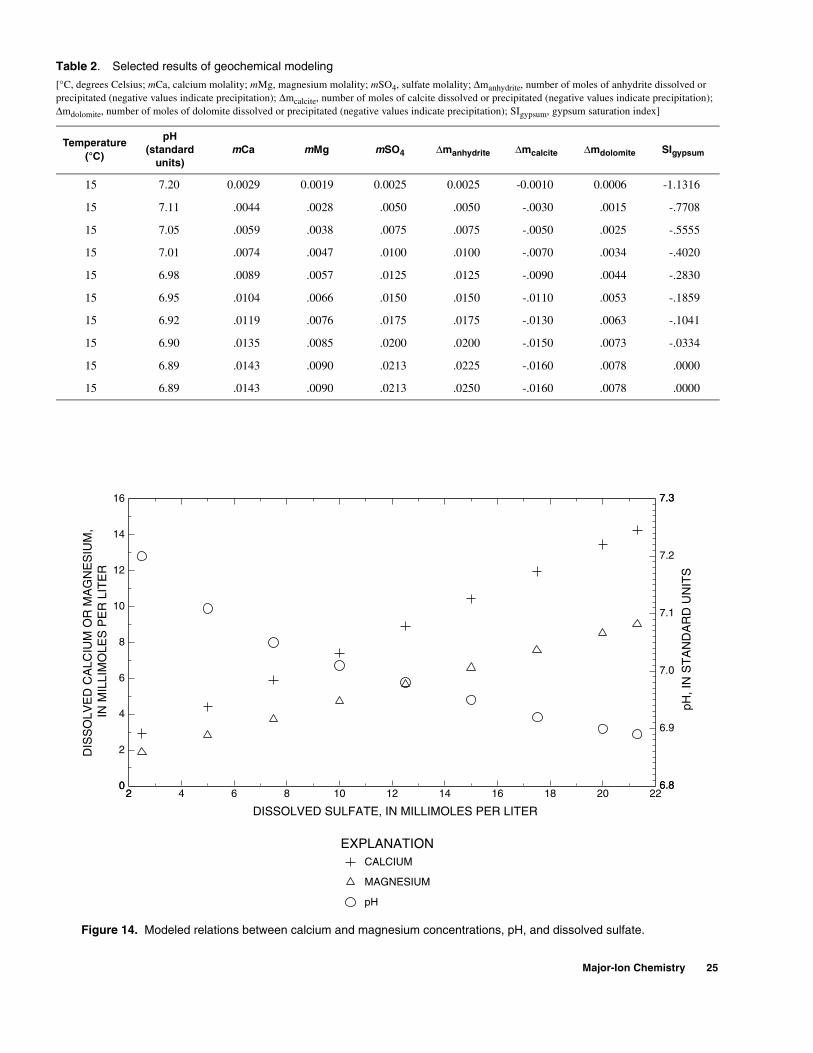
Major-Ion Chemistry 25
Table 2. Selected results of geochemical modeling
[°C, degrees Celsius; mCa, calcium molality; mMg, magnesium molality; mSO4, sulfate molality; ∆manhydrite, number of moles of anhydrite dissolved or precipitated (negative values indicate precipitation); ∆mcalcite, number of moles of calcite dissolved or precipitated (negative values indicate precipitation); ∆mdolomite, number of moles of dolomite dissolved or precipitated (negative values indicate precipitation); SIgypsum, gypsum saturation index]
Temperature(°C)
pH(standard
units)mCa mMg mSO4 ∆manhydrite ∆mcalcite ∆mdolomite SIgypsum
15 7.20 0.0029 0.0019 0.0025 0.0025 -0.0010 0.0006 -1.1316
15 7.11 .0044 .0028 .0050 .0050 -.0030 .0015 -.7708
15 7.05 .0059 .0038 .0075 .0075 -.0050 .0025 -.5555
15 7.01 .0074 .0047 .0100 .0100 -.0070 .0034 -.4020
15 6.98 .0089 .0057 .0125 .0125 -.0090 .0044 -.2830
15 6.95 .0104 .0066 .0150 .0150 -.0110 .0053 -.1859
15 6.92 .0119 .0076 .0175 .0175 -.0130 .0063 -.1041
15 6.90 .0135 .0085 .0200 .0200 -.0150 .0073 -.0334
15 6.89 .0143 .0090 .0213 .0225 -.0160 .0078 .0000
15 6.89 .0143 .0090 .0213 .0250 -.0160 .0078 .0000
Figure 14. Modeled relations between calcium and magnesium concentrations, pH, and dissolved sulfate.
CALCIUM
MAGNESIUM
pH
DISSOLVED SULFATE, IN MILLIMOLES PER LITER
DIS
SO
LVE
D C
ALC
IUM
OR
MA
GN
ES
IUM
, IN
MIL
LIM
OLE
S P
ER
LIT
ER
pH, I
N S
TA
ND
AR
D U
NIT
S
EXPLANATION
2 222 4 6 8 10 12 14 16 18 200
16
0
2
4
6
8
10
12
14
6.8
7.3
6.8
6.9
7.0
7.1
7.2
7.3

26 Geochemistry of the Madison and Minnelusa Aquifers in the Black Hills Area, South Dakota
The forward modeling results indicate that the incongruent dissolution of dolomite occurring in con-junction with anhydrite dissolution should result in increases in calcium and magnesium concentrations and a decrease in pH. Figure 15 shows the relation between dissolved calcium and magnesium concentra-tions and dissolved sulfate in the Madison and Minnelusa aquifers. To show only data reflecting sig-nificant reaction progress, only samples with sulfate concentrations greater than 1 millimole per liter are included. The variations of dissolved calcium and magnesium concentrations with dissolved sulfate shown in figure 15 for the Madison and Minnelusa aquifers are similar to those resulting from the geochemical modeling shown in figure 14 in that both calcium and magnesium concentrations increase with increasing sulfate concentrations, with calcium increasing at a greater rate. However, the modeled calcium/magnesium ratio is lower than observed in the Madison and Minnelusa aquifers. The relative rates of increase of calcium and magnesium concentrations are affected by the equilibrium constants (K) as well as temperature. Comparison of actual calcium and mag-nesium concentrations to model results indicates that if dedolomitization is occurring in both the Madison and Minnelusa aquifers, conditions in the aquifers (temper-ature, Kdolomite) are similar but not identical to those that were modeled.
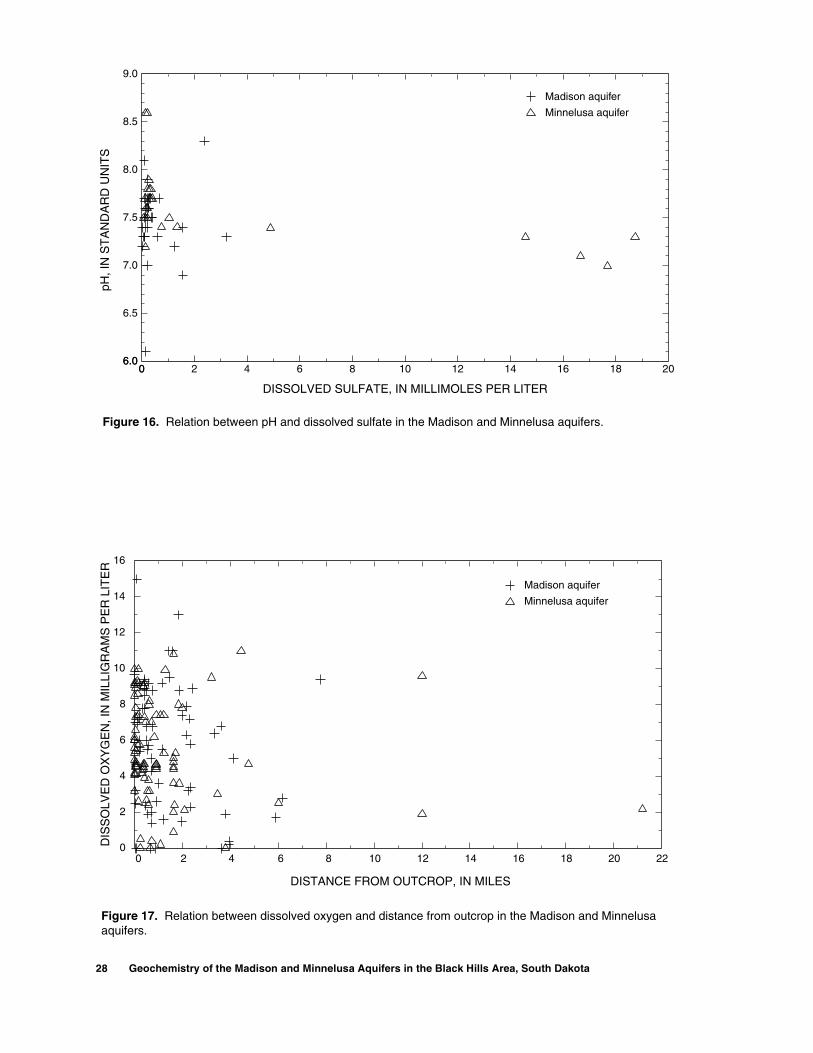
Figure 16 shows the relation between pH and dissolved sulfate in the Madison and Minnelusa aquifers. In the Minnelusa aquifer, pH generally is lower at high sulfate concentrations, which supports the occurrence of dedolomitization. In the Madison aquifer, the data are consistent with dedolomitization, but pH trends are limited by the extent of anhydrite dissolution.
Other processes that could cause a decrease in pH along a flowpath include nitrate reduction, denitri-fication, and sulfate reduction. These reactions become important in environments in which the oxygen introduced by ground-water recharge has been depleted (Langmuir, 1997). Oxygen is supplied to ground water by the movement of air through unsatur-ated material above the water table as well as by recharge (Hem, 1992). This oxygen is consumed by reaction with organic materials and reduced inorganic minerals such as pyrite and siderite. Well-oxygenated ground water may persist for long distances along a flowpath if little reactive material is available. In both the Madison and Minnelusa aquifers, most samples have dissolved oxygen concentrations greater than 2 mg/L (fig. 17), which indicates that the aquifers are
well oxygenated, even at considerable distances from the outcrops. Much of the recharge to the aquifers is from streamflow losses or through outcrop areas with limited soil development. Thus, recharge has limited interaction with organic materials in the soil horizon and consumption of oxygen is incomplete. Reduction of sulfate, nitrate, and ferric iron minerals, methane fermentation, and anaerobic decay of organic matter, therefore, are not likely in the Madison and Minnelusa aquifers in the study area.
Isotope Chemistry
This section presents information regarding the isotope chemistry of the Madison and Minnelusa aqui-fers in the Black Hills area. Stable isotopes of oxygen (18O and 16O) and hydrogen (2H, deuterium; and 1H) are used to evaluate ground-water flowpaths, recharge areas, and mixing conditions. The radioisotope tritium (3H) provides additional information for evaluation of mixing conditions and ground-water ages.
Isotope data for selected sampling sites are pre-sented in tables 7 and 8 in the Supplemental Informa-tion section. The majority of sampling sites are ground-water sites, including wells (or caves) and springs. Spring samples are categorized as either head-water springs (generally located upgradient of stream-flow loss zones) or downgradient springs (within or downgradient of loss zones). Two of the downgradient springs (sites 291 and 299) are perched springs that are located along stream channels where streamflow losses occur. The remainder of the downgradient springs are located downgradient of loss zones and are presumed to be artesian springs. Data also are included for 14 surface-water sites, all of which are located immedi-ately upgradient from loss zones where recharge occurs to the Madison or Minnelusa aquifers. Data for three meteorological sites also are provided.
Background Information and Isotopic Composition of Recharge Water
This section provides background information regarding stable isotopes and tritium. Because of spa-tial variations in isotopic signatures for precipitation in the Black Hills area, stable isotopes can be used for identification of potential recharge areas and evalua-tion of ground-water flowpaths. Tritium is useful for evaluation of ground-water ages because large tem-poral variations of concentrations in precipitation have resulted from atmospheric testing of thermonuclear bombs during the 1950’s and 1960’s.

Isotope Chemistry 27
Figure 15. Relations between dissolved calcium and magnesium concentrations and dissolved sulfate in theMadison and Minnelusa aquifers.
CALCIUM
MAGNESIUM
DISSOLVED SULFATE, IN MILLIMOLES PER LITER
DIS
SO
LVE
D C
ALC
IUM
OR
MA
GN
ES
IUM
, IN
MIL
LIM
OLE
S P
ER
LIT
ER
EXPLANATION
0
5
1
2
3
4
0 255 10 15 200
20
5
10
15
MADISON AQUIFER
MINNELUSA AQUIFER
28 Geochemistry of the Madison and Minnelusa Aquifers in the Black Hills Area, South Dakota
Figure 16. Relation between pH and dissolved sulfate in the Madison and Minnelusa aquifers.
DISSOLVED SULFATE, IN MILLIMOLES PER LITER
pH, I
N S
TA
ND
AR
D U
NIT
S
0 200 2 4 6 8 10 12 14 16 186.0
9.0
6.0
6.5
7.0
7.5
8.0
8.5
Madison aquifer
Minnelusa aquifer
DISTANCE FROM OUTCROP, IN MILES
DIS
SO
LVE
D O
XY
GE
N, I
N M
ILLI
GR
AM
S P
ER
LIT
ER
Madison aquifer
Minnelusa aquifer
Figure 17. Relation between dissolved oxygen and distance from outcrop in the Madison and Minnelusaaquifers.
0 222 4 6 8 10 12 14 16 18 200
16
2
4
6
8
10
12
14