section 15 economics of the north alabama coal to methanol
TRANSCRIPT

Section 15
ECONOMICS OF THE NORTH ALABAMA COAL TO METHANOL PROJECT
J. Frederick Weinhold
Office of Coal Gasification Tennessee Valley Authority
Chattanooga, Tennessee 37401
Mention of companies and trade names for processes, equipment, and commercial products does not constitute an endorsement by TVA or the U.S. Government
ECONOMICS OF THE NORTH ALABAMA COAL TO METHANOL PROJECT
j. Frederick Weinhold
OVERVIEW
The Tennessee Valley Authority (TVA) began work on a commercial coal gasification
project in 1979. This evolved into a coal-to-methanol plant using the Texaco
gasification process to convert 3400 tons of Illinois No. 6 coal into 2200 tons
per day of methanol (213 million gallons per year). In February 1985, the North
Alabama Coal to Methanol Consortium, which was seeking financial assistance to
take over the project from TVA, withdrew the project from the U. S. Synthetic
Fuels Corporation's (SFC) Fourth General Solicitation. TVA is currently placing
the project in a defense energy reserve status to be reactivated if and when
required by national security considerations.
During its nearly six-year history, the project size, product slate, and financing
were governed by economic considerations. More than a dozen major cost/financial
estimates and innumerable economic studies were made. On the order of $50 million
in engineering work by TVA, Stearns Catalytic, C. F. Braun, Raymond Kaiser
Engineers, Texaco, GKT (Krupp Koppers), and others stands behind these estimates.
Estimates for three different plant configurations each met the SFC's requirements
for the Level II/III design and derivative cost estimate. Such estimates are
suitable for negotiating binding agreements for financialassistance.
This paper traces the evolution of the different estimates, the underlying design
work, and their objectives. It also indicates the trends in unit capital and
operating costs which resulted. The most notable conclusions are:
• Early, nonsite specific estimates from the literature resulted in significantly lower unit costs than subsequent estimates based on the design of an actual plant to be built at TVA's Murphy Hill site in
North Alabama.
• After correcting for inflation, the estimated operating costs from the different coal to methanol configurations analyzed between 1981 and 1985 remained remarkably constant. The required selling price per unit of output, including capital charges, increased somewhat but these can readily be attributable to economies of scale. The plant size was significantly reduced twice during the period. (See
figure I.)
15-1

Both the capital and operating cost estimates tend to be higher than the generic conceptual studies reported in the literature. This is due in part to the fact that the plant uses existing proven technology rather than projected technical improvements and that actual designs and operating plans were used for many cost elements rather than rule of thumb factors. Since the estimates were to be the basis for negotiations with the SFC, sufficient contingencies to protect the interests of both the consortium members and the SFC were provided and clearly identified. Finally, since this was to be a free standing business venture, all project costs, including all funds spent by TVA and projected to be spent by the owners, were included. Frequently, such owners' management, development, and startup costs are not fully identified and provided for.
Using a relatively simple method for calculating the average capital cost per unit, we estimate that the required selling price of a gallon of methanol from the current Texaco configuration is about $1.25 per gallon in 1985 dollars. The net operating cost (after byproduct credits) is $0.53 per gallon.
By eliminating the project costs already spent by TVA which are not applicable to the present configuration, by eliminating the contingency needed to reduce the probability of a capital cost over- run from 50 percent to 30 percent and by using "real" interest rates (instead of market rates) to calculate the capital cost per unit, it is possible to project a levelized total cost of $0.90 to $0.95 per gallon in 1985 dollars. Increases in plant size, use of lower cost coal, and progress along a learning curve would further reduce the levelized cost of methanol from coal.
PROJECT EVOLUTION (FIGURE 2)
In 1979, TVA initiated a task force effort to determine if and how it should
proceed to build a commercial coal gasification plant in the Tennessee Valley.
Estimates in the literature suggested that a generic plant using 20,000 tons of
coal per day to produce medium Btu gas equivalent to 50,000 barrels of oil per day
could be built for $2 billion or less. The output from such a plant would be
pipelined to existing and new industrial facilities for use as a fuel and/or
feedstock. Using a relatively simple method for calculating the average capital
cost per unit, we estimated that TVA could produce and sell the medium Btu gas at
$5 per million Btu or less, excluding pipeline transmission (1980 dollars used
throughout unless otherwise noted).
To obtain a better insight into the design and economics of a plant to be built in
the Tennessee Valley to TVA specifications, we engaged three architect/engineer
firms to prepare conceptual designs using several different gasification
technologies. The results, which became available in late 1980, suggested that
15-2

medium Btu gas from a 50,000 barrels of oil equivalent per day plant would sell
for about $7 per million. The Koppers Totzeck (K-T) design produced gas 10
percent more costly than the Texaco design.
Both the $5 and $7 per million gas prices were above the then current natural gas
prices but quite close to distillate fuel oil. At that time, natural gas prices
were expected to reach parity with distillate shortly after deregulation in 1985.
The rapid increases in real energy prices then being projected made the project
appear to be economic without price supports or subsidies.
In early 1981, the project underwent several major changes. As the result of
shifts in Federal government priorities and programs, it was decided to shift from
a TVA-owned/goverment-financed project to a privately owned project with financial
assistance from the SFC. To make private sponsorship more feasible, the project
size was cut in half to the equivalent of 25,000 barrels of oil per day. The K-T
technology was selected on the basis of technological readiness to proceed on an
accelerated schedule. These changes resulted in a medium Btu gas price of $8.00
to $8.50 per million Btu (using the same calculational procedure employed for the
previous estimates). With leveraged private investment, tax benefits, and SFC
loan guarantees, a $6.50 per million Btu price increasing at a i0 percent general
inflation rate produced a suitable rate of return on equity. The impact of
different financing mechanisms is discussed further in the last section of this
paper.
Later in 1981, as the result of changing market conditions and inputs from the
then forming Consortium, the product slate was shifted to methanol and the plant
size reduced in half again. Even though the total Btu's of the methanol produced
was less than half the Btu's of the medium Btu gas from the larger plant, the
significantly higher form value of the methanol in the market place justified the
change. During this period the list price of methanol was about $0.75 per gallon
and average market prices $0.60 to $0.65 per gallon. Based on a conceptual design
prepared by C. F. Braun, who had been selected as project architect/engineer, we
estimated the cost of the smaller plant to be about $i billion (1980 dollars
excluding inflation and interest during construction). This work suggested that
it would be possible to sell methanol for a 1980 price of about $0.90 per gallon.
The down-sizing penalty was I0 percent. The financial analyses employed by the
Consortium for presentation to the SFC used several methanol market price
forecasts. They showed that the plant would be viable if SFC price guarantees
15-3

covered the chance that market prices would not achieve the significant real
growth rates then being projected for the 1980s and beyond.
During early 1982, C. F. Braun prepared a preliminary design and cost estimate for
a K-T plant producing 375 million gallons of methanol per year (essentially the
same size as discussed above). This effort reflected extensive engineering work
by GKT (Krupp Koppers) using the design coal and specifications for the North
Alabama project. It included optimization efforts to reduce costs. The result
was a product price estimate of $0.90 per gallon in 1982 dollars or $0.78 per
gallon in 1980 dollars. The capital costs increased by 13 percent, less than the
rate of inflation. Significant savings were also achieved in operating costs.
The combination of private sector leveraged financing with SFC and price loan
guarantees provided a satisfactory return at an $0.85 per gallon (1982 dollars)
market price inflating at 1 percent above inflation (total 9 percent). During
this period the list price for methanol remained high, but market prices began to
erode. This meant that the required SFC price guarantees needed to become price
subsidies rather than "insurance."
In late 1982, TVA, C. F. Braun, GKT, and Raymond Kaiser Engineers (the
construction manager) completed the design cost estimate for a K-T methanol plant
producing 388 million gallons of methanol per year. As a result of more complete
engineering, the estimated capital cost increased by 6 percent on a unit basis.
Since this estimate was to be the basis for negotiations with the SFC, the
Consortium added contingencies to reduce the likelihood of a cost overrun. We
developed the concept of unassigned costs and contingencies. Unassigned costs
represent the amounts which must be added to the unit-by-unit engineering
estimates to achieve a 50 percent probability of cost overrun. The numbers were
initially based on corporate experience and judgement, and later on extensive
statistical analysis. Our concept of contingency is the additional amounts
required to lower the probability of overrun to 30 percent (or less). The net
effect of these changes was a 1982 price of $1.02 per gallon ($0.88 in 1980
dollars). The project financial analysis was able to accept these changes with
the same escalating $0.85 per gallon price line (1982 dollars), but at a lower
rate of reture.
ks :he C o n s c r t i : ;roceeged izto ?re!i--inar7. ue~etiaticns ~ith the S~C durin~ earl7
1~£5, she i~act~ o~ the changing energy price structure becane clearer. After
their rapid runup in the 1979-1981 period, world oil prices started to fall. This
had relatively little impact on t~e estimated capital cost of building the plant
15-4

(in constant dollars), but it reduced inflation and projected market prices. The
result was a significant increase in required financial assistance. This factor,
when coupled with shrinking oil demand, led the Consortium and SFC to rethink the
project size and financing.
In an effort to reduce the total SFC financial assistance, the project size was
further reduced even though preliminary estimates showed that this would
significantly increase unit capital and operating costs. While the previous
reduction in size (from 700 to 350 million gallons per year) resulted in a I0
percent unit cost increase, the decrease from 388 to 206 million gallons per year
increased the unit cost by 35 percent. Based on our experience it appears that
significant economy-of-scale penalties are encountered below 350 million gallons
of methanol per year (25,000 barrels of oil equivalent per day) but that they are
not so large above this plant size.
By January 1984, the engineering team completed a Level II/III design cost and
estimate based on the reduced size K-T plant. The capital cost in constant 1984
dollars was only about 15 percent less than the 1982 cost of the larger plant.
The resulting methanol price was $1.53 in 1984 dollars ($1.24 in 1980 dollars).
This increase reflected significant increases in the fixed operating costs per
unit as well as the unit capital cost. An innovative financing approach enabled
the Consoritum to continue discussions with the SFC.
In January 1984, as the result of continuing pressure on project economics coupled
with technical progress and experience with the Texaco gasification technology,
the Consortium and TVA switched to the Texaco process. The initial comparisons
showed the Texaco quench design to have 19 percent lower operating costs and
12 percent reduction in required selling price. Thus the initial Texaco estimate
resulted in a product price of about $1.36 per gallon in 1984 dollars or $i.I0 in
1980 dollars. The Texaco radiant design was evaluated but found not to be cost
effective in the North Alabama application.
During the remainder of the year, Stearns Catalytic, Texaco, Raymond Kaiser, and
TVA worked to develop a Level II/III design and derivative cost estimate based on
the Texaco design. In late 1984, SFC representatives reviewed the design and cost
estimate work and concluded that it would meet their requirements.
The results of this effort indicated a net operating cost (after byproduct
credits) of $0.53 per gallon (1985 dollars) and a projected price of $1.25 per
15-5

gallon ($0.99 in 1980 dollars). This represents a i0 percent reduction over the
preliminary Texaco estimate and nearly 25 percent over the Level II/III K-T
estimate made a year earlier. This difference can be attributed to improved
engineering definition, optimization, and other factors in addition to the
technology change.
Even though the engineering design and cost estimates were heading in the right
direction, current and projected methanol market prices were not really
cooperating to make the project viable. The current methanol market price ($0.40 -
0.45 per gallon) ~s below the net operating cost of the plant and may well remain
below for years if current oil price projections and methanol imports keep
domestic prices low. Such a situation would have made it impossible for the
project to continue operation after the SFC price support period. This was one of
the major reasons for mothballing the project.
The current Texaco design and cost estimate would provide the basis for
reactivating the project. In the event of an energy market change, we would begin
with this engineering work to design and build the plant.
CURRENT TEXACO-BASED COST ESTIMATE
The current Texaco-based design and cost estimate reflect on a standalone,
greenfield plant built on TVA's Murphy Hill site in Marshall County, Alabama. It
receives coal by barge, raw water from the Tennessee River, and electricity from
the TVA system. It ships methanol and molten sulfur by barge and argon by truck
and discharges treated waste water into the river. The configuration shown in
figure 3 provides for all of these functions.
The unit sizing and sparing plan shown in table I indicates that spare capacity
would be provided in coal preparation, gasification, and sulfur recovery. These
spares were found to he necessary to achieve an online capacity factor approaching
90 percent. Additional data and RAM modeling would be used during the detailed
design process to confirm the cost effectiveness of these decisions.
The capital cost estimate was built up from many detailed elements as outlined in
tables II, III, and IV, and figure 4. The owner costs include the $ii0 million
already spent by TVA on the project plus funds for a strong owners' project
organization during the design and construction. The project management
15-6
r
[

organization would continue through the startup period with funds provided under
nonconstruction capital costs.
Figure 4 indicates where the direct construction costs are spent in terms of the
major process, utility, and civil units. The plant location on the site has been
shifted several times to minimize construction costs. Stearns Catalytic has
studied additional plant layouts which could result in further savings during
detailed design.
The direct and indirect costs elements are shown in tables III and IV. They
resulted from a significant planning effort by Raymond Kaiser Engineers. They
organized the plant construction activity into packages which would form the basis
for construction contracting. At this stage, no major prefabrication program is
included in the estimate. The site's river location would lend itself to such an
approach, however.
Table V presents the total production costs for the current Texaco-based design.
Illinois-basin coal is barged to the plant at a cost representing current long-
term contract conditions. Electricity is purchased from the TVA system since
numerous tradeoff studies have shown that it is more cost effective to purchase
TVA power than to build a boiler with appropriate air pollution controls to
produce steam or electricity for mechanical drives. The fixed costs include
normal plant operations and maintenance plus the front office costs (i.e.,
marketing) associated with running an independent venture. The plant is designed
to produce merchant-grade argon and sulfur, so appropriate credits are included.
The per unit capital cost is calculated using the same simplified technique as was
used throughout the paper. It provides for the plant construction cost,
nonconstruction capital cost, the funds already spent by TVA, a contingency
allowance to reduce the chance of an overrun to 30 percent, and interest during
construction. This results in a required selling price of $1.25 per gallon in
1985 dollars. Of this total, the funds already spent by TVA and the contingency
are each about $.07 per gallon.
IMPLICATIONS FOR FUTURE COMMERCIAL PROJECTS
The capital and operating cost estimates for the North Alabama Coal to Methanol
Project are the result of extensive engineering work based on specific plant
configurations and assumptions. These estimates were converted into required
15-7

selling prices by means of a consistent but relatively simplistic formula. The
resulting prices are useful for assessing trends noted in this paper, but their
absolute value is subject to misinterpretation.
Project decisions were made on the basis of detailed financial analyses prepared
by Kidder, Peabody and Company, Inc., and reviewed by senior executives from the
North Alabama Coal to Methanol Consortium member companies. These individuals
were concerned with the financial implications of the project, assisted by the
SFC, on their own firm's financial position. We did not calculate levelized
required selling prices, but rather focused on projected methanol market prices,
required SFC guarantees, and returns to the sponsors.
A levelized cost or selling price is also useful when developing national
policies. The problem is that the absolute value of such a number is affected
more by financial tax and economic assumptions than it is by technology or plant
design. One of our studies showed that the four available or near avavilable
gasification technologies produced methanol at required selling prices in a
± 5 percent range. As discussed below, financial and scale choices have a much
larger impact.
Capital intensive projects such as synthetic fuels plants produce products that
are more expensive per unit in real terms during the early years of operation than
they are during later years. The value of the capital used in the early years of
operation is not depreciated while later it is. This situation is exacerbated by
inflation which results in increasing product prices while real costs are
decreasing. Investors must, therefore, borrow resources to construct and operate
the plant during the early years and rely on future operations and inflation to
pay them back. There are three major sources of these resources--retained
earnings or equity, borrowing from banks or bondholders, and borrowing from the
government through the Federal income tax system (investment tax credits and
accelerated depreciation defer tax payments for firms with other tax
liabilities). The rules and requirements governing these are constantly
changing. Modest changes in the ratio of debt to equity and in the applicability
of investment tax credits can affect the required constant real selling price by
25 or 30 percent. Interest rates, inflation, and the rates of return on equity
required by individual investors can likewise have significant effects. Thus the
choice of financial and economic assumptions will largely determine the unit cost
of capital and, therefore, the required selling price.
15-8

For policy purposes, it is useful to calculate a required selling price
based on elimination of the project costs already spent by TVA hut not applicable
to the present configuration and elimination of the contingencies needed to reduce
the probabilities of a capital cost overrun from 50 percent to 30 percent. This
drops ~he $1.25 price to about $i.I0. Furthermore, replacing the market interest
rate of II percent with a "real" interest rate of 6 to 7 percent would reduce the
required selling price to the $0.90 to $0.95 range. It could be argued that this
represents a more representative inflation free levelized value.
Economies of scale also play a major role in the required per unit selling price.
Just as the North Alabama Project economics suffered when the plant size was
reduced, the economics of another project would benefit with increased size. A
plant the size of our two-module (775 million gallon per year) design may be able
to achieve a required selling price below $.80 per gallon using financial
assumptions similar to those resulting in $1.25 per gallon for the current
design. This is still above current methanol market prices but comparable to
gasoline on a volumetric basis. The big question is when market forces and other
factors will make it attractive enough for a private firm to invest in a
commercial coal-to-methanol plant.
15-9

I
Q
A (/')
m
o
o co o~
=P
0 ,.J .,.,I
I.,IJ 0,. I-- r,~ 0 (3
1.20
1.10
1.00
.90
.80
.70
.60
.50
.40
.30
.20
. 1 0
M E T H A N O L C O S T ESTIMATES BY
OFFICE OF C O A L GASIFICATION
TOTAL COST
OPERATING COST J
K-T 2 K-T 1 MODULE MODULE
I I 1981 | 1982
K-T REDUCED
i i I I 1983
DATE OF ESTIMATE
TEXACO REDUCED
1984 1985
FIGURE I

P R O . I E C T E V O L U T I O N
1980 1981 I i I ~ I I |
I PROI~UCT ii!iiiii!ii!iiii!ii!!!iii?!ii!ii!iiiii ~ij!g(.g gS~ iiiii!i!i!ii!i!iiiiii!i:?!!i?!iii:i!i:
PLANT SIZE g--:k{:':'i'6.ii*"'?i'"--':(gi(Ji" ~-:i.J [lqfi0'~"a:'--5"fib'i;
t--..t ¢.J"l
GASIFICATION L::::i:-~.-i;ii¢.,ei:g.<eg.:i:i:i:il g.~;~.A3.zN~] PROCESS . . . . . . . . . . . . . . . . . . . . . . .
APPLICATION TO SFC
CAPITAL COS'I" EST1M ATES
l
REVISED STUOY t CONCEPTUAL t CONCEPTUAL'
K - T
! I 1 i 1 I
1980 1981
1982 1983 1984 i | | | | I i I i
~/// / / / / / / / / / / / / /~ . . . . . . . . . y / / . ~ / / / / ~ METI IANOI, ~//'////////////,~
~.%,3L,:-'~!Z~D[,~<A I:: : 1 3 : 4 , . T : V 7 M O . : ........ :: ..... 1
I T lXa CO 1
~ 2 4
UPDATE t t
PREL,M, D ~ . t K-T / "-
I ! ! I !
1982 1983
I)ESIGN~[~ CONCEPTUAL @DESIGN K-T I i TEX / TEX
1984
FIGURE 2

(.TI !
r,o
COAL RECEWI4O & STORAGE
UNIT 111
NORTH ALABAMA COAL TO METHANOL PROJECT
TE XACO CONFIGURATION
COAL
I UNIT 112 ] "
t 2
'r ' 1 I tc°=E"s" ;
TO ~ ~ COLD C O N ~
T I ~ IV'~ ~ ~ "c°=~'°" I I I s w . ~
GASIFER L I I WATER HANO'LING WATER
UMT 113 I BLOWOOWN "=1 UNn" 114 J WATER I
RECOVERY
UNIT 119
SHIFT C O N ~ N
BY~AS~AS C O ~
~mTED GAS I AC© CA', (SELEC
UNIT 115 GAS I ~ I
I i
;AS REMOVAL
ZIIR'~I~I~I~ OL)
CHAR SLURRY
EFFLUENT TREATMENT
UNIT 134
RLTRATE
SLUOGE
I) CO2 TO ATM
METHANOL
UNiT 126
• ,~.LFUR TO STORAGE
I METHANOL I TO STORAGE
1 !
} I~_._._~ AMMONIA TO STORAGE
I ASH & SLAG JHAND~G/STORAGE
"I UNIT 121
• EFFLUENT WATEIR TO RESERVOa~
FIGURE 3

!
0
DIRECT CONSTRUCTION COSTS
P E R C E N T OF T O T A L 5 10
T ' I AIR SEPARATION
L I COAL RECEIVING & PREPARATION
I t GASIFICATION
|
15
15
WATER HANDLING & EFFLUENT TREATMENT
l GAS TREATING i14
I METHANOL 8
UTILITIES
I I CIVIL & GENERAL
16
0 I , I , 5 10
P E R C E N T OF T O T A L
15
FIGURE 4
20
20
15-13

Table I
UNIT SIZING
O'I !
4~
Process No. of Trains Units (Oper + Sp)
Air Separation 2+0
Coal Preparation 2+1
Gasification 3+2
Water Handling I+0
Shift Conversion i+0
Acid Gas Removal i+0
Sulfur Recovery i+I
Tail Gas Treatment i+0
Methanol Synthesis i+0
Effluent Treatment I+0
Process Description
Air Products
Ball Mills
Texaco
Cyam/Phosam-W
Sour Shift
Rectisol
Claus
Scot
Lurgi
Biological/ Phys. Chem.
Nominal Unit Capacity
3100 T/D Oxygen
3400 T/D Coal
160-MM SCFD Syngas
Performance Criteria
99.5% Purity
62% Slurry Conc.
Maximized Useful (Ii00 T/D Coal/Gasifier)
520 Gal/min
160-MM SCFD Syngas
160-MM SCFD Syngas
105 LT/D Sulfur
2200 T/D Methanol
1200 Gal/min
Gas
S-, CN-, and NH 3 Removal
2.27 H/CO 2 Rat io
0.i PPM Sulfur & 3% CO 2 In Syngas
99.75% Sulfur Recovery
Grade AA
Suitable for BACT w/o Zero Discharge

Table II
CAPITAL COST ESTIMATE
Construction
• Owner Costs (Studies, Engineering, Design, Tests, Environmental, Project Management, Licenses, early Site Costs)
Plant Construction ( Direct ) 87% ( Indirect ) 13%
Nonconstruction
• Prestartup and Startup • Working Capital
Project Contingency
Percent of Total
27
52
9 3
9 100
15-15
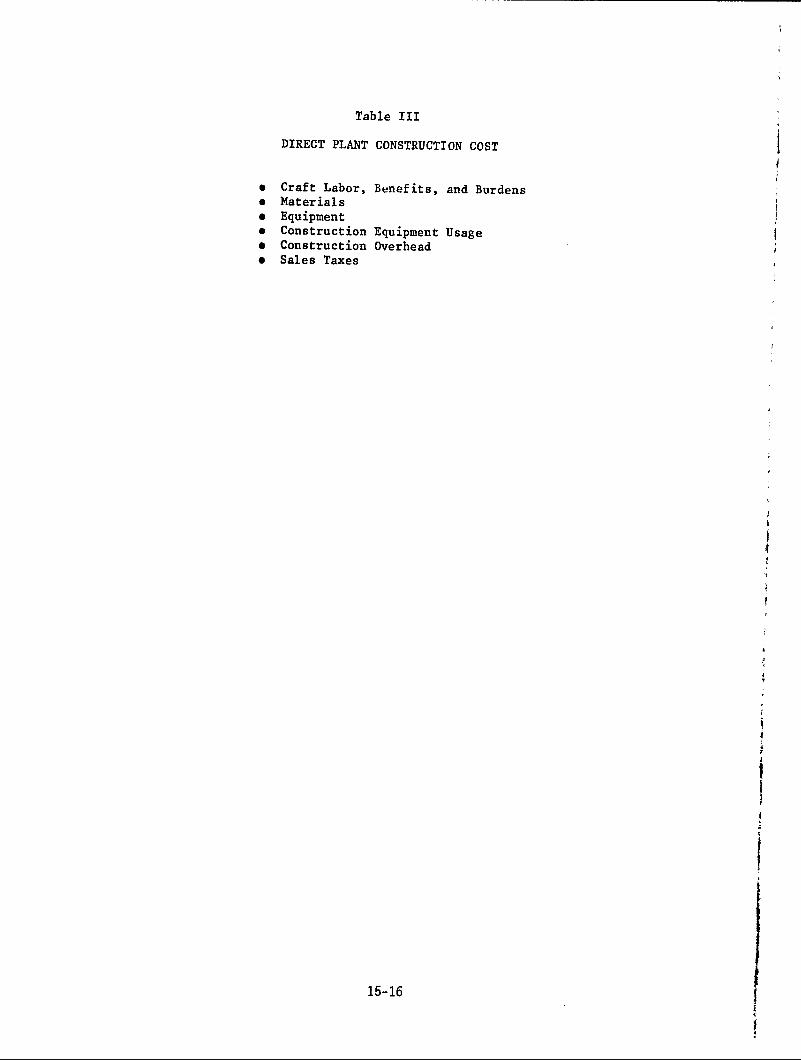
Table III
DIRECT PLANT CONSTRUCTION COST
• Craft Labor, Benefits, and Burdens • Materials • Equipment • Construction Equipment UsaEe • Construction Overhead • Sales Taxes
15-16

Table IV
INDIRECT CONSTRUCTION COST
• Construction Management Services
- Contracting/contract ADM - Managing direct hire construction - Project control - Materials/equipment controls - Site utilization - Construction engineering - QAIQC - Labor relations
• Construction Plant
- Construction offices - Warehouse and labor - Temporary roads/parking - Shops - Security/medical/fire - Temporary power and lighting
1 5 - 1 7

i
Table V
METHANOL PRODUCTION COSTS (1985 Dollars per Gallon)
Coal Electricity Fuel, etc.
Subtotal
Fixed costs Total
Byproduct credit Net production cost
Cost of capital*
.21
.08
.0__!
.32
.57
.o__44
.53
.72 1.25
*Based on plant construction cost of $908 million plus $133 million nonconstruction capital (1985 dollars).
15-18