surface modification of oxidized coal by …web.anl.gov/pcs/acsfuel/preprint...
TRANSCRIPT
SURFACE MODIFICATION OF OXIDIZED COAL BY METHANOL VAPOR
McMahan L. Gray, Ralph W. Lai, and Arthur W. Wells
US. Dept. of Energy, P.O. Box 10940 Pittsburgh, PA 15236
Keywords: Coal Surface; Oxidation; Methylation
ABSTRACT
A bituminous coal was oxidized at 125°C for times varying from 0 t o 48 hours and then chemically treated with a gaseous mixture of nitrogen, methanol, and an acid catalyst at 190°C for one .hour. The differences between oxidized and methanol- treated coal surfaces were characterized by zeta potential, induction time, and contact angle measurements. Methanol-treated coals had more positive zeta potentials, lower induction times, and higher contact angles indicating a significant increase in the hydrophobicity of the treated coal surfaces. Using C13 labeled methanol for tracing the reaction products, NMR analysis indicated between 0.5 - 1.2 carbons are added per 1000 carbons of coal as a result o f the treatment.
INTRODUCTION
In fine coal processing, the product quality depends largely on the surface properties of the feed coal. Processes that rely on surface properties of coal and i ts associated mineral matter include flotation [l-31, selective a glomeration 14-61, selective flocculation [7,8], and electrostaticseparation [9,10]. T%e rheology o f coal- water and coal-oil slurries is also dependent on the surface properties of the coal and itsassociated mineral matter [I 1-13]. Therefore, in handling or processing fine coals, we must understand the relationship between their surface properties and beneficiation response.
The hydrophobicity o f the coal surface varieswith rank, the extent o f oxidation, and the nature and amount of inorganics. During mining, stockpiling, and processing o f coal, oxidation of the coal occurs. Such oxidation can dramaticall influence the wettabilitf o f the coal particles resulting in poor recoveries in sudce-dependent coal bene iciation processes.
Both fresh and oxidized coals contain a variety o f functional groups containing oxygen, nitrogen, and sulfur. Due to their abundance and polarity, oxygen containing functional groups contribute more to the chemical behavior o f the coal surface than do those containing nitrogen and sulfur. Analyses of coals indicate thatthe major oxygen functional roups are phenols, ethers, and carbonyls [14-19]. The presence of polar oxygenate ?unctionat groups, such as phenols and carbonyl containing groups, is assumed t o result in increased hydrophilicity o f the coal surface.
Capping of polar oxygenate functional groups through methylation is expected t o increase the h drophobicity o f the coal surfaces. A method for the methylation of coal,surfaces zas been reported [20]. This method consists of treating.fine coal particles with a gaseous mixture of nitrogen, methanol vapor, and an acid catalyst (SO2 or HCI) a t temperatures of 150 -190°C for one hour. It is proposed that the polar coal hydroxyl groups (ROH) are converted to ethers, while the carboxylic groups (RCOOH). if present, are esterified. The following chemical reactions were proposed:
804
ROH + CH30H AcidCatalvst ~ ROCH3 + HzO Heat, N2
Alcohols or Methanol Ethers Water Phenols
RCOOH + CH30H AcidCatalvst , RCOOCH3 + H2O Heat, N2
Carboxylic Methanol Esters Water Acids
and
The resulting ethers and esters are less hydrophilic than the ori inal phenolic and carboxylic groups and have less hydrogen bondin potential. Aaer this treatment, the coal particle surface becomes more hydropho%ic and should respond better in conventional beneficiation processes.
In this investigation, a Pittsburgh seam bituminous coal was air oxidized a t 125OC for various times up t o 48 hours, and some of these oxidized samples were treated with methanol as described above. The oxidized and methanol-treated coal surfaces were characterized by measurement of zeta potential, induction time, and contact angle. The determination o f the de ree of methylation was achieved by reacting the coal wi th C13 labeled methanol in %e presence of an acid catalyst followed by NMR analysis of the incorporated C13 label. The goal of this investigation was t o clarify the chemistry of this surface modification method.
EXPERIMENTAL PROCEDURES
Sample Preparation:
The ultimate analysls o f the Pittsburgh seam bituminous coal is shown in Table 1. Both 100 X 325 mesh coal powders and lcm x2cm x3cm coal chunks were examined. The powdered coals were prepared by passing a 1/4 inch X 0 size fraction through a jaw crusher followed by hammer milling to yield a 28 X 0 mesh sample. This coal sample was then dry screened t o obtain the 100 X 325 mesh size fraction. The coal chunks were machined and wet ground t o the desired size. One side of the chunk was polished with emery cloth and alumina powder t o obtain a smooth surface. Both the powered coal samples and the coal chunks were stored under an argon atmosphere t o reduce air oxidation.
Accelerated Oxidation:
The coal samples were placed in an oven at 125OC for2,4! 8,24, and 48 hours. The bed thickness for the coal powders during this oven oxidation was approximately 1/8 inch. All of the oxidized coals were stored under argon after treatment.
Methanol Treatment:
As described by Attar [211, the oxidized coal samples were exposed t o a gaseous mixture of nitrogen, methanol, and eitherSO2 or anhydrous HCLat a temperature of 190°C for one hour. Twenty-gram samples o f powered coal were poured into a fritted one-inch diameter VYCOR tube 18 inches Ion with glass wool on both sides t o maintain the uniform solid core packing. The coaqchunk was placed in the same
805

tube and the chunk was also centered using glass wool. The methanol saturated nitrogen gas flow during these runs was approximately 680 m h i n with 7.0 volume percent of the flow being the acid catalyst (SO2 or HCI). After treatment, samples were cooled to room temperature and stored under argon.
Zeta Potential Measurements:
Zeta potentials of these oxidized and treated fine coals were measured using the PEN KEM LASER ZEE MODEL 501 instrument. Coal particles (0.309) were placed in 100 ml of 10-3 M potassium nitrate solution and sonified for one minute. The proper pH was achieved by addition of dilute nitric acid or sodium hydroxide solutions and the zeta potentials were measured in the pH range of 2.0 - 11 .O.
Induction Time Measurements:
The attachment of a particle t o an air bubble is the requirement for successful flotation. This phenomenon involves the thinning and rupture of the wetting film between colliding bubble and particles. Induction time I22-231 is defined as the contact time required t o thin the disjoining film between coal particle and air bubbles and establish a three-phase contact. This important parameter is closely related t o flotation processes and is useful in determining flotation kinetics as well as in predicting flotation recoveries of fine coal particles.
Using accepted procedures 1231 fo r obtaining consistent induction t ime measurements, one gram of fine coal particles was agitated in 100 ml of distilled water for two minutes. After the formation of a uniform coal slurry, approximately 20 m l was transferred into a rectangular optical PLEXIGLASS cell to form a bed o f particles. The cell was placed on the moving stage of the microscope for measurements. Inside the cell, a microsyringe was used to form an air bubble 2mm in diameter at the t ip o f the glass tube and le t stand for one minute t o reach equilibrium before making contact with the particle bed. The contact time was gradually increased from short times to determine the minimum time for the particle t o adhere to the surface of the bubble. The contact time was then preset and ten measurements were taken at different regions of the particle bed t o yield the average induction time.
Contact Angle Measurements:
Contact angle has been widel used to evaluate the hydrophobic nature of coal, first by Brady and Gauger [24], w(o showed that the hydrophobicity varied with rank. Later, Horse1 and Smith [25], Sun [26], and Aplan [27] have investigated in detail the relationship Letween the contact angle and rank and have related the contact angle t o coal floatability.
The contact angles in this work were measured usin the captive bubble method [281. The polished coal chunks were mounted and pqaced into distilled water in a PLEXIGLASS cell. The air bubble was attached to the oxidized and treated coal surfaces b using a screw-type microsyringe equipped with an inverted 22 gauge needle. T i e air bubble was allowed t o reach equilibrium for 20 minutes and the contact angle measurement was taken on both sides of the bubble by a Gartner Scientific goniometer at ten different areas over the polished surface.
SurfaceTreatment using C13 Labeled Methanol :
806
TO obtain a better understanding of the proposed chemical reactions, C13 labeled methanol was reacted with coal particles to determine the degree of methylation. A 250 ml three-necked round bottom flask was charged with 700 mg of untreated Pittsbur h seam coal and then flushed with nitrogen. The flask was heated t o 190°C with a aeatin mantle and was allowed t o equilibrate (190 +/ - 5OC). After equilibration, t t e pure nitrogen atmosphere was replaced with nitrogen containing 7 percent acid catalyst. The C13 labeled methanol from the Aldrich Chemical Co. (99 atom % ).was added from a microsyrin e, through a MlNlNERT valve into a small suspended beaker for the saturation 07 the reaction atmosphere. To assure that saturation was achieved, the labeled methanol was added until droplets were observed condensing on the walls of the flask. The coal sample was exposed t o this gaseous mixture for one hour. Following reaction, the flask was swept w i th nitrogen and cooled t o room temperature. To assure that ph sically adsorbed reagents were removed, the treated coal samples were vacuum dYried for 24 hours and stored under argon.
The methylated coal samples were analyzed by a Brucker CXP-100 nuclear magnetic resonance spectrometer. The spectra were acquired by spinning at the magic angle, using a cross-polarization contact time of 1.0 ms, 3.5 pm -90 degree pulse width and a 2.0 second recycle time. The spectrometer was operated at 25.18 MHz and the aromatic carbon resonance was assigned a chemical shift of 129 ppm.
RESULTS AND DISCUSSION , Air oxidation of the coal under either ambient temperature conditions or under accelerated conditions can result in the uptake of oxygen and the conversion of hydrocarbon constituents into oxygen containing functional groups [29-321.
Accelerated oxidation of the Pittsburgh seam coal indicates that at long exposure times there was a significant increase in the oxygen content determined by difference. The results of the oxidation of this coal are summarized in Table 2.
As expected, the oxygen content increased with the oxidation time. The apparent increase in the oxygen content shown in Table 2 is a measure of total oxidation and should not be interpreted directly as increase in oxygen functionality on particle surfaces. Increasing the number of polar groups on the coal surface is expected t o cause the coal to become more hydrophilic. The increase in the hydrophilicity of the oxidized coals can be attributed t o increased interfacial attractive forces between polar oxygenate functionality on the coal surface and liquid water.
The surface potential of particles in an aqueous solution can be determined by electrophoresis, in which electrophoretic mobilities (u) are measured in an applied electric field. The zeta potential ( 5 ) for a particle in an aqueous solution can be calculated by the von Smoluchowski equation (1):
5 = I I ~ / ( E ~ E ~ )
where 17 is the viscosity of the aqueous SoIuTion, Eris its dielectric constant, andEo is the permittivity of free space.
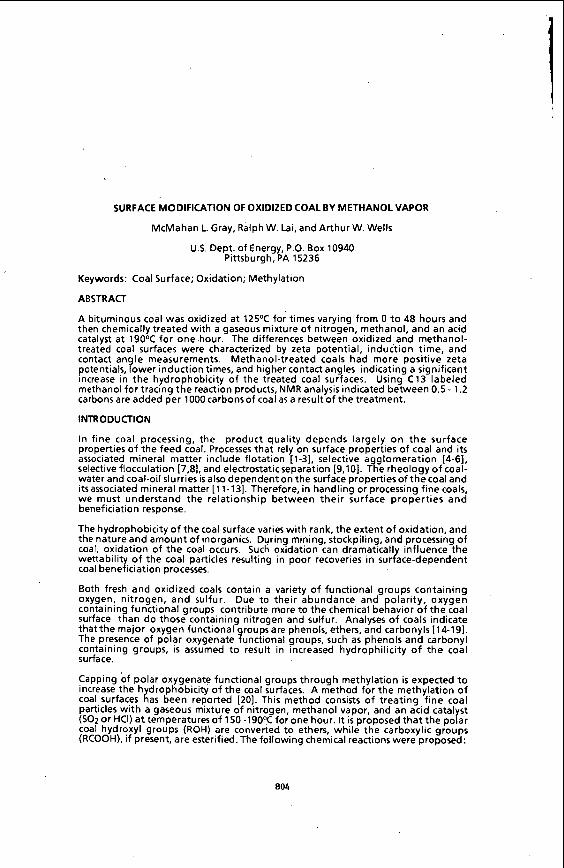
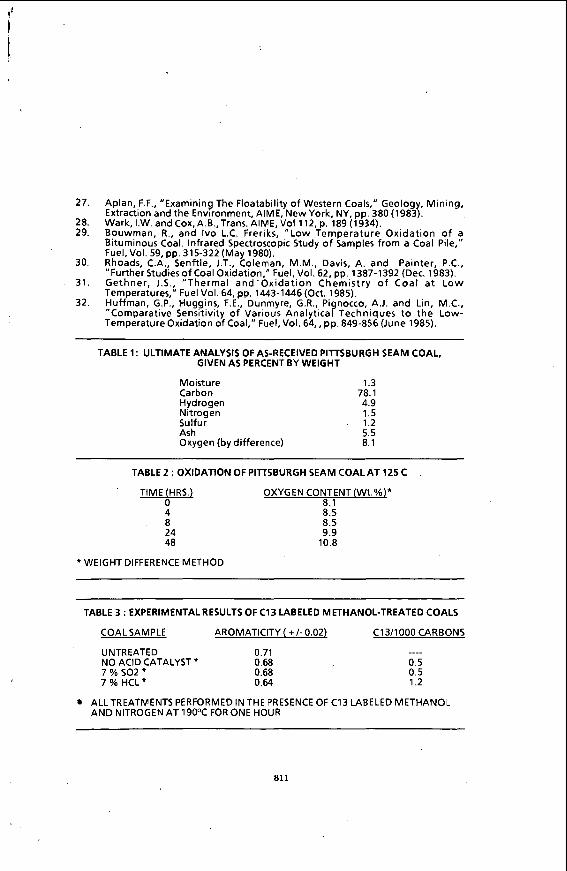
Figure 1 shows the zeta potentials in aqueous solutions of pH 2 t o 11 for fresh and oxidized coals. The ne ative potentials observed at high pH are assumed t o result from the adsorption ofaydroxyl ions and/or the deprotonation of acid sites, and the positive potentials observed at low pH result from the adsorption of hydrogen ions
807
on basic sites. Comparison of the zeta potentials between the fresh and oxidized Pittsburgh seam coals overthe pH range of 2 t o 11 reveals that the zeta potentials of the oxidized coal are approximately 30 mV more negative than the fresh coal in the entire pH range. Furthermore, the curve of the zeta potentials of the oxidized coal does not have an isoelectric point (point of zero charge) while the fresh coal has an isoelectric point at the pH of 5.0. Since these zeta potentials are measures of the average distribution of surface potential, it is apparent that the oxidized coal surfaces are dominated by acidic sites while the fresh coal has a mixture of basic and acidic sites. This increase in acidic sites on the oxidized coal surface is also supported by the observed increase in the oxygen content shown in Table 2. It is assumed that the presence of more oxygen containing functional groups (i.e., phenols or carboxylic acids) on the interface between the coal particle and the aqueous phase will cause the coal t o be more hydrophilic.
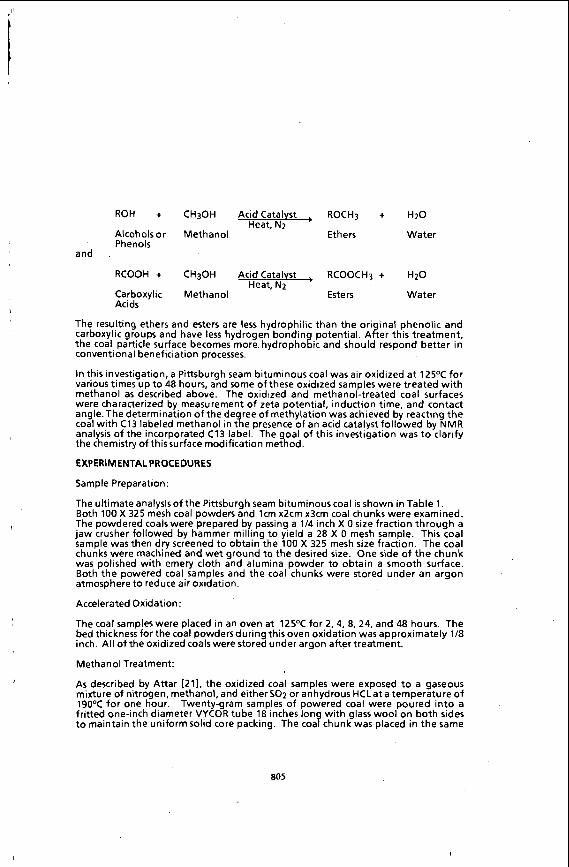
Both the induction time and contact angle measurements in Figures 2 and 3 indicate that the coal surface becomes more hydrophilic with longer oxidation times. The fresh Pittsburgh seam coal had an induction time of 1350 microseconds. After 48 hours of oxidation, this value increased t o 2200 microseconds. Fresh Pittsburgh seam coal had a contact angle of 45 degrees, which decreased t o 21 degreesafter 48 hours oxidation. The increase in induction time and the decrease in the contact angle indicate that a more hydrophilic surface results from oxidation.
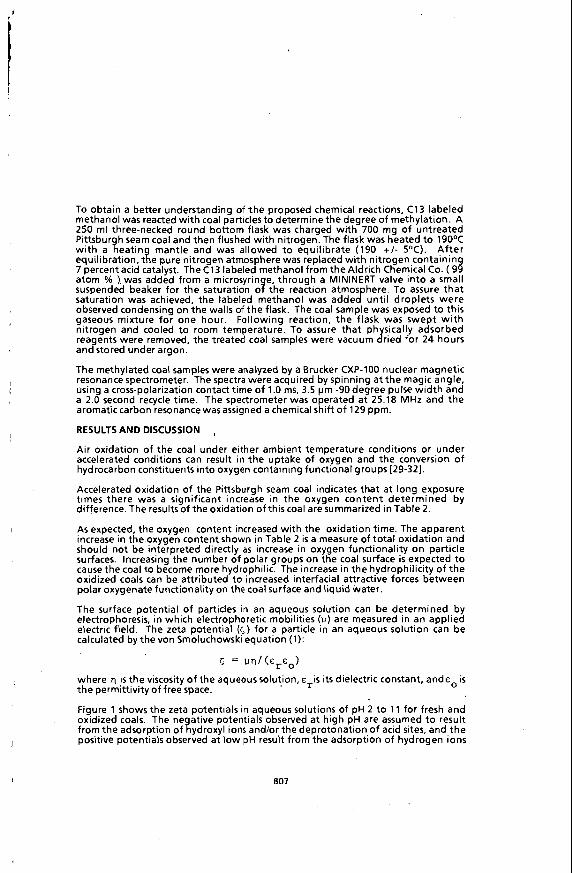
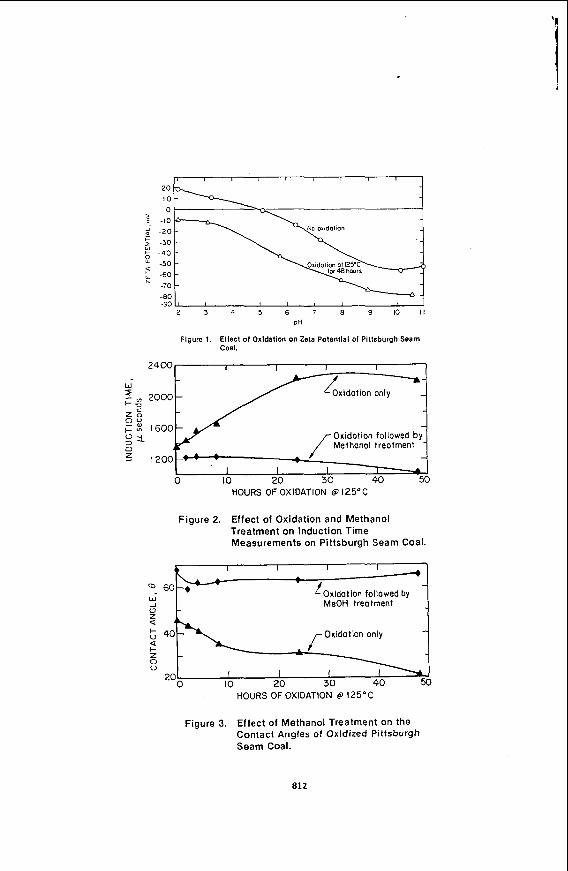
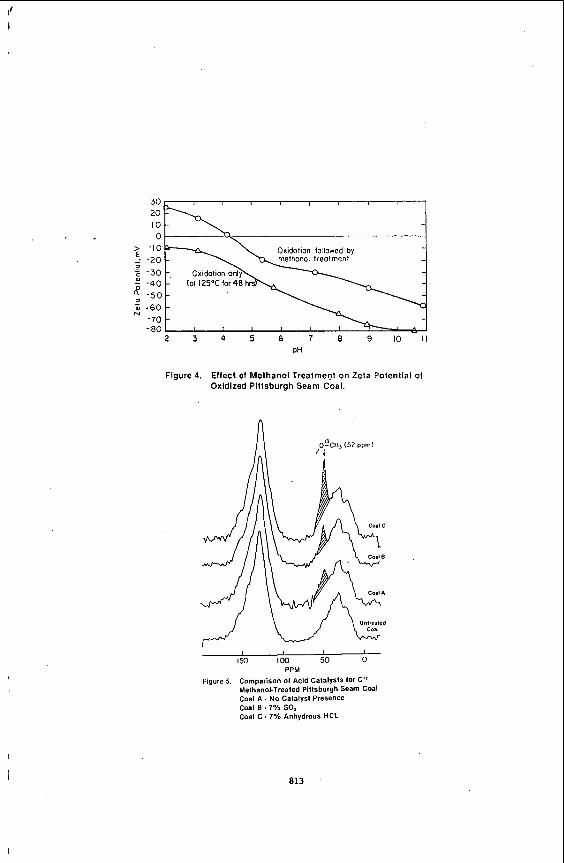
Following oxidation, 20 gram samples of oxidized coal were treated wi th the gaseous mixture of nitrogen, methanol, and 7% sulfur dioxide at 190°C for one hour t o investigate restoration of the hydrophilicity of the coal surface. In Figure 4, it is apparent that the zeta potentials o f the methanol-treated oxidized coal powder show a significant increase of approximately 20 mV as a result of treatment. This suggests a reduction in the acidicsitesof the treated coal surface indicating a hi her level of hydrophobicity. Comparison of the treated coal (Figure 4) with the aesh coal (Figure 1) shows that the isoelectric point was only slightly lower (pH of 4.2 verses 5.0) for the treated coal, su gesting that the oxidized coal surface was restored t o nearly i ts original hydropzobicity.
Consistent with the zeta potential changes observed, the methanol treatment also reduced the induction time and increased the contact angles o f the oxidized coals. Both results, presented in Figures 2 and 3, indicate increasing hydrophobicity of the oxidized coal surface as a result of the treatment.
To determine the effectiveness of the acid catalyst, a comparison study was performed using C13 labeled methanol. Pittsburgh seam coal was reacted on a small scale, as described in the experimental section, with the C13 labeled methanol with
' and without acid catalyst (SO2 or anhydrous HCI). These C13 labeled coal samples were then analyzed by NMR to determine the amount of methylation.
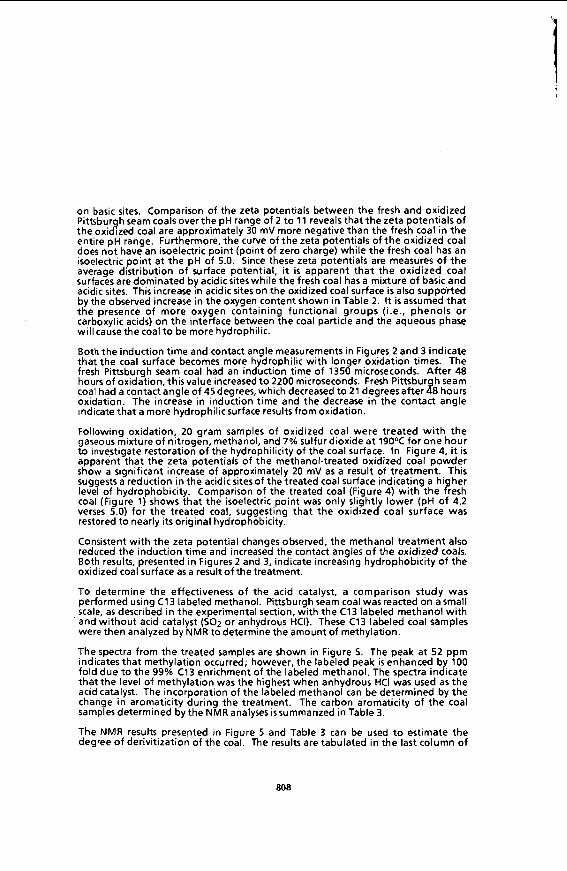
The spectra from the treated samples are shown in Figure 5. The peak at 52 ppm indicates that methylation occurred; however, the labeled peak is enhanced b 100 fold due t o the 99% C13 enrichment of the labeled methanol. The spectra ideate that the level of methylation was the highest when anhydrous HCI was used as the acid catalyst. The incorporation of the labeled methanol can be determined by the change in aromaticity during the treatment. The carbon aromaticity of the coal samples determined by the NMR analyses is summarized in Table 3.
The NMR results presented in Figure 5 and Table 3 can be used t o estimate the degree of derivitization of the coal. The results are tabulated in the last column of
808
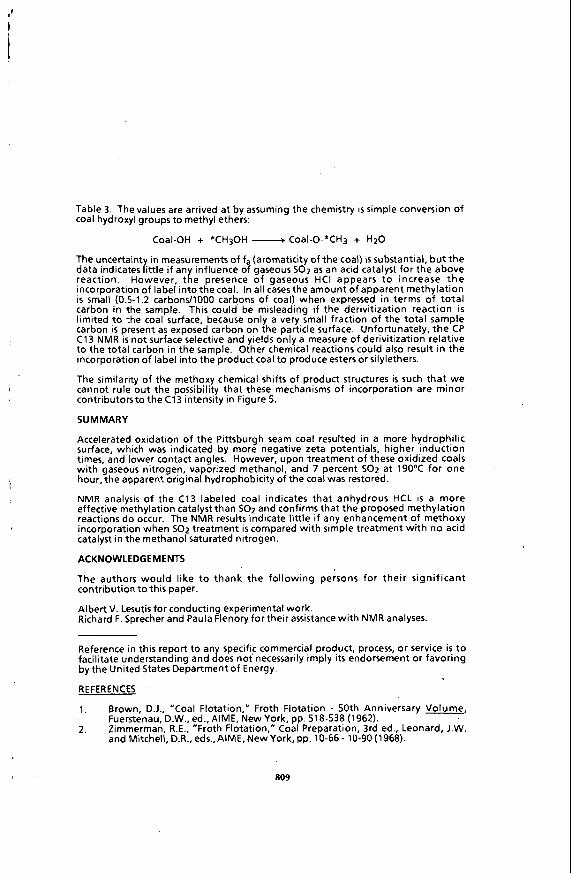
Table 3. The values are arrived at by assuming the chemistry is simple conversion of coal hydroxyl groups t o methyl ethers:
Coal-OH + *CH30H ---+ Coal-O-*CH3 + H2O
The uncertainty in measurements of fa (aromaticity of the coal) is substantial, bu t the data indicates little if an influence of gaseous SO2 as an acid catalyst for the above reaction. However, t t e presence of gaseous HCI appears t o increase t h e incorporation of label into thecoal. In all casesthe amount of apparent methylation is small (0.5-1.2 carbons/1000 carbons of coal) when expressed in terms o f total carbon in the sample. This could be misleading if the derivitization reaction is limited to the coal surface, because only a very small fraction of the total sample carbon is present as exposed carbon on the particle surface. Unfortunately, the CP C13 NMR is not surface selective and yields only a measure of derivitization relative t o the total carbon in the sample. Other chemical reactions could also result in the incorporation of label into the product coal t o produce esters or silylethers.
The similarity of the methoxy chemical shifts of product structures is such that we cannot rule out the possibility that these mechanisms o f incorporation are minor contributorsto the C13 intensity in Figure 5.
SUMMARY
Accelerated oxidation of the Pittsburgh seam coal resulted in a more hydroph,ilic surface, which was indicated by more negative zeta potentials, higher induction times, and lower contact angles. However, upon treatment of these oxidized coals with gaseous nitrogen, vaporized methanol, and 7 percent SO2 at 190°C for one hour, the apparent original hydrophobicity of the coal was restored.
NMR analysis of the C13 labeled coal indicates that anhydrous HCL is a more effective methylation catalyst than SO2 and confirms that the proposed methylation reactions do occur. The NMR results indicate little if any enhancement of methoxy incorporation when SO2 treatment is compared with simple treatment with no acid catalyst in the methanol saturated nitrogen.
ACKNOWLEDGEMENTS
The authors would like t o thank the following persons for their significant contribution t o this paper.
Albert V. Lesutis for conducting experimental work. Richard F. Sprecher and Paula Flenory for their assistance with NMR analyses.
Reference in this report t o an specific commercial product, process, or service is to facilitate understanding and &es not necessarily imply its endorsement or favoring by the United States Department of Energy.
REFERENCES '
1.
2.
Brown, D.J.. "Coal Flotation." Froth Flotation - 50th Anniversary Volume, Fuerstenau, D.W., ed., AIME, New York. pp. 518-538 (1962). Zimmerman, R.E., "Froth Flotation," Coal Preparation, 3rd ed., Leonard, J.W. and Mitchell, D.R., eds.,AIME,NewYork, pp. 10-66- 10-90(1968).
809

3.
4.
5.
6.
7.
8.
9.
10.
11.
12
13.
14. 15. 16. 17. 18. 19.
20.
21
22.
23
24.
25. 26.
Baker, A.F., Miller K.J. and Deurbrouck, A.W., "Two-Stage Flotation Selectively Floats Pyrite from Coal," Coal Mining and Processing, pp. 44-46 and 56 (August 1973). Mehrotra, V.P., Sastry, K.V.S. and Morey, B.W., "Review of Oil Agglomeration Techniquesfor Processing of Fine Coals," Int. J. Min. Proc., Vol. 11.. pp. 175- 201 (1983). Keller. D.V., "The Otisca Process of Preparation and Dewatering of Fine Coal," Proceedings o f the Consolidation and Dewatering o f Fine Particles Conference, University of Alabamz, pp. 152-71 (August 10-12, 1982). Chiang, S.H. and Klinzing, G.E., Process of Removing Mineral Matter from Coal," US. Patent Number 4,613,429 (September 23, 1986). Attia, Y.A., Conkle, H.N. and Krishnan, S.V., "Selective Flocculation Coal Cleaning for Coal Slurring Preparation," in Proc. 6th Int. Symp. Coal Slurry Combust., pp. 582-97 (1984). Attia, Y.A., "Cleaning and Desulfurization of Ultrafine Coal Suspensions by Selective Flocculation," Processing and Utilization of High Sulfur Coals, Attia, Y.A. ed., Elsevier (1985). Inculet, I.I., "Electrostatic Mineral Separation," Research Studies Press, John Wiley and Sons, Inc., N.Y. (1984). Advanced Energy Dynamics, Inc., "Dry Electrostatic Cleaning of Ohio Coals," Final Report, Grant No. 10-85-016, Ohio Coal Development Office of the Ohio Department o f Development (March 1987). Chiang, S.H. and Venkatadri. R. Effect of Surface Property on Fine Particle Dewatering," Proc. 4th World Congress on Filtration, Ostend. Belgium (April
Dinger, D.R., Funk, J.E. Jr., and Funk, J.E. Sr., "Rheology of a High Solids Coal Water Mixture: Co-AI," Proc. Fourth International Symposium on Coal Slurry Combustion, Orlando, FL., Pittsburgh Energy Technology Center, Pittsburgh, PA (1982). Tsai, S.C. and Knell, E.W., "Rheology and Its Effects on Atomization of Coal Water Slurry," First Annual Pittsburgh Coal Conference, Pittsburgh, PA, September 17-21 (1984). Rosenbaum, J.M., Ph.D.Thesis, U.C. Berkeley (1981). Abdel-Baset, Z., Given, P.H. and Yarzab, R.F., Fuel Vol. 57, p: 95 (1978). Teo, K.C., Finora, 5. and Leja, J., Fuel Vol. 61, p. 71 (1982). Schafer, H.N.S., Fuel Vol. 49, p. 271 (1970). Lyengar, M.S. and Lahiri, A., Fuel 36 (3). p. 286 (1957). Ruberto, R.G. and Cronauer. D.C., in: Organic Chemistry of Coal, (J.W. Larsen, ed.), ACS Symposium Series, 71, p. 50 (1978). Attar, J., 'Coal Demineralization and Depyritization Process," U.S. Patent 4,597,769 (1986). Attar, J., "Coal Demineralization and Depyritization Process," US. Patent 4,597,769 (1986). Sven-Nillson, I., "Effect of Contact Time Between Mineral and Gravitational Collosion Efficiencies for Single Collectors a t Intermediate Reynolds Numbers," J.Colloid and Interfacqsci., Vol94, No. 2, pp. 328-335 (1934). Eigeles, M.A. and Volova, M.L., Kinetic Investigation of Effects of Contact Time Temperature and Surface Condition on the Adhesion of Bubbles t o Mineral Surfaces," in Proc. 5th International Mineral Processing Congress, IMM. London, pp. 271-284(1960). Brady, G.A. and Gau er A W , Properties of Coal Surfaces," Ind. Eng. Chem., Vo132. p. 1599(19403. ' . '
Horsley, R.M. and Smith. H.G., Fuel Vol. 30, p. 54(1951). Sun. S.C.,TransAIME, Vol. 199, p. 67 (1954).
20-24, 1986).
810
27. Aplan, F.F., "Examining The Floatability of Western Coals," Geology, Mining, Extraction and the Environment, AIME, New York, NY, pp. 380 (1983).
28. Wark, I.W. and Cox,A.B.,Trans.AIME,Y?I 112, p. 189 (1934). 29. Bouwman, R., and Ivo L.C. Freriks, Low Temperature Oxidation o f a
Bituminous Coal. Infrared Spectroscopic Study of Samples from a Coal Pile," Fuel, Vol. 59, pp. 315-322 (May 1980).
30. Rhoads, C.A., Senftle, J.T., Coleman, M.M., Davis, A. and Painter, P.C., Further Studiesff Coal Oxidation," Fuel, Vol. 62. pp. 1387-1392 (Dec. 1983).
31. Gethner, J.S., Thermal and 'ox idat ion Chemistry o f Coal a t Low Temperatures," Fuel Vol. 64, pp. 1443-1446 (Oct. 1985).
32. !uffman, G.P., Huggins, F.E., Dunmyre, G.R., Pignocco, A.J. and Lin, M.C., Comparative Sensitivity of Various Analytical Techniques to the Low-
Temperature Oxidation of Coal," Fuel. Vol. 64,, pp. 849-856 (June 1985).
TABLE 1: ULTIMATE ANALYSIS OF AS-RECEIVED PllTSBURGH SEAM COAL, GIVEN AS PERCENT BY WEIGHT
Moisture Carbon Hydrogen Nitrogen Sulfur Ash Oxygen (by difference)
1.3 78.1 4.9 1.5 1.2 5.5 8.1
TABLE 2 : OXIDATION OF PIITSBURGH SEAM COAL AT 125 C
TIME (HRS.) OXYGEN CONTENT (Wt.%p 0 8.1 4 8.5 8 8.5 24 9.9 48 10.8
*WEIGHT DIFFERENCE METHOD
-
TABLE 3 : EXPERIMENTAL RESULTS OF C13 LABELED METHANOL-TREATED COALS
COALSAMPLE AROMATICITY (+/- 0.02) C13/1000 CARBONS
UNTREATED 0.71 NO AClDtCATALYST * 0.68 7 % SO2 0.68 7%HCL' 0.64
_ _ _ _ 0.5 0.5 1.2
ALLTREATMENTS PERFORMED IN THE PRESENCE OF C13 LABELED METHANOL AND NITROGEN AT 190°C FOR ONE HOUR
811
7 I I I 1 I I 1 -
-70 -80 -90 J
- -
2 3 4 5 6 7 8 9 10 I I
h I
Loxidotian followed by -
PH
Figure 1. Ellect of Oxldation on Zeta Potential of Pittsburgh Seem Coal.
dx idat ion only
I600
Methanol treatment 1200 @ -
1 I I 0 IO 20 30 40 50
HOURS OF OXIDATION @ 125°C
Figure 3. Effect of Methanol Treatment on the Contact Angles of Oxidized Pittsburgh Seam Coal.
812
-70 - 2 3 4 5 6 7 8 9 1 0 1 1
PH
Figure 4. Effect of Methanol Treatment on Zeta Potential of Oxidized Pittsburgh Seam Coal.
I 1 I 4 150 100 50 0
Comparison of Acid Catalysts lor C" Methanol-Treated Pitlsburgh Seam Coal Coal A . No Catalyst Presence Coal B . 7% SO, Coal C . 7% Anhydrous HCL
PPM Figure 5.
813
'I
GLASS TRANSITION TEMPERATURE OF MODIFIED COALS
Thomas K. Green, Wei-Ping Pan, Michael R. Clark Department of Chemistry
Western Kentucky University Bowling Green, KY 42101
Keywords: coal, glass transition, hydrogen bonding
INTRODUCTION
Coals are macromolecular solids (1). Although they are not polymers in the sense they possess a repeat unit, they do possess several properties typical of synthetic crosslinked macromolecular networks ( 2 ) . The crosslinks are thought to be covalent in nature. Hydrogen bonds ( 3 , 4 ) and intermolecular polarization forces (5,6) can be important associative forces as well.
Coals behave as glassy materials at room temperature ( 2 ) . In the glassy state, macromolecular motion is impeded and only short segmental motion of the polymer chain is possible. The glassy state of a material is characterized by its glass transition temperature, T I the temperature at which the polymer changes from a glass to a grubber. A rubber is characterized by significant macromolecular mobility compared to the glassy state. The practical utility of polymers and their different properties depend heavily on their glass transition temperatures. Thus, an important area of research is to understand how different molecular features affect the glass transition temperature.
This research is based on the premise that the glass transition temperature is a fundamental property of coals as well, and that it may have an important relation to several other coal properties. For example, the diffusivity of organic solvents in polymers increases by several orders of magnitude at the glass transition temperature (7). If the same concept can be applied to coal, the advantages of lowering the glass transition temperature of coal to enhance coal reactivity are obvious, particularly if the reaction is thought to be diffusion-controlled. Peppas & d. have demonstrated that coals swollen with pyridine exhibited lower glass transition temperatures than unswollen coals ( 8 ) . In this research, we are primarily concerned with the impact of the network of hydrogen bonds in coals on their glass transition temperatures. Both differential scanning calorimetry (DSC) and thermomechanical analysis (TMA) were utilized to establish the importance of hydrogen bonding to T, for two Argonne premium coals.
EXPERIMENTAL
samule Preparation. Argonne premium Illinois and Wyodak coals were obtained in sealed ampoules from Argonne National Laboratory. Both Coals were dried overnight under vacuum at 105'12. Analysis found: Illinois #6; C, 65.6%; H, 4 . 7 % ; N, 1.2%: Wyodak; C, 67.5%; H, 4 . 9 9 % ; N, 0 .84%. The coals were alkylated according to the method of Liotta ( 3 ) using tetra-a-butylammonium hydroxide and the appropriate alkyl iodide in THF. One sample was exposed to THF
a14
i
with no alkylating agent and is identified as the THF blank. Both elemental and IR analysis confirmed that alkylation had occurred.
Differential Scannina Calorimetry fDSCl. The DuPont 910 DSC was used to measure the glass transition temperatures of the samples. Samples were heated from ambient to 600'C at a heating rate of 10'C/min. The system was purged with nitrogen at a rate of 100 ml/min to provide an inert atmosphere. Sample sizes of 5 mg or less were used. The DuPont 2000 Thermal Analysis System was used to analyze the data. Heat flow was plotted as a function of temperature. The glass transition temperature is indicated by a change in the baseline curve in a negative direction. The analysis package identified the inflection point of the change in the curve and this inflection was reported as T,.
Thermal aravimetric analvsis fTGAl. The Shimadzu HT 50 TGA was used to monitor weight loss as a function of temperature. The samples were run under nitrogen at a flow rate of 100 mL/min and heated from ambient to 550'C at a heating rate of lO"C/min.
Thermomechanical Analvsis ITMAL. The DuPont 943 TMA was employed to assess the softening characteristics of the coals. The TMA uses a weighted probe that will penetrate the sample due to the softening which indicates the onset of the glass transition. Probe displacement is plotted as a function of temperature and the softening point is indicated by a negative probe displacement. The macroexpansion probe was used on the TMA. The coal samples were obtained in powdered form. Flat-bottom aluminum DSC pans were used to hold the samples. The coal powder was packed into the pans to a thickness of about 2-3 mm. Typical sample weights were about 20 mg. The pans were then placed in the TMA under a 100 g weight load. This was done to ensure that settling of the sample would be complete. Probe displacement was monitored as a function of time at ambient temperature to insure that the sample was well-packed into a pellet. A 10 g weight was then applied and the cell was purged with nitrogen at a rate of 300 mL/min to obtain an inert environment. The sample was heated at a rate of 10'C/min to a temperature just below the temperature of significant weight loss as indicated by the TG curves.
RESULTS
Elemental Analvsis. The 0-alkylated coals were analyzed for carbon, hydrogen, and nitrogen. The hydrogen/carbon ratios for the various coals were consistent with the addition of approximately 6 alkyl groups per 100 carbons for the Illinois #6 coal. For the Wyodak coal, elemental analysis indicated addition of approximately 8 methyl groups per 100 carbon. FT-IR analysis of the 0-alkylated coals indicated reaction had occurred as evidenced by the increased C-H absorption at 2900 cm-', reduction of the 0-H absorption at 3300-3600 cm-', and the appearance of an absorption at 1700 cm" which is attributable to the C=O of esters formed from carboxylic acids.
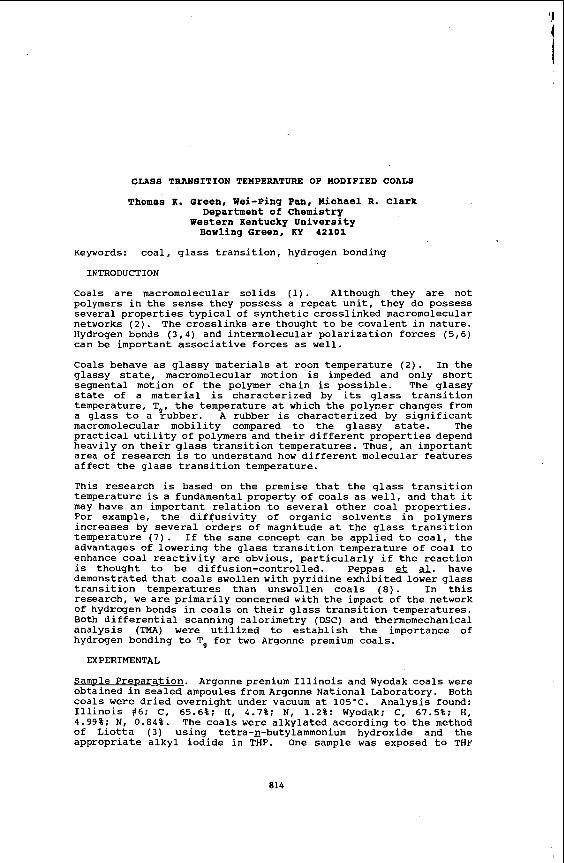
DSC Results. A typical DSC thermogram obtained using the dry, whole Illinois #6 coal is presented in Figure 1. Note that there
815

is an increasing negative heat flow into the sample relative to the aluminum oxide reference. The glass transition is identified by the slope shift that occurs near 300'C. Its onset temperature of 295.c was reported as T. These results are consistent with those of peppas & &. for a %oal of similar rank ( 8 ) .
The results for both coals and their alkylated derivatives are summarized in Table I. For the Illinois #6 coals, all reported values are the average of at least five measurements, except for the THF blank (no alkylating agent), which is the average of only two measurements. For the Wyodak coals, only three measurements were made. The effect of 0-methylation is to decrease T by 1OO'C for the Illinois 66 coal and 75'C for the Wyodak coal. $he effect of the alkyl chain length is not significant for the Illinois #6 coal, although there is clear tread of decreasing T with increasing chain length. Exposure of the Illinois #6 coal'to THF solvent results in a lower T, by 50'C.
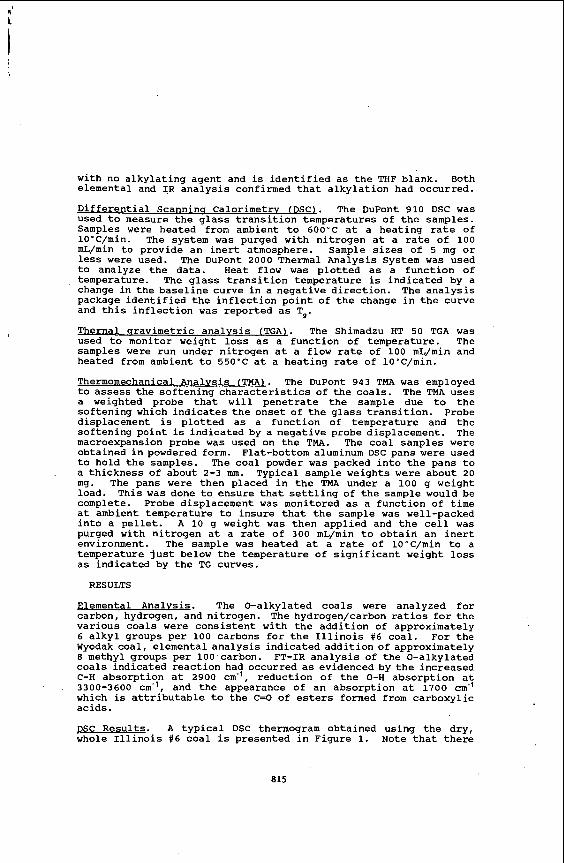
TG Results. The percent weight loss versus temperature curves for the Illinois #6 coals are presented in Figure 2. Weight loss for the dry, whole coal and the THF blank (no alkylating agent) is not significant until nearly 400'C, which is significantly above the reported T I s for these coals. This result indicates that no major thermal debradation of the coal occurred before T,, consistent with the results of Peppas & ( 8 ) .
Initial weight loss for the 0-alkylated coals occurs at much lower temperatures than the whole coal. Approximately 5-10% of the weight loss occurs in the range of 200-35O'C for these coals. An additional 15-25% weight loss occurs in the region of 350-550'12. These coals are clearly much more volatile than the whole coal, which is consistent with other studies ( 3 ) . It appears that these Coals are in a rubbery state, however, before any significant weight loss occurs, since their Tg8s are all near 200'C as measured by DSC.
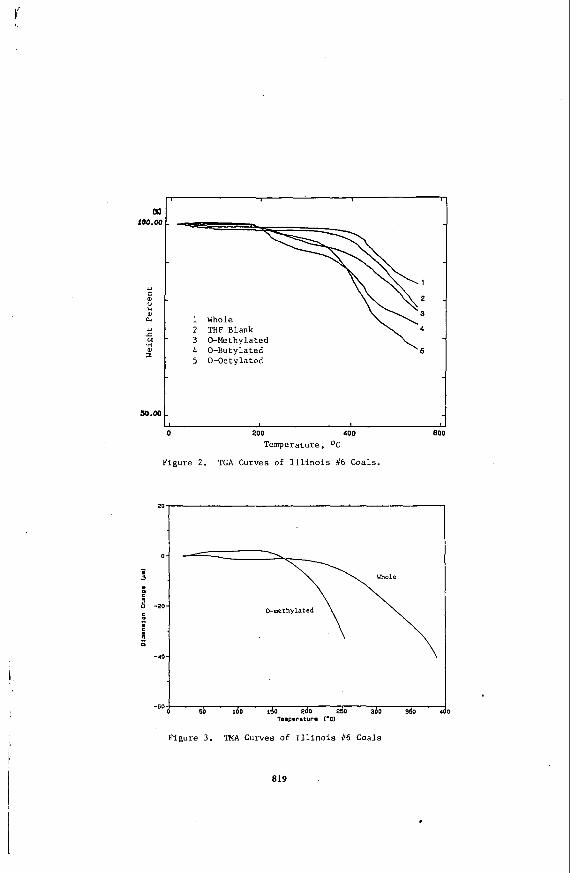
TMA Results. The whole and 0-methylated coals were analyzed by TMA in order to assess their softening characteristics. The DSC results indicated that the 0-methylated coal should soften at a much lower temperature than the whole coal. This expectation was confirmed. The results on the Illinois #6 coals are shown in Figure 3, where the probe displacement (dimensional change) is plotted against temperature. Note that the 0-methylated coal softens at a much lower temperature than the whole coal. Similar results were obtained on the corresponding Wyodak coals.
DISCUSSION
The lowering of T by 0-methylation of the coal is most probably attributed to the 'disruption of the hydrogen bond network known to exist in these coals. The hydrogen bonds serve as crosslinks between macromolecular chains and represent an important attractive force that should restrict chain mobility. That their disruption by 0-alkylation lowers T of the coal is therefore not surprising. The effect of THF solvatfon on T is also substantial, although not as large as 0-alkylation. Tgis effect might attributed to a
816

partial disruption of the hydrogen bond network by THF, which is a known hydrogen bond acceptor. THF is also expected to swell the coal substantially. When the THF is removed, not all of the disrupted hydrogen bonds are expected to reform.
The length of the added alkyl group appears to have only a Small effect on T , contrary to our expectations. We believed that the addition 0% longer alkyl groups might disrupt noncovalent interactions other than hydrogen bonding that might exist between the macromolecular chains, thereby lowering T, even more. Either these interactions are not important or 0-alkylation fails to disrupt them. In the future, we plan to examine the effects of C- alkylation (5) on the glass transition temperatures of coals to explore this aspect more fully.
REFERENCES
1. Green, T.; Kovac, J.; Brenner, D.; Larsen, J. W. in "Coal Structure," Meyer, R. A., Ed.: Academic Press, New York, 1982,
2. Treloar, L. R. G. "The Physics of Rubber Elasticity," Clarendon
3 . Liotta, R.; Rose, K.; Hippo, E.; J. Ora. Chem. 1981, 46, 277-
p 199.
Press, Oxford, 1975.
283.
4. Larsen, J. W.; Green, T. K.; Kovac, J. J. Orq. Chem. 1985, 50,
5. Miyahe, M.; Stock, L. M. Enerqv Fuels 1988, 2, 815.
6. Quinga, E. M. Y.; Larsen, J. W. Enerqv Fuels 1987, 1, 300-304.
7. Crank, J.; Park, S. J. "Diffusion in Polymers,qt Academic Press,
4729.
London, 1968.
8 . Lucht, L. M.; Larsen, 3 . M.; Peppas, N. A. Enerqv Fuels 1987, 1, 56-58.
Acknowledgements: We would like to acknowledge the generous support of Shimadzu Instruments for loan of the TGA HT 50 and DuPont Instruments for financial support for the TMA and DSC. M. Clark gratefully acknowledges the ACS Polymer Division for a Summer Research Fellowship.
817
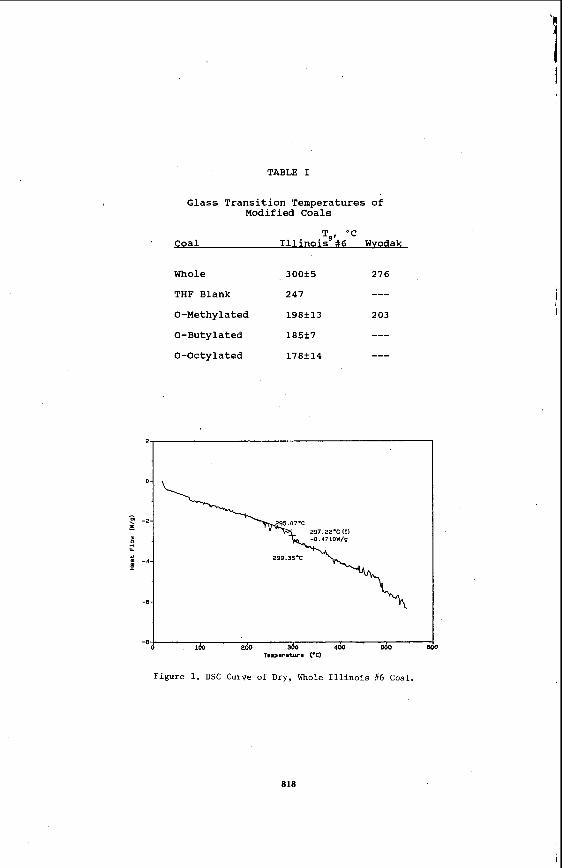
TABLE I
Glass Transition Temperatures of Modified Coals
T , 'C ' Coal I1 1 inois' # 6 Wvodak
Whole 300+5 276
THF Blank 247
0-Methylated 198+13 203
---
0-Butylated 185+7 --- 0-Octylated 178f14 ---
2 THF Blank 3 0-Methylated 4 0-Butylated 5 0-Octylated
200 400
Temperature, OC
Figure 2. TGA Curves of Illinois //6 Coals.
81
20
I
-60
Figure 3. TMA Curves of Illinois #6 Coals
819
,
DISTRIBUTION OF ORGANIC SULFUR IN RAW AND SOLVENT EXTRACTED COALS
John T. Riley, Mingshe Zhu. D. Scott Coffey, Sarah G . Sadler. Jeff M. Stidam, and Harold D. Graham, Jr.
Center for Coal Science Department of Chemistry
Western Kentucky University Bowling Green, KY 42101
Key words: organic sulfur, solvent extracted coals, bituminous coal
INTRODUCTION
The removal of organic sulfur from coal presents the most serious challenge in coal desulfurization. Before efficient chemical processes can be developed for the removal of organic sulfur, information on the nature and distribution of sulfur-containing organic compounds in coal is needed.
The general nature of the organosulfur constituents known to exist in coal and coal-derived products have been briefly reviewed (1-4). Most of the literature about organosulfur compounds in coal is qualitative in nature. It is generally accepted that the predominant organic sulfur species present in coal are aromatic groups containing thiophenic sulfur. However, the percentages of thiophenic sulfur in various types of coals are not known. The presence of sulfur containing functional groups such as thiols and sulfides invarious coals is also accepted by most coal scientists. However, the percentages of these groups in the various types or ranks of coal are not known. The presence of disulfide groups (R-S-S-R') in some coals is not generally accepted by coal scientists, although there is evidence that such groups may be present in coals (5). The quantitative determination of the various organic sulfur groups present in different types of coal is an area of coal research that has not received the attention it deserves.
Most of the work on characterizing the organic sulfur compounds in coal has been concentrated on studies of the thiophenic compounds, which are the ..most stable of the organic species present in coal. The thiophenic sulfur compounds are also the most difficult organosulfur compounds to remove from coal. Evidence in the literature and from our own work indicates that as much as 45% of the organosulfur compounds in mid-rank coals is aliphatic in nature, and contains various sulfidic and thiolic groups (5-10). Attar and coworkers used thermokinetic analysis to determine the proportions of thiolic, thiophenolic, aliphatic sulfidic, aryl sulfidic, and thiophenic sulfur in five coals ( 2 , 3 , 6 ) . These investigators estimated that 15-30% of the organic sulfur in coal is sulfidic, while 30-55% of the organic sulfur in lignite and 40-60% in bituminous coals is thiophenic. The remaining organic sulfur is assumed to be thiolic in nature. Yurovski used a classical approach to determine the types of organosulfur compounds in alcoholic solutions of phenol extracts of coal (5). In a study with a Russian coal Yurovski determined that about 48% of the organosulfur compounds in the coal were thiophenic in nature, while the remaining organosulfur compounds consisted of a mixture of thiols, sulfides, and maybe disulfides. George and Gorbaty used x-ray absorption near-edge structure (XANES) spectroscopy to study the distribution of sulfur groups in a Rasa lignite and an Illinois No. 6 bituminous coal ( 8 - 9 ) . They concluded the lignite contained 30 ? 10% sulfidic and 70 f 10% thiophenic sulfur ( E ) , whereas the Illinois No. 6 coal contained 60 f 10%
820
sulfidic and 40 f 10% thiophenic sulfur (9). Huffman and coworkers used x-ray absorption fine structure (XAFS) spectroscopy to examine the structures of sulfur groups in several bituminous coals (10). They concluded that the organic sulfur compounds in bituminous coals were predominantly thiophenic in nature. The results for bituminous coals reported by Gorbaty and Huffman differ significantly.
Many of the difficulties encountered in the investigations of solid coals are reduced in the analysis of extracts and reaction products of the coals. Tetrahydrofuran, pyridine, and dimethylformamide are quite useful solvents for the extraction of coals. Buchanan reported the sequential extraction of pristine Illinois No. 6 coal, APCSP-3, with toluene, tetrahydrofuran, dimethylformamide, and pyridine provided an extract that contained 28% (by weight) of the coal and 29% of the organic sulfur (11). Calkins and coworkers used other solvents for selective sulfur extraction. He found that tetrahydrofuran was superior to acetonitrile, ethylenediamine, and pyridine for the extraction of organic sulfur compounds from a Pittsburgh No. 8 bituminous coal (12-13). Buchanan and coworkers reported that hot perchloroethylene extracts elemental sulfur, formed in the oxidation of pyrite, from bituminous coals (14). They also reported that no appreciable amount of organic sulfur was extracted by perchloroethylene.
There is a considerable amount of information in the literature to indicate that organic sulfur compounds can be preferentially extracted from bituminous coals. In this paper we are reporting the differences between the organic sulfur content in 25 bitminous coals and residues of these coals after extraction with tetrahydrofuran and dimethylformamide.
EXPERIWENTAL
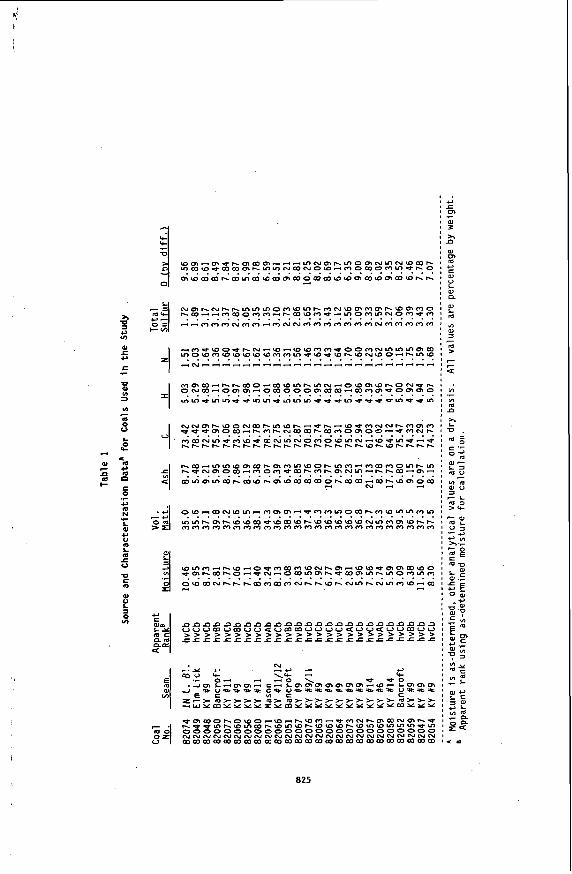
Most of the coals used in the study are from the western Kentucky (Illinois Basin) coal field. A list of the seams and ranks of the 25 coals are given in Table 1. Coal 82071 is from the eastern Kentucky (Appalachian region) coal field and coal 82074 is from the Indiana Lower Block seam, which is also part of the Illinois Basin. The coals were collected for a USDOE-sponsored project conducted at Western Kentucky University and stored under nitrogen after preparation (15). Most of the coals are clean products collected at preparation plants with coals 82071. 82073, and 82074 being run-of-mine samples.
The coals were subjected to standard analysis by ASTM methods (16), or methods with equivalent or better precision, as follows: proximate analysis using the LEG0 MAC-400 moisture, volatile matter, and ash analyzer (ASTM D 5142); ultimate analysis using the LEG0 CHN-600 carbon, hydrogen, and nitrogen analyzer and the LEG0 SC-132 sulfur analyzer (ASTM D 4239). Analytical data for the raw coals are given in Table 1 and data for extracted coals are given in Tables 2 and 3. Organic sulfur was determined by the direct determination method developed in this laboratory (17).
Solvent extractions of the coals were carried out using standard Soxhlet extraction assemblies at the atmospheric reflux temperatures of the two solvents employed, N.N-dimethylformamide (DMF) and tetrahydrofuran (THF). Prior to extraction, -60 mesh (250 pm) samples of each coal were vacuum dried at 60'C for six hours. Ten gram samples of dried coal in cellulose Soxhlet thimbles were then extracted for periods of 20-24 hours. The extracted coals were then rinsed with refluxing methanol in the Soxhlet apparatus for 5-6 hours and vacuum dried at 150°C until the samples reached a constant weight (6-10 hours). The extracted samples used in this study weredprepared by Lloyd and coworkers (15). The averages of the percent coal extracted in triplicate runs on the 25 coals by the two solvents are given in Table 4.
821

RESULTS AND DISCUSSION
As shown i n Table 1, the coals used i n the s tudy a r e predominantly high v o l a t i l e bituminous C (hvCb) coals . All except coals 82071and 82074 a r e from the western Kentucky coa l f i e l d s ( I l l i n o i s Basin) and a l l except coals 82071, 82073, and 82074 a r e washed coals . The t o t a l s u l f u r i n the raw coals ranged from 1.35% t o 3.65%, as reported on a dry bas is .
Extract ion of coa ls with organic solvents such as DMF and THF remove organic matter with subsequent increases i n the percent mineral matter i n the coal residues. The da ta i n Tables 2 and 3 show increases i n the ash contents of the coal res idues which a r e i n proportion t o the coal extracted by the solvents . The general decreases i n carbon, hydrogen, and v o l a t i l e matter percentages is consis tent with t h i s t rend. A comparison of the dry oxygen values i n Table 1 with those for the ex t rac ted coa ls i n Tables 2 and 3 show general increases i n oxygen upon ex t rac t ion w i t h the organic solvents . This is l i k e l y due t o the enrichment of oxygen-containing mineral matter i n the extracted coals .
The t o t a l s u l f u r values f o r the extracted coals increase from the enrichment of mineral mat ter ( p y r i t i c and s u l f a t i c s u l f u r forms) i n the residues, a s can be seen by comparing the t o t a l s u l f u r values f o r the raw coals i n Table 1 with those f o r the residues i n Tables 2 and 3. The increases i n t o t a l su l fur a r e grea te r for the DMF-extracted c o a l s than those f o r the THF-extracted coals . This i s t o be expected s ince the t o t a l mater ia l ex t rac ted by DMF (mean percent extracted - 24.8%) is grea te r than t h a t extracted by THF (mean percent extracted - 14.0%). When the organic s u l f u r values for the r a w coals a r e compared t o the organic sulfur values €or t h e DMF- and THF-extracted coa ls , one can see t h a t there Ls a reduction of the organic su l fur i n the extracted coa ls . The l a s t two columns i n Table 4 i l l u s t r a t e the magnitude of the reduction i n the organic s u l f u r values f o r the DMF- and THF-extracted coa ls , respect ively. The mean difference between the organic s u l f u r i n t h e raw coal and t h a t i n the DMF-extracted coa ls is 0 .19% (absolute) . This mean difference f o r the THF-extracted coals is 0.16%.
Using the mean organic su l fur values i n the raw c o a l s , the mean organic sulfur values i n the DMF- and THF-extracted coa ls , and the ex t rac t ion percentages, a mean value f o r the organic su l fur i n the coal e x t r a c t s can be ca lcu la ted . The meanvalue for the organic s u l f u r (daf bas i s ) i n the 25 coals i s 1.63%. The mean value f o r t h e organic s u l f u r (daf bas i s ) i n the DMF-extracted coals is 1.45% and f o r the THF-extracted coals i s 1.47%. With a mean ex t rac t ion percentage of 24.8% f o r DMF t h i s means t h e ca lcu la ted mean organic s u l f u r value i n the DMF ex t rac ts of the 25 coals i s 2.18%. Likewise, the mean ex t rac t ion percentage of 14.0 f o r THF can be used to c a l c u l a t e a mean organic s u l f u r value of 2.61% i n the THF ex t rac ts of the 25 c o a l s . The calculated organic s u l f u r values i n the ex t rac ts of the 25 coals represent a 33.7% enrichment of organic s u l f u r i n the DMF ex t rac ts and a 60.1% enrichment of organic su l fur i n the THF e x t r a c t s .
The lower percentage enrichment of organic s u l f u r i n the DMF ext rac ts compared t o tha t f o r t h e THF ext rac ts i s cons is ten t with the observations of other researchers. DMF e x t r a c t s a grea te r percentage of the coa ls (24.8%) than THF (14.0%). The f i r s t mater ia l extracted from coal is r icher i n s u l f u r , and possibly oxygen and ni t rogen, than the mater ia l removed as the ex t rac t ion proceeds (18).
The da ta i n Tables 1-4 were p lo t ted i n var ious ways i n attempts t o ident i fy any trends i n the rate of extract ion of organic s u l f u r from the 25 coa ls . The only apparent re la t ionships found were weak cor re la t ions between the organic sulfur extracted by the solvents and some of the other s u l f u r values for the coals . Figure 1 does ind ica te t h a t the r a t e of ex t rac t ion of organic s u l f u r from the coals using THF as the solvent may be dependent on the daf organic s u l f u r i n
822
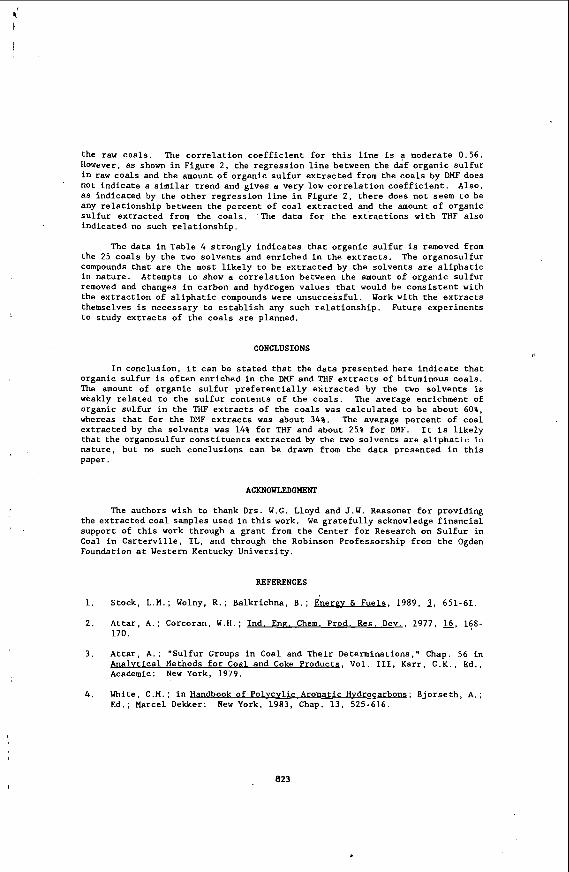
the raw coals. The correlation coefficient for this line is a moderate 0.56. However, as shown in Figure 2, the regression line between the daf organic sulfur in raw coals and the amount of organic sulfur extracted from the coals by DMF does not indicate a similar trend and gives a very low correlation coefficient. Also, as indicated by the other regression line in Figure 2, there does not seem to be any relationship between the percent of coal extracted and the amount of organic sulfur extracted from the coals. The data for the extractions with THF also indicated no such relationship.
The data i n Table 4 strongly indicates that organic sulfur is removed from the 25 coals by the two solvents and enriched in the extracts. The organosulfur compounds that are the most likely to be extracted by the solvents are aliphatic in nature. Attempts to show a correlation between the amount of organic sulfur removed and changes in carbon and hydrogen values that would be consistent with the extraction of aliphatic compounds were unsuccessful. Work with the extracts themselves is necessary to establish any such relationship. Future experiments to study extracts of the coals are planned.
CONCLUSIONS
In conclusion, it can be stated that the data presented here indicate that organic sulfur is often enriched in the DMF and THF extracts of bituminous coals. The amount of organic sulfur preferentially extracted by the two solvents is weakly related to the sulfur contents of the coals. The average enrichment of organic sulfur in the THF extracts of the coals was calculated to be about 6 0 % , whereas that for the DMF extracts was about 34%. The average percent of coal extracted by the solvents was 14% for THF and about 25% for DMF. It is likely that the organosulfur consrituents extracted by the two solvents are aliphatic in nature, but no such conclusions can be drawn from the data presented in this paper.
ACKNOWLEDGMENT
The authors wish to thank Drs. W.G. Lloyd and J.W. Reasoner for providing the extracted coal samples used in this work. We gratefully acknowledge financial support of this work through a grant from the Center for Research on Sulfur in Coal in Carterville, IL, and through the Robinson Professorship from the Ogden Foundation at Western Kentucky University.
REFERENCES
1. Stock, L.M.; Wolny, R.; Balkrichna, B.; Enerev h Fuels, 1989, 1, 651-61.
2. Attar, A,; Corcoran, W.H.; Ind. Ene. Chem. Prod. Res. Dev., 1977. 16, 168- 170.
3 . Attar, A,; "Sulfur Groups in Coal and Their Determinations," Chap. 56 in u, Vol. 111, Karr, C.K., Ed., Academic: New York, 1979.
White, C.M.; in Handbook of Polvcvlic Aromatic Hvdrocarbons; Bjorseth, A,; Ed.; Marcel Dekker: New York, 1983, Chap. 13, 525-616.
4 .
a23

5 .
6 .
7
8.
9.
10.
11.
12.
13.
14.
15.
16.
17.
18.
Yurovskii, A.Z.: Sulfur in Coals, Published for the U.S. Department of the Interior, Bureau of Mines and the National Science Foundation, by the Indian National Scientific Documentation Centre, New Delhi, 1974, 5 6 - 6 2 .
Attar, A,; Dupuis, F.; "Data on the Distribution of Organic Sulfur Functional Groups in Coals," in Coal Structure, Gorbaty, M.L., and Ouchi, D.. Eds., Advances in Chemistry Series 192, American Chemical Society: Washington, D.C., 1981.
Riley, J.T., et al., "Removal of Aliphatic Sulfur and Chlorine Compounds from Coal," Technical Reports 1-3, Center for Research on Sulfur in Coal, Carterville, IL, 1990.
George, G.N.; Gorbaty, M.L.; J. Am. Chem. SOC,. 1989, 111, 3182.
George, G . N . ; Gorbaty, M.L.; Kelemen, S.R.; PreDr. Pau. - Am. Chem. SOC.. Div. Fuel. Chem.. 1989, u, 738.
Huffman, G.P.; Huggins, F.E.; Mitra, S . ; Shah, N.; Pugmire, R.J.; Davis, G . ; Lytle, F.W.; Greegor, R.B.; Enerev & Fuels, 1989, 2, 200.
Buchanan, D.H.; Osborne, K.R.; Warfel, L.C.; Wanping, M.; Lucas, D.; Energv d Fuels, 1988, 2, 163.
Calkins, W.H.; Enerev h Fuels, 1987, 1, 59.
Calkins, W.H.; PreDr..Pau - Am. Chem. SOC.. Div. Fuel Chem.. 1985, m, 450.
Buchanan, D.H.; Chanen, C.; Puharich, K.; Warfel, L.C.; Hackley, K.C.; Kruse, C.W.; "Organic Sulfur Removal from Illinois Coal," Final Tech. Rept.. Center for Research On Sulfur in Coal, Carterville, IL, October, 1990.
Lloyd, W.G.; Reasoner, J.W.; Hower, J.C.; Yates, L.P.; Clark, C.P.; Davis, E.; Fitzpatrick, A . ; Irefin, A.; Jiminez, A , ; Jones, T.M.; Reagles, C.L.; Sturgeon, L.P.; Whitt, J.M.; Wild, G.D.; Predictors. of Plasticity in Bituminous Coal," Final Rept., USDOE Contract No. DE-FG22-81PC40793, February, 1984.
Annual Book of ASTM Standards, Vol. 5.05, her. SOC. for Testing and Materials, Philadelphia, PA (published annually).
Riley, J.T.; Ruba, G.M.; Lee. C.C.; "Direct Determination of Total Organic Sulfur in Coal," in Geochemistrv in Sulfur in Fossil Fuels, W.L. Orr and C.M. White, Eds., ACS Symposium Series No. 429, American Chemistry Society: Washington, D.C., 1990.
Buchanan, D.H.; Eastern Illinois University, Charleston, IL, private communication.
824
* U
c, In
al c +I
E
U
U
.r
a
4
M c
V L y.
I <
9 9 + E
a m 4 -
.r c, N
L c, 4
c 0
..-
m
U
4
a, L
In a
825

Coal No.
82074 82049
82048 82050
82077 82060
82056 82080
82071
82066
82051 82067 82076
82063
82061
82064
82073
82062
82057
82069
82058
82052
82059
82047
82054
Vol. Matt.
33 .O 33.5
34.1 37.6
33.7 33 .o 34.9
34.9 30.8
32.9 35.7 32.2 33.7
32.6
33.3
32 .O 31.6
33.2
30.1
31.3
31 .O 40.3
33.4
34.2
35.9
Table 2
Analytical Values' for DMF-Extracted Coals
Ash
10.28
6.90
11.92
7.74 10.17
10.67
10.34
7.99 9.41
11.55
7.86 12.50 10.69
10.39
13.82
9.74 12.36
11.09
26.64
12.33
23.46
9.28
11.96
13.64
10.39
c 72.44
74.50
67.26 72.22
71.40
71.18
70.60
71.10
74.64
67.14
69.04 69.08 68.91
68.46
65.50
69.74
70.90
70.33
56.12
71.18
56.53
70.47
69.01
67.54
69.40
H
4.62
4.76
4.52 4.75
4.52
4.42
4.80
4.71 4.64
4.64
4.89 4.74 4.64
4.21
4.47
4.27 4.49
4.54
3.87
4.55
4.16
5.22 4.39
4.39
4.73
1.72
7.70
1.83 2.14
1.64
2.00
2.41
1.55 2.12
2.02
2.06 1.54 1.75
1.72
1.95
2.30
1.37
1.60
1.65
1.53
1.61
2.14
1.98
1.69 1.83
Total Sulfur
1.74
2.14
3.68 3.54
3.57
3.12
3.13
3.31
1.52
3.21
2.94 3.26 3.60
3.40
3.68
3.13
4.24
3.23
3.56
3.07
3.55
3.42
3.91
3.96
3.55
0 (bf dLfE.1
9.19
4.00
10.80
9.61 8.69
8.60
8.72
11.33
7.68
11.44
13.21 8.88
10.41
11.82
10.59
10.83
6.83
9.21
8.16
7.35
10.70
9.46
8.75
8.79
l0,.09
I

Table 3
Analytical Values* for THF-Extracted Coals
Coal Vol. Total N Sulfur 0 (Iv dif€.Z -- & M a t t . & A
82074
82049
82048
82050
82077
82060
82056
82080
82071
82066 82052 82067 82076
82063
82061
82064
82073 82062
82057
82069
82058
82052
82059
82047
82054
28.4
36.0
36.6 39.4
34.5
33.2 35.2
35.7
32.4 33.9
39.7 32.4 34.5
33.2
33.7
32.3
32.7
33.7 31.2
32.3
33.1
39.2
30.6
36.5
36.0
7.95
5.94 10.47
6.78
8.89
9.11
9.56
7.18
7.70
10.80 7.14
10.18 9.84
9.37
12.25
8.95 9.85
9.96
23.53
9.73
19.59
8.40
9.68
11.99
9.50
72.09 4.79
73.45 5.46 68.62 5.07
72.55 5.43
71.94 4.71 78.138 4.03
70.27 5.17
73.37 5.03
77.11 5.20 70.19 4.80
71.66 5.52 73.44 4.92
71.23 5.00
71.17 4.69
69.93 4.68 70.66 4.41
73.86 4.91
72.18 4.71
60.67 4.16
74.29 4.96
60.76 4.45
71.69 5.43
66.89 3.13
66.83 4.85 70.27 5.18
1.39 1.42 12.36
1.89 2,05 11.21
1.51 3.41 10.92
1.58 3.28 10.38
1.33 3.60 9.53
1.74 2.99 3.25
2.10 3.22 9.68
1.54 3.48 9.40 1.90 1.47 6.62
1.70 3.27 9.24
1.78 3.13 10.77 1.46 3.10 6.90 1.66 3.82 8.45
1.63 3.45 9.69
1.72 3.69 7.73
1.96 3.29 10.73 1.47 3.89 6.02
1.91 3.28 7.96 1.44 3.48 6.72 1.59 2.77 6.66
5.78 3.34 6.08
1.38 3.29 9.81
1.71 3.37 15.25
1.49 3.62 11.22
1.95 3.56 9.54
a21

b
VI - m u U
e, m
2 % 0 'c
v)
a m
a
a
- > L e
in 0 c m L 0
U S
VI
- c
m
m
m e, S
V
0 0
S 0
e, 0 m L e,
- 5
~ m w o h o w o ~ w ~ h w m - ~ m ~ h m w ~ m h ~ h b u ~ I - w m w h w ~ ~ h w w w h w ~ w m m ~ b m 0 0 0 0 0 0 0 0 0 0 0 0 0 0 0 0 0 0 0 0 0 0 0 0 0 N N N N N N N N N N N N N N N N N N N N N N N N N w a m w m w w w w a w w m a w w w m w w w w w w w
aza
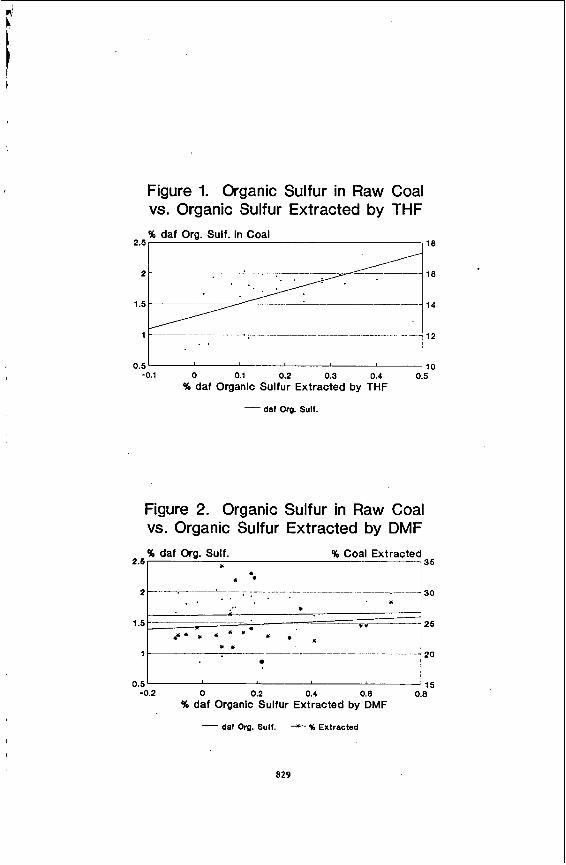
Figure 1. Organic Sulfur in Raw Coal vs. Organic Sulfur Extracted by THF % daf Org. Sulf. in Coal
2.5 I
2
1.5
1
0.5
0.5 ' ' 10 -0.1 0 0.1 0.2 0.3 0.4 0.5
% daf Organic Sulfur Extracted by THF
daf OrQ. Sulf. -
30 -- .- - - _ _ - - - _ ._ - - . . . . . . * * **---- 25 -___ --____
* * * +* ; * * * *
20 _ _ _ _ _ * I -__
15
Figure 2. Organic Sulfur in Raw Coal vs. Organic Sulfur Extracted by DMF % daf Org. Sulf. % Coal Extracted
* 2.5 I * **
829

EVALUATION OF COMBINATION FUELS FOR FLUIDIZED BED COMBUSTORS BY THERMAL ANALYTICAL TECHNIQUES
Wei-Ping Pan, U a r y Campbell, and John T. Riley,
Center f o r Coal Science Department of Chemistry
Western Kentucky University Bowling Green, KY 42101
Mingxu Zhang
Huainan Mining I n s t i t u t e Huainan, Anhui, China
Key works: thermogravimetry, coa l , municipal s o l i d wastes, f l u i d bed combustion
ABSTRACT
The object ive of t h i s study i s t o f ind su i tab le combinations of coa l f i n e s , municipal so l id waste (MSW), and limestone t o produce f u e l p e l l e t s for f lu id ized bed combustion systems. The coal f i n e s , MSW (paper) , and sorbent limestone were mixed i n d i f f e r e n t combinations and the v o l a t i l e matter and char contents of a l l mixtures, as well a s the or ig ina l mater ia l s , were evaluated by thermogravimetric analysis (TGA). Using d i f f e r e n t r a t e s of heat ing and var iable atmospheres, information was obtained t h a t can be useful i n predict ing the combustion behavior and ef f ic iency of the combination fue ls . Optimum limestone content can be determined by s e l e c t i v e l y introducing CO, during the f i n a l s tages of the combustion process t o check for excess CaO. The use of combined techniques such as TGA, d i f f e r e n t i a l thermal analysis (DTA), and TGA-FTIR can be u t i l i z e d to determine de ta i led information on the combustion and thermal proper t ies of the combination f u e l s .
INTRODUCTION
More than 150 mi l l ion tons of municipal s o l i d waste (MSU), a r e generated i n the United S t a t e s each year . This excessive amount of generated waste, combined with decreases i n l a n d f i l l s i t e s , causes ser ious environmental problems and forces the establishment of programs f o r reducing the volume of waste deposited i n l a n d f i l l s .
Mass burning of unprocessed MSU and preparat ion/f i r ing of refuse-der ived fuel (RDF), a r e the two mainmethods cur ren t lybe ing evaluated for waste-to-energy technologies ( 1 , 2 ) . There a re several methods used f o r t h e f i r i n g of RDF. The chief method employed i n t h i s study is f lu id ized bed combustion. Fluidized bed combustionsystems a r e p a r t i c u l a r l y s u i t e d t o w a s t e fue ls because of t h e i r a b i l i t y t o burn low grade and var iab le fue ls as wel l as absorb s u l f u r oxides through the use of sorbents .
Fluidized bed combustion systems have been constructed i n the U . S . , Europe, and Japan, f o r the burning of RDF alone o r combinations of RDF and wood waste ( 3 ) . However. there is l i t t l e o r no information ava i lab le regarding RDF f i r i n g i n the presence of coal i n f lu id ized bed combustion systems, or c o - f i r i n g of wood wastes with coa l . There have been several s tud ies conducted on t h e preparation of fuel
830
pellets using coal fines and limestone, which serves as a sorbent for sulfur oxides (4-6). This information was valuable in the evaluation of the combustion performance of fuel pellets prepared from coal fines, MSW or wood waste, and limestone sorbent.
The burning profiles of coal and RDF are quite different, but there is a high probability that blends of these two fuels, when co-fired under the right conditions, perform suitably as a boiler fuel. This conjecture forms the basis of the study reported in this paper.
In general, normal production of coal yields millions of tons of coal fines each year (about 20% of total yield). These fines, however, can not be sold because of handling problems. The cost of recovery of these fines is small compared to the mining of coal. Coal fines are an excellent source of an energy- rich fuel that can be blended with RDF to produce pellets suitable for use in fluidized bed combustion systems.
When coal contains high amounts of organic sulfur it is impossible to remove the sulfur using conventional physical cleaning methods. Fluidizedbed combustion systems utilizing coal-limestone-fuel mixtures have the potential for resolving this limitation since limestone, which is abundant in nature, can be used as a sorbent for emitted SO,.
SAMPLE PREPARATION AND RESULTS
T h l
The materials used for this study are coal fines (Illinois #6), Kentucky agricultural limestone, and newspaper. All samples were prepared and analyzed in Western Kentucky University's Coal and Fuel Characterization Lab. The three materials were studied by thermogravimetric analysis (TGA) to assess their thermal behavior. The TGA experimental conditions used were 10 mg sample size, air atmosphere with a flow of 50 mL/min, and a heating rate of 2O'C/min. The instrument used was a Shimadzu HT 1500 TGA Thermogravimetric Analysis System.
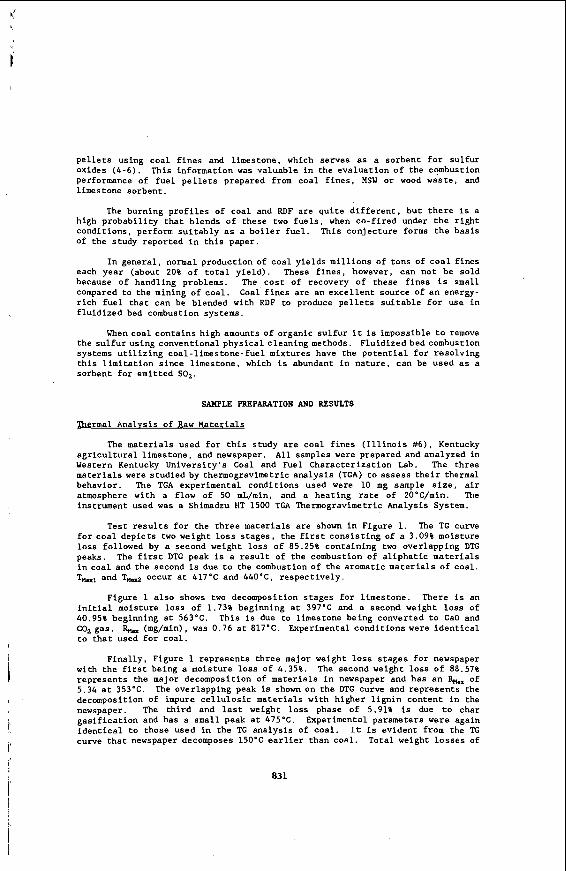
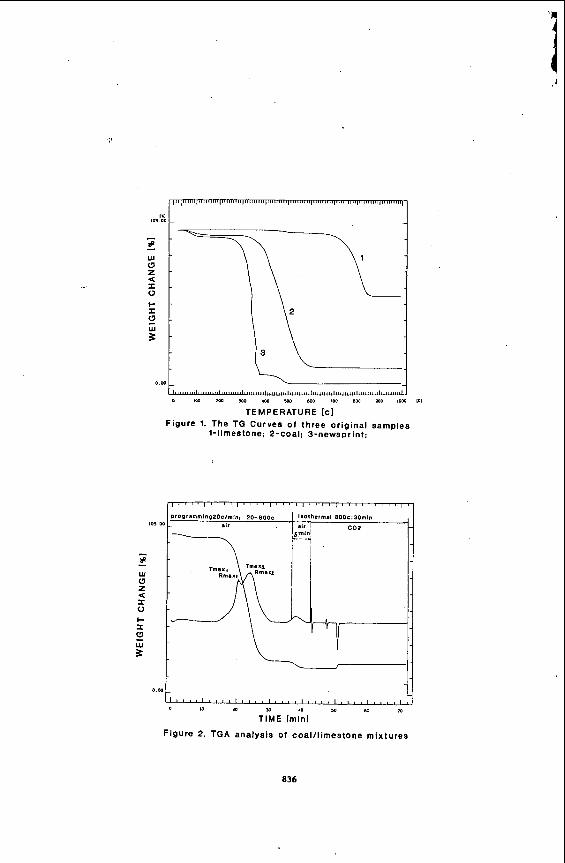
Test results for the three materials are shown in Figure 1. The TG curve for coal depicts two weight loss stages, the first consisting of a 3.09% moisture loss followed by a second weight loss of 85.25% containing two overlapping DTG peaks. The first DTG peak is a result of the combustion of aliphatic materials in coal and the second is due to the combustion of the aromatic materials of coal. Thl and TMmz occur at 417'C and 440'C. respectively.
Figure 1 also shows two decomposition stages for limestone. There is an initial moisture loss of 1.73% beginning at 397'C and a second weight loss of 40.95% beginning at 563°C. This is due to limestone being converted to CaO and CO, gas. Experimental conditions were identical to that used for coal.
& (mg/min), was 0.76 at 817°C.
Finally, Figure 1 represents three major weight loss stages for newspaper with the first being a moisture loss of 4.35%. The second weight loss of 88.57% represents the major decomposition of materials in newspaper and has an of 5.34 at 353'C. The overlapping peak is shown on the DTG curve and represents the decomposition of impure cellulosic materials with higher lignin content in the newspaper. The third and last weight loss phase of 5.91% is due to char gasification and has a small peak at 475°C. Experimental parameters were again identical to those used in the TG analysis of coal. It is evident from the TG curve that newspaper decomposes 15O'C earlier than coal. Total weight losses of
831
coal , limestone, and newspaper (es tabl ished on a,moisture f r ee b a s i s ) , were 88%, 4 2 . 7 % , and 98.8%. respect ively. 5~
Thermal Analvsis of Coal-Limestone Mixtures
In order t o decide upon an optimum amount of limestone f o r the combination fuels for the f lu id i zed bed combustor, mixtures of coal and limestone were t e s t ed by TGA. Testing procedures preceding 800-85O'C were iden t i ca l t o those previously examined. However, a f t e r 800'C o r 850'C. temperatures were he ld constant f o r 5 minutes, the atmosphere was changed t o CO, gas f o r 25 minutes, and a determination was then made as to t h e amount, i f any, of weight gain tha t occurred (See Figure 2 ) . I f a weight gain d id occur, t h i s indicated tha t an excess of CaO was i n the residue and was converted back t o CaCO, when the GO, w a s added. I f a weight gain did not occur, t h i s indicated tha t a l l of the CaO reacted with the SO, t o produce CaSO,, leaving no excess CaO i n the residue. This method was developed by R.F. Culmo and R. L. Fyans (7).
Next the optimum temperature a t which the limestone completely decomposed neededto be determined. A 5% limestone, 95% coal mixture was used t o obtain the sui table temperature values. The TG r e su l t s show t h a t there i s no s ign i f i can t weight changes above 8OO'C. Therefore 800'C and 850'C were chosen for the isothermal temperature values fo r t e s t runs.
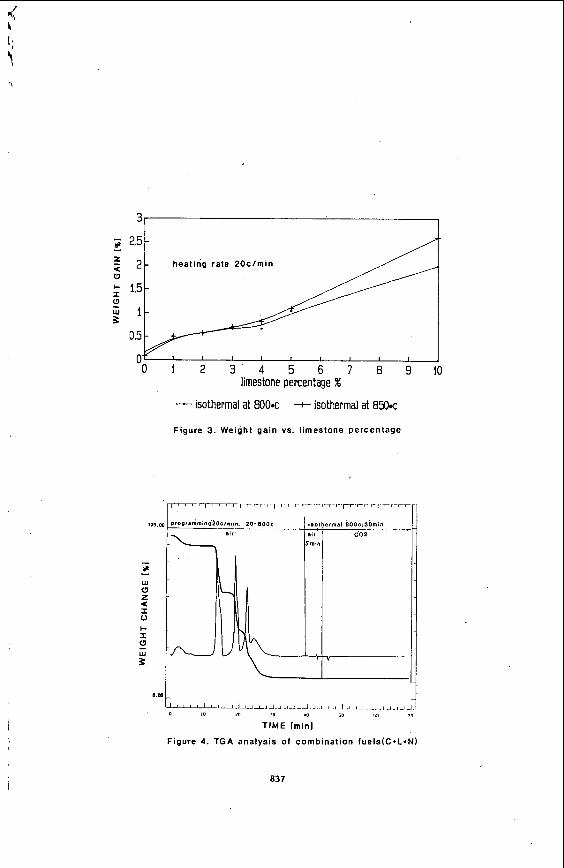
Using the chosen optimum temperature values , the optimum limestone percentage needed t o be determined. To accomplish t h i s goal , d i f f e ren t percentages of limestone ( 0 , 1 , 2 , 3 , 4 , 5 , and l o % ) , were added t o the coal . The r e su l t s of these t e s t s , as shown i n Figure 3 , indicate a s u i t a b l e limestone percentage is between 1% and 3%. A plateau i n the weight gain curve occurs between 1-3% and increases s ign i f i can t ly with increased amounts of limestone (excess CaO). Thus, 2% limestone was chosen f o r the following study. It should be recognized tha t excess limestone w i l l reduce the flame temperature i n the fluidized bed combustion system and a l so increase the operational costs.
Considering t h a t the heat ing r a t e i s higher i n f luidized bed combustors than that used i n the experimental t e s t s used thus f a r , higher heat ing r a t e s for tests were chosen t o observe the e f f e c t heating r a t e s may have on the decomposition of the fue l mixtures. Heating r a t e s of ZO'C/min. 35'C/min, 40'C/min, and 5O'C/min were chosen f o r add i t iona l experiments. These heat ing r a t e s were used with 2 % , 5%, and 10% limestone percentages. The TG r e s u l t s indicate the weight gain, due t o absorbed SO,, a t d i f f e r e n t heat ing r a t e s and limestone percentages was not s ign i f i can t ly a f f ec t ed under these spec i f i c experimental conditions.
A determination of the change i n weight loss during combustion as a function of varying coal-l imestone mixtures was made. I t was determined t h a t the 2% limestone d i d n o t show any c a t a l y t i c e f f e c t on the f i r s t thermodecompositionstage of coal. Similar r e s u l t s were obtained fo r the second thermodecomposition s tage.
Final ly , the e f f e c t of limestone on the thermal behavior o f the mixture with respect t o changes i n the parameters T,, and &, was determined. The TG r e su l t s indicate t h a t a t hea t ing r a t e s of 20'C/min and increased limestone content, Tkl and TH-.z s h i f t to s l i g h t l y higher temperatures. and hrn, s l i g h t l y decrease with increased limestone percentage. Both TG curves present the same r e s u l t s ; higher limestone content may delay the decomposition and combustion s l i g h t l y as T,, increases and R+,- decreases.
Thermal Analvsis of Combination Fuels
The TG curve a l s o shows that
The combination fuels tes ted consis t of coa l , l imestone, and newspaper (RDF), i n varying percentages. According t o the r e s u l t s of the preliminary
832
b
I
studies, it is believed that a 2% limestone content in the mixture is sufficient for absorbing the SO, emitted for the burning of the coal tested. The mixtures of coal, limestone, and newspaper are 90/2/8, 80/2/18. and 70/2/28. respectively.
There were four thermodecomposition stages observed, excluding the moisture loss. The T- for each stage was 283. 384, 450, and 489'C. It is believed that the first and second stages are due to the decomposition of newspaper, with the first being mainly due to cellulosic materials and the second to lignin content. Previously. Figure 1 indicated that there was one overlapping DTG peak with Tk- 352'C. In the case of the combination fuel, however, the overlapping peak noted in Figure lbecame two separate peaks, and the first peak occurred 70'C earlier than noted for the newspaper alone. This may be due to reduced sample particle size that occurred during the grinding and preparation of the combination fuel. The third and fourth decomposition stages are due to the thermodecomposition of coal. However, the third stage was enhanced by two possible factors: (1) additional char gasification from the newspaper and/or ( 2 ) catalyzation of the char gasification by the limestone. The results for T-, R, versus newspaper content are shown in Table 1.
The general TG curve of the combination fuel is shown in Figure 4.
To better understand and further verify the proposedmechanisms involved in the TG curve analysis, 50% coal/50% newspaper, 50% newspaper/50% limestone, and 50% coal/50% limestone test mixtures were also studied.
The TG and DTG curves of the 50% limestone/50% newspaper indicate three thermodecomposition stages with the first two peaks being due to the thermodecomposition of newspaper. The third peak was due to the decomposition of limestone. T,, for peak one did not significantly change compared to that for 100% newspaper. box, however, decreases by 20%. THax of peak two did not show any significant change. However the value of ha. was five times greater than 100% newspaper. This might be due to the catalytic effect on char gasification. It is presently unknown why the third peak shifted 1O'C earlier than 100% limestone; however, &,ax values were similar.
One may assume that the experimental values such as those listed in Table 2 may be used to predict the effects of varying amounts of limestone by utilizing known decomposition values for pure limestone and pure newspaper. However, in this case, there were significant differences between calculated (predicted) values and those obtained through experimentation. The first peak was retarded by the calcium, yielding lower weight loss values, and the second peak is influenced by a catalytic effect from the calcium. The third weight loss phase, however, was not effected because it was only due to the decomposition of limestone.
The TG results for 50% coal/50% limestone showed two thermodecomposition stages. The first peak, a combination of two overlapping peaks, shifted 2O'C higher than that for 100% coal. Again, the third peak, due to the thermodecomposition of limestone, occurred 20°C lower than that for 100% limestone. Likewise, I$.,, for peak one was reduced by 50% compared to that for 100% coal. The TG results of 50% coal/50% newspaper showed three thermodecomposition stages with the first peakbeing due to newspaper, the second peak due to coal, and the third peak due to char gasification combined with less combustible materials from coal.
From reactivity studies, it can be concluded at this point in the analysis that the addition of limestone retarded the decomposition of coal and newspaper in the early stages, and then promoted the char gasification in the later stages due to the catalytic effect of calcium.
833
Ongoing research with combinations of TGA-FTIR and DTA techniques will provide a better understanding of the overall decomposition and combustion processes for coal-RDF-limestone fuels.
ACKNOWLEDGMENTS
The authors are grateful to Shimadzu Scientific Instruments, Inc. for the loanof the HT 1500 TGA, to China's National Coal Corporation, and the International Scholar's Program at Western Kentucky University for a scholarship and support of Mingxu Zhang .
1.
2.
3 .
4.
5.
6.
7.
REFERENCES
McGowin. C.R.; Petrill, E.M.; Pei-na, M.A.; Rowley. D.R; "Fluidized Bed Combustion Testing of Coal/Refuse-Derived Fuel Mixtures," Babcock and Wilcox, Report from EPRI Project RP718-2 (1989).
Hickman, C.E.; Center for Electric Power, Tennessee Technological University, personal communication.
"Summary of Recent Literature Pertaining to the Incineration of Municipal Solid Wastes," prepared by the Center for'Environmenta1 Information, InC., NYSEG contract No. 87-372 (August, 1988).
Conkle, H.N.; Dawson, W.J. ; Rising, B.W.; "Reconstitution of Coal and Limestone for Use in Industrial Stoker Boilers," paper presented at the 18th Biennial Conference of the Institute of Briquetting and Agglomeration. Colorado Springs, GO (August, 1983).
Giammar, R.D.; Hopper. D.R.; Radhakrishnan, E.; Webb, P.R.; "Evaluation of Emission from Industrial Stoker Boilers," presented at AIChE meeting, Boston, MA (August, 1979). '
Rising, B.W.; Conkle, H.N.; Dawson, W.J.; Lift, R.D.; "Advanced Development of a Coal/Limestone Fuel Pellet for Industrial Boilers," Contract No. 68- 02-3189, Final Report from Battelle's Columbus Laboratories for the U.S. EPA (October, 1983).
Culmo, Q.R.F.; Eyans, R.L.; "Thermogravimetry as a Tool for Determining Combustion Efficiency and Calcium Utilization of a Fluidized Bed Combustion Furnace" in ComDositional Analysis bv Thermoeravimetry, C.M. Earnst, Ed., ASTM STP997, American Society for Testing and Materials, Philadelphia, PA, 1988, pp. 245-55.
a34
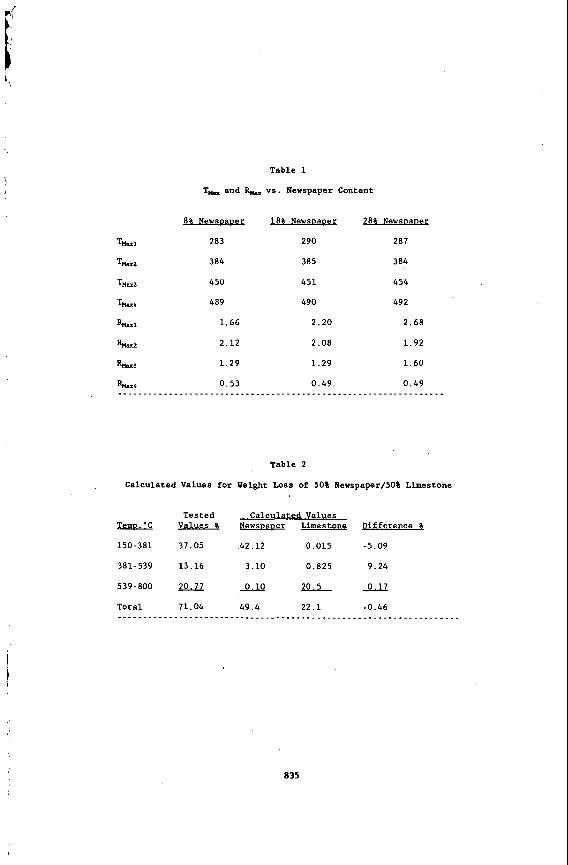
Table 1
T, and & vs. Newspaper Content
8% Newsuaver
283
384
450
489
1.66
2.12
1.29
0.53
18% NewsvaDer
290
385
451
490
2.20
2.08
1.29
0.49
28% Newsuaver
287
384
454
492
2.68
1.92
1.60
0.49
Table 2
Calculated Values for Weight Loss of 50% Newspaper/SO% Limestone
TemD.'C
150-381
381-539
539-800
Tested Calculated Values Values p ewsvauer Limestone Difference &
37.05 42.12 0.015 -5.09
13.16 3.10 0.825 9.24
0.10 20.5m
71.04 49.4 22.1 -0.46 . . . . . . . . . . . . . . . . . . . . . . . . . . . . . . . . . . . . . . . . . . . . . . . . . . . . . . . . . . .
a35
1.1 105 m -
w - 0 z - 4. I - o I - - I
0 110 a00 300 ad 500 €00 )OD 824 POD loo0
TEMPERATURE [cl Figure 1. The TG Curves o f three original samples
1-limestone; 2-coal; 3-newsprint:
--
o m -
836
'\
3, 1
-0 1 2 3 4 5 6 7 8 9 limestone percentage %
-isothermal at BOO-c + isothermal at 850.c
Figure 3. Weight gain vs. limestone percentage
-IIIIL1 .A -O-,JJ-.J->L .1...1.L .,.A 1.1-1.1 . I .I.
TIME lminl
Figure 4 . TGA analysis of combination fuels(C*L+N)
837
10
ARENECHROMIUM COMPLEXES IN COAL
Michael D. Ettinger and Leon M. Stock University of Chicago, Department of Chemistry
Chicago, Illinois 60637
Keywords: Coal, Chromium, Hydrogenation.
I n t roducLiul
When an a r e n e i s c o o r d i n a t e d t o Cr (C0)3 , profound changes i n i t s r e a c t i v i t y o c c u r 1 f 2 . Ring and b e n z y l i c hydrogen atoms e x h i b i t enhanced a c i d i t y , and t y p i c a l a r ene r e a c t i o n s such a s e l e c t r o p h i l i c aromatic s u b s t i t u t i o n s are quenched. I n c o n t r a s t t h e r i n g carbon atoms a r e a c t i v a t e d toward a t t a c k by nuc leoph i l e s i . These changes i n r e a c t i v i t y a re m a n i f e s t a t i o n s o f t h e f o r c e f u l e l e c t r o n withdrawing n a t u r e of t h e Cr (C0)3 component, and o f t h e a b i l i t y of t h i s group t o s t a b i l i z e cha rged i n t e r m e d i a t e s . I n a d d i t i o n , arenechromium t r i c a r b o n y l complexes have been proven t o be good c a t a l y s t s i n t h e hydrogena t ion of d i e n e s 3 . While most s imple complexes such a s toluenechromium t r i c a r b o n y l r e q u i r e t h e use of h i g h t e m p e r a t u r e s a n d d i h y d r o g e n p r e s s u r e s , arenechromium t r i c a r b o n y l complexes wi th napthalene, an th racene , and phenanthrene show remarkable a c t i v i t y under ex t r eme ly m i l d c o n d i t i o n s . Coal arenechromium t r i c a r b o n y l complexes may prove t o be good i n t e r n a l h y d r o g e n a t i o n c a t a l y s t s f o r t h e h y d r o g e n a t i o n o f s u r r o u n d i n g molecules.
Results and Discus-
Experiments were c a r r i e d o u t with a c o a l l i q u i d i n t h i s exp lo ra to ry i n v e s t i g a t i o n t o avoid s o l u b i l i t y problems i n h e r e n t i n t h e u s e of s o l i d c o a l s . The c o a l l i q u i d used was d i s t i l l e d a t approximately 850°C from run 250D a t t h e W i l s o n v i l l e p i l o t p l a n t w i th I l l i n o i s N O . 6 c o a l . I n c o n t r a s t t o s o l i d c o a l s and heavy d i s t i l l a t e s , t h i s ma te r i a l i s s o l u b l e i n a l l common o rgan ic s o l v e n t s .
The f i r s t s t a g e of r e s e a r c h c e n t e r e d on t h e c o n v e r s i o n of t h e a r o m a t i c hydroca rbons i n t h e c o a l l i q u i d i n t o arenechromium t r i c a r b o n y l complexes. React ions t o form complexes wi th t h e c o a l l i q u i d were c a r r i e d ou t by a procedure f o r simple m o l e c u l e s i n which t h e a r e n e i s r e f l u x e d i n d ioxane wi th chromium hexaca rbony l . However,this method r e q u i r e d long r e a c t i o n t i m e s and l a r g e excesses Of chromium h e x a c a r b o n y l t o a c h i e v e a c c e p t a b l e l e v e l s of c o m p l e x a t i o n . To a l l e v i a t e t h e s e p rob lems , t h e u s e of an a l t e r n a t i v e r e a g e n t , triaminechromiumtricarbonyl, was i n v e s t i g a t e d . T h i s r eagen t i s easy t o synthesize5, equa t ion 1, and has been used
t o o b t a i n s e v e r a l organochromium complexes6. Reac t ions of t h e coa l l i q u i d w i t h triaminechromiumtricarbonyl p r o v e d t o be v e r y s u c c e s s f u l . High y i e l d s of complexation with t h e c o a l l i q u i d arene molecules w e r e o b t a i n e d . Indeed, t h e product was orange co lo red and C r y s t a l l i n e i n n a t u r e . The 136 NMR spectrum of one such product i s shown i n F igu re 1. , The carbonyl resonance appea r s a t 234 ppm and
838
t h e aromatic carbon resonances s h i f t t o 80-100 ppm as a n t i c i p a t e d .
The second s t a g e of t h e i n v e s t i g a t i o n c e n t e r s o n hydrogena t ion t r a n s f e r chemis t ry o f t h e c o a l l i q u i d arenechromium t r i c a r b o n y l complexes. S t u d i e s have been c a r r i e d ou t w i th s imple arenechromium t r i c a r b o n y l complexes1# a s c a t a l y s t s i n t h e hydrogenat ion of methyl 2,4-hexadienoate i n which t h e s e v e r i t y of r e a c t i o n c o n d i t i o n s va r i ed from 150°C a t 7 0 0 p s i dihydrogen p r e s s u r e f o r toluenechromium t r i c a r b o n y l t o 27OC a t 5 7 p s i d i h y d r o g e n p r e s s u r e f o r napthalenechromium t r i c a r b o n y l . The d rama t i c i n c r e a s e i n a c t i v i t y of t h e p o l y c y c l i c arenechromium t r i c a r b o n y l complexes is t h a t t h e r e a r e two long C r - C bonds with t h e br idgehead 'carbon atoms t h a t have bond o r d e r s less t h a n one8 . Thus, t h e l o n g e r and w e a k e r bonds should be more e a s i l y d i s p l a c e d by t h e incoming d iene l i g a n d i n t h e ra te determining s t e p . Th i s advantage i s no t r e a l i z e d i n t h e case of t h e monocycl ic arenechromium t r i c a r b o n y l complexes such a s benzenechromium t r i c a r b o n y l where a l l of t h e Cr -C bonds have equa l l e n g t h with bond o r d e r s c l o s e t o u n i t y . The e f f e c t o f s o l v e n t was a l s o examined. Coord ina t ing s o l v e n t s such as t e t r a h y d o f u r a n o r acetone inc reased t h e r a t e of t h e hydrogenat ion r e a c t i o n presumably by f a c i l i t a t i n g t h e i n i t i a l l i gand s u b s t i t u t i o n s t e p .
Hydrogenation r e a c t i o n s were c a r r i e d out under mild c o n d i t i o n s i n a g l a s s microhydrogenation appa ra tus a t p r e s s u r e s lower than 200 p s i and t empera tu res less than 5OoC u s i n g d ideu te r ium g a s . The use of dideuter ium a l lows t h e r educ t ion s t e p t o be d e t e c t e d by means of deu te r ium NMR. A hydrogena t ion r e a c t i o n was c a r r i e d o u t w i th napthalenechromium t r i c a r b o n ' y l t o c a t a l y z e t h e hydrogena t ion of methyl 2 ,4-hexadienoate i n t h e p re sence of small amount of c o a l l i q u i d t o t e s t whether or no t t h e c o a l l i q u i d would po i son t h e c a t a l y s t . This r e a c t i o n , equat ion 2 , proved t o be s u c c e s s f u l w i th a
15Opsi D2,Acetone CH3CHCHCHCHC02CH3 + C1OH8Cr (CO) 3 - CH3CHDCHCHDC02CH3 (2)
1.23M 80.3 x lO-3M 450C,1.5hr 25mg Coal Liq
63% c o n v e r s i o n o f m e t h y l 2 , 4 - h e x a d i e n o a t e t o ' m e t h y l hex-3-enoate-2,5-&. It w a s ev iden t t h a t t h e presence of t h e c o a l l i q u i d does no th ing s i g n i f i c a n t t o i n h i b i t t h e c a t a l y s t . The n e x t se t o f e x p e r i m e n t s w e r e c a r r i e d o u t w i t h t h e c o a l l i q u i d arenechromium t r i c a r b o n y l complexed mater ia l . The c o a l l i q u i d arenechromium t r i c a r b o n y l complexed m a t e r i a l p r o v e d t o b e u n s u c c e s s f u l i n c a t a l y z i n g t h e hydrogenat ion of t h e su r round ing molecules . In p a r t , t h i s could be due t o t h e f a c t t h a t a l l of t h e p o s s i b l e a c t i v e s i t e s for hydrogenat ion may of have been r ende red u n r e a c t i v e by complexat ion wi th C r ( C 0 ) 3 . To t e s t t h i s l i n e of r eason ing , experiments were c a r r i e d ou t on a mixture of t h e c o a l l i q u i d arenechromium t r i c a r b o n y l complex and un reac ted c o a l l i q u i d as shown i n equa t ion 3 . Ana lys i s of t h e 2 H NMR spectrum of t h e c o a l l i q u i d arenechromium t r i c a r b o n y l r e a c t i o n product showed t h a t no s i g n i f i c a n t d e u t e r a t i o n had taken p l a c e .
86psi D2, 5ml Acetone Coal Liquid + Coal Liquid-Arene-Cr(C0)3 e N . R . ( 3 )
0.59 c.5g 450C,16hrs
839
h A
4 r
I n o r d e r t o c l e a r l y t es t t h e c a t a l y t i c a c t i v i t y o f t h e c o a l l i q u i d arenechromium t r i c a r b o n y l complex, experiments were c a r r i e d o u t with methyl 2 , 4 - h e x a d i e n o a t e as t h e s u b s t r a t e and t h e c o a l l i q u i d arenechromium t r i c a r b o n y l complex a s t h e c a t a l y s t as shown i n equa t ion 4 . The 2 H NMR of t h e r e a c t i o n p roduc t showed t h e c o a l l i q u i d and un reac ted methyl 2,4-hexadienoate i n d i c a t i n g no r e a c t i o n .
l50psi D2,2.5ml Acetone
CH3CHCHCHCHC02CH3 + Coal Liq-Arene-Cr(C0)3 *N.R . (4) 1.23M 0.5g 450C, 1.5hrs
Although t h e a c t i v i t y o f t h e c o a l l i q u i d arenechromium t r i c a r b o n y l complex a s a hydrogenat ion c a t a l y s t appears t o be small f o r methyl 2 ,4-hexadienoate as w e l l as f o r un reac ted c o a l l i q u i d s under t h e m i l d c o n d i t i o n s employed, it may w e l l prove t o be v i a b l e under moderately more s e v e r e c o n d i t i o n s . In a d d i t i o n , t h e n a t u r e of t h e a romat i c r i n g s i n t h i s p a r t i c u l a r c o a l l i q u i d may a c t u a l l y l e a d t o ve ry i n a c t i v e c o a l l i q u i d arenechromium t r i c a r b o n y l complexes. A s l i g h t l y h e a v i e r d i s t i l l a t e may c o n t a i n more p o l y c y c l i c a romat i c hydrocarbons and y i e l d more a c t i v e complexes while s t i l l a f f o r d i n g t h e conveniences provided by t h e use of a c o a l l i q u i d .
I n order t o tes t t h e hypo thes i s t h a t hydrogenation s u b s t r a t e s do not e x i s t i n t h e c o a l l i q u i d , a r e a c t i o n was c a r r i e d o u t w i t h napthalenechromium t r i c a r b o n y l , an a c t i v e c a t a l y s t , and un reac ted c o a l l i q u i d a s t h e s u b s t r a t e , equa t ion 5 . A comparison of t h e 2H
2OOpsi Dz, Acetone
Coal Liquid + C10~8-Cr (CO) 3 Coal Liquid-D ( 5 ) 0.5g 1.12 x 10⁻³M 7 5 W , 25 hrs
NMR s p e c t r a of t h e u n r e a c t e d c o a l l i q u i d b e f o r e and a f t e r t h e r eac t ion , F i g u r e 2, shows t h a t dideuter ium a d d i t i o n has taken p l a c e . F i r s t , t h e relative a romat i c deuterium con ten t has decreased and t h e a l i p h a t i c deu te r ium c o n t e n t has i n c r e a s e d . Second, t h e two major resonances of t h e un reac ted c o a l l i q u i d a t approximately 1.54 ppm and 1 . 1 6 ppm a r e no longer t h e dominant resonances. Rather, t h e new dominant resonances i n t h e r e a c t e d c o a l l i q u i d are a t approximately 2.27 ppm and 1 .45 ppm. I n a d d i t i o n , two o t h e r new s i g n a l s have appeared a t 3 .51 ppm and 2 . 7 1 ppm. Thus, it can be concluded t h a t hydrogenation of t h e c o a l l i q u i d had occur red .
Conclusions
A s y n t h e t i c method f o r t h e p r e p a r a t i o n of c o a l a r e n e chromium t r i c a r b o n y l complexes h a s been e s t a b l i s h e d . The se r ies o f hydrogenat ion r e a c t i o n s with c o a l l i q u i d a rene chromium t r i c a r b o n y l complexes shows t h a t t h e r e i s no th ing i n h e r e n t i n c o a l m a t e r i a l s t h a t po i son t h e arenechromium t r i c a r b o n y l c a t a l y s t and t h a t t h e r e a r e a c t i v e s i t e s i n t h e c o a l l i q u i d f o r hydrogenat ion. However, t h e a c t u a l arenechromium t r i c a r b o n y l complexes formed i n t h e c o a l li’quid are n o t a c t i v e enough f o r e x t e n s i v e hydrogenat ion under t h e mild e x p e r i m e n t a l c o n d i t i o n s t h a t w e u s e d . A s ment ioned b e f o r e , monocyclic complexes r e q u i r e h i g h e r t empera tu res and p r e s s u r e s f o r hydrogenat ion t h a n p o l y c y c l i c complexes do. Research i n t h i s a r e a i s c o n t i n u i n g t o t e s t t h e c a p a c i t y o f c o a l l i q u i d arenechromium t r i c a r b o n y l complexes t o c a t a l y z e dihydrogen a d d i t i o n .
840

1
,
The c o a l l i q u i d w a s ob ta ined through Amoco Research Cen te r from t h e W i l s o n v i l l e P i l o t P l a n t , Run 250D. The I3C NhR s p e c t r a w e r e recorded on a General E l e c t r i c GN 300 o p e r a t i n g a t 300MHz. The 2 H NMR s p e c t r a were recorded on a Varian XL 1000 o p e r a t i n g a t 400MHz. The I H NMR s p e c t r a were recorded on t h e Un ive r s i ty of Chicago 500MHz s p e c t r o m e t e r . Te t r ahydro fu ran , d i b u t y l e t h e r , and d ioxane were f r e s h l y d i s t i l l e d from sodium benzophenone k e t y l immediately b e f o r e u s e . Hexane w a s shaken w i t h s u l f u r i c a c i d p r i o r t o u s e . A l l s o l v e n t s were deoxygenated by means of s t a n d a r d freeze-pump-thaw methods. Potassium hydroxide, ace tone , and chromium hexacarbonyl were used as r ece ived .
Triaminechromium t r i c a r b o n y l
Chromium hexacarbonyl (17.69,’ 0.08mol), potassium hydroxide ( 3 2 . 0 g ) , e t h a n o l (80ml), n-butanol (80ml) and water (251111) were p l a c e d i n a f lame d r i e d t h r e e neck f l a s k f i t t e d wi th a s t i r re r and a r e f l u x condenser . The r e a c t i o n f l a s k was p l aced i n an o i l b a t h which was warmed g r a d u a l l y t o 15OoC. Chromium hexacarbonyl , which subl imed i n i t i a l l y , was washed o u t l a t e r by t h e s o l v e n t and no more subl imat ion took p l a c e . The r e a c t i o n s o l u t i o n g r a d u a l l y t u r n e d r e d . Af t e r 4h a t r e f l u x , t h e mixture was c o l l e c t e d , 150mL of concen t r a t ed aqueous ammonia s o l u t i o n was added and t h e m i x t u r e w a s s l o w l y s t i r r e d f o r two hours . A yel low p r e c i p i t a t e was c o l l e c t e d on a a g l a s s f i l t e r , washed with aqueous ammonia and e t h e r .
Coal l i q u i d arenechromium t r i c a r b o n y l
Triaminechromium t r i c a r b o n y l (4 .68g, 0.025mol), c o a l l i q u i d ( 5 g ) , and dioxane (25mLs) were loaded i n t o a 100 mL f l a s k provided wi th a magnetic s t i r rer , and a r e f l u x condenser . The s o l u t i o n was r e f l u x e d on an o i l b a t h f o r 48 h r s . The r e a c t i o n mix tu re w a s f i l t e r e d th rough C e l i t e i n a g l a s s f i l t e r and t h e f l a s k and C e l i t e were washed with e t h e r . The product was p u r i f i e d ove r a column of s i l i c a g e l with a 1 : 1 : 4 chloroform : dichloromethane : hexane.
Napthalenechromium t r i c a r b o n y l
Napthalenechromium t r i c a r b o n y l w a s p repa red by a s l i g h t l y modif ied p rocedure lo t o t h a t desc r ibed by Pauson4. A mixture of nap tha lene (5.3g, 0.042mol) and chromium hexacarbonyl (4 .4g , 0.020mol) were r e f l u x e d i n d i b u t y l e t h e r (100 m L ) , hexane (lOmL), and t e t r a h y d r o f u r a n ( I m L ) f o r 70 h r s . The h e a t i n g b a t h was maintained a t 16OoC f o r 15 h r s and a t 145OC f o r t h e remaining t i m e . So lven t and excess nap tha lene were removed under vaccum and t h e p roduc t p u r i f i e d on a column of s i l i c a g e l w i t h a 1 : 1 : 4 ch lo ro fo rm : dichloromethane : hexane.
Hydrogenation r e a c t i o n s
Hydrogena t ion r e a c t i o n s were c a r r i e d o u t on a lOmL m i c r o hydrogena t ion a p p a r a t u s . T y p i c a l l y , t h e r e a c t a n t s and d r i e d , deoxygenated acetone were p l aced i n t h e r e a c t o r and it was evacuated and f lu shed with d i n i t r o g e n t h r e e t i m e s , d ideuter ium t h r e e times and t h e n brought up t o t h e f i n a l d ideu te r ium p r e s s u r e a t t h e d e s i r e d t empera tu re . A f t e r t h e r e a c t i o n t ime, t h e mix tu re was f i l t e r e d through C e l i t e i n a g l a s s f i l t e r and concen t r a t ed under vaccum.
84 1

Acknowledgement. We are indebted to the Office of Fossil Energy of the u . S. Department of Energy for their support of this investiga- t ion.
References
1. 2.
3.
4. 5.
6.
7. 8.
Semmelheck, M. F. J. Organom. Chem. Library 1976, 1, 371. Jaouen, G. in 'Transition Metal Organometallics in Organometallics in Organic Synthesis', Vol. 2, H. Alper (ed), Academic Press 1978. Cais, M., Fraenkal, D., Weidenbaum, K. Coord. Chem. Rev. 1975, 16, 27. Mahaffy, C. A . , Pauson, P. L. Inorg. Synth. 1979, 19, 154. Razuvaev, G. A., Artemov, A. N., Aladjin, A . A,, Sirotkin, N. I. J. Organometal. Chem., 1976, 111, 131. Moser, G. A., Rausch, M. D. Synth. React. Inorg. Met. -0rg. Chem., 1955, 280, 255. Cais, M., Rejoan, A. Inorg. Chim. Acta, 1970, 4, 509. Muir, K. W., Ferguson, G., Sim, G. A. Inorg. Chem. 1966, 5, 1851.
842
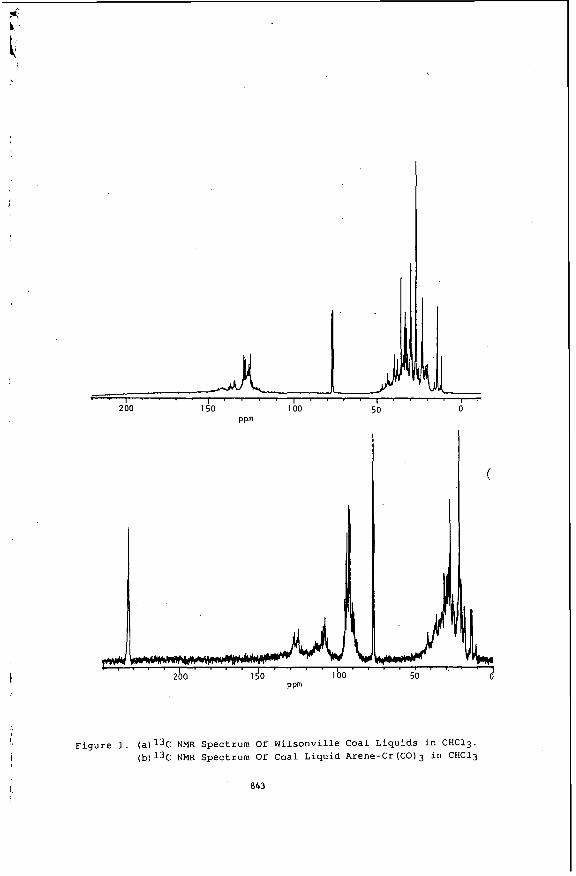
4
i
Figure 1. (a)13C NMR Spectrum Of Wilsonville Coal Liquids in CHC13. (b) 13C NMR Spectrum Of Coal Liquid Arene-Cr (CO) 3 in CHC13
843
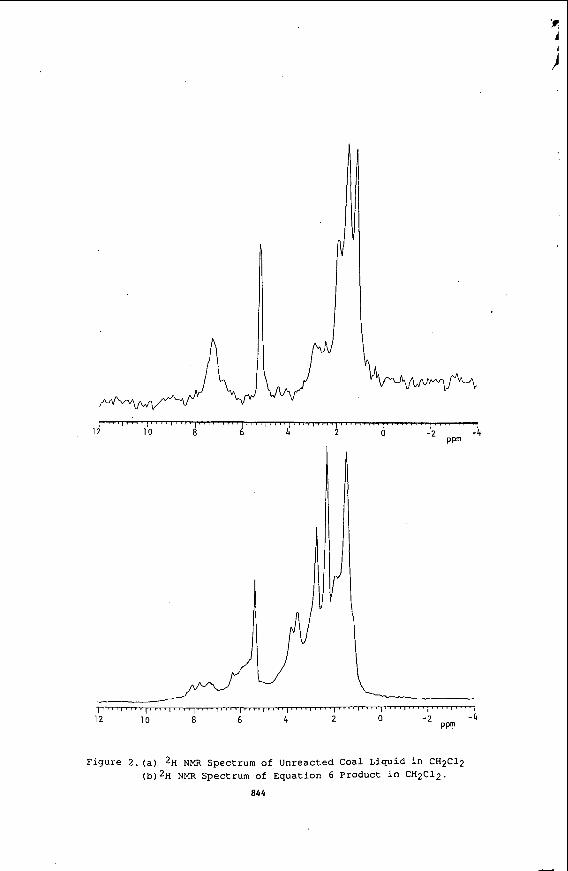
Figure 2 . ( a ) 2H NMR Spectrum of Unreacted C o a l L i q u i d i n CHZClZ ( b ) 2 H NMR Spectrum of Equat ion 6 Product i n CH2C12.
844
SYNTHESIS AND CHARACTERIZATION OF PYRIDINE AND 2,6-DIPHENYL-PYRIDINE ETHERS
I
Leonard L. Hatz Independent
3061 Bishop Road Appleton, NY 14008
Key words: Ethers; Pyr id ine Ethers; Synthesis o f Ethers;
INTRODUCTION Three novel py r id ine ethers have been synthesized f o r extension
o f studies on coal systems'. Past s tud ies have revealed t h a t hydrogen bonding act ivates a l ky l -a ry l ethers toward cleavage by iodide ion i n py r id ine invo lv ing hydrogen bonding t o coal'. Pyr id ine ethers have been synthesized de nc?vo from 2,6-diphenyl- 1,3,5-pentanetrione which had a lso been synthesized de ~ C L V O from l-phenyl-1,3-butanedione a f t e r format ion o f i t s mono-then di-anion and combination w i t h methyl. benzoate37', These react ions seem t o provide good y ie lds because o f the d r i v i n g force o f the charged molecular species. Coal i s now though t - to be as elastomer i n which strong i n t e r n a l hydrogen bonding gives i t h igh glass t r a n s i t i o n temperatures. The same ac id i c hydrogen donors and basic hydrogen receptors t h a t provide strong hydrogen bonds i n the bulk s t ruc tu re populate the surface o f coal powders5. As i n experiments using 1,3-dimethylnapthalene and decalin'. so l va t i on proper t ies o f the pyr id ine ethers w i l l ' be tested on coal f r a c t i o n s i n contemplated experiments.
t RESULTS
1,5-DiphenyI-1,3,5-pentane triane The enol a te carbani on o f l-phenyl-l,3-butanedione was obtained by proton ex t rac t i on w i th sodium hydride i n the ap ro t i c solvent, 1,2-dimethoxy ethane (monoglyme). Condensation o f t h i s carbanion w i th methyl benzoate y ie lded the t r iketone, 1,5-dipheny1-1,3,5-pentanetrione. This a roy la t i on apparently involves the di-anion o f the p-diketone which i s formed i n a step-wise ex t rac t i on o f i t s ox-hydrogens. The terminal a-hydrogen i s no t the f i r s t ext racted from the 6-diketone, but i s on ly ext racted a f t e r mono-anion formation and i n the presence o f methyl benzoate. The terminal a-hydrogen i s , however, the s i t e o f react ion o f the p-diketone w i t h the carbonyl carbon o f the ester . The methoxide group o f the ester neutra l ized by the Na+ counter ions, then leaves the condensation product. Exposure t o a i r w i t h i t s i n c i p i e n t moisture and n e u t r a l i z a t i o n o f the react ion mixture w i th 6N HC1 provide the protons f o r n e u t r a l i z a t i o n o f the carbanions present and formation o f the t r iketone.
This react ion occurs w i t h a high degree o f e f f i c i e n c y s ince 86.9% y ie lds could be obtained (See Table 1).
Apparently once formed, the di-anion i s q u i t e reac t i ve and the
a45

react ion i s ev iden t l y s p e c i f i c f o r the terminal carbon o f the dianion. As expected, the symmetric t r i ke tone formed was soluble i n d ie thy l ether, but i t s s o l u b i l i t y var ied considerably depending on the pH of the reac t i on mixture (Table 2 )
These d i f ferences could be a r e f l e c t i o n o f minor changes i n the s t ructure o f the t r i ke tone . Var ia t ion o f the co lo r , c r y s t a l l i n e form and mel t ing po in ts o f t r i ke tone which substant ia te s im i la r e a r l i e r observations are a l so suggestive o f small va r ia t i ons i n the s t ructure o f the t r i ke tone . Because o f the H-bonding, various keto-enol tautomeric forms can be envisioned and as pH changes occur i n the so lvent a l l o f these forms are undoubtedly present i n the so lut ion. A t low pH values the t r i k e t o n e i s probably found as a doubly H-bonded eno l i c s t ruc tu re (Formula 1 1 , a t intermediate pH values as a mono-H-bonded s t ruc tu re (Formula 2 ) and a t h igh pH values as a keto form (Formula 3) w i t h l i t t l e H-bonding (Fig. 2 ) .
?,6-Diphenyl-4(1H)-pyridinone This pyr id inone was produced by the c y c l i z a t i o n o f the 1,5-diphenyl-1,3,5-pentanetrione w i t h l i q u i d ammonia. Because o f the high pH o f the react ion m i l i eu , which causes the eno l i za t i on o f the ketone groups, the add i t i on product i s the primary amine-enol o r d ienol intermediate.
Cyc l izat ion by add i t i on o f the primary amine t o the other terminal carbon o f the pentanetrione chain then r e a d i l y occurs. This d i - o r t r i e n o l i c s t ruc tu re i s then dehydrated t o form the h igh ly conjugated diphenylpyr id ine d e r i v a t i v e w i th i t s qu ino id- l ike p y r i d i n e r ing .
The synthesized pyr id inone possessed the l i t e r a t u r e values o f the physical proper t ies. I n addi t ion, the physical proper t ies o f the t r iketone and pyran were considerably d i f f e r e n t . These resu l t s suggest because o f t h e i r interdependence t h a t the s t ruc tu ra l parameters a t t r i b u t e d t o these i so la tes are consistent and reputable.
DISCUSSION
As expected t h e product, l,S-diphenyl-l,3,5-~entanetrione, i s formed w i t h a h igh dpgree o f e f f i c i e n c y (86.9% y ie lds ) . Although the symmetric t r i k e t o n e was so lyb le i n d i e t h y l ether, va r ia t i ons o f ,
the pH o f the reac t i on mixture produced s l i g h t va r ia t i ons i n the '
s t ructure o f the t r i k e t o n e and therefore v a r i a t i o n o f the co lor , c r y s t a l l i n e form and mel t ing po in ts o f t r i ke tone products. Because o f the H-bondong, var ious keto-enol tautomeric forms can be envisioned'and as pH changes occur i n the solvent a l l o f these forms are undoubtedly present i n the react ion mileaux.
The u l t r a s t r u c t u r e o f coals i s suscept ib le t o study using small molecular weight organic molecules which are not suscept ib le t o a l t e r a t i o n by the i n t e r i o r o f the coal pores. We have chosen t o use the commonly accepted organic molecules which are very res i s tan t t o a l t e r a t i o n insuch an organic mileaux- ethers. Theoret ica l ly these molecules can be used as molecular sieves t o approximate the sire of coal pores'. Unfortunately, the ethers which we have used have
846

Proven t o be unreasonable solvents s ince they react w i t h the coal u l t ras t ruc tu re .
Another problem i n i n t e r p r e t a t i o n occurs becasuse o f the i n te rac t i on o f the py r id ine ethers w i t h the coal s t ruc tu re* . For example, the r e s u l t s o f the study invo lv ing the use o f 4-methylpyridine reported above.
SUMMARY
I
1-Hydrogen bonding i s a s i g n i f i c a n t in ter ference i n the synthesis o f 2,6-diphenyl-1,3,5-pentanetrione, ye t y ie lds o f 9O+X prove t h i s spec i f i c synthesis e f fec t i ve .
2-Because o f the very prominant unsaturat ion o f the products o f t h i s synthesis-the product compounds are very c o l o r f u l .
3-These ethers cannot be considered inne r t and make in te rp re ta t i on o f these r e s u l t s d i f f i c u l t .
EXPERIMENTAL
Melt ing po in ts (uncorrected) were determined on a Thomas Hoover Cap i l l a ry Mel t ing Point Apparatus (Uni-melt) and observed a t a r a t e o f P"C/min. 1H-NMR Spectra were measured on a Varian T-60 Nuclear Magnetic Resonance Spectrometer using te t ramethy ls i lane (TMS) as an i n te rna l standard. The solvents used were e i t h e r chloroform-d o r acetone-d6. I n f r a r e d spectra were recorded on a Perkin-Elmer 337 grat ing Spectrophotometer w i t h c a l i b r a t i o n peaks a t 1601 and 907 cm-' . Mass spect ra l analysis was conducted on a Dupont 21-490 Mass Spectrometer. TLC was performed on precoated S i l i c a Gel 60F-254 p la tes (Merck, Darmstatd. 0.25 mm thickness).HPLC analys is was ca r r i ed out on a Model 342 Gradient L iqu id Chromatograph system, re ten t i on times and area measurements were recorded by a Shimadzu Chromatopac C-RlB. The column used f o r t he HPLC was 4.6 mm x 25 cm CB reverse phase. Pre- in ject ion clean up o f HPLC samples included cen t r i f uga t ion i n a Beckman Microfuge TM 11 a t 11,000 rpm. Organic s o l i d s were d r ied under vacuum f o r a t l e a s t 2 h over CaSOll before analysis.
Preparation O f 1,5-diphenyl-1,3,5-pentanetri0ne~~' Sodium hydr ide (36.99 g/1.54 moles i n a 60% mineral o i l d ispersion) was added t o 100 mls o f d r i ed 1,2-dimethyoxyethane under a blanket o f anhydrous ni t rogen. A f te r s t i r r i n g f o r 15 m a t room temperature the glyme which contained mineral o i l and suspended f i nes was removed, discarded and replaced a t l eas t three times t o insure removal o f the mineral o i l a f t e r add i t i on o f 200-300 m l o f glyme. The s l u r r y was then heated t o r e f l u x and the 1-phenyl-1.3-butanedione (50.00 g/O.31 moles) i n 150 mls o f solvent was added dropwise (over 30-60 m) from an add i t i on funnel. A f te r 45 m from completion o f the addi t ion, a so lu t i on o f methyl benzoate (50.32 g/0.37 moles) i n 100 m l of glyme was added dropwise. The react ion mixture was then heated a t r e f l u x f o r 4-8 h. A f te r e q u i l i b r a t i o n w i t h the atmosphere and cool ing, the react ion mixture which was usual ly
t h i c k and crusty , was resuspended w i t h add i t iona l glyme, i f necessary, s t i r r e d and adjusted t o pH=6 w i t h concentrated HC1. The glyme was then removed i n a r o t a r y evaporator. The t a r - l i k e residue was ex t rac ted w i t h d i e t h y l ether, and the yellow-brown ethereal s o l u t i o n was d r i e d over anhydrous Na2SOa. A f t e r removal of most o f the e ther , the crude 1,5-diphenyl-i.3, 5-pentanetrione was r e c r y s t a l l i z e d from the residue w i t h 95% ethanol as yellow- brown c r y s t a l s t o g ive 47.33 g (57.7% Yd.):mp 107.0-109.0°C, ( l i t . , 106-109")1; NMR (CDCl,): 6 = 11.8-12.0 (d.11, 7.8-8.0 (m,6), 7.4-7.6 (m.7), 6.0 ( s , l ) ; IR ( K B r ) : 3450, 3150,2950, 2880, 1630, 1590, 1500, 1400, 1300, 1290, 1170, 900, 780, 690 cm-": Mass Spectrum, m/e : 266, 105.
Preparation of 2,6-diphenyl-4(1 H)-pyr idinone' 1 ,5-diphenyl- 1.3.5-pentanetrione (43.95 g/0.17 moles) was dissolved i n 200 m l o f anhydrous ethanol. . Commercial anhydrous l i q u i d ammonia was then bubbled through the mechanically s t i r r e d s l u r r y u n t i l the so lu t ion became dark brown and the reac t ion mixture cooled t o room temperature.' The s o l u t i o n was then taken t o dryness by heating i n an open round bottom f l a s k a t 90-100°C u n t i l a brownish t a r remained. This procedure was then repeated and s l i g h t l y modif ied by the add i t ion o f 50 g o f anhydrous Na,SOa before the f i n a l evaporation. R e c r y s t a l l i z a t i o n i s accomplished d i r e c t l y from the residue w i th benzene. A f t e r d ry ing 27.'21 g (66.6% y i e l d ) o f a white powder was i s o l a t e d and i d e n t i f i e d as 2,6-diphenyl-4(1H)- pyridinone: mp 178-179OC ( l i t . , 176-179aC': NHR (CD3COCD3): d = 8.0-8.3 (m, 7 ) , 7.3-7.4 ( m , 7), 7.2.(s, 1); IR (KBr): 3450, 3150, 3080, 2950, 2825, 1640, 1600, 1550, 1260, 975, 950, 780. 705, 555; Mass Spectrum (m/e): 247, 247.
Preparation o f 4-methoxypyridine7. To 10 m l o f d r i e d methanol were added 1.7 g/0.074 moles of m e t a l l i c sodium. A f te r disappearance o f the sodium and cessation o f H-, evolut ion, 5.00 g/0.033 moles o f d r i e d 4-chloropyridine hydrochloride (A ld r ich) dissolved i n 30 mls o f d r ied methanol were added dropwise over 2 h. The reac t ion mixture was then heated a t r e f l u x f o r 7 days. TLC revealed on ly t race amounts o f 4-chloropyridine and the 4-methoxypyridine,(Yd.= 2.80 g/O.O26 moles, 76.9%) was iso la ted by vacuum d i s t i l l a t i o n : bp 152-154°C (=400 t o r r ) o r 41-45OC (0.7-0.8 mm) [lit., 9596°C a t 31 nun5 o r 190.5-191.O"C (738.3 mm)']: NMR
3450, 3050,2990, 2960, 2860, 1600, 1460, 1440, 1295, 1220, 1035, 826. 820, 540, cm-l; Mass Spect ( m / e ) : 109.
Preparation o f 4-phenoxypyridine' . Phenol (12.44 g/0.073 moles) was d isso lved i n d r i e d toluene under a blanket o f anhydrous n i t rogen ( F i g . 5). M e t a l l i c sodium (3.04 g/0.132 moles) was then slowly added t o the s t i r r e d reac t ion mixture. A f t e r 1 h 4-chloropyridine-hydrochloride (6.61 g/0.044 moles) was slowly added through one s ide neck of the three neck f l a s k . This caused formation of H, and care w a s taken t o contro l the reaction. A f t e r add i t ion of t h e hydrochlor ic ac id s a l t , the react ion was heated a t re f lux fo r 10 days. A t t h i s time, TLC revealed only t race amounts
(CD3COCD3) 8 : 8.4-8.6 (d. 4), 6.7-6.9 (d , 41, 3.8 ( 8 , 1); IR (KBr):
!

o f remaining reactant. Work up involved" n e u t r a l i z a t i o n of the react ion mixture t o pH-7 fo l lowed by steam d i s t i l l a t i o n o f the react ion mixture. The d i s t i l l a t e was ext racted w i t h l i b e r a l quant i t ies o f d i e t h y l ether, the ethereal ex t rac ts were d r i e d w i t h Na2SO4 and the d i e t h y l ether p a r t i a l l y removed i n a r o t a r y evaporator. Vacuum d i s t i l l a t i o n o f the remaining e x t r a c t gave 3.2 g o f 4-phenoxypyridine (35.1 % Yd.): bp 78-79 (50 u l ) [lit., 134-136 IO), 6.8-7.0 (m, 6); IR(neat): 3007, 3005, 2950, 2850, 2730, 2620, 2500, 1595, 1500, 1270, 1220, 886, 760, 700, 632 cm-l; Mass Spect (m/e): 206.
2,6-diphenyl-4-ch I or opyr idi ne' ' 2,6-d i pheny 1 - 4(1H)-pyridinone (12.17 g/0.049 moles) and phosphorus pentachlor ide (30.75 g/0.993 moles) were mixed under n i t rogen and moistened w i t h dry phosphorus oxychloride ( 8 mls)(F ig. 5 ) . While heating t o 150°C f o r 2 h the l i q u i d mi l ieux progressed from a cloudy whi te t o c l e a r red appearance. The phosphorus oxychloride was then removed by d i s t i l l a t i o n and the mel t poured i n t o c o l d water. A f t e r s t i r r i n g the cooled suspension u n t i l the viscous reac t ion mixture became a f loccu len t p rec ip i ta te , the p r e c i p i t a t e was co l lec ted on a Buchler funnel. 10.50 g (86.3% Yd.) o f 2,6-diphenyl-4-chloropyridine was recrys ta l l i zed from the p r e c i p i t a t e w i t h 95% ethanol: mp 83-84aC ( l i t . , 72)1° ; NMR (CDC13) 6: 7.9-8.2 (m, 8 ) . 7.6 ( 8 . 11, 7.3-7.5 (m, 9) o r NMR (CD3COCD3) 6 : 8.0-8.4 (m, 8 ) . 7.8 ( 8 , 1). 7.4-7.6 (m, 9); I R (KBr): 3450, 3150, 1570, 1420, 1240, 865, 770. 735, 690 cm-l; Mass Spect ( d e ) 265, . Preparation o f 2,6-d iphenyl -4-a te thoxypyr id ine1@ Metal 1 i c sodium
(0.65 g/0.028 moles) was added s lowly and c a r e f u l l y t o 10 m l o f d r i e d methanol i n a three neck react ion vessel(Fig. 5 ) . A f t e r disappearance o f the sodium and abatement o f Hz evo lu t ion , the so lu t ion was re f luxed f o r 1 hr. A f t e r cool ing, 2.15 g/0.094 moles o f 2,6-dipheny1-4-chloropyridine dissolved i n 15 mL o f d r i e d methanol was added t o the reac t ion vessel. The temperature was again raised t o r e f l u x o f the reac t ion mixture. A f t e r 6 days HPLC revealed t h a t 50% o f the 2.6-diphenylpyridine was 2.6-diphenyl-4-chloropyridine and 50% was 2,6-diphenyl-4-methoxy- pyr id ine. Therefore, 0.65 g/0.028 moles i n 10 mL o f d r i e d methanol was again added t o the react ion mixture. A f t e r r e f l u x i n g f o r f o u r more days, the reac t ion mixture was then poured i n t o i c e water and the aqueous s o l u t i o n ext racted several t imes w i t h d i e t h y l ether. The ether ex t rac ts were then combined and concentrated t o g ive 1.63 g/o.oo7 moles o f impure 2,6-diphen~l-4-methyl~~ridine. Recrys ta l l i za t ion was accomplished w i t h absolute methanol g i v i n g 1.14 g/o.O04 moles o f 2,6-diphenyl-4-methoxy~yridine (46.3 XYd.): mp 79-80'C ( l i t . , 79-80°C)5; NMR (CDCL3) 6 : 8.0-8.2 ( m , 4). 7.3-7.6 (m, e ) , 7.1 ( 8 , 11, 3.8 ( 8 , 1) ; IR'(KBr): 3050, 2850, 2000, 1550, 1400, 1350, 1210. 1070, 1020, 895. 860, 835, 770, 690, 630 cm-'; Mass Spect (m/e) 261.
(10 mu)"; NHR (CD3Cl) 6 : 8.2-8.4 (d, 21, 7.0-7.4 ( m ,
Preparation o f
649
REFERENCES
1,Mayo, F. R.; Buchanan, D. H.; Pavelka, L. A. p r e p ? , Pa,c.-.4sS Chem.Snc.,Div. Fuel Chem. 1980, 25(.2.),, 182. (b) Mayo, F. R.; Buchanan, D. H.; Pavelka, L. A.; Hirschon, A. S., manuscript submitted t o Fue l .
2.Buchanan, D.H.; Takemura. N.; Sy, J. N. 0. "Intramolecular Hydrogen Bonding Enhances the Rate o f Nucleophi l ic Cleavage i n Alkyl-Aryl Ethers" J . O r g . C h e m . 1986. 51 ,, 4291-4294.
3,Light, R. J.; Hauser, C. R. "Aroy lat ions o f 6-Diketones a t the Terminal Methyl Groups t o Form 1.3.5-Triketones. Cyc l izat ions t o 4-Pyrones and 4-Pyridones" J .Ury .Chem. 1980. 25,, 538-546.
4.Miles, M. L.; Har is , T. M . ; Hauser, C. R. "Aroylat ions a t the Methyl Group o f Benzoylacetone and Related 6-Diketones w i t h Esters t o Form 1,3,5-Triketones by Sodium Hydride. Other Terminal Condensations." J.0rg.Chrm. 1965, 30,, 1007-1011.
5. Fowkes. F. M., Jones, K. L.. L i , G., a Lloyd, T. B. Surface Chemistry of Coal by Flow Microcalor imetry. Energy ,?i Fuels 1989, . 3 ,
6. Bockrath. E. C.. Schroeder, K. T. Smith, M. R. Invest igat ion o f L iquefact ion Mechanisms w i t h Molecular Probes. Eneryy &
7. Black, S. H. 8 Gerhardt, P. The Void Volume o f Bacter ia l
8. Sy, J. a Buchanan, D. H. J. U r y . Chem. 198X. .xw, xxx. S.Renshaw, R. R.; Conn, R. C. "Quaternary Der ivat ion o f Pyr idy l
Ethers. Onium Compounds. X V I " J.Am.Chem.Soc. 1937. 5 9 , 297-303. 10. Haake, P. ; M i l l e r , W. 0.; Tysee, D. A. J. Aner. Chem. Soc.
1964. Sd, 3577-xxxx. 11. Koenig, E.; Greiner, H. "Uber 4-Pyridyl-pyridinium-dichloride
und das Synthese von 7-Derivaten des Pyr id ins. " Err. 1931, 64,, 1056-.
12. Patrenko-Kritschenko, P.; Shot t ly , S. "Uber d i e Kondensation der Aceton-dicarbonsaureester m i t Aldehyden ve rm i t te l s Ammoniak und Aminen." Chem.Eer, 1909. 42, 2020-2025.
97-105.
Fuel< 1989, 3 , 268-272.
Spores. J. B a r t e r i n l . 1980, 59 , xx.
TABLE
Table 1. Physical Proper t ies of Syn the t i ca l l y Prepared Precursors and Ethers
Table 2. Physical Propert ies of 1.5-Diphenyl-1.3.5-pentanetrione
a-Mol es I - d i pheny 1-1 , 3-butanedione: mole NaH: moles methyl formate b-Solvent no t d r i e d immediately before synthesis c-Only one c r y s t a l l i z a t i o n , second was usual ly not f r u i t f u l
Figures
850

QPhenwypyridine
Reparaticm
E m 1 - h i te 137-139 79.8 water
Metharol hi te 79-83 46.3
Distilled Clear 41-45 water
Distilled clear 7879 water
a M e Ratio Solvent color 'Hd. m
F-1A 13.3-1 E X E t a i born 58.6 lo6-1ca
851
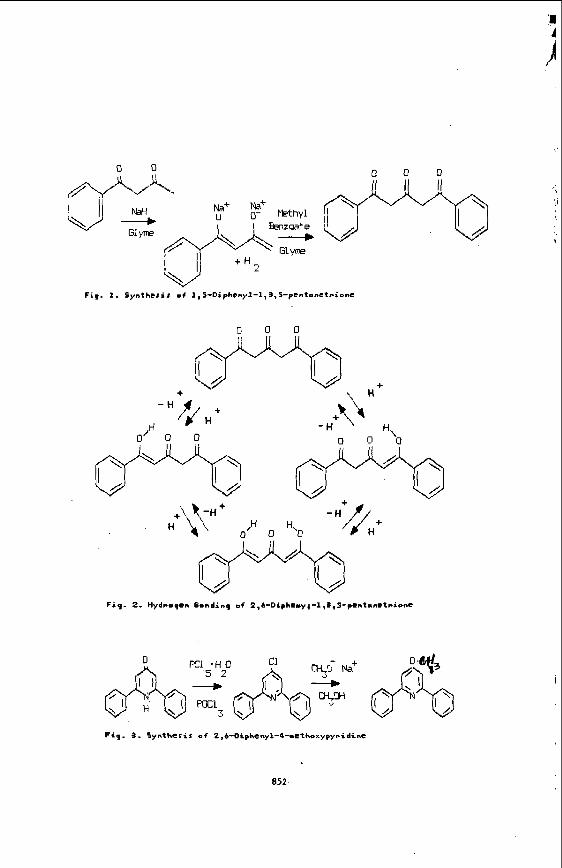
R O O
Fiq. 1 . Synthesis o f l,S-Diphcnyl-l,3,5-pent.nctrionc
Fiq. 2. Hydroqcn Bondinq o f Z , b - D i p h e r y ~ - 1 , 3 , S - p ~ n t ~ n C t r ~ o n C
852