secondary education regional information base: country...
TRANSCRIPT

Secondary EducationRegional Information Base:Country Profile
United NationsEducational, Scientific and
Cultural Organization
UNESCO Bangkok
Nepal

Secondary Education Regional Information Base: Country Profile
Nepal
UNESCO Bangkok
United NationsEducational, Scientific and
Cultural Organization

Chief Editor: Caroline Haddad Editor: Takayo Ogisu and Yoko Sato Design/Layout: Pongsuda Vongsingha and Sirisak Chaiyasook Cover photo: © UNESCO / Aliza Shrestha Dhungana
© UNESCO 2008
Published by theUNESCO BangkokMom Luang Pin Malakul Centenary Building 920 Sukhumvit Road, Prakanong, Klongtoey Bangkok 10110 Thailand
Printed in Thailand
The designations employed and the presentation of material throughout the publication do not imply the expression of any opinion whatsoever on the part of UNESCO concerning the legal status of any country, territory, city or area or of its authorities, or concerning its frontiers or boundaries.
Secondary education regional information base: country profile – Nepal. Bangkok: UNESCO Bangkok, 2008.
20 pp.
1. Secondary education. 2. Educational Policy. 3. Nepal.
ISBN 978-92-9223-212-2 (Print version)ISBN 978-92-9223-213-9 (Electronic version)
EPR/08/OS/011-300

Table of Contents
List of Tables and FiguresAcknowledgementReader’s GuideAbbreviations
1. Secondary Education at a Glance . . . . . . . . . . . . . . . . . . . 1
1.1 Education System . . . . . . . . . . . . . . . . . . . . . . . . . 11.2 Size of Schooling Sector. . . . . . . . . . . . . . . . . . . . . . 11.3 Access and Participation . . . . . . . . . . . . . . . . . . . . . 21.4 Geographical Distribution of Access . . . . . . . . . . . . . . . . 31.5 Student Progression . . . . . . . . . . . . . . . . . . . . . . . 31.6 TPR and Average Class Size . . . . . . . . . . . . . . . . . . . . 4
2. Institutional Context of Secondary Education . . . . . . . . . . . . 4
2.1 Education System . . . . . . . . . . . . . . . . . . . . . . . . . 42.2 Legislative Framework and Key Policy Documents . . . . . . . . . 42.3 Administrative Structure . . . . . . . . . . . . . . . . . . . . . 52.4 Financing . . . . . . . . . . . . . . . . . . . . . . . . . . . . . 7
3. General Secondary Education (GSE) . . . . . . . . . . . . . . . . . 9
3.1 Types of Schools . . . . . . . . . . . . . . . . . . . . . . . . . 93.2 Admission Requirements to Secondary Education . . . . . . . . . 93.3 Student Assessment and Promotion . . . . . . . . . . . . . . . .103.4 Tuition . . . . . . . . . . . . . . . . . . . . . . . . . . . . . .103.5 Curriculum . . . . . . . . . . . . . . . . . . . . . . . . . . . .11
4. Private Education . . . . . . . . . . . . . . . . . . . . . . . . . .12
5. Secondary Level Technical and Vocational Education . . . . . . . . .13
6. Teachers in GSE . . . . . . . . . . . . . . . . . . . . . . . . . . .14
6.1 Teacher Management . . . . . . . . . . . . . . . . . . . . . . .146.2 Qualifications and Pre-service Training . . . . . . . . . . . . . . .146.3 In-service Training . . . . . . . . . . . . . . . . . . . . . . . .14
7. Recent Reforms . . . . . . . . . . . . . . . . . . . . . . . . . . .15
8. Involvement of Development Agencies . . . . . . . . . . . . . . .16
9. Relevant Documents and Additional Resources . . . . . . . . . . .17
Reference . . . . . . . . . . . . . . . . . . . . . . . . . . . . . . . . .19
Background Statistics: Development Indicators . . . . . . . . . . . . . . .21

Table 1. School-aged Population, 2006 . . . . . . . . . . . . . . . . . . . . . . . . . . . . . . . . 1
Table 2. Enrolment, 2006 . . . . . . . . . . . . . . . . . . . . . . . . . . . . . . . . . . . . . . . 1
Table 3. Number of Teaching Staff, 2003 . . . . . . . . . . . . . . . . . . . . . . . . . . . . . . . 1
Table 4. GER in Secondary Education, 2006 . . . . . . . . . . . . . . . . . . . . . . . . . . . . . . 2
Table 5. NER in Secondary Education, 2006/07 . . . . . . . . . . . . . . . . . . . . . . . . . . . . 2
Table 6. GER by Ecological and Development Region and Sex, 2006/07 . . . . . . . . . . . . . . . . 3
Table 7. Progression Indicators, 2005 . . . . . . . . . . . . . . . . . . . . . . . . . . . . . . . . . 3
Table 8. Teacher-pupil Ratio, 2006 . . . . . . . . . . . . . . . . . . . . . . . . . . . . . . . . . . 4
Table 9. Average Class Size, 2006 . . . . . . . . . . . . . . . . . . . . . . . . . . . . . . . . . . . 4
Table 10. Secondary Education Management by Government Authority . . . . . . . . . . . . . . . . 7
Table 11. Public Expenditure on Education, 2003 . . . . . . . . . . . . . . . . . . . . . . . . . . . . 8
Table 12. Types and Numbers of Secondary Schools and Administrative Authority, 2006/07 . . . . . . . 9
Table 13. Enrolment by Types of Institutions, 2006/07 . . . . . . . . . . . . . . . . . . . . . . . . . 9
Table 14. Percent of Repeaters by Grade and Sex, 2005/06 . . . . . . . . . . . . . . . . . . . . . . . 10
Table 15. Statutory School-opening and Teaching Weeks per Year, Teaching Hours per Week . . . . . . . 11
Table 16. Percent of Enrolment in Private Institutions, 2001 & 2003 . . . . . . . . . . . . . . . . . . . 12
Table 17. Percent of Enrolment in TVE Programmes, 2000-2006 . . . . . . . . . . . . . . . . . . . . . 13
Table 18. Number of Teachers and Key Indicators, 2003 . . . . . . . . . . . . . . . . . . . . . . . . . 14
Table 19. Minimum and Maximum Salary for Teachers, 2007/08 . . . . . . . . . . . . . . . . . . . . . 14
Figure 1. Education Structure: Approximate Starting Age and Duration . . . . . . . . . . . . . . . . 1
Figure 2. Change in Number of Enrolment, 1980-2005 . . . . . . . . . . . . . . . . . . . . . . . . . 2
Figure 3. Change in Number of Teaching Staff, 1980-2003 . . . . . . . . . . . . . . . . . . . . . . . 2
Figure 4. Change in GER by Level, 1970-2005 . . . . . . . . . . . . . . . . . . . . . . . . . . . . . 2
Figure 5. GER by Ecological and Development Region, 2006/07 . . . . . . . . . . . . . . . . . . . . 3
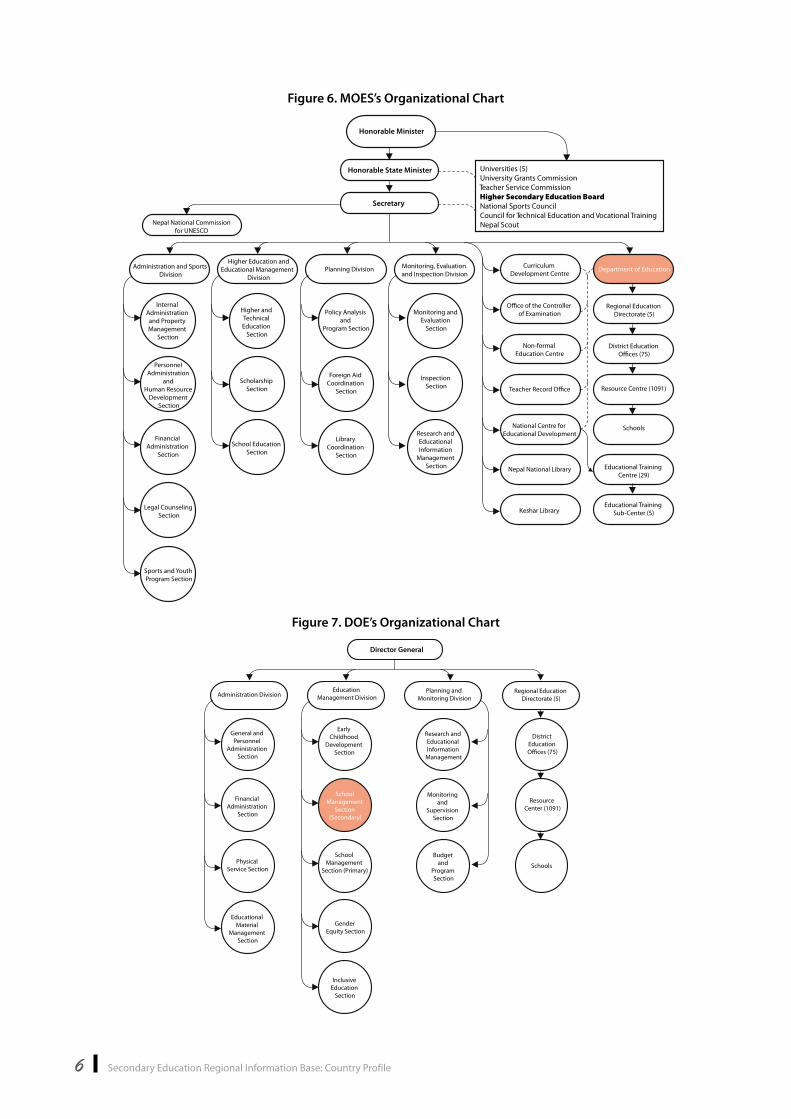
Figure 6. MOES’s Organizational Chart . . . . . . . . . . . . . . . . . . . . . . . . . . . . . . . . . 6
Figure 7. DOE’s Organizational Chart . . . . . . . . . . . . . . . . . . . . . . . . . . . . . . . . . 6
Figure 8. Resource Allocation by Level as % of Total Education Expenditure, 2005/06 & 2006/07 . . . . . 8
Figure 9. Resource Allocation by Nature of Spending as % of Total Education Expenditure, 2006/07 . . . 8
List of Tables and Figures

Acknowledgement
This Nepal Country Profile has particularly benefited from inputs provided by Mr. Hari Prasad Lamsal, Deputy Director, Department of Education, Sanothimi, Nepal, and Mr. Gambhir Man Tandukar, national consultant. The most recent data/information included within this report has been collected thanks to the collaboration of relevant offices/departments at the Federal Democratic Republic of Nepal, Ministry of Education and Sports.
This publication is part of a series of Secondary Education Regional Information Base Country Profiles developed by the Education Policy and Reform (EPR) Unit in collaboration with the Assessment, Information Systems, Monitoring and Statistics (AIMS) Unit and other relevant UNESCO Field Offices. Technical assistance was provided by UNESCO Kathmandu.
The project receives a generous financial contribution from the Japanese Government.

Reader’s Guide
The following symbols are used in the statistical tables:
… No data available
na Not applicable
* National estimation
** UIS estimation
- Magnitude nil or negligible
+n Data refers to the school or financial year (or period) after the reference year (or period)
-n Data refers to the school or financial year (or period) before the reference year (or period)
General Notes:
The Secondary Education Information Base: Country Profile uses statistics from the UNESCO Institute for Statistics (UIS) and national sources. Although, in principle, UIS statistics are used as the primary data source to facilitate comparison with other countries, nationally available statistics are used extensively where specific data is not available from UIS.
All data indicated as UIS data was retrieved from the UIS Data Centre (http://www.uis.unesco.org) on June 3, 2008. Statistics from national sources were collected through questionnaires, and the original sources are indicated under each table/figure.
All tables and figures have been compiled by UNESCO Bangkok.
Definitions:
A comprehensive list of education indicators, including their definition, purpose, calculation method, and formulas used in their calculation, is available from the UIS Glossary of Education Indicators (http://www.uis.unesco.org/ev.php?ID=5202_201&ID2=DO_TOPIC).
The year cited in tables and figures refers to the year in which the academic or financial year ends. Therefore, wherever the given year is spread across two calendar years, the year is cited according to the later year (e.g. academic year 2003/04 is presented as 2004). As for the statistics retrieved from national sources, the reference year is reserved as presented in the original source.
Levels of education in UIS statistics are defined according to the International Standard Classification of Education (ISCED97: http://www.uis.unesco.org/ev.php?ID=3813_201&ID2=DO_TOPIC). In the case of Nepal, the lower level of secondary education (ISCED 2) refers to lower secondary education (Grade 6-8) and the upper level (ISCED 3) to secondary education (Grade 9-10). Although higher secondary education (11-12) is generally considered part of secondary education in Nepal, its data is not included in either UIS or national statistics in this report because no age-based enrolment data or other indicators are collected in a systematic matter.
To distinguish nationally-defined defined terms from those used more generally in the international context, italics are used throughout the text to describe different levels of secondary education, i.e., lower secondary, secondary and higher secondary.

Abbreviations
ADB Asian Development Bank
CDC Curriculum Development Centre
CIA Central Intelligence Agency
CTEVT Council for Technical Education and Vocational Training
DEO District Education Office
DOE Department of Education
EFA Education for All
GER Gross Enrolment Ratio
GPI Gender Parity Index
GSE General secondary education
HSEB Higher Secondary Education Board
IBE International Bureau of Education
MOES Ministry of Education and Sports
MOF Ministry of Finance
NCF National Curriculum Framework
NCED National Centre for Educational Development
NPA National Plan of Action
NPC National Planning Commission
NPR Nepalese Rupee (currency)
OCE Office of the Controller of Examination
PPP Purchasing Power Parity
REO Regional Education Office
SIDA Swedish International Development Cooperation Agency
SMC School Management Committee
SLC School Leaving Certificate
SSA School Sector Approach
TA Technical Assistance
TPR Teacher-pupil Ratio
TSC Teacher Service Commission
TVE Technical and Vocational Education
UGC University Grants Commission
UIS UNESCO Institute for Statistics
UNDP United Nations Development Programme
UNESCO United Nations Educational, Scientific, and Cultural Organization
USD United States Dollar (currency)
WB World Bank

1Nepal
1. Secondary Education at a Glance
1.1 Education System
Figure 1. Education Structure: Approximate Starting Age and Duration
3 4 5 6 7 8 9 10 11 12 13 14 15 16 17 18 19 20 21 22 23 24
1 2 3 4 5 6 7 8 9 10 11 12 13 14 15 16 17 18 19 20
Vocational Secondary (Diploma)
Annex Programmes (short/long)
Technical and Vocational Secondary
Basic Education
Compulsory Education
Free Education
Secondary
Higher Sec. Higher Education
Bachelor's and Master's Degrees
Doctorate
Approximate age
Approximate grade
Level of education Pre-Primary Primary Education
Lower Secondary
1.2 Size of Schooling Sector
Nepal
Table 3. Number of Teaching Staff, 2003
Number of teaching staff
Ave. Annual Growth Rate, 2000-2003
Primary 110,173 7.23%
Secondary 52,528 5.44%
Lower secondary 28,160 4.38%
Upper secondary 24,368 6.71%
Source: UNESCO Institute for Statistics. 2008.
Note: Average annual growth rate was calculated by UNESCO Bangkok on the basis of UIS statistics.
Table 1. School-aged Population, 2006
School-aged population
Ave. Annual Growth Rate, 2001-2006
Primary 3,571,285 1.49%
Secondary 4,596,202 3.20%
Lower secondary 2,067,617 3.13%
Upper secondary 2,528,585 3.25%
Source: UNESCO Institute for Statistics. 2008.
Table 2. Enrolment, 2006
EnrolmentAve. Annual Growth
Rate, 2001-2006
Primary 4,502,697 7.24%
Secondary 1,983,561** 9.28%
Lower secondary 1,374,796 12.06%
Upper secondary 608,765** 3.75%
Source: UNESCO Institute for Statistics. 2008.

2 Secondary Education Regional Information Base: Country Profile
Figure 2. Change in Number of Enrolment, 1980-2005
0
500
1,000
1,500
2,000
2,500
3,000
3,500
4,000
4,500
1980 1985 1990 1995 2000 2005
Enro
lmen
t (00
0)
-Lower Secondary -Upper Secondary
Primary Secondary
Source: UNESCO Institute for Statistics. 2008.
Figure 3. Change in Number of Teaching Staff, 1980-2003
0
20
40
60
80
100
120
1980 1985 1990 1995 2000 2003
Num
ber o
f tea
chin
g st
a� (0
00)
-Lower Secondary -Upper Secondary
Primary Secondary
Source: UNESCO Institute for Statistics. 2008.
1.3 Access and Participation
Figure 4. Change in GER by Level, 1970-2005
26.1
52.8
85.6
79.9
107.7 109.1 116.7 113.3
9.5 13.4
21.6 25.2 33.1
39.7 35.3
45.7
1.9
2.7 4.4 5.2 4.4 4.1 5.6 0
20
40
60
80
100
120
140
160
180
200
1970 1975 1980 1985 1990 1995 2000 2005
Gro
ss e
nrol
men
t rat
e (%
)
Primary Secondary Tertiary
Source: UNESCO Institute for Statistics. 2008.
Note: Tertiary data from year 2004.
Table 4. GER in Secondary Education, 2006
Total Male Female GPI
Secondary 43.2%** 45.7%** 40.5%** 0.89**
Lower secondary 66.5% 70.1% 62.7% 0.89
Upper secondary 24.1%** 25.7%** 22.3%** 0.87**
Source: UNESCO Institute for Statistics. 2008.
Table 5. NER in Secondary Education, 2006/07
Total Male Female GPI
Secondary 45.5% 49.2% 41.7% 0.85
Lower secondary 52.3% 57.1% 47.8% 0.84
Upper secondary 34.7% 37.0% 32.4% 0.88
Source: DOE. 2006.

3Nepal
1.4 Geographical Distribution of Access
Figure 5. GER by Ecological and Development Region, 2006/07
71.5
63.6
78
96.9
64.3
76.5
63.3
84.5
67.5 66.3
56.752.6
63.4
71.6
49.5
66.2
50.1
69.7
48.4
38.4
0
10
20
30
40
50
60
70
80
90
100
Nepal Mountain Hill Valley Terai Eastern Central Western Mid western western
Far
Gro
ss e
nrol
men
t rat
e (%
)
Lower Secondary
Upper Secondary
Ecological Region Development Region
Source: DOE. 2006.
Table 6. GER by Ecological and Development Region and Sex, 2006/07
Lower Secondary Upper Secondary
Male Female GPI Male Female GPI
Ecol
ogic
al re
gion
Mountain 72.9% 54.5% 0.75 58.4% 46.7% 0.80
Hill 81.6% 74.6% 0.91 66.0% 60.8% 0.92
Valley 98.2% 95.5% 0.97 71.3% 71.9% 1.01
Terai1 72.9% 56.2% 0.77 54.1% 44.7% 0.83
Total 77.9% 65.4% 0.84 60.2% 53.1% 0.80
Dev
elop
men
t reg
ion Eastern 81.3% 71.9% 0.88 69.9% 64.5% 0.92
Central 69.4% 57.5% 0.83 53.1% 47.0% 0.89
Western 89.3% 80.0% 0.90 72.2% 67.2% 0.93
Mid western 76.2% 59.0% 0.77 54.3% 42.6% 0.78
Far western 76.8% 56.1% 0.73 44.6% 32.0% 0.72
Total 77.9% 65.4% 0.84 60.2% 53.1% 0.80
Nepal Total 77.9% 65.4% 0.84 60.2% 53.1% 0.88
Source: DOE. 2006.
Note: Gender Parity Index (GPI) was calculated by UNESCO Bangkok on the basis of DOE. 2006.
1.5 Student ProgressionTable 7. Progression Indicators, 2005
Gross Primary Graduation Ratio …
Transition rate from Primary to Secondary 76.7%-2**
Gross Enrolment Ratio in Total Secondary 45.7%
Percentage of Repeaters in Total Secondary 11.7%-2**
Upper Secondary Gross Graduation Ratio (General) …
Upper Secondary Gross Graduation Ratio (TVE) …
Source: UNESCO Institute for Statistics. 2008.
1 The area called Terai is situated in the southern part of Nepal, and is also called Madhesh. The original inhabitants of the region speak a variety of Indo-Aryan languages and people living in Terai are named Madhesi.

4 Secondary Education Regional Information Base: Country Profile
1.6 TPR and Average Class Size
Table 8. Teacher-pupil Ratio, 2006
Lower secondary 48.7
Upper secondary 35.0
Source: DOE. 2006.
Table 9. Average Class Size, 2006
Lower secondary …
Upper secondary …
2. Institutional Context of Secondary Education
2.1 Education System
The formal education system before higher education in Nepal is divided into five levels: 1) pre-primary or early childhood education for three to four years of age; 2) primary education (Grade 1-5), which caters to five to nine year-old children; 3) lower secondary education (Grade 6-8) for ten to twelve year-old children; 4) secondary education (Grade 9-10) for thirteen and forteen year-olds; and 5) higher secondary education (Grade 11-12) for fifteen and sixteen year-olds. Secondary education generally refers to Grade 6 -12, covering three distinct levels of education, i.e. lower secondary, secondary, and higher secondary education.
Before the Interim Constitution of 2007 took effect, which ensures free provision of primary and secondary education, only primary education was provided free of charge for all children and secondary education was free only for female students and children from low caste (Dalit2), poor, and ethnic minorities (Janajatis3) in accordance with the Education Act of 1971. The free provision of secondary education is on a step by step basis.
At present, the government is trying to expand basic education to include lower secondary level, ultimately aiming at the establishment of an 8-year basic education programme (current primary + lower secondary) followed by 4-year secondary education (current secondary + higher secondary). According to the Education for All National Plan of Action 2001-2015 (EFA-NPA), expanded basic education will be implemented on a pilot basis in 2012. More recently, the ongoing School Sector Reform aims to pilot 8-year basic education in 2007/08 for three years, and full implementation from 2009/10 onward.
(See Figure 1. Education Structure: Approximate Starting Age and Duration on page 1.)
2.2 Legislative Framework and Key Policy Documents
Interim Constitution (2007)
According to the Interim Constitution, each citizen has the right to receive free education from the State up to the secondary level, and each community has the right to provide basic education in its mother language in order to preserve and promote its script, culture and cultural heritage.
Education Act (1971) and Education Regulation (2002)
The Education Act and Education Regulation serve as a basic legal framework for the overall management and administration of school education (Grade 1-10). The principle aim of the Act is to prepare manpower for national development and to maintain the good conduct, decency and morality of the people in consonance with the multi-party democratic system. According to the Education Act, primary education is provided free of charge for all children enrolled in community schools and textbooks are also provided at no cost. As for lower secondary and secondary education, free education is provided for girls as well as for Dalit and tribal children whose family income falls below the poverty line.
2 Nepali society is deeply rooted in the ancient Hindu caste system hierarchy of different groups of people. Dalit is considered one of the lowest and underprivileged groups. Its people have been deprived of basic rights, including rights to education. The group is often called ‘untouchable’, harijan (Child of Hai), achhoot (Outlaw) or ‘oppressed people’.
3 Janajatis are those communities that have their own ethnic language other than Nepali and observe their own distinct customs and tradition than the Hindu, the dominant group in Nepal. The Government recognizes Janajatis/Adivasis in its official list.

5Nepal
Education for All National Plan of Action 2001-2015 (2001)
The Education for All National Plan of Action (EFA-NPA) serves as a core policy document in the education sector. In EFA-NPA, the main focus is on primary education, more specifically on the equality of access to primary education between males and females as well as among ethnicities. Although EFA-NPA spells out the introduction of 8-year basic education (including lower secondary) in its long-term plan, there is no specific provision on the policies for the upper levels of education (i.e. secondary and higher secondary education).
Education for All, Core Document 2004-2009 (2004)
The EFA Core Document 2004-2009 is a five-year strategic plan within the EFA 2015 framework. It has the following three objectives: (i) to ensure access and equity in primary education, (ii) to enhance the quality and relevance of primary education, and (iii) to improve efficiency and institutional capacity. While this document mainly focuses on primary education, it is linked with the secondary level in certain aspects, such as awareness-raising, infrastructural development of schools, teacher post-retirement pensions and other benefits.
Three-Year Interim Plan 2007/08-2009/10 (2007)
The Three-Year Interim Plan was prepared by the National Planning Commission (NPC). It states that under the reformed system of 8-year basic education (Grade 1-8) followed by 4-year secondary education (Grade 9-12), general, technical, and vocational courses will be further developed and introduced at the secondary level. It also spells out the need for revised policy in order to expand access to secondary education, especially among people below the absolute poverty line. Annual work plans and budgets are prepared in line with the Plan.
2.3 Administrative Structure
Educational administration in Nepal is decentralized on three levels: the central level, which is managed by the Ministry of Education and Sports (MOES); the regional level, managed by regional education directorates (REDs); and the district level, managed by district education offices (DEOs). MOES is responsible for overall policy development, planning, monitoring and evaluation in the education sector across the country.
The Department of Education (DOE) under MOES, with its direct line of command through the regional and district offices, maintains/has full administrative and financial authority and also holds responsibility for implementing and monitoring education programmes. More specifically, one of the school management sections within the Education Management Division under DOE is responsible for implementing programmes related to the lower secondary and secondary levels of education (G6-10). As for higher secondary education, the autonomous Higher Secondary Education Board (HSEB) is responsible for policy-making and implementation.
At the regional level, REDs take responsibility for coordinating, monitoring, and supervising the school-level teaching/learning, as well as planning within each region. DEOs, located at the most decentralized level in the administrative hierarchy, manage the planning and implementing of educational development activities. They also supervise and monitor teaching/learning processes at the district level in accordance with national policies, programmes, and the directives of the Ministry, departments, and concerned RED.
In addition to these administrative bodies, resource centres and school management committees (SMC) also play important roles. Resource centres are established in each of the clusters, which may encompass from five to thirty districts depending on school populations and geographical locations. Resource centres provide professional support and services to the schools within the cluster. At the school level, an SMC is set up and composed of selected representatives, including parents, community members and school administrators. The committee is responsible for the overall management, supervision, and functioning of the school.
6 Secondary Education Regional Information Base: Country Profile
Figure 6. MOES’s Organizational Chart
Financial Administration
Section
Legal Counseling Section
Personnel Administration
and Human Resource
Development Section
Internal Administration and Property Management
Section
Higher and Technical Education
Section
Policy Analysis and
Program Section
Monitoring and Evaluation
Section
Inspection Section
Research and Educational Information
Management Section
Foreign Aid Coordination
Section
Library Coordination
Section
Scholarship Section
School Education Section
Administration and Sports Division
Higher Education andEducational Management
DivisionPlanning Division Monitoring, Evaluation
and Inspection DivisionCurriculum
Development CentreDepartment of Education
Honorable Minister
Universities (5) University Grants Commission Teacher Service Commission Higher Secondary Education Board National Sports Council Council for Technical Education and Vocational Training Nepal Scout
Honorable State Minister
Nepal National Commissionfor UNESCO
Secretary
O�ce of the Controller of Examination
Regional Education Directorate (5)
Non-formal Education Centre
District Education O�ces (75)
Resource Centre (1091)
Schools
Educational Training Centre (29)
Educational Training Sub-Center (5)
Teacher Record O�ce
National Centre for Educational Development
Nepal National Library
Keshar Library
Sports and Youth Program Section
Figure 7. DOE’s Organizational Chart
School Management
Section (Primary)
Gender Equity Section
School Management
Section (Secondary)
Early Childhood
Development Section
General and Personnel
Administration Section
Research and Educational Information
Management
District Education O�ces (75)
Resource Center (1091)
Schools
Monitoring and
Supervision Section
Budget and
Program Section
Financial Administration
Section
Physical Service Section
Administration DivisionEducation
Management DivisionPlanning and
Monitoring DivisionRegional Education
Directorate (5)
Director General
Educational Material
Management Section
Inclusive Education
Section

7Nepal
Table 10. Secondary Education Management by Government Authority
Functions Responsible body
General secondary educationDepartment of Education (DOE), MOES
Higher Secondary Education Board
Secondary level TVE Council for Technical Education and Vocational Training (CTEVT)
Private education Department of Education (DOE), MOES
Curriculum development and research
Curriculum Development Centre (CDC), MOES
Department of Education (DOE), MOES
Higher Secondary Education Board (HSEB)
Tribhuvan University (TU)
Personnel management
Department of Education (DOE), MOES
Higher Secondary Education Board (HSEB)
Teacher Service Commission (TSC)
Teacher education National Centre for Educational Development (NCED)
Learning assessment
Office of the Controller of Examinations(OCE), MOES
Curriculum Development Centre (CDC), MOES
Higher Secondary Education Board (HSEB)
Budgeting
Department of Education (DOE), MOES
Higher Secondary Education Board (HSEB)
University Grants Commission (UGC)
Ministry of Finance (MOF)
National Planning Commission (NPC), Office of the Prime Minister
Planning
Department of Education (DOE), MOES
Higher Secondary Education Board (HSEB)
University Grants Commission (UGC)
National Planning Commission (NPC), Office of the Prime Minister
EMIS
Department of Education (DOE), MOES
Higher Secondary Education Board (HSEB)
Council for Technical Education and Vocational Training (CTEVT)
University Grants Commission (UGC)
Table lists governmental offices/departments responsible for different functions of secondary education management.
2.4 Financing
With regard to educational financing in Nepal, the main budget source is the government. The government provides teacher salaries, management costs and program costs. At the decentralized level, district, municipality, and village development committees provide support for education, especially in terms of physical infrastructure (i.e. construction of classrooms) as well as teacher salaries. In addition, schools collect fees from students (except for females and students from low caste, ethnic group or poor families). (Please see 3.3 Tuition for details regarding financial support schemes for the disadvantaged in Nepal.)
Fiscal year is July 15 – July 14 of the following year.School year is April 15 – April 14 of the following year.

8 Secondary Education Regional Information Base: Country Profile
Table 11. Public Expenditure on Education, 2003
As % of GDP 13.1%**
As % of total govt. expenditure 14.9%
Per pupil as % of GDP per capita
Primary education 12.4%**
Secondary education 10.5%
Tertiary education 71.1%
Source: UNESCO Institute for Statistics. 2008.
Figure 8. Resource Allocation by Level as % of Total Education Expenditure, 2005/06 & 2006/07
62.1 60.8
24.0 24.1
1.410.6
9.3
1.42.4 2.23
0%
20%
40%
60%
80%
100%
2005/06 2006/07
OthersAdmin & MangementTVETTertiarySecondaryPrimary
Source: MOF. 2005 and 2006.
Figure 9. Resource Allocation by Nature of Spending as % of Total Education Expenditure, 2006/07
Capital expenditure 7.94%
Recurrent expenditure(other) 44.04%
Recurrent (salary for primary teachers) 32.50%
Recurrent (salary for secondary teachers) 15.51%
* Recurrent expenditure total: 92.05%
Source: MOF. 2006.

9Nepal
3. General Secondary Education (GSE)
3.1 Types of Schools
There are mainly three types of institutions providing secondary-level education in Nepal: community schools, institutional schools, and higher secondary schools. Community schools are usually run by the government or a community. Although the majority receive regular grants from the government, there are also some unaided community schools. Institutional schools are often referred to as ‘private’ schools. They do not receive regular governmental funding and are managed privately. In regards to lower secondary and secondary education, both community schools and institutional schools cater to these two levels, whereas only higher secondary schools provide education at the higher secondary level (which is often referred to as the intermediate level).
(See 4. Private Education for more details about non-public institutions.)
Table 12. Types and Numbers of Secondary Schools and Administrative Authority, 2006/07
Grade Administrative
AuthorityNumber of Institutions
6 7 8 9 10 11 12
Community lower secondary schools REO, DEO4,668 (Aided)
1,796 (Unaided)
Institutional lower secondary schools REO, DEO 2,001
Community secondary schools REO, DEO2,773 (Aided)
793 (Unaided)
Institutional secondary schools REO, DEO 1,525
Higher secondary schools HSEB 1,197
Source: DOE. 2006.
Note: Some community schools provide education at both lower secondary and secondary levels under the same institution.
Table 13. Enrolment by Types of Institutions, 2006/07
Enrolment
Lower Secondary (G6-8) Secondary (G9-10) Higher Secondary (G11-12)
Community schools (Aided) 951,587 73.13% 528,899 74.84%
Community schools (Unaided) 183,450 14.09% 62,168 9.15%
Institutional schools 166,097 12.76% 88,320 12.99%
Higher secondary schools … …
Source: DOE. 2006.
3.2 Admission Requirements to Secondary Education
In Nepal’s secondary education system, transition from primary to lower secondary depends on the results of the final examination that is conducted at the end of Grade 5. In order for students to be admitted, they are required to obtain at least 32% in the examination. Each school and its school management committee are responsible for administering the examination and evaluating students for admission into lower secondary schools. Generally, the same SMC usually takes responsibility for both lower secondary and secondary admission because many schools offer both lower secondary- and secondary-level education under the same institution. As for higher secondary education, admission is decided based on the results of the admission test that is organized by each school in accordance with the guidelines of the Higher Secondary Education Board (HSEB).

10 Secondary Education Regional Information Base: Country Profile
3.3 Student Assessment and Promotion
Once students enter the secondary education system, they are assessed periodically through three types of examinations that are administered during each school year i.e., two trimester tests and an annual examination. Among them, the results of the annual examination are used to decide whether a student will be promoted to a higher grade or not. These annual examinations are administered by subject teachers at the school level (except for the school-leaving examinations conducted at the end of each cycle). To be qualified to take the annual examination, students need to attend at least 70% of their classes during the school opening days.
School-leaving examinations are given to students in Grade 8, Grade 10 and Grade 12. The responsible bodies for administering the exams differ depending on the level of education. For lower secondary education (Grade 8), DEO is responsible for administering the examination, while for secondary level (Grade 10), the Office of the Controller of Examinations (OCE) under MOES administers the School Leaving Certificate (SLC) examination. There is also an SLC examination at the end of higher secondary education (Grade 12), and HSEB directly takes responsibility for its administration. The SLC examinations at Grade 8 and 10 are considered nation-wide examinations.
Table 14. Percent of Repeaters by Grade and Sex, 2005/06
Lower Secondary Upper Secondary
Grade 6 Grade 7 Grade 8 Grade 9 Grade 10
Both sexes 13.2% 9.1% 12.0% 12.5% 7.4%
Male 13.1% 9.1% 11.2% 11.6% 6.5%
Female 13.5% 9.2% 12.9% 13.6% 8.6%
Source: DOE. 2005.
3.4 Tuition
While primary education has been provided free of charge since 1971 (Education Act), the decision was made only in 2007 to introduce free secondary schooling. However, at present, tuition for secondary education is still collected in both community and institutional lower secondary/secondary schools. In the case of community lower secondary/secondary schools, students must pay NPR 500 (equivalent of US$ 7.06) or more per year, whereas institutional lower secondary and secondary schools collect NPR 4,000-12,000 (equivalent of US$ 56.50–169.50) or NPR 6,000-12,000 (equivalent of US$ 84.75–169.50) per year per student depending on the institution.4
In addition, based on the proposed fee rates submitted to the Ministry, each school collects various kinds of fees for activities such as sports, special training, boarding, dining and study visits, as well as for repair and maintenance of facilities such as libraries and laboratories. The Education Regulation of 2002 addresses these additional costs.
Support Programme
There is a special consideration for female students and students from the low caste (i.e. Dalits), ethnic groups (i.e. Janajatis), and poor families living below the poverty line. The Education Act, issued in 1971, spells out the free provision of primary, lower secondary and secondary education for those children. Furthermore, several scholarship programmes support specific disadvantaged groups to access education at government-run primary, lower secondary and secondary level schools, namely the community schools. These scholarship programmes mainly target the low castes, females or students from hill country areas (i.e. Terai).
4 1 NPR = 0.0141243 USD (as of 4 September 2008)

11Nepal
3.5 Curriculum
The Curriculum Development Centre (CDC) is responsible for developing and implementing curriculum, text books, teaching/learning materials, teacher guides, assessment guides and so on. The present curriculum took effect at the lower secondary level in 2001, the secondary level in 1998 and the upper secondary level in 1990. Localization of the curriculum has thusfar been implemented only at the primary level.
The current curriculum for lower secondary and secondary education can be characterized as functional and life skill-based. It accentuates problem-solving approaches based on daily, practical needs.
Table 15. Statutory School-opening and Teaching Weeks per Year, Teaching Hours per Week
School Opening Days per Year (minimum)
Teaching Weeks per Year (minimum)
Teaching Hours per Week (minimum)
Lower secondary 220 days 30 weeks 30 hours
Upper secondary 220 days 30 weeks 30 hours
Source: MOES. 2002.
A more comprehensive and detailed description of the curriculum is available from the “World Data on Education” (http://www.ibe.unesco.org/Countries/WDE/2006/index.html) database by IBE.

12 Secondary Education Regional Information Base: Country Profile
4. Private Education
In Nepal, non-public institutions providing formal education services are referred to as institutional schools (i.e. institutional lower secondary schools, institutional secondary schools). Institutional schools obtain governmental permission for their operation by submitting a detailed particulars and a recommendation letter from the concerned DEO. Once registered, institutional schools are required to use the curricula and textbooks that are government-approved and recruit licensed teachers who have been certified by the Teacher Service Commission (TSC).
Although some policy documents, i.e. Education Act, EFA-NPA, and Three Year Interim Plan, encourage private provision of education, institutional schools do not receive any governmental funding, and parents of children enrolled in institutional schools need to pay full fees. The fees vary according to the services provided, as well as to the performance status achieved by the schools.
Table 16. Percent of Enrolment in Private Institutions, 2001 & 2003
2001 2003
All General TVE All General TVE
Secondary education 15.91% 15.52% 43.52% 22.77% 27.73% 32.76%
Lower secondary 9.92% 9.92% na 22.74% 22.74% na
Upper secondary 26.45% 25.77% 43.52% 36.12% 36.20% 32.76%
Source: UNESCO Institute for Statistics. 2008.
Note: The percents were calculated by UNESCO Bangkok on the basis of UIS Statistics.

13Nepal
5. Secondary Level Technical and Vocational Education
Technical and vocational education (TVE) at the secondary level is managed by the Council for Technical Education and Vocational Training (CTEVT) under MOES. General community schools and technical schools provide TVE programmes through their annex programmes and TVE programmes, respectively. Both annex programmes and technical schools cater to the secondary level, i.e. Grade 9-10. CTEVT offers three-year diploma courses at the higher secondary level. Other than MOES, the Ministry of Industry and Commerce also provides short-term TVE programmes at the secondary level.
Annex programmes provide both short- and long-term programmes in technical education and vocational training to unemployed and school drop-out youth through maximum utilization of existing physical facilities, human resources and school management. It is believed that annex programmes open a strong option for youth to advance their careers. The Tenth Five-Year Plan (2002) stipulates delivery of TVE programmes through 75 community schools, which is contingent upon CTEVT approval. The plan also sets participation targets of 40 and 100 participants per school (short- and long-term programmes, respectively).
As for technical schools, currently there are 17 institutions in Nepal, established in cooperation with various TVE partners and donors. They provide programmes on agriculture, construction, health, mechanics, electrical installation/maintenance, tourism, sanitation, and so on.
Although students are not allowed to switch their academic/vocational streams under the current system, a new policy will be implemented so that students who are in TVE institutions can be admitted into academic institutions and vice versa.
Table 17. Percent of Enrolment in TVE Programmes, 2000-2006
2000 2001 2002 2003 2004 2005 2006
Secondary education 1.37% 1.39% 1.22% 0.86% ... 1.05% 1.09%**
Lower secondary na na na na na na na
Upper secondary 4.27% 3.83% 3.25% 2.29% ... 3.55% 3.55%**
Source: UNESCO Institute for Statistics. 2008.

14 Secondary Education Regional Information Base: Country Profile
6. Teachers in GSE
Table 18. Number of Teachers and Key Indicators, 2003
Number of teachers Percent of female teachers Percent of trained teachers Teacher-pupil ratio
Secondary education 46,194+2 13.5% 28.2%-1 34.7
- Lower secondary 29,895+1 15.9% 25.8% 40.4
- Upper secondary 20,232+2 10.8% 28.5%-1 28.1
Source: UNESCO Institute for Statistics. 2008.
6.1 Teacher Management
At the national level, the Teacher Service Commission (TSC) is ultimately responsible for licensing and selecting permanent teachers. However, the district level holds primary responsibility for teacher management with district education offices (DEOs) playing a crucial role recruiting and deploying/redeploying teachers. Additionally, school management committees (SMCs) at the school level are responsible for the recruitment of temporary teachers in their respective schools.
6.2 Qualifications and Pre-service Training
In order to become a teacher in a lower secondary school, one should complete twelve years of education to meet the academic requirement. If a candidate’s major is not in education, a ten-month teacher training is also required. Teacher training programmes are offered by training institutions at the higher secondary level, and the National Centre for Education Development (NCED) in MOES holds the main responsibility. Similarly, teachers in secondary schools should acquire a bachelor’s degree (equivalent to fifteen years of education) and complete a ten-month teacher training when their majors are other than education.
In addition to the minimum academic requirement described above, all applicants need to pass a teacher licensing examination (administered annually by TSC) to become eligible for recruitment. Once the license is acquired, it remains permanently valid. Applicants are also required to complete practicum training for one to one-and-a-half months for both lower secondary and secondary levels.
For higher secondary teachers, there is no teacher licensing system.
6.3 In-service Training
The National Centre for Educational Development (NCED) manages in-service training for both lower secondary and secondary teachers. Under the overall supervision of NCED, actual trainings are offered in educational training centres. The training programme lasts a total of ten months, and is divided into three packages: the first package is for 2.5 months, the second for five months, and the third package for 2.5 months. Participation in training courses is taken into consideration in teachers’ career development. The District Education Office (DEO) consults with SMC to make decisions regarding in-service teacher training.
There are no institutionalized in-service teacher training opportunities for higher secondary teachers.
Table 19. Minimum and Maximum Salary for Teachers, 2007/08
Minimum salary Maximum salary
Amount per year % to GDP per capita Amount per year % to GDP per capita
- Lower secondary NPR 106,358 390.89% NPR 204,054 749.95%
- Upper secondary NPR 162,590 597.56% NPR 263,126 967.06%
Source: MOF. 2007.
Note: % to GDP per capita was calculated by Hari Prasad Lamsal, Deputy Director, Department of Education, Sanothimi, Nepal.

15Nepal
7. Recent Reforms
School Sector Reform Programme
The School Sector Reform (SSR) Programme aims to construct an integrated grade 1-12 school system. The reform will structually and functionally adjust grades 1-8 into basic education and grades 9-12 into secondary education. By doing so, the reform also aims to efficiently use human and material resources, and to allow more autonomy, inclusion and participation. This adoption of an autonomous and flexible approach to secondary education allows the roles played by the local communities to be magnified in the areas of governance, management, resourcing, and quality assurance. SSR also aims to harmonize educational choices in terms of relevance, appropriateness, and value orientations. A vocational stream at the secondary level (from Grade 9) will also be introduced in the new system, and it will enable students on a vocational track to enter tertiary education after completing an additional one-year bridge course. With a goal to meet the demands of development, it is expected that the SSR will provide children with greater opportunities to attain desired knowledge, skills and values. In terms of timeframe, the 12-year education cycle (8-2-2) was introduced in 2007 on a pilot basis, and full implementation of the reform is expected in 2010.
National Curriculum Framework (NCF)
The National Curriculum Framework (NCF) addresses curriculum reform in primary and secondary level education (Grade 1-12). Its main components are: (i) to integrate the curriculum framework for grades 1-12; (ii) to make the curriculum framework sustainable, with primary focus on inclusiveness and partnership; (iii) to address employment-oriented education; (iv) to allow admission from general education to TVE and vice versa; (v) to introduce school-based internal assessments; (vi) to reduce the number of core subjects tested in the School Leaving Certificate (SLC) examination from seven to five; (vii) to decentralize the present SLC examination at the RED level; (viii) to introduce automatic promotion up to Grade 7; and (ix) to develop and utilize several types of textbooks, i.e. written in several languages or by several different writers.

16 Secondary Education Regional Information Base: Country Profile
8. Involvement of Development Agencies
Below is the list of major secondary education-related projects (either on-going or recently completed) that receive support from external development agencies (as of September 2008).
Project TitleAgency
(type of assistance)Level of
EducationImplementation
PeriodLinks
Second Higher Education Project
WB (Grant) HS 2007-2014 http://web.worldbank.org/external/projects/main?pagePK=64283627&piPK=73230&theSitePK=40941&menuPK=228424&Projectid=P090967
Education Sector Development
ADB (TA/Loan/Grant) Sector-wide 2005-2010 http://www.adb.org/Projects/project.asp?id=35174
Secondary Education Support Project (SESP)
ADB/DANIDA
(TA/Loan/Grant)
LS+S 2000-2009 http://www.adb.org/Projects/project.asp?id=34022
Community School Support Project
WB (Credit) PE+LS+S 2003-2008 http://web.worldbank.org/external/projects/main?pagePK=64283627&piPK=73230&theSitePK=40941&menuPK=228424&Projectid=P082646
Education Sector Development Policy and Strategy
ADB (TA) Sector-wide 2004-2007 http://www.adb.org/Projects/project.asp?id=38048
Secondary Education Development
ADB (TA/Loan) LS+S 1990-2000 http://www.adb.org/Projects/project.asp?id=18011
TA = Technical Assistance; PE = Primary education; LS = Lower secondary; S=Secondary; HS = Higher Secondary
Implementation period: from the year of project approval to the [estimated] project completion year
The projects and information listed here are taken from agency websites.

17Nepal
9. Relevant Documents and Additional Resources
Listed below are documents and websites that provide country-specific information on education or the secondary education sub-sector.
Publications
Koirala, B. N., and Acharya, S. 2005. Girls in Science and Technology Education: A study on access, participation, and performance of girls in Nepal. UNESCO Kathmandu Series of Monographs and Working Papers: No. 4. Kathmandu, UNESCO. (Available from UNESCO Kathmandu website: http://unesdoc.unesco.org/images/0013/001394/139412e.pdf (PDF: 734 kb))
Pande, B. D., Thapa, B. K., and Karki, U. B. 2001. Achievement of Lower Secondary School Students in Population and Environmental Education. Kathmandu, Nepal: IUCN Nepal.
Documents
The Government of Nepal
Annual Strategic Implementation Plan (ASIP), 2006-07. http://www.doe.gov.np/admin/publication/files/125/asip%201n%202.pdf (PDF; 866kb)
A Perspective Secondary Education Development Plan, 2001
Business Plan for the Education Sector, 2005
Medium Term Expenditure Framework, 2005
Report of the High Level Working Committee on Education, 2001
Report of High Level National Education Commission, 1999. http://www.educationlaw.gov.np/english/files/pdf/Report/Report%20of%20the%20Highlevel%20National%20Education%20Commission_%202055.pdf (PDF; 100kb)
The National Education for All (EFA) Action Plan 2003-2015. http://www.unescobkk.org/fileadmin/user_upload/efa/NepalNatlPlan.doc (Word file; 1.1Mb)
Websites
Asian Development Bank: www.adb.org (English)
Key Indicators: http://www.adb.org/Documents/Books/Key_Indicators/2008/Country.asp
Education Sector Advisory Team, DANIDA Nepal: www.esat.org.np (English)
International Bureau of Education: www.ibe.unesco.org (English)
World Data on Education: http://www.ibe.unesco.org/Countries/WDE/2006/index.html
Ministry of Education and Sports: www.moe.gov.np (English)
Department of Education: http://www.doe.gov.np/ (English)
Research Centre for Educational Innovation and Development, Nepal: www.cerid.org (English)
UNESCO (Kathmandu): www.unesco.org/kathmandu/ (English)
UNESCO Institute for Statistics: www.uis.unesco.org (English)
Data centre: http://stats.uis.unesco.org/ReportFolders/reportfolders.aspxCountry/Regional Profiles: http://www.uis.unesco.org/profiles/selectCountry_en.aspx
UNICEF Nepal: www.unicef.org/infobycountry/nepal.html (English)

18 Secondary Education Regional Information Base: Country Profile
World Bank: www.worldbank.org (English)
Country Website: http://www.worldbank.org.np/WBSITE/EXTERNAL/COUNTRIES/SOUTHASIAEXT/NEPALEXTN/0,,menuPK:148707~pagePK:141159~piPK:141110~theSitePK:223555,00.html? (English); http://www.bishwabank.org.np (Nepal)
Data and Statistics: http://go.worldbank.org/X1EXSQ8Q70

ReferenceCentral Intelligence Agency. 2008. The World Fact Book. https://www.cia.gov/cia/publications/factbook/ (Accessed 23 July 2008)
Department of Education. 2005. Flash Report.
-----------.2006. Flash Report.
Ministry of Education and Sports. 2002. Education Regulation.
Ministry of Finance. 2005. MOF Red Book 2005/06.
-----------. 2006. MOF Red Book 2006/07.
-----------. 2007. Economic Survey.
UNDP. 2007. Human Development Report 2007/2008 database. http://hdr.undp.org/en/statistics/ (Accessed 22 July 2008)
UNESCO. 2007. Global Monitoring Report 2008. Paris, UNESCO.
UNESCO Institute for Statistics. 2008. Data Centre. http://stats.uis.unesco.org/ReportFolders/reportfolders.aspx (Accessed 3 June 2008)
UNPD. 2007. World Population Prospects: Population database (2006 Revision). http://esa.un.org/unpp/ (Accessed 22 July 2008)

UNESCO Bangkok
Education Policy and Reform (EPR)
Mom Luang Pin Malakul Centenary Building 920 Sukhumvit Road, Prakanong, Klongtoey Bangkok 10110 Thailand
Tel: (66-2) 391 0577 Email: [email protected] http://www.unescobkk.org
Country profiles are updated on a regular basis. Visit the Secondary Education Regional Information Base website to access the latest version or to check the status of updates. Other country profiles are also available from the website (http://www.unescobkk.org/education/epr/sepra/infobase).

Background Statistics: Development Indicators
Geography
1 Area143,181 sq km2 (land)
4,000 sq km2 (water)
Source: Central Intelligence Agency. 2008.
Demography
2 Total population, 2005 27.1 millions
3 Population growth rate, 2000-2005 2.08 %
4 Life expectancy at birth, 2000-2005
61.3 years (total)
61.0 years (male)
61.6 years (female)
5 Total fertility rate, 2000-2005 3.68
Source: UNPD. 2007.
Social and Economic Indicators
6 Population below the national poverty line, 1990-2004 30.9 %
7 Population below the absolute poverty line, 1990-2005 24.1 %
8 GDP, 2005USD 7.4 billion
USD 42.1 billion (PPP)
9 GDP per capita, 2005USD 272
USD 1,550 (PPP)
10 GDP per capita annual growth rate, 2005 2.0 %
11 Human Development Index, 2005 0.534
Source: UNDP. 2007.
Education Indicators
12 Adult literacy rate (ages 15 and above), 2007(1) 56.5 %**
13 Youth literacy rate (ages 15-24), 2007(1) 79.3 %**
14 School life expectancy, 2003(1)
8.9 years (total)**
9.8 years (male)**
8.0 years (female)**
15 EFA Development Index, 2005(2) 0.734
Source: (1) UNESCO Institute for Statistics. 2008. (2) UNESCO. 2007.

United NationsEducational, Scientific and
Cultural Organization
UNESCO BangkokEducation Policy and Reform
Mom Luang Pin Malakul Centenary Building920 Sukhumvit Road, Prakanong, KlongtoeyBangkok 10110, Thailandwww.unesco.org/bangkok