secondary accountability measures: guide - … · 2 . contents . table of figures 5 summary 6...
TRANSCRIPT

Secondary accountability measures Guide for maintained secondary schools, academies and free schools
October 2018
2
Contents Table of figures 5
Summary 6
Secondary accountability measures in 2018 6
Expiry or review date 7
Who is this guide for? 7
Secondary school performance measures 8
Progress 8 8
Pupils with extremely negative progress scores – change from 2018 and onwards 8
Percentage of pupils entering the English Baccalaureate 9
Percentage of pupils staying in education or going into employment after key stage 4 (pupil destinations) 10
Percentage of pupils achieving a grade 5 (strong pass) or above in English and maths 11
Attainment 8 11
The English Baccalaureate average point score (APS) 11
Publication of key stage 4 secondary accountability measures 12
Schools that may require support 12
Floor standard 13
The coasting definition for 2018 13
School types and particular circumstances (coasting) 13
Calculating Attainment 8 and Progress 8 15
Qualifications included in the measures 15
Maths qualifications 15
English qualifications 16
Qualifications in the English Baccalaureate (EBacc) subjects 16
Science and computer science qualifications 17
Qualifications in the ‘open’ element 17
Level 3 qualifications 18
Point scores 18
Discounting, pathway and first entry rules 19
Calculating Attainment 8 19
Worked Example A 19

3
Worked Example B 21
Calculating Progress 8 23
Calculating a pupil’s Progress 8 score 23
Pupil prior attainment calculation for Progress 8 23
Worked example A 25
Measurement of the progress of pupils with no key stage 2 test results. 26
Worked Example A - continued 27
Calculating a school Progress 8 score 27
Worked Example A – continued 27
Calculating a school (adjusted) Progress 8 score 28
Interpreting Progress 8 scores 28
Confidence intervals 29
Impact of the number of qualifications taken on a pupil’s Progress 8 score 29
Key stage 2 tests 30
Information available to secondary schools about their year 7 pupils 30
How scaled scores will be used in Progress 8 30
Pupils reaching their estimated grades 30
Calculating the EBacc average point score measure 31
Worked example 1: EBacc APS for Sumita 31
Worked example 2: EBacc APS for Steven 33
Average EBacc point score = 34
Calculating a school’s EBacc APS score 34
Annex A – Point score scales for 2016, 2017, 2018 and 2019 35
Illustrative examples of how to use these tables – points for all qualifications can be calculated following this method 42
Example A - Calculating the points for a Principal Learning (Level 2) qualification 42
Example B - Calculating the 2017, 2018 and 2019 points for a BTEC First Award 42
Example C - Calculating the 2017, 2018 and 2019 points for an OCR Cambridge National Certificate 43
Annex B – Revised 2018 Attainment 8 averages 44
Annex C – Key stage 2 results used to calculate prior attainment 46
Annex D – Prior Attainment Group thresholds for pupils with extremely negative progress scores 49

4
Adjusting extremely negative progress scores, number of standard deviations and prior attainment group thresholds 49
Annex E – Confidence Intervals 51
Worked example A – continued 52
Standard deviation of all Progress 8 scores and Progress 8 element scores nationally 52
Annex F – English in the headline performance measures 54
Annex G – Timeline for new GCSEs 55
Annex H – Other additional measures 57

5
Table of figures Table 1: Key stage 4 results for Sumita .......................................................................... 32
Table 2: Key stage 4 results for Steven .......................................................................... 33
Table A.1 Point score scales for legacy GCSEs (A*-G) .................................................. 36
Table A.2 Point score scales for combined science qualifications in Attainment 8 and Progress 8 ……………………………………………………………………………………….37
Table A.3 Point score scales for legacy double award GCSEs (A*A*-GG) ..................... 38
Table A.4 Point score scales for level 1 qualifications .................................................... 39
Table A.5 Point score scales for level 2 qualifications .................................................... 40
Table A.6 Point score scales for AS levels and double AS levels ................................... 41
Table A.7 Point score scales for graded music examinations ......................................... 41
Table A.8 Point score scales for free standing maths qualifications ............................... 42
Table A.9 Point score scales for Principal Learning (Level 2) qualifications ................... 42
Table A.10 Point score scales for BTEC First Award ...................................................... 43
Table A.11 Point score scales for OCR Cambridge National Certificate ........................ 43
Table B.1 Provisional 2018 Attainment 8 average for each KS2 fine level ...................... 44
Table D.1 Minimum scores in 2018 ................................................................................. 50
Table E.1 2016, 2017 and 2018 standard deviations of Progress 8 and Progress 8 element scores nationally ................................................................................................ 53

6
Summary A new secondary school accountability system was introduced in 2016. This document explains how secondary accountability measures are calculated. It also gives more information about announced policies that apply to accountability measures in 2018 and 2019.
Secondary accountability measures in 2018 The headline measures which will appear in the 2018 performance tables are:
• progress across 8 qualifications (Progress 8)
• percentage of pupils entering the English Baccalaureate (EBacc entry)
• percentage of students staying in education or going into employment after key stage 4 (pupil destinations)
• percentage of pupils achieving a grade 5 or above in English and maths (Attainment in English and maths)
• attainment across the same 8 qualifications (Attainment 8)
• English Baccalaureate Average Point Score (EBacc APS)
A range of additional performance measures and contextual information is published in performance tables. Further details about what will be published in the performance tables are set out in the Statements of Intent: https://www.gov.uk/government/publications/school-and-college-performance-tables-statements-of-intent.
The performance measures are designed to encourage schools to offer a broad and balanced curriculum with a focus on an academic core at key stage 4, and to reward schools for the teaching of all their pupils.
Secondary accountability measures are used to inform parents and students about school performance; to prompt and promote self-improvement, to inform the public and stakeholders; and to provide credible information to enable action in cases of underperformance. Performance data is used as the starting point for a conversation about school performance and improvement. Ofsted takes a wide range of factors into account when considering school performance more broadly, including the make-up of a school cohort.
7
Expiry or review date This guide will next be reviewed before the end of January 2019.
Who is this guide for? This guide is for:
• school leaders, school staff and governing bodies in all state-funded schools, including local authority maintained schools, academies, free schools, special schools and multi academy trusts (MATs)
• independent schools or colleges with 14-16 provision seeking information on secondary accountability measures
• local authorities
8
Secondary school performance measures
Progress 8 Progress 8 was introduced in 2016 as the headline indicator of school performance determining the floor standard. It aims to capture the progress a pupil makes from the end of primary school to the end of key stage 4. It is a type of value added measure, which means that pupils’ results are compared to the progress of other pupils nationally with similar prior attainment. Every increase in every grade a pupil achieves will attract additional credit in the performance tables.
Progress 8 is calculated for individual pupils solely in order to calculate a school’s Progress 8 score, and there is no need for schools to share individual Progress 8 scores with their pupils.
A Progress 8 score is calculated for each pupil by comparing their Attainment 8 score (see below for detail) – with the average Attainment 8 scores of all pupils nationally who had a similar starting point, calculated using assessment results from the end of primary school.1 The greater the Progress 8 score, the greater the progress made by the pupil compared to the average of pupils with similar prior attainment.
A school’s Progress 8 score is calculated as the average of its pupils’ Progress 8 scores. It gives an indication of whether, as a group, pupils in the school made above or below average progress compared to similar pupils in other schools.
• a score of zero means pupils in this school on average do as well at key stage 4 as other pupils across England who got similar results at the end of key stage 2
• a score above zero means pupils made more progress, on average, than pupils across England who got similar results at the end of key stage 2
• a score below zero means pupils made less progress, on average, than pupils across England who got similar results at the end of key stage 2
A negative progress score does not mean pupils made no progress, or the school has failed, rather it means pupils in the school made less progress than other pupils across England with similar results at the end of key stage 2.
Pupils with extremely negative progress scores – change from 2018 and onwards The department has received feedback about the disproportionate effect that a small number of extremely negative progress scores can have on a school’s average. Such extreme cases tend to occur where a pupil was a middle or high achiever at key stage 2 and goes on to achieve much worse at key stage 4 than the national average for others 1 More information about how we calculate prior attainment is included on pages 23- 29 and Annex C.

9
with similar prior attainment, for reasons beyond the control of the school (e.g. long-term illness). In a small number of cases, progress scores calculated for individual pupils can be so largely negative that they can distort the overall picture of performance for a school.
The department has listened to this feedback and has refined the methodology for 2018 in order to reduce such disproportionate impact of extreme pupil-level progress scores only. We now limit how negative2 a pupil’s progress score can be when calculating the school average. These pupils still have large negative scores (to reflect that the pupils have made much less progress than other pupils in the same prior attainment group as them), but the disproportionate effect they have on a school’s score has been reduced.
We do this by setting a minimum progress score that can be assigned to pupils within the prior attainment groups where extremely negative scores exist. Some of the prior attainment groups will not have a minimum progress score threshold set. These are prior attainment groups from 1 to 18 (inclusive), where the average Attainment 8 scores at key stage 4 for these groups are not high enough to allow for extreme negative progress scores.
Where a minimum score is set for a prior attainment group, this is determined based on the variation in pupil progress scores within that prior attainment group (as measured by the standard deviation). The minimum scores are fixed at a set number of standard deviations below the mean for that prior attainment group so that approximately 1% of pupils are identified nationally3 (in most cases, this is no more than 1 or 2 pupils per school). By design, these minimum scores will change each year. As such, predicting which pupils will, and will not, have their score affected by this methodology change, in advance of progress scores being made available, will not be possible. Further information on the calculation, the number of standard deviation(s) and minimum thresholds per prior attainment group is available in Annex D.
School performance tables published in October 2018 and January 2019 will display the progress figures calculated using the methodology outlined below. However, we will also publish the figures that do not place limits on pupil progress scores for transparency and to help inspectors and others identify how particular schools have been affected.
Percentage of pupils entering the English Baccalaureate
The English Baccalaureate (EBacc) entry measure reports the percentage of pupils entered for the EBacc. To enter the EBacc, pupils must take up to eight GCSEs across five subject
2 We are not setting a maximum limit on how positive a pupil’s progress score can be as there are much smaller numbers of extremely positive progress scores that have a disproportionate impact than extremely negative ones. 3 Due to natural fluctuation of performance year-on-year, it may not be possible to use the same standard deviation value each year to calculate the minimum scores.

10
‘pillars’.4 The structure of the EBacc is set out on page 7 of the Government’s response to its consultation on implementing the EBacc5.
Percentage of pupils staying in education or going into employment after key stage 4 (pupil destinations)
The headline pupil destination measure shows the percentage of pupils continuing to a sustained education, employment or training destination in the year after completing key stage 4 study (after year 11). The data, to be published in October 2018 is for pupils who finished year 11 in 2016, which is the most recent data available. To be counted in a sustained destination, pupils had to have a recorded activity throughout the first two terms of the 2016/17 academic year (or any 6 months in the year for apprenticeships).
Additional breakdowns show whether pupils were in education, apprenticeships or employment, did not stay in education or employment for at least two terms, or whether activity was not captured in the data. Education destinations including further education (FE) colleges and other providers, sixth-form colleges, school sixth forms or other education destinations are also shown.
In 2018, we have changed the way progression into apprenticeships is reported in pupil destinations to separate it from other education or employment participation.
This will have no impact on the headline ‘staying in education or employment’ percentage. However, because double counting between apprenticeships and other categories will be removed, individual categories should be expected to be lower than in previous years. The education, employment and apprenticeship subtotals can now be added together to get the headline measure, instead of only education and employment as in previous years.
Unlike education and employment, students are counted in an apprenticeship if they stayed in an apprenticeship for at least 6 consecutive months at any point in the 2016/17 academic year (August to July).
We use a range of administrative data to determine pupils’ destinations. The data sources include the national pupil database (NPD) and employment and benefits information from Her Majesty’s Revenue and Customs (HMRC), Department of Work and Pensions (DWP) and local authorities.
Further information on the key stage 4 destination measures can be found in the DfE publication: https://www.gov.uk/government/collections/statistics-destinations
4 Some AS level qualifications in the same subject pillars can also count towards the EBacc. 5https://www.gov.uk/government/uploads/system/uploads/attachment_data/file/630713/Implementing_the_English_Baccalaureate_-_Government_consultation_response.pdf

11
Percentage of pupils achieving a grade 5 (strong pass) or above in English and maths
In 2017, pupils sat reformed GCSEs in English language, English literature and maths for the first time, graded on a 9 to 1 scale.
From 2017, the headline English and maths measure is the percentage of pupils achieving a grade 5 or above in English and maths. A grade 5 or above in English or maths is recognised as a ‘strong pass’ for the purposes of school accountability only.
We also publish an additional measure showing the percentage of pupils achieving a grade 4 or above in English and maths in the performance tables. In all subjects, a grade 4 or above is recognised as a ‘standard pass’.
A ‘standard pass’ is a credible achievement for a young person that should be valued as a passport to future study and employment.
Attainment 8 Attainment 8 measures pupils’ attainment across 8 qualifications including:
• maths (double weighted) and English (double weighted, if both English language and English literature are entered)
• 3 qualifications that count in the English Baccalaureate (EBacc) measure – see below
• 3 further qualifications that can be GCSE qualifications (including EBacc subjects) or technical awards from the DfE approved list http://www.gov.uk/government/collections/performance-tables-technical-and-vocational-qualifications
Attainment 8 and Progress 8 calculations are described in more detail on pages 15-30.
The English Baccalaureate average point score (APS)
As announced in July 2017, from 2018 the headline EBacc attainment measure is the EBacc average point score (EBacc APS). This replaces the previous threshold EBacc attainment measure. EBacc APS measures pupils’ point scores across the five pillars of the EBacc. This ensures the attainment of all pupils is recognised, not just those at particular grade boundaries, encouraging schools to enter pupils of all abilities, and support them to achieve their full potential.
Further information on how the EBacc average point score measure is calculated is on pages 32-35.

12
Publication of key stage 4 secondary accountability measures
Headline secondary accountability measures are published as a statistical publication (previously statistical first release) and at school level on the school and college performance tables website6. The provisional publication in October includes a gender breakdown. All other characteristics breakdowns, including data on pupil characteristics such as free schools meals, disadvantaged, special education needs and ethnicity, are included in the January revised publication.
Progress 8 and its constituent elements, and pupil destinations, are not published for independent schools and independent special schools.7 Pupil destinations are also only published for schools which had pupils completing the key stage two years previously. The remaining headline secondary accountability measures are published for all secondary schools for which data are published in the performance tables.
As usual, suppression is applied so we do not disclose the results of small numbers of pupils. Figures are suppressed if the school has five or fewer pupils included in the cohort. This applies to sub-groups of pupils as well as the whole cohort; for example, if there were 5 boys and 3 girls in a school, we would not publish attainment for boys or girls separately but would publish attainment for all pupils (as this is based on 8 pupils). The same rules are applied across pupils included in each headline measure except for pupil destinations. We apply extra suppression to destination measures because it contains employment data. We do not publish figures if there are 10 or fewer pupils in a particular school or figures referring to outcomes for 1 or 2 individuals. The Progress 8 score is suppressed if fewer than 50% of pupils at the end of key stage 4 are included in the measure ( for example because they do not have key stage 2 prior attainment recorded).
Schools, colleges and local authorities also have access to school level performance data via Analyse School Performance (ASP) and Key to Success (KTS).
Schools that may require support
The Secretary of State announced on 4 May 2018 that there will be a consultation this autumn on a new way to identify schools that might benefit from an offer of support, which will be in place from September 2019. Until then, the existing floor and coasting standards will remain in place. Where a school is below the floor or coasting standards, but is not judged inadequate, the RSC will not use the Secretary of State’s powers to issue an academy order or a warning notice. Instead, the floor and coasting standards will be calculated in 2018 solely for the Department for Education to identify schools that might benefit from support.
6 On the school performance tables website, school level data for state-funded schools only are published in the provisional October publication. Data for all schools are published in the revised January publication. 7 We do not publish key stage 2 data for independent schools because they don’t have to follow the national curriculum or enter pupils for key stage 2 tests. This means that independent schools are not included in the calculation of Progress 8. They are still included in attainment measures at key stage 4.

13
For 2018, the definitions for the floor and coasting standard remain unchanged from previous years, as set out below.
Floor standard Floor standards do not apply to special schools, independent schools, pupil referral units, alternative provision, hospital schools, UTCs, FE colleges with 14-16 provision and studio schools.
Schools are excluded from a Progress 8 floor standard in a particular year where they have fewer than 6 pupils at the end of key stage 4, or where fewer than 50% of pupils have key stage 2 assessments that can be used as prior attainment in the calculations of Progress 8.
From 2016, a school is below the floor standard if its Progress 8 score is below -0.5, and the upper band of the 95% confidence interval is below zero.8
Confidence intervals are explained in more detail on page 52 in Annex E.
The coasting definition for 2018
The coasting definition is based on three years of data, using the same performance measures that underpin the floor standards. In line with regulations,9 in 2018 a secondary school will fall within the coasting definition if, based on revised data for all of 2016, 2017 and 2018:
• in 2016, 2017 and 2018 the school’s Progress 8 score was below -0.2510
School types and particular circumstances (coasting) A school has to be below the relevant coasting threshold in all three years to fall within the overall coasting definition. Schools will be excluded from the coasting measure if:
• they have fewer than 6 pupils at the end of key stage 4 • or fewer than 50% of pupils have key stage 2 assessments that can be used as
prior attainment in the calculations of Progress 8 or • or the school closes within the academic year (except if it reopened as a converter
academy11 8 Some schools chose to opt into Progress 8 in 2015. This was the floor standard in 2015 for those schools that chose to opt in. 9 The Coasting Schools (England) Regulations 2017 10 In addition, the upper band of the confidence interval is below zero. 11 Schools that have become a converter academy during any point within the three year coasting period will not be subject to the coasting standard until the school has of three years of consecutive data as a converter academy.
14
Any school that is excluded from the coasting measure in a particular year cannot be defined as coasting until it has three consecutive years of data that meets the coasting definition. No school will be identified as coasting until after the revised secondary performance tables are published in January.
The coasting definition applies to all state-funded mainstream maintained schools and academies with the relevant key stage 4 data. It does not apply to special schools, independent schools, pupil referral units, alternative provision, hospital schools, UTCs, FE colleges with 14-16 provision and studio schools.

15
Calculating Attainment 8 and Progress 8
Qualifications included in the measures Progress 8 and Attainment 8 are based on a calculation of pupils’ performance across 8 qualifications. These qualifications are:
1. a double weighted maths element that will contain the point score of the pupil’s English Baccalaureate (EBacc) maths qualification
2. an English element based on the higher point score of a pupil’s EBacc English language or English literature qualification. This will be double weighted provided a pupil has taken both qualifications
3. an element which can include the three highest point scores from any of the EBacc qualifications in science subjects, computer science, history, geography, and languages. For more information see the list of qualifications that count in the EBacc. The qualifications can count in any combination and there is no requirement to take qualifications in each of the ‘pillars’ of the EBacc
4. the open element contains the three highest point scores in any three other subjects, including English language or literature (if not counted in the English slot), further GCSE qualifications (including EBacc subjects) or any other technical awards from the DfE approved list: http://www.gov.uk/government/collections/performance-tables-technical-and-vocational-qualifications). For more information, see the list of qualifications included in the key stage 4 performance tables: https://www.gov.uk/government/publications/key-stage-4-qualifications-discount-codes-and-point-scores
If a pupil has not taken the maximum number of qualifications that count in each group then they will receive a point score of zero where a slot is empty.
Once new reformed GCSEs (9-1) are introduced in a subject, unreformed GCSEs (A*to G), International GCSEs or level 1/level 2 certificates in the same subject will no longer count in performance tables. This includes early entries prior to 2017 and 2018 in unreformed qualifications. Unreformed qualifications will continue to count until reformed GCSEs (9 to 1) are introduced. For further details, see Annex G.
Maths qualifications This element of Progress 8 is double weighted. Only maths qualifications which also count towards the EBacc can count in the maths element of Progress 8. From 2017 only the new GCSEs (9 to 1) in maths or AS levels in maths or further maths count towards the EBacc and in the maths element of Progress 8.
16
Where a pupil has taken more than one EBacc maths qualification, qualifications which are not used in the maths element can not count elsewhere in Progress 8.12
Approved mathematical type qualifications that do not count towards the EBacc, for example GCSE statistics, can be counted in a slot in the ‘open’ element of Progress 8 regardless of whether or not a pupil has also taken an EBacc maths qualification.
Level 3 Free Standing Maths Qualifications will only count in the ‘open’ element, and will only count if a pupil has not taken an EBacc maths qualification.
English qualifications If a student sits both English language and English literature, the higher grade is double-weighted in the English element. The lower grade can count in the ‘open’ element of subjects (not in the EBacc element).
If only one of GCSE English literature or English language is taken then this qualification will count in the English element, but will not be double-weighted.
From 2017 only the new GCSEs (9 to 1) in English language and English literature, AS English language, AS English literature and AS English language and literature count towards the EBacc and in the English slot of Progress 8.
An explanation of how English counts towards other headline performance table measures is provided at Annex F.
Qualifications in the English Baccalaureate (EBacc) subjects Only qualifications that count towards the EBacc measure can be included in the Progress 8 element reserved for EBacc qualifications.
Maths cannot be included in the EBacc element. English literature and English language cannot be included in the EBacc element - the better of these qualifications will count in the ‘English’ element, and the other can count in the ‘open’ element if the grade is higher than other eligible subjects.
There are no other stipulations about the types of EBacc subjects which can count in the three slots of the EBacc element. Any combination of EBacc subjects can be used to fill these slots, including for example:
• biology, chemistry, French
• or Spanish, French, German
• or history, geography, Spanish
12 First entry and discounting rules as set out on page 19 still apply.

17
Science and computer science qualifications All students have to study science up to the age of 16. The key stage 4 science and computing curricula are compulsory in state-funded maintained schools, and academies are required to provide a broad and balanced curriculum, including English, maths and science, up to the age of 16.
New science and computer science GCSEs (9 to 1) were available for teaching from September 2016, with the first examinations in summer 2018.
There is the combined science GCSE (double award), the single science GCSEs (biology, chemistry and physics) and computer science GCSE.
Combined and single science GCSEs are the only science GCSE options available from 2018. GCSEs in core, additional and further additional science are not eligible to count in the performace tables from 2018 and early entries in these qualifications will not count .
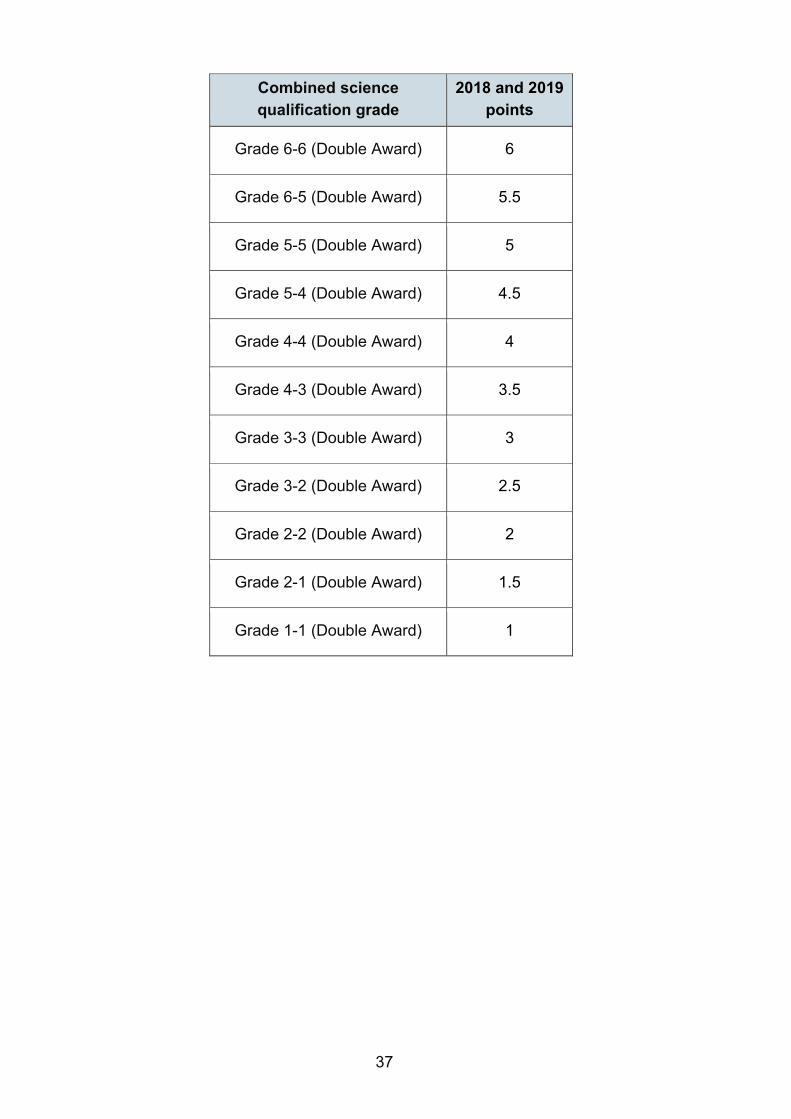
Separate GCSEs in biology, chemistry, physics and computer science each take up one slot, and can count in Progress 8 in any combination. The combined science GCSE can take up two slots in either the EBacc or open elements of Progress 8 where this represents the highest relevant grades achieved. One grade from this qualification can fill one slot if higher grades are achieved in other qualifications.
The points awarded to combined science are averaged, which means for example, that a double science grade of a grade 6 and a grade 5 would be averaged to two 5.5 points to fill either one or two slots as appropriate (a maximum of 11 points across two slots). This is shown in more detail in Table A.2 on page 37.
Any other science subject may count in the open element of Progress 8.
Details of the combined science, single science and computer science qualification pathways and how they may count in the headline measures can be found in the Discounting and Early Entry Guidance at: https://www.gov.uk/government/publications/key-stage-4-qualifications-discount-codes-and-point-scores.
Qualifications in the ‘open’ element Up to three GCSE qualifications (including EBacc subjects not used to fill the slots in the EBacc element) and/or technical awards from the approved list for the year in question can count towards the three slots in the ‘open’ element in the Progress 8 measure.

18
Technical awards are approved level 1 and 2 qualifications that equip 14 to 16 year olds with applied knowledge and practical skills not usually acquired through general education13.
Level 3 qualifications AS levels can count in the appropriate element of the Progress 8 measure for their subject (for example, maths AS-levels count in the maths slot, a French AS-level in the ‘EBacc group’, and an Art AS-level in the ‘open’ element). If a GCSE in the same subject has been taken the AS-level will always count in Progress 8 and the GCSE will not count, even if the AS has a lower point score than the GCSE. AS-levels at grades A and B score higher points in Progress 8 than an A* in unreformed GCSEs, and AS levels at grade A score higher points in Progress 8 than a grade 9 in reformed GCSEs.
Level 3 qualifications not included in the EBacc list can only count in an ‘open’ slot. This includes Free Standing Maths qualifications.
Free Standing Maths Qualifications will only count in an ‘open’ slot if a pupil has not taken an EBacc maths qualification.14
One graded music qualification can count in the ‘open’ element of Progress 8, and can count alongside GCSE music.
Point scores In 2017, new GCSE (9 to 1) qualifications in English and maths were included for the first time in the Progress 8 measure. New GCSEs have been introduced from 2018, with more following in 2019 and a very small number of less-taught languages GCSEs in 2020. A full list can be found in Annex G.
These new qualifications use a grading scale from 9 to 1 to identify levels of performance. Points will be allocated to the new GCSEs on a 9 to 1 score scale corresponding to the new 9 to 1 grades, for example a grade 9 will get 9 points in the performance measures.
During this transition period where a combination of reformed and legacy GCSEs can count towards performance measures, point scores from legacy GCSEs are mapped onto the 9 to 1 scale (with 8.5 being the maximum points available for legacy GCSEs)
13 See the technical guidance for further information: https://www.gov.uk/government/publications/14-to-19-technical-and-applied-qualifications-technical-guidance. 14Free Standing Maths Qualifications (FMSQ) do not discount EBacc maths qualifications therefore early entry rules are not applicable across these qualifications. For example, even if a pupil sat an FSMQ in year 10 and an EBacc maths qualification in year 11, the ‘open’ slot would not be filled by the FSMQ as the pupil would have an EBacc maths qualification which counts.
19
(see Annex A) and used to calculate Attainment 8, Progress 8 and the EBacc average point score.
The point scores for different types of qualifications in 2016, 2017, 2018 and 2019 can be found in Annex A. A list of all key stage 4 qualifications and the points allocated to them in performance tables can be found here: https://www.gov.uk/government/publications/key-stage-4-qualifications-discount-codes-and-point-scores
Discounting, pathway and first entry rules Discounting ensures that, where a pupil has taken two or more qualifications with a significant overlap in content, the performance tables only give credit once for teaching a single course of study.
Rules for first entry in a particular subject still apply under Progress 8 and Attainment 8, as do rules for pathways in English, maths and science qualifications. The discounting and early entry guidance is published here: https://www.gov.uk/government/publications/key-stage-4-qualifications-discount-codes-and-point-scores.
When a new GCSE (9 to 1) is introduced in the performance tables, an early entry to the unreformed GCSE (A*to G) in the same subject will not count in the performance tables. For example, the new science GCSEs introduced in performance tables in 2018, means early entry to unreformed science GCSEs in 2017 will not count in performance tables.
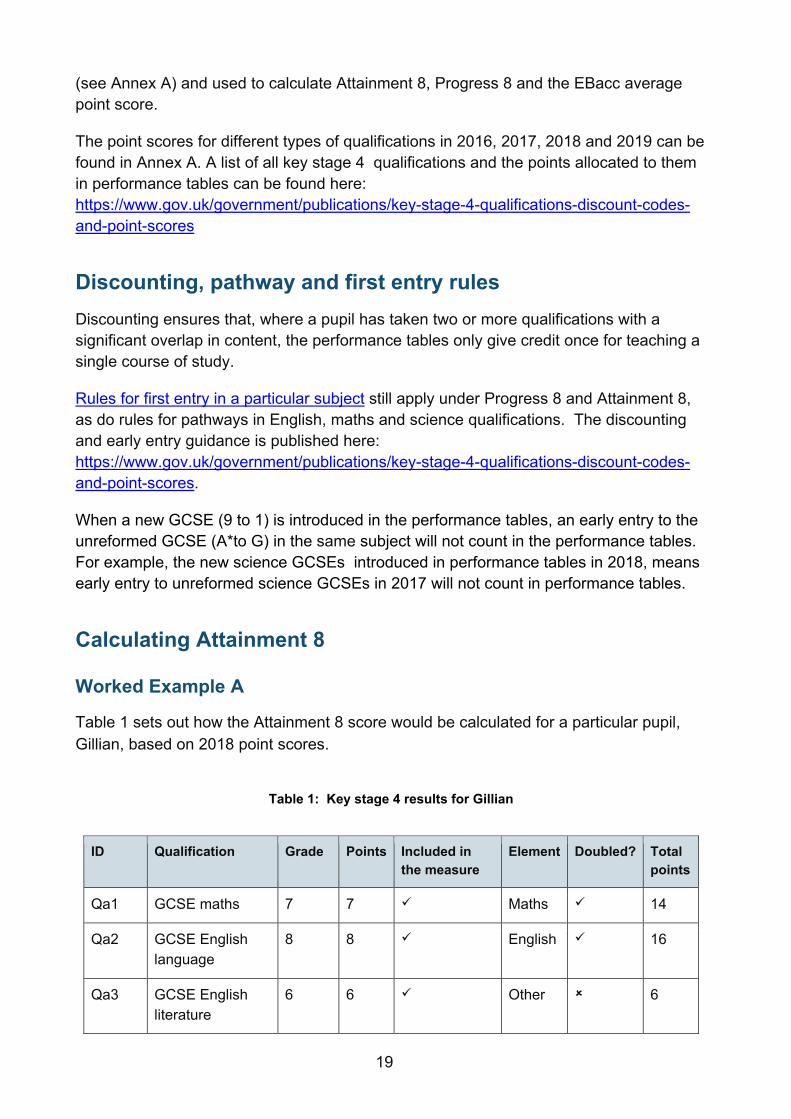
Calculating Attainment 8
Worked Example A
Table 1 sets out how the Attainment 8 score would be calculated for a particular pupil, Gillian, based on 2018 point scores.
Table 1: Key stage 4 results for Gillian
ID Qualification Grade Points Included in
the measure Element Doubled? Total
points
Qa1 GCSE maths 7 7 Maths 14
Qa2 GCSE English language
8 8 English 16
Qa3 GCSE English literature
6 6 Other 6

20
ID Qualification Grade Points Included in the measure
Element Doubled? Total points
Qa4 GCSE biology 7 7 EBacc 7
Qa5 GCSE art 4 4 Other 4
Qa6 GCSE physics 6 6 EBacc 6
Qa7 GCSE Japanese15
A* 8.5
Qa8 AS Level Japanese
C 7 EBacc 7
Qa9 GCSE Spanish 6 6 Other 6
Qa10 GCSE religious studies
3 3
Referring to the IDs of qualifications above, the following illustrates the calculation of the Attainment 8 score for Gillian:
Attainment 8 score = (Qa1 + Qa1) + (Qa2 + Qa2 as taken English literature)
+ Qa4 + Qa6 + Qa8 + Qa3 + Qa5 + Qa9 = (7 + 7) + (8 +8) + 7 + 6 + 7 + 6 +4 +6 = 66
Dividing the Attainment 8 score by 10 gives a pupil’s average grade. In this case it is 6.6.
15 GCSE Japanese is unreformed in 2018, reformed GCSEs in Japanese will be introduced into performance tables in 2019. In the interim, the unreformed GCSEs still count in performance tables and towards Progress 8.

21
Worked Example B
Table 2 sets out how the Attainment score would be calculated for another pupil, Hardip,
in 2018. Table 2: Key stage 4 results for Hardip
ID Qualification Grade Points Included in the measure
Element Doubled? Total points
Qb1 GCSE Maths 3 3 Maths 6
Qb2 GCSE English Language
4 4 English 4
Qb3 GCSE Combined Science
5-5 5 EBacc Ebacc
5 5
Qb4 GCSE Computer Science
4 4 EBacc 4
Qb5 BTEC First Award in Hospitality
Distinction 7 Other 7
Qb6 BTEC First Award in Sport
Merit 5.5 Other 5.5
Qb7 Cambridge National Certificate in Business and Enterprise
Pass 4 Other 4
Qb8 Pearson BTEC Certificate in Health and Social Care
Pass 1.75

22
Attainment 8 score = (Qb1 + Qb1) + (Qb2 + 0) Qb3 + Qb3 Qb4 + Qb5 + Qb6 +Qb7
= (3 + 3) + (4 +0) + 5 + 5 + 4 +7 + 5.5 +4 = 40.5
Dividing the Attainment 8 score by 10 gives a pupil’s average grade. In this case it is 4.05.
Hardip has not taken English literature, so his score for English language is not doubled. Furthermore, he has taken two EBacc subjects, as computer science16 counts as a separate science in addition to combined science, so he scores in each of the three EBacc slots. The three highest scores from the four technical awards he entered count towards the open slots.
16 Since 2014 computer science has counted as an individual science in the performance tables. However it can also count alongside combined science or single sciences in Attainment 8/Progress 8 so it is not involved in science pathway discounting.
23
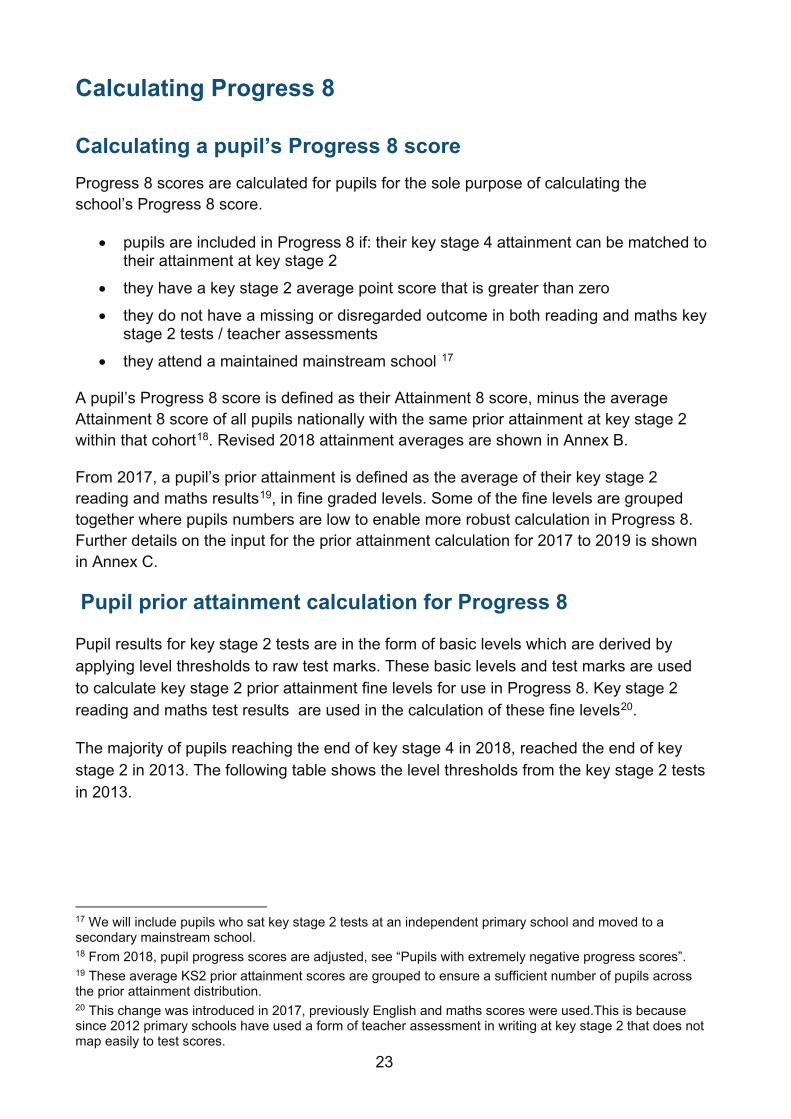
Calculating Progress 8
Calculating a pupil’s Progress 8 score Progress 8 scores are calculated for pupils for the sole purpose of calculating the school’s Progress 8 score.
• pupils are included in Progress 8 if: their key stage 4 attainment can be matched to their attainment at key stage 2
• they have a key stage 2 average point score that is greater than zero
• they do not have a missing or disregarded outcome in both reading and maths key stage 2 tests / teacher assessments
• they attend a maintained mainstream school 17
A pupil’s Progress 8 score is defined as their Attainment 8 score, minus the average Attainment 8 score of all pupils nationally with the same prior attainment at key stage 2 within that cohort18. Revised 2018 attainment averages are shown in Annex B.
From 2017, a pupil’s prior attainment is defined as the average of their key stage 2 reading and maths results19, in fine graded levels. Some of the fine levels are grouped together where pupils numbers are low to enable more robust calculation in Progress 8. Further details on the input for the prior attainment calculation for 2017 to 2019 is shown in Annex C.
Pupil prior attainment calculation for Progress 8
Pupil results for key stage 2 tests are in the form of basic levels which are derived by applying level thresholds to raw test marks. These basic levels and test marks are used to calculate key stage 2 prior attainment fine levels for use in Progress 8. Key stage 2 reading and maths test results are used in the calculation of these fine levels20.
The majority of pupils reaching the end of key stage 4 in 2018, reached the end of key stage 2 in 2013. The following table shows the level thresholds from the key stage 2 tests in 2013.
17 We will include pupils who sat key stage 2 tests at an independent primary school and moved to a secondary mainstream school. 18 From 2018, pupil progress scores are adjusted, see “Pupils with extremely negative progress scores”. 19 These average KS2 prior attainment scores are grouped to ensure a sufficient number of pupils across the prior attainment distribution. 20 This change was introduced in 2017, previously English and maths scores were used.This is because since 2012 primary schools have used a form of teacher assessment in writing at key stage 2 that does not map easily to test scores.

24
Reading Maths
Level Mark range Level Mark range
N 0-10 N 0-14
- 2 15-17
3 11-18 3 18-44
4 19-35 4 45-78
5 36-50 5 79-100
For pupils with key stage 2 test level 3, 4 or 5, test marks are converted to subject fine grade by:
Basic level + actual test mark − bottom of level threshold
top of level threshold − bottom of level threshold + 1
where the level and level thresholds are determined by the mark.
In the case of pupils with key stage 2 test level 2, teacher assessment is also taken into account. If a pupil has a teacher assessment of W, 1 or 2, their fine grade is 0.5, 1.5 or 2.5 respectively. If their teacher assessment is higher than 2, test marks are converted to fine grade. Following feedback, clarification of the formula is shown in the table below:
KS2 test level
KS2 teacher assessment level KS2 fine grade
2
Working towards L1 0.5
Level 1 1.5
Level 2 2.5
Above level 2 3 − bottom of level 3 threshold − actual test mark
top of level 3 threshold − bottom of level 3 threshold + 1
Further detail is given in Annex C.
Once the key stage 2 reading and maths marks have been converted to fine grade, an average of the two is taken to provide an overall fine level. This is then rounded to 1 decimal place to obtain the fine level. Given that some fine levels are held only by few pupils, Progress 8 uses grouped fine levels, as follows:

25
KS2
fine level
KS2
grouped fine level
Up to 1.5 1.5
Between 1.6 and 2.0 2
Between 2.1 and 2.5 2.5
Between 2.6 and 2.8 2.8
Between 2.9 and 5.7 KS2 fine grade
At least 5.8 5.8
Worked example A Gillian reached the end of key stage 2 in 2013 and achieved key stage 2 reading and maths test marks of 40 and 74 respectively. To the KS2 prior attainment group:
• convert key stage 2 test scores to fine grades
Reading 5 + 40− 3650− 36+1
= 5.26666666 …
Maths 4 + 74− 4578− 45+1
= 4.85294117 …
• find the overall key stage 2 fine level by finding the subject average and rounding to one decimal place
Fine level 5.26666667+ 4.8529411762
= 5.1 (1 decimal place)
• look up the group that the fine grade resides in
The fine level 5.1 resides in the “otherwise” category above and so the grouped fine level is 5.1. See “Pupil prior attainment calculation for Progress 8” or Annex C for details on correspondence between fine levels and grouped fine levels.

26
Measurement of the progress of pupils with no key stage 2 test results. Pupils working below the level of the test
When calculating the baseline for each pupil’s Progress 8 score, we will use key stage 2 teacher assessments in cases where pupils have been unable to access the end of key stage 2 tests. This includes taking account of teacher assessments at levels 1 and 2. Annex C shows how we will award points to different pupils in Progress 8 and other value added performance measures.
Pupils without a test score in reading, maths or both
Certain pupils without a test score in one or both of reading and maths, can have their teacher assessment used. If a pupil has assessment information for one subject only, this subject will be used as the baseline. Where key stage 2 test results have been annulled where maladministration has been found, we may use teacher assessment where this is available to calculate Progress 8.
Pupils who have no key stage 2 assessment
There will be some pupils (those arriving at secondary school from the independent sector or abroad) who have no key stage 2 results to use as the baseline for the Progress 8 measure. These pupils’ scores will not be included in the Progress 8 measure (and the pupils will not be included in the denominator when calculating the average of the progress scores for the school).
However, these pupils will be included in the attainment measures for the school, unless they have arrived from a non-English speaking country in year 10 or year 11 and the school requests for their results to be removed. We also expect the school to be able to show to Ofsted, parents and others the progress these pupils have made through secondary school. The school can do this by providing information from robust assessments of their own when the pupil enters the school, and then looking at the pupil’s progress to GCSEs.
27
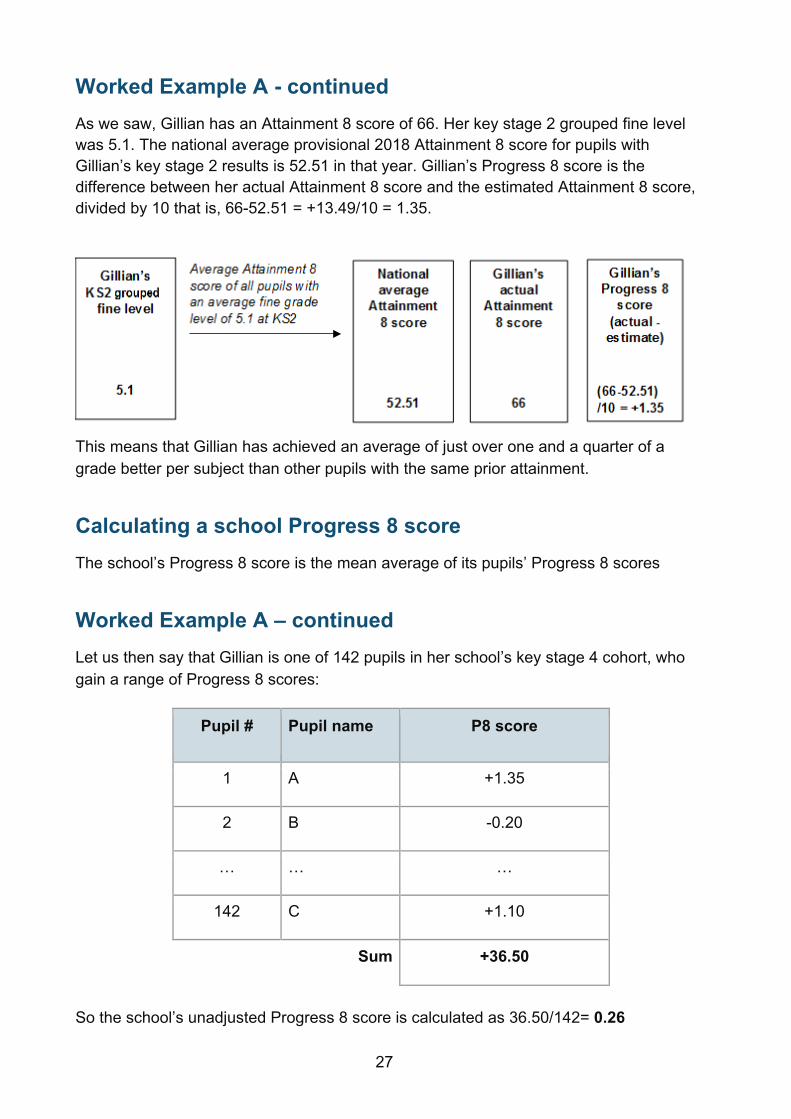
Worked Example A - continued As we saw, Gillian has an Attainment 8 score of 66. Her key stage 2 grouped fine level was 5.1. The national average provisional 2018 Attainment 8 score for pupils with Gillian’s key stage 2 results is 52.51 in that year. Gillian’s Progress 8 score is the difference between her actual Attainment 8 score and the estimated Attainment 8 score, divided by 10 that is, 66-52.51 = +13.49/10 = 1.35.
This means that Gillian has achieved an average of just over one and a quarter of a grade better per subject than other pupils with the same prior attainment.
Calculating a school Progress 8 score The school’s Progress 8 score is the mean average of its pupils’ Progress 8 scores
Worked Example A – continued Let us then say that Gillian is one of 142 pupils in her school’s key stage 4 cohort, who gain a range of Progress 8 scores:
Pupil # Pupil name P8 score
1 A +1.35
2 B -0.20
… … …
142 C +1.10
Sum +36.50
So the school’s unadjusted Progress 8 score is calculated as 36.50/142= 0.26
28
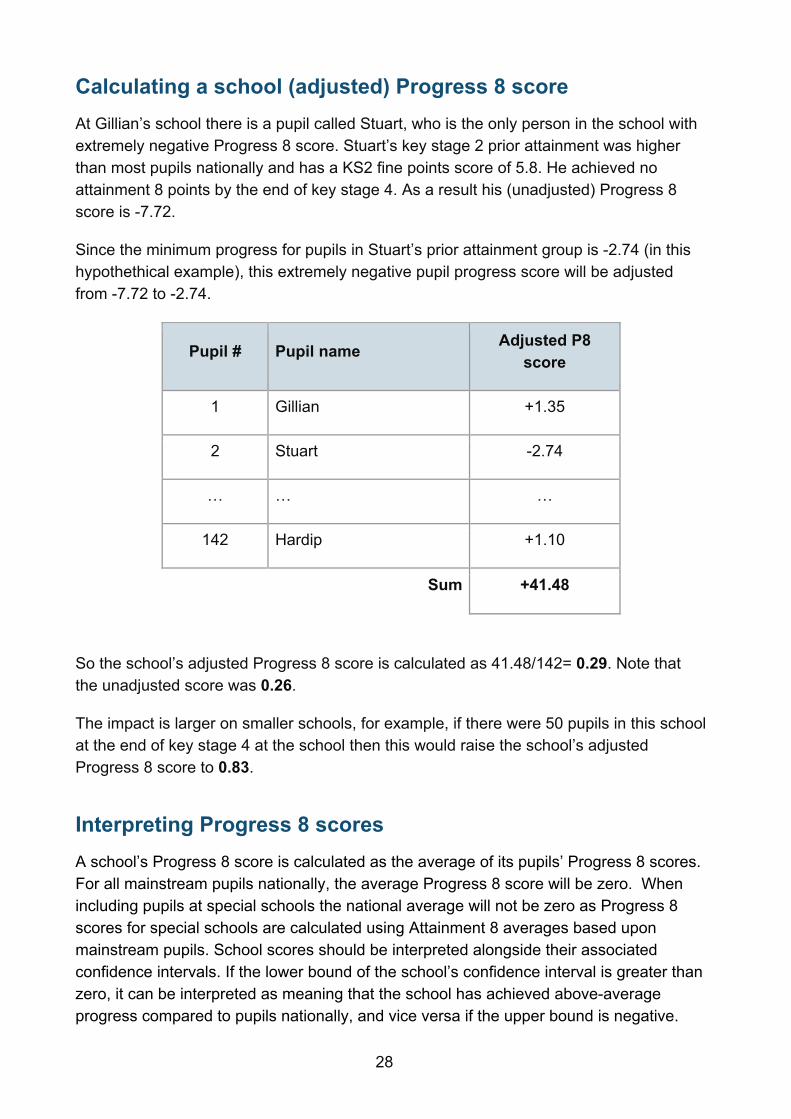
Calculating a school (adjusted) Progress 8 score At Gillian’s school there is a pupil called Stuart, who is the only person in the school with extremely negative Progress 8 score. Stuart’s key stage 2 prior attainment was higher than most pupils nationally and has a KS2 fine points score of 5.8. He achieved no attainment 8 points by the end of key stage 4. As a result his (unadjusted) Progress 8 score is -7.72.
Since the minimum progress for pupils in Stuart’s prior attainment group is -2.74 (in this hypothethical example), this extremely negative pupil progress score will be adjusted from -7.72 to -2.74.
Pupil # Pupil name Adjusted P8
score
1 Gillian +1.35
2 Stuart -2.74
… … …
142 Hardip +1.10
Sum +41.48
So the school’s adjusted Progress 8 score is calculated as 41.48/142= 0.29. Note that the unadjusted score was 0.26.
The impact is larger on smaller schools, for example, if there were 50 pupils in this school at the end of key stage 4 at the school then this would raise the school’s adjusted Progress 8 score to 0.83.
Interpreting Progress 8 scores A school’s Progress 8 score is calculated as the average of its pupils’ Progress 8 scores. For all mainstream pupils nationally, the average Progress 8 score will be zero. When including pupils at special schools the national average will not be zero as Progress 8 scores for special schools are calculated using Attainment 8 averages based upon mainstream pupils. School scores should be interpreted alongside their associated confidence intervals. If the lower bound of the school’s confidence interval is greater than zero, it can be interpreted as meaning that the school has achieved above-average progress compared to pupils nationally, and vice versa if the upper bound is negative.

29
The minimum grades each pupil requires to achieve a positive Progress 8 score will not be known in advance. This is because each pupil’s results are compared to other pupils with the same prior attainment within the same cohort.
It is highly advisable that care should be taken when using a previous year’s attainment averages as a guide to potential future Progress 8 results. This is because changes to national subject entry patterns and performance will cause these estimates to change in future years. Schools may change their curriculum offer in response to the Progress 8 measure and to the Government’s EBacc ambition, so any modelling based on current national results could be misleading.
See Annex E for further details on interpreting school scores and their associated confidence intervals.
Confidence intervals Progress 8 results are calculated for a school based on a specific cohort of pupils. A school may have been just as effective but have performed differently with a different set of pupils. Similarly, some pupils may be more likely to achieve high or low grades independently of which school they attend. To account for this natural uncertainty 95% confidence intervals around Progress 8 scores are provided as a proxy for the range of scores within which each school’s underlying performance measure can be confidently said to lie. The results of schools with a small cohort tend to have wider confidence intervals; this reflects the fact that the performance of a small number of pupils taking their key stage 4 exams can have a disproportionate effect on the school’s overall results. Both the Progress 8 score and the confidence interval for a school should be taken into account when comparing with other schools, pupil groups or national averages. Information about how confidence intervals are calculated is described in Annex E.
Impact of the number of qualifications taken on a pupil’s Progress 8 score
The number of qualifications each pupil should enter remains a professional judgement led by what best meets the needs of an individual.
The Progress 8 score for each pupil will always be determined by dividing the points total for their best eight qualifications by 10 (the eight qualifications with English and maths both double-weighted), regardless of how many qualifications the pupil sits.
This approach supports the policy aim to encourage schools to offer a broad and balanced curriculum with an academic core.
It may benefit some less able pupils to work towards good grades (and hence score more points) in fewer subjects, with the emphasis on doing well in English and maths, rather than to take more subjects but achieve lower grades overall.
30
Key stage 2 tests We use scaled scores to report the results of the national curriculum tests that pupils sit at the end of key stage 2. The range of scaled scores available for each key stage 2 test is the same as in 2016 and 2017. The lowest scaled score that can be awarded is 80 and 120 is the highest scaled score. Pupils scoring at least a scaled score of at least 100 will have been deemed to have met the expected standard of the test. More information about scaled scores can be found here.
If you would like to see how test scores compare with the 2018 national or local authority average for each subject, or the 2017 results, you can do this at https://www.gov.uk/government/collections/statistics-key-stage-2. Secondary schools should continue to view key stage 2 test results as just one piece of data available to them and continue to supplement this data with their own ongoing assessments of what pupils know and can do.
Information available to secondary schools about their year 7 pupils Secondary schools receive information via common transfer files on the teacher assessment and test score (the scaled score) awarded to each pupil.
Question Level Analysis is available for secondary schools to use in Analyse School Performance (ASP). This will help secondary schools identify strengths and weaknesses of incoming year 7 pupils in each test subject.
How scaled scores will be used in Progress 8 The first GCSE results for pupils with key stage 2 scaled scores will not be available until 2021. We will provide information about how scaled scores will be used in Progress 8 before then.
Pupils reaching their estimated grades A pupil’s estimated grade is what they are anticipated to achieve based on the national average for their prior attainment group. Progress 8 does not give particular credit to a school for helping a pupil reach his or her estimated grade. Schools get credit for each increase in grade a pupil achieves, regardless of how this grade relates to their estimated grade. For example, the Progress 8 score can improve equally if a pupil working well below their estimated grade moves up one grade, or if another pupil moves up one grade to achieve their estimated grade.

31
Calculating the EBacc average point score measure As announced in July 2017, from 2018 the headline EBacc attainment measure is EBacc average point score (APS).
This measure shows pupils’ point scores across the five pillars of the EBacc. The EBacc APS is calculated by allocating points to a pupil's best grades in EBacc subjects using the same rules as the previous EBacc attainment threshold measure, as follows:
• the better grade of either English language or English literature when both subjects are taken
• the grade for maths • the best two grades from exams taken in science - grades will be taken from
the following: - if the single sciences option is chosen, three out of four single sciences
must be chosen. The best two grades will be taken from these subjects - grades for GCSE combined science21
• the better grade of either geography or history (Humanities) • the best grade in language
These points will be totalled for each pupil, with a zero for any missing pillars, and then divided by six to create an average point score per pupil.22 These scores are added together for all pupils in a school's end of key stage 4 cohort23, and divided by the number in the cohort, to calculate the EBacc average point score per pupil for each school.
Worked example 1: EBacc APS for Sumita Table 1 sets out how the EBacc APS would be calculated for a particular pupil, Sumita, based on her attainment in EBacc subjects.
21 The 2017 EBacc APS shadow data released to schools in early 2018 was based on the 2017 EBacc methodology. Therefore, grades for Core Science and Additional Science and grades for Double Science contributed to the EBacc APS point score in shadow data. These qualifications counted for the last time in 2017 so therefore do not contribute towards EBacc APS for 2018. From 2018 only reformed science GCSEs will count towards EBacc APS, as set out above. 22Science grades count in two pillars, meaning a total of six pillars for EBacc APS. 23 Pupils are identified as being at the end of key stage 4 if they were on roll at the school and in year 11 at the time of the January school census. Age is calculated as at 31 August at the start of the academic year, and the majority of pupils at the end of key stage 4 were age 15 at this point. Some pupils may complete this key stage in an earlier or later year group.

32
Table 1: Key stage 4 results for Sumita
ID Qualification Grade Points Included in the measure
Element Points used toward EBacc APS
Qc1 GCSE English language
8 8 English 8
Qc2 GCSE English literature
7 7 English
Qc3 GCSE Maths 5 5 Maths 5
Qc4 GCSE Biology 4 4 Science
Qc5 GCSE Physics 5 5 Science
Qc6 GCSE Chemistry 7 7 Science 7
Qc7 GCSE Computer Science
7 7 Science 7
Qc8 GCSE History 5 5 Humanities 5
Qc9 GCSE French 4 4 Languages 4
Qc10 GCSE Religious studies
5 5 None - does not count towards EBacc
Sumita sat both English language and English literature, so her English score can be used toward her EBacc APS. Her score in the English element was taken from English language as this was her best result. Sumita took a maths GCSE that counts towards the EBacc maths element, so this score is used.
Sumita chose the single sciences option and sat four single sciences, so her science score can be used toward her EBacc APS. Her two highest scoring grades were in GCSE chemistry and GCSE computer science.
Sumita’s results for history and French are used toward the humanities and languages elements, respectively. Sumita did not enter for other qualifications in these areas so these points are used. GCSE religious studies does not count toward the EBacc so is not used in the calculation of EBacc APS.
Total EBacc point score = Qc1 + Qc3 + + Qc6 + Qc7 + Qc8 + Qc9 = 8 + 5 + (7 + 7) + 5+ 4 = 36
Average EBacc point score =
36 ÷ 6 = 6

33
Worked example 2: EBacc APS for Steven Table 2 sets out how the EBacc APS would be calculated for a particular pupil, Steven, based on their attainment in EBacc subjects.
Table 2: Key stage 4 results for Steven
ID Qualification Grade Points Included in the measure
Element Points used toward EBacc APS
Qd1 GCSE English language
3 3 English
Qd2 GCSE Maths 5 5 Maths 5
Qd3 GCSE Combined Science
3-3 6 Science 6
Qd4 GCSE German 4 4 Languages 4
Qd5 GCSE Music 4 4 None – does not count towards EBacc
Qd6 BTEC Travel and Tourism
Distinction 7 None – does not count towards EBacc
Steven did not sit both English language and English literature, so his English score cannot be used toward his EBacc APS. Steven took GCSE maths, which counts towards the EBacc maths element, so this score can be used.
Steven took combined science so both grades are used towards EBacc APS. His GCSE German qualification counts towards the EBacc languages element. However, Steven did not take any humanities qualifications so scores a 0 for this element for EBacc APS. His remaining two qualifications do not count towards EBacc so cannot be included in the calculation.
Total EBacc point score = Qd2 + Qd3 + Qd4 = 0 (English) + 5 + (3 + 3) + 0 (Humanities)+ 4 = 15

34
Average EBacc point score = 15÷ 6 = 2.5
Calculating a school’s EBacc APS score Let us then say that Steven and Sumita are two of 200 pupils in their school’s key stage 4 cohort, each assigned EBacc APS scores:
Pupil # Pupil name EBacc APS
1 Sumita 6.0
2 Sarah 5.42
… … …
200 Steven 2.5
Sum: 912.43
So the school’s EBacc APS is calculated as 912.43/200= 4.56

35
Annex A – Point score scales for 2016, 2017, 2018 and 2019 This annex explains the point score scale that are used in 2016, 2017, 2018 and 2019 performance tables24.
In 2017, new GCSE qualifications in English and maths, graded 9 to 1, were included in performance tables, with others to follow in 2018 and 2019. Points are allocated to the new GCSEs on a 9 to 1 scale corresponding to the new grades, for example a grade 9 will get 9 points in the performance measures, and so on with a grade 1 getting 1 point.
We allocated performance table points to new GCSEs (9 to 1) in 2017 and 2018 in line with Ofqual decisions on setting standards for new GCSEs. In September 2014, Ofqual confirmed that:
• the bottom of grade 1 will be aligned with the bottom of grade G • broadly the same proportion of students will achieve a grade 4 and above as
currently achieve a grade C and above; and • broadly the same proportion of students will achieve a grade 7 and above as
achieve an A and above.
We have reflected this in performance table points so that the same points are awarded to a grade G and a grade 1; a grade C and a grade 4; and a grade A and a grade 7. Points for other grades have been allocated between these anchor points.
This is the fairest way of reflecting attainment of pupils working at broadly the same level during this transitional period. From 2019, almost all new GCSEs (9 to 1) will be in place with points awarded on a linear 9 to 1 scale except for a very small number of languages with smaller cohorts25 which will be available in 2020.
The outcomes of Ofqual’s consultation on setting grade standards for 2017 GCSE qualifications can be found here: www.gov.uk/government/news/setting-standards-for-new-gcses-in-2017.
The tables on the following pages contain the 2017, 2018 and 2019 performance tables points for level and grade structure combinations. A list of all qualifications which count at key stage 4, and their corresponding performance points is available here: www.gov.uk/government/publications/key-stage-4-qualifications-discount-codes-and-point-scores
24 In 2016, the point score scale for performance table measures changed from the previous 16-58 scale used in 2015 and earlier to a 1-8 scale to begin the transition of points following the introduction fo reformed 9 to 1 GCSEs in 2017. 25 Gujarati, Persian, Portuguese, Turkish and Biblical Hebrew.

36
It is important to note that the key factor in the grade structure is the number of grades – not the names of grades. For example, a pass/merit/distinction/distinction* and a grade C/ grade B/ grade A/ grade A* structure both have four grades.
Table A.1 Point score scales for legacy GCSEs (A*-G)26
GCSE grade 2016 Points 2017, 2018 and 2019
Points
A* 8.00 8.50
A 7.00 7.00
B 6.00 5.50
C 5.00 4.00
D 4.00 3.00
E 3.00 2.00
F 2.00 1.50
G 1.00 1.00
Table A.2 Point score scales for combined science qualifications in Attainment 8 and Progress 8
Combined science qualification grade
2018 and 2019 points
Grade 9-9 (Double Award) 9
Grade 9-8 (Double Award) 8.5
Grade 8-8 (Double Award) 8
Grade 8-7 (Double Award) 7.5
Grade 7-7 (Double Award) 7
Grade 7-6 (Double Award) 6.5
26 The point score scales for legacy GCSEs also apply to academic certificates/international GCSE-style qualifications (AQA, Cambridge International and Pearson Edexcel Level 1/2 certificates), where these still count in performance tables.
37
Combined science qualification grade
2018 and 2019 points
Grade 6-6 (Double Award) 6
Grade 6-5 (Double Award) 5.5
Grade 5-5 (Double Award) 5
Grade 5-4 (Double Award) 4.5
Grade 4-4 (Double Award) 4
Grade 4-3 (Double Award) 3.5
Grade 3-3 (Double Award) 3
Grade 3-2 (Double Award) 2.5
Grade 2-2 (Double Award) 2
Grade 2-1 (Double Award) 1.5
Grade 1-1 (Double Award) 1

38
Table A.3 Point score scales for legacy double award GCSEs (A*A*-GG)
GCSE (double award) grade 2016 Points 2017 and
2018 Points
A*A* 8.00 8.50
A*A 7.50 7.75
AA 7.00 7.00
AB 6.50 6.25
BB 6.00 5.50
BC 5.50 4.75
CC 5.00 4.00
CD 4.50 3.50
DD 4.00 3.00
DE 3.50 2.50
EE 3.00 2.00
EF 2.50 1.75
FF 2.00 1.50
FG 1.50 1.25
GG 1.00 1.00
39
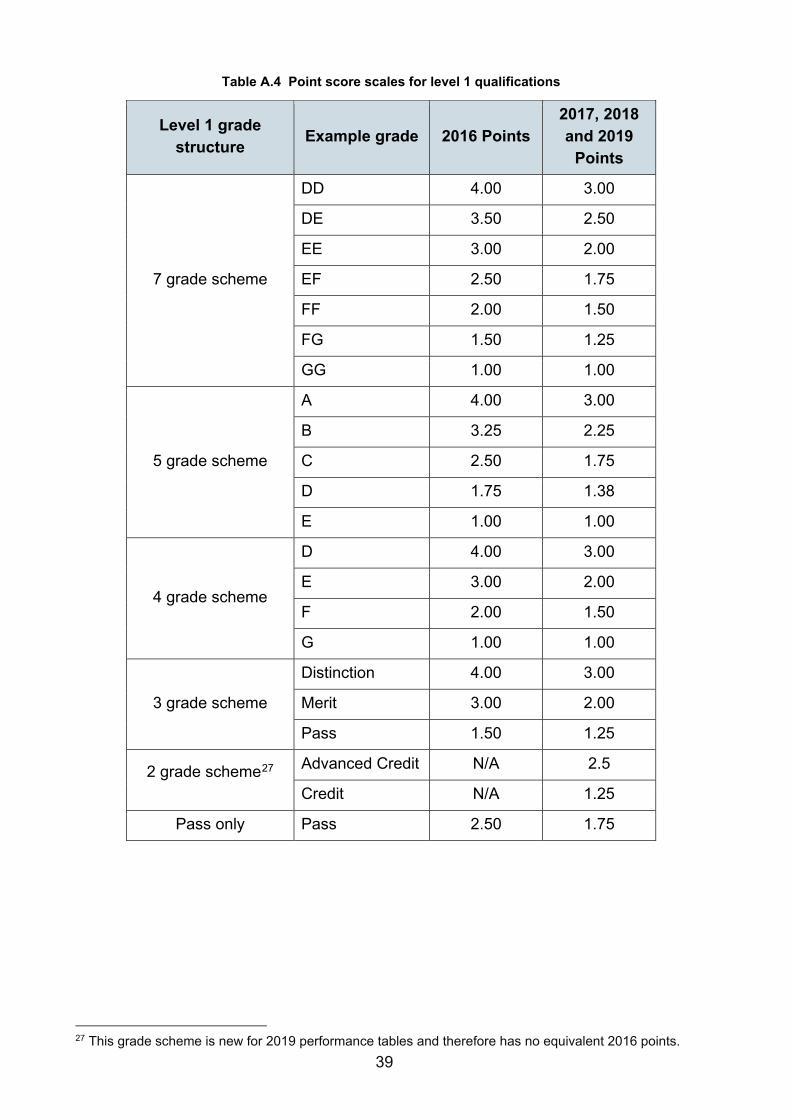
Table A.4 Point score scales for level 1 qualifications
Level 1 grade structure Example grade 2016 Points
2017, 2018 and 2019
Points
7 grade scheme
DD 4.00 3.00
DE 3.50 2.50
EE 3.00 2.00
EF 2.50 1.75
FF 2.00 1.50
FG 1.50 1.25
GG 1.00 1.00
5 grade scheme
A 4.00 3.00
B 3.25 2.25
C 2.50 1.75
D 1.75 1.38
E 1.00 1.00
4 grade scheme
D 4.00 3.00
E 3.00 2.00
F 2.00 1.50
G 1.00 1.00
3 grade scheme
Distinction 4.00 3.00
Merit 3.00 2.00
Pass 1.50 1.25
2 grade scheme27
Advanced Credit N/A 2.5
Credit N/A 1.25
Pass only Pass 2.50 1.75
27 This grade scheme is new for 2019 performance tables and therefore has no equivalent 2016 points.

40
Table A.5 Point score scales for level 2 qualifications
Level 2 grade structure Example grade 2016 Points 2017, 2018 and 2019
Points
8 grade scheme
A*A* 8.00 8.50 A*A 7.50 7.75 AA 7.00 7.00 AB 6.50 6.25 BB 6.00 5.50 BC 5.50 4.75 CC 5.00 4.00 CD 4.50 3.50
7 grade scheme
Distinction* Distinction* 8.00 8.50 Distinction* Distinction 7.50 7.75 Distinction Distinction 7.00 7.00 Distinction Merit 6.50 6.25 Merit Merit 6.00 5.50 Merit Pass 5.50 4.75 Pass Pass 5.00 4.00
5 grade scheme
A 7.00 7.00 B 6.50 6.25 C 6.00 5.50 D 5.50 4.75 E 5.00 4.00
4 grade scheme
A* 8.00 8.50 A 7.00 7.00 B 6.00 5.50 C 5.00 4.00
3 grade scheme Distinction 7.50 7.75 Merit 6.50 6.25 Pass 5.00 4.00
Pass only Pass 6.00 5.50

41
Table A.6 Point score scales for AS levels and double AS levels
AS level grade 2016 Points 2017, 2018 and 2019 Points
A 9.50 10.75
B 8.25 8.88
C 7.00 7.00
D 5.75 5.13
E 4.50 3.50
Double AS levels grade 2016 Points 2017, 2018 and
2019 Points
AA 9.50 10.75
BA 8.88 9.82
BB 8.25 8.88
CB 7.63 7.95
CC 7.00 7.00
DC 6.38 6.07
DD 5.75 5.13
ED 5.13 4.20
EE 4.50 3.50
Table A.7 Point score scales for graded music examinations
Graded music level Grade 2016
Points 2017, 2018 and
2019 Points
Grade 8
Distinction 8.00 8.50
Merit 8.00 8.50
Pass 8.00 8.50
Grade 7
Distinction 8.00 8.50
Merit 8.00 8.50
Pass 7.00 7.00
Grade 6
Distinction 8.00 8.50
Merit 8.00 8.50
Pass 7.00 7.00

42
Table A.8 Point score scales for free standing maths qualifications
Free standing maths qualification grade 2016 Points
2017, 2018 and 2019
points
A 5.75 5.13
B 5.00 4.00
C 4.25 3.25
D 3.50 2.50
E 2.75 1.88
Illustrative examples of how to use these tables – points for all qualifications can be calculated following this method
Example A - Calculating the points for a Principal Learning (Level 2) qualification
These qualifications are at level 2, so table A.5 should be used.
There are four possible passing grades (C/B/A/A*), so the 4 grade scheme should be used. The 2017,2018, 2019 column of Table A.5 gives points of 4, 5.5, 7 and 8.5.
The table below shows the 2018 points for a Principal Learning (Level 2) qualification:
Table A.9 Point score scales for Principal Learning (Level 2) qualifications
Principal Learning (Level 2) grade Points
A* 8.50
A 7.00
B 5.50
C 4.00
Example B - Calculating the 2017, 2018 and 2019 points for a BTEC First Award
BTEC First Awards can be both level 1 and level 2 qualifications.
At level 1, there is a pass only grade structure, and the 2017, 2018, 2019 column of Table A.4 gives the points of 1.75.

43
At level 2 in a BTEC First Award there are four possible outcomes Distinction*/Distinction/Merit/Pass which makes for a 4 grade structure, and the 2017 column of Table A.5 gives the points of between 4.00 and 8.50.
The table below shows the 2018 point score scales for the BTEC First Award:
Table A.10 Point score scales for BTEC First Award
BTEC First Award grade Points
Level 2 Distinction* 8.50
Level 2 Distinction 7.00
Level 2 Merit 5.50
Level 2 Pass 4.00
Level 1 Pass 1.75
Example C - Calculating the 2017, 2018 and 2019 points for an OCR Cambridge National Certificate
OCR Cambridge National Certificates can be both level 1 and level 2 qualifications.
Grades level 1 distinction/ level 1 merit/ level 1 pass are at level 1, which makes for a 3-grade structure, and the 2017,2018, 2019 column of Table A.4 gives the points of between 1.25 and 3.
Grades level 2 distinction*/ level 2 distinction/ level 2 merit/ level 2 pass are at level 2, which makes for a 4 grade structure, and the 2017,2018, 2019 column of Table A.5 gives the points of between 4 and 8.5.
The table below shows the point scores for the OCR Cambridge National Certificate:
Table A.11 Point score scales for OCR Cambridge National Certificate
OCR Cambridge National Certificate grade Points
Level 2 Distinction* 8.50
Level 2 Distinction 7.00
Level 2 Merit 5.50
Level 2 Pass 4.00
Level 1 Distinction 3.00
Level 1 Merit 2.00
Level 1 Pass 1.25
Point scores for other qualifications can be calculated using a similar method as in examples A, B and C above.

Annex B – Revised 2018 Attainment 8 averages Each Attainment 8 average is the average Attainment 8 score of all pupils nationally with the same prior attainment at key stage 2. The following table shows the provisional Attainment 8 averages (sometimes also called revised Attainment 8 estimates) for each key stage 2 average fine level, based on the provisional 2018 cohort averages.
Changes to national subject entry patterns, point values for GCSE and other qualifications, changes to key stage 2 assessments and performance will cause these averages to change in future years, as they will be derived from later cohorts. As such it is very unwise to extrapolate to cohorts beyond 2018.
Table B.1 Provisional 2018 Attainment 8 average for each KS2 fine level
Key stage 2 fine level
Attainment 8 average
English average
Maths average
EBacc average
Open average
1.5 13.44 2.97 1.92 3.67 4.87 2 15.63 3.56 2.27 4.22 5.58
2.5 17.35 4.27 2.29 4.47 6.32 2.8 18.87 4.68 2.64 4.68 6.86 2.9 20.13 4.93 3 4.99 7.2
3 21.26 5.06 3.47 5.32 7.41 3.1 22.63 5.43 3.61 5.77 7.81 3.2 22.74 5.43 3.66 5.72 7.93 3.3 23.8 5.69 3.86 6.06 8.19 3.4 24.76 5.86 4.18 6.32 8.4 3.5 25.71 6.09 4.37 6.59 8.65 3.6 27.06 6.33 4.6 6.97 9.16 3.7 27.92 6.59 4.79 7.18 9.37 3.8 28.79 6.76 4.95 7.44 9.64 3.9 29.95 6.96 5.26 7.8 9.93
4 31.31 7.23 5.55 8.23 10.29 4.1 32.45 7.46 5.82 8.54 10.63 4.2 33.68 7.71 6.12 8.9 10.95 4.3 35.33 8.02 6.5 9.45 11.36 4.4 36.92 8.33 6.87 9.93 11.78 4.5 38.74 8.66 7.28 10.55 12.26 4.6 40.9 9.06 7.79 11.27 12.78 4.7 42.76 9.42 8.16 11.9 13.28 4.8 44.86 9.79 8.63 12.64 13.81 4.9 47.3 10.25 9.15 13.47 14.43
5 49.69 10.68 9.67 14.29 15.04 5.1 52.34 11.15 10.27 15.2 15.72 5.2 55.02 11.59 10.88 16.15 16.4 5.3 57.63 12.01 11.53 17.07 17.04 5.4 60.62 12.47 12.25 18.11 17.8 5.5 63.87 12.98 13.03 19.24 18.62 5.6 67.56 13.59 13.83 20.51 19.63 5.7 71.96 14.36 14.76 22 20.85 5.8 76.97 15.24 15.75 23.61 22.37
Source: 2017/18 key stage 4 provisional attainment data

45
Scores are currently grouped according to the following conditions28:
• pupils with mean key stage 2 fine grade score of <=1.5 are assigned a key stage 2 score of 1.5
• pupils with mean key stage 2 fine grade score between 1.6 and 2.0 are assigned a key stage 2 score of 2.0
• pupils with mean key stage 2 fine grade score between 2.1 and 2.5 are assigned a key stage 2 score of 2.5
• pupils with mean key stage 2 fine grade score between 2.6 and 2.8 are assigned a key stage 2 score of 2.8
• pupils with mean key stage 2 fine grade score of >=5.8 are assigned a key stage 2 score of 5.8
28 Scores are grouped at the extreme ends of the prior attainment distribution because without grouping there would only be small numbers of pupils with the scores, so increasing the size of the groups reduces volatility of the estimates.
Annex C – Key stage 2 results used to calculate prior attainment From 2017 onwards, reading and maths test results only will be used in calculating key stage 2 prior attainment fine levels for use in Progress 8. This is because since 2012 primary schools have used a form of teacher assessment in writing at key stage 2 that does not map easily to test scores.
NB: Level 6 tests taken by pupils completing key stage 2 from 2012 onwards (who will reach the end of key stage 4 in 2017 and beyond) will not be used in the calculation of the fine level used as prior attainment in Progress 8, as the use of these tests varies between schools, instead the level 3-5 test will be used.
Adjustments are made for pupils with incomplete test results: • if a pupil does not have a test result in a subject then their teacher assessment
level is used (see table below) • if a pupil has a result missing in one subject, then prior attainment is calculated
from the remaining subject • if a pupil does not have a test score or teacher assessment result in any subject
then they are excluded from the measure Grouped key stage 2 fine grades are the prior attainment result used to estimate a pupil’s Attainment 8 score. They are based on the marks that pupils achieved in their end of key stage 2 assessment. Fine grades use the underlying marks data to create a finer measure.
The following set of rules is used to convert test marks to fine grades for reading and maths. These rules also take into account situations where a pupil’s assigned level for their reading or maths test is not consistent with the mark they receive for example where a pupil was ill during the test.
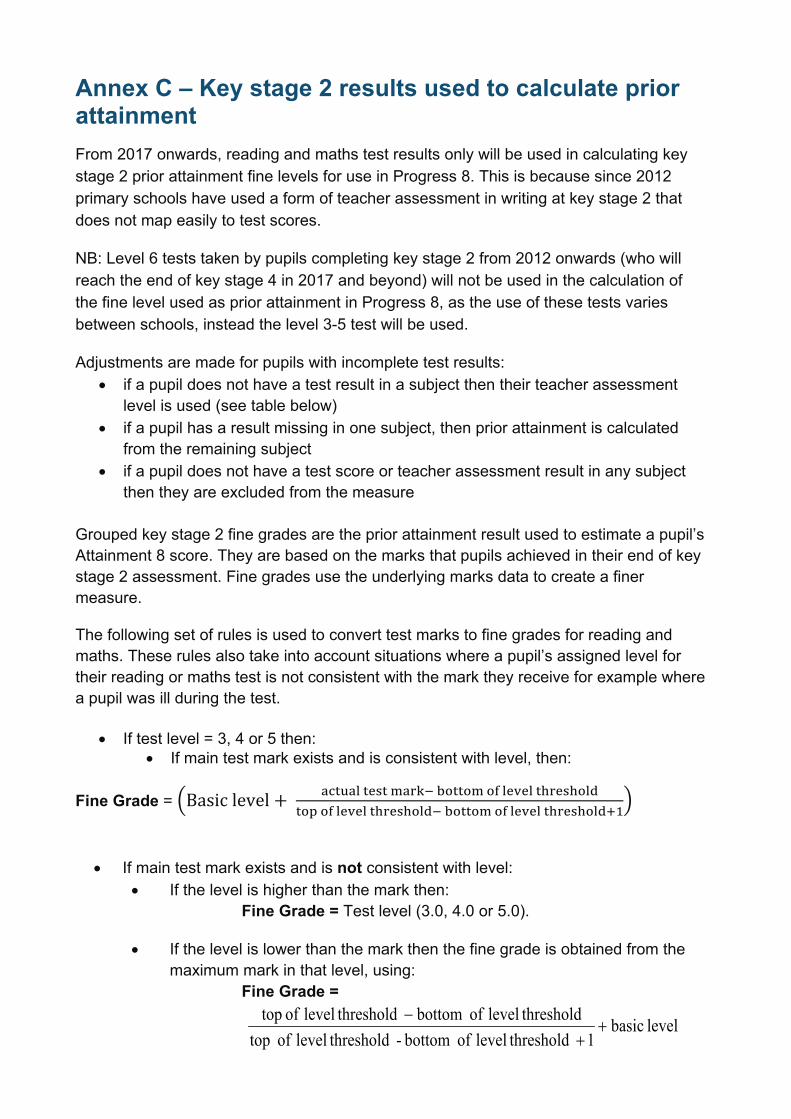
• If test level = 3, 4 or 5 then: • If main test mark exists and is consistent with level, then:
Fine Grade = �Basic level + actual test mark− bottom of level thresholdtop of level threshold− bottom of level threshold+1
�
• If main test mark exists and is not consistent with level:
• If the level is higher than the mark then: Fine Grade = Test level (3.0, 4.0 or 5.0).
• If the level is lower than the mark then the fine grade is obtained from the maximum mark in that level, using:
Fine Grade =
level basic1 thresholdlevel of bottom - thresholdlevel of top
thresholdlevel of bottom thresholdlevel of top ++
−
47
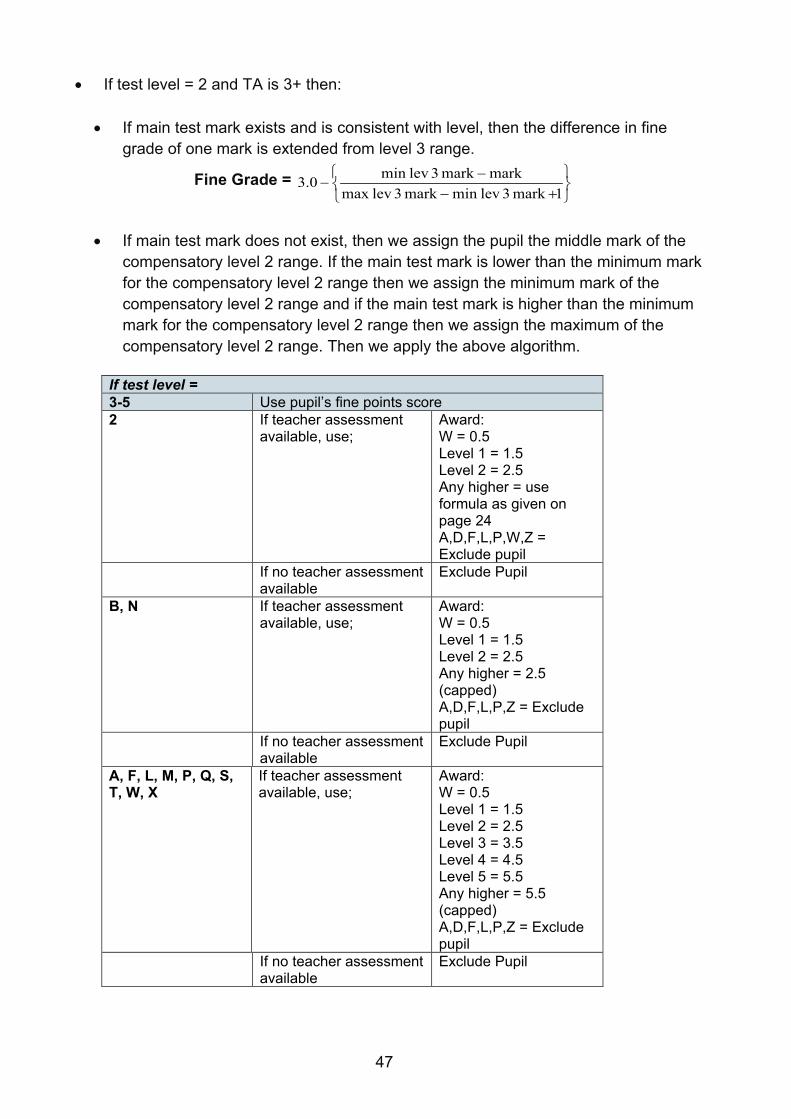
• If test level = 2 and TA is 3+ then:
• If main test mark exists and is consistent with level, then the difference in fine grade of one mark is extended from level 3 range.
Fine Grade =
+−−
−1mark 3 levmin mark 3 levmax
markmark 3 levmin 0.3
• If main test mark does not exist, then we assign the pupil the middle mark of the
compensatory level 2 range. If the main test mark is lower than the minimum mark for the compensatory level 2 range then we assign the minimum mark of the compensatory level 2 range and if the main test mark is higher than the minimum mark for the compensatory level 2 range then we assign the maximum of the compensatory level 2 range. Then we apply the above algorithm.
If test level = 3-5 Use pupil’s fine points score 2 If teacher assessment
available, use; Award: W = 0.5 Level 1 = 1.5 Level 2 = 2.5 Any higher = use formula as given on page 24 A,D,F,L,P,W,Z = Exclude pupil
If no teacher assessment available
Exclude Pupil
B, N If teacher assessment available, use;
Award: W = 0.5 Level 1 = 1.5 Level 2 = 2.5 Any higher = 2.5 (capped) A,D,F,L,P,Z = Exclude pupil
If no teacher assessment available
Exclude Pupil
A, F, L, M, P, Q, S, T, W, X
If teacher assessment available, use;
Award: W = 0.5 Level 1 = 1.5 Level 2 = 2.5 Level 3 = 3.5 Level 4 = 4.5 Level 5 = 5.5 Any higher = 5.5 (capped) A,D,F,L,P,Z = Exclude pupil
If no teacher assessment available
Exclude Pupil

48
Once fine levels are calculated they are grouped at the extremities of the key stage 2 prior attainment distribution to ensure that prior attainment groups are suffiently large for estimates of attainment 8. The grouped key stage 2 fine levels are as follows:
KS2
fine level
KS2
grouped fine level
Up to 1.5 1.5
Between 1.6 and 2.0 2
Between 2.1 and 2.5 2.5
Between 2.6 and 2.8 2.8
Between 2.9 and 5.7 KS2 fine grade
At least 5.8 5.8

49
Annex D – Prior Attainment Group thresholds for pupils with extremely negative progress scores
Adjusting extremely negative progress scores, number of standard deviations and prior attainment group thresholds
The threshold score applied to the pupil’s progress score is dependent on the prior attainment group that the pupil is in. To work these thresholds out: The first step is to calculate the mean and standard deviation of Progress 8 scores within each prior attainment group. The second step to ascertain the number of standard deviations each pupil’s progress 8 score is from their prior attainment group average. The third step is to order the numbers of standard deviations from step two from low to high and select the number of standard deviations such that about 1% of pupils nationally29 are below this value. This number is -2.736979, to 6 decimal places in 2018. The fourth step is to multiply the standard deviations found in the first step with the results from the third step to give the threshold for each prior attainment group – the minimum score for that prior attainment group. The fifth step: a pupil’s progress score will be replaced by the minimum, only if their original score falls below this minimum. Finally, the school’s progress score is calculated by averaging the adjusted progress score.
29 of pupils who are included in Progress 8

50
Table D.1 Minimum scores in 2018
Schools can use the table above to see which prior attainment group a pupil will have been allocated to depending on their key stage 2 average fine level, and what the lowest score they can be allocated in 2018 is. Not all prior attainment groups have extremely negative scores. This is because in the average Attainment 8 score for pupils in the lowest prior attainment groups will be relatively low, for example in prior attainment group 1 (fine levels up to 1.5), the average Attainment 8 score was 13.4, whereas for prior attainment group 34 (fine levels of at least 5.8), the average Attainment 8 score was 77.0. So a pupil doing very badly in group 34 can get an extremely negative score (e.g -7.7), whereas the lowest score a pupil in group 1 can get is -1.3. In short, it is pupils in the middle to higher prior attainment groups that can gain a Progress 8 score that is so far below those for others with similar prior attainment that it has a disproportionate impact on the school’s score. There is, in effect, already a minimum possible score for the lower groups.
As set out in the table above, the lowest prior attainment groups (1-18) have minimum scores that are above the threshold for that prior attainment group, due to no pupils having scores extreme enough to be below the threshold. The middle to higher prior attainment groups (19-34) have pupils with extreme progress scores below the threshold. These are the only prior attainment groups where pupils’ scores have been changed by this new methodology.
Prior Attainment Group Key stage 2 average fine level
Minimum threshold for adjusted Progress 8
1-18 N/A 19 >=4.25 and 4.35 -3.418 20 >=4.35 and 4.45 -3.514 21 >=4.45 and 4.55 -3.569 22 >=4.55 and 4.65 -3.586 23 >=4.65 and 4.75 -3.624 24 >=4.75 and 4.85 -3.658 25 >=4.85 and 4.95 -3.641 26 >=4.95 and 5.05 -3.725 27 >=5.05 and 5.15 -3.688 28 >=5.15 and 5.25 -3.701 29 >=5.25 and 5.35 -3.68 30 >=5.35 and 5.45 -3.697 31 >=5.45 and 5.55 -3.652 32 >=5.55 and 5.65 -3.531 33 >=5.65 and 5.75 -3.317 34 >=5.75 -3.067

51
Annex E – Confidence Intervals A 95% confidence interval are calculated around each school Progress 8 score, providing a proxy for the range of values within which we are statistically confident that the true value of the Progress 8 score for the school lies.
The confidence interval, denoted [ ]ss UppCILowCI , , is given by the formula:
[ ] [ ]ssssss CIPCIPUppCILowCI +−= 8,8, , where:
sLowCI is the lower confidence limit for the school’s Progress 8 score
sUppCI
sP8
sCI
is the upper confidence limit for the school’s Progress 8 score is the school’s Progress 8 score is the size of the confidence interval for the school’s Progress 8 score
s
Ns n
CIσ
×= 96.1
where:
1.96 is the critical value for a 95% confidence interval; Nσ
sn
is the standard deviation of the Progress 8 scores for all eligible pupils nationally; is the number of eligible pupils that belong to the school
The national average Progress 8 score of all pupils at state-funded maintained mainstream school scores will be 0. • when a school has their lower confidence interval limit higher than zero ( sLowCI >
0), the school’s Progress 8 score is above average and the result is statistically significant
• when a school has their upper confidence interval limit lower than zero ( sUppCI < 0), the school’s Progress 8 score is below average and the result is statistically significant
• in the other case when the confidence interval straddles zero ( sLowCI < 0 < sUppCI ), the school’s Progress 8 score is likely to be above or below average, and the result is not statistically significant

52
Worked example A – continued We can calculate the size of the confidence interval for the school’s Progress 8 score using sCI :
σ CI s = 1.96 × N 1.2394 = 1. 96 × = 1. 96 × 0 . 104 = 0 .20 n s 142
We derive the confidence interval for the school’s Progress 8 score:
[ ] [ ]46.0,06.020.026.0,20.026.0 ++=++−+= As sLowCI > 0, we can say that the school’s Progress 8 score is above the national average Progress 8 score, and say this result is statistically significant.
Standard deviation of all Progress 8 scores and Progress 8 element scores nationally The below standard deviations are based on the Progress 8 scores of all eligible pupils at mainstream schools and are the national figures used in confidence interval calculations.
KEY: Upper Confidence Limit
School Progress 8 Score
Lower Confidence Limit
NATIONAL AVERAGE
PROGRESS 8 SCORE = 0
SCHOOL A IS ABOVE NATIONAL AVERAGE AND THIS IS STATISTICALLY
SIGNIFICANT
SCHOOL B IS NOT SIGNIFICANTLY DIFFERENT FROM NATIONAL AVERAGE
SCHOOL C IS BELOW NATIONAL AVERAGE AND THIS IS STATISTICALLY SIGNIFICANT

53
Table E 1: 2016, 2017 and 2018 standard deviations of Progress 8 and Progress 8 element scores nationally
Measure
Revised 2016
Revised 2017 Provisional 2018
Progress 8 1.0605 1.229722 1.264453
Progress 8 English element 1.1248 1.542787 1.512834
Progress 8 maths element 1.2348 1.397587 1.539593
Progress 8 EBacc element 1.3841 1.449435 1.371839
Progress 8 Open element 1.2300 1.429360 1.483009 Source: 2015/16, 2016/17 & 2017/18 key stage 4 attainment data

54
Annex F – English in the headline performance measures
Headline Performance Measure English Requirement
Progress 8 and Attainment 8 If a pupil sits both English language and English literature, the higher grade is double-weighted. The lower grade can count in the ‘open’ element of these measures. If only GCSE English literature or English language is taken then this qualification will count, but will not be double-weighted.
EBacc average point score (EBacc APS)
For English results to be included in the EBacc APS calculation, pupils must sit both English language and English literature. The better grade counts towards EBacc APS.
English and maths at a grade 5 or above
A pupil would have to achieve a grade 5 or above in either English literature or English language. There is no requirement to sit both.
From 2017 onwards the only qualifications which will count as English in the performance tables are the new GCSEs (9 to 1) and AS levels.
For the measures of the percentage of pupils achieving the English and maths measure, the department is also publishing as an additional measure the percentage of pupils achieving a grade 4 or above in English and maths (see page 58).

55
Annex G – Timeline for new GCSEs From 2017 the only GCSEs that count in these subjects are the new GCSEs graded 9 to 1:
New GCSEs
English literature
English language
Maths
From 2018 the only GCSEs that count in these subjects are the new GCSEs, graded 9 to 1. As well as the new GCSEs in English language, English literature and maths listed above this will include:
EBacc Subjects Other subjects
Biology Art and design
Chemistry Citizenship studies
Classical Greek Dance
Combined science (Double award) Drama
Computer Science Food preparation and nutrition
French Music
Geography Physical education
German Religious studies
History
Latin
Physics
Spanish

56
From 2019 the only GCSEs that will count in these subjects will be the new GCSEs graded 9 to 1. As well as those listed above this will include:
EBacc Subjects Other subjects
Ancient History Astronomy
Arabic Business
Bengali Classical civilisation
Chinese Design and technology
Italian Economics
Japanese Electronics
Modern Greek Engineering
Modern Hebrew Film studies
Panjabi Geology
Polish Media studies
Russian Psychology
Urdu Sociology
Statistics
In 2020 the only GCSEs that will count in these subjects will be the new GCSEs graded 9 to 1. As well as those listed above this will include:
EBacc Subjects
Biblical Hebrew
Gujarati
Polish
Portuguese
Turkish
Please note that in 2018, 2019 and 2020, no legacy GCSEs (A*-G), International GCSEs or level 1/level 2 certificates in these subjects will count in performance tables as new GCSEs are introduced.
57
Annex H – Other additional measures As outlined in the 2018 performance tables statement of intent, some additional measures will also be published in 2018. These are outlined in the box below.
Additional measures for 2018 Methodology
The proportion of pupils achieving a grade 4 or above in English and maths
For transparency and to help schools show progress, the headline threshold attainment measure is also published at grade 4. This measures has the same methodology as its headline counterpart regarding qualification inclusion and requirements. The additional measure will show where pupils achieved a grade 4 or above in reformed 9 to 1 GCSEs in English language, English literature and maths.
The proportion of pupils achieving the EBacc at grade 5 or above and grade 4 and above.
Following the introduction of EBacc APS in 2018, the EBacc attainment threshold measure will no longer be a headline measure. However, this will continue to be published as an additional measure. The EBacc attainment threshold measures will be published for EBacc attainment overall and element breakdown, showing the proportion of pupils achieving grade 5 and above and grade 4 and above in reformed subjects
Average number of EBacc slots filled in Attainment 8 at school level
To help schools understand their EBacc entry rates in more detail, the number of EBacc slots filled per pupil within a school divided by the total number of pupils at the end of key stage 4 within the school. The number of EBacc slots filled per pupil is calculated according to Attainment 8 methodology outlined earlier in the guidance.
Average number of open slots filled in Attainment 8 at school level
The number of Open slots filled per pupil within a school divided by the total number of pupils at the end of key stage 4 within the school. The number of Open slots filled per pupil is calculated according to Attainment 8 methodology outlined earlier in the guidance.
Pupils achieving 5 or more GCSEs at grade 4 or above
The grade changes from 2017 onwards mean it is no longer possible to calculate the previous headline measure, 5+ A*-C grades including
58
Additional measures for 2018 Methodology
English and maths, and this measure will therefore not appear in the performance tables. Data for this new measure will be made available in the download data file on the school performance tables website.
This measure will be calculated as per 5+ A*-C grades including English and maths in 2016 with the below differences:
• The attainment threshold will be set to include those who achieve a grade 4 or above in reformed GCSEs
• The English requirement mirrors the standard pass in English and maths measure – a pupil would have to achieve a grade 4 or above in English literature or English language. There is no requirement to sit both.
• The combined science qualification will be counted as one GCSE
To note, this additional measure is published for transparency and is no longer a headline measure or used for school accountability purposes. When considering attainment at KS4, the 2018 headline measures should be used.

59
© Crown copyright 2018
This publication (not including logos) is licensed under the terms of the Open Government Licence v3.0 except where otherwise stated. Where we have identified any third party copyright information you will need to obtain permission from the copyright holders concerned.
To view this licence: visit www.nationalarchives.gov.uk/doc/open-government-licence/version/3 email [email protected] write to Information Policy Team, The National Archives, Kew, London, TW9 4DU
About this publication: enquiries www.education.gov.uk/contactus download www.gov.uk/government/publications
Reference: DFE-00278-2017
Follow us on Twitter: @educationgovuk
Like us on Facebook: facebook.com/educationgovuk