second survey on discrimination and hate crime against ... · the content of fra’s second survey...
TRANSCRIPT
Second survey on discrimination and hate crime against Jews in EU
Member States
Technical report
EQUALITY
Second survey on discrimination and hate crim
e against Jews in EU M
ember States - Technical report
FRA
More information on the European Union is available on the internet (http://europa.eu).
Luxembourg: Publications Office of the European Union, 2019
Print ISBN 978-92-9474-608-5 doi:10.2811/577209 TK-03-19-246-EN-CPDF ISBN 978-92-9474-607-8 doi:10.2811/598789 TK-03-19-246-EN-N
© European Union Agency for Fundamental Rights, 2019Reproduction is authorised provided the source is acknowledged.
Second survey on discrimination and hate crime against Jews in EU
Member States
Technical report


3
INTRODUCTION ����������������������������������������������������������������������������������������������������������������������������������������������������������������������� 5
1 DEVELOPMENT OF THE SURVEY QUESTIONNAIRE AND THE ONLINE PLATFORM ����������������������������������������������������� 91.1. Questionnaire development ..................................................................................................................................... 91.2. Questionnaire content .............................................................................................................................................. 121.3. Survey information materials .................................................................................................................................. 131.4. Online survey tool ..................................................................................................................................................... 141.5. Set-up of the survey website .................................................................................................................................. 15
2 TRANSLATION OF THE QUESTIONNAIRE AND SURVEY MATERIALS ������������������������������������������������������������������������� 172.1. Questionnaire translation ......................................................................................................................................... 172.2. Translation of other survey materials .................................................................................................................... 19
3 USABILITY TESTING ������������������������������������������������������������������������������������������������������������������������������������������������������� 21
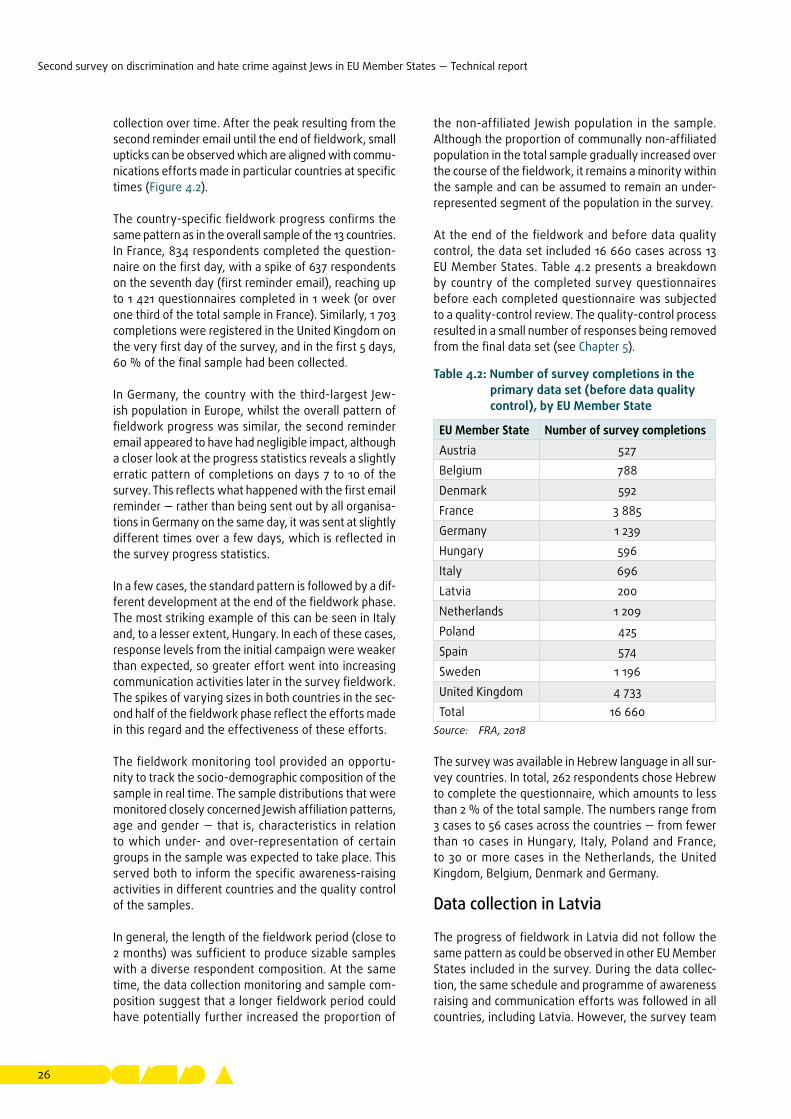
4 DATA COLLECTION AND FIELDWORK PROGRESS ������������������������������������������������������������������������������������������������������� 234.1. Technical set-up of the survey ................................................................................................................................ 234.2. Fieldwork progress ................................................................................................................................................... 24
5 DATA QUALITY CONTROL ��������������������������������������������������������������������������������������������������������������������������������������������� 295.1. Speeders and straightliners .................................................................................................................................... 295.2. Length of time taken to complete the survey ..................................................................................................... 305.3. Break-offs ................................................................................................................................................................... 325.4. Validation checks and permitted values ............................................................................................................... 325.5. Issues identified during data consistency checks and measures taken ........................................................... 335.6. Response consistency checks ................................................................................................................................ 34
6 QUALITY OF THE COUNTRY SAMPLES AND WEIGHTING �������������������������������������������������������������������������������������������� 376.1. Quality of the samples achieved in each Member State .................................................................................... 376.2. Weighting ................................................................................................................................................................... 46
6.2.1 Target population size weight ................................................................................................................... 466.2.2 Within-sample weights .............................................................................................................................. 466.2.3 Propensity weights ..................................................................................................................................... 466.2.4 Effects of different weighting approaches on the survey results ....................................................... 48
6.3. Comparison of the 2012 and 2018 surveys ............................................................................................................ 51
7 AWARENESS-RAISING ACTIVITIES ������������������������������������������������������������������������������������������������������������������������������� 577.1. Background research ................................................................................................................................................ 577.2. Awareness-raising strategy ..................................................................................................................................... 57
7.2.1 The first phase: mapping the Jewish communal landscape across the selected EU Member States ............................................................................................................................................. 58
7.2.2 The second phase: reaching out to the Jewish communities in the selected EU Member States .. 587.2.3 The third phase: the supplementary strategy in relation to the samples achieved ........................ 607.2.4 Under-represented segments of the Jewish population in the survey sample ................................ 60
8 LESSONS LEARNED �������������������������������������������������������������������������������������������������������������������������������������������������������� 63
ANNEXES ������������������������������������������������������������������������������������������������������������������������������������������������������������������������������ 65Annex 1: Survey questionnaire question wording comparison: 2018 and 2012 surveys ........................................ 65Annex 2: Survey information and awareness-raising materials ................................................................................. 67Annex 3: Screenshots of different parts of the survey and question types ............................................................. 78
Contents
4
Figure 1.1: Respondent’s potential pathways to the survey .................................................................................................... 15Figure 1.2: Survey website’s holding page .................................................................................................................................. 15Figure 1.3: Survey landing page ................................................................................................................................................... 16Figure 2.1: Illustration of the adapted TRAPD translation procedure used in translating the questionnaire of
the second survey on discrimination and hate crime against Jews in the EU ................................................... 18Figure 4.1: Total number of survey completions per day from 9 May 2018 until the end of fieldwork, in 13
EU Member States ....................................................................................................................................................... 25Figure 4.2: Number of survey completions per day from 9 May 2018 until the end of fieldwork, by EU
Member State (*) ........................................................................................................................................................ 25Figure 5.1: Respondents who took 14 minutes or less to complete the survey, by EU Member State (%)
(N = 16 460) ................................................................................................................................................................... 31
Table 1.1: Summary of key changes to the questionnaire prior to the usability testing .................................................... 11Table 1.2 Summary of key changes to the questionnaire after usability testing ............................................................... 12Table 1.3: Overview of the questionnaire structure ................................................................................................................. 13Table 2.1: Languages used in survey countries ........................................................................................................................ 17Table 4.1: Key fieldwork dates ..................................................................................................................................................... 24Table 4.2: Number of survey completions in the primary data set (before data quality control), by EU
Member State ............................................................................................................................................................... 26Table 5.1: Number of speeders and straightliners by EU Member State .............................................................................. 30Table 5.2: Time of survey completion in minutes in the final data set (in brackets: actual shortest and
longest completion time in seconds within each category) ................................................................................. 31Table 5.3: Survey completion length by device type in minutes ........................................................................................... 32Table 5.4: Number of respondents who started the survey but did not finish it (break-offs), by the
questionnaire item reached ....................................................................................................................................... 33Table 5.5: Final samples sizes, by EU Member State ............................................................................................................... 35Table 6.1: Age composition of samples in each survey country compared with Jewish population benchmark data . 41Table 6.2: Representation of women in the sample compared with the Jewish population benchmark data,
by EU Member State .................................................................................................................................................... 41Table 6.3: Representation of Jews with higher education (ISCED levels 5, 6, 7, 8) in the sample compared
with the Jewish population benchmark data, by EU Member State .................................................................... 42Table 6.4: Composition of the samples in terms of residential geography compared with the Jewish
population benchmark data, by EU Member State ................................................................................................ 42Table 6.5: Survey respondents’ Jewish community affiliation compared with the Jewish population
benchmark data, by EU Member State .................................................................................................................... 44Table 6.6: Assessment of the quality of the Jewish population benchmarks, by EU Member State ............................... 45Table 6.7: Survey participation propensities related to the used information channels about the 2018 FRA survey .. 47Table 6.8: Effect of different weighting approaches to results on respondents’ perceptions concerning
antisemitism — selected indicators of the 2018 survey, by EU Member State ................................................. 48Table 6.9: Effect of different weighting approaches to results concerning antisemitic harassment
incidents, by EU Member State ................................................................................................................................. 50Table 6.10: Within-sample weighting efficiency and the effective sample sizes, by EU Member State ........................... 51Table 6.11: Number of respondents in the 2012 and 2018 surveys, by EU Member State .................................................. 52Table 6.12: Proportion of women in the samples of the 2012 and 2018 surveys, by EU Member State (%) .................... 52Table 6.13: Age profile of respondents in the 2012 and 2018 surveys, by EU Member State (%) ...................................... 52Table 6.14: Respondents with higher education (ISCED levels 5, 6, 7, 8) in the 2012 and 2018 surveys, by EU
Member State (%) ....................................................................................................................................................... 52Table 6.15: Jewish community affiliation among respondents in the 2012 and 2018 surveys, by EU Member
State (%) ....................................................................................................................................................................... 53Table 6.16: Comparison of unweighted and weighted (propensity weighting) results for selected indicators,
2012 and 2018 surveys, by EU Member State ......................................................................................................... 55Table 6.17: Comparison of unweighted and weighted (propensity weighting) results for selected indicators,
2012 and 2018 surveys, by EU Member State ......................................................................................................... 56Table 6.18: Weighting efficiency for propensity weights, for trends in the 2012 and 2018 surveys, by EU
Member State ............................................................................................................................................................... 56
Figures and tables
5
Introduction
1 DellaPergola, S. (2016), World Jewish Population, 2016, Berman Jewish DataBank.
The overall objectives of the European Union Agency for Fundamental Rights’ (FRA) second survey on dis-crimination and hate crime against Jews in the EU are (1) to collect comparable data in the selected EU Mem-ber States, thereby contributing to the assessment and further development of policies that aim to protect the fundamental rights of Jewish people living in the EU; (2) to identify changes over time with respect to the results of the first survey on discrimination and hate crime against Jews in 2012; (3) to further develop research methodologies for surveying hard-to-reach groups using online survey tools; (4) to deliver FRA’s key stakeholders research evidence that can be used to raise awareness of fundamental rights and address gaps in the protection of rights.
The survey provides comparable data on the perceived extent and nature of antisemitism across a number of selected EU Member States, whether it is manifested as hate crime, hate speech, discrimination or in any other form that undermines Jewish people’s feelings of safety and security.
To develop the survey, FRA convened a stakeholder and expert meeting in Vienna on 7 March 2017. The meeting served mainly to inform and consult with rel-evant stakeholders and experts at an early stage of the survey development, as well as to lay the ground-work for cooperation at later stages of the survey. The participants included representatives from EU insti-tutions, European Jewish organisations, representa-tives of national Jewish communities and civil-society organisations as well as academic experts. The meeting participants expressed their support for the forthcom-ing survey and stressed the necessity of reaching out as widely as possible to the Jewish population in the countries covered by the survey.
The survey set out to collect data from self-identified Jewish people (aged 16 and over) in 13 EU Member States — Austria, Belgium, Denmark, France, Germany, Hungary, Italy, Latvia, the Netherlands, Poland, Spain, Sweden and the United Kingdom. When presenting the results of the survey, the main part of FRA’s analysis is based on data from 12 of the 13 countries, since the low response level in Latvia meant that it was not feasible to include the country in the comparative analysis. The results for Latvia have, however, been summarised in an annex to the main survey results report, and this technical report describes the steps taken to collect data in all 13 countries that were covered in the survey, including Latvia. The selected EU countries correspond to 97 % of the estimated Jewish population in the EU1.
The survey collected data through an open (opt-in) online survey, which was open for respondents to complete for 7 weeks in May and June 2018. The survey was designed to be accessible to all eligible participants, i.e. those self-identifying as Jews — based on religion, culture, upbring-ing, ethnicity, parentage or any other reason — aged 16 or over and resident in one of the survey countries. The questionnaire could be accessed via an open web link that was publicised on the FRA website, via Jewish organisations, Jewish media outlets and social networks. The content of FRA’s second survey on discrimination and hate crime against Jews builds strongly on the experience and methodology developed for the first, 2012 FRA sur-vey on discrimination and hate crime against Jews (which covered eight EU Member States) and on stakeholder and expert consultation carried out in spring 2017.
FRA designed the survey project with a view to maxi-mising the possibilities of achieving a diverse sample of respondents from the target population, which is challenging to reach given the relatively small size of the Jewish population compared with the general popu-lation of the EU Member States.
Following an EU-wide open call for tenders, FRA com-missioned a consortium of Ipsos MORI and the Insti-tute for Jewish Policy Research (JPR), both based in the United Kingdom, to implement the survey, following the technical specifications from FRA. This involved plan-ning, preparing and carrying out the data collection activities, including the following:
• conducting background research and consultations with the Jewish communities;
• carrying out awareness-raising activities;
• reviewing the translations of the questionnaire and of the additional translations of revised parts of the questionnaire and translations into languages not used in the 2012 survey;
• translating information materials;
• transforming the questionnaire into an online sur-vey tool and hosting the survey;
• collecting data through the open online survey;
• processing and delivering the data set;
• tabulating selected indicators and technical reporting.
Second survey on discrimination and hate crime against Jews in EU Member States — Technical report
6
The survey consortium managed the data collection work under the general oversight of FRA staff, who monitored compliance according to strict quality-control procedures and also had the final say in key stages of the project, including approval of the final version of the questionnaire before it was used to programme the online survey tool. The contractor — the consortium of Ipsos MORI and JPR — carried out these tasks from Octo-ber 2017 to August 2018. The national research teams of academic experts and local researcher and community liaison points in each survey country supported the sur-vey implementation. JPR collected information on the size and composition of the Jewish population in each country and on the communal structures of the Euro-pean Jewish communities, identified ways to make Jew-ish people in the selected countries aware of the survey and implemented the communication strategy. Ipsos MORI ensured the technical set-up of the survey, includ-ing the translation of all survey materials, the develop-ment of the survey website and compliance with the standards of data security, privacy and confidentiality.
The survey’s Central Coordination Team (CCT) — consist-ing of Ipsos MORI and JPR staff with extensive experi-ence in delivering large, multi-country studies — was responsible for the coordination and management of the implementation of the fieldwork in the 13 EU Member States. In planning and implementing the sur-vey, the CCT and FRA benefited from the experience of a number of renowned international researchers, target population and subject matter specialists and academics. Several leading specialists on issues of contemporary European Jewry advised on the design and implementation of the survey: Professor Eliezer Ben-Rafael (Tel Aviv University, Israel), Professor Michał Bilewicz (University of Warsaw, Poland), Professor Chantal Bordes-Benayoun (National Centre for Scientific Research, France), Dr Jonathan Boyd (Institute for Jew-ish Policy Research, United Kingdom), Professor Sergio DellaPergola (Hebrew University of Jerusalem, Israel), Professor Lars Dencik (Roskilde University, Denmark), Dr Olaf Glöckner (Moses Mendelssohn Zentrum, Ger-many), Dr Erich Griessler (Institute for Advanced Studies, Austria), Professor András Kovács (Central European University, Hungary), Dr Hannah van Solinge (Nether-lands Interdisciplinary Demographic Institute), Dr Daniel Staetsky (Institute for Jewish Policy Research, United Kingdom), Dr Mark Tolts (Hebrew University of Jerusa-lem, Israel) and Dr Martina Weisz (Hebrew University of Jerusalem, Israel).
The CCT was led by a quality director and a project direct- or, supported by a project manager and two deputy project managers, as well as a team of specialists in each of the activities (including academic lead, data processing manager, translation manager and weight-ing consultant) and national research teams. Directed by
the CCT, the in-country teams who delivered the local activities were comprised of a national research team in each survey country led by one of the academic experts (affiliated with JPR) and a local researcher drawn from Ipsos’ network of national research agencies as well as a community liaison contact point to ensure the appro-priate skills and expertise were available for the back-ground research, community engagement, translation and testing of the online survey tool.
FRA agreed with the contractor on a quality assurance plan at the beginning of the project. This outlined the procedures that would be used to monitor quality at all stages of the survey life cycle, and detailed how their achievement would be documented. The quality assurance procedures relevant for various activities are described in this technical report in the relevant sec-tions concerning each activity.
In August 2018, FRA received the final data set, tabu-lation of selected indicators and the technical report from the contractor, which allowed FRA to start ana-lysing the data. The survey results were published in December 2018 in the report Experiences and percep-tions of antisemitism. Second survey on discrimination and hate crime against Jews in the EU2. This technical report describes in detail the data collection process and outcomes beyond the results of the survey, which are presented in the survey results report.
The survey asked respondents about their opinions on trends in antisemitism, antisemitism as a problem in everyday life, personal experiences of antisemitic incidents, witnessing antisemitic incidents and wor-ries about becoming a victim of an antisemitic attack. The survey also provides data on the extent to which respondents consider antisemitic acts against the Jew-ish community — such as vandalism of Jewish sites or antisemitic messages in the broadcast media or on the internet — to be a problem in their respective countries.
Furthermore, the survey collected data on the effects of antisemitism on respondents’ daily behaviour and their feelings of safety and about any actions they take due to security fears. The questions about personal experi ences of specific forms of harassment or physical violence were followed up with questions concerning the details of such incidents, including their frequency, hate motivation, the number and characteristics of perpetrators and the reporting of the incident to any organisation or institution. The survey collected data about personal experiences of feeling discriminated against on different grounds and in various areas of
2 FRA (2018), Experiences and perceptions of antisemitism — Second survey on discrimination and hate crime against Jews in the EU, Luxembourg, Publications Office of the European Union (Publications Office).
Introduction
7
everyday life — for example, at work, school or when using specific services. The survey followed up on respondents’ discrimination experiences with questions concerning the reporting of incidents and the reasons for non-reporting. The survey also explored the level of rights awareness regarding anti-discrimination legisla-tion, victim support organisations and knowledge of any legislation concerning the trivialisation or denial of the Holocaust. The survey questionnaire is available as a separate document on the FRA website3.
This technical report presents in detail all the stages of the survey and the relevant information needed to assess the quality and reliability of the data, as well as considerations for interpreting the survey results. The following chapters of the report cover the pro-cedures used in the development and administration of the survey.
3 FRA (2018), Experiences and perceptions of antisemitism — Second survey on discrimination and hate crime against Jews in the EU — Questionnaire, Luxembourg, Publications Office.
The first three chapters of this report describe and assess the different stages of developing the methodo-logical design of the survey such as the development of the questionnaire and the online survey platform (Chapter 1) and the translation process (Chapter 2). The survey was tested before the main stage fieldwork in countries which had not been covered in the 2012 sur-vey, to collect feedback on the usability of the online survey tool and all fieldwork materials. A summary of the usability testing report is available in Chapter 3. Chapter 4 describes the main stage fieldwork with details concerning the achieved sample as well as fieldwork progress, quality-control procedures and out-comes (Chapter 5). Chapter 6 discusses the quality of the samples achieved and approaches taken regarding the weighting of the survey data. Chapter 7 provides a summary of the background research and awareness-raising activities. The final chapter summarises the les-sons learned for future surveys.

9
1 Development of the survey questionnaire and the online platform
This chapter describes the development of the ques-tionnaire and the online platform, which includes the survey tool as well as all other information provided to the respondents about the survey. The chapter is divided into the following key sections: questionnaire development and its content, the additional survey materials and the development of the online survey tool and set-up of the survey website.
1�1� Questionnaire development
The development of the survey questionnaire content was the responsibility of FRA. The questionnaire was largely based on the questionnaire developed for the 2012 survey, primarily to allow for the assessment of trends. FRA, Ipsos MORI and JPR worked together to revise the questionnaire for the 2018 survey. The questionnaire review focused on the content-related developments since the first survey was carried out and finding an online survey design that is compat-ible across the latest and most common operating systems and devices which respondents are likely to use to access the survey (known as a device agnostic survey design, where the survey is displayed correctly on every type of screen and device). The questionnaire went through a multi-stage review process before being finalised, as summarised below.
• FRA provided the contractor with a draft of the questionnaire in English. This version incorporated initial changes to the 2012 survey questionnaire and the new items.
• Ipsos MORI conducted device agnostic testing on the English and German versions of the question-naire. The testing focused on identifying question
text and item text that was above the upper limit of the recommended number of characters and questions where the layout should be adapted so as to be visible on a variety of devices. German was chosen as the second language for testing based on earlier experience showing that translations into German are often longer than the original English text. Based on the testing report, the survey intro-duction text was revised, the introductory texts in advance of questions were placed on separate screens, questions involving multiple items with the same answer scale were implemented using progressive grids4 and efforts were made to reduce the length of questions and items so as to improve the design, while ensuring the comparability with the 2012 survey.
• FRA, JPR and Ipsos MORI reviewed the question-naire content over a series of review meetings held via conference calls in October and November 2017. The majority of the questionnaire remained the same, or as close as possible to the 2012 sur-vey to preserve trends while at the same time tak-ing into account the device agnostic survey design principles. Upon final approval by FRA, the ques-tionnaire was forwarded for translation. During the translation process, the questionnaire was further reviewed by the contractor’s team, including the national research experts (NRE) who provided in-put on the entire survey and the country-specific
4 Questions composed of several items which all use the same answer categories can be displayed as progressive grids, where respondents do not see all items at once, but the online survey tool expands the items one by one, so that once the respondent has completed an item it is automatically collapsed on the screen and the next item appears, until all items have been completed. This helps the respondent to focus on each question separately and to avoid having to scroll down the page.
Second survey on discrimination and hate crime against Jews in EU Member States — Technical report
10
items, fine-tuning and correcting translations where necessary.
• During the programming and technical testing of the online survey, Ipsos MORI tested the stability of the questionnaire display and interaction across browsers, operating systems and devices. Further-more, as respondents were accessing the survey via an open link, which meant that the opening pages of the survey had to be available in all survey languages, the team worked to create visuals that made it as intuitive as possible for respondents to access the survey. Screenshots of selected survey questions are provided in Annex 3.
• Ipsos MORI conducted the usability testing of the questionnaire to assess how easy it is for a range of different types of participants to access the online survey tool, navigate the online questionnaire, answer questions and carry out other tasks. In add-ition, it was used to test sensitive questions and, in some instances, cognition of the survey questions. Details about the usability testing process (e.g. re-cruitment, types of questions tested) can be found in the chapter on usability testing (Chapter 3).
• Final adjustments were made to the questionnaire following the usability testing and applied to the online survey tool in advance of the mainstage fieldwork.
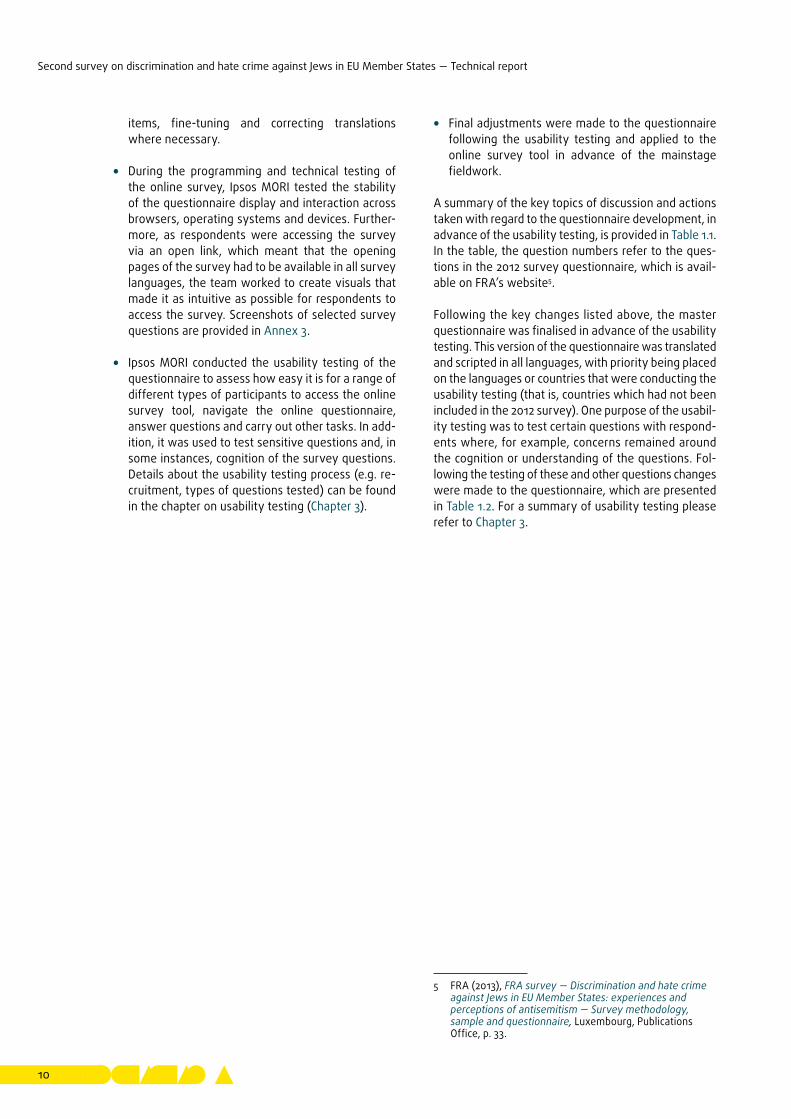
A summary of the key topics of discussion and actions taken with regard to the questionnaire development, in advance of the usability testing, is provided in Table 1.1. In the table, the question numbers refer to the ques-tions in the 2012 survey questionnaire, which is avail-able on FRA’s website5.
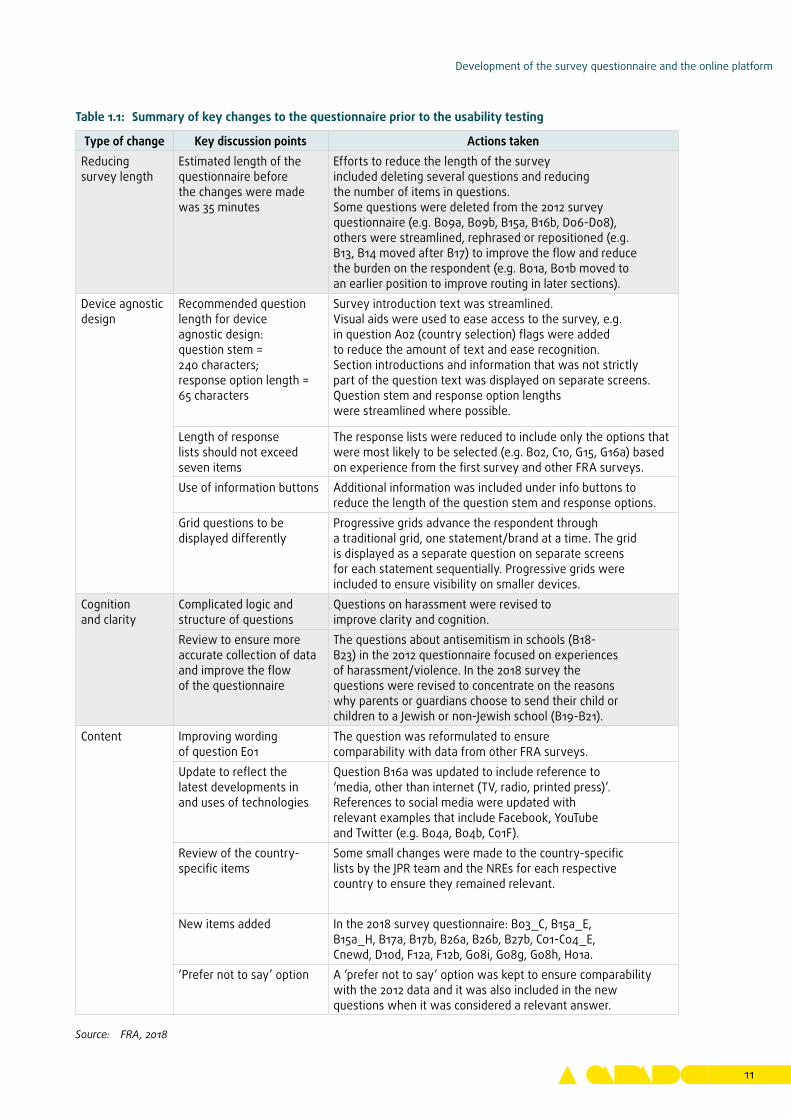
Following the key changes listed above, the master questionnaire was finalised in advance of the usability testing. This version of the questionnaire was translated and scripted in all languages, with priority being placed on the languages or countries that were conducting the usability testing (that is, countries which had not been included in the 2012 survey). One purpose of the usabil-ity testing was to test certain questions with respond-ents where, for example, concerns remained around the cognition or understanding of the questions. Fol-lowing the testing of these and other questions changes were made to the questionnaire, which are presented in Table 1.2. For a summary of usability testing please refer to Chapter 3.
5 FRA (2013), FRA survey — Discrimination and hate crime against Jews in EU Member States: experiences and perceptions of antisemitism — Survey methodology, sample and questionnaire, Luxembourg, Publications Office, p. 33.
Development of the survey questionnaire and the online platform
11
Table 1.1: Summary of key changes to the questionnaire prior to the usability testing
Type of change Key discussion points Actions takenReducing survey length
Estimated length of the questionnaire before the changes were made was 35 minutes
Efforts to reduce the length of the survey included deleting several questions and reducing the number of items in questions.Some questions were deleted from the 2012 survey questionnaire (e.g. B09a, B09b, B15a, B16b, D06-D08), others were streamlined, rephrased or repositioned (e.g. B13, B14 moved after B17) to improve the flow and reduce the burden on the respondent (e.g. B01a, B01b moved to an earlier position to improve routing in later sections).
Device agnostic design
Recommended question length for device agnostic design:question stem = 240 characters;response option length = 65 characters
Survey introduction text was streamlined.Visual aids were used to ease access to the survey, e.g. in question A02 (country selection) flags were added to reduce the amount of text and ease recognition.Section introductions and information that was not strictly part of the question text was displayed on separate screens.Question stem and response option lengths were streamlined where possible.
Length of response lists should not exceed seven items
The response lists were reduced to include only the options that were most likely to be selected (e.g. B02, C10, G15, G16a) based on experience from the first survey and other FRA surveys.
Use of information buttons Additional information was included under info buttons to reduce the length of the question stem and response options.
Grid questions to be displayed differently
Progressive grids advance the respondent through a traditional grid, one statement/brand at a time. The grid is displayed as a separate question on separate screens for each statement sequentially. Progressive grids were included to ensure visibility on smaller devices.
Cognition and clarity
Complicated logic and structure of questions
Questions on harassment were revised to improve clarity and cognition.
Review to ensure more accurate collection of data and improve the flow of the questionnaire
The questions about antisemitism in schools (B18-B23) in the 2012 questionnaire focused on experiences of harassment/violence. In the 2018 survey the questions were revised to concentrate on the reasons why parents or guardians choose to send their child or children to a Jewish or non-Jewish school (B19-B21).
Content Improving wording of question E01
The question was reformulated to ensure comparability with data from other FRA surveys.
Update to reflect the latest developments in and uses of technologies
Question B16a was updated to include reference to ‘media, other than internet (TV, radio, printed press)’.References to social media were updated with relevant examples that include Facebook, YouTube and Twitter (e.g. B04a, B04b, C01F).
Review of the country-specific items
Some small changes were made to the country-specific lists by the JPR team and the NREs for each respective country to ensure they remained relevant.
New items added In the 2018 survey questionnaire: B03_C, B15a_E, B15a_H, B17a, B17b, B26a, B26b, B27b, C01-C04_E, Cnewd, D10d, F12a, F12b, G08i, G08g, G08h, H01a.
‘Prefer not to say’ option A ‘prefer not to say’ option was kept to ensure comparability with the 2012 data and it was also included in the new questions when it was considered a relevant answer.
Source: FRA, 2018
Second survey on discrimination and hate crime against Jews in EU Member States — Technical report
12
Following the revisions to the master questionnaire, the online survey tool was updated and the additional translations were finalised. Full comparison of item wording of the questionnaires of the 2012 and 2018 surveys is available in Annex 1.
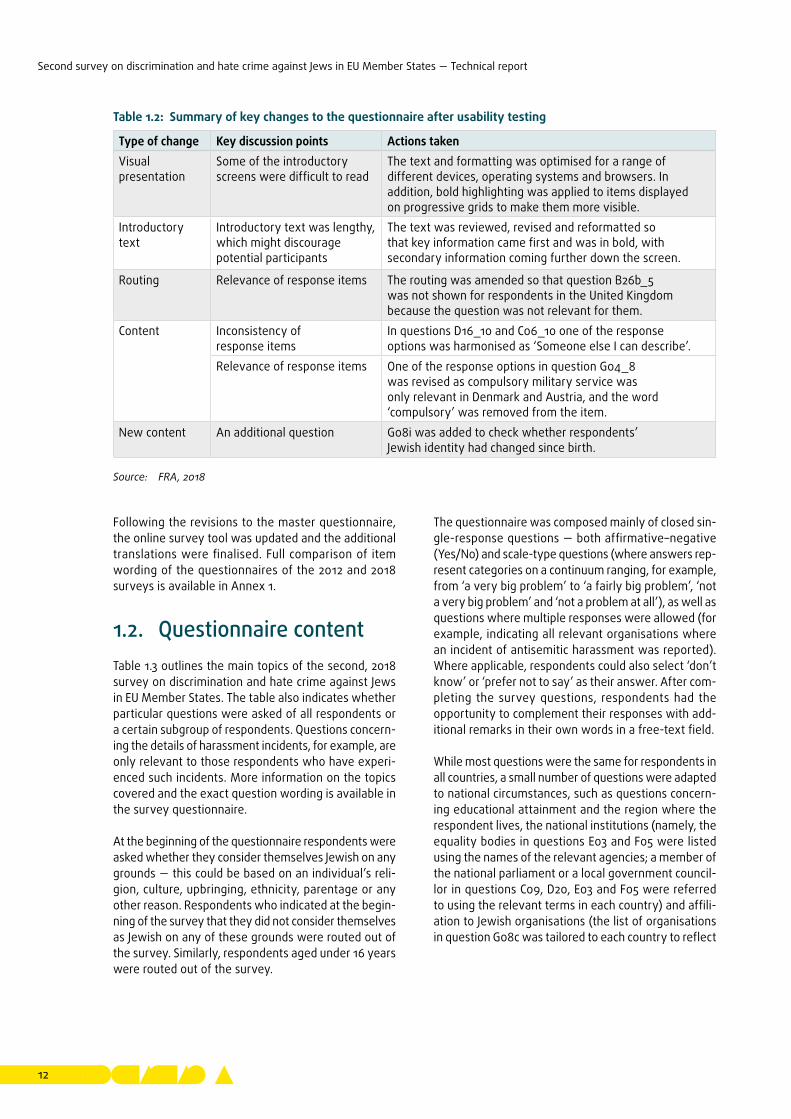
1�2� Questionnaire contentTable 1.3 outlines the main topics of the second, 2018 survey on discrimination and hate crime against Jews in EU Member States. The table also indicates whether particular questions were asked of all respondents or a certain subgroup of respondents. Questions concern-ing the details of harassment incidents, for example, are only relevant to those respondents who have experi-enced such incidents. More information on the topics covered and the exact question wording is available in the survey questionnaire.
At the beginning of the questionnaire respondents were asked whether they consider themselves Jewish on any grounds — this could be based on an individual’s reli-gion, culture, upbringing, ethnicity, parentage or any other reason. Respondents who indicated at the begin-ning of the survey that they did not consider themselves as Jewish on any of these grounds were routed out of the survey. Similarly, respondents aged under 16 years were routed out of the survey.
The questionnaire was composed mainly of closed sin-gle-response questions — both affirmative–negative (Yes/No) and scale-type questions (where answers rep-resent categories on a continuum ranging, for example, from ‘a very big problem’ to ‘a fairly big problem’, ‘not a very big problem’ and ‘not a problem at all’), as well as questions where multiple responses were allowed (for example, indicating all relevant organisations where an incident of antisemitic harassment was reported). Where applicable, respondents could also select ‘don’t know’ or ‘prefer not to say’ as their answer. After com-pleting the survey questions, respondents had the opportunity to complement their responses with add-itional remarks in their own words in a free-text field.
While most questions were the same for respondents in all countries, a small number of questions were adapted to national circumstances, such as questions concern-ing educational attainment and the region where the respondent lives, the national institutions (namely, the equality bodies in questions E03 and F05 were listed using the names of the relevant agencies; a member of the national parliament or a local government council-lor in questions C09, D20, E03 and F05 were referred to using the relevant terms in each country) and affili-ation to Jewish organisations (the list of organisations in question G08c was tailored to each country to reflect
Table 1.2: Summary of key changes to the questionnaire after usability testing
Type of change Key discussion points Actions takenVisual presentation
Some of the introductory screens were difficult to read
The text and formatting was optimised for a range of different devices, operating systems and browsers. In addition, bold highlighting was applied to items displayed on progressive grids to make them more visible.
Introductory text
Introductory text was lengthy, which might discourage potential participants
The text was reviewed, revised and reformatted so that key information came first and was in bold, with secondary information coming further down the screen.
Routing Relevance of response items The routing was amended so that question B26b_5 was not shown for respondents in the United Kingdom because the question was not relevant for them.
Content Inconsistency of response items
In questions D16_10 and C06_10 one of the response options was harmonised as ‘Someone else I can describe’.
Relevance of response items One of the response options in question G04_8 was revised as compulsory military service was only relevant in Denmark and Austria, and the word ‘compulsory’ was removed from the item.
New content An additional question G08i was added to check whether respondents’ Jewish identity had changed since birth.
Source: FRA, 2018
Development of the survey questionnaire and the online platform
13
the organisations available6). The International Stand-ard Classification of Education (ISCED) categories were used to record the highest level of education gained by respondents. The country-specific categories used in respective survey countries were mapped back into the harmonised ISCED coding frame to be used for the comparative analysis. The national variations were kept to a minimum to ensure comparability across countries.
6 To provide researchers access to microdata of the 2012 FRA survey on discrimination and hate crime against Jews in the EU, the data set went through a disclosure control process to ensure that respondents cannot be identified. As a result of the disclosure control checks made, the variables related to question G08c concerning local Jewish organisations were excluded from the archived data set. The same approach was applied to the 2018 survey data set. Also, some other variables were excluded (e.g. Gnew, G16aB, G16aC) or recoded (e.g. citizenship recoded into national/non-national due to the low number of non-citizens in the data set) to prevent potential identification.
1�3� Survey information materials
Information materials developed for the survey included materials that were used for the awareness-raising activities and materials that were used to provide add-itional information to respondents during fieldwork. The information materials were the following:
1. invitation email,
2. two reminder emails,
3. frequently asked questions document (FAQ),
4. privacy policy,
5. information note for data subjects,
6. contact us form.
Table 1.3: Overview of the questionnaire structure
Sections Topics coveredWelcome, introduction and screening
Country of residence, survey language, Jewish identity and age.
Feelings of safety and security
Multi-item questions on the extent of antisemitism in different areas (everyday life, media, politics, internet), prevalence of manifestations of antisemitism, levels of antisemitism, antisemitic nature of negative comments and their prevalence, worry of victimisation, avoidance behaviour, actions considered due to lack of safety, influence of events in the Middle East on antisemitic incidents.
HarassmentPrevalence of harassment (including incidents related to being Jewish) and characteristics of the most serious incident in the 5 years before the survey (forms, frequency, location, perpetrators, reporting and reasons for non-reporting).
Experiences of violence and vandalism
Prevalence of vandalism (including incidents related to being Jewish) in the 5 years before the survey.Prevalence of violence (including incidents related to being Jewish) and characteristics of the most serious incident in the 5 years before the survey (frequency, location, perpetrators, reporting and reasons for non-reporting).
Rights awareness
Awareness of existing anti-discrimination legislation and relevant support organisations.Awareness of existing legislation that forbids incitement to violence or hatred against Jews; denial or trivialisation of the Holocaust.
Experiences of discrimination
Discrimination experiences on any grounds, and specifically related to being Jewish.Discrimination incidents in various areas of everyday life in the 12 months preceding the survey, reporting these incidents to any organisation and reasons for non-reporting.
Respondent backgroundStandard socio-demographic information, relationship status, questions about Jewish identity (following of practices, belonging to organisations, religious affiliation, etc.).
Conclusion Information about the survey.Free-text field for additional remarks concerning antisemitism in the country.
Source: FRA, 2018
Second survey on discrimination and hate crime against Jews in EU Member States — Technical report
14
The invitation and reminder emails were based on updated versions of the materials used in the 2012 sur-vey. The FAQ document, privacy policy, information for data subjects and contact us form were sourced from other FRA surveys and were reviewed and updated to ensure their relevance to the latest privacy policy developments, including the entry into application of the general data protection regulation and its appli-cability for this survey. The FAQ document compiled answers to the questions respondents were likely to ask based on experience from earlier surveys. The privacy policy provided respondents with the main informa-tion about the survey and measures applied to ensure confidentiality, anonymity and data protection on the survey website. The information note for data subjects explained what kind of personal data FRA collected, how FRA will use the data and listed respondents’ rights related to their personal data.
All these survey materials were available in all survey languages.
The use of the survey information materials, com-munication strategy, including email distribution, are described in Chapter 7, on awareness-raising activities.
1�4� Online survey toolIn the absence of reliable sampling frames, and based on experiences with the 2012 survey7, FRA decided to use an opt-in online survey approach as it allowed all self-identifying Jewish people who were 16 years of age or older and living in one of the selected EU Member States — Austria, Belgium, Denmark, France, Germany, Hungary, Italy, Latvia, the Netherlands, Poland, Spain, Sweden and the United Kingdom — to complete the survey when and where it was most convenient for them, at their own pace, in their national languages and in an anonymous and confidential manner. It was also the method which could most easily be used to survey respondents from all the selected Member States under equal conditions, and was able to achieve national cov-erage in each of the survey countries. Due to the nature of an open opt-in online survey, this method does not deliver a random probability sample that would fulfil the statistical criteria for representativeness and provide valid and reliable estimates of the attitudes or experi-ences of the broader target population.
Although the open opt-in online survey was gener-ally successful, the chosen survey mode is likely to have excluded some eligible members of the target
7 FRA (2013), FRA survey — Discrimination and hate crime against Jews in EU Member States: experiences and perceptions of antisemitism — Survey methodology, sample and questionnaire, Luxembourg, Publications Office, p. 33.
population, such as those with problems accessing the internet or those lacking the skills to complete an online survey. However, the survey findings are reliable and robust, and represent the most comprehensive data available on experiences of self-identified Jews in the EU. As in any nonprobability survey, there is no way to assess the estimated bias related to the respondent selection, non-response, since information about the whole population and specifically those who decided not to participate in the survey (chose not to opt in) is not available or very limited.
The finalised version of the questionnaire was devel-oped into a self-administered web-based questionnaire that could be completed via the online survey tool. Due to the self-administered survey mode (as opposed to interviewer-administered mode — that is, an inter-viewer asking the questions and recording the answer given by the respondent), some questions which are also used in interviewer-administered FRA surveys had to be slightly modified to better suit the situation where the respondent must be able to navigate the question-naire on their own and see both the question and the response options. The online survey tool was developed by Ipsos MORI using Dimensions software. The master script was prepared in English. The tested master script was overlaid with the translated versions of the ques-tionnaire. The country- and language-specific versions of the online survey tool were tested by the NREs to ensure that the translations and country-specific ques-tions had been correctly uploaded.
The online survey tool was designed to remain open and accessible to respondents 24 hours a day, 7 days a week for a consecutive period of up to 2 months. The survey was set up as an open web link. Using an open web link was preferred because it meant that respond-ents did not have to provide their email addresses, pre-register to access the survey or be given other login details. This was important not only for data protection but also for mitigating any potential sensitivities about third parties collecting this information (for example, the survey awareness-raising activities were reliant on the support of numerous third parties — Jewish commu-nity organisations — operating within each surveyed EU Member State; these organisations were asked to share the message through their networks and mailing lists, without any further control on the outcome). For secu-rity reasons, an open link could only be accessed and filled in at once, i.e. if a respondent opens the link, starts the survey, closes their browser and then attempts to restart the survey using the open link they will not be able to return to the responses in their incomplete sur-vey, but will be sent to a new survey. Once the respond-ent had selected their language, they were provided with a unique link to access the survey. The unique link was provided in the introductory text in the next
Development of the survey questionnaire and the online platform
15
screen after the language selection. This meant that (a) respondents did not provide any personal information when using the open link; and (b) those who copied the unique link could pause the survey and restart at a later date if they wished.
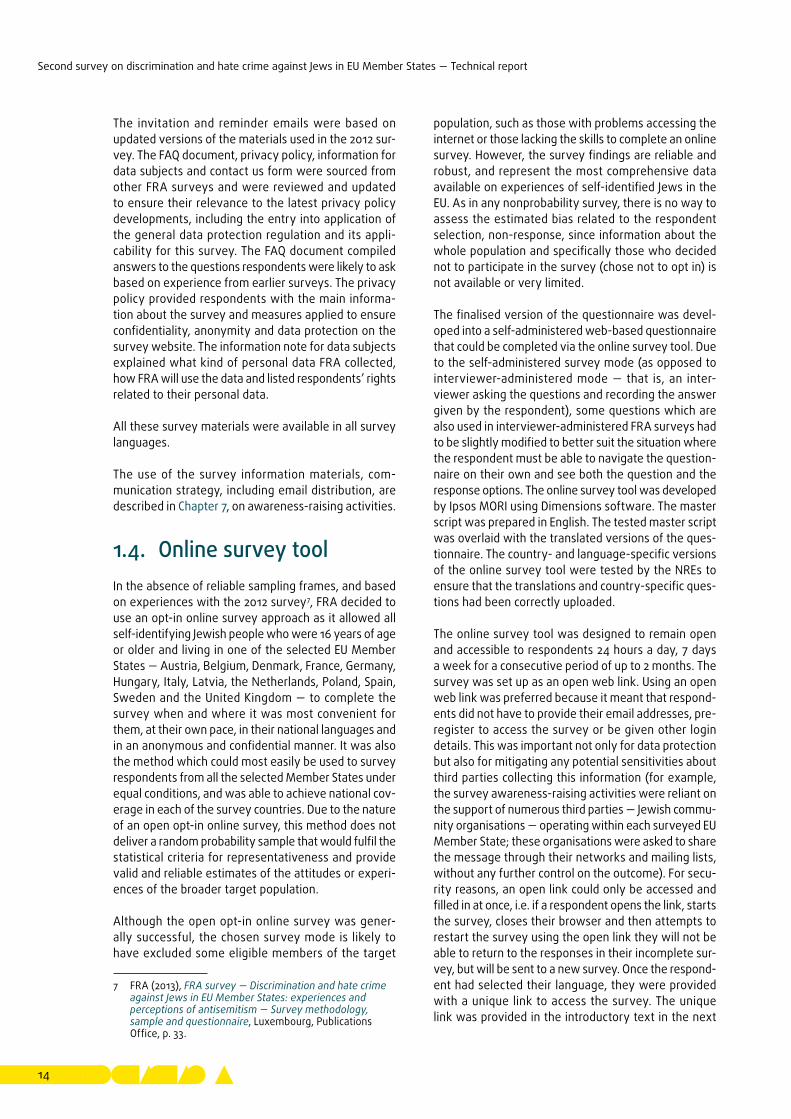
Figure 1.1 shows respondents’ potential pathways to the survey. The survey was hosted on a secure Ipsos MORI server. To encourage participation in the survey, an additional URL ‘www.eurojews.eu’ was bought and registered by JPR, and this URL was included in the awareness-raising materials. When respondents clicked on this link or typed it in their browser they were automatically redirected to the open-link survey page on the Ipsos MORI server. From here, respondents
could start and complete the survey. The visual identity of the online survey tool followed the design of the awareness-raising materials to ensure a smooth transi-tion for the respondents and to reduce the potential for respondents to be concerned when they are redirected from one URL to another.
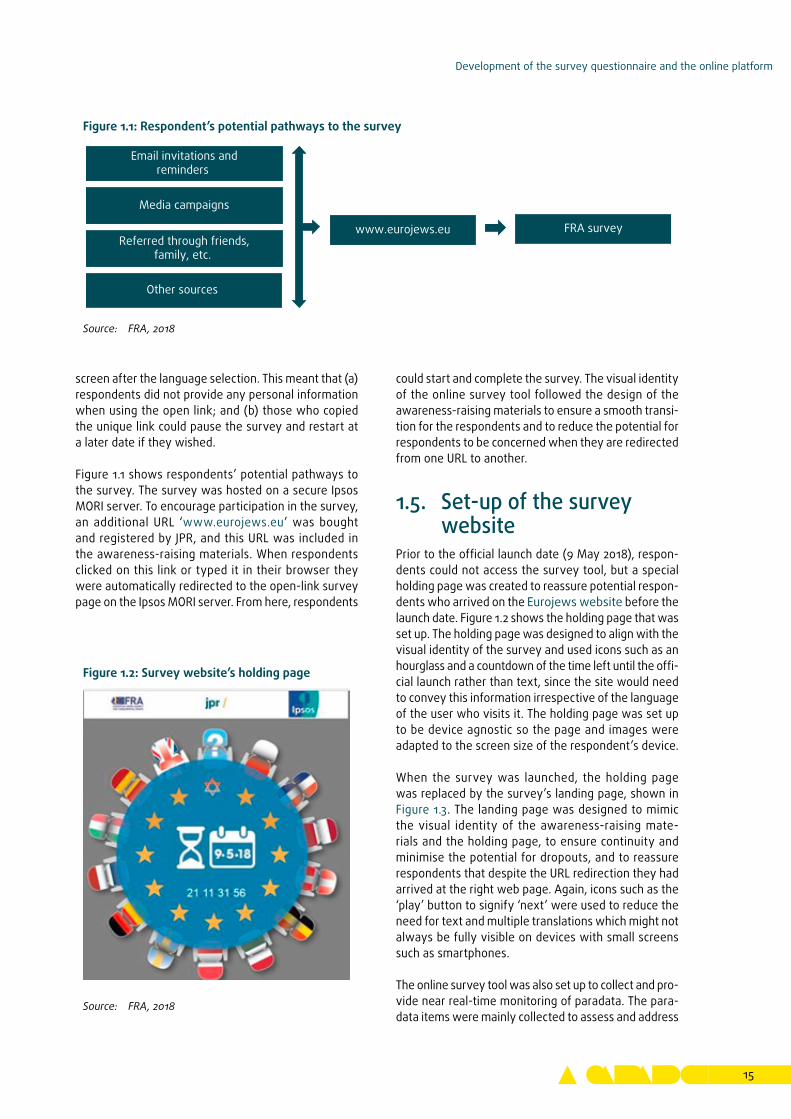
1�5� Set-up of the survey website
Prior to the official launch date (9 May 2018), respon-dents could not access the survey tool, but a special holding page was created to reassure potential respon-dents who arrived on the Eurojews website before the launch date. Figure 1.2 shows the holding page that was set up. The holding page was designed to align with the visual identity of the survey and used icons such as an hourglass and a countdown of the time left until the offi-cial launch rather than text, since the site would need to convey this information irrespective of the language of the user who visits it. The holding page was set up to be device agnostic so the page and images were adapted to the screen size of the respondent’s device.
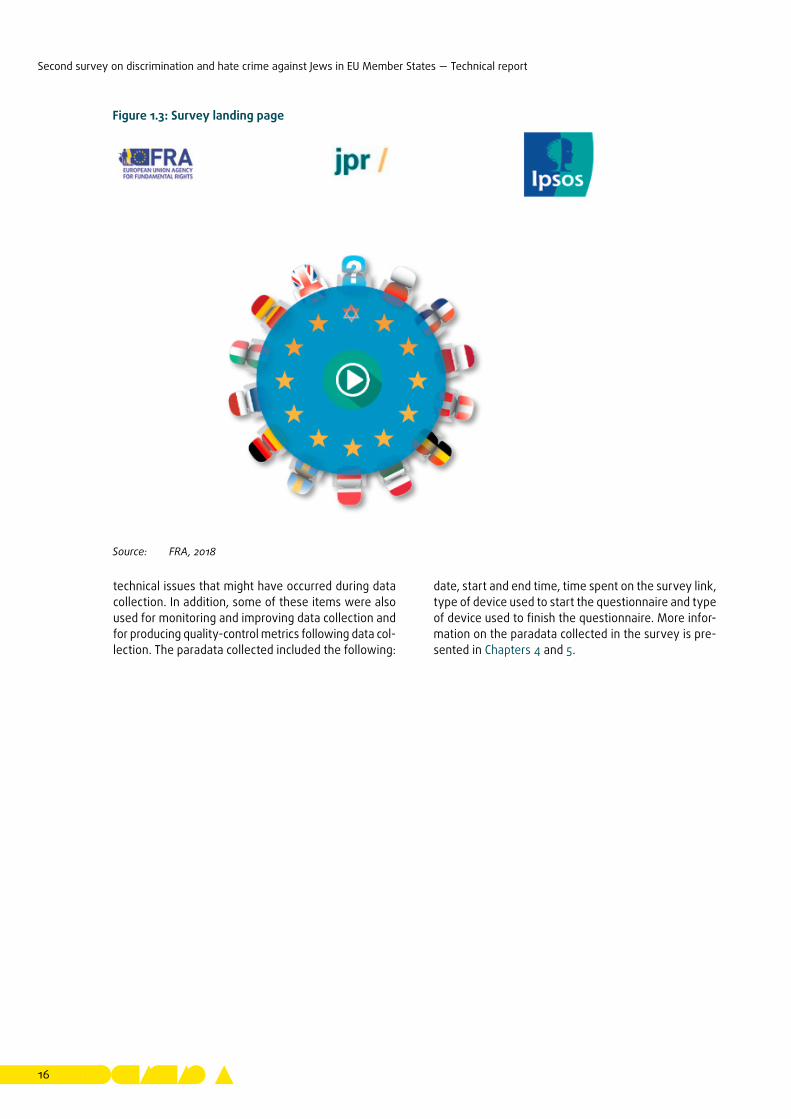
When the survey was launched, the holding page was replaced by the survey’s landing page, shown in Figure 1.3. The landing page was designed to mimic the visual identity of the awareness-raising mate-rials and the holding page, to ensure continuity and minimise the potential for dropouts, and to reassure respondents that despite the URL redirection they had arrived at the right web page. Again, icons such as the ‘play’ button to signify ‘next’ were used to reduce the need for text and multiple translations which might not always be fully visible on devices with small screens such as smartphones.
The online survey tool was also set up to collect and pro-vide near real-time monitoring of paradata. The para-data items were mainly collected to assess and address
Figure 1.1: Respondent’s potential pathways to the survey
Source: FRA, 2018
Email invitations andreminders
Media campaigns
Referred through friends,family, etc.
Other sources
www.eurojews.eu FRA survey
Figure 1.2: Survey website’s holding page
Source: FRA, 2018
Second survey on discrimination and hate crime against Jews in EU Member States — Technical report
16
technical issues that might have occurred during data collection. In addition, some of these items were also used for monitoring and improving data collection and for producing quality-control metrics following data col-lection. The paradata collected included the following:
date, start and end time, time spent on the survey link, type of device used to start the questionnaire and type of device used to finish the questionnaire. More infor-mation on the paradata collected in the survey is pre-sented in Chapters 4 and 5.
Figure 1.3: Survey landing page
Source: FRA, 2018
17
2 Translation of the questionnaire and survey materials
This chapter outlines the details of the translation pro-cess, including the selected approach to producing the translations, the materials translated and who was involved in the coordination, translation, documentation, revision and approval stages in the translation process.
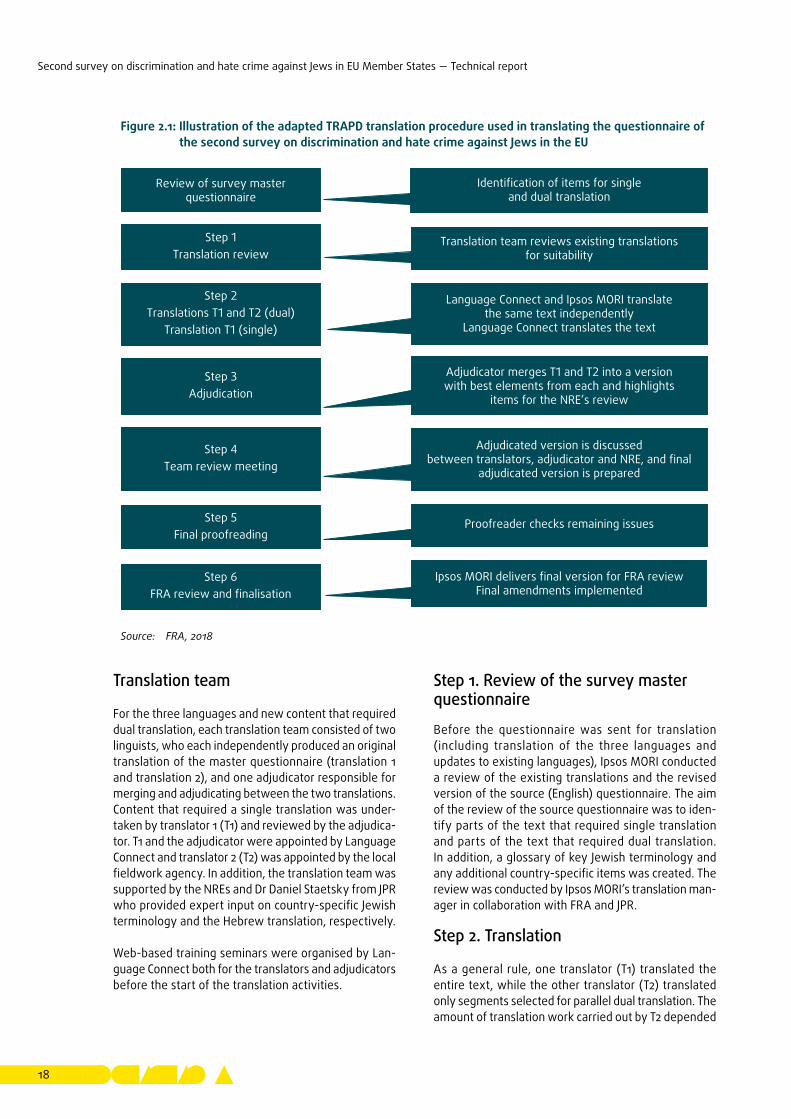
2�1� Questionnaire translationThe questionnaire translations of the 2012 survey were available as a basis for producing the revised question-naire translations for most of the languages used in the survey. In addition, the English master version of the questionnaire for FRA’s second survey on discrimination and hate crime against Jews in the EU was fully trans-lated into three languages — Danish, Polish and Span-ish. These languages represent countries which were not covered in the 2012 survey. In the case of Austria and the Netherlands, the questionnaires for Germany
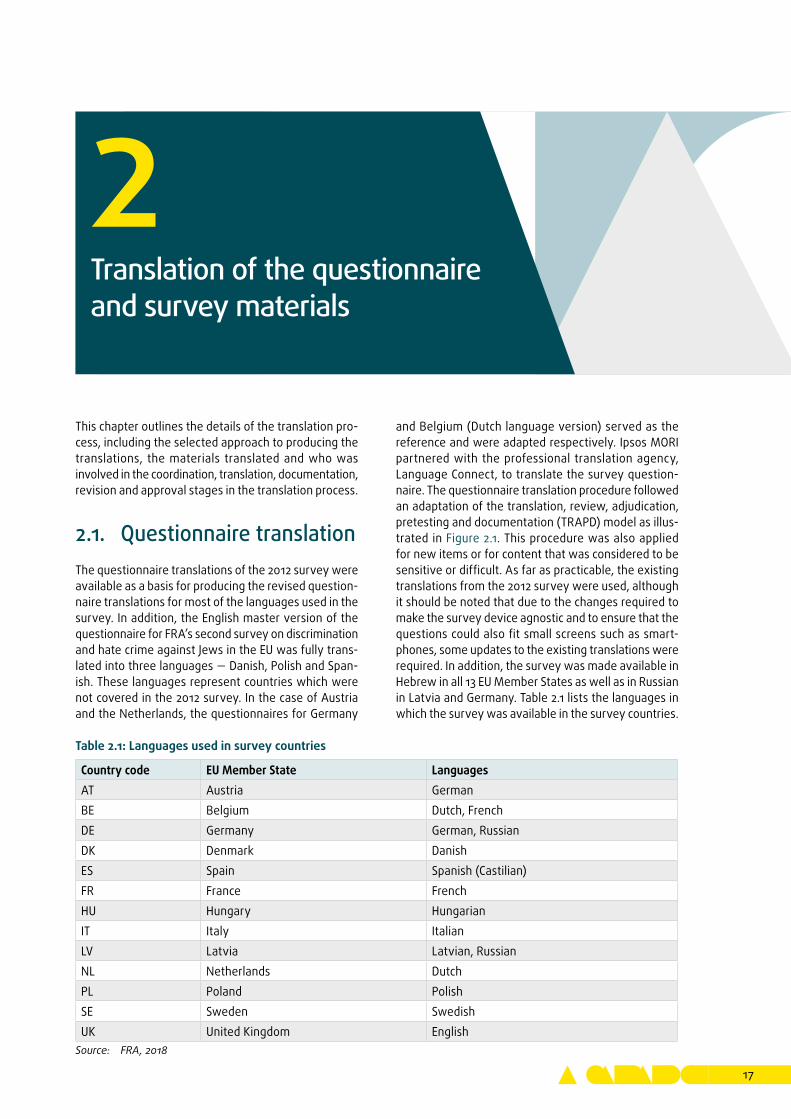
and Belgium (Dutch language version) served as the reference and were adapted respectively. Ipsos MORI partnered with the professional translation agency, Language Connect, to translate the survey question-naire. The questionnaire translation procedure followed an adaptation of the translation, review, adjudication, pretesting and documentation (TRAPD) model as illus-trated in Figure 2.1. This procedure was also applied for new items or for content that was considered to be sensitive or difficult. As far as practicable, the existing translations from the 2012 survey were used, although it should be noted that due to the changes required to make the survey device agnostic and to ensure that the questions could also fit small screens such as smart-phones, some updates to the existing translations were required. In addition, the survey was made available in Hebrew in all 13 EU Member States as well as in Russian in Latvia and Germany. Table 2.1 lists the languages in which the survey was available in the survey countries.
Table 2.1: Languages used in survey countries
Country code EU Member State LanguagesAT Austria GermanBE Belgium Dutch, FrenchDE Germany German, RussianDK Denmark DanishES Spain Spanish (Castilian)FR France FrenchHU Hungary HungarianIT Italy ItalianLV Latvia Latvian, RussianNL Netherlands DutchPL Poland PolishSE Sweden SwedishUK United Kingdom English
Source: FRA, 2018
Second survey on discrimination and hate crime against Jews in EU Member States — Technical report
18
Translation team
For the three languages and new content that required dual translation, each translation team consisted of two linguists, who each independently produced an original translation of the master questionnaire (translation 1 and translation 2), and one adjudicator responsible for merging and adjudicating between the two translations. Content that required a single translation was under-taken by translator 1 (T1) and reviewed by the adjudica-tor. T1 and the adjudicator were appointed by Language Connect and translator 2 (T2) was appointed by the local fieldwork agency. In addition, the translation team was supported by the NREs and Dr Daniel Staetsky from JPR who provided expert input on country-specific Jewish terminology and the Hebrew translation, respectively.
Web-based training seminars were organised by Lan-guage Connect both for the translators and adjudicators before the start of the translation activities.
Step 1� Review of the survey master questionnaire
Before the questionnaire was sent for translation (including translation of the three languages and updates to existing languages), Ipsos MORI conducted a review of the existing translations and the revised version of the source (English) questionnaire. The aim of the review of the source questionnaire was to iden-tify parts of the text that required single translation and parts of the text that required dual translation. In add ition, a glossary of key Jewish terminology and any additional country-specific items was created. The review was conducted by Ipsos MORI’s translation man-ager in collaboration with FRA and JPR.
Step 2� Translation
As a general rule, one translator (T1) translated the entire text, while the other translator (T2) translated only segments selected for parallel dual translation. The amount of translation work carried out by T2 depended
Figure 2.1: Illustration of the adapted TRAPD translation procedure used in translating the questionnaire of the second survey on discrimination and hate crime against Jews in the EU
FRA review and finalisationStep 6
Final proofreadingStep 5
Team review meetingStep 4
AdjudicationStep 3
Translation T1 (single)Translations T1 and T2 (dual)
Step 2
Translation reviewStep 1
Review of survey master questionnaire
Identification of items for single and dual translation
Translation team reviews existing translations for suitability
Language Connect and Ipsos MORI translate the same text independently
Language Connect translates the text
Adjudicator merges T1 and T2 into a version with best elements from each and highlights
items for the NRE’s review
Ipsos MORI delivers final version for FRA reviewFinal amendments implemented
Proofreader checks remaining issues
Adjudicated version is discussed between translators, adjudicator and NRE, and final
adjudicated version is prepared
Source: FRA, 2018

Translation of the questionnaire and survey materials
19
upon whether they were translating into the languages for which the questionnaire translations were available from the 2012 survey or into the three new languages.
Step 3� Adjudication
The two translations were collated and then provided to the adjudicator whose task was to produce a reconciled version while ensuring consistency in the use of terms and repeated elements across the questionnaire. The adjudicator’s comments, doubts and problems faced when having to reconcile between the translations served as a basis for discussion during the adjudica-tion and/or team review meeting.
Step 4� Team review meeting
Online meetings convened the translation team mem-bers to discuss the outcome of the translation and adju-dication process, issues raised and proposed solutions for the final review. The meetings were conducted in the target language and if any outstanding issues arose, particularly related to content or differences of linguis-tic opinion, these were described in English for further assessment. The issues recorded for further discussion mainly focused on the use of country-specific items or Jewish terminology, and some translations required greater involvement of the JPR team and/or NREs than others. The translations were also reviewed to ensure that the final decisions on terms were applied consist-ently in the survey and were compatible between the 2012 and 2018 surveys.
Step 5� Final proofreading
Following the final decisions of the team review meet-ing, the final version of the translation was reviewed
once more to check the correctness of the target lan-guage. At this final step, checks for spelling, grammar, syntax and completeness were performed.
Step 6� FRA review and finalisation
In a final step, FRA reviewed the finalised language versions of the questionnaire for all languages except Hebrew. The small number of changes requested by FRA were implemented by the local agencies’ transla-tors or by Language Connect’s translators.
The translation process was documented and archived using a centralised monitoring tool which reflected each step of the process. FRA was able to monitor the process during its implementation and to keep track of its progress.
2�2� Translation of other survey materials
The changes made to the questionnaire after the usabil-ity testing did not require the full team translation pro-cess. They involved adapting, adding or amending the translations as necessary and reviewing the changes before the finalisation of each language version.
Following the finalisation of the source versions for the information materials in English, a single translation and proofreading was undertaken by the local agency in each country. In addition, each NRE double-checked the translations of all survey materials to ensure that they were easy to understand and faithful to the meaning of the English version.

21
3 Usability testing
The online survey tool was subjected to usability test-ing where participants selected from the survey’s tar-get population completed the full survey under the observation of a moderator. Participants completed the survey unassisted while being observed, followed by an interview where they were asked a series of evaluation questions about their experience. The aim of the usability testing was to identify any unforeseen issues or inconsistencies with accessibility and function-ality of the online survey tool (e.g. starting the survey, navigating the online questionnaire, answering ques-tions), as well as ease of use across different devices by different respondents. In addition, the testing was used to assess the impact of sensitive questions and, in some instances, cognition of the survey questions. The usability testing was conducted in the countries not covered by the 2012 survey — Austria, Denmark, the Netherlands, Poland and Spain, using the translations of the questionnaire in the respective languages. The test-ing also took place in the United Kingdom where, along with the English questionnaire version, the Hebrew version was tested.
For the usability testing, a moderator’s guide and accompanying showcards were developed. The guide was split into four sections and included the follow-ing: (i) an introduction to the survey and session; (ii) observation of the participant completing the ques-tionnaire in their own time; (iii) evaluation questions about the participant’s experience; and (iv) task-based exercises designed to test different types of questions. The materials were translated by the local researchers into the respective languages.
In each country, eight participants with different gen-ders, age groups and education levels were recruited for
the usability testing. The survey was tested on a range of devices and operating systems produced by differ-ent manufacturers (e.g. laptops: Dell, Microsoft; smart-phones: Apple iPhone, Google Android, LG; tablets: Apple iOS, Google Android) and on different browsers (e.g. Windows Internet Explorer, Google Chrome, Mozilla Firefox, Apple Safari) to further test the compatibility and functionality of the online survey tool.
The fieldwork for the usability testing was set in two stages. As the master script was prepared in English, the usability testing was conducted in the United Kingdom first (at the end of February 2018), including testing of the questionnaire in Hebrew. In the other five coun-tries, the usability testing took place at the beginning of March 2018.
Key outcomes from the usability testing
Overall, the online survey tool functioned well and the objectives of the usability testing were met. Firstly, par-ticipants with different socio-demographic backgrounds across the countries were able to access the survey using different device types. Secondly, the usability testing provided reassurance that the translations of the questionnaire were accurate and understood by individuals in these countries.
In addition to identifying some minor changes to the content and formatting of the survey, the usability test-ing proved beneficial in identifying some issues with software compatibility that were resolved in advance of the fieldwork. For a table of the changes implemented to the questionnaire following the usability testing please refer to Table 1.2 in Chapter 1.


23
4 Data collection and fieldwork progress
This chapter describes in more detail the main stage fieldwork with details concerning the technical set-up of the survey, the achieved sample across the EU Member States surveyed as well as fieldwork progress.
4�1� Technical set-up of the survey
As respondents in the 13 survey countries completed the survey, the data they provided were collected to a central database. The online survey tool was created using Dimensions software. The tool was thoroughly tested before the start of the main stage data collec-tion both through extensive testing by the Ipsos MORI team and usability testing. In addition to the checks built into the online survey tool to ensure high quality and consistency of the data collected, Ipsos MORI’s data processing team ran a data validation script to check the final data set before submitting it to FRA.
The online survey mode enabled a centralised and effi-cient data collection, where the number of completed questionnaires could be continuously monitored and some data could be extracted and analysed at any time. The technical set-up was designed to ensure that the survey could handle a large number of respondents accessing the survey simultaneously, without any noticeable effect for survey respondents.
Respondents who required assistance during the survey were provided with a ‘contact us’ option built into the survey site. It appeared at the bottom of each screen throughout the survey. By clicking on the ‘contact us’ button, respondents were directed to a pop-up win-dow with a response form. This response form allowed respondents to indicate the type of issue they were facing by selecting from a drop-down menu the option
that described their query or problem, and an open-text response box to type in the details. Each response form was linked to the mailbox of the local research company in each country responsible for responding to each query. All requests also reached the mailbox of the www.eurojews.eu domain which was monitored by the Central Coordination Team in the United Kingdom. Notably, the ‘contact us’ form did not require individu-als to provide their name or contact details, if they did not want to.
A separate pop-up window was available for respond-ents regarding the website privacy policy which described what precautions for confidentiality, ano-nymity and data protection were taken on the website, including information concerning the use of cookies and collection of other paradata. The information note for data subjects provided respondents with information about the personal data collected in the survey, their use and respondents’ rights regarding their personal data.
All respondents were provided access to a country-specific FAQ document, which was made available as a PDF, accessible via the survey platform in all survey languages. The FAQ document contained information about the context of the survey, about FRA and the organisations implementing the data collection and about data protection and the confidentiality of the survey. The survey paradata show that on average, around 40 % of respondents who completed the survey downloaded the FAQ document. This share ranges from 16 % of respondents in Italy and 24 % in Denmark, to 61 % in France and 71 % in Spain.
A free-of-charge telephone number was also set up for each country as an additional way for respondents to contact the teams responsible for the survey at the country level. Incoming calls were answered by a native
Second survey on discrimination and hate crime against Jews in EU Member States — Technical report
24
speaker at Ipsos MORI or a partner research company. According to the survey paradata, in total 37 persons contacted the survey via email or the ‘contact us’ form and six by telephone. The majority of queries came within the first 2 weeks to 3 weeks of the fieldwork.
Most of the queries addressed survey accessibility, with a few reported instances of the survey getting stuck or participants voicing frustration at the looping of the survey when clicking back to change or check their answers to an earlier question. These incidents were few in relation to the number of successful completes of the survey. There were no real patterns that could be identified in terms of reporting particular issues con-cerning the survey, which suggests that there were no systematic problems. In the majority of these incidents participants reported that, in the end, they were able to complete the survey.
During the main stage survey data collection, some respondents submitted more general comments (in total 12 cases), such as requests to make the survey available in English for those living outside the United Kingdom. Another point mentioned was about the requirement in the survey tool to go back to the start of a question when the intention of the respondent was just to go back one item within the question.
There were very few queries around privacy, which was covered extensively in both the privacy policy and the FAQ document that participants were able to access whilst completing the survey. Those who did follow-up with queries were looking for further assurances that their answers remained confidential and whether third parties would see the data. A few other queries cov-ered the content of the survey, including suggestions to improve the language/grammar used.
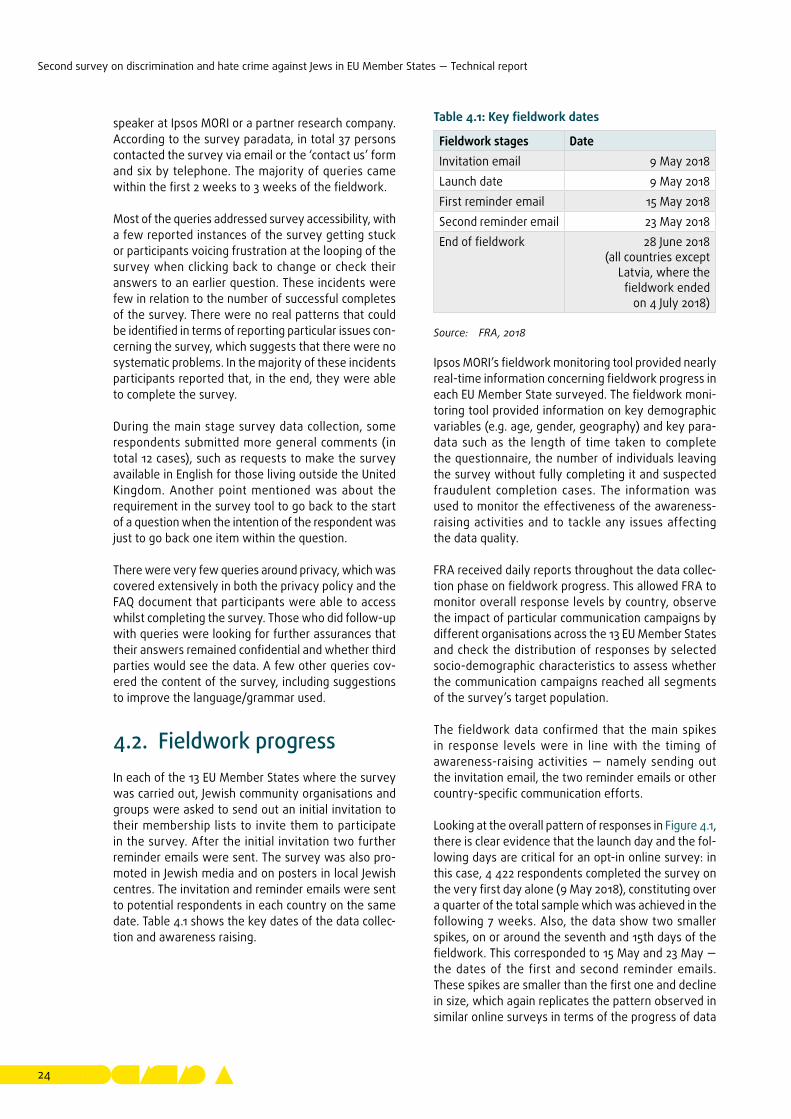
4�2� Fieldwork progressIn each of the 13 EU Member States where the survey was carried out, Jewish community organisations and groups were asked to send out an initial invitation to their membership lists to invite them to participate in the survey. After the initial invitation two further reminder emails were sent. The survey was also pro-moted in Jewish media and on posters in local Jewish centres. The invitation and reminder emails were sent to potential respondents in each country on the same date. Table 4.1 shows the key dates of the data collec-tion and awareness raising.
Table 4.1: Key fieldwork dates
Fieldwork stages DateInvitation email 9 May 2018Launch date 9 May 2018First reminder email 15 May 2018Second reminder email 23 May 2018End of fieldwork 28 June 2018
(all countries except Latvia, where the fieldwork ended
on 4 July 2018)
Source: FRA, 2018
Ipsos MORI’s fieldwork monitoring tool provided nearly real-time information concerning fieldwork progress in each EU Member State surveyed. The fieldwork moni-toring tool provided information on key demographic variables (e.g. age, gender, geography) and key para-data such as the length of time taken to complete the questionnaire, the number of individuals leaving the survey without fully completing it and suspected fraudulent completion cases. The information was used to monitor the effectiveness of the awareness-raising activities and to tackle any issues affecting the data quality.
FRA received daily reports throughout the data collec-tion phase on fieldwork progress. This allowed FRA to monitor overall response levels by country, observe the impact of particular communication campaigns by different organisations across the 13 EU Member States and check the distribution of responses by selected socio-demographic characteristics to assess whether the communication campaigns reached all segments of the survey’s target population.
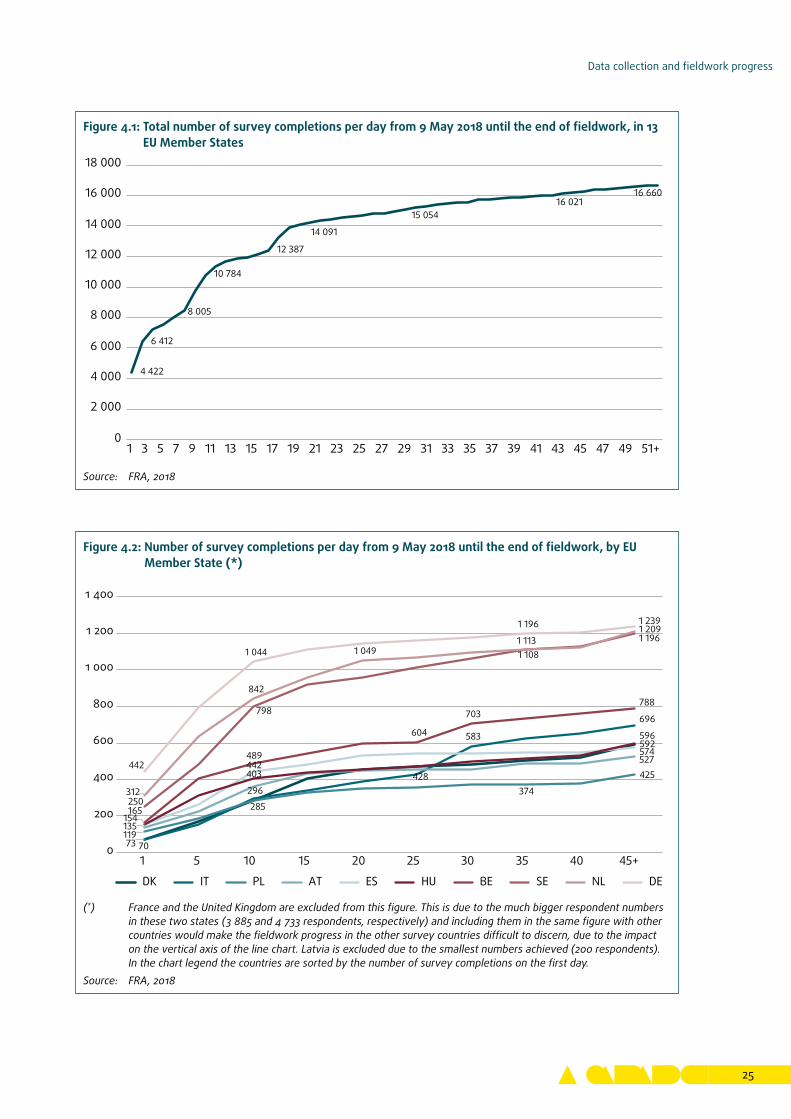
The fieldwork data confirmed that the main spikes in response levels were in line with the timing of awareness-raising activities — namely sending out the invitation email, the two reminder emails or other country-specific communication efforts.
Looking at the overall pattern of responses in Figure 4.1, there is clear evidence that the launch day and the fol-lowing days are critical for an opt-in online survey: in this case, 4 422 respondents completed the survey on the very first day alone (9 May 2018), constituting over a quarter of the total sample which was achieved in the following 7 weeks. Also, the data show two smaller spikes, on or around the seventh and 15th days of the fieldwork. This corresponded to 15 May and 23 May — the dates of the first and second reminder emails. These spikes are smaller than the first one and decline in size, which again replicates the pattern observed in similar online surveys in terms of the progress of data
Data collection and fieldwork progress
25
Figure 4.1: Total number of survey completions per day from 9 May 2018 until the end of fieldwork, in 13 EU Member States
4 422
6 412
8 005
10 784
12 387
14 091
15 05416 021
16 660
0
2 000
4 000
6 000
8 000
10 000
12 000
14 000
16 000
18 000
1 3 5 7 9 11 13 15 17 19 21 23 25 27 29 31 33 35 37 39 41 43 45 47 49 51+
Source: FRA, 2018
Figure 4.2: Number of survey completions per day from 9 May 2018 until the end of fieldwork, by EU Member State (*)
70
592
73
296428
583
696
119
285
374
425
135
527
154
442574
403
596
165
489
604
703788
250
798
1 108
1 196
312
842
1 0491 113
1 209
442
1 044
1 196 1 239
0
200
400
600
800
1 000
1 200
1 400
1 5 10 15 20 25 30 35 40 45+
DK IT PL AT ES HU BE SE NL DE
(*) France and the United Kingdom are excluded from this figure. This is due to the much bigger respondent numbers in these two states (3 885 and 4 733 respondents, respectively) and including them in the same figure with other countries would make the fieldwork progress in the other survey countries difficult to discern, due to the impact on the vertical axis of the line chart. Latvia is excluded due to the smallest numbers achieved (200 respondents). In the chart legend the countries are sorted by the number of survey completions on the first day.
Source: FRA, 2018
Second survey on discrimination and hate crime against Jews in EU Member States — Technical report
26
collection over time. After the peak resulting from the second reminder email until the end of fieldwork, small upticks can be observed which are aligned with commu-nications efforts made in particular countries at specific times (Figure 4.2).
The country-specific fieldwork progress confirms the same pattern as in the overall sample of the 13 countries. In France, 834 respondents completed the question-naire on the first day, with a spike of 637 respondents on the seventh day (first reminder email), reaching up to 1 421 questionnaires completed in 1 week (or over one third of the total sample in France). Similarly, 1 703 completions were registered in the United Kingdom on the very first day of the survey, and in the first 5 days, 60 % of the final sample had been collected.
In Germany, the country with the third-largest Jew-ish population in Europe, whilst the overall pattern of fieldwork progress was similar, the second reminder email appeared to have had negligible impact, although a closer look at the progress statistics reveals a slightly erratic pattern of completions on days 7 to 10 of the survey. This reflects what happened with the first email reminder — rather than being sent out by all organisa-tions in Germany on the same day, it was sent at slightly different times over a few days, which is reflected in the survey progress statistics.
In a few cases, the standard pattern is followed by a dif-ferent development at the end of the fieldwork phase. The most striking example of this can be seen in Italy and, to a lesser extent, Hungary. In each of these cases, response levels from the initial campaign were weaker than expected, so greater effort went into increasing communication activities later in the survey fieldwork. The spikes of varying sizes in both countries in the sec-ond half of the fieldwork phase reflect the efforts made in this regard and the effectiveness of these efforts.
The fieldwork monitoring tool provided an opportu-nity to track the socio-demographic composition of the sample in real time. The sample distributions that were monitored closely concerned Jewish affiliation patterns, age and gender — that is, characteristics in relation to which under- and over-representation of certain groups in the sample was expected to take place. This served both to inform the specific awareness-raising activities in different countries and the quality control of the samples.
In general, the length of the fieldwork period (close to 2 months) was sufficient to produce sizable samples with a diverse respondent composition. At the same time, the data collection monitoring and sample com-position suggest that a longer fieldwork period could have potentially further increased the proportion of
the non-affiliated Jewish population in the sample. Although the proportion of communally non-affiliated population in the total sample gradually increased over the course of the fieldwork, it remains a minority within the sample and can be assumed to remain an under-represented segment of the population in the survey.
At the end of the fieldwork and before data quality control, the data set included 16 660 cases across 13 EU Member States. Table 4.2 presents a breakdown by country of the completed survey questionnaires before each completed questionnaire was subjected to a quality-control review. The quality-control process resulted in a small number of responses being removed from the final data set (see Chapter 5).
Table 4.2: Number of survey completions in the primary data set (before data quality control), by EU Member State
EU Member State Number of survey completionsAustria 527Belgium 788Denmark 592France 3 885Germany 1 239Hungary 596Italy 696Latvia 200Netherlands 1 209Poland 425Spain 574Sweden 1 196United Kingdom 4 733Total 16 660
Source: FRA, 2018
The survey was available in Hebrew language in all sur-vey countries. In total, 262 respondents chose Hebrew to complete the questionnaire, which amounts to less than 2 % of the total sample. The numbers range from 3 cases to 56 cases across the countries — from fewer than 10 cases in Hungary, Italy, Poland and France, to 30 or more cases in the Netherlands, the United Kingdom, Belgium, Denmark and Germany.
Data collection in Latvia
The progress of fieldwork in Latvia did not follow the same pattern as could be observed in other EU Member States included in the survey. During the data collec-tion, the same schedule and programme of awareness raising and communication efforts was followed in all countries, including Latvia. However, the survey team
Data collection and fieldwork progress
27
recognised at the outset that certain difficulties in data collection could be expected in Latvia, given the small estimated size of the Jewish population, with an age dis-tribution skewed towards elderly people and a declining size of the population. In the 2012 survey, the sample collected in Latvia amounted to 154 respondents, with a significant number of face-to-face or telephone inter-views needed in addition to the online survey in order to reach this sample size.
In the 2018 survey, the level of response to the online dissemination campaign in Latvia was very low, con-trary to the other countries, and only some 30 respond-ents completed the survey in the first weeks of the fieldwork (most of these were obtained during the first week of fieldwork when 27 respondents completed the survey online). The poor success of the email aware-ness-raising activities is most likely a consequence of the majority of the Jewish population in Latvia being elderly and not using the internet. Therefore changes in the survey recruitment methodology and data col-lection were applied, focusing efforts exclusively on face-to-face and telephone interviews or offering direct help to respondents in completing the survey. Also, the data collection period in Latvia was extended by 1 week to gain the maximum number of responses possible.
The face-to-face and telephone interviews and other interviewer assistance in Latvia was provided by a local community liaison person (CLP) employed by JPR. Ipsos MORI gave a telephone briefing to the CLP that cov-ered the key aims of the survey and, in particular, the importance of encouraging respondents to complete the survey themselves so as to avoid data collection mode effect. In cases where this would not be possible e.g. while interviewing over the phone, Ipsos MORI gave guidance on how to administer the survey. The CLP was sent test links to familiarise themselves with the survey.
Later, a short training session lasting around 1 hour was undertaken. The training covered the background to the survey, questionnaire content (main sections of the questionnaire, short and long routing depending on specific experiences, e.g. harassment), survey admin-istration, importance of privacy, the online approach and the importance of self-completion of the survey on the device provided. Most of the survey comple-tions resulting from these additional support activities took place from fieldwork day 28 onwards. In the end, 200 respondents completed the questionnaire in Latvia.
Whilst the adoption of this approach improved the par-ticipation levels, caution should be taken when review-ing the data from Latvia. Changes in the respondent recruitment and data collection mode have an impact on data quality (as discussed later, notably with respect to the length of time taken to complete the survey completion and relatively more frequent selection of non-response options per respondent). The survey is primarily based on the voluntary opt-in participation of the potential respondents and on self-completion of the questionnaire. The questionnaire includes a certain amount of sensitive questions, and any intermediation of an interviewer can have an impact on a respondent’s willingness to respond.
While the survey was able to reach more respondents in this way in Latvia, the changes in the respondent recruitment and data collection methods can be esti-mated to have had an impact on data quality, limiting the scope for comparisons between Latvia and other survey countries. Therefore, the results concerning Latvia were not presented together with those of the other 12 EU Member States in the survey results report and, instead, the results for Latvia were included in the report as an annex.

29
5 Data quality control
This chapter reports on the quality of the data set and the measures undertaken to review its quality. The chapter describes findings both based on the paradata collected (e.g. length of time taken to complete the survey) and additional analysis that was carried out to review the consistency of responses. It also examines the break-offs of the survey completion.
First, the data set was inspected for duplicate cases and no such cases were found. Later, the levels of item non-response (such as ‘Don’t know’, ‘Prefer not to say’ answers) were reviewed. The selection of non-response items was observed in rare cases and has no impact on the validity of the data.
5�1� Speeders and straightliners
Satisficing response behaviour can have a notable impact on data quality, particularly in online surveys where respondents are in full control of the survey com-pletion. Satisficing refers to the fact that respondents may give satisfactory but not optimal answers in order to reduce their effort while completing a survey. The paradata collected during the survey fieldwork were used to identify ‘speeders’ and ‘straightliners’. Com-pletion patterns based on time spent completing the survey, over the total sample, were used to monitor ‘speeders’ — respondents who were ‘speeding’ through the survey by giving answers very quickly without being able to give sufficient thought or attention to the ques-tions. A straightlining response pattern was identified through non-differentiation in using rating scales (that is, selecting the same answer question after question). Both ‘speeders’ and ‘straightliners’ were automatically excluded from the data set.
Speeders
As a respondent filled in the survey (questionnaire), an algorithm calculated the approximate number of clicks needed to answer a question. For example, a single categorical question required one click and a multiple answer or grid question required multiple clicks. This was then defined as the ‘clicks per minute’ required to complete the questionnaire. Respondents’ click per minute value was compared to the median clicks per minute value for all completed questionnaires across the sample. If a respondent’s click per minute value was three times greater than the median speed, the case was flagged as a speeder and excluded from the data set. This assessment was made after the respondent had submitted all of their answers.
Straightliners
The calculations for identifying straightliners were based on all grid questions composed of at least five items and with the number of response options in each item greater than or equal to three (i.e. respondents selected responses between one and three on a grid question that contained at least five items). An add-itional calculation was made based on the minimum/maximum values selected by the respondent out of the available response options. In the formula used to assess straightlining, the left-most answer given by a respondent, i.e. the lowest answer given, was denoted as FirstAnswerIndex. Similarly, the right-most answer out of all available response options was denoted as LastAnswerIndex. The AllShownAnswers in the formula was the total number of items on the scale. Whilst the respondent was completing the survey, the algorithm calculated the deviation using the formula:
((LastAnswerIndex-FirstAnswerIndex)/All-ShownAnswers) = straightliner deviation.
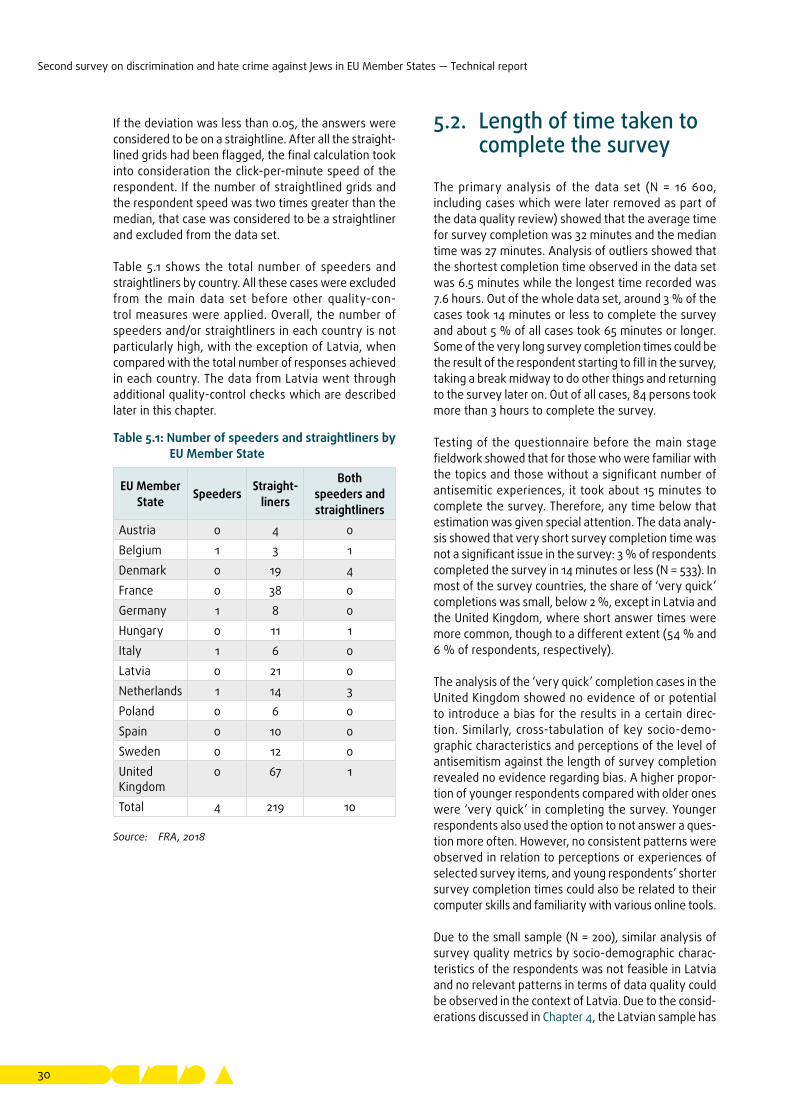
Second survey on discrimination and hate crime against Jews in EU Member States — Technical report
30
If the deviation was less than 0.05, the answers were considered to be on a straightline. After all the straight-lined grids had been flagged, the final calculation took into consideration the click-per-minute speed of the respondent. If the number of straightlined grids and the respondent speed was two times greater than the median, that case was considered to be a straightliner and excluded from the data set.
Table 5.1 shows the total number of speeders and straightliners by country. All these cases were excluded from the main data set before other quality-con-trol measures were applied. Overall, the number of speeders and/or straightliners in each country is not particularly high, with the exception of Latvia, when compared with the total number of responses achieved in each country. The data from Latvia went through additional quality-control checks which are described later in this chapter.
Table 5.1: Number of speeders and straightliners by EU Member State
EU Member State Speeders Straight-
liners
Both speeders and straightliners
Austria 0 4 0Belgium 1 3 1Denmark 0 19 4France 0 38 0Germany 1 8 0Hungary 0 11 1Italy 1 6 0Latvia 0 21 0Netherlands 1 14 3Poland 0 6 0Spain 0 10 0Sweden 0 12 0United Kingdom
0 67 1
Total 4 219 10
Source: FRA, 2018
5�2� Length of time taken to complete the survey
The primary analysis of the data set (N = 16 600, including cases which were later removed as part of the data quality review) showed that the average time for survey completion was 32 minutes and the median time was 27 minutes. Analysis of outliers showed that the shortest completion time observed in the data set was 6.5 minutes while the longest time recorded was 7.6 hours. Out of the whole data set, around 3 % of the cases took 14 minutes or less to complete the survey and about 5 % of all cases took 65 minutes or longer. Some of the very long survey completion times could be the result of the respondent starting to fill in the survey, taking a break midway to do other things and returning to the survey later on. Out of all cases, 84 persons took more than 3 hours to complete the survey.
Testing of the questionnaire before the main stage fieldwork showed that for those who were familiar with the topics and those without a significant number of antisemitic experiences, it took about 15 minutes to complete the survey. Therefore, any time below that estimation was given special attention. The data analy-sis showed that very short survey completion time was not a significant issue in the survey: 3 % of respondents completed the survey in 14 minutes or less (N = 533). In most of the survey countries, the share of ‘very quick’ completions was small, below 2 %, except in Latvia and the United Kingdom, where short answer times were more common, though to a different extent (54 % and 6 % of respondents, respectively).
The analysis of the ‘very quick’ completion cases in the United Kingdom showed no evidence of or potential to introduce a bias for the results in a certain direc-tion. Similarly, cross-tabulation of key socio-demo-graphic characteristics and perceptions of the level of ant isemitism against the length of survey completion revealed no evidence regarding bias. A higher propor-tion of younger respondents compared with older ones were ‘very quick’ in completing the survey. Younger respondents also used the option to not answer a ques-tion more often. However, no consistent patterns were observed in relation to perceptions or experiences of selected survey items, and young respondents’ shorter survey completion times could also be related to their computer skills and familiarity with various online tools.
Due to the small sample (N = 200), similar analysis of survey quality metrics by socio-demographic charac-teristics of the respondents was not feasible in Latvia and no relevant patterns in terms of data quality could be observed in the context of Latvia. Due to the consid-erations discussed in Chapter 4, the Latvian sample has
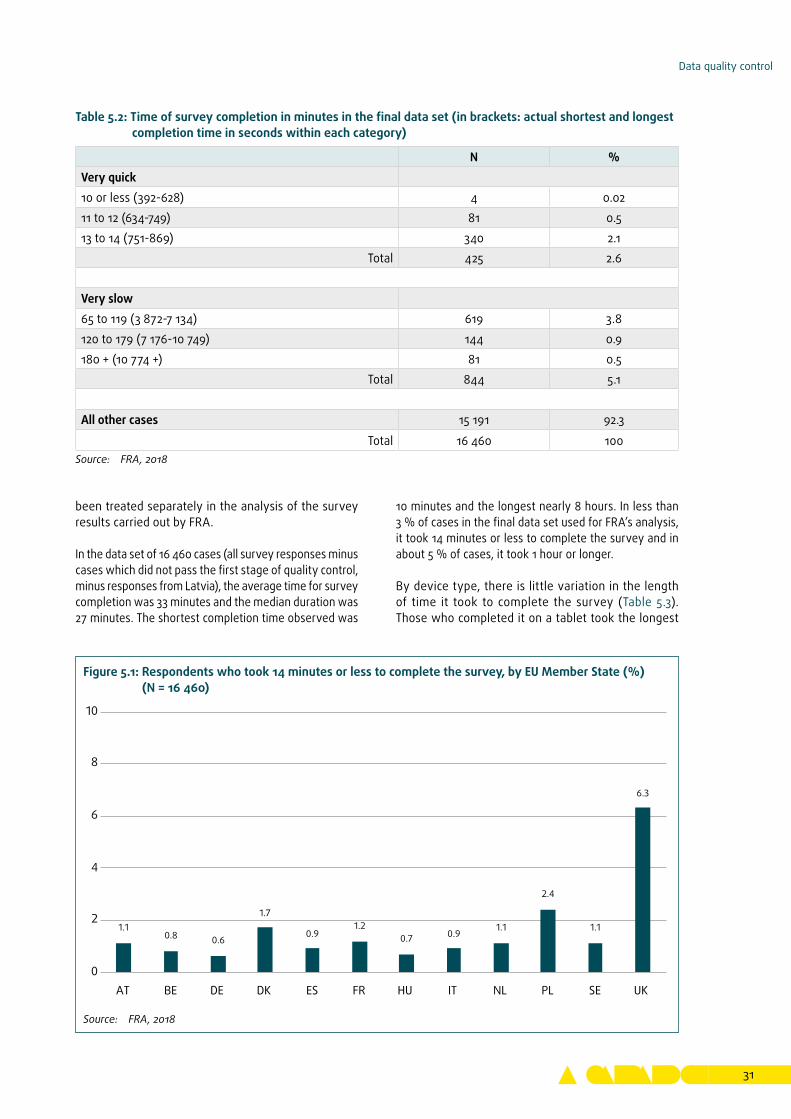
Data quality control
31
been treated separately in the analysis of the survey results carried out by FRA.
In the data set of 16 460 cases (all survey responses minus cases which did not pass the first stage of quality control, minus responses from Latvia), the average time for survey completion was 33 minutes and the median duration was 27 minutes. The shortest completion time observed was
10 minutes and the longest nearly 8 hours. In less than 3 % of cases in the final data set used for FRA’s analysis, it took 14 minutes or less to complete the survey and in about 5 % of cases, it took 1 hour or longer.
By device type, there is little variation in the length of time it took to complete the survey (Table 5.3). Those who completed it on a tablet took the longest
Table 5.2: Time of survey completion in minutes in the final data set (in brackets: actual shortest and longest completion time in seconds within each category)
N %Very quick10 or less (392-628) 4 0.0211 to 12 (634-749) 81 0.513 to 14 (751-869) 340 2.1
Total 425 2.6
Very slow65 to 119 (3 872-7 134) 619 3.8120 to 179 (7 176-10 749) 144 0.9180 + (10 774 +) 81 0.5
Total 844 5.1
All other cases 15 191 92.3
Total 16 460 100Source: FRA, 2018
Figure 5.1: Respondents who took 14 minutes or less to complete the survey, by EU Member State (%) (N = 16 460)
1.10.8 0.6
1.7
0.91.2
0.7 0.91.1
2.4
1.1
6.3
0
2
4
6
8
10
AT BE DE DK ES FR HU IT NL PL SE UK
Source: FRA, 2018
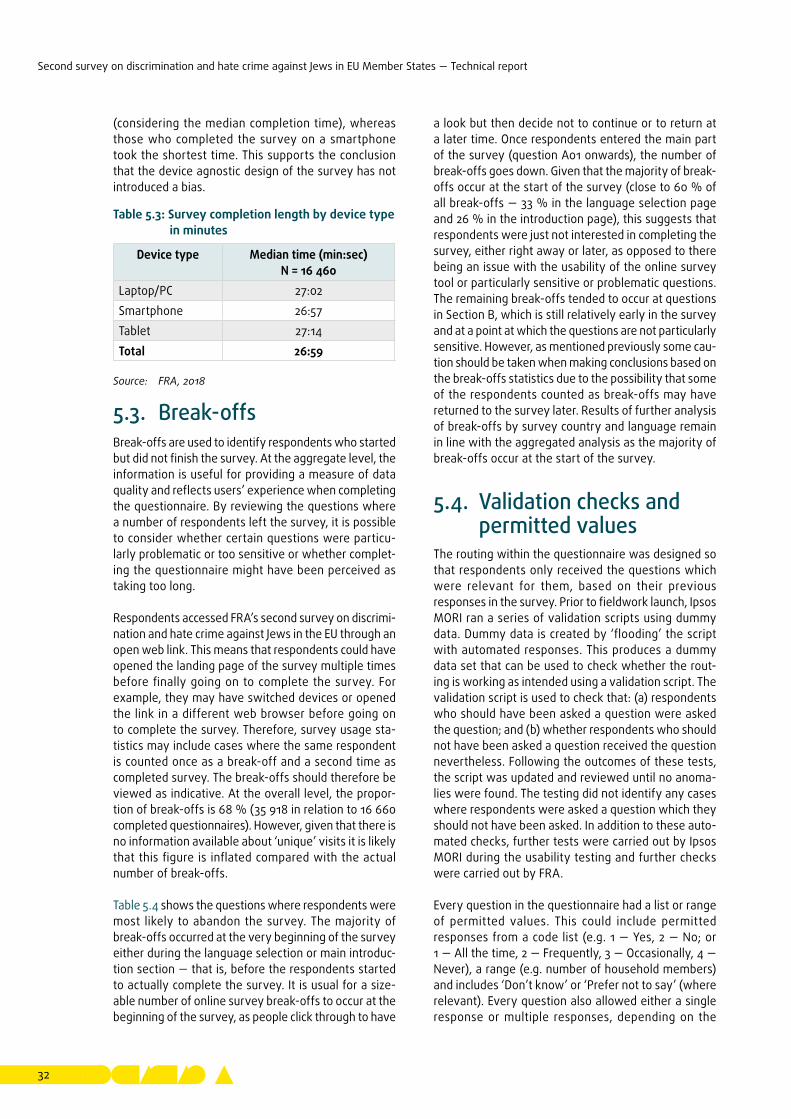
Second survey on discrimination and hate crime against Jews in EU Member States — Technical report
32
(considering the median completion time), whereas those who completed the survey on a smartphone took the shortest time. This supports the conclusion that the device agnostic design of the survey has not introduced a bias.
Table 5.3: Survey completion length by device type in minutes
Device type Median time (min:sec)N = 16 460
Laptop/PC 27:02Smartphone 26:57Tablet 27:14Total 26:59
Source: FRA, 2018
5�3� Break-offsBreak-offs are used to identify respondents who started but did not finish the survey. At the aggregate level, the information is useful for providing a measure of data quality and reflects users’ experience when completing the questionnaire. By reviewing the questions where a number of respondents left the survey, it is possible to consider whether certain questions were particu-larly problematic or too sensitive or whether complet-ing the questionnaire might have been perceived as taking too long.
Respondents accessed FRA’s second survey on discrimi-nation and hate crime against Jews in the EU through an open web link. This means that respondents could have opened the landing page of the survey multiple times before finally going on to complete the survey. For example, they may have switched devices or opened the link in a different web browser before going on to complete the survey. Therefore, survey usage sta-tistics may include cases where the same respondent is counted once as a break-off and a second time as completed survey. The break-offs should therefore be viewed as indicative. At the overall level, the propor-tion of break-offs is 68 % (35 918 in relation to 16 660 completed questionnaires). However, given that there is no information available about ‘unique’ visits it is likely that this figure is inflated compared with the actual number of break-offs.
Table 5.4 shows the questions where respondents were most likely to abandon the survey. The majority of break-offs occurred at the very beginning of the survey either during the language selection or main introduc-tion section — that is, before the respondents started to actually complete the survey. It is usual for a size-able number of online survey break-offs to occur at the beginning of the survey, as people click through to have
a look but then decide not to continue or to return at a later time. Once respondents entered the main part of the survey (question A01 onwards), the number of break-offs goes down. Given that the majority of break-offs occur at the start of the survey (close to 60 % of all break-offs — 33 % in the language selection page and 26 % in the introduction page), this suggests that respondents were just not interested in completing the survey, either right away or later, as opposed to there being an issue with the usability of the online survey tool or particularly sensitive or problematic questions. The remaining break-offs tended to occur at questions in Section B, which is still relatively early in the survey and at a point at which the questions are not particularly sensitive. However, as mentioned previously some cau-tion should be taken when making conclusions based on the break-offs statistics due to the possibility that some of the respondents counted as break-offs may have returned to the survey later. Results of further analysis of break-offs by survey country and language remain in line with the aggregated analysis as the majority of break-offs occur at the start of the survey.
5�4� Validation checks and permitted values
The routing within the questionnaire was designed so that respondents only received the questions which were relevant for them, based on their previous responses in the survey. Prior to fieldwork launch, Ipsos MORI ran a series of validation scripts using dummy data. Dummy data is created by ‘flooding’ the script with automated responses. This produces a dummy data set that can be used to check whether the rout-ing is working as intended using a validation script. The validation script is used to check that: (a) respondents who should have been asked a question were asked the question; and (b) whether respondents who should not have been asked a question received the question nevertheless. Following the outcomes of these tests, the script was updated and reviewed until no anoma-lies were found. The testing did not identify any cases where respondents were asked a question which they should not have been asked. In addition to these auto-mated checks, further tests were carried out by Ipsos MORI during the usability testing and further checks were carried out by FRA.
Every question in the questionnaire had a list or range of permitted values. This could include permitted responses from a code list (e.g. 1 — Yes, 2 — No; or 1 — All the time, 2 — Frequently, 3 — Occasionally, 4 — Never), a range (e.g. number of household members) and includes ‘Don’t know’ or ‘Prefer not to say’ (where relevant). Every question also allowed either a single response or multiple responses, depending on the
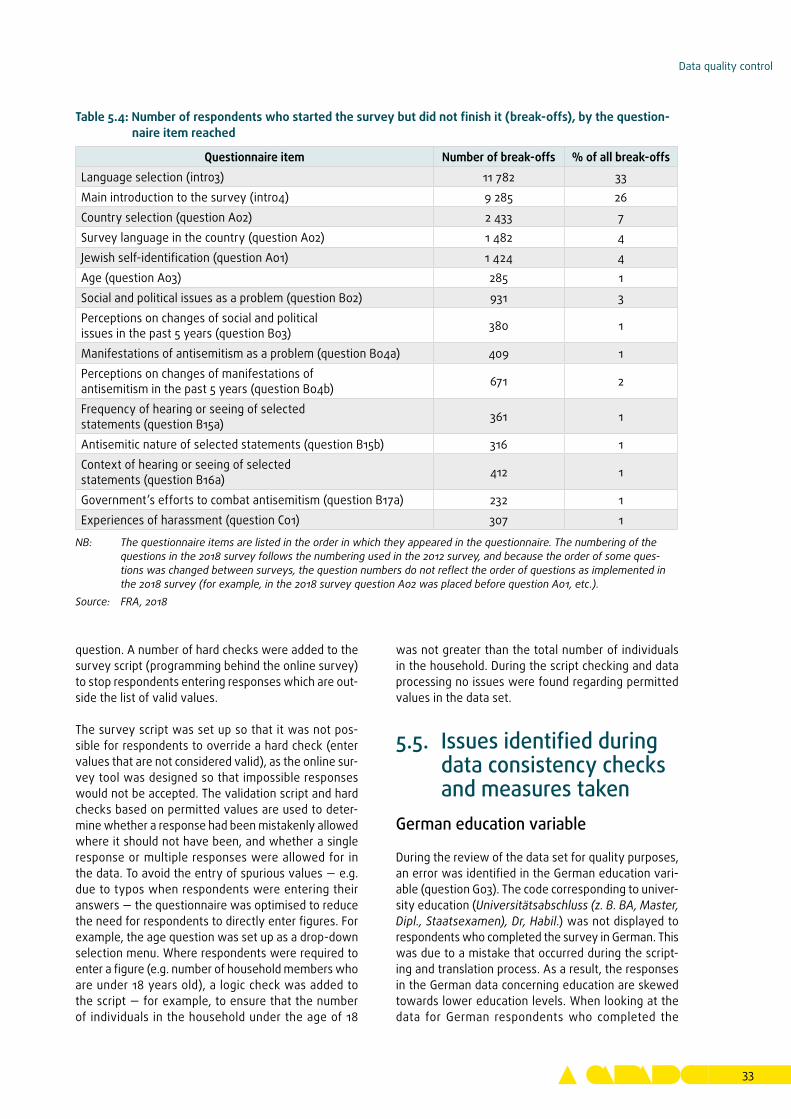
Data quality control
33
question. A number of hard checks were added to the survey script (programming behind the online survey) to stop respondents entering responses which are out-side the list of valid values.
The survey script was set up so that it was not pos-sible for respondents to override a hard check (enter values that are not considered valid), as the online sur-vey tool was designed so that impossible responses would not be accepted. The validation script and hard checks based on permitted values are used to deter-mine whether a response had been mistakenly allowed where it should not have been, and whether a single response or multiple responses were allowed for in the data. To avoid the entry of spurious values — e.g. due to typos when respondents were entering their answers — the questionnaire was optimised to reduce the need for respondents to directly enter figures. For example, the age question was set up as a drop-down selection menu. Where respondents were required to enter a figure (e.g. number of household members who are under 18 years old), a logic check was added to the script — for example, to ensure that the number of individuals in the household under the age of 18
was not greater than the total number of individuals in the household. During the script checking and data processing no issues were found regarding permitted values in the data set.
5�5� Issues identified during data consistency checks and measures taken
German education variable
During the review of the data set for quality purposes, an error was identified in the German education vari-able (question G03). The code corresponding to univer-sity education (Universitätsabschluss (z. B. BA, Master, Dipl., Staatsexamen), Dr, Habil.) was not displayed to respondents who completed the survey in German. This was due to a mistake that occurred during the script-ing and translation process. As a result, the responses in the German data concerning education are skewed towards lower education levels. When looking at the data for German respondents who completed the
Table 5.4: Number of respondents who started the survey but did not finish it (break-offs), by the question-naire item reached
Questionnaire item Number of break-offs % of all break-offsLanguage selection (intro3) 11 782 33Main introduction to the survey (intro4) 9 285 26Country selection (question A02) 2 433 7Survey language in the country (question A02) 1 482 4Jewish self-identification (question A01) 1 424 4Age (question A03) 285 1Social and political issues as a problem (question B02) 931 3Perceptions on changes of social and political issues in the past 5 years (question B03) 380 1
Manifestations of antisemitism as a problem (question B04a) 409 1Perceptions on changes of manifestations of antisemitism in the past 5 years (question B04b) 671 2
Frequency of hearing or seeing of selected statements (question B15a) 361 1
Antisemitic nature of selected statements (question B15b) 316 1Context of hearing or seeing of selected statements (question B16a) 412 1
Government’s efforts to combat antisemitism (question B17a) 232 1Experiences of harassment (question C01) 307 1
NB: The questionnaire items are listed in the order in which they appeared in the questionnaire. The numbering of the questions in the 2018 survey follows the numbering used in the 2012 survey, and because the order of some ques-tions was changed between surveys, the question numbers do not reflect the order of questions as implemented in the 2018 survey (for example, in the 2018 survey question A02 was placed before question A01, etc.).
Source: FRA, 2018
Second survey on discrimination and hate crime against Jews in EU Member States — Technical report
34
survey in Hebrew or Russian, and who were correctly shown the code for ‘university education’, the majority of respondents selected this code to describe their level of education, which is in line with expectations. In order to correct educational data in the case of respondents from Germany, the missing values were imputed apply-ing a logistic regression model to predict the values of the education variable based on the German sam-ple of the 2012 FRA survey on discrimination and hate crime against Jews in the EU. For the data analysis, FRA used a binary variable (no higher education completed; higher education completed) with imputed values for the German sample.
Routing in the questionnaire section concerning physical attacks
Analysis of the survey data resulted in the identification of a routing error in the questionnaire which had not been found when checking the routings. The erroneous routing meant that respondents who indicated having experienced a physical attack in the 5 years before the survey but not in the past 12 months (or who could not remember whether they had been attacked in the past 12 months) were not asked any further questions concerning the physical attack(s) they had experienced, including whether the attack was perceived as anti-semitic or the circumstances of the most serious inci-dent. In the final data set, due to this routing error, the data concerning the most serious incident of physical attack is limited mainly to incidents that took place in the last 12 months before the survey (N = 294). The routing error is noted in the survey questionnaire8.
5�6� Response consistency checks
Participation in the FRA survey on discrimination and hate crime against Jews was based on respondents’ self-identification as Jewish on one or more grounds — specifically, respondents were asked ‘Do you consider yourself to be Jewish in any way — this could be on the grounds of your religion, culture, upbringing, ethnic-ity, parentage or any other reasons?’. The respondents who answered ‘No’ to this question were routed out of the survey as not eligible to participate. Later in the questionnaire, the survey included a set of items to measure respondents’ Jewish identity. The questions covered such issues as self-assessed strength of Jewish identity and the strength of one’s religious beliefs (on a scale of 1 to 10), observing Jewish practices (e.g. eating kosher or attending synagogue); membership in syna-gogues and/or Jewish organisations; classification of
8 See p. 35 of the questionnaire. The incorrect routing ‘IF D11 IS CODED 0 or 777 GO TO B09c’ appears between questions D11 and D12a.
Jewish identity (e.g. Orthodox, traditional, progressive, Haredi); importance of selected issues to respondent’s Jewish identity (e.g. Jewish culture, remembering the Holocaust, supporting Israel); Jewish background (e.g. Jewish by birth, Jewish by conversion).
In general, those who self-identified themselves as Jewish at the beginning of the questionnaire presum-ably should be self-identifying in this way consistently through various questions regarding their identities and in measurements of their Jewish identity (while at the same time taking into account the many different ways in which people may identify themselves as Jewish). As an additional data quality-control measure, some further analysis of these questionnaire items was con-ducted after the data collection. This analysis aimed to flag cases of inconsistencies which could appear because of someone completing the survey out of curi-osity, to submit fraudulent answers or for any other similar reason, and which should be examined in more detail. This section presents the results of this analysis.
In the data set of 16 600 respondents, there were 834 cases (5 %) whose answers concerning their Jewish identity showed one or more inconsistencies. For exam-ple, question G16c asked the respondents to describe themselves, their parents and spouses/partners as (1) Jewish by birth; (2) Jewish by conversion; (3) Not Jewish; (4) Do not know. In 491 cases respondents answering this question indicated that they did not know whether or not they were Jewish and 343 answered that they were not Jewish. The cases of respondents identifying as not Jewish were spread across all survey countries, with relatively higher shares of cases observed in Ger-many, Hungary and Poland (9-13 % of the country sam-ples). In other countries, the shares of such cases varied between 1 % and 8 %.
No differences were observed between these cases and the rest of the survey sample when analysed in terms of the length of time taken for survey completion, type of device used to complete the survey (laptop, smart-phone or tablet), respondents’ age or gender. There was no reason to exclude these cases from further analysis because their Jewish identity could still be based on parentage. At the same time, 154 cases were identi-fied among the survey responses where respondents said that neither they nor their parents were Jewish. A few additional characteristics of these cases were explored. For example, their patterns of Jewish ritual observance or synagogue attendance were compared to the rest of the sample. The analysis showed that some of these cases differed from other respondents in relation to their involvement in Judaism and Jewish culture. The difference was very small, but observ-able. In addition, these cases were further examined in terms of the description of Jewish identity they hold.
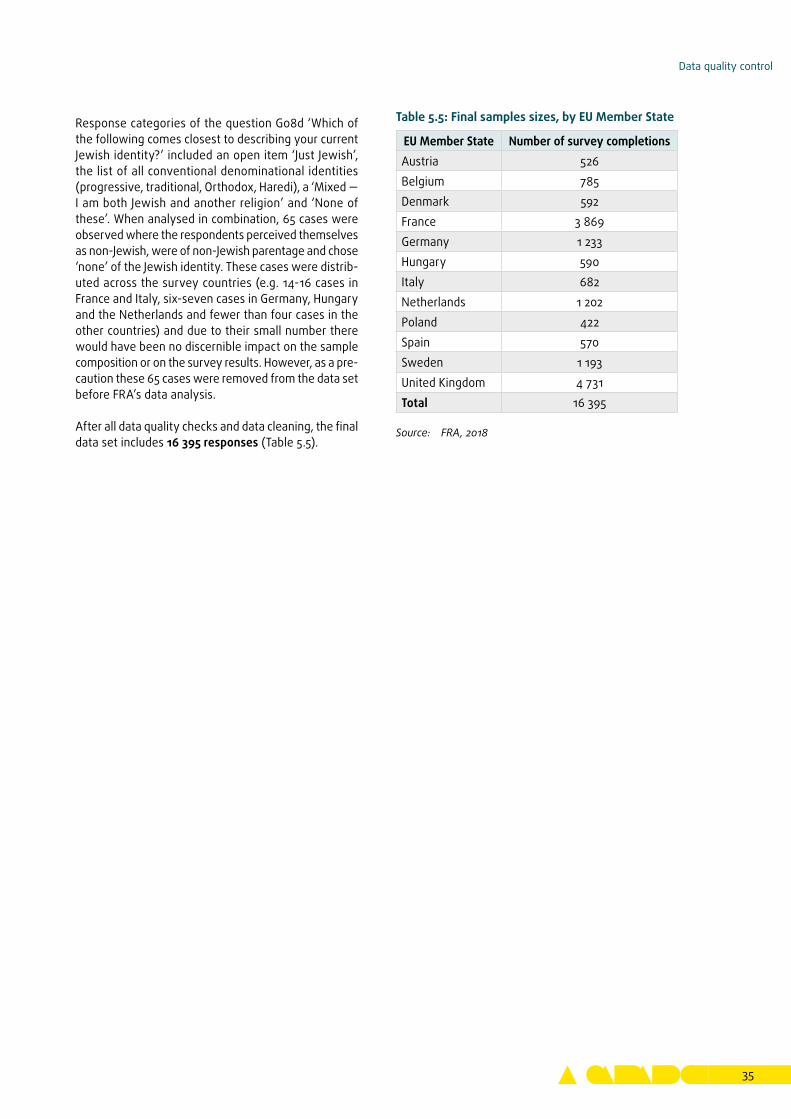
Data quality control
35
Response categories of the question G08d ‘Which of the following comes closest to describing your current Jewish identity?’ included an open item ‘Just Jewish’, the list of all conventional denominational identities (progressive, traditional, Orthodox, Haredi), a ‘Mixed — I am both Jewish and another religion’ and ‘None of these’. When analysed in combination, 65 cases were observed where the respondents perceived themselves as non-Jewish, were of non-Jewish parentage and chose ‘none’ of the Jewish identity. These cases were distrib-uted across the survey countries (e.g. 14-16 cases in France and Italy, six-seven cases in Germany, Hungary and the Netherlands and fewer than four cases in the other countries) and due to their small number there would have been no discernible impact on the sample composition or on the survey results. However, as a pre-caution these 65 cases were removed from the data set before FRA’s data analysis.
After all data quality checks and data cleaning, the final data set includes 16 395 responses (Table 5.5).
Table 5.5: Final samples sizes, by EU Member State
EU Member State Number of survey completionsAustria 526Belgium 785Denmark 592France 3 869Germany 1 233Hungary 590Italy 682Netherlands 1 202Poland 422Spain 570Sweden 1 193United Kingdom 4 731Total 16 395
Source: FRA, 2018

37
6 Quality of the country samples and weighting
This chapter discusses the quality of the samples achieved and elaborates on the weighting approach applied for the data analysis as well as comparability between the current survey (2018) and the previous survey (2012) on discrimination and hate crime against Jews in the EU.
6�1� Quality of the samples achieved in each Member State
The quality of the samples achieved in FRA’s 2018 sur-vey has been assessed in the following ways:
(1) investigating the extent to which country samples in the 2018 survey reflect the estimates of the socio-demographic composition of the Jewish population in surveyed EU Member States; and
(2) testing the sensitivity of selected survey estimates to adjustments of the samples’ socio-demographic profile, based on available estimates and assumptions concerning the Jewish population.
Given the opt-in online survey approach — selected in the absence of available sampling frames with national coverage of the whole target population — and the lack of comprehensive Jewish population statistics in some surveyed countries, there are limits concern-ing the extent to which the quality of the samples can be assessed.
The samples achieved in the surveyed countries can be compared against selected Jewish population bench-marks, i.e. the known socio-demographic profiles of
Jewish populations in each country surveyed. Availabil-ity of benchmark data varies from country to country, while a number of survey variables can be taken into account in this analysis — age (question A03), gender (question G01), Jewish communal affiliation (question G08c), educational attainment (question G03) and resi-dential geography (geographical distribution) (question Gnew). The population benchmarks were compiled by JPR and their team, drawing from available data sources. All the benchmarks should be treated as appropriate for experimental rather than definitive assessment, due to the different quality of the sources and availability of the information concerning the socio-demographic profile of the Jewish population.
A separate discussion could focus on the most appro-priate benchmark for the achieved samples in this sur-vey. The survey was distributed mainly through the Jewish communal channels (membership, affiliation, subscriptions lists of Jewish organisations). Therefore, the respondents can be expected to have features of a ‘communal’ Jewish population to a greater extent than the Jewish population in general. One feature reflecting the ‘communal’ population is the over-representation of communally affiliated Jews in the survey, but signs of this could also be seen in other respondent char-acteristics, such as levels of Jewish ritual observance, stronger attachment to Jewish communal life, religion or culture. The perceptions and experiences of self-iden-tifying Jews who have no connection with any part of the Jewish community in their countries are likely to be under-represented in the findings.
The available body of Jewish socio-demographic sta-tistics in the EU lacks comprehensive data relating to Jewish communities, as distinguished from the total Jewish population. In some countries surveyed, the survey sample compositions could be matched with
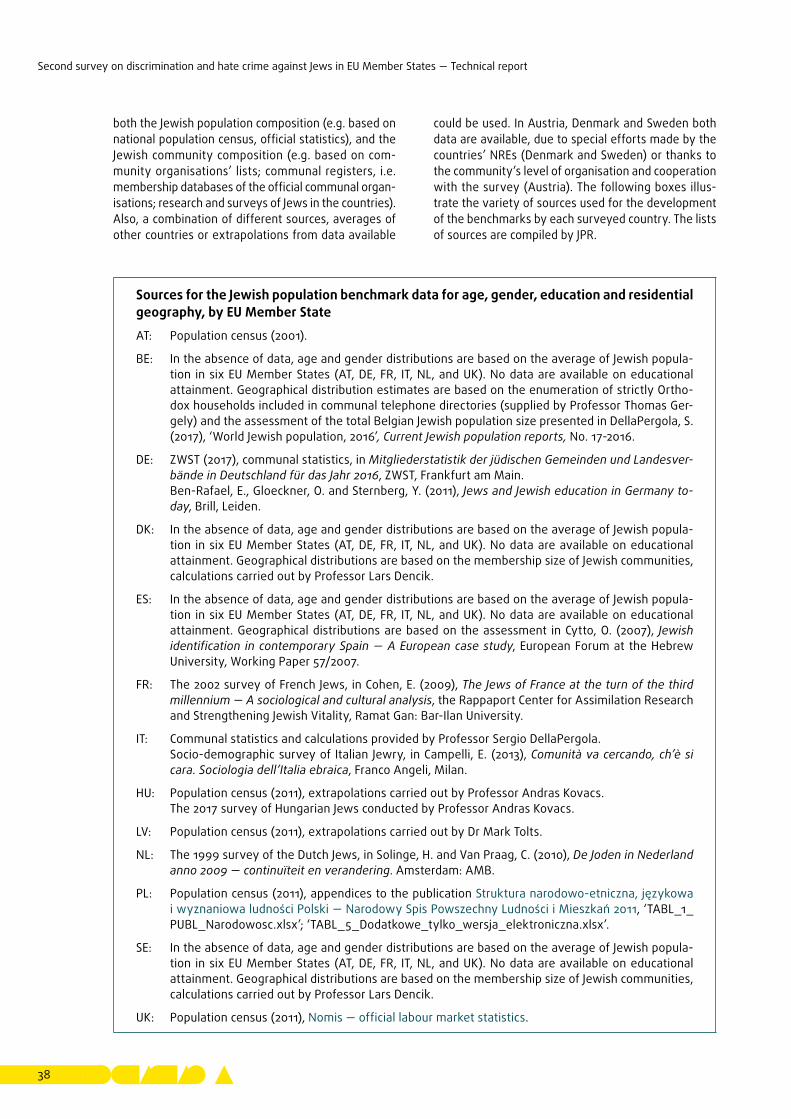
Second survey on discrimination and hate crime against Jews in EU Member States — Technical report
38
both the Jewish population composition (e.g. based on national population census, official statistics), and the Jewish community composition (e.g. based on com-munity organisations’ lists; communal registers, i.e. membership databases of the official communal organ-isations; research and surveys of Jews in the countries). Also, a combination of different sources, averages of other countries or extrapolations from data available
could be used. In Austria, Denmark and Sweden both data are available, due to special efforts made by the countries’ NREs (Denmark and Sweden) or thanks to the community’s level of organisation and cooperation with the survey (Austria). The following boxes illus-trate the variety of sources used for the development of the benchmarks by each surveyed country. The lists of sources are compiled by JPR.
Sources for the Jewish population benchmark data for age, gender, education and residential geography, by EU Member State
AT: Population census (2001).
BE: In the absence of data, age and gender distributions are based on the average of Jewish popula-tion in six EU Member States (AT, DE, FR, IT, NL, and UK). No data are available on educational attainment. Geographical distribution estimates are based on the enumeration of strictly Ortho-dox households included in communal telephone directories (supplied by Professor Thomas Ger-gely) and the assessment of the total Belgian Jewish population size presented in DellaPergola, S. (2017), ‘World Jewish population, 2016’, Current Jewish population reports, No. 17-2016.
DE: ZWST (2017), communal statistics, in Mitgliederstatistik der jüdischen Gemeinden und Landesver-bände in Deutschland für das Jahr 2016, ZWST, Frankfurt am Main.
Ben-Rafael, E., Gloeckner, O. and Sternberg, Y. (2011), Jews and Jewish education in Germany to-day, Brill, Leiden.
DK: In the absence of data, age and gender distributions are based on the average of Jewish popula-tion in six EU Member States (AT, DE, FR, IT, NL, and UK). No data are available on educational attainment. Geographical distributions are based on the membership size of Jewish communities, calculations carried out by Professor Lars Dencik.
ES: In the absence of data, age and gender distributions are based on the average of Jewish popula-tion in six EU Member States (AT, DE, FR, IT, NL, and UK). No data are available on educational attainment. Geographical distributions are based on the assessment in Cytto, O. (2007), Jewish identification in contemporary Spain — A European case study, European Forum at the Hebrew University, Working Paper 57/2007.
FR: The 2002 survey of French Jews, in Cohen, E. (2009), The Jews of France at the turn of the third millennium — A sociological and cultural analysis, the Rappaport Center for Assimilation Research and Strengthening Jewish Vitality, Ramat Gan: Bar-Ilan University.
IT: Communal statistics and calculations provided by Professor Sergio DellaPergola. Socio-demographic survey of Italian Jewry, in Campelli, E. (2013), Comunità va cercando, ch’è si
cara. Sociologia dell’Italia ebraica, Franco Angeli, Milan.
HU: Population census (2011), extrapolations carried out by Professor Andras Kovacs. The 2017 survey of Hungarian Jews conducted by Professor Andras Kovacs.
LV: Population census (2011), extrapolations carried out by Dr Mark Tolts.
NL: The 1999 survey of the Dutch Jews, in Solinge, H. and Van Praag, C. (2010), De Joden in Nederland anno 2009 — continuïteit en verandering. Amsterdam: AMB.
PL: Population census (2011), appendices to the publication Struktura narodowo-etniczna, językowa i wyznaniowa ludności Polski — Narodowy Spis Powszechny Ludności i Mieszkań 2011, ‘TABL_1_PUBL_Narodowosc.xlsx’; ‘TABL_5_Dodatkowe_tylko_wersja_elektroniczna.xlsx’.
SE: In the absence of data, age and gender distributions are based on the average of Jewish popula-tion in six EU Member States (AT, DE, FR, IT, NL, and UK). No data are available on educational attainment. Geographical distributions are based on the membership size of Jewish communities, calculations carried out by Professor Lars Dencik.
UK: Population census (2011), Nomis — official labour market statistics.
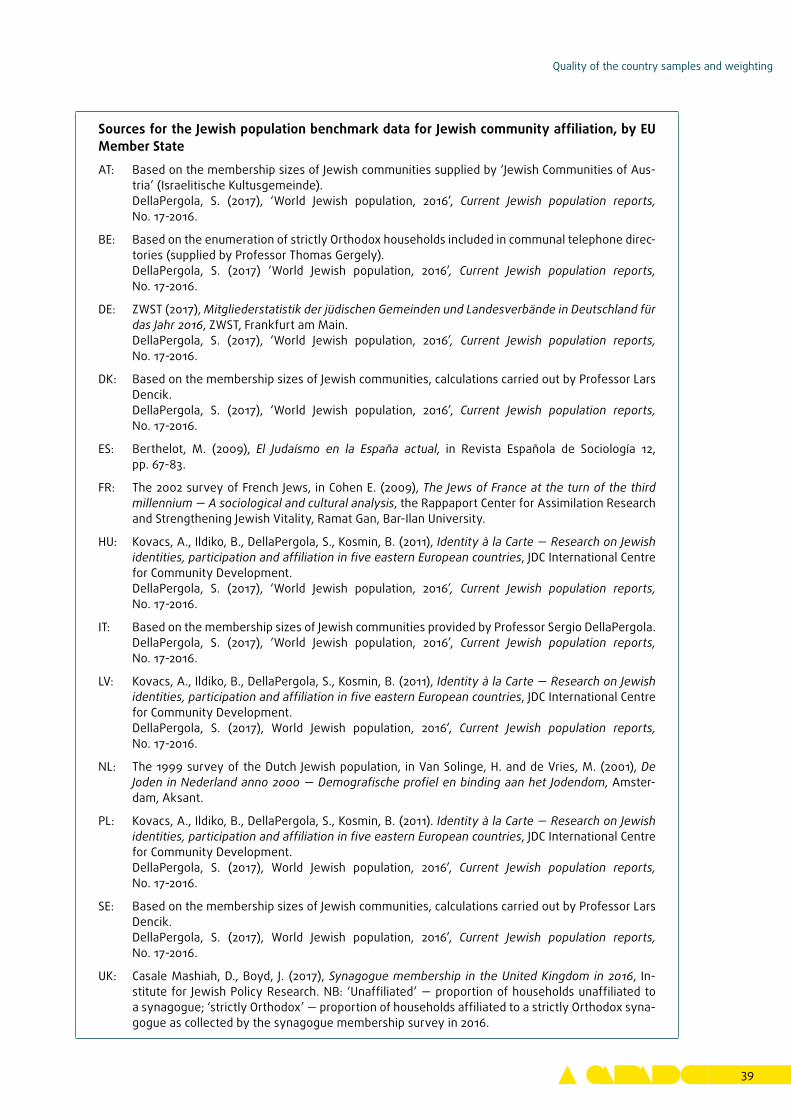
Quality of the country samples and weighting
39
Sources for the Jewish population benchmark data for Jewish community affiliation, by EU Member State
AT: Based on the membership sizes of Jewish communities supplied by ‘Jewish Communities of Aus-tria’ (Israelitische Kultusgemeinde).
DellaPergola, S. (2017), ‘World Jewish population, 2016’, Current Jewish population reports, No. 17-2016.
BE: Based on the enumeration of strictly Orthodox households included in communal telephone direc-tories (supplied by Professor Thomas Gergely).
DellaPergola, S. (2017) ‘World Jewish population, 2016’, Current Jewish population reports, No. 17-2016.
DE: ZWST (2017), Mitgliederstatistik der jüdischen Gemeinden und Landesverbände in Deutschland für das Jahr 2016, ZWST, Frankfurt am Main.
DellaPergola, S. (2017), ‘World Jewish population, 2016’, Current Jewish population reports, No. 17-2016.
DK: Based on the membership sizes of Jewish communities, calculations carried out by Professor Lars Dencik.
DellaPergola, S. (2017), ‘World Jewish population, 2016’, Current Jewish population reports, No. 17-2016.
ES: Berthelot, M. (2009), El Judaísmo en la España actual, in Revista Española de Sociología 12, pp. 67-83.
FR: The 2002 survey of French Jews, in Cohen E. (2009), The Jews of France at the turn of the third millennium — A sociological and cultural analysis, the Rappaport Center for Assimilation Research and Strengthening Jewish Vitality, Ramat Gan, Bar-Ilan University.
HU: Kovacs, A., Ildiko, B., DellaPergola, S., Kosmin, B. (2011), Identity à la Carte — Research on Jewish identities, participation and affiliation in five eastern European countries, JDC International Centre for Community Development.
DellaPergola, S. (2017), ‘World Jewish population, 2016’, Current Jewish population reports, No. 17-2016.
IT: Based on the membership sizes of Jewish communities provided by Professor Sergio DellaPergola. DellaPergola, S. (2017), ‘World Jewish population, 2016’, Current Jewish population reports,
No. 17-2016.
LV: Kovacs, A., Ildiko, B., DellaPergola, S., Kosmin, B. (2011), Identity à la Carte — Research on Jewish identities, participation and affiliation in five eastern European countries, JDC International Centre for Community Development.
DellaPergola, S. (2017), World Jewish population, 2016’, Current Jewish population reports, No. 17-2016.
NL: The 1999 survey of the Dutch Jewish population, in Van Solinge, H. and de Vries, M. (2001), De Joden in Nederland anno 2000 — Demografische profiel en binding aan het Jodendom, Amster-dam, Aksant.
PL: Kovacs, A., Ildiko, B., DellaPergola, S., Kosmin, B. (2011). Identity à la Carte — Research on Jewish identities, participation and affiliation in five eastern European countries, JDC International Centre for Community Development.
DellaPergola, S. (2017), World Jewish population, 2016’, Current Jewish population reports, No. 17-2016.
SE: Based on the membership sizes of Jewish communities, calculations carried out by Professor Lars Dencik.
DellaPergola, S. (2017), World Jewish population, 2016’, Current Jewish population reports, No. 17-2016.
UK: Casale Mashiah, D., Boyd, J. (2017), Synagogue membership in the United Kingdom in 2016, In-stitute for Jewish Policy Research. NB: ‘Unaffiliated’ — proportion of households unaffiliated to a synagogue; ‘strictly Orthodox’ — proportion of households affiliated to a strictly Orthodox syna-gogue as collected by the synagogue membership survey in 2016.
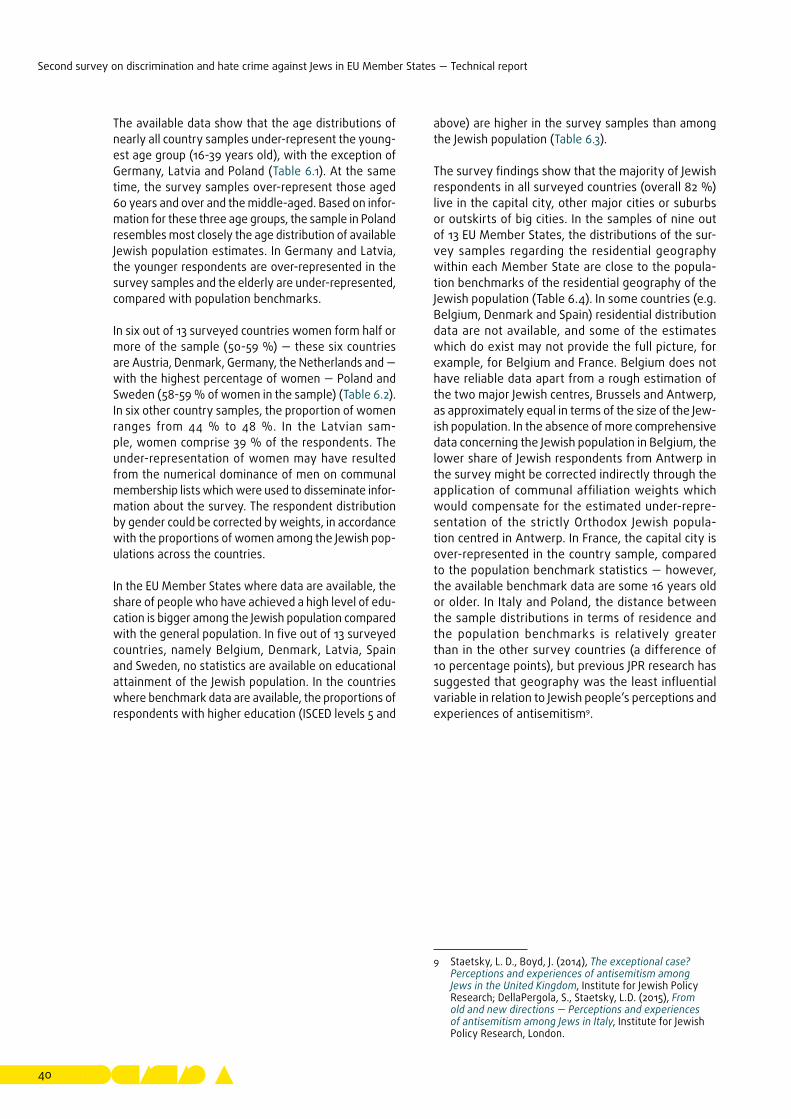
Second survey on discrimination and hate crime against Jews in EU Member States — Technical report
40
The available data show that the age distributions of nearly all country samples under-represent the young-est age group (16-39 years old), with the exception of Germany, Latvia and Poland (Table 6.1). At the same time, the survey samples over-represent those aged 60 years and over and the middle-aged. Based on infor-mation for these three age groups, the sample in Poland resembles most closely the age distribution of available Jewish population estimates. In Germany and Latvia, the younger respondents are over-represented in the survey samples and the elderly are under-represented, compared with population benchmarks.
In six out of 13 surveyed countries women form half or more of the sample (50-59 %) — these six countries are Austria, Denmark, Germany, the Netherlands and — with the highest percentage of women — Poland and Sweden (58-59 % of women in the sample) (Table 6.2). In six other country samples, the proportion of women ranges from 44 % to 48 %. In the Latvian sam-ple, women comprise 39 % of the respondents. The under-representation of women may have resulted from the numerical dominance of men on communal membership lists which were used to disseminate infor-mation about the survey. The respondent distribution by gender could be corrected by weights, in accordance with the proportions of women among the Jewish pop-ulations across the countries.
In the EU Member States where data are available, the share of people who have achieved a high level of edu-cation is bigger among the Jewish population compared with the general population. In five out of 13 surveyed countries, namely Belgium, Denmark, Latvia, Spain and Sweden, no statistics are available on educational attainment of the Jewish population. In the countries where benchmark data are available, the proportions of respondents with higher education (ISCED levels 5 and
above) are higher in the survey samples than among the Jewish population (Table 6.3).
The survey findings show that the majority of Jewish respondents in all surveyed countries (overall 82 %) live in the capital city, other major cities or suburbs or outskirts of big cities. In the samples of nine out of 13 EU Member States, the distributions of the sur-vey samples regarding the residential geography within each Member State are close to the popula-tion benchmarks of the residential geography of the Jewish population (Table 6.4). In some countries (e.g. Belgium, Denmark and Spain) residential distribution data are not available, and some of the estimates which do exist may not provide the full picture, for example, for Belgium and France. Belgium does not have reliable data apart from a rough estimation of the two major Jewish centres, Brussels and Antwerp, as approximately equal in terms of the size of the Jew-ish population. In the absence of more comprehensive data concerning the Jewish population in Belgium, the lower share of Jewish respondents from Antwerp in the survey might be corrected indirectly through the application of communal affiliation weights which would compensate for the estimated under-repre-sentation of the strictly Orthodox Jewish popula-tion centred in Antwerp. In France, the capital city is over-represented in the country sample, compared to the population benchmark statistics — however, the available benchmark data are some 16 years old or older. In Italy and Poland, the distance between the sample distributions in terms of residence and the population benchmarks is relatively greater than in the other survey countries (a difference of 10 percentage points), but previous JPR research has suggested that geography was the least influential variable in relation to Jewish people’s perceptions and experiences of antisemitism9.
9 Staetsky, L. D., Boyd, J. (2014), The exceptional case? Perceptions and experiences of antisemitism among Jews in the United Kingdom, Institute for Jewish Policy Research; DellaPergola, S., Staetsky, L.D. (2015), From old and new directions — Perceptions and experiences of antisemitism among Jews in Italy, Institute for Jewish Policy Research, London.
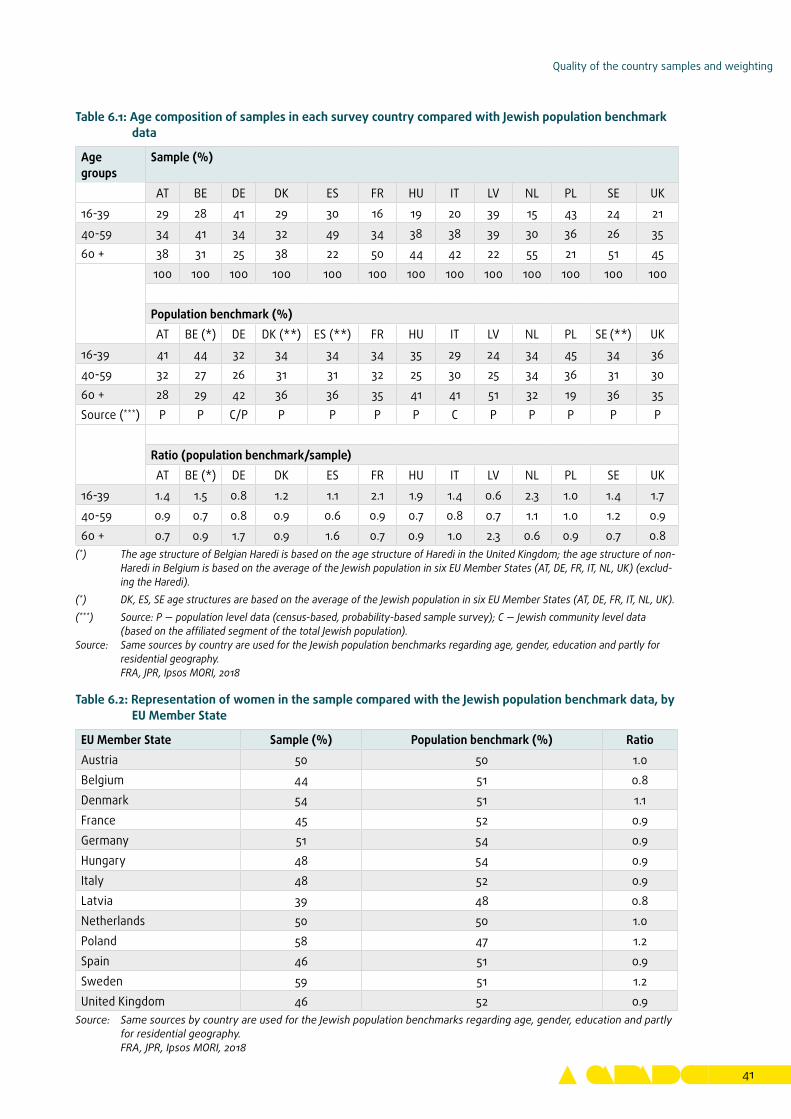
Quality of the country samples and weighting
41
Table 6.1: Age composition of samples in each survey country compared with Jewish population benchmark data
Age groups
Sample (%)
AT BE DE DK ES FR HU IT LV NL PL SE UK16-39 29 28 41 29 30 16 19 20 39 15 43 24 2140-59 34 41 34 32 49 34 38 38 39 30 36 26 3560 + 38 31 25 38 22 50 44 42 22 55 21 51 45
100 100 100 100 100 100 100 100 100 100 100 100 100
Population benchmark (%)AT BE (*) DE DK (**) ES (**) FR HU IT LV NL PL SE (**) UK
16-39 41 44 32 34 34 34 35 29 24 34 45 34 3640-59 32 27 26 31 31 32 25 30 25 34 36 31 3060 + 28 29 42 36 36 35 41 41 51 32 19 36 35Source (***) P P C/P P P P P C P P P P P
Ratio (population benchmark/sample)AT BE (*) DE DK ES FR HU IT LV NL PL SE UK
16-39 1.4 1.5 0.8 1.2 1.1 2.1 1.9 1.4 0.6 2.3 1.0 1.4 1.740-59 0.9 0.7 0.8 0.9 0.6 0.9 0.7 0.8 0.7 1.1 1.0 1.2 0.960 + 0.7 0.9 1.7 0.9 1.6 0.7 0.9 1.0 2.3 0.6 0.9 0.7 0.8
(*) The age structure of Belgian Haredi is based on the age structure of Haredi in the United Kingdom; the age structure of non-Haredi in Belgium is based on the average of the Jewish population in six EU Member States (AT, DE, FR, IT, NL, UK) (exclud-ing the Haredi).
(*) DK, ES, SE age structures are based on the average of the Jewish population in six EU Member States (AT, DE, FR, IT, NL, UK).(***) Source: P — population level data (census-based, probability-based sample survey); C — Jewish community level data
(based on the affiliated segment of the total Jewish population).Source: Same sources by country are used for the Jewish population benchmarks regarding age, gender, education and partly for
residential geography. FRA, JPR, Ipsos MORI, 2018
Table 6.2: Representation of women in the sample compared with the Jewish population benchmark data, by EU Member State
EU Member State Sample (%) Population benchmark (%) RatioAustria 50 50 1.0Belgium 44 51 0.8Denmark 54 51 1.1France 45 52 0.9Germany 51 54 0.9Hungary 48 54 0.9Italy 48 52 0.9Latvia 39 48 0.8Netherlands 50 50 1.0Poland 58 47 1.2Spain 46 51 0.9Sweden 59 51 1.2United Kingdom 46 52 0.9
Source: Same sources by country are used for the Jewish population benchmarks regarding age, gender, education and partly for residential geography.
FRA, JPR, Ipsos MORI, 2018
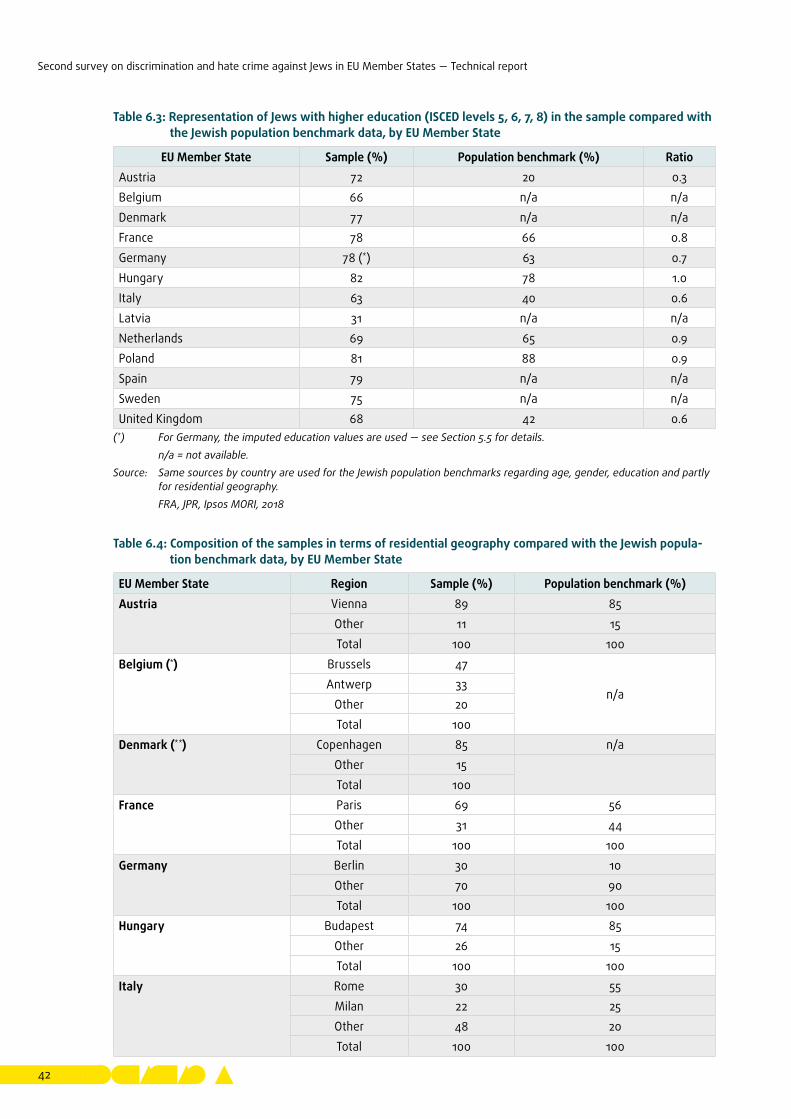
Second survey on discrimination and hate crime against Jews in EU Member States — Technical report
42
Table 6.3: Representation of Jews with higher education (ISCED levels 5, 6, 7, 8) in the sample compared with the Jewish population benchmark data, by EU Member State
EU Member State Sample (%) Population benchmark (%) RatioAustria 72 20 0.3Belgium 66 n/a n/aDenmark 77 n/a n/aFrance 78 66 0.8Germany 78 (*) 63 0.7Hungary 82 78 1.0Italy 63 40 0.6Latvia 31 n/a n/aNetherlands 69 65 0.9Poland 81 88 0.9Spain 79 n/a n/aSweden 75 n/a n/aUnited Kingdom 68 42 0.6
(*) For Germany, the imputed education values are used — see Section 5.5 for details. n/a = not available.Source: Same sources by country are used for the Jewish population benchmarks regarding age, gender, education and partly
for residential geography. FRA, JPR, Ipsos MORI, 2018
Table 6.4: Composition of the samples in terms of residential geography compared with the Jewish popula-tion benchmark data, by EU Member State
EU Member State Region Sample (%) Population benchmark (%)Austria Vienna 89 85
Other 11 15Total 100 100
Belgium (*) Brussels 47
n/aAntwerp 33
Other 20Total 100
Denmark (**) Copenhagen 85 n/aOther 15Total 100
France Paris 69 56Other 31 44Total 100 100
Germany Berlin 30 10Other 70 90Total 100 100
Hungary Budapest 74 85Other 26 15Total 100 100
Italy Rome 30 55Milan 22 25Other 48 20Total 100 100
Quality of the country samples and weighting
43
EU Member State Region Sample (%) Population benchmark (%)Latvia Riga 98 88
Other 2 12Total 100 100
Netherlands Amsterdam 52 44Other 48 56Total 100 100
Poland Warsaw 65 40Other 35 60Total 100 100
Spain (***) Madrid 46 40Barcelona 38 35
Other 16 25Total 100 100
Sweden Stockholm 62 71Gothenburg 13 17
Other 25 12Total 100 100
United Kingdom London 61 65Other 39 35Total 100 100
(*) Only approximate estimates are available for the benchmarks, suggesting a more or less equal share of the population residing in Brussels and Antwerp, respectively.
(**) No detailed data are available concerning the geographical distribution of the population, but a majority of Jews in Denmark are estimated to live in the capital city.
(***) Only approximations of the geographical distribution of the population are available to be used as benchmarks. n/a = not available.Source: Same sources by country are used for the Jewish population benchmarks regarding age, gender, education and partly
for residential geography, and therefore are listed after Table 6.4. FRA, JPR, Ipsos MORI, 2018
Another aspect to be assessed in the framework of the country sample quality is the Jewish communal struc-ture of the samples, based on respondents’ commu-nity affiliation, compared with the relevant population benchmark data from the communities themselves. In the majority of the surveyed countries, the propor-tion of respondents affiliated to a community is higher than what could be expected based on available Jew-ish population benchmarks (Table 6.5). Even if some of the benchmarks are taken as rough approximations, the biggest under-representation of unaffiliated seg-ments of the Jewish population are observed in the samples from Denmark, the Netherlands, Poland, Spain and Sweden.
In three cases — Austria, Germany and Italy — the communal affiliation structure in the country samples reflects closely the estimates available concerning the (non-)affiliation structure of the Jewish population. In all three countries, the majority of Jews are communally
affiliated. In the other countries surveyed, the commu-nally unaffiliated respondents are under-represented in the survey samples compared with available estimates.
Table 6.6 summarises the availability of the Jewish population benchmark data and their quality in each surveyed country, as assessed by the experts involved in implementing the survey for FRA. Nine countries out of the 13 in the survey have moderate quality data in relation to age and gender (Austria, France, Germany, Hungary, Italy, Latvia, the Netherlands, Poland and the United Kingdom). Six countries have benchmark data for communal affiliation that can be considered as moderate quality (Austria, Germany, France, Italy, the Netherlands, the United Kingdom), and three countries (Hungary, Latvia, Poland) have estimates which may contain more uncertainty.
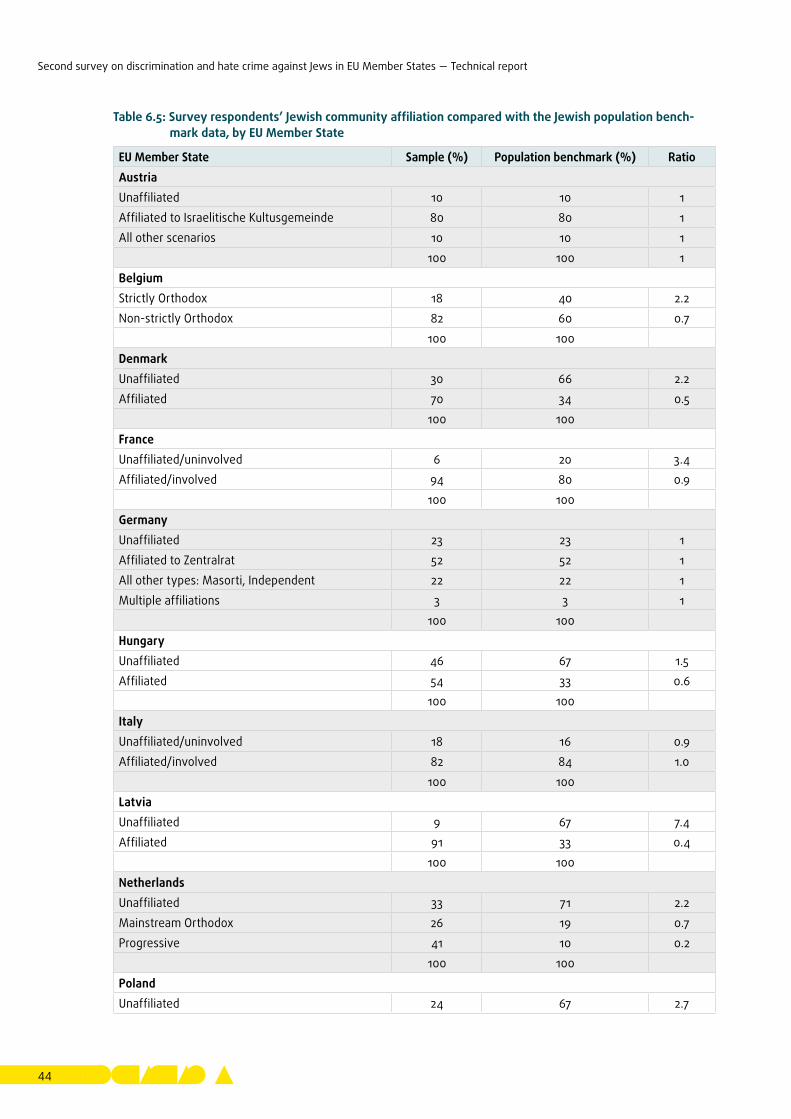
Second survey on discrimination and hate crime against Jews in EU Member States — Technical report
44
Table 6.5: Survey respondents’ Jewish community affiliation compared with the Jewish population bench-mark data, by EU Member State
EU Member State Sample (%) Population benchmark (%) RatioAustriaUnaffiliated 10 10 1Affiliated to Israelitische Kultusgemeinde 80 80 1All other scenarios 10 10 1
100 100 1BelgiumStrictly Orthodox 18 40 2.2Non-strictly Orthodox 82 60 0.7
100 100DenmarkUnaffiliated 30 66 2.2Affiliated 70 34 0.5
100 100FranceUnaffiliated/uninvolved 6 20 3.4Affiliated/involved 94 80 0.9
100 100GermanyUnaffiliated 23 23 1Affiliated to Zentralrat 52 52 1All other types: Masorti, Independent 22 22 1Multiple affiliations 3 3 1
100 100HungaryUnaffiliated 46 67 1.5Affiliated 54 33 0.6
100 100ItalyUnaffiliated/uninvolved 18 16 0.9Affiliated/involved 82 84 1.0
100 100LatviaUnaffiliated 9 67 7.4Affiliated 91 33 0.4
100 100NetherlandsUnaffiliated 33 71 2.2Mainstream Orthodox 26 19 0.7Progressive 41 10 0.2
100 100PolandUnaffiliated 24 67 2.7
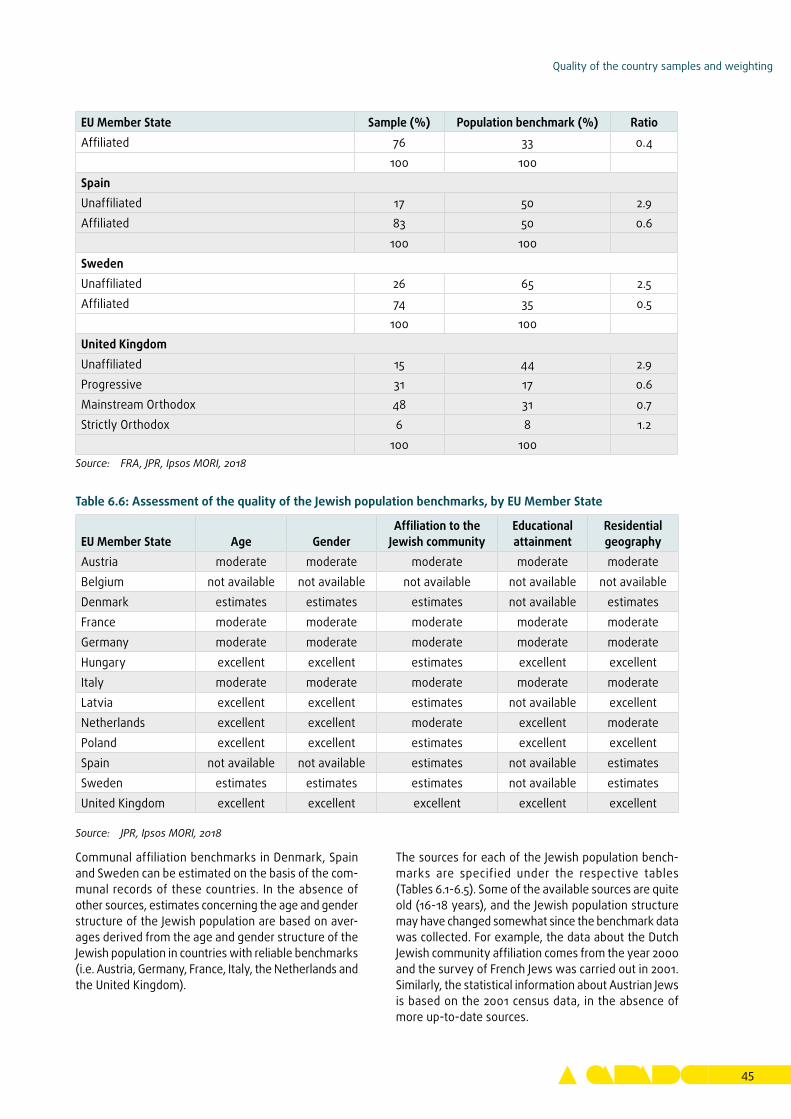
Quality of the country samples and weighting
45
EU Member State Sample (%) Population benchmark (%) RatioAffiliated 76 33 0.4
100 100SpainUnaffiliated 17 50 2.9Affiliated 83 50 0.6
100 100SwedenUnaffiliated 26 65 2.5Affiliated 74 35 0.5
100 100United KingdomUnaffiliated 15 44 2.9Progressive 31 17 0.6Mainstream Orthodox 48 31 0.7Strictly Orthodox 6 8 1.2
100 100Source: FRA, JPR, Ipsos MORI, 2018
Table 6.6: Assessment of the quality of the Jewish population benchmarks, by EU Member State
EU Member State Age GenderAffiliation to the
Jewish communityEducational attainment
Residential geography
Austria moderate moderate moderate moderate moderateBelgium not available not available not available not available not availableDenmark estimates estimates estimates not available estimatesFrance moderate moderate moderate moderate moderateGermany moderate moderate moderate moderate moderateHungary excellent excellent estimates excellent excellentItaly moderate moderate moderate moderate moderateLatvia excellent excellent estimates not available excellentNetherlands excellent excellent moderate excellent moderatePoland excellent excellent estimates excellent excellentSpain not available not available estimates not available estimatesSweden estimates estimates estimates not available estimatesUnited Kingdom excellent excellent excellent excellent excellent
Source: JPR, Ipsos MORI, 2018
Communal affiliation benchmarks in Denmark, Spain and Sweden can be estimated on the basis of the com-munal records of these countries. In the absence of other sources, estimates concerning the age and gender structure of the Jewish population are based on aver-ages derived from the age and gender structure of the Jewish population in countries with reliable benchmarks (i.e. Austria, Germany, France, Italy, the Netherlands and the United Kingdom).
The sources for each of the Jewish population bench-marks are specified under the respective tables (Tables 6.1-6.5). Some of the available sources are quite old (16-18 years), and the Jewish population structure may have changed somewhat since the benchmark data was collected. For example, the data about the Dutch Jewish community affiliation comes from the year 2000 and the survey of French Jews was carried out in 2001. Similarly, the statistical information about Austrian Jews is based on the 2001 census data, in the absence of more up-to-date sources.
Second survey on discrimination and hate crime against Jews in EU Member States — Technical report
46
6�2� WeightingThis section describes the steps taken to develop the weighting approaches applied to the data set and data analysis. Firstly, it presents the weighting strategy based on estimates of socio-demographic character-istics such as age, gender and affiliation to the Jewish community organisations, in order to adjust for spe-cific respondent characteristics. Over the course of its data analysis, FRA also developed propensity weights based on variables associated with the recruitment pro-cess, as well as a composite weight, which takes into account all different adjustment possibilities. In order to demonstrate the effects of the weights, this section compares selected survey estimates when different weights are applied.
Due to the lack of comprehensive and up-to-date Jewish population statistics (e.g. census statistics on age and gender distributions of the Jewish population), and data relating to Jewish communities (e.g. Jewish communal affiliation), in most countries the available information is based on educated estimates and assumptions, the accuracy of which is difficult to ascertain. The data regarding the Jewish population composition and the community composition differs in comprehensiveness from country to country.
6�2�1 Target population size weight
The samples across the 12 survey countries range from 422 respondents in Poland to 4 731 respondents in the United Kingdom. In order to adjust the impact of each country sample towards the average of the 12 survey countries, FRA has applied a weight that takes into account the differences between the sizes of the Jewish population in the different countries. In view of different estimates concerning the size of the Jewish population (so-called core and extended Jewish population), a mid-point of these estimates was used when establishing the relative contribution each country sample should have for the 12-country average10. The target popula-tion size weight was composed as a separate weight, included in the data set, and applied to calculate the average of the 12 survey countries in the results report.
In order to compare findings between the 2018 and 2012 surveys, FRA calculated a new weight variable for the 2012 survey data which follows the same adjust-ment approach as that used for the analysis of the 2018 survey. A separate weight variable was created for the 2012 data set and applied for the findings of the 2012 survey (average results for countries included in both the 2012 and 2018 surveys).
10 DellaPergola, S. (2017), ‘World Jewish population, 2016’, Current Jewish population reports, No. 17-2016.
6�2�2 Within-sample weights
To explore possibilities for adjusting the country sam-ples based on population estimates available for all 13 countries, a weight was calculated based on three variables: age, gender and Jewish community affilia-tion. The development of the benchmarks and related issues are discussed in the section on the quality of the country samples (Section 6.1). The weight corrects for samples’ over- or under-representation of specific groups in the Jewish population based on the selected characteristics, with the assumption that these charac-teristics may be correlated with other variables in the survey (for example, respondents’ views concerning antisemitism or experiencing antisemitic discrimina-tion, harassment or violence). The calculated weight has been included as a separate variable in the data set.
In the samples from Austria, Germany and Italy the pattern of communal affiliation was close to the popu-lation benchmarks, therefore the weight mainly adjusts the age and gender distributions. For all countries except Belgium and Latvia the weight was developed using a post-stratification weighting approach (i.e. rim weighting) using STATA software. For Belgium, a full simultaneous age–gender–communal affiliation distri-bution was available and the weight was developed using SPSS software and a cell weighting method. No adjustments (e.g. trimming or capping) of weights was considered necessary. In the end, the Latvian sample was not weighted because the data for Latvia were not included in the comparative results presented in FRA’s report.
6�2�3 Propensity weights
FRA also explored other possibilities of weighting and using available auxiliary information to its full extent, not limiting to the post-stratification and calibration types of weighting. The usual sequence in complex probability surveys contains three types of weighting: design weighting, non-response weighting and post-stratification or calibration weighting. Non-response weighting may use model-based approaches: the prob-ability of a selected person to participate in the survey is estimated using a statistical model based on vari-ables expressing specific characteristics (e.g. type of neighbourhood or living area) — and the inverse of this probability is used for the weighting.
In the nonprobability sample such as that of an open, opt-in online survey, it is not possible to identify typi-cal characteristics of ‘non-respondents’ — however, it is possible to identify characteristics that made the participation of a person in the survey more likely, compared with the participation of other persons in the population. This can be done by using variables
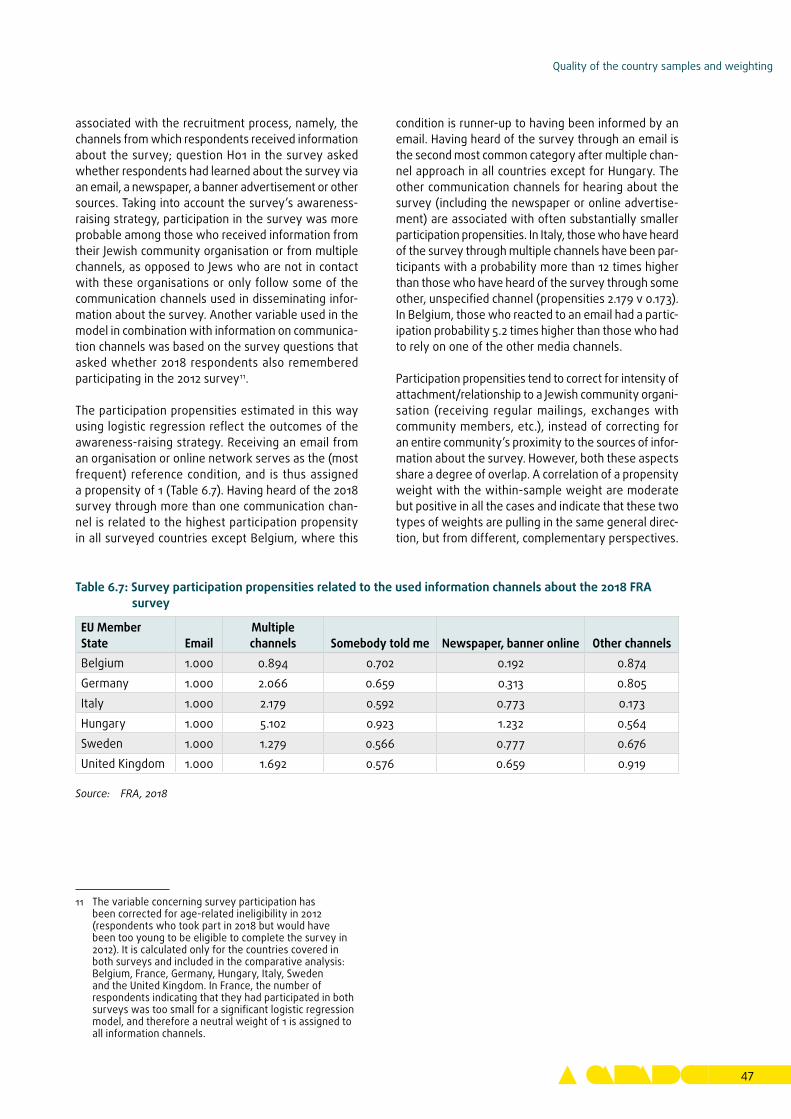
Quality of the country samples and weighting
47
associated with the recruitment process, namely, the channels from which respondents received information about the survey; question H01 in the survey asked whether respondents had learned about the survey via an email, a newspaper, a banner advertisement or other sources. Taking into account the survey’s awareness-raising strategy, participation in the survey was more probable among those who received information from their Jewish community organisation or from multiple channels, as opposed to Jews who are not in contact with these organisations or only follow some of the communication channels used in disseminating infor-mation about the survey. Another variable used in the model in combination with information on communica-tion channels was based on the survey questions that asked whether 2018 respondents also remembered participating in the 2012 survey11.
The participation propensities estimated in this way using logistic regression reflect the outcomes of the awareness-raising strategy. Receiving an email from an organisation or online network serves as the (most frequent) reference condition, and is thus assigned a propensity of 1 (Table 6.7). Having heard of the 2018 survey through more than one communication chan-nel is related to the highest participation propensity in all surveyed countries except Belgium, where this
11 The variable concerning survey participation has been corrected for age-related ineligibility in 2012 (respondents who took part in 2018 but would have been too young to be eligible to complete the survey in 2012). It is calculated only for the countries covered in both surveys and included in the comparative analysis: Belgium, France, Germany, Hungary, Italy, Sweden and the United Kingdom. In France, the number of respondents indicating that they had participated in both surveys was too small for a significant logistic regression model, and therefore a neutral weight of 1 is assigned to all information channels.
condition is runner-up to having been informed by an email. Having heard of the survey through an email is the second most common category after multiple chan-nel approach in all countries except for Hungary. The other communication channels for hearing about the survey (including the newspaper or online advertise-ment) are associated with often substantially smaller participation propensities. In Italy, those who have heard of the survey through multiple channels have been par-ticipants with a probability more than 12 times higher than those who have heard of the survey through some other, unspecified channel (propensities 2.179 v 0.173). In Belgium, those who reacted to an email had a partic-ipation probability 5.2 times higher than those who had to rely on one of the other media channels.
Participation propensities tend to correct for intensity of attachment/relationship to a Jewish community organi-sation (receiving regular mailings, exchanges with community members, etc.), instead of correcting for an entire community’s proximity to the sources of infor-mation about the survey. However, both these aspects share a degree of overlap. A correlation of a propensity weight with the within-sample weight are moderate but positive in all the cases and indicate that these two types of weights are pulling in the same general direc-tion, but from different, complementary perspectives.
Table 6.7: Survey participation propensities related to the used information channels about the 2018 FRA survey
EU Member State Email
Multiple channels Somebody told me Newspaper, banner online Other channels
Belgium 1.000 0.894 0.702 0.192 0.874Germany 1.000 2.066 0.659 0.313 0.805Italy 1.000 2.179 0.592 0.773 0.173Hungary 1.000 5.102 0.923 1.232 0.564Sweden 1.000 1.279 0.566 0.777 0.676United Kingdom 1.000 1.692 0.576 0.659 0.919
Source: FRA, 2018

Second survey on discrimination and hate crime against Jews in EU Member States — Technical report
48
Table 6.8: Effect of different weighting approaches to results on respondents’ perceptions concerning anti-semitism — selected indicators of the 2018 survey, by EU Member State
EU Member State Unweighted Within-sample weight Propensity weight (*) Combined weight
Perceptions concerning antisemitism as a problem in the country (question B02 D), response category ‘a very big problem’ (%)Austria 24.1 24.7Belgium 43.2 41.1 41.5 40.2Denmark 13.5 14.2France 64.9 65.3Germany 43.1 43.1 44.2 44.3Hungary 26.1 26.9 27.2 27.9Italy 21.4 21.0 20.8 19.7Netherlands 24.1 31.8Poland 38.9 39.7Spain 29.6 30.9Sweden 35.0 37.9 35.7 37.8United Kingdom 28.4 27.5 28.4 28.4Perceptions concerning changes in the level of antisemitism in the country over the 5 years before the survey (question B03 B), response category ‘increased a lot’ (%)Austria 33.1 33.8Belgium 60.4 57.6 58.6 55.6Denmark 36.0 37.6France 76.9 74.1Germany 59.7 60.2 59.0 60.3Hungary 30.7 30.5 31.9 31.4Italy 35.8 34.6 36.6 35.3Netherlands 56.5 59.2
6�2�4 Effects of different weighting approaches on the survey results
The experimental development and application of dif-ferent weights can be considered a research result in itself. This section provides an overview of results for selected variables, comparing unweighted findings with the different weights applied to examine the impact of the various weighting schemes.
Assessment of respondents’ perceptions and experi-ences of antisemitism, and their survey participation propensities, reveals some patterns, but not effects that would consistently move the results in the same direc-tion, no matter which weighting variable or combination is used (Tables 6.8 and 6.9). FRA developed a combined weight that incorporates the propensity weight and the within-sample weight and in this way exploits the available information more comprehensively than each of the weights on its own. If a survey estimate calcu-lated using the combined weight is 19.5 % compared to 21.4 % in the unweighted condition, the weighted value
should better approximate the ‘true value’ in the target population (the example refers to the results of Italy regarding antisemitism seen as ‘a very big problem’ in Tables 6.8 and 6.9).
No systematic within-sample weighting effects could be found regarding key results on perceptions and expe-riences of antisemitism, the within-sample weights do not change the overall results substantially. A small difference observed in case of the (within-sample) weighting does not change much in perceptions and experiences of antisemitism. In the examples provided, some exceptions are observed, for example, the biggest differences between the unweighted and weighted by combined weight findings are observed in Belgium. The values of the findings regarding perceptions are lower when weighted by combined weight in 3-5 percentage points, while the findings regarding the experiences are higher in 8-10 percentage points. The reasons for such deviations need further exploration and might be related to the quality of the benchmarks constructed for the weighting procedure.
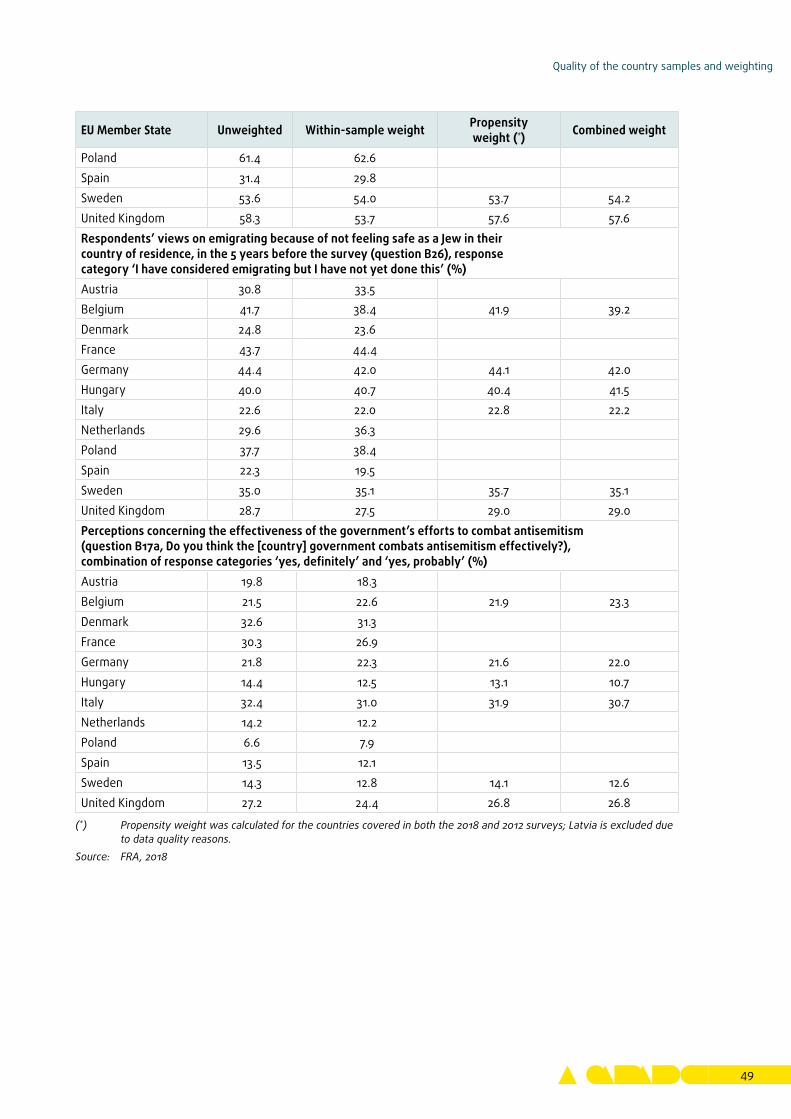
Quality of the country samples and weighting
49
EU Member State Unweighted Within-sample weight Propensity weight (*) Combined weight
Poland 61.4 62.6Spain 31.4 29.8Sweden 53.6 54.0 53.7 54.2United Kingdom 58.3 53.7 57.6 57.6Respondents’ views on emigrating because of not feeling safe as a Jew in their country of residence, in the 5 years before the survey (question B26), response category ‘I have considered emigrating but I have not yet done this’ (%)Austria 30.8 33.5Belgium 41.7 38.4 41.9 39.2Denmark 24.8 23.6France 43.7 44.4Germany 44.4 42.0 44.1 42.0Hungary 40.0 40.7 40.4 41.5Italy 22.6 22.0 22.8 22.2Netherlands 29.6 36.3Poland 37.7 38.4Spain 22.3 19.5Sweden 35.0 35.1 35.7 35.1United Kingdom 28.7 27.5 29.0 29.0Perceptions concerning the effectiveness of the government’s efforts to combat antisemitism (question B17a, Do you think the [country] government combats antisemitism effectively?), combination of response categories ‘yes, definitely’ and ‘yes, probably’ (%)Austria 19.8 18.3Belgium 21.5 22.6 21.9 23.3Denmark 32.6 31.3France 30.3 26.9Germany 21.8 22.3 21.6 22.0Hungary 14.4 12.5 13.1 10.7Italy 32.4 31.0 31.9 30.7Netherlands 14.2 12.2Poland 6.6 7.9Spain 13.5 12.1Sweden 14.3 12.8 14.1 12.6United Kingdom 27.2 24.4 26.8 26.8
(*) Propensity weight was calculated for the countries covered in both the 2018 and 2012 surveys; Latvia is excluded due to data quality reasons.
Source: FRA, 2018
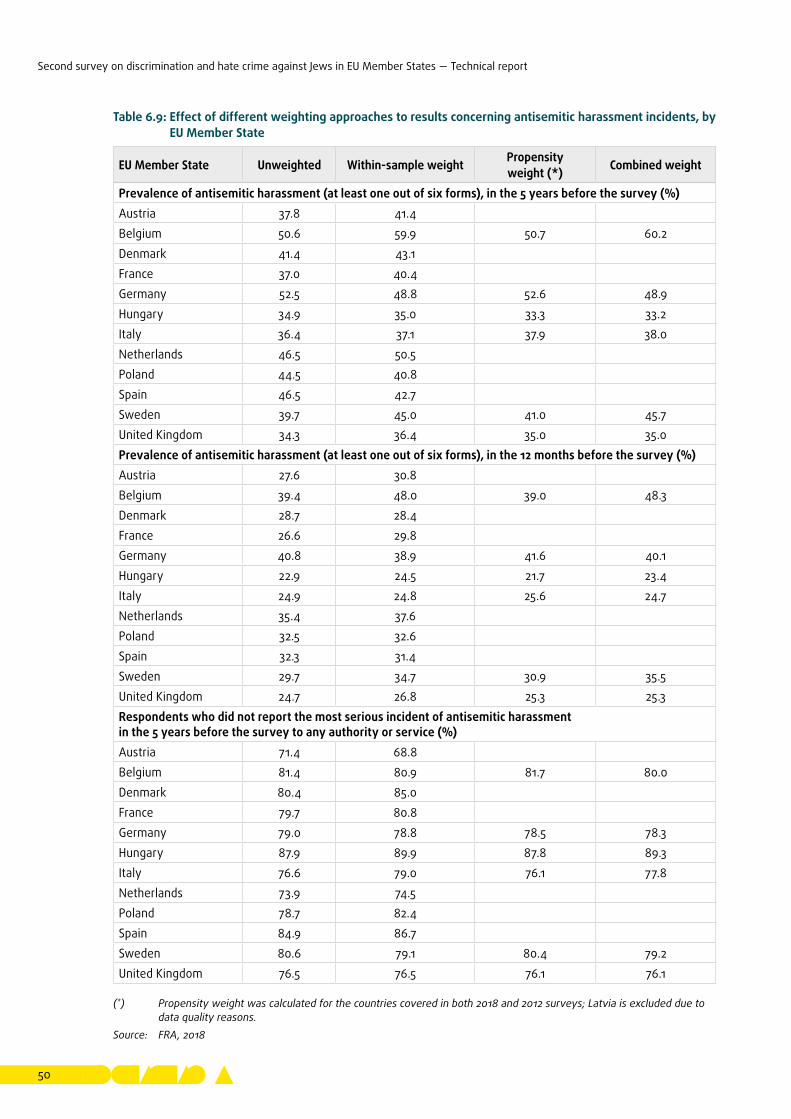
Second survey on discrimination and hate crime against Jews in EU Member States — Technical report
50
Table 6.9: Effect of different weighting approaches to results concerning antisemitic harassment incidents, by EU Member State
EU Member State Unweighted Within-sample weight Propensity weight (*) Combined weight
Prevalence of antisemitic harassment (at least one out of six forms), in the 5 years before the survey (%)Austria 37.8 41.4Belgium 50.6 59.9 50.7 60.2Denmark 41.4 43.1France 37.0 40.4Germany 52.5 48.8 52.6 48.9Hungary 34.9 35.0 33.3 33.2Italy 36.4 37.1 37.9 38.0Netherlands 46.5 50.5Poland 44.5 40.8Spain 46.5 42.7Sweden 39.7 45.0 41.0 45.7United Kingdom 34.3 36.4 35.0 35.0Prevalence of antisemitic harassment (at least one out of six forms), in the 12 months before the survey (%)Austria 27.6 30.8Belgium 39.4 48.0 39.0 48.3Denmark 28.7 28.4France 26.6 29.8Germany 40.8 38.9 41.6 40.1Hungary 22.9 24.5 21.7 23.4Italy 24.9 24.8 25.6 24.7Netherlands 35.4 37.6Poland 32.5 32.6Spain 32.3 31.4Sweden 29.7 34.7 30.9 35.5United Kingdom 24.7 26.8 25.3 25.3Respondents who did not report the most serious incident of antisemitic harassment in the 5 years before the survey to any authority or service (%)Austria 71.4 68.8Belgium 81.4 80.9 81.7 80.0Denmark 80.4 85.0France 79.7 80.8Germany 79.0 78.8 78.5 78.3Hungary 87.9 89.9 87.8 89.3Italy 76.6 79.0 76.1 77.8Netherlands 73.9 74.5Poland 78.7 82.4Spain 84.9 86.7Sweden 80.6 79.1 80.4 79.2United Kingdom 76.5 76.5 76.1 76.1
(*) Propensity weight was calculated for the countries covered in both 2018 and 2012 surveys; Latvia is excluded due to data quality reasons.
Source: FRA, 2018
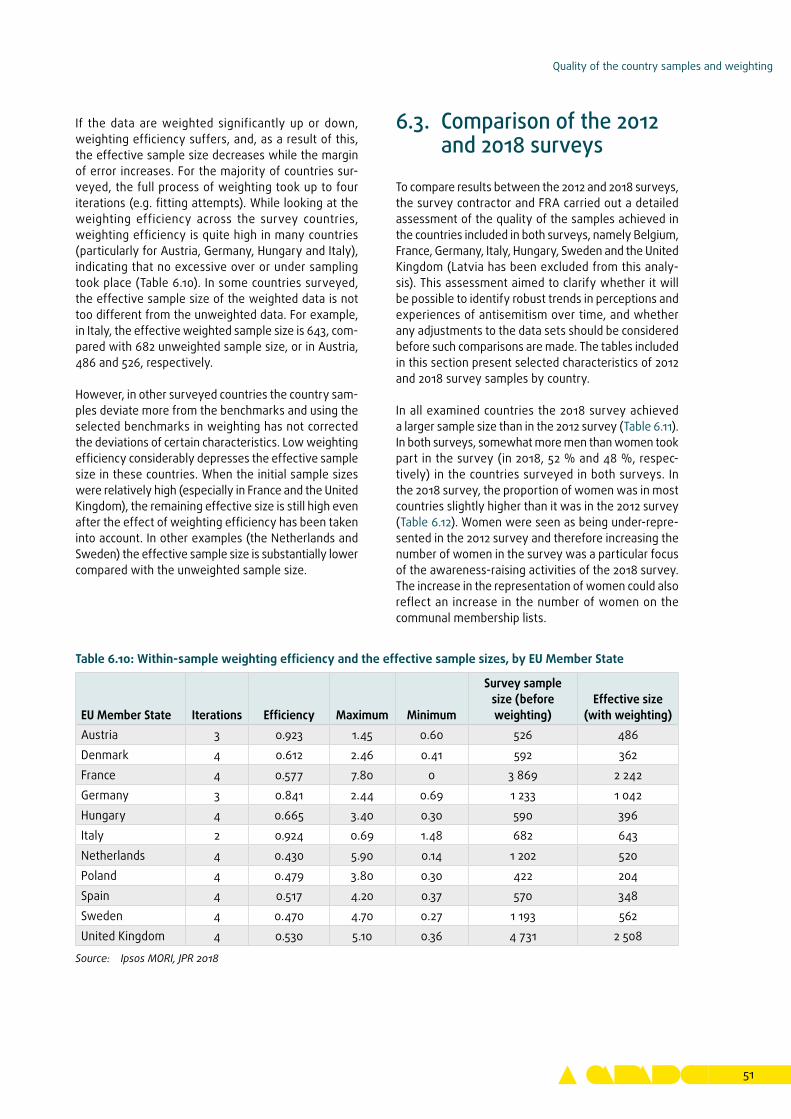
Quality of the country samples and weighting
51
If the data are weighted significantly up or down, weighting efficiency suffers, and, as a result of this, the effective sample size decreases while the margin of error increases. For the majority of countries sur-veyed, the full process of weighting took up to four iterations (e.g. fitting attempts). While looking at the weighting efficiency across the survey countries, weighting efficiency is quite high in many countries (particularly for Austria, Germany, Hungary and Italy), indicating that no excessive over or under sampling took place (Table 6.10). In some countries surveyed, the effective sample size of the weighted data is not too different from the unweighted data. For example, in Italy, the effective weighted sample size is 643, com-pared with 682 unweighted sample size, or in Austria, 486 and 526, respectively.
However, in other surveyed countries the country sam-ples deviate more from the benchmarks and using the selected benchmarks in weighting has not corrected the deviations of certain characteristics. Low weighting efficiency considerably depresses the effective sample size in these countries. When the initial sample sizes were relatively high (especially in France and the United Kingdom), the remaining effective size is still high even after the effect of weighting efficiency has been taken into account. In other examples (the Netherlands and Sweden) the effective sample size is substantially lower compared with the unweighted sample size.
6�3� Comparison of the 2012 and 2018 surveys
To compare results between the 2012 and 2018 surveys, the survey contractor and FRA carried out a detailed assessment of the quality of the samples achieved in the countries included in both surveys, namely Belgium, France, Germany, Italy, Hungary, Sweden and the United Kingdom (Latvia has been excluded from this analy-sis). This assessment aimed to clarify whether it will be possible to identify robust trends in perceptions and experiences of antisemitism over time, and whether any adjustments to the data sets should be considered before such comparisons are made. The tables included in this section present selected characteristics of 2012 and 2018 survey samples by country.
In all examined countries the 2018 survey achieved a larger sample size than in the 2012 survey (Table 6.11). In both surveys, somewhat more men than women took part in the survey (in 2018, 52 % and 48 %, respec-tively) in the countries surveyed in both surveys. In the 2018 survey, the proportion of women was in most countries slightly higher than it was in the 2012 survey (Table 6.12). Women were seen as being under-repre-sented in the 2012 survey and therefore increasing the number of women in the survey was a particular focus of the awareness-raising activities of the 2018 survey. The increase in the representation of women could also reflect an increase in the number of women on the communal membership lists.
Table 6.10: Within-sample weighting efficiency and the effective sample sizes, by EU Member State
EU Member State Iterations Efficiency Maximum Minimum
Survey sample size (before weighting)
Effective size (with weighting)
Austria 3 0.923 1.45 0.60 526 486Denmark 4 0.612 2.46 0.41 592 362France 4 0.577 7.80 0 3 869 2 242Germany 3 0.841 2.44 0.69 1 233 1 042Hungary 4 0.665 3.40 0.30 590 396Italy 2 0.924 0.69 1.48 682 643Netherlands 4 0.430 5.90 0.14 1 202 520Poland 4 0.479 3.80 0.30 422 204Spain 4 0.517 4.20 0.37 570 348Sweden 4 0.470 4.70 0.27 1 193 562United Kingdom 4 0.530 5.10 0.36 4 731 2 508
Source: Ipsos MORI, JPR 2018
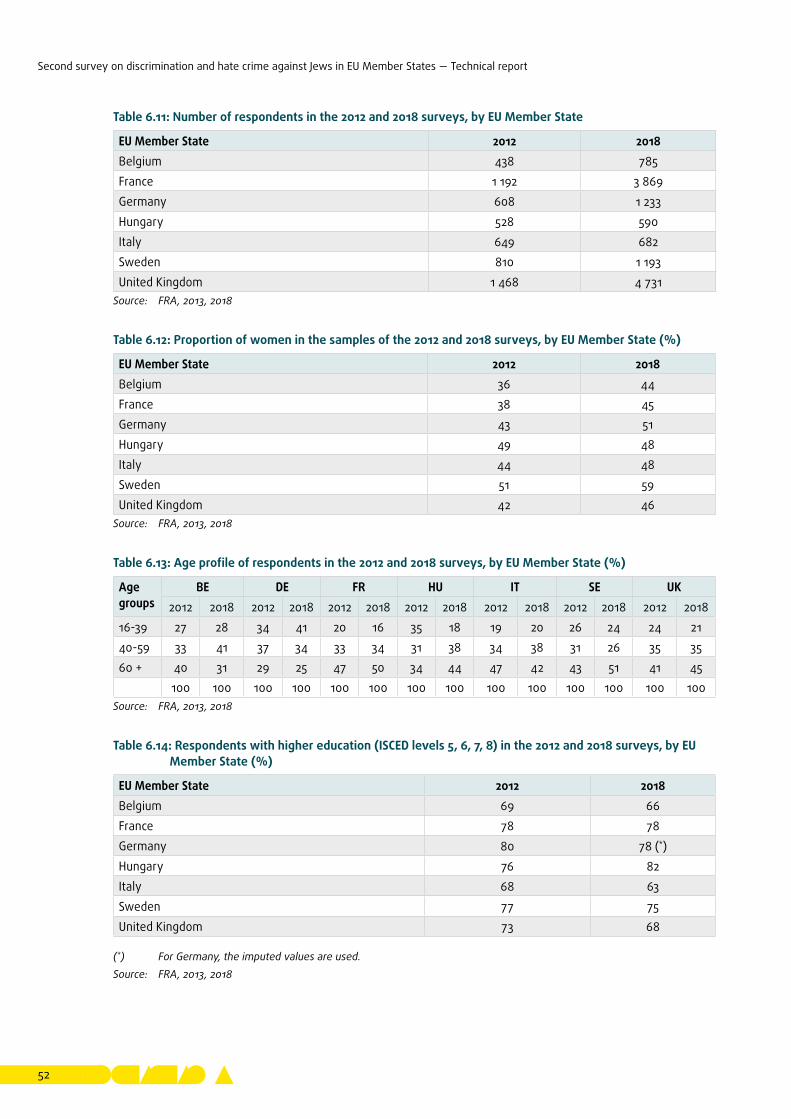
Second survey on discrimination and hate crime against Jews in EU Member States — Technical report
52
Table 6.11: Number of respondents in the 2012 and 2018 surveys, by EU Member State
EU Member State 2012 2018Belgium 438 785France 1 192 3 869Germany 608 1 233Hungary 528 590Italy 649 682Sweden 810 1 193United Kingdom 1 468 4 731
Source: FRA, 2013, 2018
Table 6.12: Proportion of women in the samples of the 2012 and 2018 surveys, by EU Member State (%)
EU Member State 2012 2018Belgium 36 44France 38 45Germany 43 51Hungary 49 48Italy 44 48Sweden 51 59United Kingdom 42 46
Source: FRA, 2013, 2018
Table 6.14: Respondents with higher education (ISCED levels 5, 6, 7, 8) in the 2012 and 2018 surveys, by EU Member State (%)
EU Member State 2012 2018Belgium 69 66France 78 78Germany 80 78 (*)Hungary 76 82Italy 68 63Sweden 77 75United Kingdom 73 68
(*) For Germany, the imputed values are used.Source: FRA, 2013, 2018
Table 6.13: Age profile of respondents in the 2012 and 2018 surveys, by EU Member State (%)
Age groups
BE DE FR HU IT SE UK2012 2018 2012 2018 2012 2018 2012 2018 2012 2018 2012 2018 2012 2018
16-39 27 28 34 41 20 16 35 18 19 20 26 24 24 2140-59 33 41 37 34 33 34 31 38 34 38 31 26 35 3560 + 40 31 29 25 47 50 34 44 47 42 43 51 41 45
100 100 100 100 100 100 100 100 100 100 100 100 100 100Source: FRA, 2013, 2018
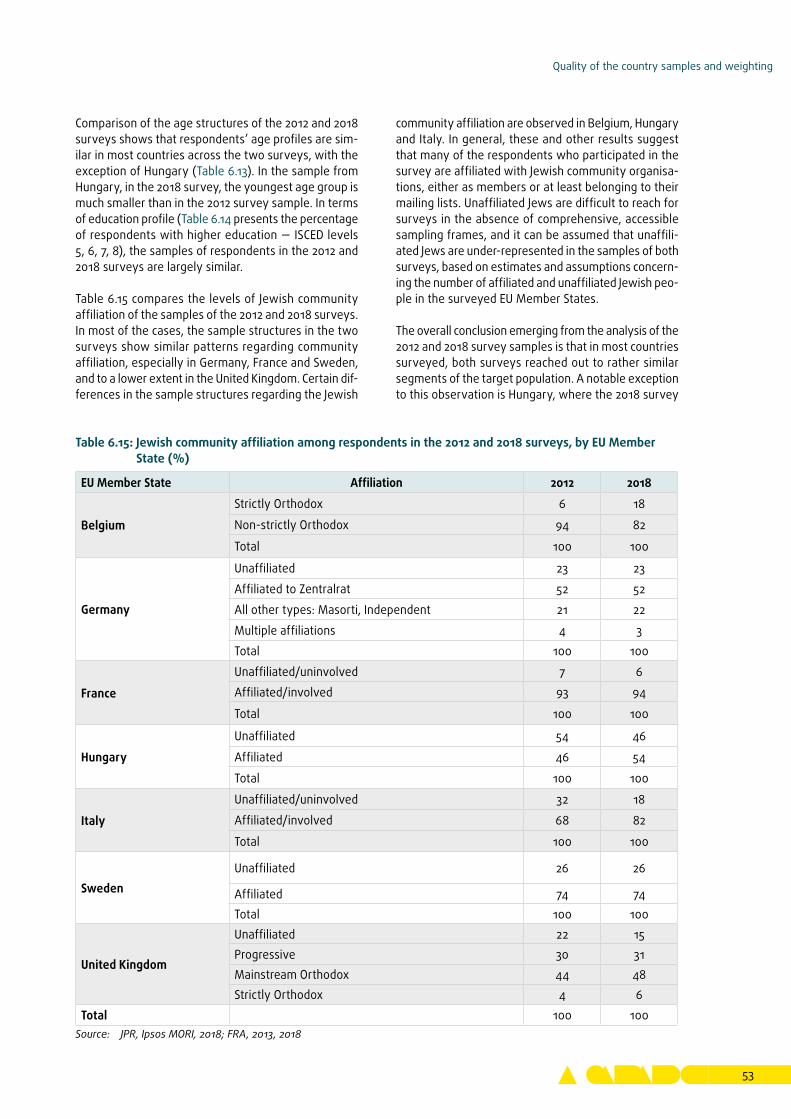
Quality of the country samples and weighting
53
Comparison of the age structures of the 2012 and 2018 surveys shows that respondents’ age profiles are sim-ilar in most countries across the two surveys, with the exception of Hungary (Table 6.13). In the sample from Hungary, in the 2018 survey, the youngest age group is much smaller than in the 2012 survey sample. In terms of education profile (Table 6.14 presents the percentage of respondents with higher education — ISCED levels 5, 6, 7, 8), the samples of respondents in the 2012 and 2018 surveys are largely similar.
Table 6.15 compares the levels of Jewish community affiliation of the samples of the 2012 and 2018 surveys. In most of the cases, the sample structures in the two surveys show similar patterns regarding community affiliation, especially in Germany, France and Sweden, and to a lower extent in the United Kingdom. Certain dif-ferences in the sample structures regarding the Jewish
community affiliation are observed in Belgium, Hungary and Italy. In general, these and other results suggest that many of the respondents who participated in the survey are affiliated with Jewish community organisa-tions, either as members or at least belonging to their mailing lists. Unaffiliated Jews are difficult to reach for surveys in the absence of comprehensive, accessible sampling frames, and it can be assumed that unaffili-ated Jews are under-represented in the samples of both surveys, based on estimates and assumptions concern-ing the number of affiliated and unaffiliated Jewish peo-ple in the surveyed EU Member States.
The overall conclusion emerging from the analysis of the 2012 and 2018 survey samples is that in most countries surveyed, both surveys reached out to rather similar segments of the target population. A notable exception to this observation is Hungary, where the 2018 survey
Table 6.15: Jewish community affiliation among respondents in the 2012 and 2018 surveys, by EU Member State (%)
EU Member State Affiliation 2012 2018
Belgium
Strictly Orthodox 6 18
Non-strictly Orthodox 94 82
Total 100 100
Germany
Unaffiliated 23 23
Affiliated to Zentralrat 52 52
All other types: Masorti, Independent 21 22
Multiple affiliations 4 3
Total 100 100
France
Unaffiliated/uninvolved 7 6
Affiliated/involved 93 94
Total 100 100
Hungary
Unaffiliated 54 46
Affiliated 46 54
Total 100 100
Italy
Unaffiliated/uninvolved 32 18
Affiliated/involved 68 82
Total 100 100
SwedenUnaffiliated 26 26
Affiliated 74 74Total 100 100
United Kingdom
Unaffiliated 22 15Progressive 30 31Mainstream Orthodox 44 48Strictly Orthodox 4 6
Total 100 100Source: JPR, Ipsos MORI, 2018; FRA, 2013, 2018
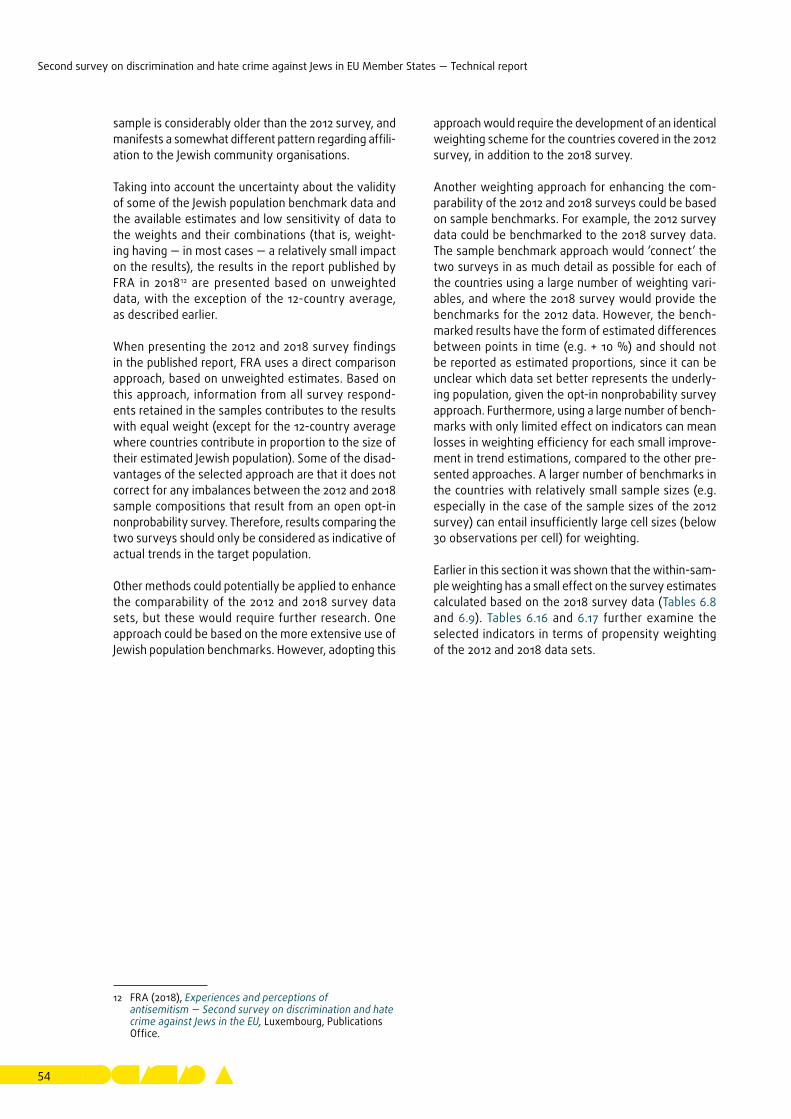
Second survey on discrimination and hate crime against Jews in EU Member States — Technical report
54
sample is considerably older than the 2012 survey, and manifests a somewhat different pattern regarding affili-ation to the Jewish community organisations.
Taking into account the uncertainty about the validity of some of the Jewish population benchmark data and the available estimates and low sensitivity of data to the weights and their combinations (that is, weight-ing having — in most cases — a relatively small impact on the results), the results in the report published by FRA in 201812 are presented based on unweighted data, with the exception of the 12-country average, as described earlier.
When presenting the 2012 and 2018 survey findings in the published report, FRA uses a direct comparison approach, based on unweighted estimates. Based on this approach, information from all survey respond-ents retained in the samples contributes to the results with equal weight (except for the 12-country average where countries contribute in proportion to the size of their estimated Jewish population). Some of the disad-vantages of the selected approach are that it does not correct for any imbalances between the 2012 and 2018 sample compositions that result from an open opt-in nonprobability survey. Therefore, results comparing the two surveys should only be considered as indicative of actual trends in the target population.
Other methods could potentially be applied to enhance the comparability of the 2012 and 2018 survey data sets, but these would require further research. One approach could be based on the more extensive use of Jewish population benchmarks. However, adopting this
12 FRA (2018), Experiences and perceptions of antisemitism — Second survey on discrimination and hate crime against Jews in the EU, Luxembourg, Publications Office.
approach would require the development of an identical weighting scheme for the countries covered in the 2012 survey, in addition to the 2018 survey.
Another weighting approach for enhancing the com-parability of the 2012 and 2018 surveys could be based on sample benchmarks. For example, the 2012 survey data could be benchmarked to the 2018 survey data. The sample benchmark approach would ‘connect’ the two surveys in as much detail as possible for each of the countries using a large number of weighting vari-ables, and where the 2018 survey would provide the benchmarks for the 2012 data. However, the bench-marked results have the form of estimated differences between points in time (e.g. + 10 %) and should not be reported as estimated proportions, since it can be unclear which data set better represents the underly-ing population, given the opt-in nonprobability survey approach. Furthermore, using a large number of bench-marks with only limited effect on indicators can mean losses in weighting efficiency for each small improve-ment in trend estimations, compared to the other pre-sented approaches. A larger number of benchmarks in the countries with relatively small sample sizes (e.g. especially in the case of the sample sizes of the 2012 survey) can entail insufficiently large cell sizes (below 30 observations per cell) for weighting.
Earlier in this section it was shown that the within-sam-ple weighting has a small effect on the survey estimates calculated based on the 2018 survey data (Tables 6.8 and 6.9). Tables 6.16 and 6.17 further examine the selected indicators in terms of propensity weighting of the 2012 and 2018 data sets.
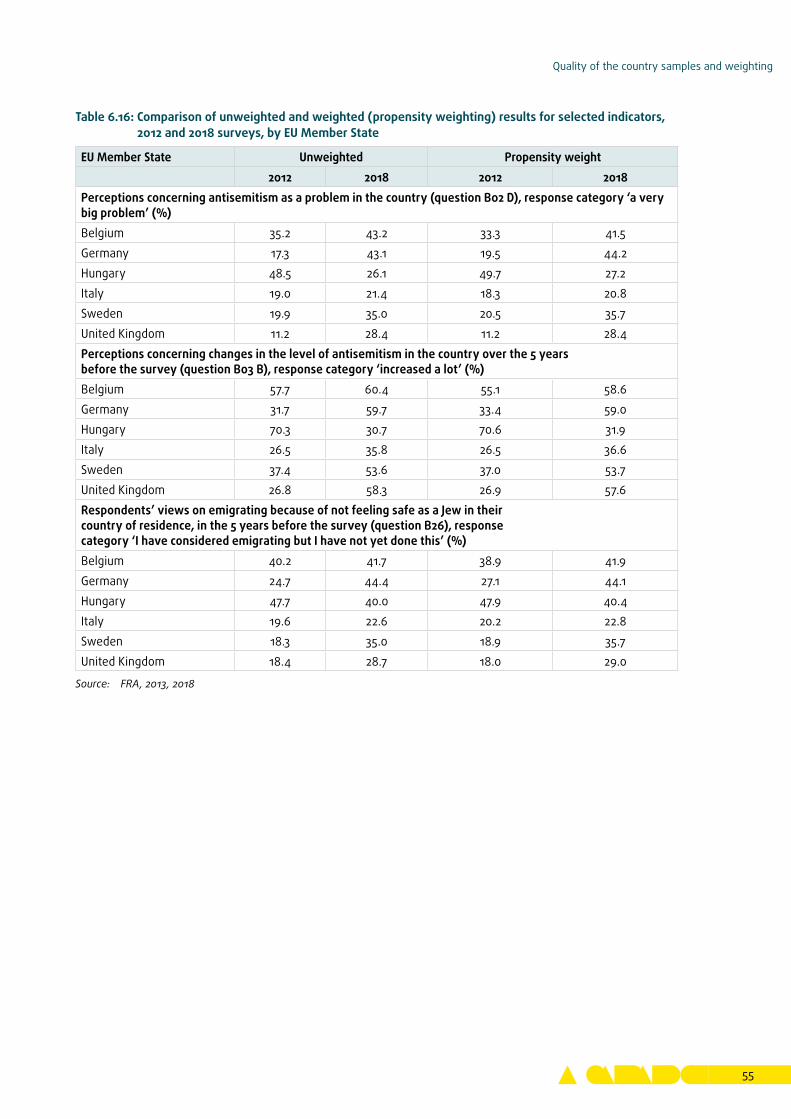
Quality of the country samples and weighting
55
Table 6.16: Comparison of unweighted and weighted (propensity weighting) results for selected indicators, 2012 and 2018 surveys, by EU Member State
EU Member State Unweighted Propensity weight2012 2018 2012 2018
Perceptions concerning antisemitism as a problem in the country (question B02 D), response category ‘a very big problem’ (%)Belgium 35.2 43.2 33.3 41.5Germany 17.3 43.1 19.5 44.2Hungary 48.5 26.1 49.7 27.2Italy 19.0 21.4 18.3 20.8Sweden 19.9 35.0 20.5 35.7United Kingdom 11.2 28.4 11.2 28.4Perceptions concerning changes in the level of antisemitism in the country over the 5 years before the survey (question B03 B), response category ‘increased a lot’ (%)Belgium 57.7 60.4 55.1 58.6Germany 31.7 59.7 33.4 59.0Hungary 70.3 30.7 70.6 31.9Italy 26.5 35.8 26.5 36.6Sweden 37.4 53.6 37.0 53.7United Kingdom 26.8 58.3 26.9 57.6Respondents’ views on emigrating because of not feeling safe as a Jew in their country of residence, in the 5 years before the survey (question B26), response category ‘I have considered emigrating but I have not yet done this’ (%)Belgium 40.2 41.7 38.9 41.9Germany 24.7 44.4 27.1 44.1Hungary 47.7 40.0 47.9 40.4Italy 19.6 22.6 20.2 22.8Sweden 18.3 35.0 18.9 35.7United Kingdom 18.4 28.7 18.0 29.0
Source: FRA, 2013, 2018
Second survey on discrimination and hate crime against Jews in EU Member States — Technical report
56
Table 6.17: Comparison of unweighted and weighted (propensity weighting) results for selected indicators, 2012 and 2018 surveys, by EU Member State
EU Member State Unweighted Propensity weight2012 2018 2012 2018
Prevalence of antisemitic harassment (at least one out of six forms), in the 5 years before the survey (%) (*)Belgium 38.4 50.5 40.4 50.6Germany 35.7 52.4 38.0 52.5Hungary 42.8 34.7 42.4 33.1Italy 32.8 36.4 33.3 36.9Sweden 32.8 39.8 33.8 41.1United Kingdom 29.0 34.3 29.0 35.0Respondents who did not report the most serious incident of antisemitic harassment in the 5 years before the survey to any authority or service (%)Belgium 73.1 81.4 72.9 81.7Germany 71.2 79.0 70.9 78.5Hungary 89.9 87.9 90.6 87.8Italy 77.3 76.6 81.8 76.1Sweden 74.6 80.6 75.1 80.4United Kingdom 71.1 76.5 71.3 76.1
(*) For comparative purposes, the 2018 prevalence rate was recalculated compared with the prevalence rate of harass-ment presented in the survey results report. The rate used above is limited to five forms of harassment — excluding ‘made offensive gestures to you or stared at you inappropriately’, because this form of harassment was not asked about in the 2012 survey.
Source: FRA, 2013, 2018
Table 6.18: Weighting efficiency for propensity weights, for trends in the 2012 and 2018 surveys, by EU Member State
EU Member State 2012 2018Belgium 0.599 0.395Germany 0.805 0.588Hungary 0.913 0.832Italy 0.650 0.367Sweden 0.941 0.870United Kingdom 0.926 0.869
Source: FRA, 2013, 2018
The comparison of the selected indicators for both the 2012 and 2018 surveys data shows that, in general, the percentage values concerning perceptions and
experiences of antisemitism among Jews across the examined countries tend to go up more frequently than down. Tables 6.16 and 6.17 show that weighting the results using propensity weighting confirms in a major-ity of cases the trends that could be observed based on unweighted results. It is important to mention that the propensity weights are based on only one type of auxiliary variable — the participation propensity based on recruitment channel, but not age, gender or com-munity affiliation. Based on the discussion earlier in this report concerning the outcomes of the within-sample weighting of the 2018 survey, it is reasonable to expect that no reliable weighting scheme would significantly alter the observed trends and, at least at the country level, different weighting approaches do not have a big impact on the survey findings.
57
7 Awareness-raising activities
This chapter describes the measures taken to dissemi-nate information about the survey in order to reach as large and diverse a sample of respondents as possible in each of the 13 EU Member States. The activities adopted for this purpose build upon the experiences gathered during the implementation of FRA’s 2012 survey and the need to take further efforts to involve and include segments of the target population that are otherwise at risk of remaining under-represented.
7�1� Background researchIn the early stages of implementing the 2018 survey, FRA requested the survey contractors to compile a background research report that outlines the char-acteristics of the Jewish population in each of 13 EU Member States included in the survey — Austria, Bel-gium, Denmark, France, Germany, Hungary, Italy, Lat-via, the Netherlands, Poland, Spain, Sweden and the United Kingdom. The report informed the finalisation of the detailed awareness-raising plans and activities for each country surveyed.
The background research focused on the two follow-ing aspects in each of the countries: (i) socio-demo-graphic data about the Jewish population of the country to inform the survey distribution strategy and to later assess the sample quality; and (ii) information about key Jewish organisations and facilities to be used to publicise the survey and distribute the survey weblink. The background research report provided a mapping of the socio-demographic and communal structures of the Jewish communities in each country, as a basis for quality-control measures and weighting of the data set. It also prepared the ground for and helped in deter-mining the focus of the needed awareness-raising activities. The data and information contained in the
background research report constituted a detailed por-trait of the Jewish populations of the 13 EU Member States, drawing from as recent and as comprehensive information as possible.
The background research and simultaneous local con-sultations with the Jewish communities confirmed that the quality and scope of the data available about the Jewish population differ significantly across the Mem-ber States. Also, in some countries such data were gathered recently, whereas in others the most rele-vant sources were a decade or two old. For example, extensive research has been undertaken on Jews in the United Kingdom, including the collection of data on religious groups by government agencies and the national census while, by contrast, in Belgium and Spain very little relevant research has been carried out and data on Jews are practically unavailable. In cases of clear lack of information concerning the local Jewish population, JPR organised visits to the country commu-nities to identify community sources to construct initial socio-demographic portraits, informed by community registers or lists of organisations, and to establish rela-tionships with information providers.
7�2� Awareness-raising strategy
The awareness raising about the survey aimed to ensure that Jews in each of the surveyed EU Member States were made aware of the survey, across all age bands, genders, denominational groupings and geographical areas, that they were positively predisposed to it and able to access the weblink in order to complete the questionnaire. The awareness-raising activities began at the very start of the project and intensified before
Second survey on discrimination and hate crime against Jews in EU Member States — Technical report
58
the launch of the survey in May 2018, continuing over the course of the fieldwork phase.
The main communications work for the survey was concentrated over a short period of time — beginning just over 2 weeks before the survey launch (start of data collection), and ending 2 weeks afterwards. Evi-dence from previous online surveys demonstrates that the vast majority of responses occur over the first 2 weeks of the fieldwork, particularly in response to the launch email and first follow-up email. The efforts made to maximise the impact of awareness-raising activities during this period proved to be successful, as the progress of the 2018 survey fieldwork confirms. In total, 8 weeks were planned for the fieldwork so as to allow adequate time to make an early assessment of the fieldwork outcomes and, if necessary, to adjust the communications strategy to rectify any problems that might arise.
The entire awareness-raising process can be subdi-vided into three main phases, with work starting well in advance of the actual fieldwork. The first phase focused on establishing the full picture of communal segmen-tation in terms of its socio-demographic characteristics and Jewish identity dimensions, evaluating the quality of the sources of information on the socio-demographic characteristics of Jewish communities and mapping of communal organisations in each Member State.
The second phase covered the development of the awareness-raising plan, with a focus on establishing contacts with the Jewish organisations in the surveyed countries, introducing the survey to them, studying the scope of operations and the reach of these organisa-tions’ communications mechanisms, identifying and accessing new sources of information and data about each community, and securing their cooperation in dis-tributing notifications about, and invitations to partici-pate in the survey to their membership lists.
During the third phase, which started with the launch of the survey on 9 May 2018, the progress of the survey data collection was closely monitored in order to assess the size and composition of the samples achieved in each survey country. Once the main promotional strat-egy had been rolled out in the first 3 weeks of the fieldwork, further awareness-raising work was under-taken both with existing contacts and new ones, with a particular focus on improving response levels among specific segments of the Jewish populations that were at risk of being under-represented.
7�2�1 The first phase: mapping the Jewish communal landscape across the selected EU Member States
The first phase of the awareness-raising activities aimed to build a list of key personalities and organisa-tions in the Jewish communities in each survey country. This work was done by the JPR team and partly by the NRE assigned to each country. The following three key questions guided this process.
1 Who are the key players within each Jewish com-munity who: (a) need to know that this survey is taking place due to their prominent communal/political posi-tion; and (b) are well placed to help garner support for the survey across all levels of community leadership?
2 Which organisations within each Jewish community play the key umbrella role(s), representing either the entire Jewish community or significant parts of it, and whose support may be key to ensuring the success of the survey?
3 Which organisations, media outlets or initiatives within each community hold the best and most exten-sive email lists, and who may be well placed to help distribute the survey link to different segments of the Jewish population?
Whilst the initial work helped JPR to identify most of the key individuals and organisations, this was treated as an iterative process. The JPR team sharpened and amended their target lists as they contacted each indi-vidual and entered into discussions with him or her, gaining more knowledge about the situation in each country and improving their understanding as the process went along.
7�2�2 The second phase: reaching out to the Jewish communities in the selected EU Member States
Meeting key players
In the course of rolling out the awareness-raising strategy, the JPR team organised visits to Jewish com-munities in Belgium, France, Germany, Hungary, the Netherlands, Poland and Spain, meeting key figures in Brussels, Antwerp, Paris, Berlin, Budapest, Amsterdam, Warsaw, Madrid and Barcelona. In addition, JPR took
Awareness-raising activities
59
advantage of the visit to Vienna for the project inception meeting to meet with Austrian Jewish community lead-ers. Most of JPR’s awareness-raising work in the United Kingdom was accomplished through meetings, emails and telephone calls, due to the contractor’s familiarity with the British Jewish communal landscape and the fact that the JPR office is located in London. For the visits, priority was given to the countries where neither the NRE could ensure, at the outset, significant engage-ment with and the support of key players in the Jewish community, nor did JPR have existing connections with key figures or a strong understanding of community structures and issues. Input of the NREs in Austria, Italy and Latvia, and close cooperation with the community liaison persons in Denmark and Sweden, was crucial to support the survey and encourage participation. Where it was deemed necessary, JPR organised add-itional visits, for example, to Paris (due to the size and importance of the French Jewish community), Antwerp (due to particular concerns about accessing the strictly Orthodox community), Brussels (a seminar for ‘student ambassadors’ of the survey, funded by the European Commission) and Budapest (to meet directly with key Jewish community figures in Hungary).
In total, during the country visits, the JPR team met directly with 136 individuals and the organisations they represent. These meetings were part of the awareness-raising work undertaken in this project. During the meetings, information about the survey and its signifi-cance was provided, and the importance of the survey link reaching the email inbox of different segments of the Jewish population (in terms of their age, gender, community affiliation, place of residence) in each coun-try was stressed. The focus was given on mapping the resources of communal organisations that could be used for the distribution of the survey weblink, i.e. under-standing and recording details, wherever possible, of each organisation’s email database, Facebook groups and other information dissemination mechanisms, to assess each organisation’s capacity to disseminate the survey link.
Also, the meeting participants were asked for their active support in publicising the survey, for exam-ple, sending out in total four emails and/or notices to closed Facebook or WhatsApp groups they had access to: one on the day of the launch of the survey data collection; two follow-up reminders; and, if possible, one pre-notification before the launch informing poten-tial respondents to look out for the launch day notice. Whilst different organisations had different capacities
to spread the message, the ideal plan presented to each organisation was to work in accordance with the following schedule.
1. Launch day email: Wednesday 9 May 2018.
2. First follow-up reminder email: Tuesday 15 May 2018.
3. Second follow-up reminder email: Wednesday 23 May 2018.
The additional, pre-launch email, scheduled for Fri-day 4 May, was presented to each organisation as a supplementary option for those willing to send it. The content of the emails was pre-prepared and made available to the organisations in all survey languages.
Each meeting and contact was subsequently followed up, several times, in order to gather more detailed infor-mation about the nature of the membership and the potential reach of each organisation, and to secure the specific practical support required.
The meetings held across the surveyed EU Member States were helpful for several reasons. Firstly, they enabled the Jewish communities and their leaders in the countries to become aware of the survey, and to meet some of the key members of the team involved in running it. This helped the communities to realise the value of the survey and their opportunity to contribute to the collection of valuable information, flagging up any concerns they might have about antisemitism. It also allowed discussion of the issues around survey messaging and helped to fine-tune it.
In addition to online communication, hard-copy flyers, posters and announcements were printed to be distrib-uted in synagogues, other related venues and events. JPR also established the following ideal timeline for any additional communications work that took place in certain instances.
1. Posters/flyers in community buildings: from the week commencing 30 April 2018.
2. Press op-eds: weeks commencing 30 April; 7 May 2018.
3. Public community announcements: Shabbat, 4 and 5 May, 11 and 12 May, 18 and 19 May; Shavuot, 19-21 May 2018.
Second survey on discrimination and hate crime against Jews in EU Member States — Technical report
60
4. Website banners: from the week commencing 7 May 2018.
5. Adverts in Jewish press: weeks commencing 7 May; 14 May 2018.
However, determining precisely what action would be taken in each instance depended heavily on the capac-ity and willingness of each individual/organisation, and the distribution channels they were able to access and use. In certain instances, approval for any action at all needed to be secured from community authorities, so additional awareness-raising work with such authori-ties, conducted by phone or Skype, was required in the weeks following the meetings. Some organisations were able to reach large numbers of Jews directly and sent out multiple emails. Others with similar lists were only willing to send out one or two emails. Others were simply prepared to post a clickable notice about the sur-vey as a banner on their website or include information about it in an e-newsletter. Some organisations were best placed to notify the leaders of constituent organi-sations about the survey, so were, in effect, supporting the communications plan by asking those individuals to distribute the survey link on to their members. Others only worked with hard-copy distribution systems, so any notices or articles about the survey had to fit around their publication schedules.
The awareness-raising activities required different approaches in each surveyed country to establish a spe-cific agreement with each organisation or key stake-holder, and to provide their contacts with the practical support for the implementation, including the produc-tion of the emails, adverts, web banners, flyers and posters to the specifications required in each case. This also involved a lot of communication and practical inter-actions on such issues as talking through exactly what tasks were required; reminding about specific actions to be taken on specific dates; ensuring that the launch-day emails and reminder emails and the weblinks embed-ded in them were correct and worked within different organisational systems; testing those emails; li aising with the organisations’ IT people to resolve any tech-nical issues; arranging for adverts and articles to be placed in the press; and producing and distributing posters and flyers to Jewish organisations as required.
7�2�3 The third phase: the supplementary strategy in relation to the samples achieved
Having revised the map of the Jewish communal organi-sations and the preliminary results of the awareness-raising activities at hand, JPR prepared to supplement the distribution strategy with a targeted mail-out of smaller Jewish synagogues, Jewish community centres
and cultural organisations in each surveyed Member State. Not all Jewish organisations and individuals are necessarily attentive to messages or directives com-ing from the main Jewish organisations. JPR believed that this strategy of a supplementary targeted mail-out could be particularly important in relation to geographi-cally dispersed Jewish communities, such as in Germany and France. In these countries, which also have some of the largest Jewish communities, there are a significant number of smaller Jewish organisations and networks simply as a side effect of the population size.
In undertaking this work, JPR examined communal directories of the Jewish communities in Belgium, France, Germany and the United Kingdom and accu-mulated hundreds of email addresses of synagogues, community centres, schools, individuals, rabbis and community leaders. They were to be contacted from the second or third week of the fieldwork onwards, for about 3 weeks if required, upon review of the achieved samples at that stage. The waiting period was advisable in order to avoid confusion in messaging and instruc-tions, as some of the organisations reached through the supplementary mail-out were also expected to be reached indirectly through the main mail-out. This maximised the chances of the organisations acting in a straightforward manner on the original set of instruc-tions, without comparing and questioning messages from two different sources. The delayed targeted mail-out then aimed to reach out to the organisations that overlooked/disregarded the main mail-out or were not captured by it — most notably targeting the geographi-cally and denominationally under-represented at that point in time.
In addition, towards the end of the fieldwork, the ‘last chance’ email was activated in some countries (e.g. Austria, Denmark, Germany, Hungary, the Nether-lands, Poland, Spain, Sweden) through the organisa-tions involved in the original campaign, both to notify respondents that the survey was about to close, and to try to optimally bolster response levels.
7�2�4 Under-represented segments of the Jewish population in the survey sample
The 2012 FRA survey proved that certain segments of the Jewish population are more difficult to reach out to, notably, the youngest respondents (students, young people), women, those unaffiliated to the Jewish organ-isations and the strictly Orthodox. Certain plans and measures were put in place to try to overcome some of these challenges in the 2018 survey.
In addition to the meetings with youth and student lead-ers and activists on each visit to the survey countries,
Awareness-raising activities
61
a seminar in partnership with the European Union of Jewish Students for ‘student ambassadors’ to the survey was held in Brussels, in April 2018, with funding from the European Commission. The main goal of the day was for each pair of students from each survey country to devise their own awareness-raising campaign for Jewish students and young adults in their country.
Following extensive consultations with the leaders of and experts in strictly Orthodox Jewish communal life, online and printed newspaper advertising in specific strictly Orthodox outlets combined with some use of email databases were used to reach out to this segment. In the course of the consultations and awareness-raising activities, JPR received some indications that the strictly Orthodox leadership was more positively inclined towards the survey than it was in 2012. However, during the course of the fieldwork, for example, the response levels were low in Antwerp — the key centre of the strictly Orthodox Jewish population in Belgium. JPR decided to visit Antwerp for follow-up work to identify any further mechanisms that might help to reach that group. This led to a valuable text messaging list, the administrator of which JPR contacted and established an agreement to activate that list three times over a 2-week period, resulting in significant improvements in response levels from that particular community.
According to the survey contractor, the unaffiliated segment of the Jewish population is both difficult to define and to reach out to. JPR worked to establish links with organisations whose work focuses on reaching the smaller parts of the Jewish community — particularly social, cultural and sporting organisations — and also encouraged all the survey respondents to refer the sur-vey on to other Jews who may have had an interest. Possibly, they could be captured through the referral
process, given sufficient time for fieldwork. The mon-itoring of the fieldwork data showed that it took some more time until the word about the survey reached those unaffiliated to any Jewish organisations. Still, the affiliated Jews comprise the majorities of the samples of all surveyed countries (as discussed in Chapter 6).
Despite the under-representation of women in the 2012 FRA survey, JPR did not recommend addressing this through a special communication strategy, following their expectation that women’s representation should be more or less proportionate to their numbers in the population. The under-representation of women may be linked to their under-representation on communal membership lists, where households may sometimes list the male head as the sole representative. In general, the 2018 FRA survey reached out to proportionally more women than the 2012 survey, which might be impacted by the growth of women’s inclusion on Jewish commu-nal lists and communal agendas, both due to practical steps taken by organisations and to women’s capacity and willingness to put themselves forward. Still, in some of the surveyed countries relatively bigger gaps are observed regarding women representation (for further details see Chapter 6 on sample composition).
However, in order to encourage the respondents to for-ward the message about the survey to potential other respondents, the email’s text ‘In addition to completing the survey yourself, please forward this email on to eli-gible Jewish friends, family members and colleagues to encourage them to participate too’, was supplemented with the following addition: ‘We are particularly keen to reach young people aged 16-30/the strictly Orthodox/women/communally unengaged, and your support in forwarding this email to people you know within any of those categories would be greatly appreciated.’

63
8 Lessons learned
This technical report outlines in detail how the data for FRA’s second survey on discrimination and hate crime against Jews in EU Member States were collected and what measures were implemented to ensure high qual-ity and validity of the survey. Building on observations provided throughout this report as well as experience and knowledge gained from working on the project as a whole, this section provides a series of recom-mendations for future surveys on Jewish populations across the EU. The following points were observed in the course of the project and are deemed important to take into account when designing a survey on Jewish populations in the future.
Questionnaire review and adaptation
One of the key changes to the questionnaire and online survey tool for the second survey on discrimination and hate crime against Jews was the adoption of a design that is compatible across the most common and latest operating systems and also works on different types of devices (a device agnostic survey design). Whilst this was considered to be important given the growth in mobile internet usage in the European Union13, it required changing and adapting existing questions which had to be reviewed closely to minimise any implications for the measurement of trends over time when comparing questions that differ slightly from 2012 to 2018. However, the results show that respondents did use a variety of devices to complete the survey. Of all respondents in the final data set, 62 % completed the survey on their laptop or desktop computer, 29 % completed it on a smartphone and 9 % on a tablet. This suggests that adopting a device agnostic design has had a positive effect on participation rates — or at least ensured a better user experience for those opting
13 Eurostat (2018), Digital economy & society in the EU — A browse through our online world in figures.
to use their smartphone to complete the survey — and it is therefore recommended to use it for future online surveys, including research on the Jewish population.
Open link
The use of an open link to the survey was found to be beneficial because it ensured the anonymity of respondents, did not require the collection of sensi-tive data (e.g. email, registration in advance) and was easy to access.
Survey length
Concerns about the length of the survey were raised during the consultations and by participants during the usability testing. The data about the dropouts do not suggest that the length of the questionnaire was the main reason for some respondents’ decision to leave the survey before fully completing it. In contrast, the high proportion and level of detail provided in open-ended response questions at the end of the survey sug-gests that those who did take the time to complete the survey were engaged by the content. Although the survey participation rate was higher than anticipated, the reduction of the survey length, particularly when using an online methodology, should remain a consid-eration in the future.
Translations
Identifying sections for single and double translation is a good practice and a means of being efficient with resources. Also, the input and advice on the contextual Jewish terminology from the academics, as part of the survey contractor’s team, was critical.
Second survey on discrimination and hate crime against Jews in EU Member States — Technical report
64
Although the overall quality of the translated question-naires was good, it is worth discussing certain issues. The additional time taken to revise the questionnaire during the initial review and following the usability test-ing was essential, but it did reduce the amount of time available to produce the translations, review and apply them to the survey script in advance of the fieldwork. A shorter time period does increase the risk of error, therefore sufficient time needs to be allowed for all nec-essary steps to ensure the quality of the translations.
The need to ensure comparability between the 2012 and 2018 surveys and trend questions raised additional challenges as it was necessary to keep the translation as close to the original 2012 wording as possible for comparability, although the questions required review for a variety of reasons, including at times incorrect translation, outdated (archaic) wording or other reasons. Also, introducing new items into the questionnaire and their translations required an additional review of the language versions for the consistency of the question-naire as a whole, to ensure that the terms used in the new questions are in line with the language used in the existing questions. If the survey is to be repeated it might be useful to allow additional resources for a review of the existing translations to ensure their consistency and accuracy, particularly as language and usage evolves over time.
All the observations apply also to the additional mate-rials (e.g. information notes and messages related to awareness raising) used in the survey. For efficiency, the local researchers, who updated the translations, were instructed to only provide translations for new items and so they would not have reviewed existing translations. Whilst FRA is confident in the quality of the translations used in the survey, again, additional resources for a review of the existing translations to ensure their quality would not be wasted.
Lastly, it is worth discussing the availability of the sur-vey questionnaire in different languages. In the cur-rent survey, the language versions were attached to a specific country. However, FRA received feedback in relation to making the survey questionnaire available in more languages, for example, enabling respondents in all countries to also access the questionnaire in Eng-lish if they choose. Due to the minimal costs involved, and the potential benefits, it is worthy of consideration going forward. Also, use of Hebrew language could be reconsidered. The review of the translated materials and check of the script in Hebrew was quite resource intensive and requires additional expertise. However, the pick-up of the Hebrew versions by the respondents across the countries surveyed was quite low.
Scripting
Due to the length and complex routing, the question-naire was challenging to script (Section C, on experi-ences of harassment, in particular). Not only does this increase the time required to script and validate the survey, it also increases the risk of error in data collec-tion. The complexity of this section has also impacted the development of the key indicators as it requires complex programming to ascertain the correct values. Given the importance of this section, it is recommended that the structure of this section is reviewed and sim-plified in future surveys, while retaining comparability with earlier surveys.
Awareness-raising activities
The increased emphasis on awareness raising in the 2018 survey, in contrast with the 2012 survey, was one of the most important contributors to the significantly increased response levels achieved. Direct meetings with the community leaders and practitioners in their countries were especially beneficial and served to cre-ate high levels of support for and establish trust in the project across the countries surveyed. For any future surveys, depending on resources, consideration could be given to visits to all Member States covered (and potentially to more than one city, especially in the case of dispersed communities), which may serve to raise awareness about the survey.
Trend analysis
Trend analysis should be able to identify underlying patterns of opinions and experiences in a time series — in this case, between FRA’s 2012 and 2018 surveys on discrimination and hate crime against Jews in the EU, in the countries which were covered by both surveys.
As open opt-in nonprobability online surveys, neither the 2012 nor the 2018 survey could be based on the use of a comprehensive sampling frame that would enable drawing a national sample for which virtually everyone has a chance of being selected. Without such a frame, the sample of the target population covered by the nonprobability approach cannot be treated as representative of the target population.
To assess the trends in results between the 2012 and 2018 surveys, FRA carried out a detailed assessment of the quality of the samples achieved across the surveyed countries and explored several approaches to weight the data as presented in the technical report. Further steps, in this regard, could be explored.
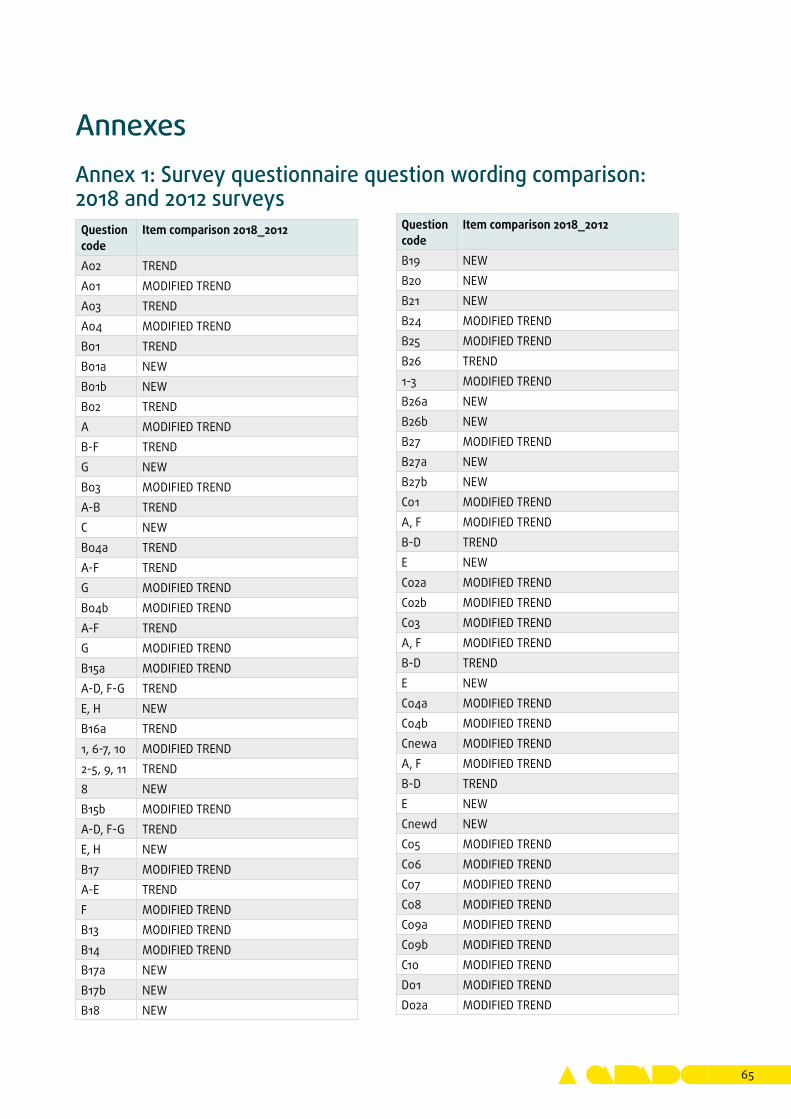
65
AnnexesAnnex 1: Survey questionnaire question wording comparison: 2018 and 2012 surveysQuestion code
Item comparison 2018_2012
A02 TRENDA01 MODIFIED TRENDA03 TRENDA04 MODIFIED TRENDB01 TRENDB01a NEWB01b NEWB02 TRENDA MODIFIED TRENDB-F TRENDG NEWB03 MODIFIED TRENDA-B TRENDC NEWB04a TRENDA-F TRENDG MODIFIED TRENDB04b MODIFIED TRENDA-F TRENDG MODIFIED TRENDB15a MODIFIED TRENDA-D, F-G TRENDE, H NEWB16a TREND1, 6-7, 10 MODIFIED TREND2-5, 9, 11 TREND8 NEWB15b MODIFIED TRENDA-D, F-G TRENDE, H NEWB17 MODIFIED TRENDA-E TRENDF MODIFIED TRENDB13 MODIFIED TRENDB14 MODIFIED TRENDB17a NEWB17b NEWB18 NEW
Question code
Item comparison 2018_2012
B19 NEWB20 NEWB21 NEWB24 MODIFIED TRENDB25 MODIFIED TRENDB26 TREND1-3 MODIFIED TRENDB26a NEWB26b NEWB27 MODIFIED TRENDB27a NEWB27b NEWC01 MODIFIED TRENDA, F MODIFIED TRENDB-D TRENDE NEWC02a MODIFIED TRENDC02b MODIFIED TRENDC03 MODIFIED TRENDA, F MODIFIED TRENDB-D TRENDE NEWC04a MODIFIED TRENDC04b MODIFIED TRENDCnewa MODIFIED TRENDA, F MODIFIED TRENDB-D TRENDE NEWCnewd NEWC05 MODIFIED TRENDC06 MODIFIED TRENDC07 MODIFIED TRENDC08 MODIFIED TRENDC09a MODIFIED TRENDC09b MODIFIED TRENDC10 MODIFIED TRENDD01 MODIFIED TRENDD02a MODIFIED TREND
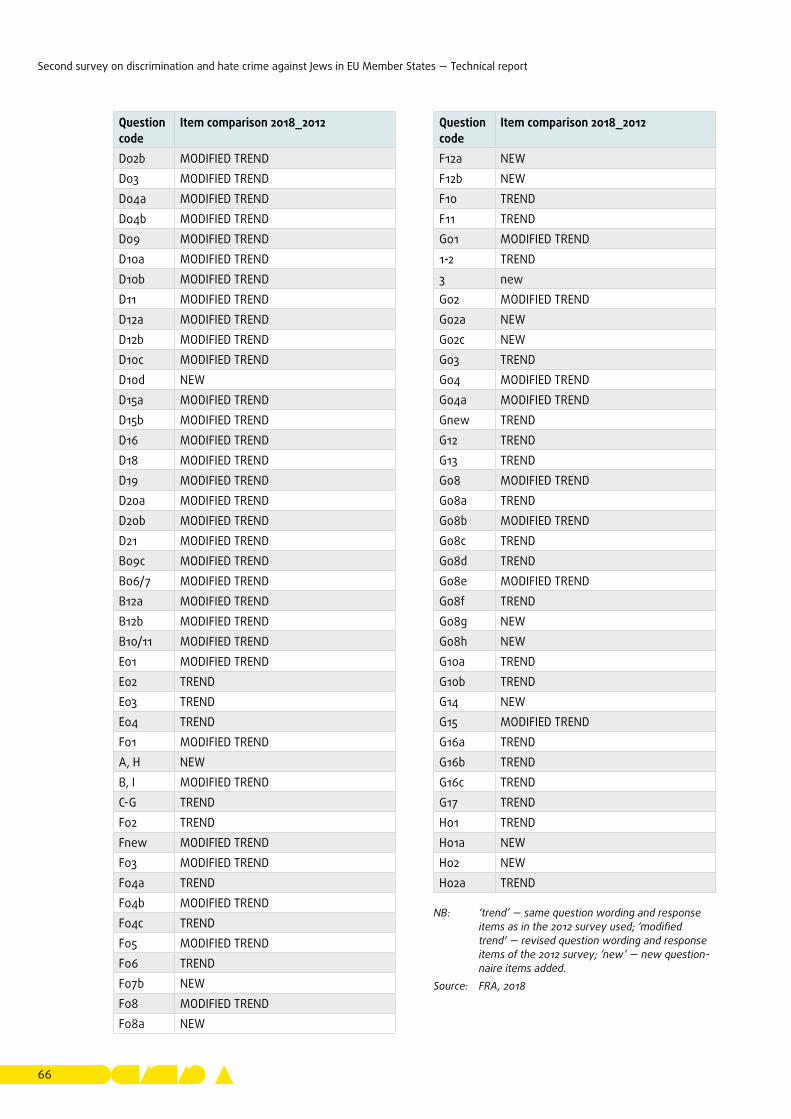
Second survey on discrimination and hate crime against Jews in EU Member States — Technical report
66
Question code
Item comparison 2018_2012
D02b MODIFIED TRENDD03 MODIFIED TRENDD04a MODIFIED TRENDD04b MODIFIED TRENDD09 MODIFIED TRENDD10a MODIFIED TRENDD10b MODIFIED TRENDD11 MODIFIED TRENDD12a MODIFIED TRENDD12b MODIFIED TRENDD10c MODIFIED TRENDD10d NEWD15a MODIFIED TRENDD15b MODIFIED TRENDD16 MODIFIED TRENDD18 MODIFIED TRENDD19 MODIFIED TRENDD20a MODIFIED TRENDD20b MODIFIED TRENDD21 MODIFIED TRENDB09c MODIFIED TRENDB06/7 MODIFIED TRENDB12a MODIFIED TRENDB12b MODIFIED TRENDB10/11 MODIFIED TRENDE01 MODIFIED TRENDE02 TRENDE03 TRENDE04 TRENDF01 MODIFIED TRENDA, H NEWB, I MODIFIED TRENDC-G TRENDF02 TRENDFnew MODIFIED TRENDF03 MODIFIED TRENDF04a TRENDF04b MODIFIED TRENDF04c TRENDF05 MODIFIED TRENDF06 TRENDF07b NEWF08 MODIFIED TRENDF08a NEW
Question code
Item comparison 2018_2012
F12a NEWF12b NEWF10 TRENDF11 TRENDG01 MODIFIED TREND1-2 TREND3 newG02 MODIFIED TRENDG02a NEWG02c NEWG03 TRENDG04 MODIFIED TRENDG04a MODIFIED TRENDGnew TRENDG12 TRENDG13 TRENDG08 MODIFIED TRENDG08a TRENDG08b MODIFIED TRENDG08c TRENDG08d TRENDG08e MODIFIED TRENDG08f TRENDG08g NEWG08h NEWG10a TRENDG10b TRENDG14 NEWG15 MODIFIED TRENDG16a TRENDG16b TRENDG16c TRENDG17 TRENDH01 TRENDH01a NEWH02 NEWH02a TREND
NB: ‘trend’ — same question wording and response items as in the 2012 survey used; ‘modified trend’ — revised question wording and response items of the 2012 survey; ‘new’ — new question-naire items added.
Source: FRA, 2018
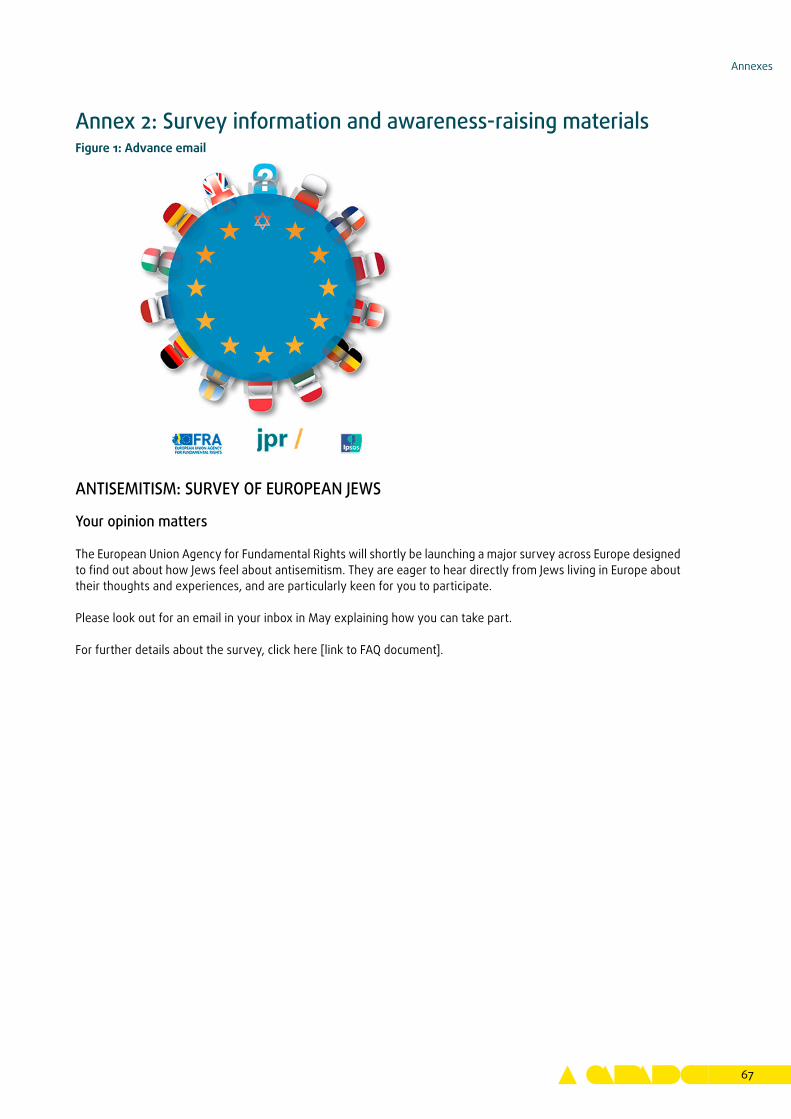
Annexes
67
Annex 2: Survey information and awareness-raising materialsFigure 1: Advance email
ANTISEMITISM: SURVEY OF EUROPEAN JEWS
Your opinion matters
The European Union Agency for Fundamental Rights will shortly be launching a major survey across Europe designed to find out about how Jews feel about antisemitism. They are eager to hear directly from Jews living in Europe about their thoughts and experiences, and are particularly keen for you to participate.
Please look out for an email in your inbox in May explaining how you can take part.
For further details about the survey, click here [link to FAQ document].
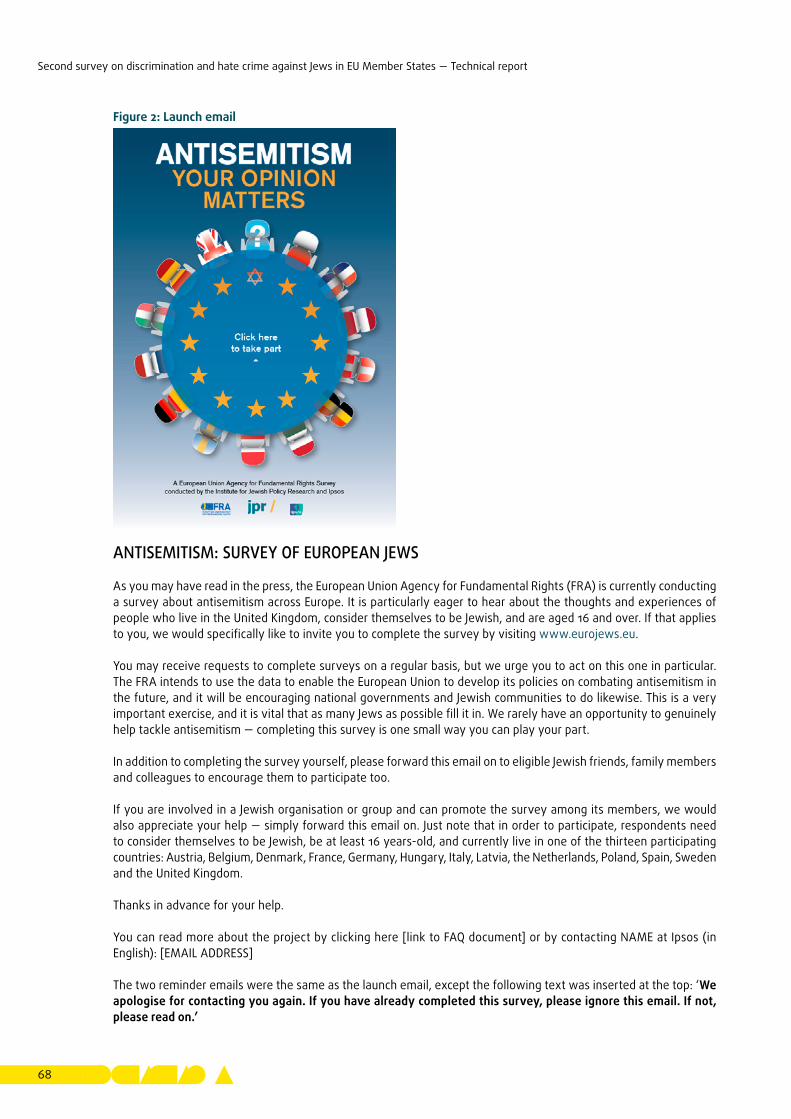
Second survey on discrimination and hate crime against Jews in EU Member States — Technical report
68
Figure 2: Launch email
ANTISEMITISM: SURVEY OF EUROPEAN JEWS
As you may have read in the press, the European Union Agency for Fundamental Rights (FRA) is currently conducting a survey about antisemitism across Europe. It is particularly eager to hear about the thoughts and experiences of people who live in the United Kingdom, consider themselves to be Jewish, and are aged 16 and over. If that applies to you, we would specifically like to invite you to complete the survey by visiting www.eurojews.eu.
You may receive requests to complete surveys on a regular basis, but we urge you to act on this one in particular. The FRA intends to use the data to enable the European Union to develop its policies on combating antisemitism in the future, and it will be encouraging national governments and Jewish communities to do likewise. This is a very important exercise, and it is vital that as many Jews as possible fill it in. We rarely have an opportunity to genuinely help tackle antisemitism — completing this survey is one small way you can play your part.
In addition to completing the survey yourself, please forward this email on to eligible Jewish friends, family members and colleagues to encourage them to participate too.
If you are involved in a Jewish organisation or group and can promote the survey among its members, we would also appreciate your help — simply forward this email on. Just note that in order to participate, respondents need to consider themselves to be Jewish, be at least 16 years-old, and currently live in one of the thirteen participating countries: Austria, Belgium, Denmark, France, Germany, Hungary, Italy, Latvia, the Netherlands, Poland, Spain, Sweden and the United Kingdom.
Thanks in advance for your help.
You can read more about the project by clicking here [link to FAQ document] or by contacting NAME at Ipsos (in English): [EMAIL ADDRESS]
The two reminder emails were the same as the launch email, except the following text was inserted at the top: ‘We apologise for contacting you again. If you have already completed this survey, please ignore this email. If not, please read on.’
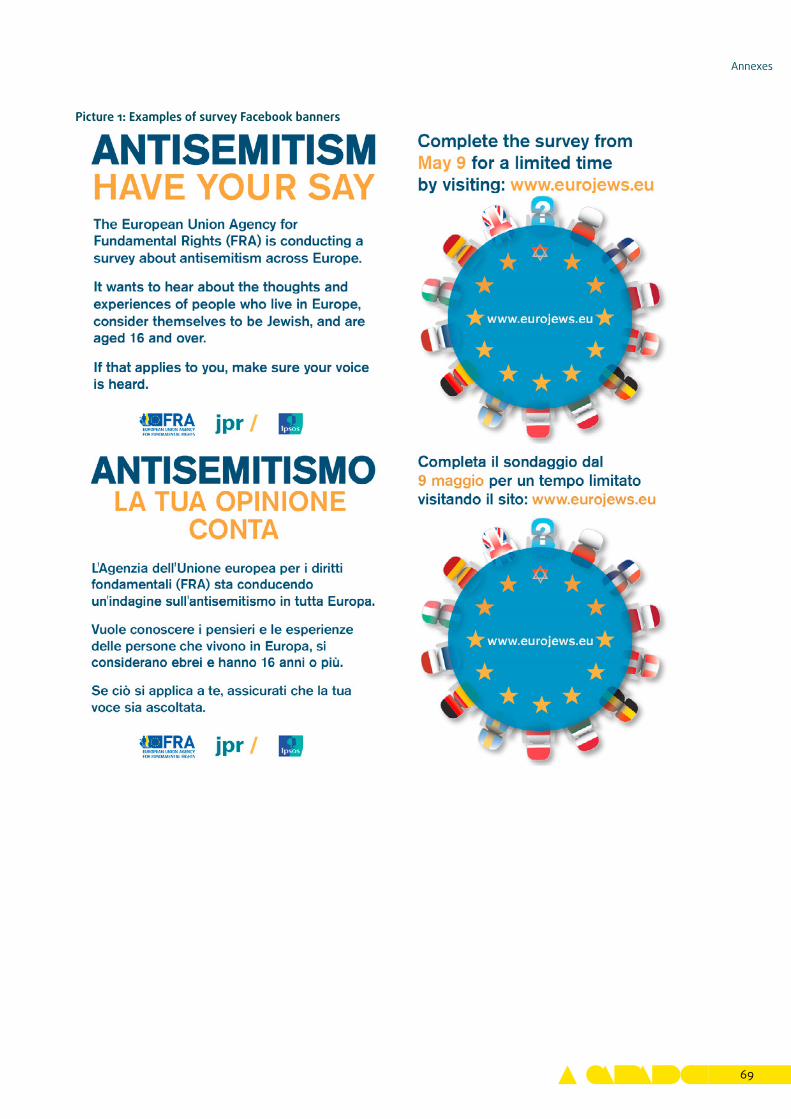
Annexes
69
Picture 1: Examples of survey Facebook banners
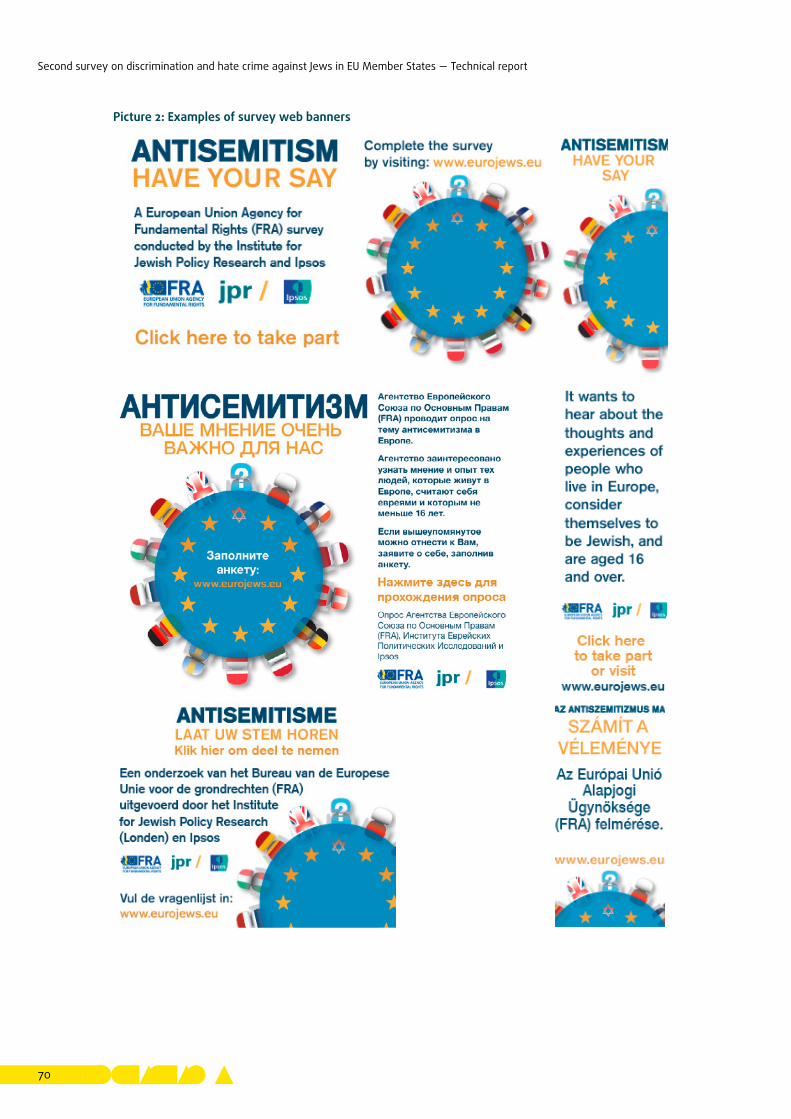
Second survey on discrimination and hate crime against Jews in EU Member States — Technical report
70
Picture 2: Examples of survey web banners
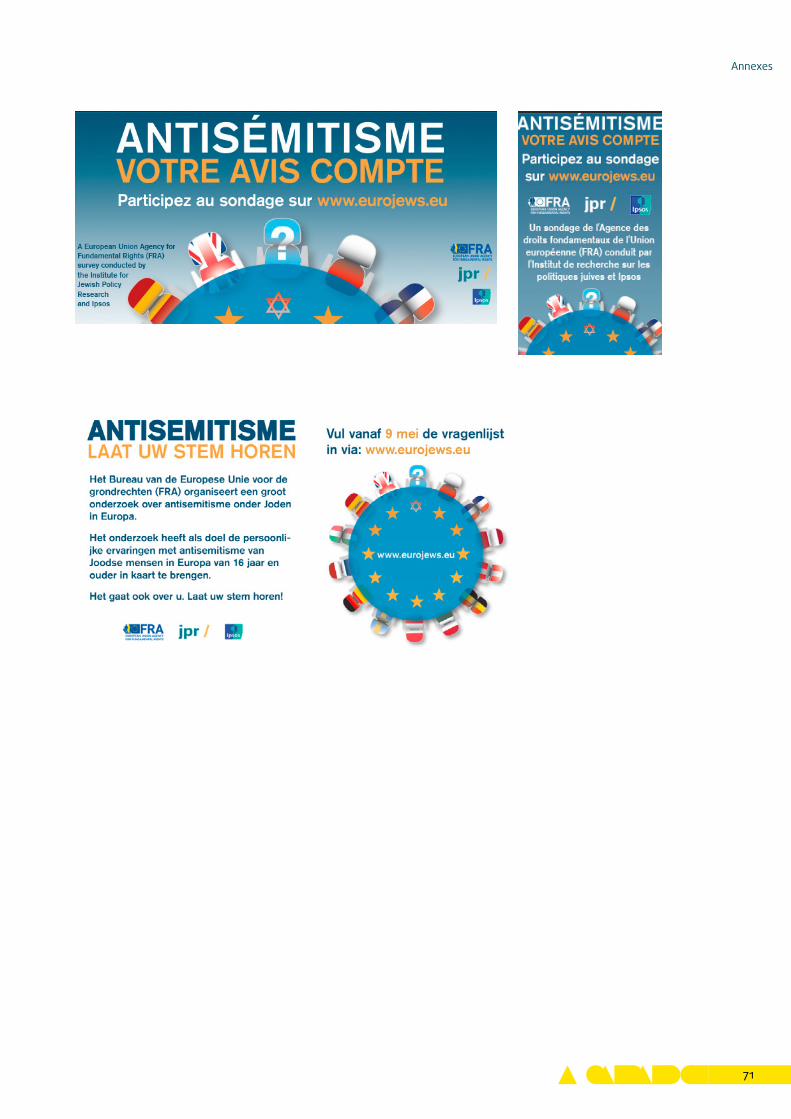
Annexes
71
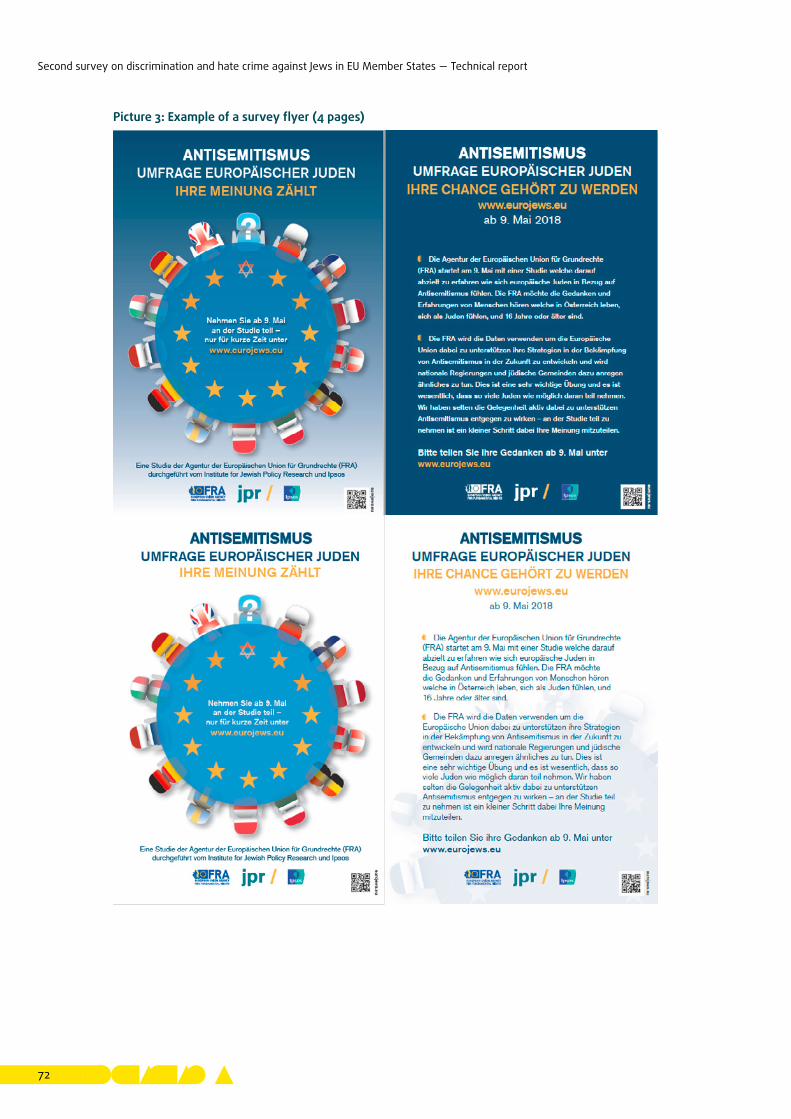
Second survey on discrimination and hate crime against Jews in EU Member States — Technical report
72
Picture 3: Example of a survey flyer (4 pages)
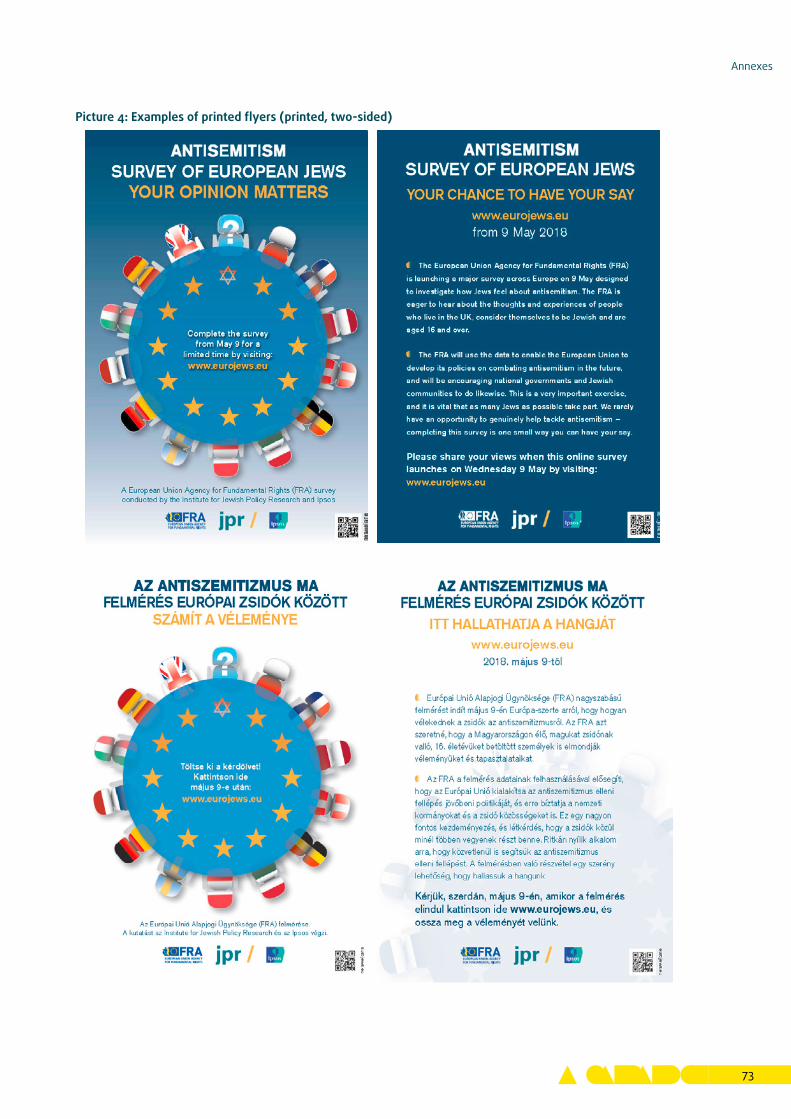
Annexes
73
Picture 4: Examples of printed flyers (printed, two-sided)
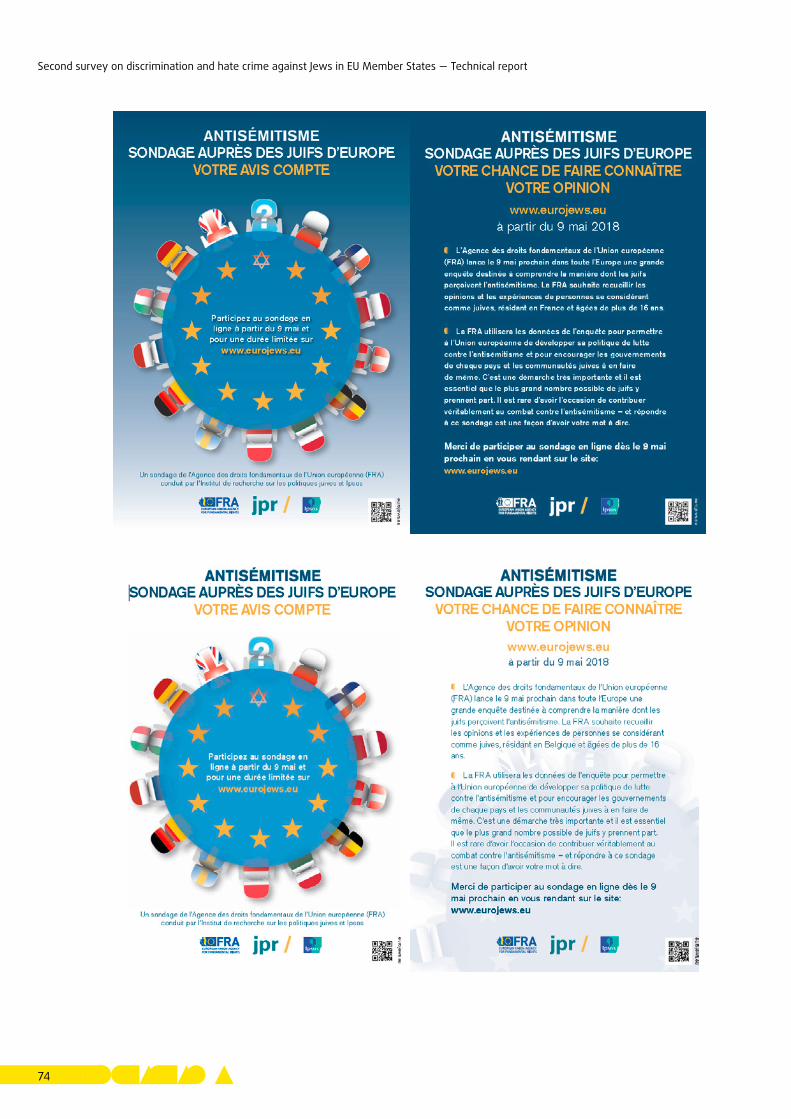
Second survey on discrimination and hate crime against Jews in EU Member States — Technical report
74
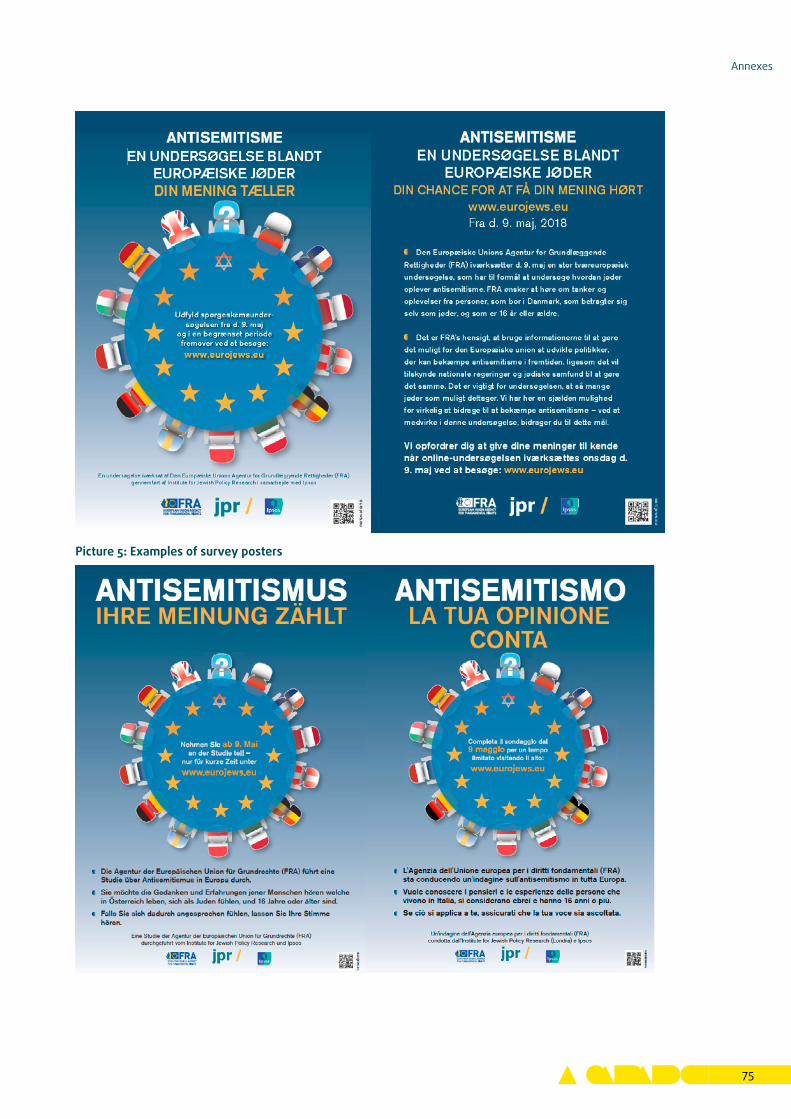
Annexes
75
Picture 5: Examples of survey posters
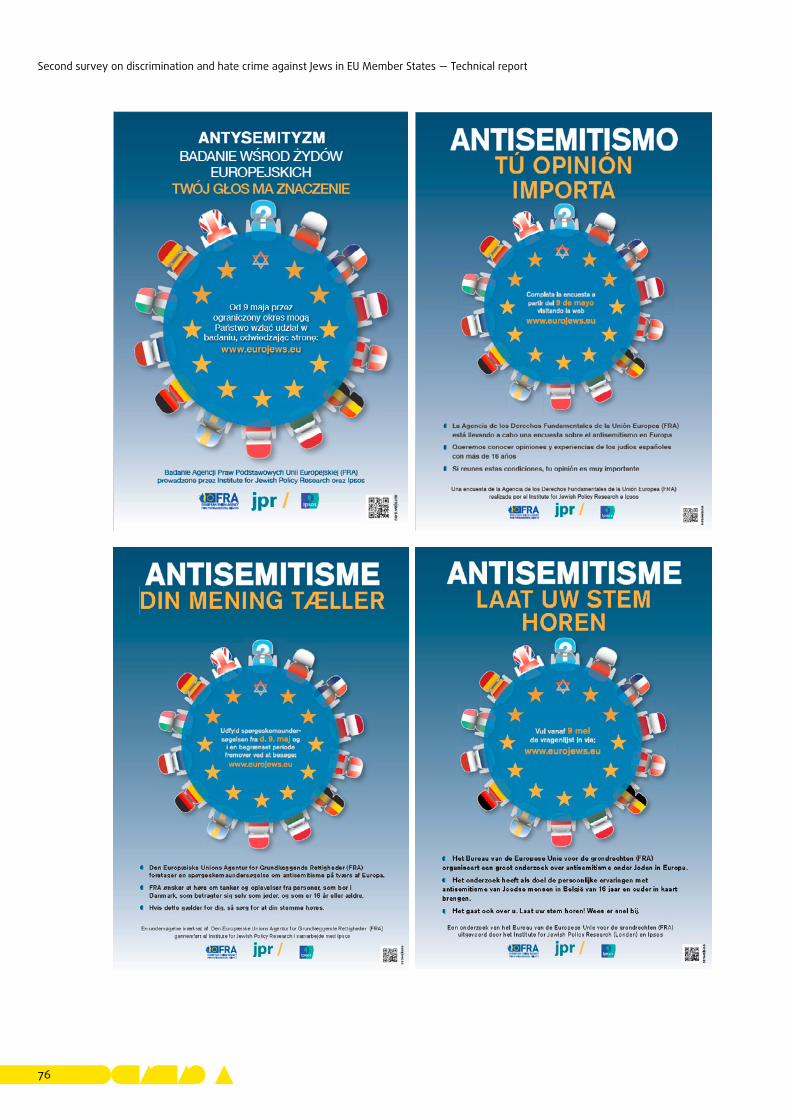
Second survey on discrimination and hate crime against Jews in EU Member States — Technical report
76
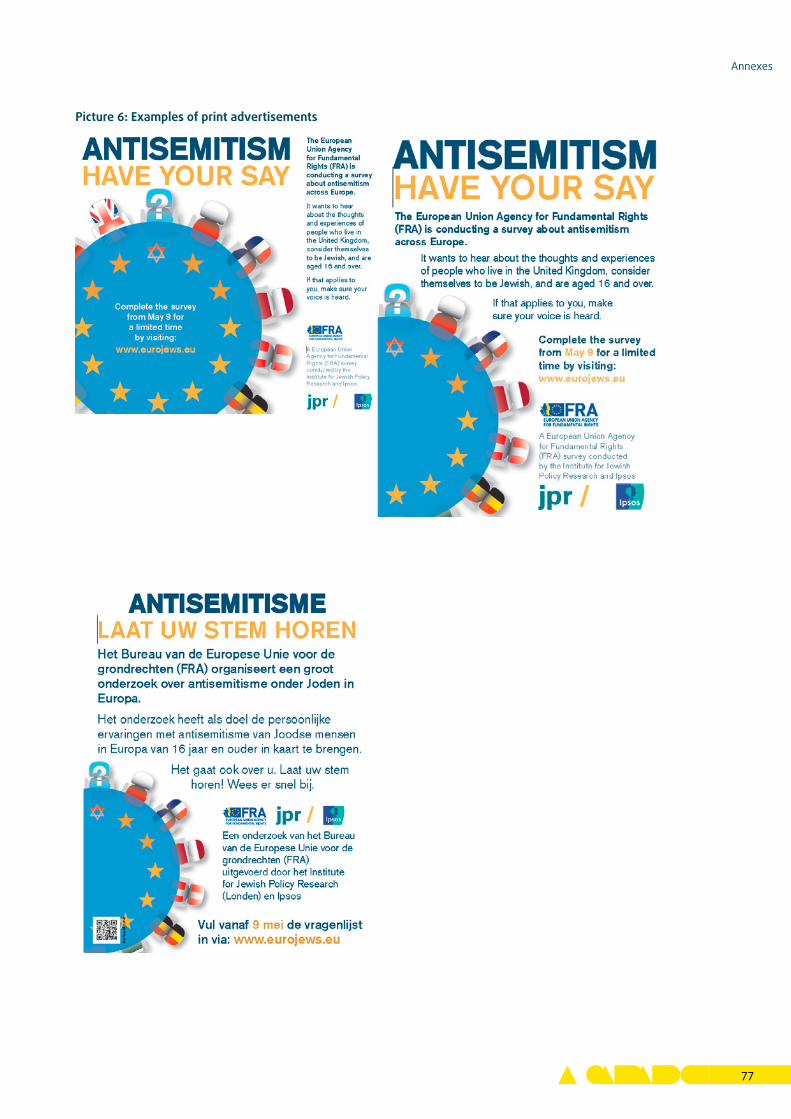
Annexes
77
Picture 6: Examples of print advertisements
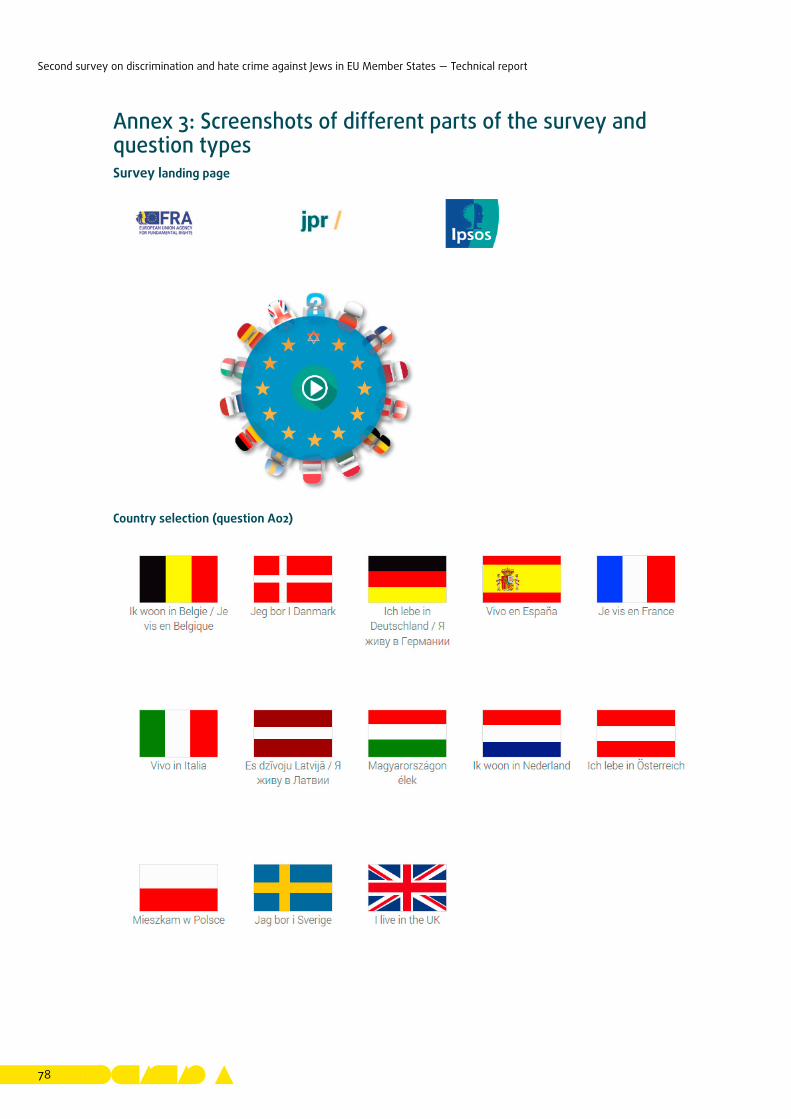
Second survey on discrimination and hate crime against Jews in EU Member States — Technical report
78
Annex 3: Screenshots of different parts of the survey and question typesSurvey landing page
Country selection (question A02)
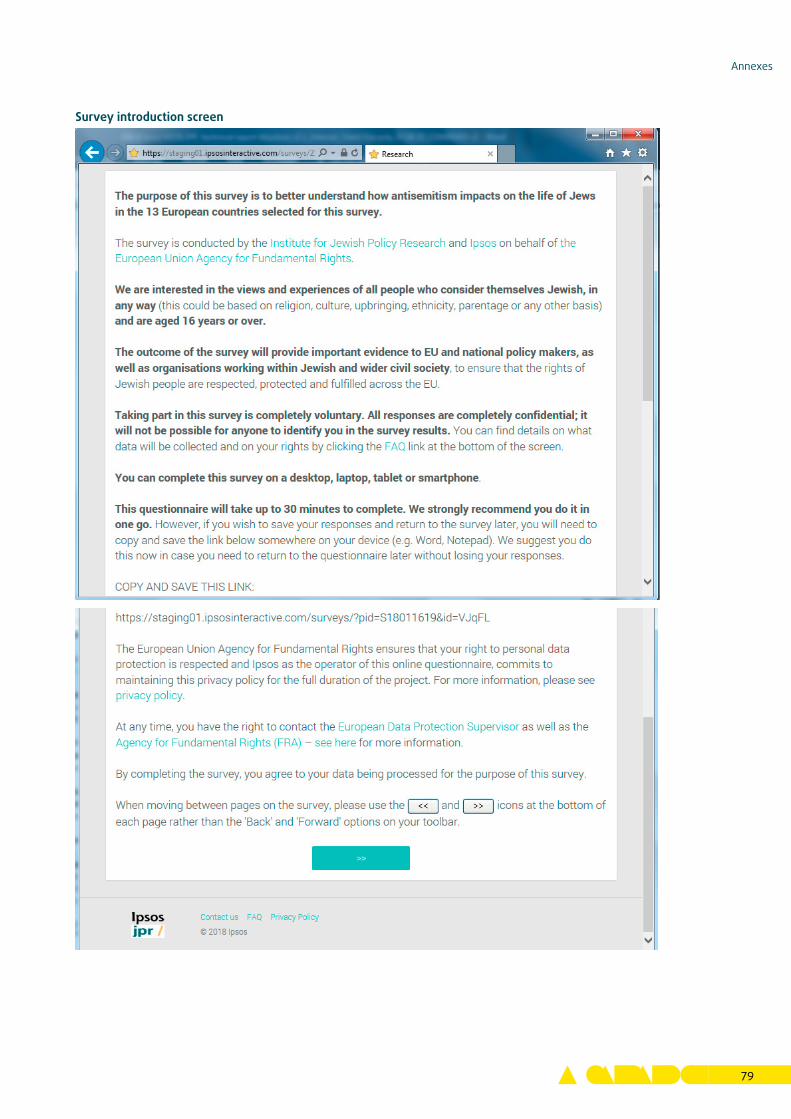
Annexes
79
Survey introduction screen
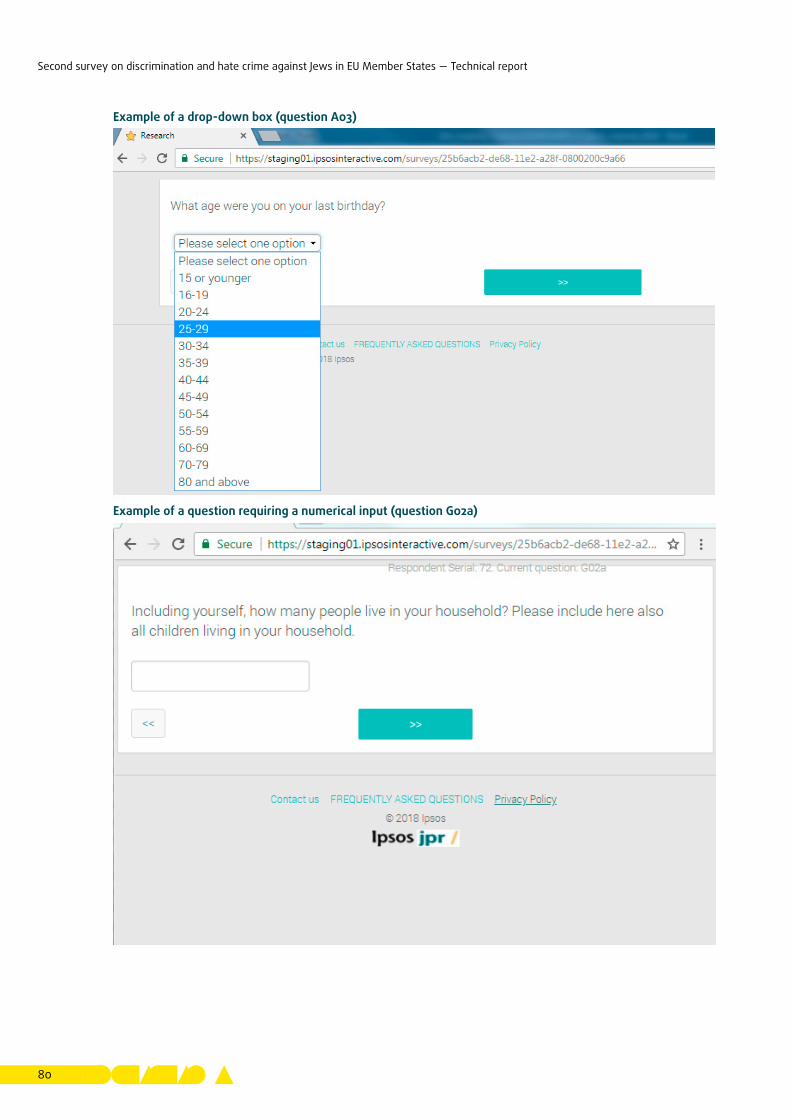
Second survey on discrimination and hate crime against Jews in EU Member States — Technical report
80
Example of a drop-down box (question A03)
Example of a question requiring a numerical input (question G02a)
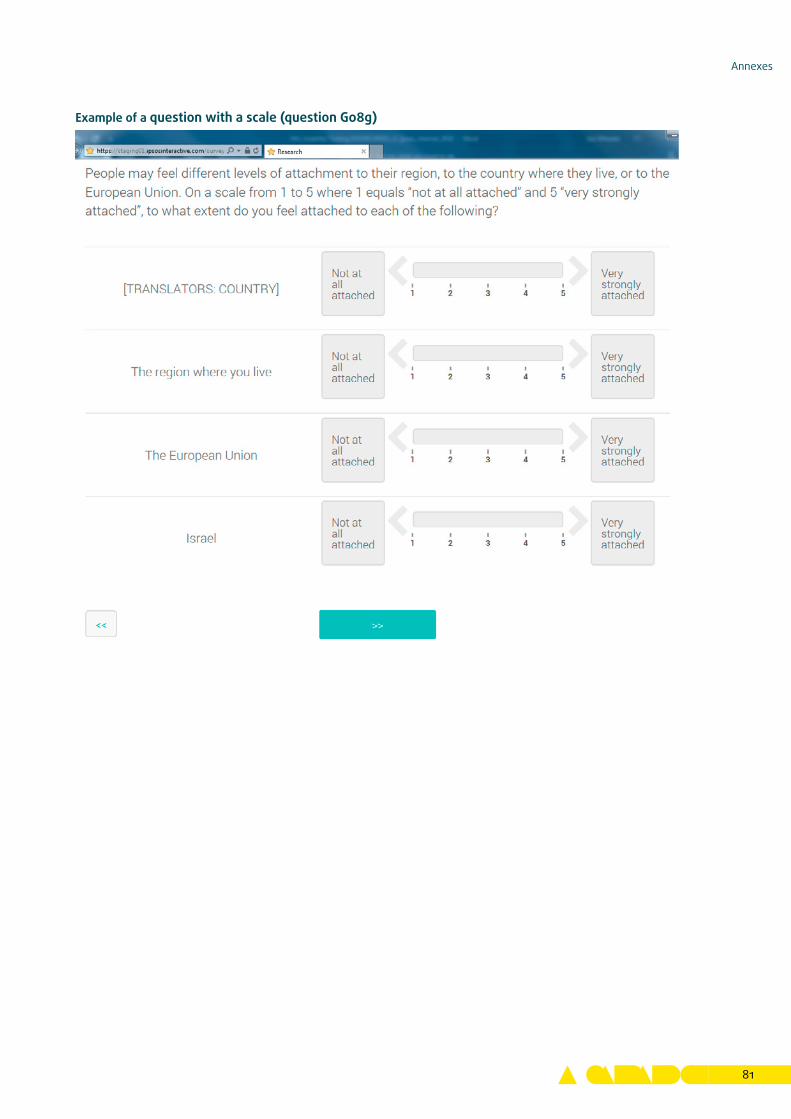
Annexes
81
Example of a question with a scale (question G08g)


Getting in touch with the EUIn personAll over the European Union there are hundreds of Europe Direct information centres. You can find the address of the centre nearest you at: https://europa.eu/european-union/contact_enOn the phone or by emailEurope Direct is a service that answers your questions about the European Union. You can contact this service:– by freephone: 00 800 6 7 8 9 10 11 (certain operators may charge for these calls),– at the following standard number: +32 22999696 or– by email via: https://europa.eu/european-union/contact_en
Finding information about the EUOnlineInformation about the European Union in all the official languages of the EU is available on the Europa website at: https://europa.eu/european-union/index_enEU publicationsYou can download or order free and priced EU publications at: https://publications.europa.eu/en/publications. Multiple copies of free publications may be obtained by contacting Europe Direct or your local information centre (see https://europa.eu/european-union/contact_en).EU law and related documentsFor access to legal information from the EU, including all EU law since 1952 in all the official language versions, go to EUR-Lex at: http://eur-lex.europa.euOpen data from the EUThe EU Open Data Portal (http://data.europa.eu/euodp/en) provides access to datasets from the EU. Data can be downloaded and reused for free, both for commercial and non-commercial purposes.
A great deal of information on the European Union Agency for Fundamental Rights is available on the internet. It can be accessed through the FRA website at fra.europa.eu.
FRA’s second survey on discrimination and hate crime against Jews in EU Member States surveyed over 16 000 self-identified Jewish respondents in 12 EU Member States: Austria, Belgium, Denmark, France, Germany, Hungary, Italy, the Netherlands, Poland, Spain, Sweden, and the United Kingdom. This technical report presents a detailed overview of the survey method-ology used by FRA when collecting the survey data.
HELPING TO MAKE FUNDAMENTAL RIGHTS A REALITY FOR EVERYONE IN THE EUROPEAN UNION
FRA - EUROPEAN UNION AGENCY FOR FUNDAMENTAL RIGHTSSchwarzenbergplatz 11 – 1040 Vienna – AustriaTel. +43 1580 30-0 – Fax +43 1580 30-699fra.europa.eufacebook.com/fundamentalrightslinkedin.com/company/eu-fundamental-rights-agencytwitter.com/EURightsAgency
EqualityHate speechHate crime Non-discrimination
Second survey on discrimination and hate crim
e against Jews in EU M
ember States - Technical report
FRA