second quarter 2009 report investment trends vol. … · second quarter 2009 report investment...
TRANSCRIPT

Sponsored by:
Second Quarter 2009 ReportVol. 5, No. 2Investment Trends
Quarterly
Spotlighton
Nashville
1Investment TrendsQuarterly
Copyright© 2009 by Real Estate Research Corporation (RERC) and the CCIM Institute.
InThisVolume
Regional and Metro-Level AnalysesComing Soon!
East RegionBaltimore, Boston, Charlotte, Hartford, Norfolk, Northern New Jersey, New York City, Pittsburgh, Philadelphia, Raleigh, Richmond, Washington, D.C.
South RegionAtlanta, Austin, Dallas/Ft. Worth, Houston, Memphis, Miami, Nashville, New Orleans/Baton Rouge, Oklahoma City, Orlando, San Antonio, Tampa
Midwest RegionChicago, Cincinnati, Cleveland, Columbus, Detroit, Indianapolis, Kansas City, Milwaukee, Minneapolis, Omaha, St. Louis, Toledo
West RegionDenver, Honolulu, Las Vegas, Los Angeles, Phoenix, Portland, Sacramento, Salt Lake City, San Diego, San Francisco, Seattle, Tucson
Now Available!National OverviewIn Search of Bottom
Economic Background and Investment Environment
How Is Commercial Real Estate Affected?
A Focus on Real Estate Cap Rate & Yield Rate ExpectationsNational Market Analysis & Property Sector Highlights“Nashville Tunes in New Economic Growth...Beyond the Music”ContributorsScope & Methodology
2Investment TrendsQuarterly
Copyright© 2009 by Real Estate Research Corporation (RERC) and the CCIM Institute.
Foreword
May 2009
Dear Readers,
Although the sense of optimism that we usually have during the spring season is being overshadowed by the reces-sion, there are news flashes here and there that indicate the economic freefall may be slowing. However, first quarter 2009 GDP contraction was nearly as low as that for fourth quarter 2008, and while not as many people in April lost jobs as did people in March, the unemployment rate increased from 8.5 percent in March to 8.9 percent in April. We were reminded that while it appears economic stabilization is underway, there will be many more ups and downs ahead of us before we see anything resembling economic recovery.
As for commercial real estate, a lagging indicator to the economy, we have yet to reach the bottom of this down cycle. For those of you who thought we would never again see anything like the real estate crisis in the early 1990s, it appears that the losses in this recession may be even more severe. In the 1990s, prices declined 30 to 35 percent over 5 years, which was bad enough. However, the crisis we find ourselves in today is happening at an accelerated pace, and real estate prices have fallen 20 to 25 percent on a free and clear basis in just the last 3 quarters!
Beyond price adjustments, reduced returns, and continued lack of credit availability, property fundamentals are de-clining throughout the industry. On a national basis, vacancy rates are up at least a half percentage point for each property type. Prices and rents are declining, absorption is negative, and capitalization rates are increasing. RERC’s analysis of this information, along with the views contributed by many CCIM Institute designees and candidates, is provided in the second quarter 2008 RERC/CCIM Investment Trends Quarterly.
We thank all who responded to and completed RERC’s surveys when encouraged by the CCIM Institute. Your con-tributions to the information available to the commercial real estate industry are needed and appreciated now more than ever.
Sincerely,
Kenneth P. Riggs, Jr., CCIM, CRE, MAIPresident & CEOReal Estate Research Corporation (RERC)
Charles “Mac” McClure, CCIM2009 CCIM Institute PresidentChairman, The McClure Group, Inc.
3Investment TrendsQuarterly
Copyright© 2009 by Real Estate Research Corporation (RERC) and the CCIM Institute.
InSearchofBottom
The recent Chapter 11 bankruptcy of General Growth Properties, Inc. was a particularly sad day for anyone associated with this real estate investment trust (REIT) or with the Bucksbaum family. Like many other real estate owners who have overleveraged, General Growth was caught in the worst credit and capital markets crisis since the 1930s and was not able to work its way through it without reorganizing. While we understand and appreciate the difficulty General Growth is going through, it is important to also take note of how quickly the financial situation of the nation’s second largest mall owner deteriorated, and how the challenges they have and are going through are also occurring in countless other businesses. The speed at which this recession has deepened and the severity of its damage have shocked us all, from the federal government on down.
Still, in the long run, there may be more hope for General Growth to come back from bankruptcy and to preserve the majority of its assets than it will for many other industries. Although we are seeing some progress in the housing industry, there is much unraveling yet to be done at Fannie Mae and Freddie Mac, with more home foreclosures and further price declines, at least in some regions, still ahead. In addition, the stress tests administered to the large investment houses have not reflected well on the banks’ overall health, and despite some first quarter profits, there are still worrisome piles of legacy/toxic assets on the banks’ books that must somehow be disposed of. The auto industry is at a breaking point, and with the bankruptcy of Chrysler, there are fears that the bankruptcy of General Motors cannot be far behind. An average of 45 percent fewer cars and light trucks were sold by the Big Three last year than in the previous year, and it is no wonder that lower sales volume, added to their other high costs of doing business, may mean the end of this industry as we know it. When we consider the ripple effect on auto parts suppliers of steel, rubber, tech items like CD players or GPS systems, besides the leathers and fabrics that are included in the production of a car or truck, one can get an idea of the additional jobs that are likely to be lost before this is over. Other industries, including insurance, retailing, manufacturing, airlines, hotels and lodging, education, state and local governments, and even healthcare continue to see increased unemployment as well.
As always, it is the loss of jobs that will have the longest-lasting impact on commercial real estate. With unemployment expected to increase at least throughout 2009, the damage to real estate fundamentals will increase accordingly, with higher vacancy, negative absorption, declining rents, and decreased values. It will be some time before we see the bottom of the commercial real estate market and know exactly what it is we have to deal with, but the majority of real estate investors remain determined to work through and overcome the new depths associated with this crisis.
4Investment TrendsQuarterly
Copyright© 2009 by Real Estate Research Corporation (RERC) and the CCIM Institute.
It seems that most watchers of the economy have spent the majority of first quarter 2009 downgrading their expectations for the rest of this year. We have seen some indications of improvement during the last month or two, but hopes for an early end to the recession were dashed when the Commerce Department reported first quarter gross domestic product (GDP) growth grew at a seasonally-adjusted annual rate of –6.1 percent for first quarter, not much better than the –6.3 percent rate for fourth quarter 2008. In addition to witnessing the worst 6-month economic performance since the 1950s, this is the first time since the mid-1970s that we have seen the economy contract for 3 consecutive quarters.
With the loss of another 674,000 jobs in March 2009 and 539,000 jobs in April, unemployment increased to 8.9 per-cent. Recent losses were higher than most economists had expected, and came from a broad array of companies like United Technologies, Nortel Networks, Pioneer, Goodyear, Smithfield Foods, Nissan Motor, Panasonic, Estee Lauder, PNC Financial Services, and others. Many economists are now predicting that the unemployment rate will reach double digits by the end of this year.
On a local level, 18 of the 372 metros tracked by the Bureau of Labor Statistics (BLS) have jobless rates of at least 15 per-cent, and 109 metros have jobless rates of at least 10 per-cent, with El Centro, Calif., reporting an unemployment rate of 25.1 percent, the highest unemployment rate among these metros.
The pressure remains on consumers, but consumers have less to spend and they are saving more of what they do have during this recession. It is no wonder they are keeping their pocketbooks closed—they have lost retirement savings, lost value in their homes, and are worried about losing their jobs. This loss is real, and it is immense. According to the Federal Reserve, the drop in household net worth, including home values, mutual funds, life insurance, and college and pension funds, dropped by $11 trillion, a decline of nearly 18 percent, during 2008.
Although consumer spending increased 2.2 percent in first quarter 2009, personal consumption fell at a seasonally-adjusted rate of 0.2 percent during the month of March, the fourth such decline during the last 6 months. In addition, retail
sales inched upward during the first part of the quarter, with a 1.9 percent jump in January and a 0.3 percent increase in February, but March retail sales declined 1.1 percent. Per-sonal income fell 0.3 percent in March, the fifth decrease in the last 6 months, while personal savings increased 4.2 per-cent in March, reports the Commerce Department.
As second quarter 2009 gets underway, however, there have been a few signs that the economy could be starting to stabi-lize. Consumer confidence increased to 39.2 in April, up from 26.9 in March. Although this jump was considerable, the in-dex reading overall was approximately two-thirds lower than it was 2 years ago. Still, it is a sign that consumers may be starting to think about loosening up on the purse strings. Ac-cording to the Conference Board, the Present Situation Index and the Expectations Index also rose in April.
The Commerce Department reported that housing starts in-creased 17.2 percent in February 2009 to 572,000 homes, although starts fell 10.8 percent in March to a seasonally-ad-justed 510,000 homes. With the inventory for homes remain-ing high, this decrease is considered a positive factor for the housing market overall in that it helps to keep overall supply from increasing further. Home prices fell 2.2 percent in Febru-ary, according to the Standard & Poor’s/Case-Shiller Index, but it is important to note that the pace of deterioration has slowed and that a period of leveling off may be underway.
Perhaps the most encouraging flicker of improvement in the economy is the stock market’s brief market rally that we en-joyed this April. Although we have a long way to go before we can even imagine recovering what was lost in last fall’s crash, since the stock market generally serves as a leading indica-tor regarding improvement in the economy, there is legitimate hope that things may slowly start to turn around, barring any new calamities.
With respect to the economic landscape, CCIM members who responded to RERC’s survey rated the U.S. economy’s first quarter 2009 performance at 3.5 on a scale of 1 to 10, with 10 being excellent. While low, this rating is up from last quarter’s rating of 2.6. The East and Midwest regional econo-mies received slightly higher ratings than the West and South regions.
Economic Background andInvestment Environment
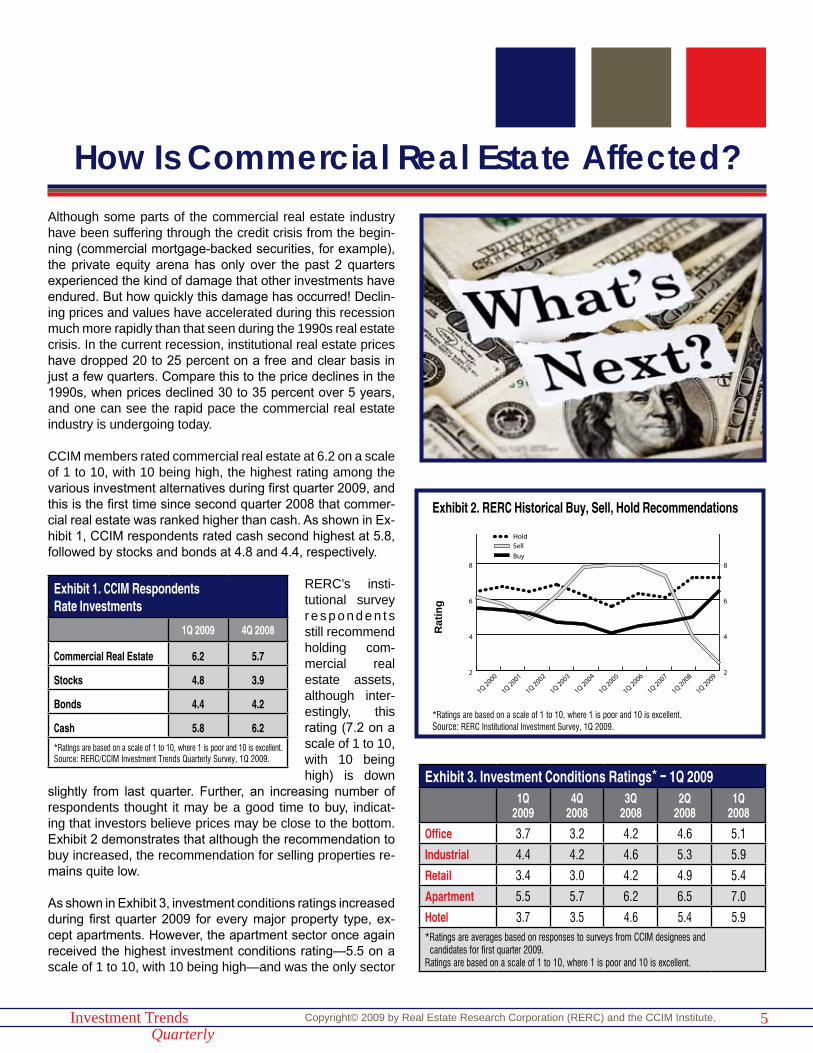
Although some parts of the commercial real estate industry have been suffering through the credit crisis from the begin-ning (commercial mortgage-backed securities, for example), the private equity arena has only over the past 2 quarters experienced the kind of damage that other investments have endured. But how quickly this damage has occurred! Declin-ing prices and values have accelerated during this recession much more rapidly than that seen during the 1990s real estate crisis. In the current recession, institutional real estate prices have dropped 20 to 25 percent on a free and clear basis in just a few quarters. Compare this to the price declines in the 1990s, when prices declined 30 to 35 percent over 5 years, and one can see the rapid pace the commercial real estate industry is undergoing today.
CCIM members rated commercial real estate at 6.2 on a scale of 1 to 10, with 10 being high, the highest rating among the various investment alternatives during first quarter 2009, and this is the first time since second quarter 2008 that commer-cial real estate was ranked higher than cash. As shown in Ex-hibit 1, CCIM respondents rated cash second highest at 5.8, followed by stocks and bonds at 4.8 and 4.4, respectively.
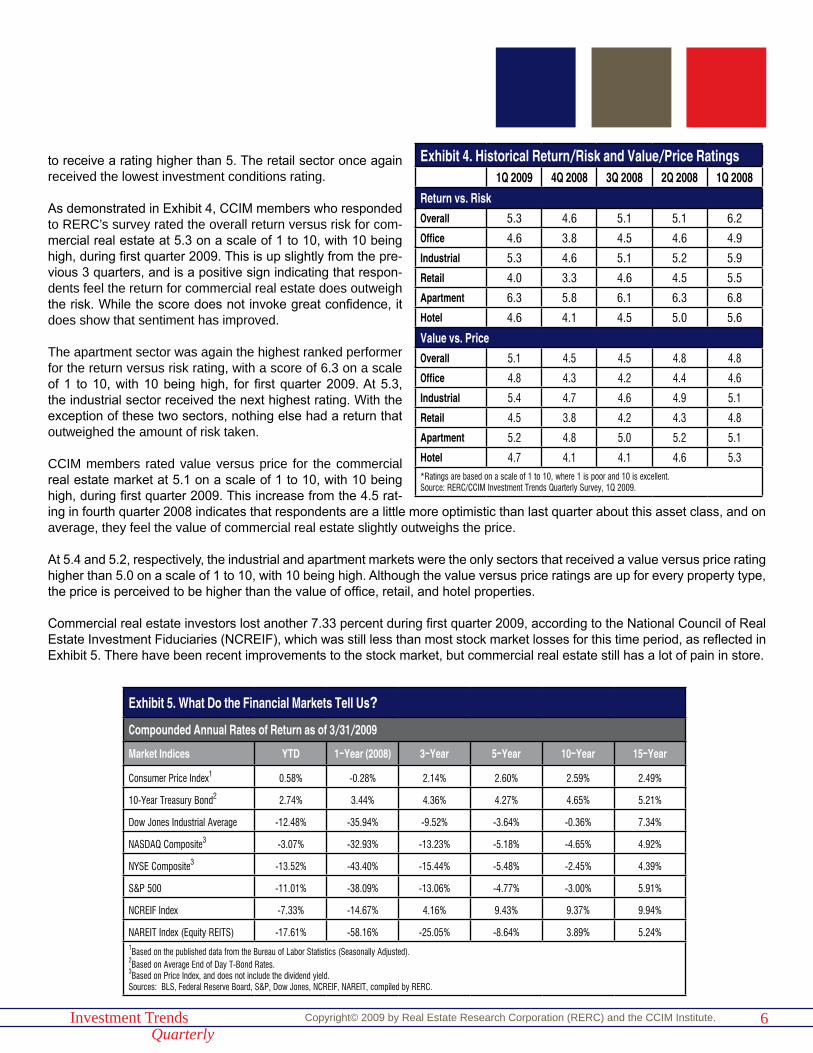
RERC’s insti-tutional survey r e s p o n d e n t s still recommend holding com-mercial real estate assets, although inter-estingly, this rating (7.2 on a scale of 1 to 10, with 10 being high) is down
slightly from last quarter. Further, an increasing number of respondents thought it may be a good time to buy, indicat-ing that investors believe prices may be close to the bottom. Exhibit 2 demonstrates that although the recommendation to buy increased, the recommendation for selling properties re-mains quite low.
As shown in Exhibit 3, investment conditions ratings increased during first quarter 2009 for every major property type, ex-cept apartments. However, the apartment sector once again received the highest investment conditions rating—5.5 on a scale of 1 to 10, with 10 being high—and was the only sector
5Investment TrendsQuarterly
Copyright© 2009 by Real Estate Research Corporation (RERC) and the CCIM Institute.
How Is Commercial Real Estate Affected?
Exhibit 1. CCIM RespondentsRate Investments
1Q 2009 4Q 2008
Commercial Real Estate 6.2 5.7
Stocks 4.8 3.9
Bonds 4.4 4.2
Cash 5.8 6.2
*Ratings are based on a scale of 1 to 10, where 1 is poor and 10 is excellent.Source: RERC/CCIM Investment Trends Quarterly Survey, 1Q 2009.
Exhibit 3. Investment Conditions Ratings* - 1Q 20091Q
20094Q
20083Q
20082Q
20081Q
2008
Office 3.7 3.2 4.2 4.6 5.1
Industrial 4.4 4.2 4.6 5.3 5.9
Retail 3.4 3.0 4.2 4.9 5.4
Apartment 5.5 5.7 6.2 6.5 7.0
Hotel 3.7 3.5 4.6 5.4 5.9*Ratings are averages based on responses to surveys from CCIM designees and candidates for first quarter 2009.Ratings are based on a scale of 1 to 10, where 1 is poor and 10 is excellent.
2
4
6
8
10
2
4
6
8
10HoldSell
Buy
1Q 2009
1Q 2008
1Q 2007
1Q 2006
1Q 2005
1Q 2004
1Q 2003
1Q 2002
1Q 2001
1Q 2000
Exhibit 2. RERC Historical Buy, Sell, Hold Recommendations
*Ratings are based on a scale of 1 to 10, where 1 is poor and 10 is excellent.Source: RERC Institutional Investment Survey, 1Q 2009.
Rat
ing
6Investment TrendsQuarterly
Copyright© 2009 by Real Estate Research Corporation (RERC) and the CCIM Institute.
Exhibit 5. What Do the Financial Markets Tell Us?
Compounded Annual Rates of Return as of 3/31/2009
Market Indices YTD 1-Year (2008) 3-Year 5-Year 10-Year 15-Year
Consumer Price Index1 0.58% -0.28% 2.14% 2.60% 2.59% 2.49%
10-Year Treasury Bond2 2.74% 3.44% 4.36% 4.27% 4.65% 5.21%
Dow Jones Industrial Average -12.48% -35.94% -9.52% -3.64% -0.36% 7.34%
NASDAQ Composite3 -3.07% -32.93% -13.23% -5.18% -4.65% 4.92%
NYSE Composite3 -13.52% -43.40% -15.44% -5.48% -2.45% 4.39%
S&P 500 -11.01% -38.09% -13.06% -4.77% -3.00% 5.91%
NCREIF Index -7.33% -14.67% 4.16% 9.43% 9.37% 9.94%
NAREIT Index (Equity REITS) -17.61% -58.16% -25.05% -8.64% 3.89% 5.24%1Based on the published data from the Bureau of Labor Statistics (Seasonally Adjusted).2Based on Average End of Day T-Bond Rates.3Based on Price Index, and does not include the dividend yield.Sources: BLS, Federal Reserve Board, S&P, Dow Jones, NCREIF, NAREIT, compiled by RERC.
to receive a rating higher than 5. The retail sector once again received the lowest investment conditions rating.
As demonstrated in Exhibit 4, CCIM members who responded to RERC’s survey rated the overall return versus risk for com-mercial real estate at 5.3 on a scale of 1 to 10, with 10 being high, during first quarter 2009. This is up slightly from the pre-vious 3 quarters, and is a positive sign indicating that respon-dents feel the return for commercial real estate does outweigh the risk. While the score does not invoke great confidence, it does show that sentiment has improved.
The apartment sector was again the highest ranked performer for the return versus risk rating, with a score of 6.3 on a scale of 1 to 10, with 10 being high, for first quarter 2009. At 5.3, the industrial sector received the next highest rating. With the exception of these two sectors, nothing else had a return that outweighed the amount of risk taken.
CCIM members rated value versus price for the commercial real estate market at 5.1 on a scale of 1 to 10, with 10 being high, during first quarter 2009. This increase from the 4.5 rat-ing in fourth quarter 2008 indicates that respondents are a little more optimistic than last quarter about this asset class, and on average, they feel the value of commercial real estate slightly outweighs the price.
At 5.4 and 5.2, respectively, the industrial and apartment markets were the only sectors that received a value versus price rating higher than 5.0 on a scale of 1 to 10, with 10 being high. Although the value versus price ratings are up for every property type, the price is perceived to be higher than the value of office, retail, and hotel properties.
Commercial real estate investors lost another 7.33 percent during first quarter 2009, according to the National Council of Real Estate Investment Fiduciaries (NCREIF), which was still less than most stock market losses for this time period, as reflected in Exhibit 5. There have been recent improvements to the stock market, but commercial real estate still has a lot of pain in store.
Exhibit 4. Historical Return/Risk and Value/Price Ratings1Q 2009 4Q 2008 3Q 2008 2Q 2008 1Q 2008
Return vs. RiskOverall 5.3 4.6 5.1 5.1 6.2
Office 4.6 3.8 4.5 4.6 4.9
Industrial 5.3 4.6 5.1 5.2 5.9
Retail 4.0 3.3 4.6 4.5 5.5
Apartment 6.3 5.8 6.1 6.3 6.8
Hotel 4.6 4.1 4.5 5.0 5.6
Value vs. PriceOverall 5.1 4.5 4.5 4.8 4.8
Office 4.8 4.3 4.2 4.4 4.6
Industrial 5.4 4.7 4.6 4.9 5.1
Retail 4.5 3.8 4.2 4.3 4.8
Apartment 5.2 4.8 5.0 5.2 5.1
Hotel 4.7 4.1 4.1 4.6 5.3*Ratings are based on a scale of 1 to 10, where 1 is poor and 10 is excellent.Source: RERC/CCIM Investment Trends Quarterly Survey, 1Q 2009.
7Investment TrendsQuarterly
Copyright© 2009 by Real Estate Research Corporation (RERC) and the CCIM Institute.
While the U.S. economy continues to suffer the ill effects of the post-credit market extremes, there is evidence that the decline is slowing and we are starting to see a few signs of entering into a period (potentially protracted) of stabilization. Warning: This is not to suggest a recovery is on the horizon. We have much yet to work through, and there will be many more ups and downs before we can expect anything resembling a re-covery in jobs and the housing market. But first, we need to stabilize from the worst shocks to our economy and financial markets since the Great Depression.
Despite the Federal Reserve’s extremely accommodative monetary policy and the influx of capital targeted at the in-vestment banks, many of the same issues that threatened the capital markets remain unresolved. Lack of credit continues as a drain on the economy, as we saw recently with the second consecutive 6-percent contraction in GDP, which was attrib-uted mostly to the continued reduction in business investment (which fell 38 percent in first quarter 2009). Although we are seeing some stabilization in the housing market overall, there are many areas that will see additional price declines. In ad-dition, the stress tests the banks have undergone have indi-cated that the health of the banks remains somewhat precari-ous, with many of them needing additional funds to continue to operate. With respect to commercial real estate, the difficul-ties associated with overleveraging continue to drag down the market, and there is much more pain in store for investors.
The economic stresses causing commercial real estate funda-mentals to deteriorate, particularly additional job losses, are expected to continue throughout the year. With consumers remaining cautious, concentrating on expanding their sav-
ings and replenishing their retirement accounts, investors also should expect slow consumer spending to continue. These factors will further negatively impact the office, industrial, re-tail, apartment, and hotel property sectors.
Since commercial real estate is a lagging indicator to the economy, RERC estimates stabilization in the economy to oc-cur before year-end 2009 with strong signs of this in the sec-ond quarter, and commercial real estate following suit approxi-mately 12 months after stabilization occurs in the economy. That means stabilization in the commercial real estate industry will not begin until mid-2010. Until then and as the commer-cial real estate market continues to struggle with new depths, watch for:
• Lack of credit availability in the near term.
• Fundamentals to continue to deteriorate throughout 2009.
• Vacancy/availability rates to increase in all property sec-tors.
• Capitalization rate increases to begin leveling off.
• Property sale prices and rents to continue to decrease.
• Concessions and terms favoring buyers to continue.
• Buy opportunities in CMBS or with distressed debt proper-ties.
Summary
8Investment TrendsQuarterly
Copyright© 2009 by Real Estate Research Corporation (RERC) and the CCIM Institute.
NAR Commercial Forecast: February 20092008 2009
2007 2008 2009I II III IV I II III
OFFICE
Vacancy Rate (%) 12.9 13.2 13.4 13.9 14.7 15.7 16.7 12.5 13.4 16.2
Net Absorption (’000 sq. ft.) 3,192 5,206 4,800 -6,893 -15,091 -17,537 -20,336 57,265 12,271 -77,406
Completions (’000 sq. ft.) 15,701 17,637 21,961 12,888 15,733 16,900 19,306 61,102 68,187 71,356
Inventory (millions sq. ft.) 3,427 3,445 3,467 3,480 3,495 3,512 3,532 3,409 3,480 3,551
Rent Growth (%) 1.0 -0.2 -0.6 -0.6 -0.8 -0.9 -1.2 8.0 -0.4 -4.2
INDUSTRIAL
Vacancy Rate (%) 9.8 9.9 10.7 11.1 11.4 11.7 12.2 9.4 10.4 12.0
Net Absorption (’000 sq. ft.) -12,678 -30,441 -8,327 -5,795 -18,540 -32,552 -44,575 120,231 -57,241 -148,062
Completions (’000 sq. ft.) 34,847 42,847 44,639 57,280 12,214 17,249 35,779 126,765 179,613 69,553
Inventory (millions sq. ft.) 12,778 12,821 12,866 12,923 12,935 12,953 12,988 12,399 12,923 12,993
Rent Growth (%) 0.2 0.5 -0.7 -0.8 -0.8 -0.9 -1.2 3.6 -0.8 -4.1
RETAIL
Vacancy Rate (%) 9.0 9.3 9.8 10.8 11.8 12.6 13.4 9.2 9.7 13.0
Net Absorption (’000 sq. ft.) -639 622 -2,157 -8,784 -12,397 -12,503 -12,250 11,081 -7,315 -49,754
Completions (’000 sq. ft.) 5,070 6,296 6,246 8,674 3,483 809 625 29,733 26,286 5,858
Inventory (millions sq. ft.) 1,598 1,606 1,612 1,621 1,624 1,625 1,626 1,580 1,621 1,627
Rent Growth (%) 0.7 0.7 0.8 -4.2 -2.2 -2.6 -2.2 3.2 -2.0 -9.0
MULTIFAMILY
Vacancy Rate (%) 5.5 5.4 5.8 6.1 6.0 6.0 6.0 5.4 5.7 6.2
Net Absorption (Units) -52,603 37,680 27,303 12,001 60,112 57,808 56,998 234,399 24,390 127,523
Completions (Units) 56,275 54,573 53,999 55,926 53,894 58,157 55,731 230,932 220,773 214,027
Inventory (Units in Millions) 14.1 14.1 14.2 14.2 14.3 14.3 14.4 14.0 14.2 14.4
Rent Growth (%) 0.9 0.9 0.5 0.6 0.4 0.4 0.5 3.1 2.9 1.7
Sources: NAR, CBRE/Torto Wheaton Research.
NAR U.S. Economic Outlook: May 20092008 Quarterly 2009 Quarterly 2010 Quarterly Annual
Q3 Q4 Q1 Q2 Q3 Q4 Q1 Q2 Q3 Q4 2007 2008 2009 2010
Annual Growth Rate
Real GDP -0.5 -6.3 -6.1 -1.7 0.3 0.8 1.4 2.6 2.5 2.8 2.0 1.1 -2.9 1.4
Nonfarm Payroll Employment -1.5 -3.7 -5.9 -3.7 -2.1 -0.8 0.0 1.0 1.1 1.2 1.1 -0.4 -3.4 -0.2
Consumer Prices 6.2 -8.3 -2.4 0.7 1.8 2.0 2.1 2.2 2.3 2.5 2.9 3.8 -0.8 1.7
Real Disposable Income -8.5 2.7 6.2 -2.0 0.9 0.7 1.3 1.4 2.2 2.6 2.8 1.3 1.3 1.1
Consumer Confidence 57 41 32 43 44 43 42 40 43 45 103 58 41 43
Unemployment 6.0 6.9 8.1 9.4 10.0 10.5 10.4 10.3 10.2 10.1 4.6 5.8 9.5 10.2
Interest Rates, Percent
Fed Funds Rate 1.9 0.5 0.2 0.1 0.1 0.1 0.1 0.8 1.5 2.0 5.0 1.9 0.1 1.1
3-Month T-Bill Rate 1.5 0.3 0.2 0.3 0.3 0.3 0.3 0.9 1.6 2.1 4.4 1.4 0.3 1.2
Prime Rate 5.0 4.1 3.3 2.9 3.0 3.0 3.0 3.3 4.0 4.8 8.1 5.1 3.1 4.1
Corporate Aaa Bond Yield 5.7 5.8 5.3 5.5 5.5 5.5 5.3 5.0 5.0 4.9 5.6 5.6 5.4 5.1
10-Year Government Bond 3.9 3.3 2.7 3.0 3.0 3.1 3.1 3.1 3.3 3.4 4.6 3.7 2.9 3.2
30-Year Government Bond 4.4 3.7 3.5 3.5 3.5 3.7 3.7 3.7 3.9 4.0 4.8 4.3 3.5 3.8
Source: Forecast produced using Macroeconomic Advisers quarterly model of the U.S. economy. Quarterly figures are seasonally-adjusted annual rates. Assumptions and simulations by NAR's Dr. Lawrence Yun.
9Investment TrendsQuarterly
Copyright© 2009 by Real Estate Research Corporation (RERC) and the CCIM Institute.
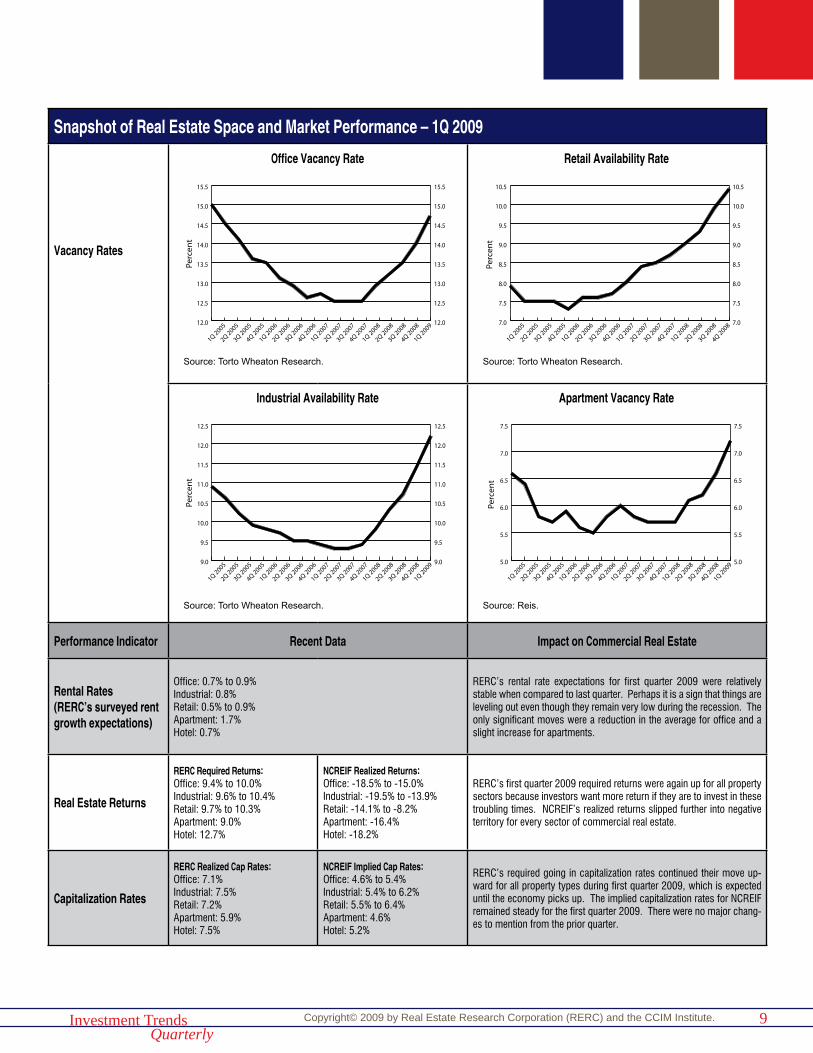
Snapshot of Real Estate Space and Market Performance – 1Q 2009
Vacancy Rates
Performance Indicator Recent Data Impact on Commercial Real Estate
Rental Rates(RERC’s surveyed rent growth expectations)
Office: 0.7% to 0.9%Industrial: 0.8%Retail: 0.5% to 0.9%Apartment: 1.7%Hotel: 0.7%
RERC’s rental rate expectations for first quarter 2009 were relatively stable when compared to last quarter. Perhaps it is a sign that things are leveling out even though they remain very low during the recession. The only significant moves were a reduction in the average for office and a slight increase for apartments.
Real Estate Returns
RERC Required Returns:Office: 9.4% to 10.0%Industrial: 9.6% to 10.4%Retail: 9.7% to 10.3%Apartment: 9.0%Hotel: 12.7%
NCREIF Realized Returns:Office: -18.5% to -15.0%Industrial: -19.5% to -13.9%Retail: -14.1% to -8.2%Apartment: -16.4%Hotel: -18.2%
RERC’s first quarter 2009 required returns were again up for all property sectors because investors want more return if they are to invest in these troubling times. NCREIF’s realized returns slipped further into negative territory for every sector of commercial real estate.
Capitalization Rates
RERC Realized Cap Rates:Office: 7.1%Industrial: 7.5%Retail: 7.2%Apartment: 5.9%Hotel: 7.5%
NCREIF Implied Cap Rates:Office: 4.6% to 5.4%Industrial: 5.4% to 6.2%Retail: 5.5% to 6.4%Apartment: 4.6%Hotel: 5.2%
RERC’s required going in capitalization rates continued their move up-ward for all property types during first quarter 2009, which is expected until the economy picks up. The implied capitalization rates for NCREIF remained steady for the first quarter 2009. There were no major chang-es to mention from the prior quarter.
12.0
12.5
13.0
13.5
14.0
14.5
15.0
15.5
12.0
12.5
13.0
13.5
14.0
14.5
15.0
15.5
1Q 2009
4Q 2008
3Q 2008
2Q 2008
1Q 2008
4Q 2007
3Q 2007
2Q 2007
1Q 2007
4Q 2006
3Q 2006
2Q 2006
1Q 2006
4Q 2005
3Q 2005
2Q 2005
1Q 2005
Perc
ent
7.0
7.5
8.0
8.5
9.0
9.5
10.0
10.5
7.0
7.5
8.0
8.5
9.0
9.5
10.0
10.5
4Q 2008
3Q 2008
2Q 2008
1Q 2008
4Q 2007
3Q 2007
2Q 2007
1Q 2007
4Q 2006
3Q 2006
2Q 2006
1Q 2006
4Q 2005
3Q 2005
2Q 2005
1Q 2005
Perc
ent
9.0
9.5
10.0
10.5
11.0
11.5
12.0
12.5
9.0
9.5
10.0
10.5
11.0
11.5
12.0
12.5
1Q 2009
4Q 2008
3Q 2008
2Q 2008
1Q 2008
4Q 2007
3Q 2007
2Q 2007
1Q 2007
4Q 2006
3Q 2006
2Q 2006
1Q 2006
4Q 2005
3Q 2005
2Q 2005
1Q 2005
Perc
ent
5.0
5.5
6.0
6.5
7.0
7.5
5.0
5.5
6.0
6.5
7.0
7.5
1Q 2009
4Q 2008
3Q 2008
2Q 2008
1Q 2008
4Q 2007
3Q 2007
2Q 2007
1Q 2007
4Q 2006
3Q 2006
2Q 2006
1Q 2006
4Q 2005
3Q 2005
2Q 2005
1Q 2005
Perc
ent
Source: Torto Wheaton Research.
Source: Torto Wheaton Research.
Source: Torto Wheaton Research.
Source: Reis.
Office Vacancy Rate Retail Availability Rate
Industrial Availability Rate Apartment Vacancy Rate
10Investment TrendsQuarterly
Copyright© 2009 by Real Estate Research Corporation (RERC) and the CCIM Institute.
-7
-5
-3
-1
1
3
5
7
9
-7
-5
-3
-1
1
3
5
7
9
1Q 2009
3Q 2008
1Q 2008
3Q 2007
1Q 2007
3Q 2006
1Q 2006
3Q 2005
1Q 2005
3Q 2004
1Q 2004
3Q 2003
1Q 2003
3Q 2002
1Q 2002
3Q 2001
1Q 2001
3Q 2000
1Q 2000
Perc
ent C
hang
e Q
uart
er A
go
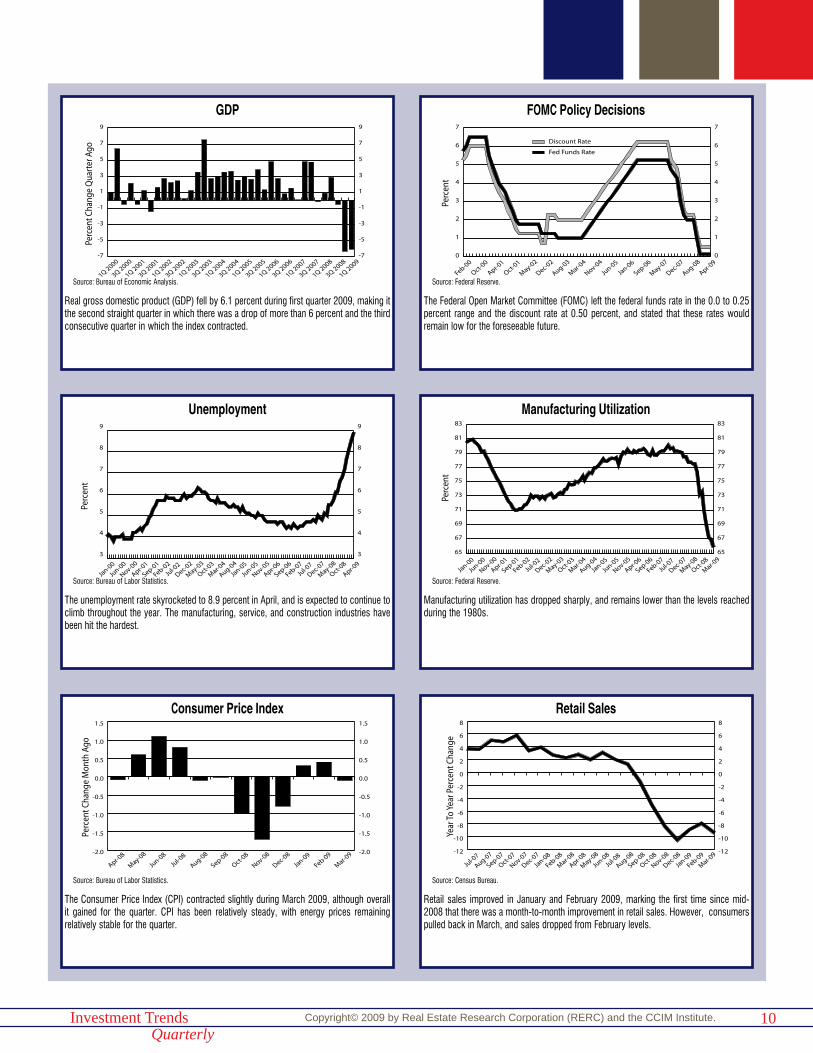
Real gross domestic product (GDP) fell by 6.1 percent during first quarter 2009, making it the second straight quarter in which there was a drop of more than 6 percent and the third consecutive quarter in which the index contracted.
-2.0
-1.5
-1.0
-0.5
0.0
0.5
1.0
1.5
-2.0
-1.5
-1.0
-0.5
0.0
0.5
1.0
1.5
Mar-09
Feb-09
Jan-0
9
Dec-08
Nov-08
Oct-08
Sep-08
Aug-08
Jul-0
8
Jun-0
8
May-08
Apr-08
Perc
ent C
hang
e M
onth
Ago
The Consumer Price Index (CPI) contracted slightly during March 2009, although overall it gained for the quarter. CPI has been relatively steady, with energy prices remaining relatively stable for the quarter.
Source: Bureau of Labor Statistics.
Perc
ent
3
4
5
6
7
8
9
3
4
5
6
7
8
9
Apr-09
Oct-08
May-08
Dec-07
Jul-0
7
Feb-07
Sep-06
Apr-06
Nov-05
Jun-0
5
Jan-0
5
Aug-04
Mar-04
Oct-03
May-03
Dec-02
Jul-0
2
Feb-02
Sep-01
Apr-01
Nov-00
Jun-0
0
Jan-0
0
The unemployment rate skyrocketed to 8.9 percent in April, and is expected to continue to climb throughout the year. The manufacturing, service, and construction industries have been hit the hardest.
Source: Bureau of Labor Statistics.
Source: Bureau of Economic Analysis.
Perc
ent
0
1
2
3
4
5
6
7
0
1
2
3
4
5
6
7
Discount Rate
Fed Funds Rate
Apr-09
Aug-08
Dec-07
May-07
Sep-06
Jan-0
6
Jun-0
5
Nov-04
Mar-04
Aug-03
Dec-02
May-02
Oct-01
Apr-01
Oct-00
Feb-00
The Federal Open Market Committee (FOMC) left the federal funds rate in the 0.0 to 0.25 percent range and the discount rate at 0.50 percent, and stated that these rates would remain low for the foreseeable future.
-12
-10
-8
-6
-4
-2
0
2
4
6
8
-12
-10
-8
-6
-4
-2
0
2
4
6
8
Mar-09
Feb-09
Jan-0
9
Dec-08
Nov-08
Oct-08
Sep-08
Aug-08
Jul-0
8
Jun-0
8
May-08
Apr-08
Mar-08
Feb-08
Jan-0
8
Dec-07
Nov-07
Oct-07
Sep-07
Aug-07
Jul-0
7
Year
To Y
ear P
erce
nt C
hang
e
Retail sales improved in January and February 2009, marking the first time since mid-2008 that there was a month-to-month improvement in retail sales. However, consumers pulled back in March, and sales dropped from February levels.
Source: Census Bureau.
65
67
69
71
73
75
77
79
81
83
65
67
69
71
73
75
77
79
81
83
Mar-09
Oct-08
May-08
Dec-07
Jul-0
7
Feb-07
Sep-06
Apr-06
Nov-05
Jun-0
5
Jan-0
5
Aug-04
Mar-04
Oct-03
May-03
Dec-02
Jul-0
2
Feb-02
Sep-01
Apr-01
Nov-00
Jun-0
0
Jan-0
0
Perc
ent
Manufacturing utilization has dropped sharply, and remains lower than the levels reached during the 1980s.
Source: Federal Reserve.
Source: Federal Reserve.
Unemployment
GDP
Consumer Price Index
Manufacturing Utilization
FOMC Policy Decisions
Retail Sales
11Investment TrendsQuarterly
Copyright© 2009 by Real Estate Research Corporation (RERC) and the CCIM Institute.
4.0
4.5
5.0
5.5
6.0
6.5
7.0
7.5
8.0
4.0
4.5
5.0
5.5
6.0
6.5
7.0
7.5
8.0
Mar-09
Sep-08
Mar-08
Sep-07
Mar-07
Sep-06
Mar-06
Sep-05
Mar-05
Sep-04
Mar-04
Sep-03
Mar-03
Sep-02
Mar-02
Sep-01
Mar-01
Mill
ions
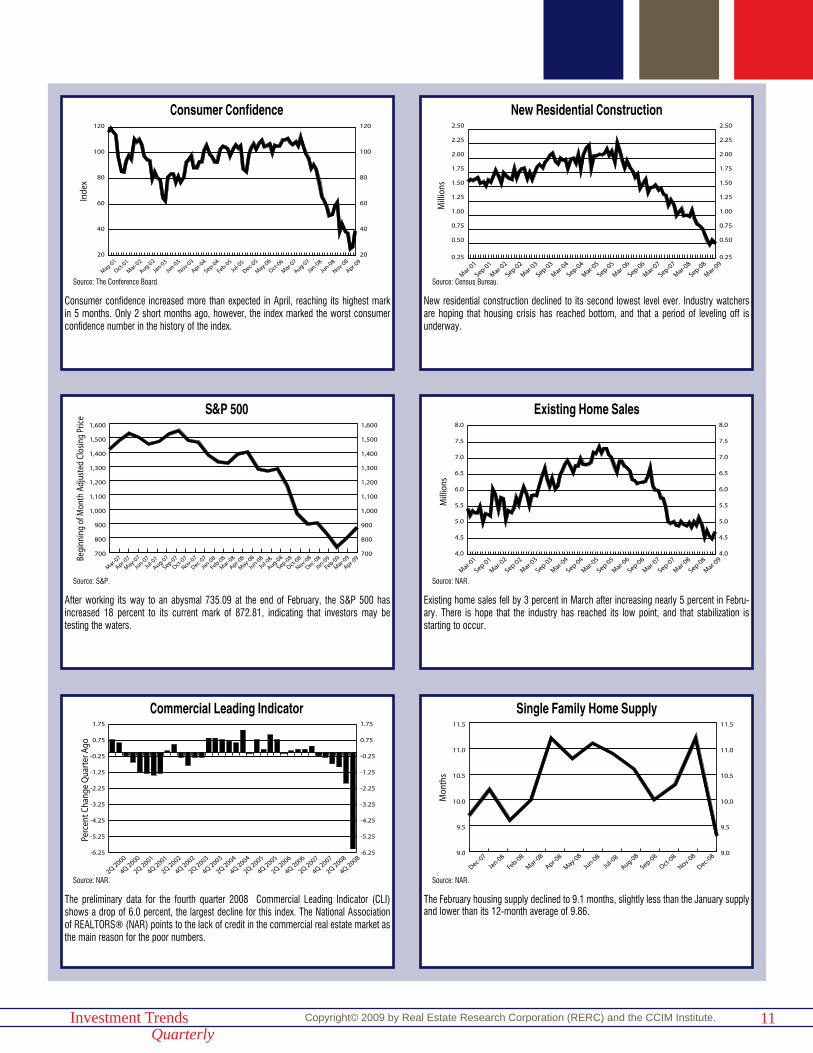
Existing home sales fell by 3 percent in March after increasing nearly 5 percent in Febru-ary. There is hope that the industry has reached its low point, and that stabilization is starting to occur.
Source: NAR.
0.25
0.50
0.75
1.00
1.25
1.50
1.75
2.00
2.25
2.50
0.25
0.50
0.75
1.00
1.25
1.50
1.75
2.00
2.25
2.50
Mar-09
Sep-08
Mar-08
Sep-07
Mar-07
Sep-06
Mar-06
Sep-05
Mar-05
Sep-04
Mar-04
Sep-03
Mar-03
Sep-02
Mar-02
Sep-01
Mar-01
Mill
ions
New residential construction declined to its second lowest level ever. Industry watchers are hoping that housing crisis has reached bottom, and that a period of leveling off is underway.
Source: Census Bureau.
9.0
9.5
10.0
10.5
11.0
11.5
9.0
9.5
10.0
10.5
11.0
11.5
Dec-08
Nov-08
Oct-08
Sep-08
Aug-08
Jul-0
8
Jun-0
8
May-08
Apr-08
Mar-08
Feb-08
Jan-0
8
Dec-07
Mon
ths
The February housing supply declined to 9.1 months, slightly less than the January supply and lower than its 12-month average of 9.86.
Source: NAR.
20
40
60
80
100
120
20
40
60
80
100
120
Apr-09
Nov-08
Jun-0
8
Jan-0
8
Aug-07
Mar-07
Oct-06
May-06
Dec-05
Jul-0
5
Feb-05
Sep-04
Apr-04
Nov-03
Jun-0
3
Jan-0
3
Aug-02
Mar-02
Oct-01
May-01
Inde
x
Consumer confidence increased more than expected in April, reaching its highest mark in 5 months. Only 2 short months ago, however, the index marked the worst consumer confidence number in the history of the index.
-6.25
-5.25
-4.25
-3.25
-2.25
-1.25
-0.25
0.75
1.75
-6.25
-5.25
-4.25
-3.25
-2.25
-1.25
-0.25
0.75
1.75
4Q 2008
2Q 2008
4Q 2007
2Q 2007
4Q 2006
2Q 2006
4Q 2005
2Q 2005
4Q 2004
2Q 2004
4Q 2003
2Q 2003
4Q 2002
2Q 2002
4Q 2001
2Q 2001
4Q 2000
2Q 2000
Perc
ent C
hang
e Q
uart
er A
go
The preliminary data for the fourth quarter 2008 Commercial Leading Indicator (CLI) shows a drop of 6.0 percent, the largest decline for this index. The National Association of REALTORS® (NAR) points to the lack of credit in the commercial real estate market as the main reason for the poor numbers.
Source: NAR.
700
800
900
1,000
1,100
1,200
1,300
1,400
1,500
1,600
700
800
900
1,000
1,100
1,200
1,300
1,400
1,500
1,600
Apr-09
Mar-09
Feb-09
Jan-0
9
Dec-08
Nov-08
Oct-08
Sep-08
Aug-08
Jul-0
8
Jun-0
8
May-08
Apr-08
Mar-08
Feb-08
Jan-0
8
Dec-07
Nov-07
Oct-07
Sep-07
Aug-07
Jul-0
7
Jun-0
7
May-07
Apr-07
Mar-07Be
ginn
ing
of M
onth
Adj
uste
d Cl
osin
g Pr
ice
After working its way to an abysmal 735.09 at the end of February, the S&P 500 has increased 18 percent to its current mark of 872.81, indicating that investors may be testing the waters.
Source: S&P.
Source: The Conference Board.
Consumer Confidence New Residential Construction
S&P 500 Existing Home Sales
Commercial Leading Indicator Single Family Home Supply
12Investment TrendsQuarterly
Copyright© 2009 by Real Estate Research Corporation (RERC) and the CCIM Institute.
A sustained lack of credit and the economic slump will depress the commercial real estate market this year, according to a forward-looking index and forecast for the commercial real estate sectors published by the National Association of REALTORS® (NAR).
Lawrence Yun, NAR chief economist, said all components of the index declined. “The credit crunch has especially hammered down some components of NAR’s commercial leading indicator,” he said. “A lack of commercial credit is a serious threat to the overall economy. The Federal Reserve needs to use the Term Asset-Backed Securities Loan Facility (TALF) to provide liquidity and support for commercial mortgage-backed securities.”
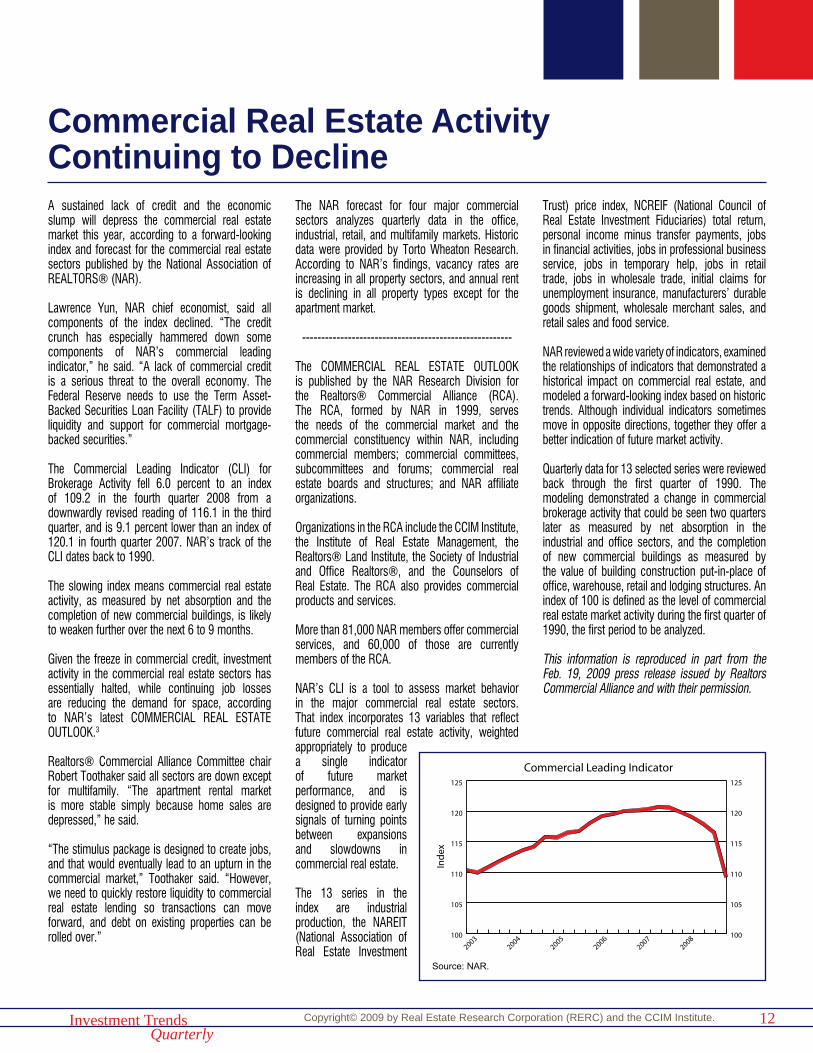
The Commercial Leading Indicator (CLI) for Brokerage Activity fell 6.0 percent to an index of 109.2 in the fourth quarter 2008 from a downwardly revised reading of 116.1 in the third quarter, and is 9.1 percent lower than an index of 120.1 in fourth quarter 2007. NAR’s track of the CLI dates back to 1990.
The slowing index means commercial real estate activity, as measured by net absorption and the completion of new commercial buildings, is likely to weaken further over the next 6 to 9 months.
Given the freeze in commercial credit, investment activity in the commercial real estate sectors has essentially halted, while continuing job losses are reducing the demand for space, according to NAR’s latest COMMERCIAL REAL ESTATE OUTLOOK.3
Realtors® Commercial Alliance Committee chair Robert Toothaker said all sectors are down except for multifamily. “The apartment rental market is more stable simply because home sales are depressed,” he said.
“The stimulus package is designed to create jobs, and that would eventually lead to an upturn in the commercial market,” Toothaker said. “However, we need to quickly restore liquidity to commercial real estate lending so transactions can move forward, and debt on existing properties can be rolled over.”
The NAR forecast for four major commercial sectors analyzes quarterly data in the office, industrial, retail, and multifamily markets. Historic data were provided by Torto Wheaton Research. According to NAR’s findings, vacancy rates are increasing in all property sectors, and annual rent is declining in all property types except for the apartment market.
-------------------------------------------------------
The COMMERCIAL REAL ESTATE OUTLOOK is published by the NAR Research Division for the Realtors® Commercial Alliance (RCA). The RCA, formed by NAR in 1999, serves the needs of the commercial market and the commercial constituency within NAR, including commercial members; commercial committees, subcommittees and forums; commercial real estate boards and structures; and NAR affiliate organizations.
Organizations in the RCA include the CCIM Institute, the Institute of Real Estate Management, the Realtors® Land Institute, the Society of Industrial and Office Realtors®, and the Counselors of Real Estate. The RCA also provides commercial products and services.
More than 81,000 NAR members offer commercial services, and 60,000 of those are currently members of the RCA.
NAR’s CLI is a tool to assess market behavior in the major commercial real estate sectors. That index incorporates 13 variables that reflect future commercial real estate activity, weighted appropriately to produce a single indicator of future market performance, and is designed to provide early signals of turning points between expansions and slowdowns in commercial real estate.
The 13 series in the index are industrial production, the NAREIT (National Association of Real Estate Investment
Trust) price index, NCREIF (National Council of Real Estate Investment Fiduciaries) total return, personal income minus transfer payments, jobs in financial activities, jobs in professional business service, jobs in temporary help, jobs in retail trade, jobs in wholesale trade, initial claims for unemployment insurance, manufacturers’ durable goods shipment, wholesale merchant sales, and retail sales and food service.
NAR reviewed a wide variety of indicators, examined the relationships of indicators that demonstrated a historical impact on commercial real estate, and modeled a forward-looking index based on historic trends. Although individual indicators sometimes move in opposite directions, together they offer a better indication of future market activity.
Quarterly data for 13 selected series were reviewed back through the first quarter of 1990. The modeling demonstrated a change in commercial brokerage activity that could be seen two quarters later as measured by net absorption in the industrial and office sectors, and the completion of new commercial buildings as measured by the value of building construction put-in-place of office, warehouse, retail and lodging structures. An index of 100 is defined as the level of commercial real estate market activity during the first quarter of 1990, the first period to be analyzed.
This information is reproduced in part from the Feb. 19, 2009 press release issued by Realtors Commercial Alliance and with their permission.
Commercial Real Estate ActivityContinuing to Decline
100
105
110
115
120
125
100
105
110
115
120
125
20082007
20062005
20042003
Ind
ex
Commercial Leading Indicator
Source: NAR.
13Investment TrendsQuarterly
Copyright© 2009 by Real Estate Research Corporation (RERC) and the CCIM Institute.
NationalMarketAnalysis
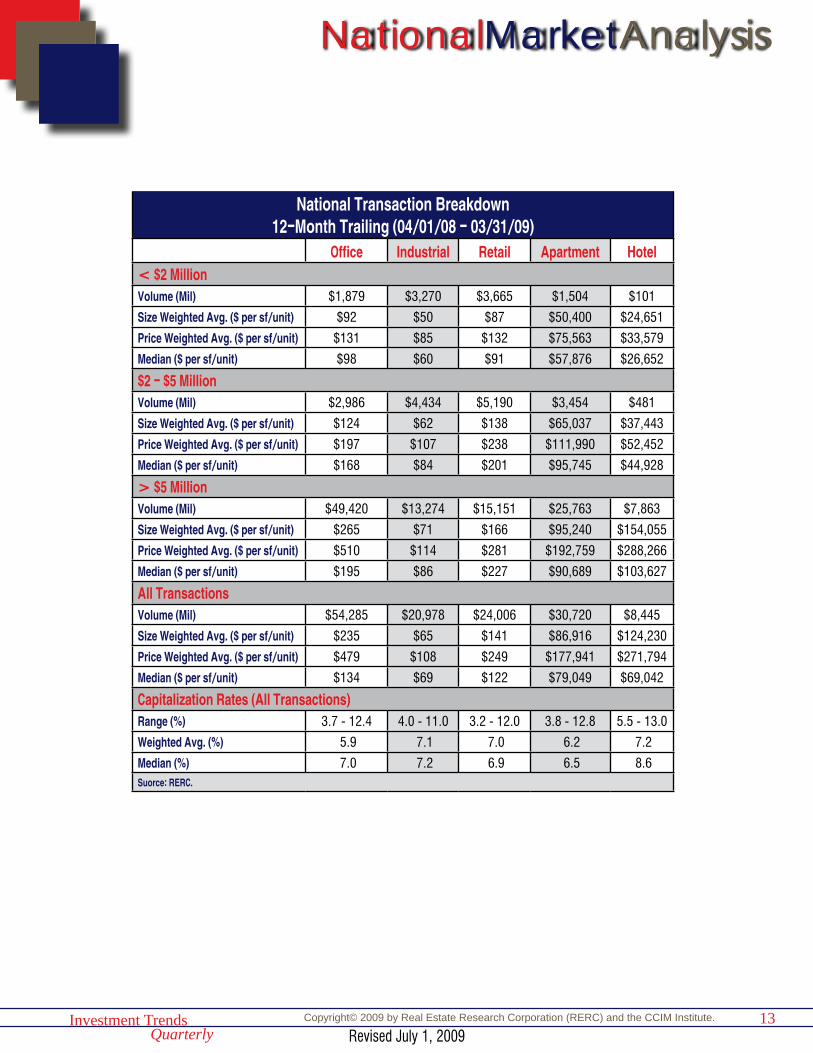
National Transaction Breakdown12-Month Trailing (04/01/08 - 03/31/09)
Office Industrial Retail Apartment Hotel< $2 MillionVolume (Mil) $1,879 $3,270 $3,665 $1,504 $101
Size Weighted Avg. ($ per sf/unit) $92 $50 $87 $50,400 $24,651
Price Weighted Avg. ($ per sf/unit) $131 $85 $132 $75,563 $33,579
Median ($ per sf/unit) $98 $60 $91 $57,876 $26,652
$2 - $5 MillionVolume (Mil) $2,986 $4,434 $5,190 $3,454 $481
Size Weighted Avg. ($ per sf/unit) $124 $62 $138 $65,037 $37,443
Price Weighted Avg. ($ per sf/unit) $197 $107 $238 $111,990 $52,452
Median ($ per sf/unit) $168 $84 $201 $95,745 $44,928
> $5 MillionVolume (Mil) $49,420 $13,274 $15,151 $25,763 $7,863
Size Weighted Avg. ($ per sf/unit) $265 $71 $166 $95,240 $154,055
Price Weighted Avg. ($ per sf/unit) $510 $114 $281 $192,759 $288,266
Median ($ per sf/unit) $195 $86 $227 $90,689 $103,627
All TransactionsVolume (Mil) $54,285 $20,978 $24,006 $30,720 $8,445
Size Weighted Avg. ($ per sf/unit) $235 $65 $141 $86,916 $124,230
Price Weighted Avg. ($ per sf/unit) $479 $108 $249 $177,941 $271,794
Median ($ per sf/unit) $134 $69 $122 $79,049 $69,042
Capitalization Rates (All Transactions)Range (%) 3.7 - 12.4 4.0 - 11.0 3.2 - 12.0 3.8 - 12.8 5.5 - 13.0
Weighted Avg. (%) 5.9 7.1 7.0 6.2 7.2
Median (%) 7.0 7.2 6.9 6.5 8.6 Suorce: RERC.
Revised July 1, 2009
14Investment TrendsQuarterly
Copyright© 2009 by Real Estate Research Corporation (RERC) and the CCIM Institute.
NationalMarketAnalysis
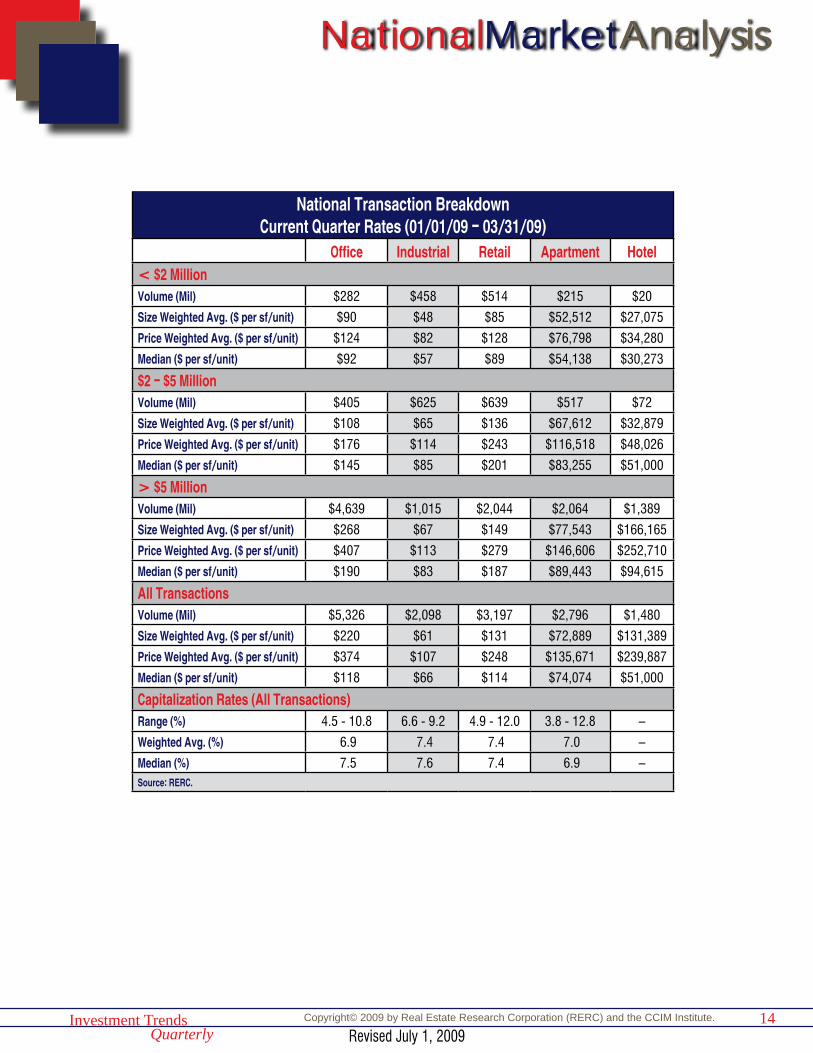
National Transaction BreakdownCurrent Quarter Rates (01/01/09 - 03/31/09)
Office Industrial Retail Apartment Hotel< $2 MillionVolume (Mil) $282 $458 $514 $215 $20
Size Weighted Avg. ($ per sf/unit) $90 $48 $85 $52,512 $27,075
Price Weighted Avg. ($ per sf/unit) $124 $82 $128 $76,798 $34,280
Median ($ per sf/unit) $92 $57 $89 $54,138 $30,273
$2 - $5 MillionVolume (Mil) $405 $625 $639 $517 $72
Size Weighted Avg. ($ per sf/unit) $108 $65 $136 $67,612 $32,879
Price Weighted Avg. ($ per sf/unit) $176 $114 $243 $116,518 $48,026
Median ($ per sf/unit) $145 $85 $201 $83,255 $51,000
> $5 MillionVolume (Mil) $4,639 $1,015 $2,044 $2,064 $1,389
Size Weighted Avg. ($ per sf/unit) $268 $67 $149 $77,543 $166,165
Price Weighted Avg. ($ per sf/unit) $407 $113 $279 $146,606 $252,710
Median ($ per sf/unit) $190 $83 $187 $89,443 $94,615
All TransactionsVolume (Mil) $5,326 $2,098 $3,197 $2,796 $1,480
Size Weighted Avg. ($ per sf/unit) $220 $61 $131 $72,889 $131,389
Price Weighted Avg. ($ per sf/unit) $374 $107 $248 $135,671 $239,887
Median ($ per sf/unit) $118 $66 $114 $74,074 $51,000
Capitalization Rates (All Transactions)Range (%) 4.5 - 10.8 6.6 - 9.2 4.9 - 12.0 3.8 - 12.8 –
Weighted Avg. (%) 6.9 7.4 7.4 7.0 –
Median (%) 7.5 7.6 7.4 6.9 –Source: RERC.
Revised July 1, 2009
OfficePropertySector
15Investment TrendsQuarterly
Copyright© 2009 by Real Estate Research Corporation (RERC) and the CCIM Institute.
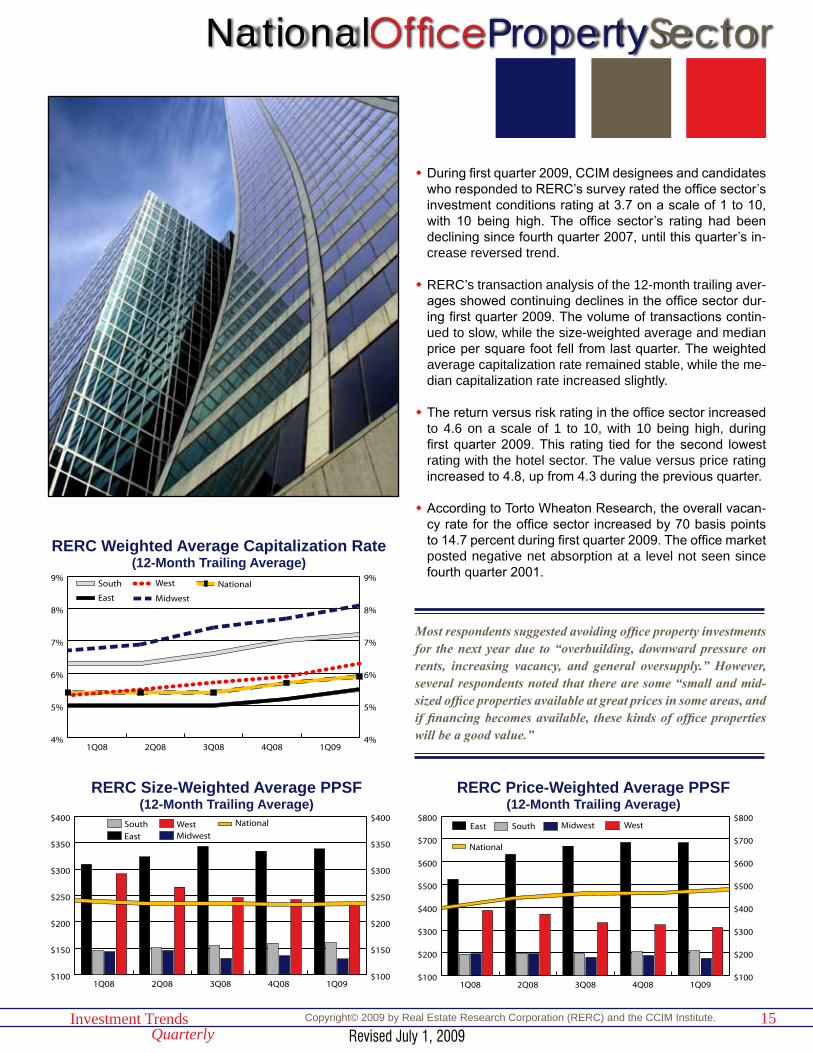
w During first quarter 2009, CCIM designees and candidates who responded to RERC’s survey rated the office sector’s investment conditions rating at 3.7 on a scale of 1 to 10, with 10 being high. The office sector’s rating had been declining since fourth quarter 2007, until this quarter’s in-crease reversed trend.
w RERC’s transaction analysis of the 12-month trailing aver-ages showed continuing declines in the office sector dur-ing first quarter 2009. The volume of transactions contin-ued to slow, while the size-weighted average and median price per square foot fell from last quarter. The weighted average capitalization rate remained stable, while the me-dian capitalization rate increased slightly.
w The return versus risk rating in the office sector increased to 4.6 on a scale of 1 to 10, with 10 being high, during first quarter 2009. This rating tied for the second lowest rating with the hotel sector. The value versus price rating increased to 4.8, up from 4.3 during the previous quarter.
w According to Torto Wheaton Research, the overall vacan-cy rate for the office sector increased by 70 basis points to 14.7 percent during first quarter 2009. The office market posted negative net absorption at a level not seen since fourth quarter 2001.
4%
5%
6%
7%
8%
9%
4%
5%
6%
7%
8%
9%NationalWest
Midwest
South
East
1Q094Q083Q082Q081Q08
RERC Weighted Average Capitalization Rate(12-Month Trailing Average)
$100
$200
$300
$400
$500
$600
$700
$800
$100
$200
$300
$400
$500
$600
$700
$800
National
WestMidwestSouthEast
1Q094Q083Q082Q081Q08
RERC Price-Weighted Average PPSF(12-Month Trailing Average)
$100
$150
$200
$250
$300
$350
$400
$100
$150
$200
$250
$300
$350
$400NationalWest
MidwestSouth
East
1Q094Q083Q082Q081Q08
RERC Size-Weighted Average PPSF(12-Month Trailing Average)
OfficeOfficeNational
Most respondents suggested avoiding office property investments for the next year due to “overbuilding, downward pressure on rents, increasing vacancy, and general oversupply.” However, several respondents noted that there are some “small and mid-sized office properties available at great prices in some areas, and if financing becomes available, these kinds of office properties will be a good value.”
Revised July 1, 2009

16Investment TrendsQuarterly
Copyright© 2009 by Real Estate Research Corporation (RERC) and the CCIM Institute.
IndustrialPropertySector
w CCIM survey respondents rated the investment conditions of the industrial sector at 4.4 on a scale of 1 to 10, with 10 being high, during first quarter 2009. The industrial sec-tor received the second highest rating among the property types.
w RERC’s transaction analysis for the industrial sector showed slightly lower average prices for first quarter 2009. The weighted average capitalization rate increased by 40 basis points to 7.1 percent, while the median capitalization rate increased by 20 basis points.
w The industrial sector received a return versus risk rating of 5.3 on a scale of 1 to 10, with 10 being high, during first quarter 2009, tying for the second highest rating among the property types. The value versus price for the industrial sector was rated at 5.4, indicating the value of the proper-ties outweighs the price.
w The overall availability rate for industrial space increased by 80 basis points to 12.2 percent during first quarter 2009. According to Torto Wheaton Research, this is a higher availability rate than that noted during the last two recessions, and is the highest since Torto Wheaton began tracking data for the industrial sector in 1989.
5%
6%
7%
8%
9%
10%
5%
6%
7%
8%
9%
10%NationalWest
Midwest
South
East
1Q094Q083Q082Q081Q08
RERC Weighted Average Capitalization Rate(12-Month Trailing Average)
$0
$50
$100
$150
$200
$0
$50
$100
$150
$200NationalWest
Midwest
South
East
1Q094Q083Q082Q081Q08
RERC Price-Weighted Average PPSF(12-Month Trailing Average)
$40
$60
$80
$100
$120
$140
$40
$60
$80
$100
$120
$140NationalWest
Midwest
South
East
1Q094Q083Q082Q081Q08
RERC Size-Weighted Average PPSF(12-Month Trailing Average)
National
Industrial may be a good sector in which to invest due to pent-up demand in some areas, and “more focus from Congress on U.S. manufacturing and less on off-shore manufacturing.” Long-term industrial may offer good opportunities because the sector has the “shortest ramp-up time” and “requires little capital, high going-in cap rates=instant returns, and a more stable tenant base.” However, in some areas, industrial “still seems to be flat-lining.”
Revised July 1, 2009
17Investment TrendsQuarterly
Copyright© 2009 by Real Estate Research Corporation (RERC) and the CCIM Institute.
RetailPropertySector
5.5%
6.0%
6.5%
7.0%
7.5%
8.0%
5.5%
6.0%
6.5%
7.0%
7.5%
8.0%NationalWest
Midwest
South
East
1Q094Q083Q082Q081Q08
RERC Weighted Average Capitalization Rate(12-Month Trailing Average)
$100
$150
$200
$250
$300
$350
$400
$100
$150
$200
$250
$300
$350
$400NationalWest
Midwest
South
East
1Q094Q083Q082Q081Q08
RERC Price-Weighted Average PPSF(12-Month Trailing Average)
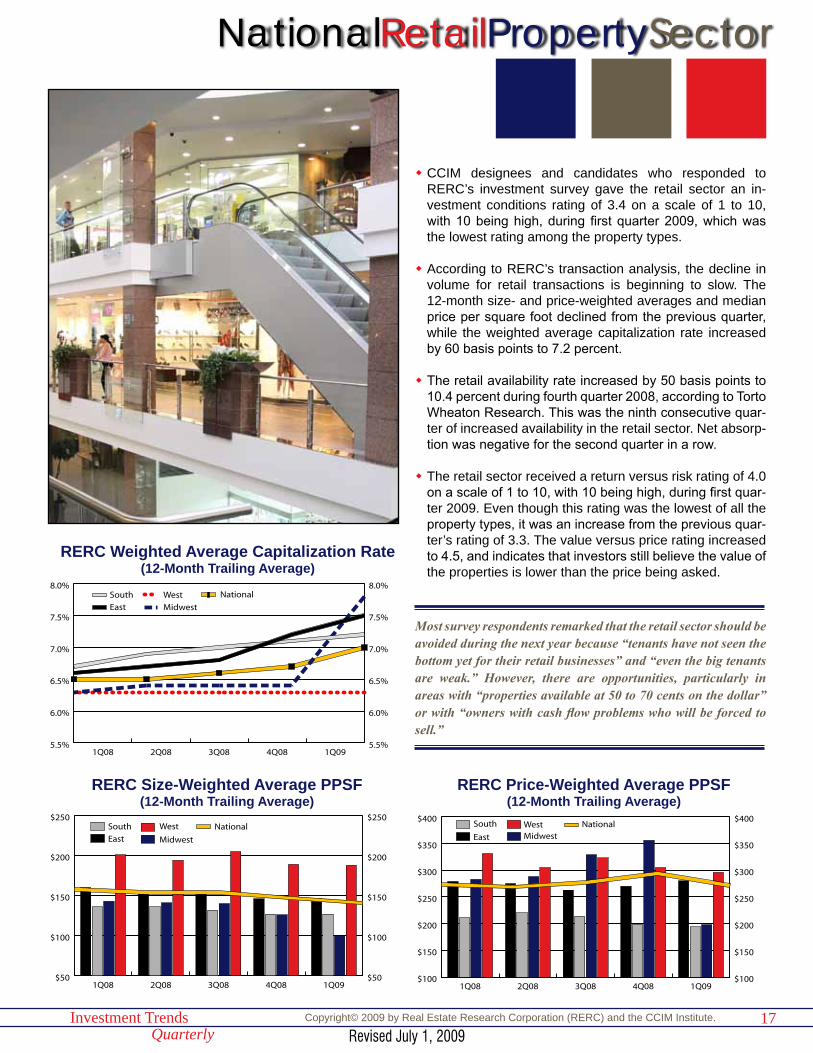
w CCIM designees and candidates who responded to RERC’s investment survey gave the retail sector an in-vestment conditions rating of 3.4 on a scale of 1 to 10, with 10 being high, during first quarter 2009, which was the lowest rating among the property types.
w According to RERC’s transaction analysis, the decline in volume for retail transactions is beginning to slow. The 12-month size- and price-weighted averages and median price per square foot declined from the previous quarter, while the weighted average capitalization rate increased by 60 basis points to 7.2 percent.
w The retail availability rate increased by 50 basis points to 10.4 percent during fourth quarter 2008, according to Torto Wheaton Research. This was the ninth consecutive quar-ter of increased availability in the retail sector. Net absorp-tion was negative for the second quarter in a row.
w The retail sector received a return versus risk rating of 4.0 on a scale of 1 to 10, with 10 being high, during first quar-ter 2009. Even though this rating was the lowest of all the property types, it was an increase from the previous quar-ter’s rating of 3.3. The value versus price rating increased to 4.5, and indicates that investors still believe the value of the properties is lower than the price being asked.
$50
$100
$150
$200
$250
$50
$100
$150
$200
$250NationalWest
Midwest
South
East
1Q094Q083Q082Q081Q08
RERC Size-Weighted Average PPSF(12-Month Trailing Average)
National
Most survey respondents remarked that the retail sector should be avoided during the next year because “tenants have not seen the bottom yet for their retail businesses” and “even the big tenants are weak.” However, there are opportunities, particularly in areas with “properties available at 50 to 70 cents on the dollar” or with “owners with cash flow problems who will be forced to sell.”
Revised July 1, 2009
18Investment TrendsQuarterly
Copyright© 2009 by Real Estate Research Corporation (RERC) and the CCIM Institute.
ApartmentPropertySector
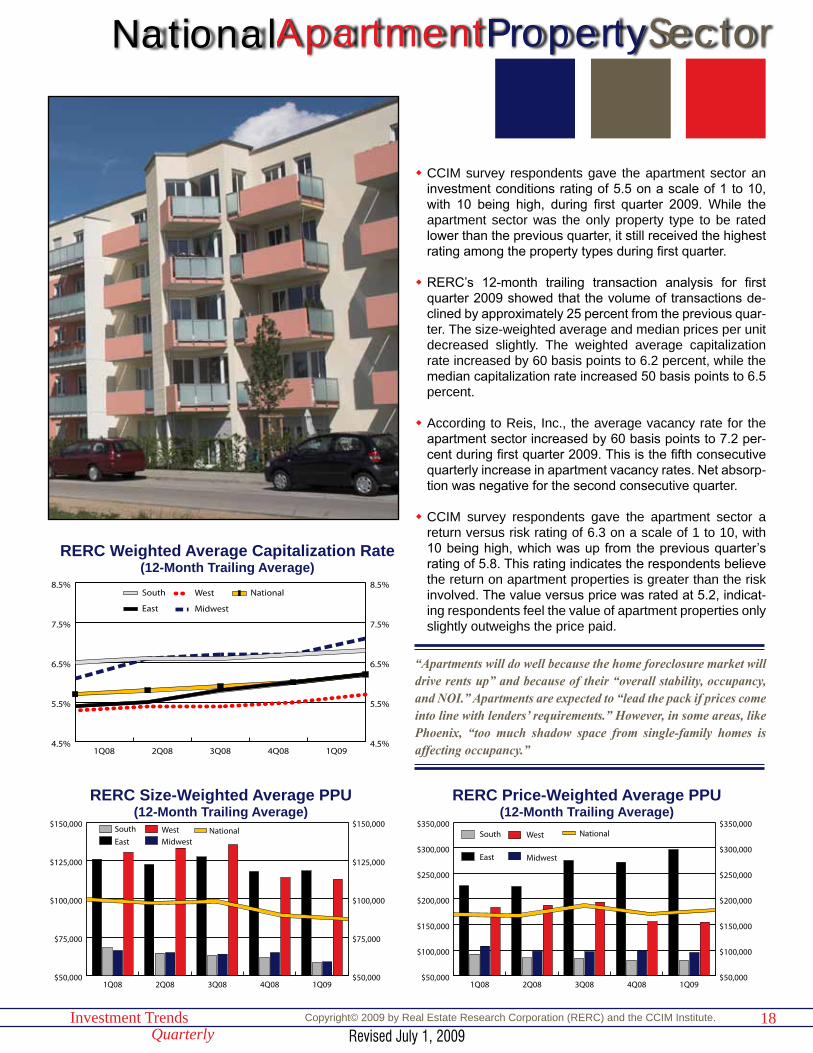
w CCIM survey respondents gave the apartment sector an investment conditions rating of 5.5 on a scale of 1 to 10, with 10 being high, during first quarter 2009. While the apartment sector was the only property type to be rated lower than the previous quarter, it still received the highest rating among the property types during first quarter.
w RERC’s 12-month trailing transaction analysis for first quarter 2009 showed that the volume of transactions de-clined by approximately 25 percent from the previous quar-ter. The size-weighted average and median prices per unit decreased slightly. The weighted average capitalization rate increased by 60 basis points to 6.2 percent, while the median capitalization rate increased 50 basis points to 6.5 percent.
w According to Reis, Inc., the average vacancy rate for the apartment sector increased by 60 basis points to 7.2 per-cent during first quarter 2009. This is the fifth consecutive quarterly increase in apartment vacancy rates. Net absorp-tion was negative for the second consecutive quarter.
w CCIM survey respondents gave the apartment sector a return versus risk rating of 6.3 on a scale of 1 to 10, with 10 being high, which was up from the previous quarter’s rating of 5.8. This rating indicates the respondents believe the return on apartment properties is greater than the risk involved. The value versus price was rated at 5.2, indicat-ing respondents feel the value of apartment properties only slightly outweighs the price paid.
4.5%
5.5%
6.5%
7.5%
8.5%
4.5%
5.5%
6.5%
7.5%
8.5%NationalWest
Midwest
South
East
1Q094Q083Q082Q081Q08
RERC Weighted Average Capitalization Rate(12-Month Trailing Average)
$50,000
$100,000
$150,000
$200,000
$250,000
$300,000
$350,000
$50,000
$100,000
$150,000
$200,000
$250,000
$300,000
$350,000NationalWest
Midwest
South
East
1Q094Q083Q082Q081Q08
RERC Price-Weighted Average PPU(12-Month Trailing Average)
$50,000
$75,000
$100,000
$125,000
$150,000
$50,000
$75,000
$100,000
$125,000
$150,000NationalWest
Midwest
South
East
1Q094Q083Q082Q081Q08
RERC Size-Weighted Average PPU(12-Month Trailing Average)
ApartmentApartmentNational
“Apartments will do well because the home foreclosure market will drive rents up” and because of their “overall stability, occupancy, and NOI.” Apartments are expected to “lead the pack if prices come into line with lenders’ requirements.” However, in some areas, like Phoenix, “too much shadow space from single-family homes is affecting occupancy.”
Revised July 1, 2009
19Investment TrendsQuarterly
Copyright© 2009 by Real Estate Research Corporation (RERC) and the CCIM Institute.
HotelPropertySector
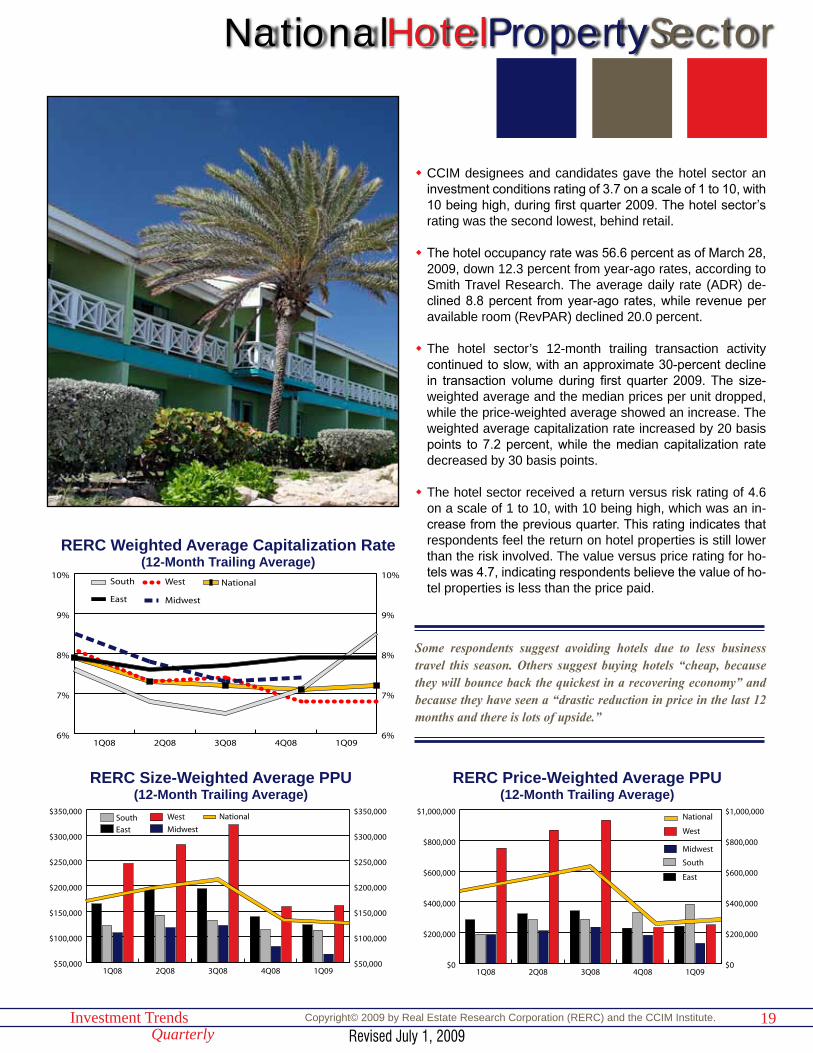
w CCIM designees and candidates gave the hotel sector an investment conditions rating of 3.7 on a scale of 1 to 10, with 10 being high, during first quarter 2009. The hotel sector’s rating was the second lowest, behind retail.
w The hotel occupancy rate was 56.6 percent as of March 28, 2009, down 12.3 percent from year-ago rates, according to Smith Travel Research. The average daily rate (ADR) de-clined 8.8 percent from year-ago rates, while revenue per available room (RevPAR) declined 20.0 percent.
w The hotel sector’s 12-month trailing transaction activity continued to slow, with an approximate 30-percent decline in transaction volume during first quarter 2009. The size-weighted average and the median prices per unit dropped, while the price-weighted average showed an increase. The weighted average capitalization rate increased by 20 basis points to 7.2 percent, while the median capitalization rate decreased by 30 basis points.
w The hotel sector received a return versus risk rating of 4.6 on a scale of 1 to 10, with 10 being high, which was an in-crease from the previous quarter. This rating indicates that respondents feel the return on hotel properties is still lower than the risk involved. The value versus price rating for ho-tels was 4.7, indicating respondents believe the value of ho-tel properties is less than the price paid.
6%
7%
8%
9%
10%
6%
7%
8%
9%
10%NationalWest
Midwest
South
East
1Q094Q083Q082Q081Q08
RERC Weighted Average Capitalization Rate(12-Month Trailing Average)
$0
$200,000
$400,000
$600,000
$800,000
$1,000,000
$0
$200,000
$400,000
$600,000
$800,000
$1,000,000National
West
Midwest
South
East
1Q094Q083Q082Q081Q08
RERC Price-Weighted Average PPU(12-Month Trailing Average)
$50,000
$100,000
$150,000
$200,000
$250,000
$300,000
$350,000
$50,000
$100,000
$150,000
$200,000
$250,000
$300,000
$350,000NationalWest
Midwest
South
East
1Q094Q083Q082Q081Q08
RERC Size-Weighted Average PPU(12-Month Trailing Average)
National
Some respondents suggest avoiding hotels due to less business travel this season. Others suggest buying hotels “cheap, because they will bounce back the quickest in a recovering economy” and because they have seen a “drastic reduction in price in the last 12 months and there is lots of upside.”
Revised July 1, 2009

20Investment TrendsQuarterly
Copyright© 2009 by Real Estate Research Corporation (RERC) and the CCIM Institute.
The first verse from an old hit song called “Nashville Cats” starts this way: “Well, there’s thirteen hundred and fifty two guitar pickers in Nashville.” Recorded by the Lovin’ Spoonful in 1966, the country-themed tune was a somewhat tongue-in-cheek tribute to the Tennessee capitol city and its tre-mendous output of live and recorded country music.
Home to the legendary Grand Ole Opry, Nashville has been the undis-
puted seat of country and its various musical offshoots for decades. In the years following World War II, music pioneers opened small studios along Sixteenth Avenue South on what would be later dubbed “Music Row.” Major record companies like RCA, Decca, and Columbia followed, as did publishing houses, music licensing firms, and other business that served the music industry. Radio networks and radio stations began broadcasts. Giants like Elvis Presley, Chet Atkins, and the Everly Brothers recorded seminal tracks there. Music City was born, and it still lives.
Today, Nashville remains one of the nation’s three music industry meccas, and the vibrant scene draws thou-sands of music fans and professionals from coast to coast, thus contributing to the local economy and preserving a big part of the city’s character. Beyond
the studios and honky tonks, there’s a lot more going on in this progressive, mid-South metropolis.
The seat of Tennessee government, Nashville benefits economically from steady state jobs as well as travel/tourism dollars. Thanks to a strong central city-county government, effec-tive economic development practices, dynamic economic drivers through healthcare, technology, and educa-
By Edward M. Bury, APR
Nashville Tunes inNew Economic Growth...
Beyond the Music
Right:Tennessee
State Capitol
Above: Nashville Music District
21Investment TrendsQuarterly
Copyright© 2009 by Real Estate Research Corporation (RERC) and the CCIM Institute.
tional institutions (there are seven major colleges and universities), over-all affordability, and a central location, Music City dances to a lot of tunes these days and has evolved into a di-verse business center.
According to national publications, Nashville and the state of Tennessee are great places for business. Forbes ranked Nashville as the 25th best U.S. market for career and business growth, and Site Selection magazine, a leading economic develop-ment journal, ranked Tennes-see as having the second-best business climate in the nation. And, Expansion Management ranked Nashville number one in its “50 Hottest Cities” poll for business expansion—for the second consecutive year.
Solid local government is a key reason for the region’s econom-ic success. The metro area of 1.5 million is under the admin-istration of the Metropolitan Government of Nashville and Davidson County, which is com-prised of an elected mayor and Metropolitan Council. Formed in 1963, the government is a consolidation of the two bod-ies—city and county—into a new form of elected administra-tion. According to an excerpt from an online history pub-lished by the Nashville Public Library, “Nashville became the national pioneer in metropolitan organization. Although other
cities had partial consolidation, Nash-ville was the first city in the country to achieve true consolidation.” This con-solidation helped the burgeoning area manage growth and provide needed services as the population shifted to the suburbs in the 1950s.
The local economic development en-gine, the Nashville Area Chamber of Commerce, also is credited with be-ing a catalyst for sound and smart growth.
“We have a truly outstanding cham-ber of commerce,” said Jim Dunn, CCIM, president of Keystone Realty Services of Madison, Tenn., and a 40-year Nashville commercial real es-tate veteran. “Back in the 1970s, the chamber concentrated on luring the smokestack-type of industries, and we got some of those. But one of the leaders had the foresight to say that those really aren’t the kind of jobs we
need in the future—not that we would turn them down.”
Dunn, president of the Middle Tennes-see CCIM Chapter, said new minds on the Chamber later crafted a 10-year plan to bring a wider range of businesses to energize the economy. Their efforts paid off handsomely over the past decade. Dell Computers built its first manufacturing and distribution facility outside of Texas in Nashville, bringing 3,200 jobs. Caremark Phar-macy Services, the parent of the CVS pharmacy retailer, opened its world headquarters in Nashville. The pub-licly-traded Louisiana Pacific Building Materials Company, one of the na-tion’s largest, relocated its corporate headquarters to the city in 2004 from Portland. And, in 2005, automaker Nissan moved its North American headquarters to Franklin, part of the metro area, along with 1,300 jobs. Ac-cording to Expansion Management,
Nashville Transaction Breakdown12-Month Trailing (04/01/08 - 03/31/09)
Office Industrial Retail Apartment Hotel< $5 MillionVolume (Mil) $63 $82 $110 $20 $12
Size Weighted Avg. ($ per sf/unit) $106 $41 $130 $44,255 $30,893
Price Weighted Avg. ($ per sf/unit) $138 $55 $183 $50,026 $33,646
Median ($ per sf/unit) $104 $49 $116 $40,000 $33,176
> $5 MillionVolume (Mil) $211 $27 $155 $272 –
Size Weighted Avg. ($ per sf/unit) $168 $31 $176 $63,153 –
Price Weighted Avg. ($ per sf/unit) $175 $33 $238 $81,432 –
Median ($ per sf/unit) $168 $35 $211 $44,030 –
All TransactionsVolume (Mil) $274 $110 $266 $292 $49
Size Weighted Avg. ($ per sf/unit) $148 $38 $153 $61,371 $48,418
Price Weighted Avg. ($ per sf/unit) $167 $50 $215 $79,296 $55,281
Median ($ per sf/unit) $117 $43 $119 $43,403 $47,414
Capitalization Rates (All Transactions)Weighted Average (%) 6.8 – 7.2 6.4 –
Median (%) 6.9 – 7.3 6.3 –Source: RERC.
Above: Grand Old Opry
Revised July 1, 2009
22Investment TrendsQuarterly
Copyright© 2009 by Real Estate Research Corporation (RERC) and the CCIM Institute.
Nissan’s decision marks the 17th cor-porate headquarters announcement in Tennessee since January 2003.
In May, the Chamber reported that 74 companies relocated to or expanded operations in the metro area since late 2008, creating 5,722 new jobs. And, the group is negotiating with 26 other companies on job relocation or reten-tion.
Healthcare is widely considered a sought-after economic driver, and the city has emerged as a leader in that field. Healthcare companies based in the Nashville area employ an esti-mated 430,000 workers globally and more than 94,000 in middle Tennes-see alone. The Hospital Corporation of America (HCA), the largest private operator of health care facilities in the world, was founded in and remains headquartered there.
A key factor also paramount to Nash-ville’s boom is its geographic location. Just about in the center of Tennessee, the market can boast six Interstate highway routes that link Nashville with major distribution points nation-wide. Dunn pointed out that from a demographic perspective, the market is within a 24-hour drive of 75 percent of the U.S. population; and, from a climatic perspective, Nashville en-joys four seasons but avoids the ex-tremes—the average low in January is 28 degrees, and the average high in August is 88 degrees.
Much of Nashville’s economic success in terms of corporate relocations has taken place outside the city’s down-town core. But there is also lots go-ing on downtown on the banks of the Cumberland River. In April 2009, the Metropolitan Council approved a land acquisition bill to borrow up to $75 million for land to build a new conven-tion center, a project pushed by Mayor Karl Dean. Dunn noted that federal stimulus funds should help with major infrastructure projects, like improve-ments to an existing commuter rail system and “some significant bridge enhancements.”
A 24-hour city is emerging as multifam-ily residential properties are open or being developed along Church Street and in pocket neighborhoods like North Capitol, SoBro, and the Gulch. The Nashville Downtown Partnership reports: “More condos were sold in downtown Nashville during the first 2 quarters of 2008 than in all of 2007.
Over 900 condos—more than in the 5 previous years combined—are ex-pected to close by the end of 2008. Over 400 more condos will close in 2009.”
Nashvillians seeking a downtown ad-dress have a lot of options at prices far below comparable properties in other major metro markets. Home seekers can opt for a home at The Viridian, a new, luxury 31-story condo property with unit prices ranging from $214,000 to $1.4 million, or a renovated unit at the Lofts of Werthann Mills, where a condominium home developed in a century-old factory building starts at $134,500 and jumps to $429,900.
These and other multifamily homes are within walking distance of the growing arts and entertainment options down-town—options beyond country music, of course. But rest assured, in Music City the music rarely stops.
Above: Nashville Skyline
23Investment TrendsQuarterly
Copyright© 2009 by Real Estate Research Corporation (RERC) and the CCIM Institute.
B.K. Allen, CCIMB.K. Allen Real EstatePotomac Falls, Virginia
Todd Clarke, CCIMNew Mexico ApartmentsAlbuquerque, New Mexico
Wayne D’Amico, CCIMProperty PoliticsEssex, Connecticut
Paul Fetscher, CCIMGreat American BrokerageLong Beach, New York
Stephen FurnaryING Clarion PartnersNew York, New York
Breck HansonLaSalle Bank, N.A.Chicago, Illinois
Dennis MartinRREEF/DB Real EstateNew York, New York
Jeff Lyon, CCIMGVA Kidder MathewsSeattle, Washington
Buzz McCoyBuzz McCoy Associates, Inc.Los Angeles, California
Tom Nordstrom, CCIMAEGON USA Realty Advisors, Inc.Cedar Rapids, Iowa
Art PasquerellaBerwind Property Group, Inc.Philadelphia, Pennsylvania
Duncan Patterson, CCIMPatterson-Woods AssociatesGreenville, Delaware
Gary M. Ralston, CCIM, SIOR, SRS, CPM, CREFlorida Retail Development, LLCWinter Park, Florida
Cynthia Shelton, CCIMColliers ArnoldOrlando, Florida
Frank Simpson, CCIMThe Simpson CompanyGainesville, Georgia
Allen SmithPrudential Investment Managment ServicesParsippany, New Jersey
Richard SokolovSimon Property GroupIndianapolis, Indiana
John Stone, CCIMJohn M. Stone CompanyDallas, Texas
Dewey Struble, CCIMSperry Van NessReno, Nevada
Julien StudleyJulien Studley, Inc.New York, New York
Allan SweetAMLI Residential Properties TrustChicago, Illinois
Garry Weiss, CCIMFirst Industrial Realty TrustChicago, Illinois
Sam ZellEquity Group InvestmentsChicago, Illinois
RERC~CCIM Investment Trends Quarterly
RERC Editorial Staff
PublisherKenneth P. Riggs, Jr.CFA®, CRE, FRICS, MAI, CCIM
Editor-in-ChiefBarb Bush
Lead AnalystBrian Velky
Research AnalystsGreg PhilippCliff CarlsonCharles GohrMorgan Westpfahl
Design EditorMichelle Houlgrave
Data ManagementBen NeilDaniel Warner
Production CommitteeTerri Cotter
Research AssistantsJeffrey HarmsDavid KellyHerinomena RakotoariveloAnthony Tholkes
CCIM Institute
PresidentCharles “Mac” McClure, CCIM
President-ElectRichard Juge, CCIM
First Vice PresidentFrank Simpson, CCIM
Chief Executive OfficerJonathan Salk
Director of Public RelationsEdward M. Bury, APR
CCIM Member Services CommitteeBrent Case, CCIM, ChairmanMiriam Campos-Root, CCIM, Vice Chairman
Immediate Past ChairmanCCIM Member Services CommitteeSteve Moriera, CCIM
LiasonCCIM Member Services CommitteeKarl Landreneau, CCIM
Advisory Board Members
Copyright Notice for RERC~CCIM Investment Trends Quarterly
Copyright© 2009 by Real Estate Research Corporation (RERC) and the CCIM Institute. All rights reserved. No part of this publication may be reproduced, duplicated, or copied in any form, includ-ing electronic forwarding or copying, xerography, microfilm, or other methods, or incorporated into any information retrieval system, without the written permission of RERC and the CCIM Institute.
24Investment TrendsQuarterly
Copyright© 2009 by Real Estate Research Corporation (RERC) and the CCIM Institute.
Acknowledgements
REALTORS® Commercial Alliance of the National Association of REALTORS®
NAR PresidentCharles McMillan, CIPS
NAR Executive Vice President/CEODale A. Stinton
RCA Committee RepresentativeRobert Toothaker, CPM
NAR Vice President of Commercial Real EstateJan M. Hope
Real Estate Research CorporationFounded more than 75 years ago, Real Estate Research Corporation (RERC) was the nation’s first independent real estate firm that specialized in both real estate research and analysis. Recognized as a pioneer in the art of real es-tate management and for monitoring key sectors of the economy that influence the real estate industry, RERC has retained its place as one of the industry’s leading real estate investment trends analysts through the publication of such reports as Expectations & Market Realities in Real Estate and the RERC Real Estate Report. Today, RERC is known for its research publications and market studies, commercial property valuations, com-plex consulting assignments, portfolio manage-ment and technology services, and independent fiduciary services.
The CCIM InstituteThe CCIM Institute, headquartered in Chicago, confers the Certified Commer-cial Investment Member designation through an extensive curriculum of 200 classroom hours in addition to professional experience requirements. CCIMs are recognized experts in commercial real estate brokerage, leasing, asset management, valuation, and investment analysis, and form a business net-work encompassing more than 1,000 markets throughout North America, Eu-rope, Asia and the Caribbean. There currently are more than 8,600 CCIM designees, with an additional 8,200 professionals pursuing the designation. CCIM Institute is an affiliate of the National Association of REALTORS®. Visit www.ccim.com.
REALTORS® Commercial Alliance of the National Association of REALTORS®
The REALTORS® Commercial Alliance (RCA) is the commercial division of the National Association of REALTORS® (NAR) that connects commercial real es-tate professionals and exchanges valuable information that contributes to their success. RCA in partnership with NAR’s commercial affiliates—CCIM Institute, the Counselors of Real Estate (CRE), the Institute of Real Estate Management (IREM), the REALTORS® Land Institute (RLI), and the Society of Industrial and Office REALTORS® (SIOR)—is dedicated to collaboration with and building on the strengths of each affiliate entity to benefit the real estate industry. RCA works to serve the needs of members, and to shape and unify the commercial real estate industry through valuable products and services, technology initia-tives, public policy advocacy, education, and research.
The RERC/CCIM Investment Trends Quarterly is produced by Real Estate Research Corporation (RERC) in association with and for members of the CCIM Institute. The RERC/CCIM Invest-ment Trends Quarterly is sponsored by the REALTORS® Com-mercial Alliance of the National Association of REALTORS®.
25Investment TrendsQuarterly
Copyright© 2009 by Real Estate Research Corporation (RERC) and the CCIM Institute.
RealEstateResearchCorporation
Founded in 1931, Real Estate Research Corporation is one of the longest-serv-ing and most recognized national firms devoted to real property research, valu-ation, real estate consulting, indepen-dent fiduciary services, and portfolio services.
“
”
Offices located throughout the U.S., with headquarters in Chicago
LeadershipKenneth P. Riggs, Jr.CFA®, CRE, FRICS, MAI, CCIMPresident & CEO
Jules H. Marling, III, CRE, FRICS, MAIManaging Director
Del H. Kendall, CRE, MAIManaging Director
Donald A. Burns, CRE, FRICS, MAIManaging Director
Gregory P. Kendall, CRE, MAIManaging Director
Kent D. Steele, CRE, FRICS, MAIManaging Director
William L. Corbin, MAIManaging Director
Standard PublicationsRERC Real Estate Report
RERC/CCIM Investment Trends Quarterly
Expectations & Market Realities in Real Estate
Real Estate Research Corporation980 North Michigan Avenue, Suite 1110Chicago, IL 60611-4522Phone: 319.352.1500Fax: 319.352.4050www.RERC.com
Explore our services... ■ Specialized Research■ Independent Fiduciary Services■ Fairness Opinions■ Litigation Support■ Consulting■ Portfolio Services■ Commercial Valuation■ Financial Risk Management■ Market Research & Analysis■ Appraisal Management Services
IndependentTo ensure objectivity and independence, RERC does not engage in any activity that may conflict with the best interests of our cli-ents. As an impartial observer of the markets, RERC is able to collect and synthesize data and commentary unavailable to less independent organizations.
UniqueRERC brings unique and diverse skills to solving complex real estate issues. RERC’s innovative approach to problem solving is fostered by the diverse education and professional backgrounds of our team members.
ExpertiseRERC’s expertise originates from a national presence and per-spective, coupled with local market knowledge gained through the completion of hundreds of engagements annually in every major market. Our clients have found that RERC is relationship-oriented, focusing first and foremost on our clients’ and custom-ers’ needs, and delivering the highest quality products and ser-vices. RERC is an SEC-registered advisor.
27Investment TrendsQuarterly
Copyright© 2009 by Real Estate Research Corporation (RERC) and the CCIM Institute.
Trusted Advice. Proven Performance.
Gold
Bronze
Contributors
Adam Abrams RED Brokerage, LLC Kansas City, MO
Sage Andress Sunmark Realty, Inc. Tampa, FL
Brian Andrus Stonebridge Real Estate Co.
Clearwater, FL
Matthew Arnovitz Arnovitz & Associates Dayton, OH
Ray Ault Ault Commercial Realty, Inc.
Proctor, VT
Bo Barron Sperry Van Ness/The Barron Group
Owensboro, KY
James Barse NAI/Latter & Blum Harvey, LA
Amy Bolan Re/Max Commitment Alliance, OH
Ted Booras United Commercial Partners
Jay Boyle Grubb & Ellis|BRE Commercial
San Diego, CA
Sean Carter First National Bank of Chester County
Lancaster, PA
Michael Cliggitt Cliggitt Realty/Cliggitt Valuation
Lakeland, FL
Terry L. Conley TLC - The Location Connection, Inc
Cassville, GA
Chuck Connely C.C. Connely &Associates, LLC
Kansas City, MO
A. Nicholas Coppola CoppolaProperties, Inc.
Needham, MA
Brion Costa Costa LandCorporation
Monrovia, CA
Alan Davidson Eagle Commercial Realty Services
Phoenix, AZ
Petra Della Valle Loewe-AdlerInternational, Inc.
Dallas, TX
Bob Dikman The DikmanCompany
Tampa, FL
Robert W. Drayton City of Charlotte Charlotte, NC
Skip Duemeland DuemelandsCommerical
Bismarck, ND
Brian Frank Kilby Valuations Gilbert, AZ
Richard Gonzalez R+S Realty Group Tavares, FL
Andrew Gutwein Coldwell Banker Com-mercial
Indianapolis, IN
Scot E. Hall Wolf Realty Inc. Glendale, AZ
Dennis Hearst Cushman &Wakefield
San Diego, CA
Charles Huett John H. Huett &Associates
Dallas, TX
Genny Jackson Action Real Estate & Auction LLC
Port Saint Lucie, FL
Steve Jacquemin S.J. FinancialGroup, Inc.
Ellisville, MO
Michael Jeppesen Innovision Property Group
Salt Lake City, UT
David LeCavalier ForeFrontProperties LLC
Northbrook, IL
Chris Leon Realty World Salinas, CA
Ed Light Prudential CRES Tampa, FL
Gerard Marino REMAX Realty Group Fort Myers, FL
Randolph T. Mason Lee & Associates Commercial Real Estate Services
Irvine, CA
Paul McArthur Trillium RealtyAdvisors LLC
Hopewell, NJ
Nicholas L Miner Eagle Commercial Realty Services, AMO
Phoenix, AZ
Dave Murray RB Murray Company Springfield, MO
Edward Neill Ed Neill RealEstate Inv.
San Diego, CA
28Investment TrendsQuarterly
Copyright© 2009 by Real Estate Research Corporation (RERC) and the CCIM Institute.
Bronze
Contributors
Scott Nicholson Boise ValleyCommerc
Seattle, WA
Nick Nicketakis CBS Realtors Waukegan, IL
Danny Overton NAI Commercial Properties
Tulsa, OK
Blake Parker Parker Real Estate Services
Logan, UT
Charles Parmelli Colliers Houston& Co.
Somerset, NJ
James Pasquarella CBRE Wayne, PA
Susan Pfeil Aviva Investors North America, Inc.
Des Moines, IA
Amy Pierce Delta Trust & Bank Little Rock, AR
Daniel Poulin Sealy & Company Metairie, LA
Victoria Pruitt Premier 1 Realty Ponte Vedra, FL
Gaston Reboredo Commercial Real Estate Partners LLC
Boca Raton, FL
Lenore Reynolds Bruce Strumpf, Inc. Clearwater, FL
Richard J. Rossiter Jones Lang LaSalle Orlando, FL
Chip Sanders Waveland Property Group, Inc.
Oak Brook, IL
Kurt A. Schenck High Associates Ltd.
Chris Schreiber Kiemle & Hagood Coeur d’Alene, ID
Ed Schuttenberg CB Richard Ellis St. Louis, MO
A. G. Seifert Babson Capital Chicago, IL
Brian Sorrentino ROI Commercial Real Estate, Inc
Taber Sweet Sturm Realty Group Denver, CO
Alan Tapie Grandbridge Atlanta, GA
Pratt Thomas Merrill P Thomas Co. Mobile, AL
Herb Tousley CBC Griffin Company Minneapolis, MN
Robert B. White Grubb & Ellis 1st Com-mercial
Fort Myers, FL
Steve Williamson Transwestern Dallas, TX
Rafeal Wright Future Home Realty Brooksville, FL
Thank youto all
who sharedinformation
for thisreport.

29Investment TrendsQuarterly
Copyright© 2009 by Real Estate Research Corporation (RERC) and the CCIM Institute.
Scope&MethodologyThe analysis provided in the RERC/CCIM Investment Trends Quarterly is conducted by Real Estate Research Corporation (RERC). The information is gathered in raw form from surveys sent to CCIM designees and candidates, and from sales transactions collected from various sources, including CCIM members, various key commercial information exchange organizations (CIEs), the media, assessors’ offices, RERC contacts in the marketplace, and other reliable public and private resources. All sales transactions are aggregated, analyzed, and reported on by RERC. Additional data and forecasts are provided courtesy of the REALTORS® Commercial Alliance and Torto Wheaton Research.
Published quarterly, the RERC/CCIM Investment Trends Quarterly report provides timely insight into transaction volume, pricing, and capitalization rates for the core income-producing properties.
RERC DefinitionsCapitalization Rate: The capitalization rate is defined as the first year “stabilized” net operating income (NOI) (NOI is before capital expenditures – tenant improvements, leasing commissions, reserves – and debt service) divided by the present value (or purchase price). Capitalization rates included are transac-tion-based medians and price-weighted averages.
RERC Capitalization Rate and Ranges: Capitalization rates and ranges listed throughout this report are based on RERC’s proprietary realized capitalization rate model, which includes available transaction-based capitalization rates, NCREIF Index Returns, and other market factors, but is heavily weighted toward transaction-based capitalization rates for each property type within each market.
Price-Weighted Average: The price-weighted average is developed through weighting each asset based on the gross sales price. Therefore, larger dollar properties are given more weight than the smaller dollar properties, with the weighted average reflecting more weight towards institutional real estate.
Size-Weighted Average: The size-weighted average is developed through weighting each asset based on its gross square footage – simply an aggregation of all the gross sales prices divided by the aggregation of the gross square footage.
National/Regional Market Analysis: RERC ranks the investment potential of the metros and property types it covers based on various space market and financial market criteria, including pricing, capitalization rates, vacancy rates, and other factors.
Investment Conditions Rating: A rating of 1 through 10 (with 10 being high) reflecting survey respondents’ collective views of the investment environment for a particular property type in comparison with other property types. The rating may take into account supply and demand, economic conditions, pricing, rental rates, or other factors.
NCREIF DefinitionsNCREIF: The National Council of Real Estate Investment Fiduciaries (NCREIF) is an independent organization dedicated to the compilation, validation, and distribution of performance data for the institutional real estate investment community.
Total Return: The total return includes appreciation (or depreciation), realized capital gain (or loss), and income. It is computed by adding the income and capital appreciation return on a quarterly basis.
Implied Cap Rate (Income Return): The implied capitalization rate measures the portion of return attributable to each property’s NOI. It is computed by divid-ing the total NOI by the total quarterly investment.
Capital Appreciation Return: The capital appreciation return measures the change in market value adjusted for any capital improvements/expenditures and partial sales divided by the average quarterly investment.
Annual and Annualized Returns: Annual returns are computed by chain-linking quarterly rates of return to produce time-weighted rates of return for the an-nual and annualized periods under study. For time periods beyond 1 year, the annualized returns are expressed as the annual compounded rate of return.
Allocation: The distribution, expressed as a percentage of the overall investment, in a particular geographic area by property type.
For a detailed description of the proceeding returns, as well as the calculations used by NCREIF to derive these figures, please visit http://www.ncreif.org/indi-ces.
The combined returns are the weighted average of the returns for each property type according to the proportionate market value of properties surveyed relative to the total market values surveyed during a time period.
RERC Defined Regions and MSAsWest: Alaska, Arizona, California, Colorado, Hawaii, Idaho, Montana, Nevada, New Mexico, Oregon, Utah, Washington, Wyoming
Midwest: Illinois, Indiana, Iowa, Kansas, Michigan, Minnesota, Missouri, Nebraska, North Dakota, Ohio, South Dakota, Wisconsin
South: Alabama, Arkansas, Florida, Georgia, Louisiana, Mississippi, Oklahoma, Tennessee, Texas
East: Connecticut, Delaware, Kentucky, Maine, Maryland, Massachusetts, New Hampshire, New Jersey, New York, North Carolina, Pennsylvania, Rhode Island, South Carolina, Vermont, Virginia, Washington D.C., West Virginia
Metropolitan Statistical Area (MSA): A geographic unit comprised of one or more counties around a central city or urbanized area with 50,000 or more popu-lation. Contiguous counties are included if they have close social and economic links with the area’s population nucleus.
With a few exceptions, the MSAs within this report coincide with the U.S. Office of Management and Budget’s December 2005 definitions for each MSA. For example, St. Paul, Minn., and Bloomington, Minn., as well as many other suburbs, are included within the Minneapolis MSA.
Note of Caution: It is imperative to exercise caution when comparing the data contained herein to previous reports published by RERC. The data herein is not “fixed,” and will be updated and changed as additional transaction information is gathered and analyzed.
Disclaimer: This publication is designed to provide accurate information in regard to the subject matter covered. It is sold with the understanding that the publisher is not engaged in rendering legal or accounting service. The publisher advises that no statement in this issue is to be construed as a recommendation to make any real estate investment or to buy or sell a security or as investment advice. The examples contained in the publication are intended for use as back-ground on the real estate industry as a whole, not as support for any particular real estate investment or security. Although the RERC/CCIM Investment Trends Quarterly uses only sources that it deems reliable and accurate, Real Estate Research Corporation (RERC) does not warrant the accuracy of the information contained herein.
The analysis provided in the information is gathered in raw form from surveys sent to CCIM designees and candidates, and from sales transactions collected from various sources, including CCIM members, various key commercial information exchange organizations (CIEs), the media, assessors’ offices, RERC contacts in the marketplace, and other reliable public and private resources. All sales transactions are aggregated, analyzed, and reported on by RERC. Additional data and forecasts are provided courtesy of the REALTORS® Commercial Alliance and Torto Wheaton Research.

Baltimore • Boston • Charlotte • Hartford • New York City • Norfolk Northern New Jersey • Philadelphia • Pittsburgh • Raleigh • Richmond • Washington, D.C.
East Region
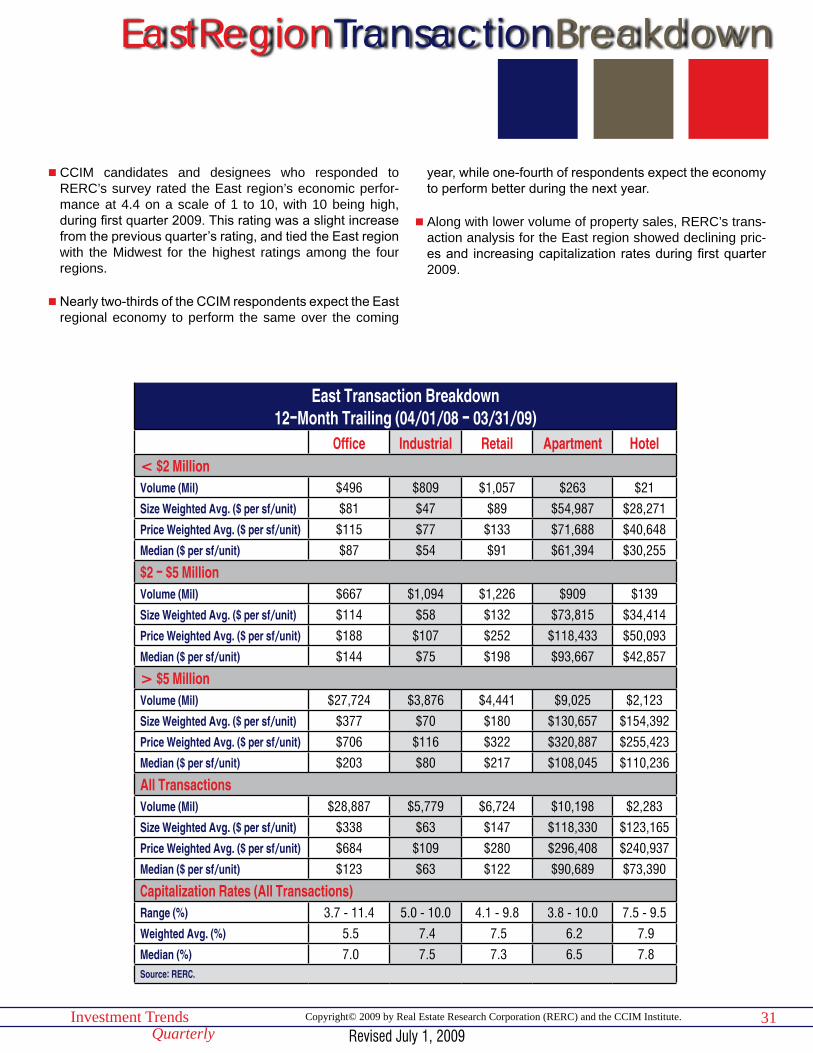
31Investment TrendsQuarterly
Copyright© 2009 by Real Estate Research Corporation (RERC) and the CCIM Institute.
EastRegionTransactionBreakdown
n CCIM candidates and designees who responded to RERC’s survey rated the East region’s economic perfor-mance at 4.4 on a scale of 1 to 10, with 10 being high, during first quarter 2009. This rating was a slight increase from the previous quarter’s rating, and tied the East region with the Midwest for the highest ratings among the four regions.
n Nearly two-thirds of the CCIM respondents expect the East regional economy to perform the same over the coming
year, while one-fourth of respondents expect the economy to perform better during the next year.
n Along with lower volume of property sales, RERC’s trans-action analysis for the East region showed declining pric-es and increasing capitalization rates during first quarter 2009.
East Transaction Breakdown12-Month Trailing (04/01/08 - 03/31/09)
Office Industrial Retail Apartment Hotel< $2 MillionVolume (Mil) $496 $809 $1,057 $263 $21
Size Weighted Avg. ($ per sf/unit) $81 $47 $89 $54,987 $28,271
Price Weighted Avg. ($ per sf/unit) $115 $77 $133 $71,688 $40,648
Median ($ per sf/unit) $87 $54 $91 $61,394 $30,255
$2 - $5 MillionVolume (Mil) $667 $1,094 $1,226 $909 $139
Size Weighted Avg. ($ per sf/unit) $114 $58 $132 $73,815 $34,414
Price Weighted Avg. ($ per sf/unit) $188 $107 $252 $118,433 $50,093
Median ($ per sf/unit) $144 $75 $198 $93,667 $42,857
> $5 MillionVolume (Mil) $27,724 $3,876 $4,441 $9,025 $2,123
Size Weighted Avg. ($ per sf/unit) $377 $70 $180 $130,657 $154,392
Price Weighted Avg. ($ per sf/unit) $706 $116 $322 $320,887 $255,423
Median ($ per sf/unit) $203 $80 $217 $108,045 $110,236
All TransactionsVolume (Mil) $28,887 $5,779 $6,724 $10,198 $2,283
Size Weighted Avg. ($ per sf/unit) $338 $63 $147 $118,330 $123,165
Price Weighted Avg. ($ per sf/unit) $684 $109 $280 $296,408 $240,937
Median ($ per sf/unit) $123 $63 $122 $90,689 $73,390
Capitalization Rates (All Transactions)Range (%) 3.7 - 11.4 5.0 - 10.0 4.1 - 9.8 3.8 - 10.0 7.5 - 9.5
Weighted Avg. (%) 5.5 7.4 7.5 6.2 7.9
Median (%) 7.0 7.5 7.3 6.5 7.8 Source: RERC.
Revised July 1, 2009
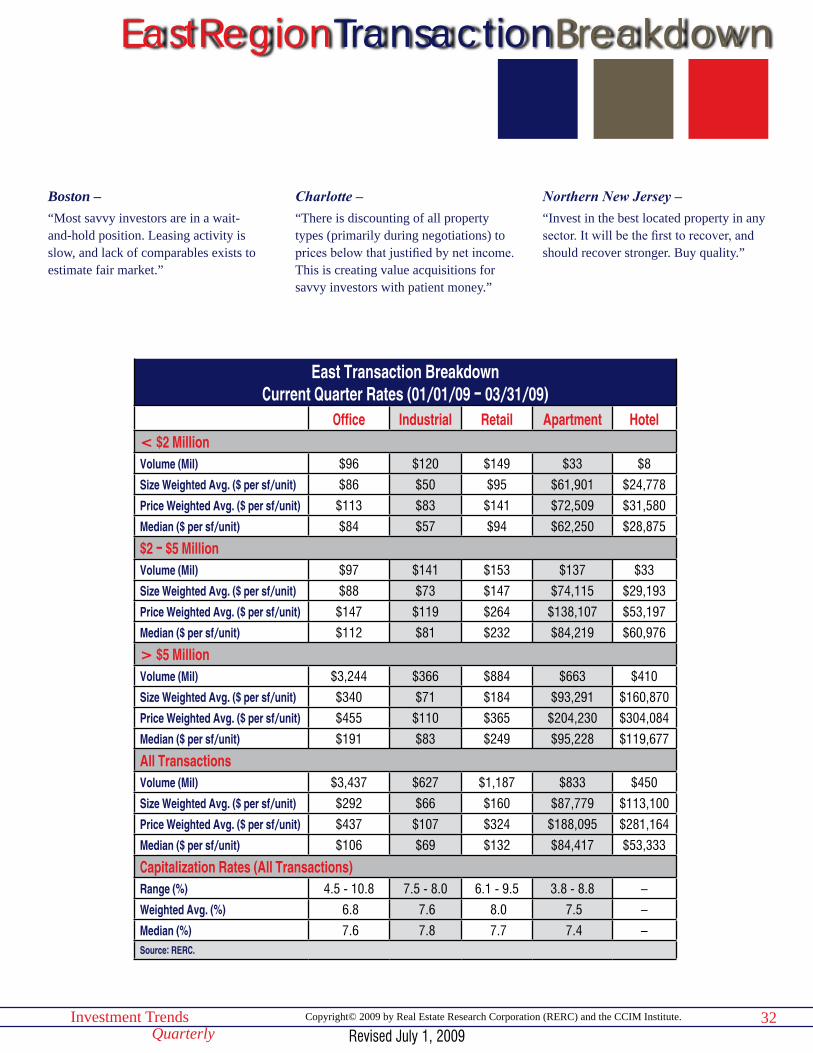
32Investment TrendsQuarterly
Copyright© 2009 by Real Estate Research Corporation (RERC) and the CCIM Institute.
EastRegionTransactionBreakdown
East Transaction BreakdownCurrent Quarter Rates (01/01/09 - 03/31/09)
Office Industrial Retail Apartment Hotel< $2 MillionVolume (Mil) $96 $120 $149 $33 $8
Size Weighted Avg. ($ per sf/unit) $86 $50 $95 $61,901 $24,778
Price Weighted Avg. ($ per sf/unit) $113 $83 $141 $72,509 $31,580
Median ($ per sf/unit) $84 $57 $94 $62,250 $28,875
$2 - $5 MillionVolume (Mil) $97 $141 $153 $137 $33
Size Weighted Avg. ($ per sf/unit) $88 $73 $147 $74,115 $29,193
Price Weighted Avg. ($ per sf/unit) $147 $119 $264 $138,107 $53,197
Median ($ per sf/unit) $112 $81 $232 $84,219 $60,976
> $5 MillionVolume (Mil) $3,244 $366 $884 $663 $410
Size Weighted Avg. ($ per sf/unit) $340 $71 $184 $93,291 $160,870
Price Weighted Avg. ($ per sf/unit) $455 $110 $365 $204,230 $304,084
Median ($ per sf/unit) $191 $83 $249 $95,228 $119,677
All TransactionsVolume (Mil) $3,437 $627 $1,187 $833 $450
Size Weighted Avg. ($ per sf/unit) $292 $66 $160 $87,779 $113,100
Price Weighted Avg. ($ per sf/unit) $437 $107 $324 $188,095 $281,164
Median ($ per sf/unit) $106 $69 $132 $84,417 $53,333
Capitalization Rates (All Transactions)Range (%) 4.5 - 10.8 7.5 - 8.0 6.1 - 9.5 3.8 - 8.8 –
Weighted Avg. (%) 6.8 7.6 8.0 7.5 –
Median (%) 7.6 7.8 7.7 7.4 –Source: RERC.
Boston –“Most savvy investors are in a wait-and-hold position. Leasing activity is slow, and lack of comparables exists to estimate fair market.”
Charlotte –“There is discounting of all property types (primarily during negotiations) to prices below that justified by net income. This is creating value acquisitions for savvy investors with patient money.”
Northern New Jersey –“Invest in the best located property in any sector. It will be the first to recover, and should recover stronger. Buy quality.”
Revised July 1, 2009
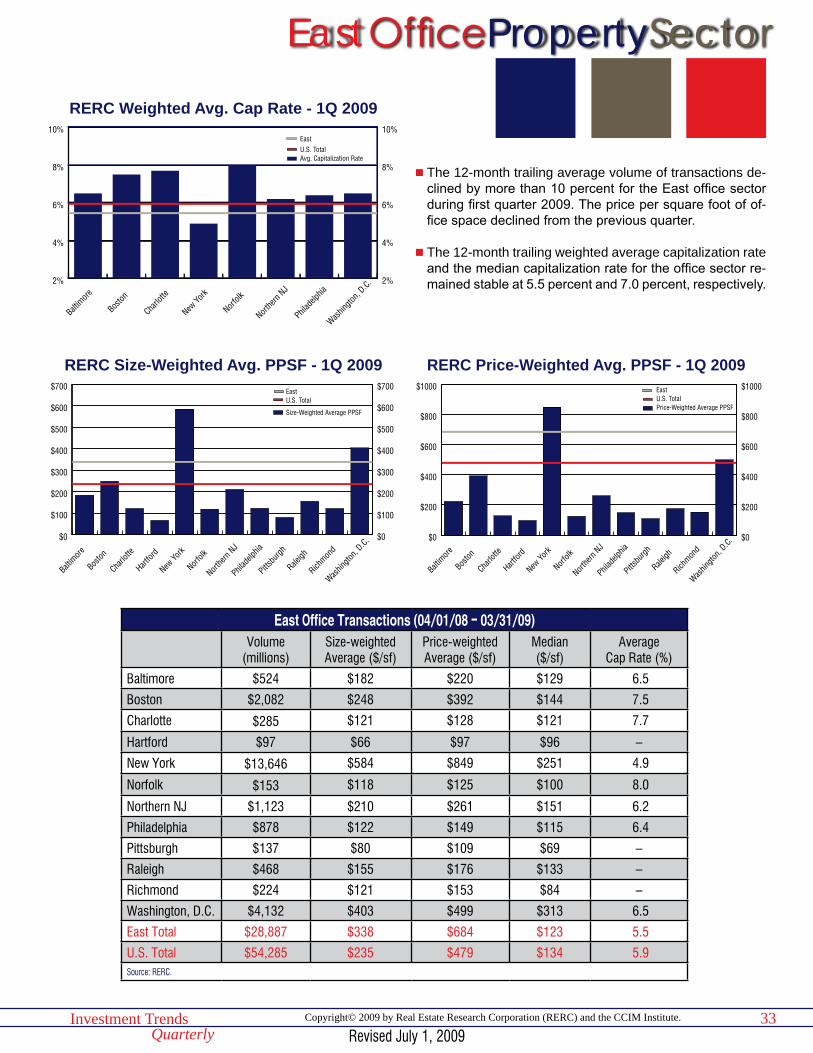
OfficePropertySector
33Investment TrendsQuarterly
Copyright© 2009 by Real Estate Research Corporation (RERC) and the CCIM Institute.
$0
$200
$400
$600
$800
$1000
$0
$200
$400
$600
$800
$1000EastU.S. TotalPrice-Weighted Average PPSF
Washin
gton,
D.C.
Richmon
d
Raleigh
Pittsbu
rgh
Philad
elphia
Northe
rn NJ
Norfol
k
New Yo
rk
Hartfor
d
Charlo
tte
Boston
Baltim
ore
RERC Price-Weighted Avg. PPSF - 1Q 2009
East Office Transactions (04/01/08 - 03/31/09)Volume
(millions)Size-weighted Average ($/sf)
Price-weighted Average ($/sf)
Median($/sf)
Average Cap Rate (%)
Baltimore $524 $182 $220 $129 6.5
Boston $2,082 $248 $392 $144 7.5
Charlotte $285 $121 $128 $121 7.7
Hartford $97 $66 $97 $96 –
New York $13,646 $584 $849 $251 4.9
Norfolk $153 $118 $125 $100 8.0
Northern NJ $1,123 $210 $261 $151 6.2
Philadelphia $878 $122 $149 $115 6.4
Pittsburgh $137 $80 $109 $69 –
Raleigh $468 $155 $176 $133 –
Richmond $224 $121 $153 $84 –
Washington, D.C. $4,132 $403 $499 $313 6.5
East Total $28,887 $338 $684 $123 5.5
U.S. Total $54,285 $235 $479 $134 5.9 Source: RERC.
$0
$100
$200
$300
$400
$500
$600
$700
$0
$100
$200
$300
$400
$500
$600
$700EastU.S. Total
Size-Weighted Average PPSF
Washin
gton,
D.C.
Richmon
d
Raleigh
Pittsbu
rgh
Philad
elphia
Northe
rn NJ
Norfolk
New Yo
rk
Hartfor
d
Charlo
tte
Boston
Baltim
ore
RERC Size-Weighted Avg. PPSF - 1Q 2009
n The 12-month trailing average volume of transactions de-clined by more than 10 percent for the East office sector during first quarter 2009. The price per square foot of of-fice space declined from the previous quarter.
n The 12-month trailing weighted average capitalization rate and the median capitalization rate for the office sector re-mained stable at 5.5 percent and 7.0 percent, respectively.
East
2%
4%
6%
8%
10%
2%
4%
6%
8%
10%EastU.S. TotalAvg. Capitalization Rate
Washin
gton,
D.C.
Philad
elphia
Northe
rn NJ
Norfolk
New Yo
rk
Charlo
tte
Boston
Baltim
ore
RERC Weighted Avg. Cap Rate - 1Q 2009
Revised July 1, 2009
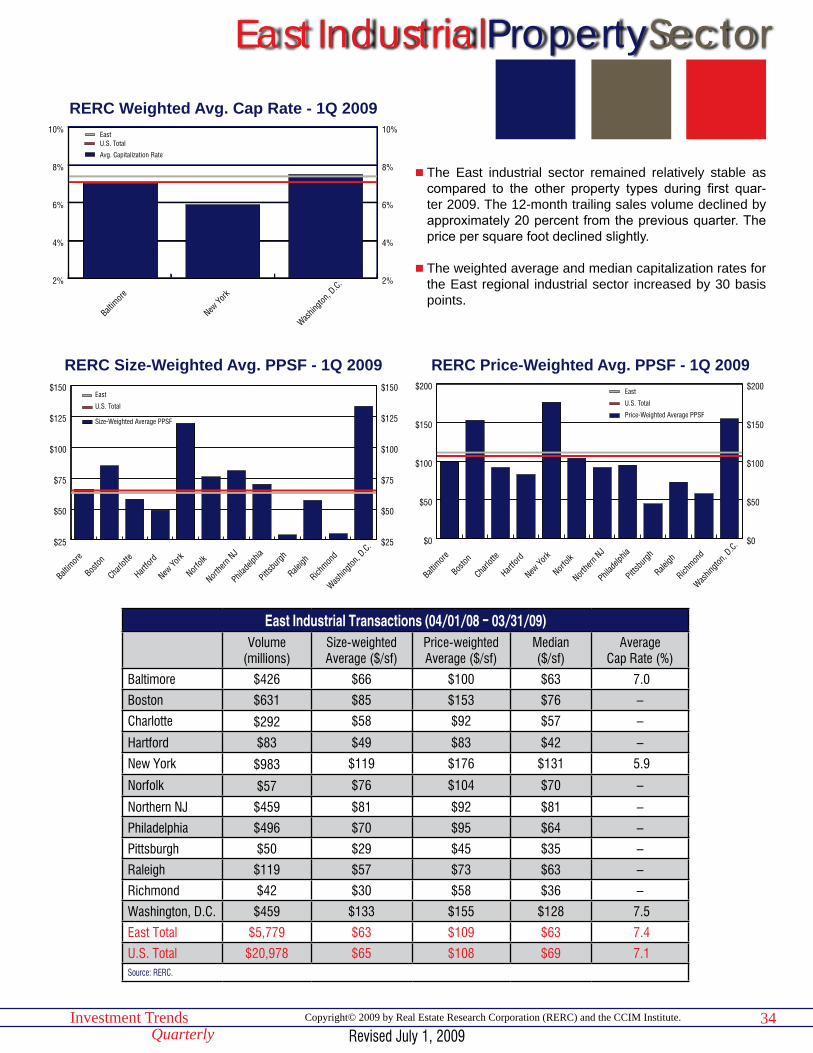
34Investment TrendsQuarterly
Copyright© 2009 by Real Estate Research Corporation (RERC) and the CCIM Institute.
IndustrialPropertySector
$0
$50
$100
$150
$200
$0
$50
$100
$150
$200East
U.S. Total
Price-Weighted Average PPSF
Washin
gton,
D.C.
Richmon
d
Raleigh
Pittsbu
rgh
Philad
elphia
Northe
rn NJ
Norfolk
New Yo
rk
Hartfor
d
Charlo
tte
Boston
Baltim
ore
RERC Price-Weighted Avg. PPSF - 1Q 2009
2%
4%
6%
8%
10%
2%
4%
6%
8%
10%EastU.S. Total
Avg. Capitalization Rate
Washin
gton,
D.C.
New Yo
rk
Baltim
ore
RERC Weighted Avg. Cap Rate - 1Q 2009
East Industrial Transactions (04/01/08 - 03/31/09)Volume
(millions)Size-weighted Average ($/sf)
Price-weighted Average ($/sf)
Median($/sf)
Average Cap Rate (%)
Baltimore $426 $66 $100 $63 7.0
Boston $631 $85 $153 $76 –
Charlotte $292 $58 $92 $57 –
Hartford $83 $49 $83 $42 –
New York $983 $119 $176 $131 5.9
Norfolk $57 $76 $104 $70 –
Northern NJ $459 $81 $92 $81 –
Philadelphia $496 $70 $95 $64 –
Pittsburgh $50 $29 $45 $35 –
Raleigh $119 $57 $73 $63 –
Richmond $42 $30 $58 $36 –
Washington, D.C. $459 $133 $155 $128 7.5
East Total $5,779 $63 $109 $63 7.4
U.S. Total $20,978 $65 $108 $69 7.1 Source: RERC.
$25
$50
$75
$100
$125
$150
$25
$50
$75
$100
$125
$150East
U.S. Total
Size-Weighted Average PPSF
Washin
gton,
D.C.
Richmon
d
Raleigh
Pittsbu
rgh
Philad
elphia
Northe
rn NJ
Norfolk
New Yo
rk
Hartfor
d
Charlo
tte
Boston
Baltim
ore
RERC Size-Weighted Avg. PPSF - 1Q 2009
n The East industrial sector remained relatively stable as compared to the other property types during first quar-ter 2009. The 12-month trailing sales volume declined by approximately 20 percent from the previous quarter. The price per square foot declined slightly.
n The weighted average and median capitalization rates for the East regional industrial sector increased by 30 basis points.
East
Revised July 1, 2009
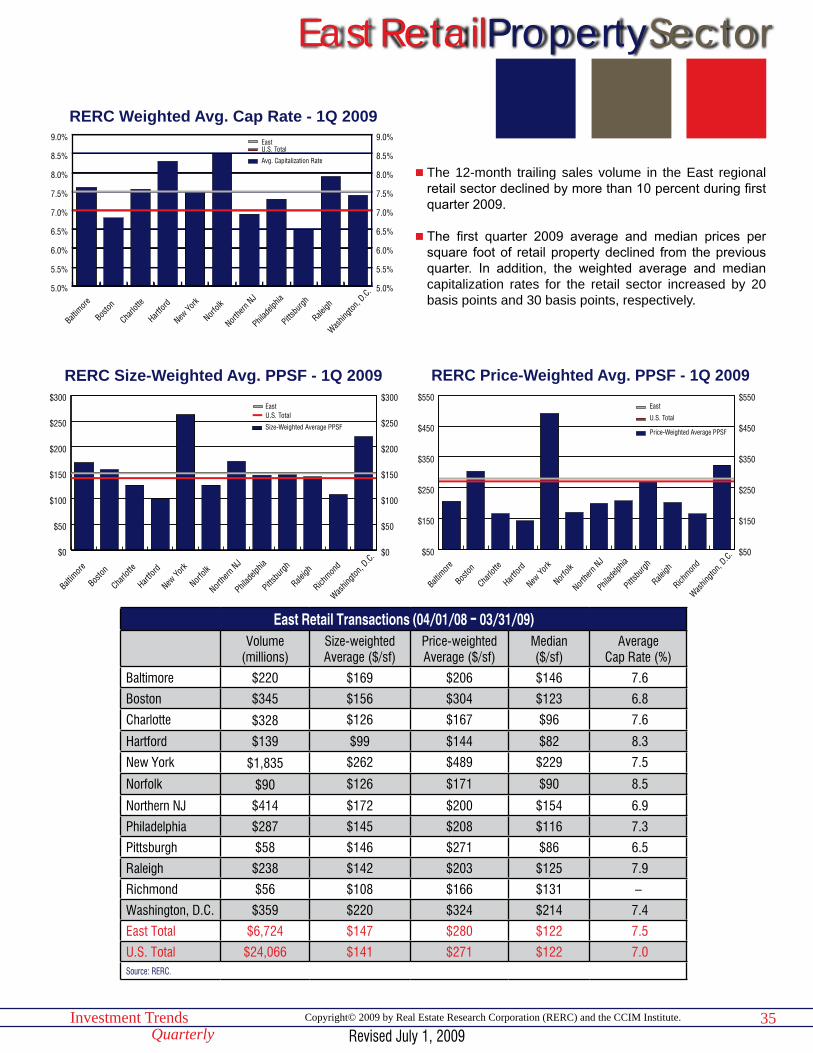
35Investment TrendsQuarterly
Copyright© 2009 by Real Estate Research Corporation (RERC) and the CCIM Institute.
RetailPropertySector
$50
$150
$250
$350
$450
$550
$50
$150
$250
$350
$450
$550East
U.S. Total
Price-Weighted Average PPSF
Washin
gton,
D.C.
Richmon
d
Raleigh
Pittsbu
rgh
Philad
elphia
Northe
rn NJ
Norfol
k
New Yo
rk
Hartfor
d
Charlo
tte
Boston
Baltim
ore
RERC Price-Weighted Avg. PPSF - 1Q 2009
5.0%
5.5%
6.0%
6.5%
7.0%
7.5%
8.0%
8.5%
9.0%
5.0%
5.5%
6.0%
6.5%
7.0%
7.5%
8.0%
8.5%
9.0%EastU.S. Total
Avg. Capitalization Rate
Washin
gton,
D.C.
Raleigh
Pittsbu
rgh
Philad
elphia
Northe
rn NJ
Norfolk
New Yo
rk
Hartfor
d
Charlo
tte
Boston
Baltim
ore
RERC Weighted Avg. Cap Rate - 1Q 2009
East Retail Transactions (04/01/08 - 03/31/09)Volume
(millions)Size-weighted Average ($/sf)
Price-weighted Average ($/sf)
Median($/sf)
Average Cap Rate (%)
Baltimore $220 $169 $206 $146 7.6
Boston $345 $156 $304 $123 6.8
Charlotte $328 $126 $167 $96 7.6
Hartford $139 $99 $144 $82 8.3
New York $1,835 $262 $489 $229 7.5
Norfolk $90 $126 $171 $90 8.5
Northern NJ $414 $172 $200 $154 6.9
Philadelphia $287 $145 $208 $116 7.3
Pittsburgh $58 $146 $271 $86 6.5
Raleigh $238 $142 $203 $125 7.9
Richmond $56 $108 $166 $131 –
Washington, D.C. $359 $220 $324 $214 7.4
East Total $6,724 $147 $280 $122 7.5
U.S. Total $24,066 $141 $271 $122 7.0 Source: RERC.
$0
$50
$100
$150
$200
$250
$300
$0
$50
$100
$150
$200
$250
$300EastU.S. Total
Size-Weighted Average PPSF
Washin
gton,
D.C.
Richmon
d
Raleigh
Pittsbu
rgh
Philad
elphia
Northe
rn NJ
Norfolk
New Yo
rk
Hartfor
d
Charlo
tte
Boston
Baltim
ore
RERC Size-Weighted Avg. PPSF - 1Q 2009
n The 12-month trailing sales volume in the East regional retail sector declined by more than 10 percent during first quarter 2009.
n The first quarter 2009 average and median prices per square foot of retail property declined from the previous quarter. In addition, the weighted average and median capitalization rates for the retail sector increased by 20 basis points and 30 basis points, respectively.
East
Revised July 1, 2009
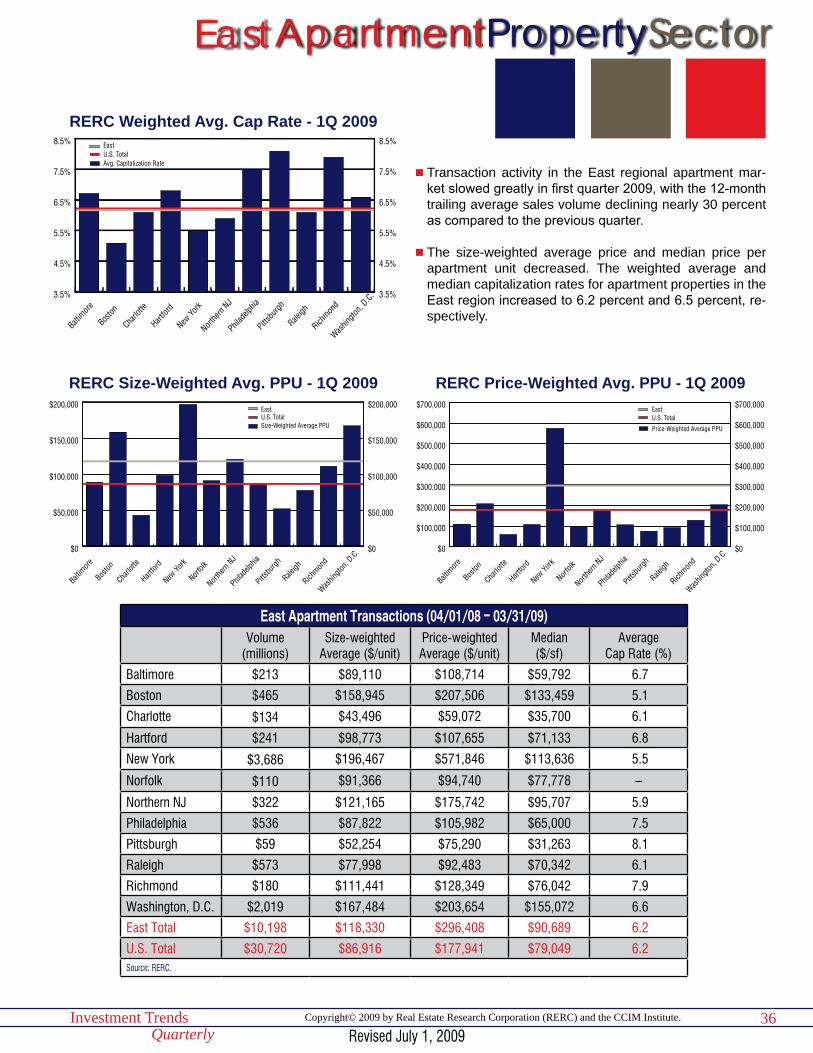
36Investment TrendsQuarterly
Copyright© 2009 by Real Estate Research Corporation (RERC) and the CCIM Institute.
ApartmentPropertySector
$0
$100,000
$200,000
$300,000
$400,000
$500,000
$600,000
$700,000
$0
$100,000
$200,000
$300,000
$400,000
$500,000
$600,000
$700,000EastU.S. Total
Price-Weighted Average PPU
Washin
gton,
D.C.
Richmon
d
Raleigh
Pittsbu
rgh
Philad
elphia
Northe
rn NJ
Norfol
k
New Yo
rk
Hartfor
d
Charlo
tte
Boston
Baltim
ore
RERC Price-Weighted Avg. PPU - 1Q 2009
3.5%
4.5%
5.5%
6.5%
7.5%
8.5%
3.5%
4.5%
5.5%
6.5%
7.5%
8.5%EastU.S. TotalAvg. Capitalization Rate
Washin
gton,
D.C.
Richmon
d
Raleigh
Pittsbu
rgh
Philad
elphia
Northe
rn NJ
New Yo
rk
Hartfor
d
Charlo
tte
Boston
Baltim
ore
RERC Weighted Avg. Cap Rate - 1Q 2009
East Apartment Transactions (04/01/08 - 03/31/09)Volume
(millions)Size-weighted
Average ($/unit)Price-weighted Average ($/unit)
Median($/sf)
Average Cap Rate (%)
Baltimore $213 $89,110 $108,714 $59,792 6.7
Boston $465 $158,945 $207,506 $133,459 5.1
Charlotte $134 $43,496 $59,072 $35,700 6.1
Hartford $241 $98,773 $107,655 $71,133 6.8
New York $3,686 $196,467 $571,846 $113,636 5.5
Norfolk $110 $91,366 $94,740 $77,778 –
Northern NJ $322 $121,165 $175,742 $95,707 5.9
Philadelphia $536 $87,822 $105,982 $65,000 7.5
Pittsburgh $59 $52,254 $75,290 $31,263 8.1
Raleigh $573 $77,998 $92,483 $70,342 6.1
Richmond $180 $111,441 $128,349 $76,042 7.9
Washington, D.C. $2,019 $167,484 $203,654 $155,072 6.6
East Total $10,198 $118,330 $296,408 $90,689 6.2
U.S. Total $30,720 $86,916 $177,941 $79,049 6.2 Source: RERC.
$0
$50,000
$100,000
$150,000
$200,000
$0
$50,000
$100,000
$150,000
$200,000EastU.S. TotalSize-Weighted Average PPU
Washin
gton,
D.C.
Richmon
d
Raleigh
Pittsbu
rgh
Philad
elphia
Northe
rn NJ
Norfol
k
New Yo
rk
Hartfor
d
Charlo
tte
Boston
Baltim
ore
RERC Size-Weighted Avg. PPU - 1Q 2009
n Transaction activity in the East regional apartment mar-ket slowed greatly in first quarter 2009, with the 12-month trailing average sales volume declining nearly 30 percent as compared to the previous quarter.
n The size-weighted average price and median price per apartment unit decreased. The weighted average and median capitalization rates for apartment properties in the East region increased to 6.2 percent and 6.5 percent, re-spectively.
East
Revised July 1, 2009
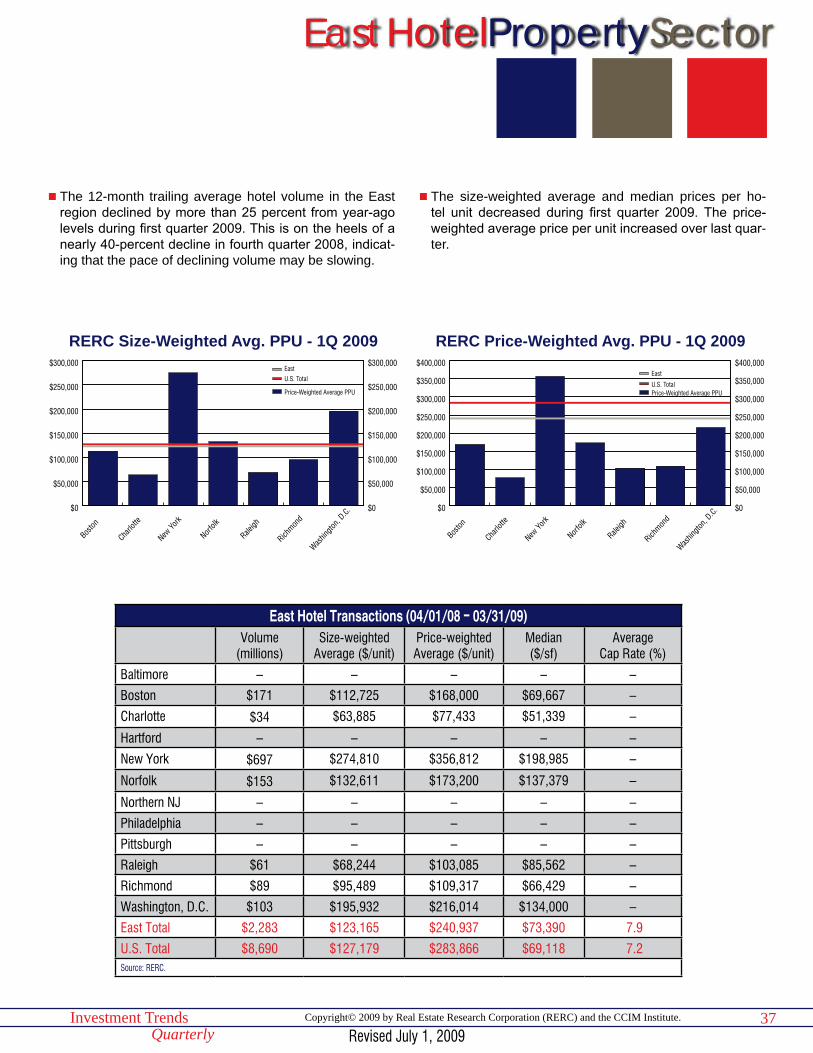
37Investment TrendsQuarterly
Copyright© 2009 by Real Estate Research Corporation (RERC) and the CCIM Institute.
HotelPropertySector
$0
$50,000
$100,000
$150,000
$200,000
$250,000
$300,000
$350,000
$400,000
$0
$50,000
$100,000
$150,000
$200,000
$250,000
$300,000
$350,000
$400,000East
U.S. TotalPrice-Weighted Average PPU
Washin
gton,
D.C.
Richmon
d
Raleigh
Norfol
k
New Yo
rk
Charlo
tte
Boston
RERC Price-Weighted Avg. PPU - 1Q 2009
East Hotel Transactions (04/01/08 - 03/31/09)Volume
(millions)Size-weighted
Average ($/unit)Price-weighted Average ($/unit)
Median($/sf)
Average Cap Rate (%)
Baltimore – – – – –
Boston $171 $112,725 $168,000 $69,667 –
Charlotte $34 $63,885 $77,433 $51,339 –
Hartford – – – – –
New York $697 $274,810 $356,812 $198,985 –
Norfolk $153 $132,611 $173,200 $137,379 –
Northern NJ – – – – –
Philadelphia – – – – –
Pittsburgh – – – – –
Raleigh $61 $68,244 $103,085 $85,562 –
Richmond $89 $95,489 $109,317 $66,429 –
Washington, D.C. $103 $195,932 $216,014 $134,000 –
East Total $2,283 $123,165 $240,937 $73,390 7.9
U.S. Total $8,690 $127,179 $283,866 $69,118 7.2 Source: RERC.
$0
$50,000
$100,000
$150,000
$200,000
$250,000
$300,000
$0
$50,000
$100,000
$150,000
$200,000
$250,000
$300,000EastU.S. Total
Price-Weighted Average PPU
Washin
gton,
D.C.
Richmon
d
Raleigh
Norfol
k
New Yo
rk
Charlo
tte
Boston
RERC Size-Weighted Avg. PPU - 1Q 2009
n The 12-month trailing average hotel volume in the East region declined by more than 25 percent from year-ago levels during first quarter 2009. This is on the heels of a nearly 40-percent decline in fourth quarter 2008, indicat-ing that the pace of declining volume may be slowing.
n The size-weighted average and median prices per ho-tel unit decreased during first quarter 2009. The price-weighted average price per unit increased over last quar-ter.
East
Revised July 1, 2009
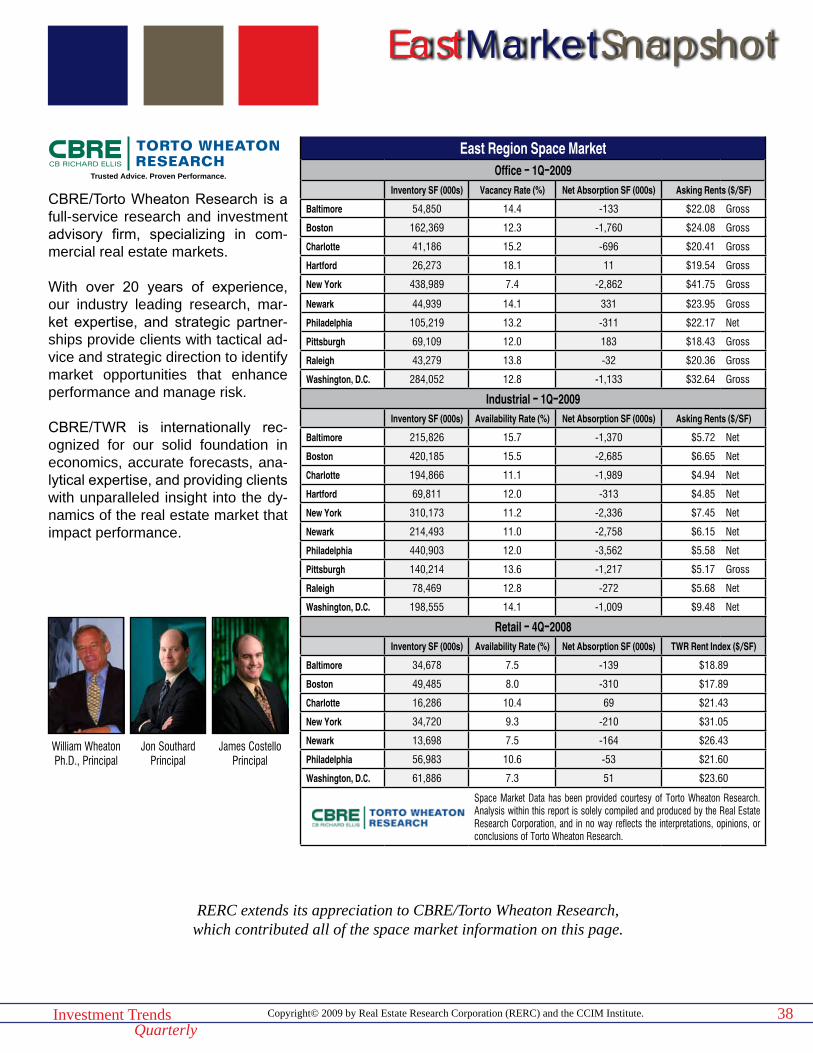
Copyright© 2009 by Real Estate Research Corporation (RERC) and the CCIM Institute.Investment TrendsQuarterly
EastMarketSnapshot
38
RERC extends its appreciation to CBRE/Torto Wheaton Research, which contributed all of the space market information on this page.
East Region Space MarketOffice - 1Q-2009
Inventory SF (000s) Vacancy Rate (%) Net Absorption SF (000s) Asking Rents ($/SF)
Baltimore 54,850 14.4 -133 $22.08 Gross
Boston 162,369 12.3 -1,760 $24.08 Gross
Charlotte 41,186 15.2 -696 $20.41 Gross
Hartford 26,273 18.1 11 $19.54 Gross
New York 438,989 7.4 -2,862 $41.75 Gross
Newark 44,939 14.1 331 $23.95 Gross
Philadelphia 105,219 13.2 -311 $22.17 Net
Pittsburgh 69,109 12.0 183 $18.43 Gross
Raleigh 43,279 13.8 -32 $20.36 Gross
Washington, D.C. 284,052 12.8 -1,133 $32.64 Gross
Industrial - 1Q-2009Inventory SF (000s) Availability Rate (%) Net Absorption SF (000s) Asking Rents ($/SF)
Baltimore 215,826 15.7 -1,370 $5.72 Net
Boston 420,185 15.5 -2,685 $6.65 Net
Charlotte 194,866 11.1 -1,989 $4.94 Net
Hartford 69,811 12.0 -313 $4.85 Net
New York 310,173 11.2 -2,336 $7.45 Net
Newark 214,493 11.0 -2,758 $6.15 Net
Philadelphia 440,903 12.0 -3,562 $5.58 Net
Pittsburgh 140,214 13.6 -1,217 $5.17 Gross
Raleigh 78,469 12.8 -272 $5.68 Net
Washington, D.C. 198,555 14.1 -1,009 $9.48 Net
Retail - 4Q-2008Inventory SF (000s) Availability Rate (%) Net Absorption SF (000s) TWR Rent Index ($/SF)
Baltimore 34,678 7.5 -139 $18.89
Boston 49,485 8.0 -310 $17.89
Charlotte 16,286 10.4 69 $21.43
New York 34,720 9.3 -210 $31.05
Newark 13,698 7.5 -164 $26.43
Philadelphia 56,983 10.6 -53 $21.60
Washington, D.C. 61,886 7.3 51 $23.60
Space Market Data has been provided courtesy of Torto Wheaton Research. Analysis within this report is solely compiled and produced by the Real Estate Research Corporation, and in no way reflects the interpretations, opinions, or conclusions of Torto Wheaton Research.
Trusted Advice. Proven Performance.
CBRE/Torto Wheaton Research is a full-service research and investment advisory firm, specializing in com-mercial real estate markets.
With over 20 years of experience, our industry leading research, mar-ket expertise, and strategic partner-ships provide clients with tactical ad-vice and strategic direction to identify market opportunities that enhance performance and manage risk.
CBRE/TWR is internationally rec-ognized for our solid foundation in economics, accurate forecasts, ana-lytical expertise, and providing clients with unparalleled insight into the dy-namics of the real estate market that impact performance.
William WheatonPh.D., Principal
Jon SouthardPrincipal
James CostelloPrincipal
Copyright© 2009 by Real Estate Research Corporation (RERC) and the CCIM Institute.Investment TrendsQuarterly
39
Demographics & Economics
Population Unemployment Rate
Baltimore MSA 2.7 million Baltimore2 7.4%
Baltimore Growth1 0.62% Maryland2 7.0%
National Growth1 1.23% National3 8.6%
Household Income & Value
Per Capita Income $32,279 2008 Households 1.0 million
1-year Job Growth -0.90% Household Growth 0.68%
1-Year Job Additions -12,600 Median Home Price $260,100
Major Employers
Constellation Energy
Johns Hopkins Hospital
Verizon
Lifebridge Health
H&S BakerySources: Bureau of Labor Statistics, NAR, STDB Online.“2008 Local Market Report” - Baltimore Region ©2008 NATIONAL ASSOCIATION OF REALTORS®. Used with permission. Reproduction, reprinting, or retransmission of this document in any form (electronic media included) is prohibited without written permission.1Projected annual growth over 5 years (2008-2013). 2Rates are non-seasonally adjusted as of March 2009. 3Rates are non-seasonally adjusted as of April 2009.
Noteworthy Transactions
Sale Date Sale Price Sq. Ft./Units PPSF/PPU
Office
7222 Ambassador Road 2-09 $2,620,000 22,753 $115
7138 Windsor Blvd. 2-09 $1,890,000 12,000 $158
Industrial
2300 Eskow Ave. 2-09 $1,900,000 13,173 $144
8149 Norris Lane 2-09 $2,300,000 16,050 $143
Retail
9200 Old Annapolis Road 1-09 $2,980,000 15,415 $193
2623 Washington Blvd. 2-09 $639,900 7,080 $90
Apartment
3601 - 3611 Ford’s Lane 1-09 $5,750,000 186 $30,914Compiled by RERC for the RERC/CCIM Investment Trends Quarterly report.
Market Construction/Redevelopment Activity
Property Type
New(N)/Refurbished(R)
Total Sq. Ft./Units
Estimated Delivery
The Hyatt at City Center Mixed Use N 450,000 N/A
414 Light St. Office N 475,000 2012
The Fitzgerald at UB Midtown Mixed Use N
280 units
201014,000 retail
Merchants Terminal Corp. DC Industrial N 155,000 2009Sources: CBRE, RE Business.
Balti
mo
re Metro Trend AnalysisPrevious Quarter
Previous Year
Office
Size-Weighted Average PPSF = =
Weighted Average Cap Rate = =
Industrial
Size-Weighted Average PPSF = =
Weighted Average Cap Rate –
Retail
Size-Weighted Average PPSF =
Weighted Average Cap Rate
Apartment
Size-Weighted Average PPU
Weighted Average Cap Rate –
Metro Cap Rate Comparison* Current Quarter
Office
vs. East Region
vs. Nation
Industrial
vs. East Region
vs. Nation =
Retail
vs. East Region =
vs. Nation
Apartment
vs. East Region
vs. Nation
*Comparison of current quarter weighted average capitalization rates.Source: RERC, 1Q 2009.
Revised July 1, 2009
Copyright© 2009 by Real Estate Research Corporation (RERC) and the CCIM Institute.Investment TrendsQuarterly
40
Baltimore Transaction Breakdown12-Month Trailing (04/01/08 - 03/31/09)
Office Industrial Retail Apartment Hotel< $5 MillionVolume (Mil) $30 $95 $62 $5 –
Size Weighted Avg. ($ per sf/unit) $96 $53 $126 $55,066 –
Price Weighted Avg. ($ per sf/unit) $120 $82 $177 $55,430 –
Median ($ per sf/unit) $108 $61 $118 $53,227 –
> $5 MillionVolume (Mil) $494 $331 $158 $208 –
Size Weighted Avg. ($ per sf/unit) $193 $71 $195 $90,502 –
Price Weighted Avg. ($ per sf/unit) $226 $105 $217 $110,040 –
Median ($ per sf/unit) $169 $81 $171 $110,043 –
All TransactionsVolume (Mil) $524 $426 $220 $213 –
Size Weighted Avg. ($ per sf/unit) $182 $66 $169 $89,110 –
Price Weighted Avg. ($ per sf/unit) $220 $100 $206 $108,714 –
Median ($ per sf/unit) $129 $63 $146 $59,792 –
Capitalization Rates (All Transactions)Weighted Average (%) 6.5 7.0 7.6 6.7 –
Median (%) 6.7 7.0 7.5 6.4 –Source: RERC.
Baltimore Transaction Trends12-Month Trailing (04/01/08 - 03/31/09)
Office Industrial Retail Apartment HotelMedian Price% Change Quarter Ago 2% 0% -6% -29% –
% Change Year Ago -11% -8% – -16% –
Volume % Change Quarter Ago -9% 4% 0% -40% –
% Change Year Ago -58% -34% – -74% –Source: RERC.
Revised July 1, 2009
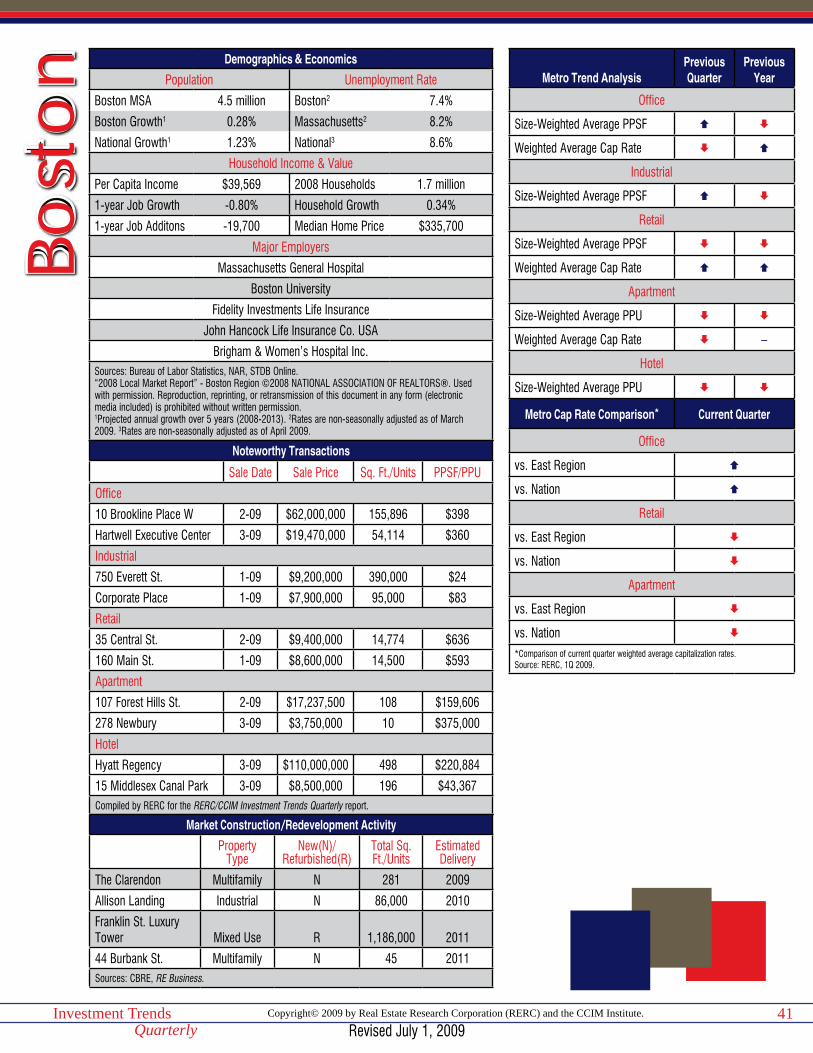
Copyright© 2009 by Real Estate Research Corporation (RERC) and the CCIM Institute.Investment TrendsQuarterly
41
Demographics & Economics
Population Unemployment Rate
Boston MSA 4.5 million Boston2 7.4%
Boston Growth1 0.28% Massachusetts2 8.2%
National Growth1 1.23% National3 8.6%
Household Income & Value
Per Capita Income $39,569 2008 Households 1.7 million
1-year Job Growth -0.80% Household Growth 0.34%
1-year Job Additons -19,700 Median Home Price $335,700
Major Employers
Massachusetts General Hospital
Boston University
Fidelity Investments Life Insurance
John Hancock Life Insurance Co. USA
Brigham & Women’s Hospital Inc.Sources: Bureau of Labor Statistics, NAR, STDB Online.“2008 Local Market Report” - Boston Region ©2008 NATIONAL ASSOCIATION OF REALTORS®. Used with permission. Reproduction, reprinting, or retransmission of this document in any form (electronic media included) is prohibited without written permission.1Projected annual growth over 5 years (2008-2013). 2Rates are non-seasonally adjusted as of March 2009. 3Rates are non-seasonally adjusted as of April 2009.
Noteworthy Transactions
Sale Date Sale Price Sq. Ft./Units PPSF/PPU
Office
10 Brookline Place W 2-09 $62,000,000 155,896 $398
Hartwell Executive Center 3-09 $19,470,000 54,114 $360
Industrial
750 Everett St. 1-09 $9,200,000 390,000 $24
Corporate Place 1-09 $7,900,000 95,000 $83
Retail
35 Central St. 2-09 $9,400,000 14,774 $636
160 Main St. 1-09 $8,600,000 14,500 $593
Apartment
107 Forest Hills St. 2-09 $17,237,500 108 $159,606
278 Newbury 3-09 $3,750,000 10 $375,000
Hotel
Hyatt Regency 3-09 $110,000,000 498 $220,884
15 Middlesex Canal Park 3-09 $8,500,000 196 $43,367Compiled by RERC for the RERC/CCIM Investment Trends Quarterly report.
Market Construction/Redevelopment Activity
Property Type
New(N)/Refurbished(R)
Total Sq. Ft./Units
Estimated Delivery
The Clarendon Multifamily N 281 2009
Allison Landing Industrial N 86,000 2010
Franklin St. Luxury Tower Mixed Use R 1,186,000 2011
44 Burbank St. Multifamily N 45 2011Sources: CBRE, RE Business.
Bost
on Metro Trend Analysis
Previous Quarter
Previous Year
Office
Size-Weighted Average PPSF
Weighted Average Cap Rate
Industrial
Size-Weighted Average PPSF
Retail
Size-Weighted Average PPSF
Weighted Average Cap Rate
Apartment
Size-Weighted Average PPU
Weighted Average Cap Rate –
Hotel
Size-Weighted Average PPU
Metro Cap Rate Comparison* Current Quarter
Office
vs. East Region
vs. Nation
Retail
vs. East Region
vs. Nation
Apartment
vs. East Region
vs. Nation
*Comparison of current quarter weighted average capitalization rates.Source: RERC, 1Q 2009.
Revised July 1, 2009
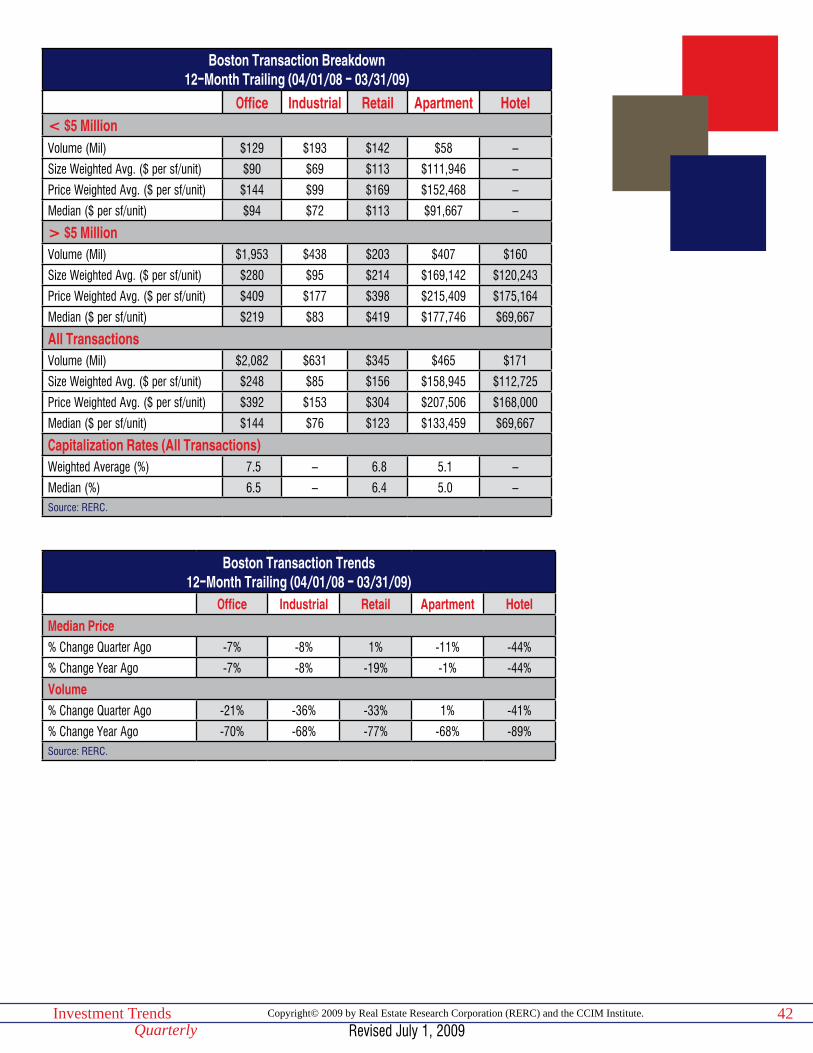
Copyright© 2009 by Real Estate Research Corporation (RERC) and the CCIM Institute.Investment TrendsQuarterly
42
Boston Transaction Breakdown12-Month Trailing (04/01/08 - 03/31/09)
Office Industrial Retail Apartment Hotel< $5 MillionVolume (Mil) $129 $193 $142 $58 –
Size Weighted Avg. ($ per sf/unit) $90 $69 $113 $111,946 –
Price Weighted Avg. ($ per sf/unit) $144 $99 $169 $152,468 –
Median ($ per sf/unit) $94 $72 $113 $91,667 –
> $5 MillionVolume (Mil) $1,953 $438 $203 $407 $160
Size Weighted Avg. ($ per sf/unit) $280 $95 $214 $169,142 $120,243
Price Weighted Avg. ($ per sf/unit) $409 $177 $398 $215,409 $175,164
Median ($ per sf/unit) $219 $83 $419 $177,746 $69,667
All TransactionsVolume (Mil) $2,082 $631 $345 $465 $171
Size Weighted Avg. ($ per sf/unit) $248 $85 $156 $158,945 $112,725
Price Weighted Avg. ($ per sf/unit) $392 $153 $304 $207,506 $168,000
Median ($ per sf/unit) $144 $76 $123 $133,459 $69,667
Capitalization Rates (All Transactions)Weighted Average (%) 7.5 – 6.8 5.1 –
Median (%) 6.5 – 6.4 5.0 –Source: RERC.
Boston Transaction Trends12-Month Trailing (04/01/08 - 03/31/09)
Office Industrial Retail Apartment HotelMedian Price% Change Quarter Ago -7% -8% 1% -11% -44%
% Change Year Ago -7% -8% -19% -1% -44%
Volume % Change Quarter Ago -21% -36% -33% 1% -41%
% Change Year Ago -70% -68% -77% -68% -89%Source: RERC.
Revised July 1, 2009

Copyright© 2009 by Real Estate Research Corporation (RERC) and the CCIM Institute.Investment TrendsQuarterly
43
Demographics & Economics
Population Unemployment Rate
Charlotte MSA 1.7 million Charlotte2 11.4%
Charlotte Growth1 3.05% North Carolina2 10.9%
National Growth1 1.23% National3 8.6%
Household Income & Value
Per Capita Income $32,343 2008 Households 656,253
1-year Job Growth -1.80% Household Growth 3.12%
1-Year Job Additions -15,700 Median Home Price $186,300
Major Employers
Bank of America
Carolinas Healthcare System
Wachovia Corporation
Adecco
Duke Energy Corp.Sources: Bureau of Labor Statistics, NAR, STDB Online.“2008 Local Market Report” - Charlotte Region ©2008 NATIONAL ASSOCIATION OF REALTORS®. Used with permission. Reproduction, reprinting, or retransmission of this document in any form (electronic media included) is prohibited without written permission.1Projected annual growth over 5 years (2008-2013). 2Rates are non-seasonally adjusted as of March 2009. 3Rates are non-seasonally adjusted as of April 2009.
Noteworthy Transactions
Sale Date Sale Price Sq. Ft./Units PPSF/PPU
Industrial
6125 HarrisTechnology Blvd. 1-09 $5,310,000 148,694 $36
12700 General Drive 2-09 $7,400,000 142,629 $52
Retail
2500 South Blvd. 1-09 $2,500,000 50,000 $50
7101 Smith Corners Blvd. 3-09 $6,900,000 48,235 $143Compiled by RERC for the RERC/CCIM Investment Trends Quarterly report.
Market Construction/Redevelopment Activity
Property Type
New(N)/Refurbished(R)
Total Sq. Ft./Units
Estimated Delivery
Hillsborough & Dawson St. Mixed Use N N/A 2010
500 W. Trade Multifamily N 400 2009
Elizabeth Avenue Mixed Use N
590,000 retail/office
2010850 units
Duke Energy Center Office N 1,200,000 2010Sources: CBRE, RE Business.
Cha
rlott
e Metro Trend AnalysisPrevious Quarter
Previous Year
Office
Size-Weighted Average PPSF =
Weighted Average Cap Rate = =
Industrial
Size-Weighted Average PPSF
Retail
Size-Weighted Average PPSF
Weighted Average Cap Rate –
Apartment
Size-Weighted Average PPU
Weighted Average Cap Rate
Hotel
Size-Weighted Average PPU
Metro Cap Rate Comparison* Current Quarter
Office
vs. East Region
vs. Nation
Retail
vs. East Region =
vs. Nation
Apartment
vs. East Region =
vs. Nation =*Comparison of current quarter weighted average capitalization rates.Source: RERC, 1Q 2009.
Revised July 1, 2009

Copyright© 2009 by Real Estate Research Corporation (RERC) and the CCIM Institute.Investment TrendsQuarterly
44
Charlotte Transaction Breakdown12-Month Trailing (04/01/08 - 03/31/09)
Office Industrial Retail Apartment Hotel< $5 MillionVolume (Mil) $23 $96 $86 $34 –
Size Weighted Avg. ($ per sf/unit) $100 $46 $94 $32,790 –
Price Weighted Avg. ($ per sf/unit) $127 $58 $169 $35,386 –
Median ($ per sf/unit) $117 $57 $80 $33,886 –
> $5 MillionVolume (Mil) $262 $196 $242 $100 –
Size Weighted Avg. ($ per sf/unit) $123 $66 $143 $48,917 –
Price Weighted Avg. ($ per sf/unit) $128 $108 $167 $67,111 –
Median ($ per sf/unit) $121 $57 $169 $49,650 –
All TransactionsVolume (Mil) $285 $292 $328 $134 $34
Size Weighted Avg. ($ per sf/unit) $121 $58 $126 $43,496 $63,885
Price Weighted Avg. ($ per sf/unit) $128 $92 $167 $59,072 $77,433
Median ($ per sf/unit) $121 $57 $96 $35,700 $51,339
Capitalization Rates (All Transactions)Weighted Average (%) 7.7 – 7.6 6.1 –
Median (%) 7.8 – 7.9 6.6 –Source: RERC.
Charlotte Transaction Trends12-Month Trailing (04/01/08 - 03/31/09)
Office Industrial Retail Apartment HotelMedian Price% Change Quarter Ago 0% 4% -1% -26% 1%
% Change Year Ago -12% 7% -7% -36% -31%
Volume % Change Quarter Ago -13% -43% -18% -48% -34%
% Change Year Ago -76% -45% -30% -87% -80%Source: RERC.
Revised July 1, 2009
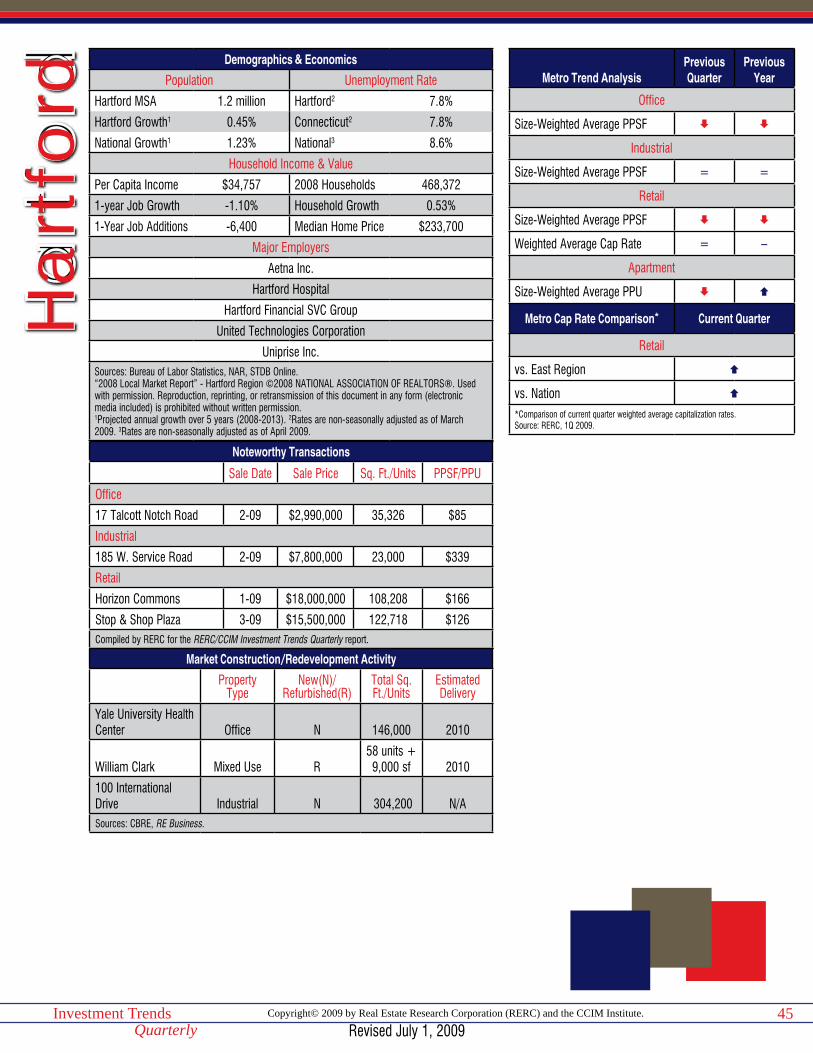
Copyright© 2009 by Real Estate Research Corporation (RERC) and the CCIM Institute.Investment TrendsQuarterly
45
Demographics & Economics
Population Unemployment Rate
Hartford MSA 1.2 million Hartford2 7.8%
Hartford Growth1 0.45% Connecticut2 7.8%
National Growth1 1.23% National3 8.6%
Household Income & Value
Per Capita Income $34,757 2008 Households 468,372
1-year Job Growth -1.10% Household Growth 0.53%
1-Year Job Additions -6,400 Median Home Price $233,700
Major Employers
Aetna Inc.
Hartford Hospital
Hartford Financial SVC Group
United Technologies Corporation
Uniprise Inc.Sources: Bureau of Labor Statistics, NAR, STDB Online.“2008 Local Market Report” - Hartford Region ©2008 NATIONAL ASSOCIATION OF REALTORS®. Used with permission. Reproduction, reprinting, or retransmission of this document in any form (electronic media included) is prohibited without written permission.1Projected annual growth over 5 years (2008-2013). 2Rates are non-seasonally adjusted as of March 2009. 3Rates are non-seasonally adjusted as of April 2009.
Noteworthy Transactions
Sale Date Sale Price Sq. Ft./Units PPSF/PPU
Office
17 Talcott Notch Road 2-09 $2,990,000 35,326 $85
Industrial
185 W. Service Road 2-09 $7,800,000 23,000 $339
Retail
Horizon Commons 1-09 $18,000,000 108,208 $166
Stop & Shop Plaza 3-09 $15,500,000 122,718 $126 Compiled by RERC for the RERC/CCIM Investment Trends Quarterly report.
Market Construction/Redevelopment Activity
Property Type
New(N)/Refurbished(R)
Total Sq. Ft./Units
Estimated Delivery
Yale University Health Center Office N 146,000 2010
William Clark Mixed Use R58 units + 9,000 sf 2010
100 International Drive Industrial N 304,200 N/ASources: CBRE, RE Business.
Ha
rtfo
rd Metro Trend AnalysisPrevious Quarter
Previous Year
Office
Size-Weighted Average PPSF
Industrial
Size-Weighted Average PPSF = =
Retail
Size-Weighted Average PPSF
Weighted Average Cap Rate = –
Apartment
Size-Weighted Average PPU
Metro Cap Rate Comparison* Current Quarter
Retail
vs. East Region
vs. Nation
*Comparison of current quarter weighted average capitalization rates.Source: RERC, 1Q 2009.
Revised July 1, 2009

Copyright© 2009 by Real Estate Research Corporation (RERC) and the CCIM Institute.Investment TrendsQuarterly
46
Hartford Transaction Breakdown12-Month Trailing Averages (04/01/08 - 03/31/09)
Office Industrial Retail Apartment Hotel< $5 MillionVolume (Mil) $25 $51 $55 $7 –
Size Weighted Avg. ($ per sf/unit) $69 $43 $56 $46,648 –
Price Weighted Avg. ($ per sf/unit) $98 $54 $76 $47,242 –
Median ($ per sf/unit) $97 $45 $66 $47,619 –
> $5 MillionVolume (Mil) $72 $109 $80 $183 –
Size Weighted Avg. ($ per sf/unit) $65 $81 $118 $106,150 –
Price Weighted Avg. ($ per sf/unit) $96 $96 $147 $114,154 –
Median ($ per sf/unit) $94 $96 $146 $111,212 –
All TransactionsVolume (Mil) $97 $161 $135 $190 –
Size Weighted Avg. ($ per sf/unit) $66 $63 $81 $101,536 –
Price Weighted Avg. ($ per sf/unit) $97 $83 $118 $111,770 –
Median ($ per sf/unit) $96 $49 $75 $64,506 –
Capitalization Rates (All Transactions)Weighted Average (%) – – 8.5 6.8 –
Median (%) – – 8.0 6.8 –Source: RERC.
Hartford Transaction Trends12-Month Trailing (04/01/08 - 03/31/09
Office Industrial Retail Apartment HotelMedian Price% Change Quarter Ago -6% -10% -1% 13% –
% Change Year Ago 11% -19% 9% – –
Volume % Change Quarter Ago -38% -41% 3% -2% –
% Change Year Ago -26% -64% -45% – –Source: RERC.
Revised July 1, 2009
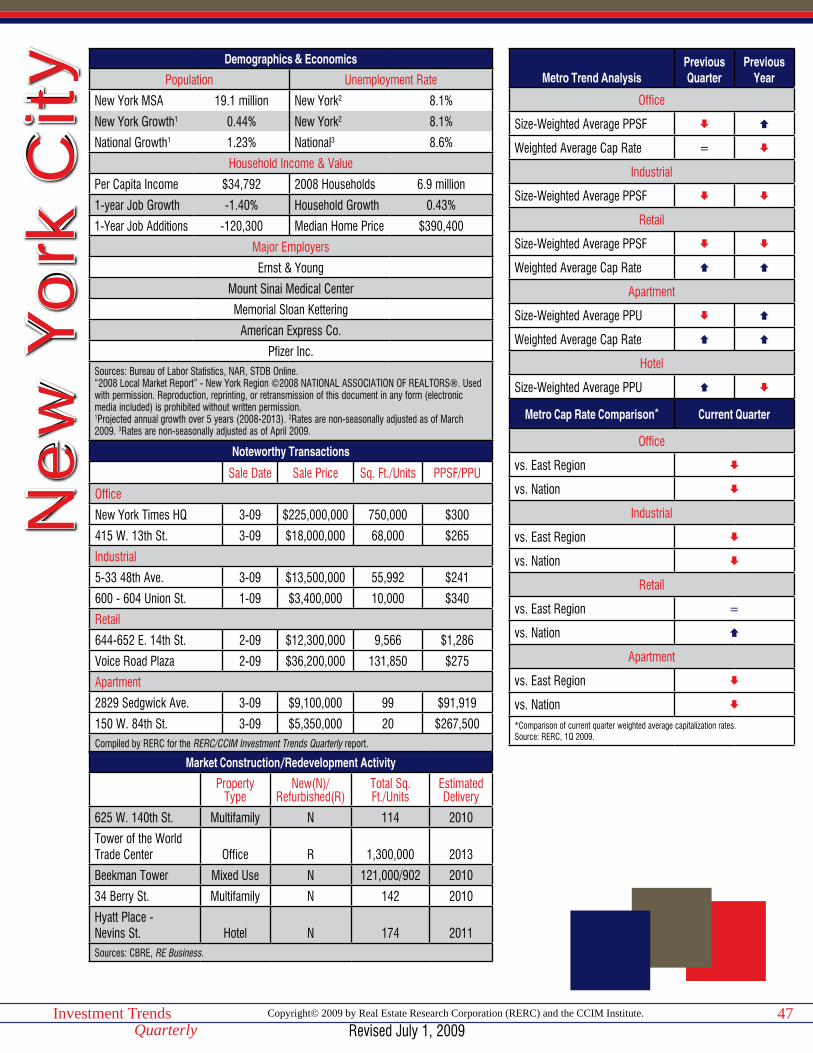
Copyright© 2009 by Real Estate Research Corporation (RERC) and the CCIM Institute.Investment TrendsQuarterly
47
Demographics & Economics
Population Unemployment Rate
New York MSA 19.1 million New York2 8.1%
New York Growth1 0.44% New York2 8.1%
National Growth1 1.23% National3 8.6%
Household Income & Value
Per Capita Income $34,792 2008 Households 6.9 million
1-year Job Growth -1.40% Household Growth 0.43%
1-Year Job Additions -120,300 Median Home Price $390,400
Major Employers
Ernst & Young
Mount Sinai Medical Center
Memorial Sloan Kettering
American Express Co.
Pfizer Inc.Sources: Bureau of Labor Statistics, NAR, STDB Online.“2008 Local Market Report” - New York Region ©2008 NATIONAL ASSOCIATION OF REALTORS®. Used with permission. Reproduction, reprinting, or retransmission of this document in any form (electronic media included) is prohibited without written permission.1Projected annual growth over 5 years (2008-2013). 2Rates are non-seasonally adjusted as of March 2009. 3Rates are non-seasonally adjusted as of April 2009.
Noteworthy Transactions
Sale Date Sale Price Sq. Ft./Units PPSF/PPU
Office
New York Times HQ 3-09 $225,000,000 750,000 $300
415 W. 13th St. 3-09 $18,000,000 68,000 $265
Industrial
5-33 48th Ave. 3-09 $13,500,000 55,992 $241
600 - 604 Union St. 1-09 $3,400,000 10,000 $340
Retail
644-652 E. 14th St. 2-09 $12,300,000 9,566 $1,286
Voice Road Plaza 2-09 $36,200,000 131,850 $275
Apartment
2829 Sedgwick Ave. 3-09 $9,100,000 99 $91,919
150 W. 84th St. 3-09 $5,350,000 20 $267,500Compiled by RERC for the RERC/CCIM Investment Trends Quarterly report.
Market Construction/Redevelopment Activity
Property Type
New(N)/Refurbished(R)
Total Sq. Ft./Units
Estimated Delivery
625 W. 140th St. Multifamily N 114 2010
Tower of the World Trade Center Office R 1,300,000 2013
Beekman Tower Mixed Use N 121,000/902 2010
34 Berry St. Multifamily N 142 2010
Hyatt Place -Nevins St. Hotel N 174 2011Sources: CBRE, RE Business.
Ne
w Y
ork
City Metro Trend Analysis
Previous Quarter
Previous Year
Office
Size-Weighted Average PPSF
Weighted Average Cap Rate =
Industrial
Size-Weighted Average PPSF
Retail
Size-Weighted Average PPSF
Weighted Average Cap Rate
Apartment
Size-Weighted Average PPU
Weighted Average Cap Rate
Hotel
Size-Weighted Average PPU
Metro Cap Rate Comparison* Current Quarter
Office
vs. East Region
vs. Nation
Industrial
vs. East Region
vs. Nation
Retail
vs. East Region =
vs. Nation
Apartment
vs. East Region
vs. Nation
*Comparison of current quarter weighted average capitalization rates.Source: RERC, 1Q 2009.
Revised July 1, 2009

Copyright© 2009 by Real Estate Research Corporation (RERC) and the CCIM Institute.Investment TrendsQuarterly
48
New York Transaction Breakdown12-Month Trailing (04/01/08 - 03/31/09)
Office Industrial Retail Apartment Hotel< $5 MillionVolume (Mil) $205 $382 $602 $646 –
Size Weighted Avg. ($ per sf/unit) $171 $116 $211 $107,763 –
Price Weighted Avg. ($ per sf/unit) $269 $172 $307 $135,471 –
Median ($ per sf/unit) $185 $124 $188 $98,219 –
> $5 MillionVolume (Mil) $13,442 $601 $1,232 $3,040 $693
Size Weighted Avg. ($ per sf/unit) $606 $122 $298 $238,109 $287,955
Price Weighted Avg. ($ per sf/unit) $858 $179 $578 $664,560 $358,971
Median ($ per sf/unit) $455 $146 $483 $160,273 $226,000
All TransactionsVolume (Mil) $13,646 $983 $1,835 $3,686 $697
Size Weighted Avg. ($ per sf/unit) $584 $119 $262 $196,467 $274,810
Price Weighted Avg. ($ per sf/unit) $849 $176 $489 $571,846 $356,812
Median ($ per sf/unit) $251 $131 $229 $113,636 $198,985
Capitalization Rates (All Transactions)Weighted Average (%) 4.9 5.9 7.5 5.5 –
Median (%) 5.5 6.5 6.0 6.0 –Source: RERC.
New York Transaction Trends12-Month Trailing (04/01/08 - 03/31/09)
Office Industrial Retail Apartment HotelMedian Price% Change Quarter Ago -11% 0% -5% -9% -22%
% Change Year Ago -35% -6% -3% -9% -5%
Volume % Change Quarter Ago -12% -27% -12% -32% -14%
% Change Year Ago -60% -60% -56% -66% -84%Source: RERC.
Revised July 1, 2009
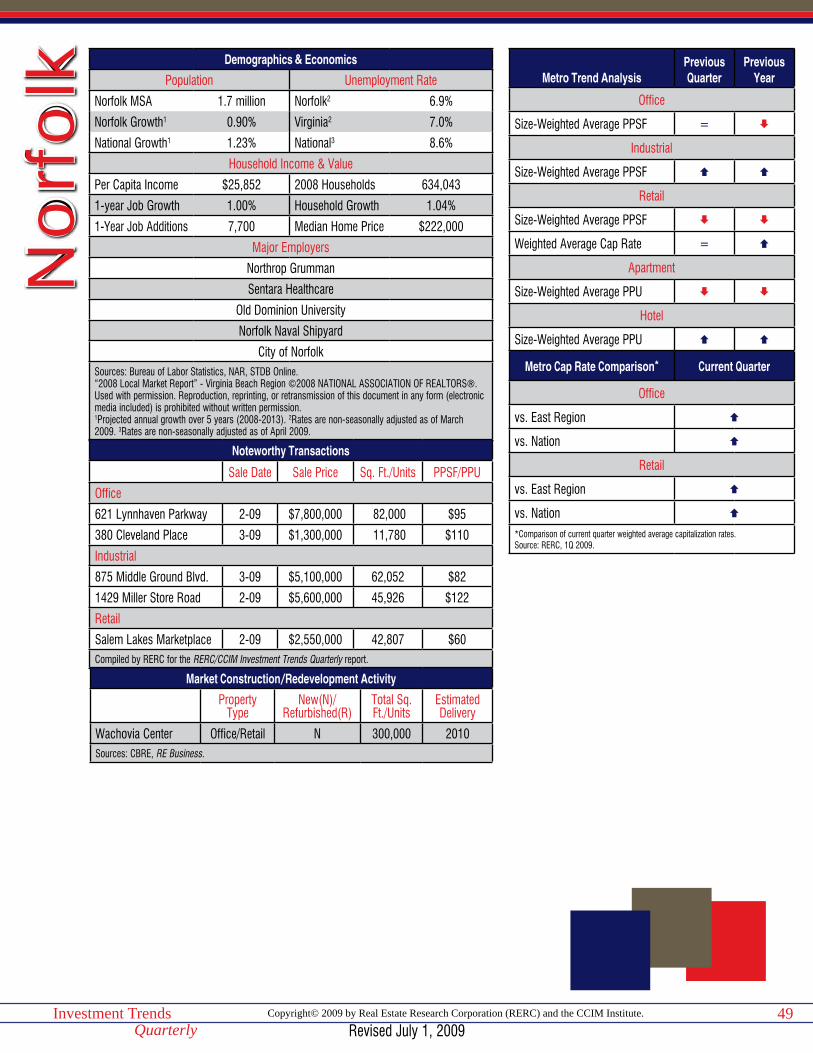
Copyright© 2009 by Real Estate Research Corporation (RERC) and the CCIM Institute.Investment TrendsQuarterly
49
Demographics & Economics
Population Unemployment Rate
Norfolk MSA 1.7 million Norfolk2 6.9%
Norfolk Growth1 0.90% Virginia2 7.0%
National Growth1 1.23% National3 8.6%
Household Income & Value
Per Capita Income $25,852 2008 Households 634,043
1-year Job Growth 1.00% Household Growth 1.04%
1-Year Job Additions 7,700 Median Home Price $222,000
Major Employers
Northrop Grumman
Sentara Healthcare
Old Dominion University
Norfolk Naval Shipyard
City of NorfolkSources: Bureau of Labor Statistics, NAR, STDB Online. “2008 Local Market Report” - Virginia Beach Region ©2008 NATIONAL ASSOCIATION OF REALTORS®. Used with permission. Reproduction, reprinting, or retransmission of this document in any form (electronic media included) is prohibited without written permission.1Projected annual growth over 5 years (2008-2013). 2Rates are non-seasonally adjusted as of March 2009. 3Rates are non-seasonally adjusted as of April 2009.
Noteworthy Transactions
Sale Date Sale Price Sq. Ft./Units PPSF/PPU
Office
621 Lynnhaven Parkway 2-09 $7,800,000 82,000 $95
380 Cleveland Place 3-09 $1,300,000 11,780 $110
Industrial
875 Middle Ground Blvd. 3-09 $5,100,000 62,052 $82
1429 Miller Store Road 2-09 $5,600,000 45,926 $122
Retail
Salem Lakes Marketplace 2-09 $2,550,000 42,807 $60Compiled by RERC for the RERC/CCIM Investment Trends Quarterly report.
Market Construction/Redevelopment Activity
Property Type
New(N)/Refurbished(R)
Total Sq. Ft./Units
Estimated Delivery
Wachovia Center Office/Retail N 300,000 2010Sources: CBRE, RE Business.
No
rfo
lk Metro Trend AnalysisPrevious Quarter
Previous Year
Office
Size-Weighted Average PPSF =
Industrial
Size-Weighted Average PPSF
Retail
Size-Weighted Average PPSF
Weighted Average Cap Rate =
Apartment
Size-Weighted Average PPU
Hotel
Size-Weighted Average PPU
Metro Cap Rate Comparison* Current Quarter
Office
vs. East Region
vs. Nation
Retail
vs. East Region
vs. Nation
*Comparison of current quarter weighted average capitalization rates.Source: RERC, 1Q 2009.
Revised July 1, 2009

Copyright© 2009 by Real Estate Research Corporation (RERC) and the CCIM Institute.Investment TrendsQuarterly
50
Norfolk Transaction Breakdown12-Month Trailing (04/01/08 - 03/31/09)
Office Industrial Retail Apartment Hotel< $5 MillionVolume (Mil) $21 $32 $31 – –
Size Weighted Avg. ($ per sf/unit) $100 $67 $96 – –
Price Weighted Avg. ($ per sf/unit) $110 $114 $196 – –
Median ($ per sf/unit) $99 $66 $80 – –
> $5 MillionVolume (Mil) $132 – – $101 $150
Size Weighted Avg. ($ per sf/unit) $121 – – $94,082 $147,668
Price Weighted Avg. ($ per sf/unit) $128 – – $96,924 $176,161
Median ($ per sf/unit) $104 – – $99,023 $138,889
All TransactionsVolume (Mil) $153 $57 $90 $110 $153
Size Weighted Avg. ($ per sf/unit) $118 $76 $126 $91,366 $132,611
Price Weighted Avg. ($ per sf/unit) $125 $104 $171 $94,740 $173,200
Median ($ per sf/unit) $100 $70 $90 $77,778 $137,379
Capitalization Rates (All Transactions)Weighted Average (%) 8.0 – 8.5 – –
Median (%) 8.2 – 8.6 – –Source: RERC.
Norfolk Transaction Trends12-Month Trailing (04/01/08 - 03/31/09)
Office Industrial Retail Apartment HotelMedian Price% Change Quarter Ago 1% 10% -13% 0% –
% Change Year Ago -28% 10% -33% -5% –
Volume % Change Quarter Ago -4% -44% -67% -19% –
% Change Year Ago -36% -68% -65% -59% –Source: RERC.
Revised July 1, 2009
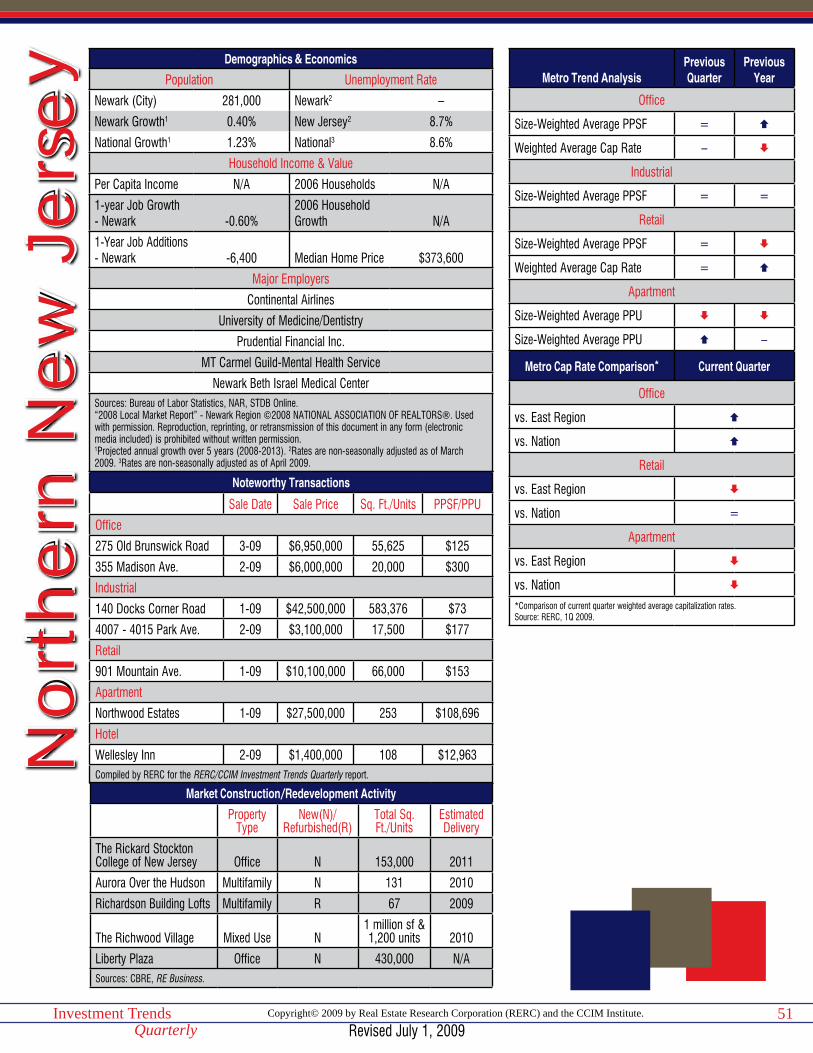
Copyright© 2009 by Real Estate Research Corporation (RERC) and the CCIM Institute.Investment TrendsQuarterly
51
Demographics & Economics
Population Unemployment Rate
Newark (City) 281,000 Newark2 –
Newark Growth1 0.40% New Jersey2 8.7%
National Growth1 1.23% National3 8.6%
Household Income & Value
Per Capita Income N/A 2006 Households N/A
1-year Job Growth - Newark -0.60%
2006 Household Growth N/A
1-Year Job Additions - Newark -6,400 Median Home Price $373,600
Major Employers
Continental Airlines
University of Medicine/Dentistry
Prudential Financial Inc.
MT Carmel Guild-Mental Health Service
Newark Beth Israel Medical CenterSources: Bureau of Labor Statistics, NAR, STDB Online.“2008 Local Market Report” - Newark Region ©2008 NATIONAL ASSOCIATION OF REALTORS®. Used with permission. Reproduction, reprinting, or retransmission of this document in any form (electronic media included) is prohibited without written permission.1Projected annual growth over 5 years (2008-2013). 2Rates are non-seasonally adjusted as of March 2009. 3Rates are non-seasonally adjusted as of April 2009.
Noteworthy Transactions
Sale Date Sale Price Sq. Ft./Units PPSF/PPU
Office
275 Old Brunswick Road 3-09 $6,950,000 55,625 $125
355 Madison Ave. 2-09 $6,000,000 20,000 $300
Industrial
140 Docks Corner Road 1-09 $42,500,000 583,376 $73
4007 - 4015 Park Ave. 2-09 $3,100,000 17,500 $177
Retail
901 Mountain Ave. 1-09 $10,100,000 66,000 $153
Apartment
Northwood Estates 1-09 $27,500,000 253 $108,696
Hotel
Wellesley Inn 2-09 $1,400,000 108 $12,963Compiled by RERC for the RERC/CCIM Investment Trends Quarterly report.
Market Construction/Redevelopment Activity
Property Type
New(N)/Refurbished(R)
Total Sq. Ft./Units
Estimated Delivery
The Rickard Stockton College of New Jersey Office N 153,000 2011
Aurora Over the Hudson Multifamily N 131 2010
Richardson Building Lofts Multifamily R 67 2009
The Richwood Village Mixed Use N1 million sf & 1,200 units 2010
Liberty Plaza Office N 430,000 N/ASources: CBRE, RE Business.
No
rthe
rn N
ew
Je
rse
y Metro Trend AnalysisPrevious Quarter
Previous Year
Office
Size-Weighted Average PPSF =
Weighted Average Cap Rate –
Industrial
Size-Weighted Average PPSF = =
Retail
Size-Weighted Average PPSF =
Weighted Average Cap Rate =
Apartment
Size-Weighted Average PPU
Size-Weighted Average PPU –
Metro Cap Rate Comparison* Current Quarter
Office
vs. East Region
vs. Nation
Retail
vs. East Region
vs. Nation =
Apartment
vs. East Region
vs. Nation
*Comparison of current quarter weighted average capitalization rates.Source: RERC, 1Q 2009.
Revised July 1, 2009

Copyright© 2009 by Real Estate Research Corporation (RERC) and the CCIM Institute.Investment TrendsQuarterly
52
Northern NJ Transaction Breakdown12-Month Trailing (04/01/08 - 03/31/09)
Office Industrial Retail Apartment Hotel< $5 MillionVolume (Mil) $41 $97 $92 $49 –
Size Weighted Avg. ($ per sf/unit) $113 $80 $155 $96,826 –
Price Weighted Avg. ($ per sf/unit) $174 $113 $204 $115,269 –
Median ($ per sf/unit) $155 $93 $142 $90,000 –
> $5 MillionVolume (Mil) $1,082 $362 $322 $274 –
Size Weighted Avg. ($ per sf/unit) $217 $81 $178 $126,813 –
Price Weighted Avg. ($ per sf/unit) $265 $87 $198 $186,457 –
Median ($ per sf/unit) $150 $76 $199 $161,765 –
All TransactionsVolume (Mil) $1,123 $459 $414 $322 –
Size Weighted Avg. ($ per sf/unit) $210 $81 $172 $121,165 –
Price Weighted Avg. ($ per sf/unit) $261 $92 $200 $175,742 –
Median ($ per sf/unit) $151 $81 $154 $95,707 –
Capitalization Rates (All Transactions)Weighted Average (%) 6.2 – 6.9 5.9 –
Median (%) 6.9 – 6.5 6.2 –Source: RERC.
Northern NJ Transaction Trends12-Month Trailing (04/01/08 - 03/31/09)
Office Industrial Retail Apartment HotelMedian Price% Change Quarter Ago 3% -4% -13% -2% –
% Change Year Ago 5% -13% -15% -16% –
Volume % Change Quarter Ago -20% -28% -30% -16% –
% Change Year Ago -36% -57% -50% -80% –Source: RERC.
Revised July 1, 2009
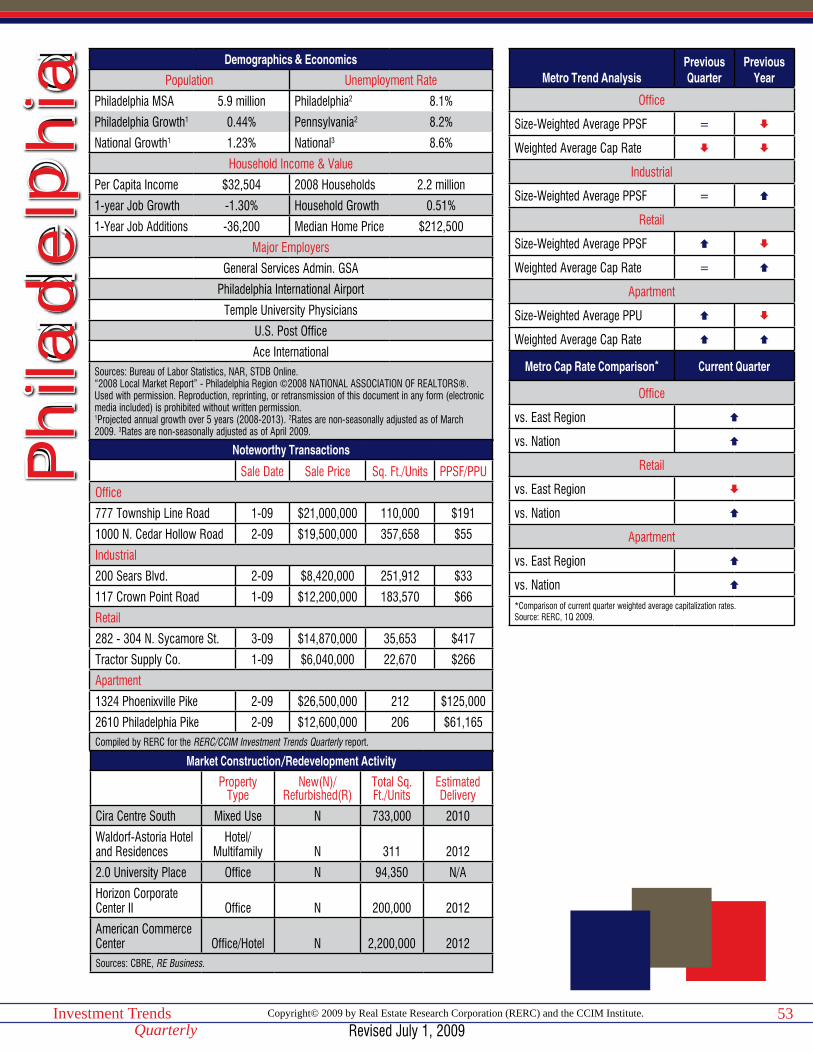
Copyright© 2009 by Real Estate Research Corporation (RERC) and the CCIM Institute.Investment TrendsQuarterly
53
Demographics & Economics
Population Unemployment Rate
Philadelphia MSA 5.9 million Philadelphia2 8.1%
Philadelphia Growth1 0.44% Pennsylvania2 8.2%
National Growth1 1.23% National3 8.6%
Household Income & Value
Per Capita Income $32,504 2008 Households 2.2 million
1-year Job Growth -1.30% Household Growth 0.51%
1-Year Job Additions -36,200 Median Home Price $212,500
Major Employers
General Services Admin. GSA
Philadelphia International Airport
Temple University Physicians
U.S. Post Office
Ace InternationalSources: Bureau of Labor Statistics, NAR, STDB Online.“2008 Local Market Report” - Philadelphia Region ©2008 NATIONAL ASSOCIATION OF REALTORS®. Used with permission. Reproduction, reprinting, or retransmission of this document in any form (electronic media included) is prohibited without written permission.1Projected annual growth over 5 years (2008-2013). 2Rates are non-seasonally adjusted as of March 2009. 3Rates are non-seasonally adjusted as of April 2009.
Noteworthy Transactions
Sale Date Sale Price Sq. Ft./Units PPSF/PPU
Office
777 Township Line Road 1-09 $21,000,000 110,000 $191
1000 N. Cedar Hollow Road 2-09 $19,500,000 357,658 $55
Industrial
200 Sears Blvd. 2-09 $8,420,000 251,912 $33
117 Crown Point Road 1-09 $12,200,000 183,570 $66
Retail
282 - 304 N. Sycamore St. 3-09 $14,870,000 35,653 $417
Tractor Supply Co. 1-09 $6,040,000 22,670 $266
Apartment
1324 Phoenixville Pike 2-09 $26,500,000 212 $125,000
2610 Philadelphia Pike 2-09 $12,600,000 206 $61,165Compiled by RERC for the RERC/CCIM Investment Trends Quarterly report.
Market Construction/Redevelopment Activity
Property Type
New(N)/Refurbished(R)
Total Sq. Ft./Units
Estimated Delivery
Cira Centre South Mixed Use N 733,000 2010
Waldorf-Astoria Hotel and Residences
Hotel/Multifamily N 311 2012
2.0 University Place Office N 94,350 N/A
Horizon Corporate Center II Office N 200,000 2012
American Commerce Center Office/Hotel N 2,200,000 2012Sources: CBRE, RE Business.
Phila
de
lphi
a Metro Trend AnalysisPrevious Quarter
Previous Year
Office
Size-Weighted Average PPSF =
Weighted Average Cap Rate
Industrial
Size-Weighted Average PPSF =
Retail
Size-Weighted Average PPSF
Weighted Average Cap Rate =
Apartment
Size-Weighted Average PPU
Weighted Average Cap Rate
Metro Cap Rate Comparison* Current Quarter
Office
vs. East Region
vs. Nation
Retail
vs. East Region
vs. Nation
Apartment
vs. East Region
vs. Nation
*Comparison of current quarter weighted average capitalization rates.Source: RERC, 1Q 2009.
Revised July 1, 2009

Copyright© 2009 by Real Estate Research Corporation (RERC) and the CCIM Institute.Investment TrendsQuarterly
54
Philadelphia Transaction Breakdown12-Month Trailing (04/01/08 - 03/31/09)
Office Industrial Retail Apartment Hotel< $5 MillionVolume (Mil) $54 $117 $121 $64 –
Size Weighted Avg. ($ per sf/unit) $97 $45 $120 $59,649 –
Price Weighted Avg. ($ per sf/unit) $133 $59 $201 $82,950 –
Median ($ per sf/unit) $102 $63 $100 $52,941 –
> $5 MillionVolume (Mil) $824 $379 $166 $472 –
Size Weighted Avg. ($ per sf/unit) $124 $85 $173 $93,830 –
Price Weighted Avg. ($ per sf/unit) $150 $106 $213 $109,104 –
Median ($ per sf/unit) $135 $66 $164 $91,734 –
All TransactionsVolume (Mil) $878 $496 $287 $536 –
Size Weighted Avg. ($ per sf/unit) $122 $70 $145 $87,822 –
Price Weighted Avg. ($ per sf/unit) $149 $95 $208 $105,982 –
Median ($ per sf/unit) $115 $64 $116 $65,000 –
Capitalization Rates (All Transactions)Weighted Average (%) 6.4 – 7.3 7.5 –
Median (%) 6.5 – 7.5 7.3 –Source: RERC.
Philadelphia Transaction Trends12-Month Trailing (04/01/08 - 03/31/09)
Office Industrial Retail Apartment HotelMedian Price% Change Quarter Ago -4% 2% 11% -11% –
% Change Year Ago -13% 11% 2% -24% –
Volume % Change Quarter Ago -2% -3% -1% -30% –
% Change Year Ago -60% -27% -75% -70% –Source: RERC.
Revised July 1, 2009
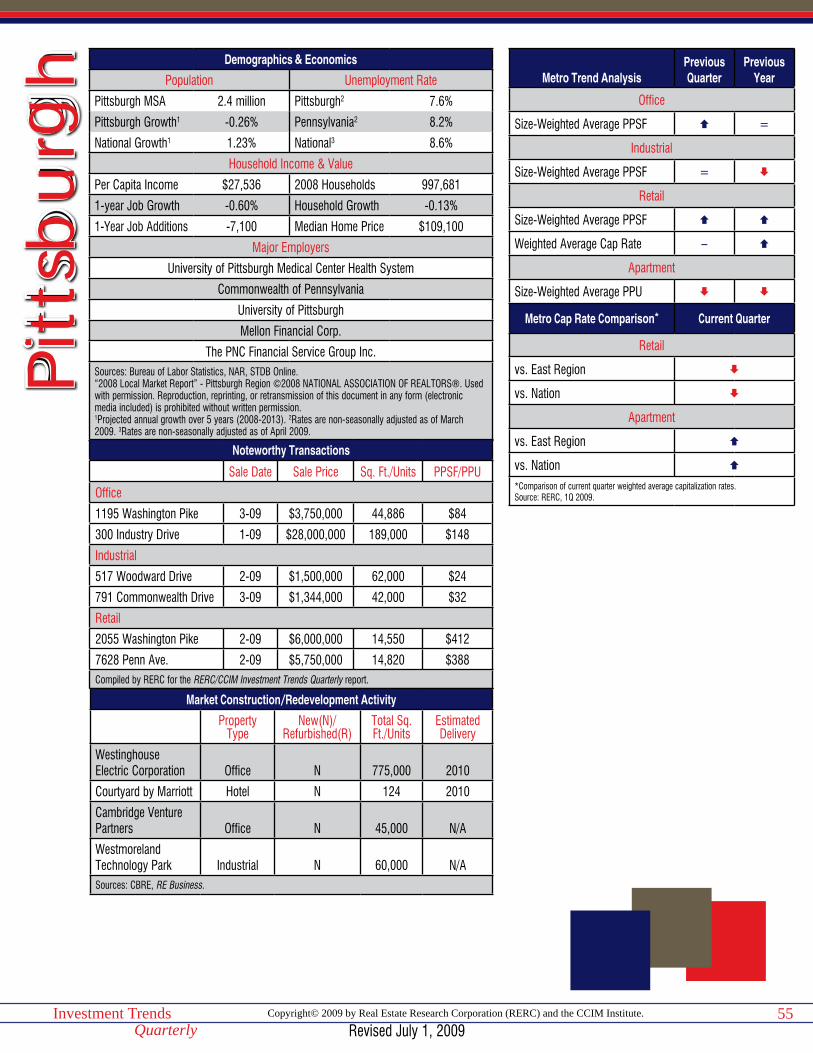
Copyright© 2009 by Real Estate Research Corporation (RERC) and the CCIM Institute.Investment TrendsQuarterly
55
Demographics & Economics
Population Unemployment Rate
Pittsburgh MSA 2.4 million Pittsburgh2 7.6%
Pittsburgh Growth1 -0.26% Pennsylvania2 8.2%
National Growth1 1.23% National3 8.6%
Household Income & Value
Per Capita Income $27,536 2008 Households 997,681
1-year Job Growth -0.60% Household Growth -0.13%
1-Year Job Additions -7,100 Median Home Price $109,100
Major Employers
University of Pittsburgh Medical Center Health System
Commonwealth of Pennsylvania
University of Pittsburgh
Mellon Financial Corp.
The PNC Financial Service Group Inc.Sources: Bureau of Labor Statistics, NAR, STDB Online.“2008 Local Market Report” - Pittsburgh Region ©2008 NATIONAL ASSOCIATION OF REALTORS®. Used with permission. Reproduction, reprinting, or retransmission of this document in any form (electronic media included) is prohibited without written permission.1Projected annual growth over 5 years (2008-2013). 2Rates are non-seasonally adjusted as of March 2009. 3Rates are non-seasonally adjusted as of April 2009.
Noteworthy Transactions
Sale Date Sale Price Sq. Ft./Units PPSF/PPU
Office
1195 Washington Pike 3-09 $3,750,000 44,886 $84
300 Industry Drive 1-09 $28,000,000 189,000 $148
Industrial
517 Woodward Drive 2-09 $1,500,000 62,000 $24
791 Commonwealth Drive 3-09 $1,344,000 42,000 $32
Retail
2055 Washington Pike 2-09 $6,000,000 14,550 $412
7628 Penn Ave. 2-09 $5,750,000 14,820 $388Compiled by RERC for the RERC/CCIM Investment Trends Quarterly report.
Market Construction/Redevelopment Activity
Property Type
New(N)/Refurbished(R)
Total Sq. Ft./Units
Estimated Delivery
WestinghouseElectric Corporation Office N 775,000 2010
Courtyard by Marriott Hotel N 124 2010
Cambridge Venture Partners Office N 45,000 N/A
WestmorelandTechnology Park Industrial N 60,000 N/ASources: CBRE, RE Business.
Pitt
sbur
gh Metro Trend Analysis
Previous Quarter
Previous Year
Office
Size-Weighted Average PPSF =
Industrial
Size-Weighted Average PPSF =
Retail
Size-Weighted Average PPSF
Weighted Average Cap Rate –
Apartment
Size-Weighted Average PPU
Metro Cap Rate Comparison* Current Quarter
Retail
vs. East Region
vs. Nation
Apartment
vs. East Region
vs. Nation
*Comparison of current quarter weighted average capitalization rates.Source: RERC, 1Q 2009.
Revised July 1, 2009

Copyright© 2009 by Real Estate Research Corporation (RERC) and the CCIM Institute.Investment TrendsQuarterly
56
Pittsburgh Transaction Breakdown12-Month Trailing (04/01/08 - 03/31/09)
Office Industrial Retail Apartment Hotel< $5 MillionVolume (Mil) $34 $36 $23 $5 –
Size Weighted Avg. ($ per sf/unit) $63 $36 $108 $29,860 –
Price Weighted Avg. ($ per sf/unit) $72 $54 $206 $30,105 –
Median ($ per sf/unit) $65 $45 $75 $28,246 –
> $5 MillionVolume (Mil) $103 – $35 $54 –
Size Weighted Avg. ($ per sf/unit) $87 – $188 $56,332 –
Price Weighted Avg. ($ per sf/unit) $121 – $313 $79,651 –
Median ($ per sf/unit) $148 – $388 $41,166 –
All TransactionsVolume (Mil) $137 $50 $58 $59 –
Size Weighted Avg. ($ per sf/unit) $80 $29 $146 $52,254 –
Price Weighted Avg. ($ per sf/unit) $109 $45 $271 $75,290 –
Median ($ per sf/unit) $69 $35 $86 $31,263 –
Capitalization Rates (All Transactions)Weighted Average (%) – – 6.5 8.1 –
Median (%) – – 6.5 8.3 –Source: RERC.
Pittsburgh Transaction Trends12-Month Trailing (04/01/08 - 03/31/09)
Office Industrial Retail Apartment HotelMedian Price% Change Quarter Ago – -31% -6% 10% –
% Change Year Ago 11% -20% -24% -18% –
Volume % Change Quarter Ago – -33% 21% 58% –
% Change Year Ago -61% -68% -63% -23% –Source: RERC.
Revised July 1, 2009
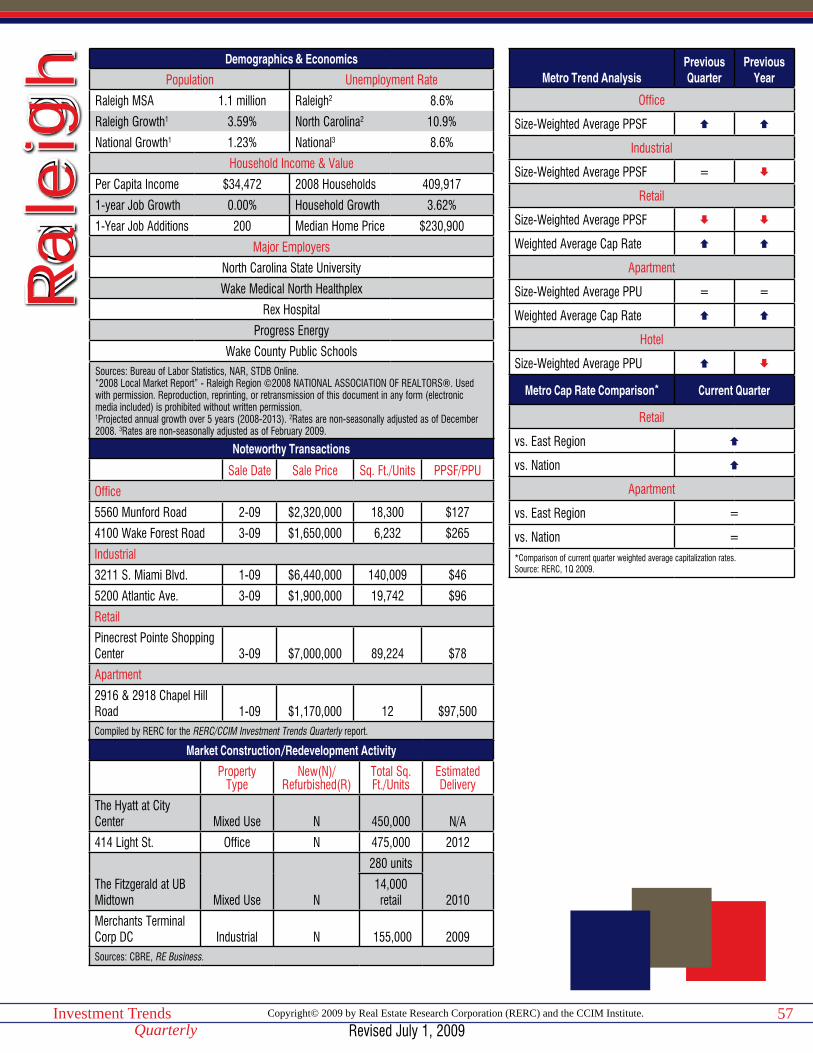
Copyright© 2009 by Real Estate Research Corporation (RERC) and the CCIM Institute.Investment TrendsQuarterly
57
Demographics & Economics
Population Unemployment Rate
Raleigh MSA 1.1 million Raleigh2 8.6%
Raleigh Growth1 3.59% North Carolina2 10.9%
National Growth1 1.23% National3 8.6%
Household Income & Value
Per Capita Income $34,472 2008 Households 409,917
1-year Job Growth 0.00% Household Growth 3.62%
1-Year Job Additions 200 Median Home Price $230,900
Major Employers
North Carolina State University
Wake Medical North Healthplex
Rex Hospital
Progress Energy
Wake County Public SchoolsSources: Bureau of Labor Statistics, NAR, STDB Online.“2008 Local Market Report” - Raleigh Region ©2008 NATIONAL ASSOCIATION OF REALTORS®. Used with permission. Reproduction, reprinting, or retransmission of this document in any form (electronic media included) is prohibited without written permission.1Projected annual growth over 5 years (2008-2013). 2Rates are non-seasonally adjusted as of December 2008. 3Rates are non-seasonally adjusted as of February 2009.
Noteworthy Transactions
Sale Date Sale Price Sq. Ft./Units PPSF/PPU
Office
5560 Munford Road 2-09 $2,320,000 18,300 $127
4100 Wake Forest Road 3-09 $1,650,000 6,232 $265
Industrial
3211 S. Miami Blvd. 1-09 $6,440,000 140,009 $46
5200 Atlantic Ave. 3-09 $1,900,000 19,742 $96
Retail
Pinecrest Pointe Shopping Center 3-09 $7,000,000 89,224 $78
Apartment
2916 & 2918 Chapel Hill Road 1-09 $1,170,000 12 $97,500Compiled by RERC for the RERC/CCIM Investment Trends Quarterly report.
Market Construction/Redevelopment Activity
Property Type
New(N)/Refurbished(R)
Total Sq. Ft./Units
Estimated Delivery
The Hyatt at City Center Mixed Use N 450,000 N/A
414 Light St. Office N 475,000 2012
The Fitzgerald at UB Midtown Mixed Use N
280 units
201014,000 retail
Merchants Terminal Corp DC Industrial N 155,000 2009Sources: CBRE, RE Business.
Rale
igh Metro Trend Analysis
Previous Quarter
Previous Year
Office
Size-Weighted Average PPSF
Industrial
Size-Weighted Average PPSF =
Retail
Size-Weighted Average PPSF
Weighted Average Cap Rate
Apartment
Size-Weighted Average PPU = =
Weighted Average Cap Rate
Hotel
Size-Weighted Average PPU
Metro Cap Rate Comparison* Current Quarter
Retail
vs. East Region
vs. Nation
Apartment
vs. East Region =
vs. Nation =*Comparison of current quarter weighted average capitalization rates.Source: RERC, 1Q 2009.
Revised July 1, 2009

Copyright© 2009 by Real Estate Research Corporation (RERC) and the CCIM Institute.Investment TrendsQuarterly
58
Raleigh Transaction Breakdown12-Month Trailing (04/01/08 - 03/31/09)
Office Industrial Retail Apartment Hotel< $5 MillionVolume (Mil) $81 $79 $59 $24 –
Size Weighted Avg. ($ per sf/unit) $115 $57 $116 $59,557 –
Price Weighted Avg. ($ per sf/unit) $133 $77 $158 $70,363 –
Median ($ per sf/unit) $118 $63 $105 $67,667 –
> $5 MillionVolume (Mil) $387 $40 $179 $550 $53
Size Weighted Avg. ($ per sf/unit) $167 $58 $153 $79,054 $79,074
Price Weighted Avg. ($ per sf/unit) $184 $65 $218 $93,437 $106,438
Median ($ per sf/unit) $148 $77 $212 $74,851 $85,562
All TransactionsVolume (Mil) $468 $119 $238 $573 $61
Size Weighted Avg. ($ per sf/unit) $155 $57 $142 $77,998 $68,244
Price Weighted Avg. ($ per sf/unit) $176 $73 $203 $92,483 $103,085
Median ($ per sf/unit) $133 $63 $125 $70,342 $85,562
Capitalization Rates (All Transactions)Weighted Average (%) – – 7.9 6.1 –
Median (%) – – 7.6 6.2 –Source: RERC.
Raleigh Transaction Trends12-Month Trailing (04/01/08 - 03/31/09)
Office Industrial Retail Apartment HotelMedian Price% Change Quarter Ago 0% -4% -20% 3% –
% Change Year Ago -1% -4% -21% 2% –
Volume % Change Quarter Ago 2% 8% 3% -53% –
% Change Year Ago -41% -71% -49% -50% –Source: RERC.
Revised July 1, 2009
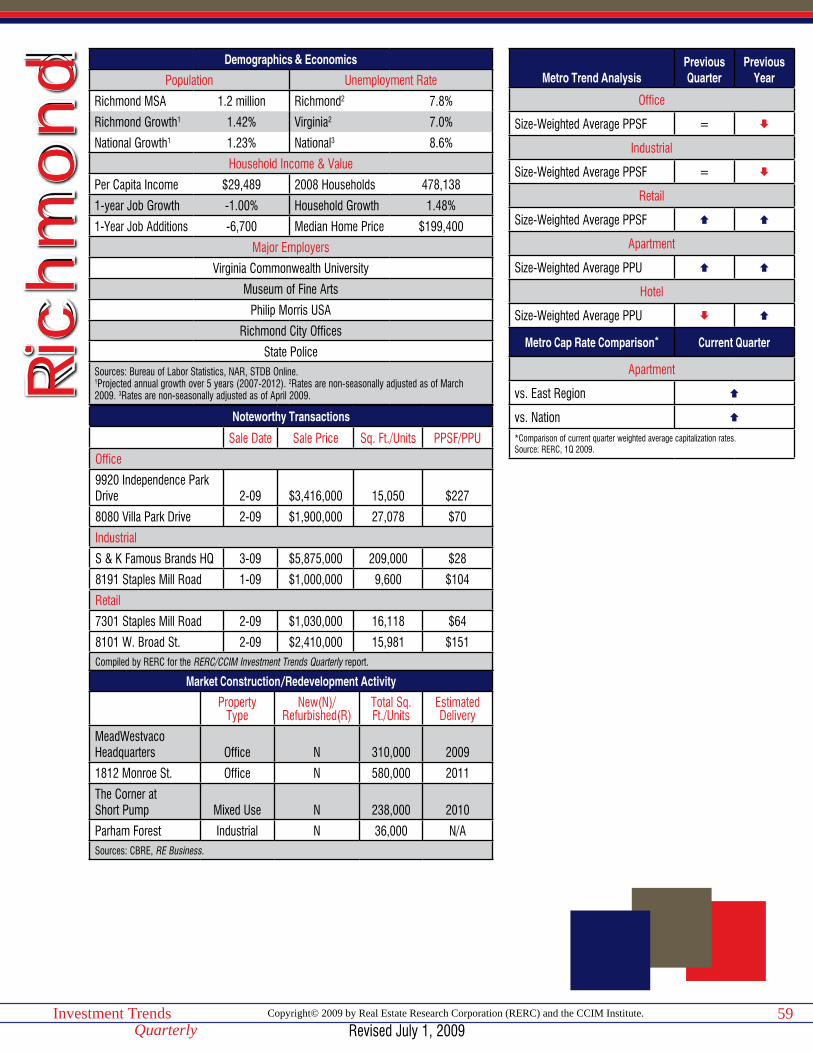
Copyright© 2009 by Real Estate Research Corporation (RERC) and the CCIM Institute.Investment TrendsQuarterly
59
Demographics & Economics
Population Unemployment Rate
Richmond MSA 1.2 million Richmond2 7.8%
Richmond Growth1 1.42% Virginia2 7.0%
National Growth1 1.23% National3 8.6%
Household Income & Value
Per Capita Income $29,489 2008 Households 478,138
1-year Job Growth -1.00% Household Growth 1.48%
1-Year Job Additions -6,700 Median Home Price $199,400
Major Employers
Virginia Commonwealth University
Museum of Fine Arts
Philip Morris USA
Richmond City Offices
State PoliceSources: Bureau of Labor Statistics, NAR, STDB Online.1Projected annual growth over 5 years (2007-2012). 2Rates are non-seasonally adjusted as of March 2009. 3Rates are non-seasonally adjusted as of April 2009.
Noteworthy Transactions
Sale Date Sale Price Sq. Ft./Units PPSF/PPU
Office
9920 Independence Park Drive 2-09 $3,416,000 15,050 $227
8080 Villa Park Drive 2-09 $1,900,000 27,078 $70
Industrial
S & K Famous Brands HQ 3-09 $5,875,000 209,000 $28
8191 Staples Mill Road 1-09 $1,000,000 9,600 $104
Retail
7301 Staples Mill Road 2-09 $1,030,000 16,118 $64
8101 W. Broad St. 2-09 $2,410,000 15,981 $151Compiled by RERC for the RERC/CCIM Investment Trends Quarterly report.
Market Construction/Redevelopment Activity
Property Type
New(N)/Refurbished(R)
Total Sq. Ft./Units
Estimated Delivery
MeadWestvacoHeadquarters Office N 310,000 2009
1812 Monroe St. Office N 580,000 2011
The Corner atShort Pump Mixed Use N 238,000 2010
Parham Forest Industrial N 36,000 N/ASources: CBRE, RE Business.
Ric
hmo
ndMetro Trend Analysis
Previous Quarter
Previous Year
Office
Size-Weighted Average PPSF =
Industrial
Size-Weighted Average PPSF =
Retail
Size-Weighted Average PPSF
Apartment
Size-Weighted Average PPU
Hotel
Size-Weighted Average PPU
Metro Cap Rate Comparison* Current Quarter
Apartment
vs. East Region
vs. Nation
*Comparison of current quarter weighted average capitalization rates.Source: RERC, 1Q 2009.
Revised July 1, 2009

Copyright© 2009 by Real Estate Research Corporation (RERC) and the CCIM Institute.Investment TrendsQuarterly
60
Richmond Transaction Breakdown12-Month Trailing (04/01/08 - 03/31/09)
Office Industrial Retail Apartment Hotel< $5 MillionVolume (Mil) $24 $23 $35 $3 –
Size Weighted Avg. ($ per sf/unit) $80 $33 $92 $56,615 –
Price Weighted Avg. ($ per sf/unit) $102 $62 $175 $60,138 –
Median ($ per sf/unit) $70 $36 $123 $63,767 –
> $5 MillionVolume (Mil) $201 – – $177 $84
Size Weighted Avg. ($ per sf/unit) $129 – – $113,262 $97,851
Price Weighted Avg. ($ per sf/unit) $159 – – $129,482 $111,684
Median ($ per sf/unit) $121 – – $139,925 $73,374
All TransactionsVolume (Mil) $224 $42 $56 $180 $89
Size Weighted Avg. ($ per sf/unit) $121 $30 $108 $111,441 $95,489
Price Weighted Avg. ($ per sf/unit) $153 $58 $166 $128,349 $109,317
Median ($ per sf/unit) $84 $36 $131 $76,042 $66,429
Capitalization Rates (All Transactions)Weighted Average (%) – – – 7.9 –
Median (%) – – – 7.9 –Source: RERC.
Richmond Transaction Trends12-Month Trailing (04/01/08 - 03/31/09)
Office Industrial Retail Apartment HotelMedian Price% Change Quarter Ago -15% -6% 7% 15% -1%
% Change Year Ago -26% -13% – – -21%
Volume % Change Quarter Ago -17% 6% -24% 6% -34%
% Change Year Ago -40% -71% – – -58%Source: RERC.
Revised July 1, 2009
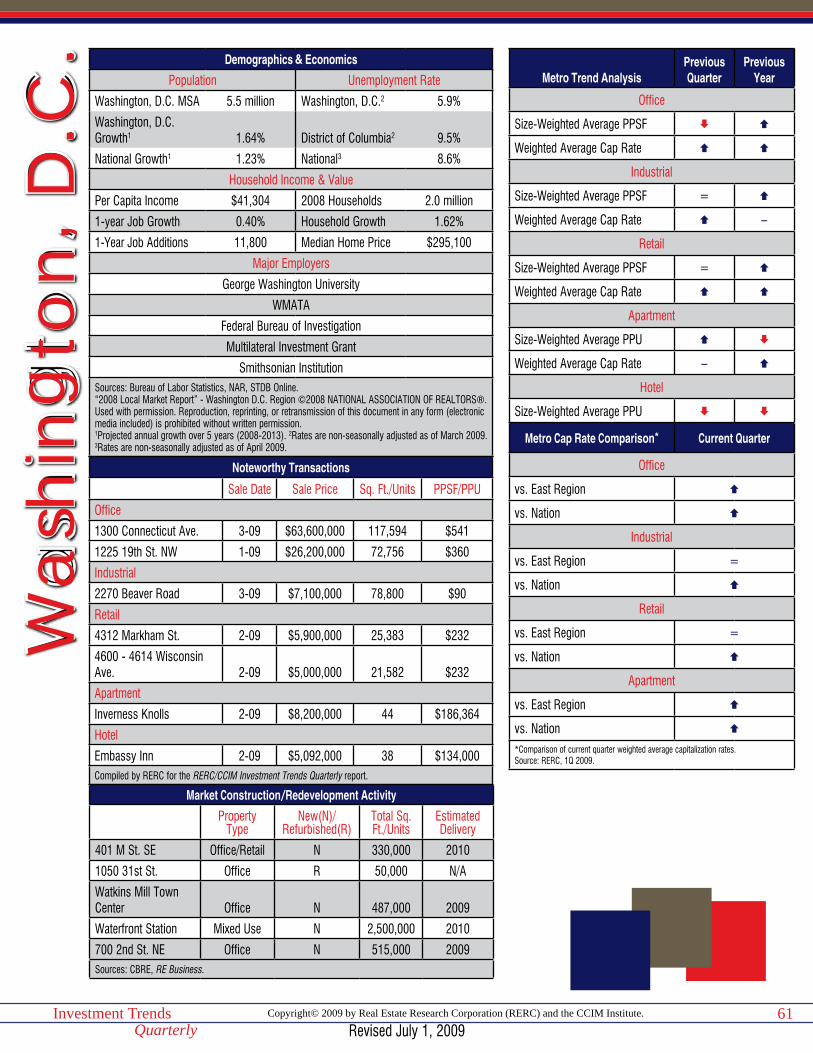
Copyright© 2009 by Real Estate Research Corporation (RERC) and the CCIM Institute.Investment TrendsQuarterly
61
Demographics & Economics
Population Unemployment Rate
Washington, D.C. MSA 5.5 million Washington, D.C.2 5.9%
Washington, D.C. Growth1 1.64% District of Columbia2 9.5%
National Growth1 1.23% National3 8.6%
Household Income & Value
Per Capita Income $41,304 2008 Households 2.0 million
1-year Job Growth 0.40% Household Growth 1.62%
1-Year Job Additions 11,800 Median Home Price $295,100
Major Employers
George Washington University
WMATA
Federal Bureau of Investigation
Multilateral Investment Grant
Smithsonian InstitutionSources: Bureau of Labor Statistics, NAR, STDB Online.“2008 Local Market Report” - Washington D.C. Region ©2008 NATIONAL ASSOCIATION OF REALTORS®. Used with permission. Reproduction, reprinting, or retransmission of this document in any form (electronic media included) is prohibited without written permission.1Projected annual growth over 5 years (2008-2013). 2Rates are non-seasonally adjusted as of March 2009. 3Rates are non-seasonally adjusted as of April 2009.
Noteworthy Transactions
Sale Date Sale Price Sq. Ft./Units PPSF/PPU
Office
1300 Connecticut Ave. 3-09 $63,600,000 117,594 $541
1225 19th St. NW 1-09 $26,200,000 72,756 $360
Industrial
2270 Beaver Road 3-09 $7,100,000 78,800 $90
Retail
4312 Markham St. 2-09 $5,900,000 25,383 $232
4600 - 4614 Wisconsin Ave. 2-09 $5,000,000 21,582 $232
Apartment
Inverness Knolls 2-09 $8,200,000 44 $186,364
Hotel
Embassy Inn 2-09 $5,092,000 38 $134,000Compiled by RERC for the RERC/CCIM Investment Trends Quarterly report.
Market Construction/Redevelopment Activity
Property Type
New(N)/Refurbished(R)
Total Sq. Ft./Units
Estimated Delivery
401 M St. SE Office/Retail N 330,000 2010
1050 31st St. Office R 50,000 N/A
Watkins Mill Town Center Office N 487,000 2009
Waterfront Station Mixed Use N 2,500,000 2010
700 2nd St. NE Office N 515,000 2009Sources: CBRE, RE Business.
Wa
shin
gto
n, D
.C.
Metro Trend AnalysisPrevious Quarter
Previous Year
Office
Size-Weighted Average PPSF
Weighted Average Cap Rate
Industrial
Size-Weighted Average PPSF =
Weighted Average Cap Rate –
Retail
Size-Weighted Average PPSF =
Weighted Average Cap Rate
Apartment
Size-Weighted Average PPU
Weighted Average Cap Rate –
Hotel
Size-Weighted Average PPU
Metro Cap Rate Comparison* Current Quarter
Office
vs. East Region
vs. Nation
Industrial
vs. East Region =
vs. Nation
Retail
vs. East Region =
vs. Nation
Apartment
vs. East Region
vs. Nation
*Comparison of current quarter weighted average capitalization rates.Source: RERC, 1Q 2009.
Revised July 1, 2009

Copyright© 2009 by Real Estate Research Corporation (RERC) and the CCIM Institute.Investment TrendsQuarterly
62
Washington, D.C. Transaction Breakdown12-Month Trailing (04/01/08 - 03/31/09)
Office Industrial Retail Apartment Hotel< $5 MillionVolume (Mil) $59 $83 $61 $16 –
Size Weighted Avg. ($ per sf/unit) $213 $102 $130 $80,130 –
Price Weighted Avg. ($ per sf/unit) $293 $153 $232 $109,944 –
Median ($ per sf/unit) $236 $117 $148 $73,235 –
> $5 MillionVolume (Mil) $4,073 $376 $298 $2,002 $103
Size Weighted Avg. ($ per sf/unit) $409 $142 $257 $168,996 $195,932
Price Weighted Avg. ($ per sf/unit) $502 $156 $343 $204,423 $216,014
Median ($ per sf/unit) $354 $139 $294 $168,519 $134,000
All TransactionsVolume (Mil) $4,132 $459 $359 $2,019 $103
Size Weighted Avg. ($ per sf/unit) $403 $133 $220 $167,484 $195,932
Price Weighted Avg. ($ per sf/unit) $499 $155 $324 $203,654 $216,014
Median ($ per sf/unit) $313 $128 $214 $155,072 $134,000
Capitalization Rates (All Transactions)Weighted Average (%) 6.5 7.5 7.4 6.6 –
Median (%) 7.0 6.7 7.4 6.7 –Source: RERC.
Washington, D.C. Transaction Trends12-Month Trailing (04/01/08 - 03/31/09)
Office Industrial Retail Apartment HotelMedian Price% Change Quarter Ago 3% -2% 7% – -40%
% Change Year Ago 0% 11% 1% – 14%
Volume % Change Quarter Ago -15% -5% -6% – -60%
% Change Year Ago -71% -30% -68% – -95%Source: RERC.
Revised July 1, 2009

Atlanta • Austin • Dallas/Ft. Worth • Houston • Memphis • Miami • Nashville New Orleans/Baton Rouge • Oklahoma City • Orlando • San Antonio • Tampa
South Region
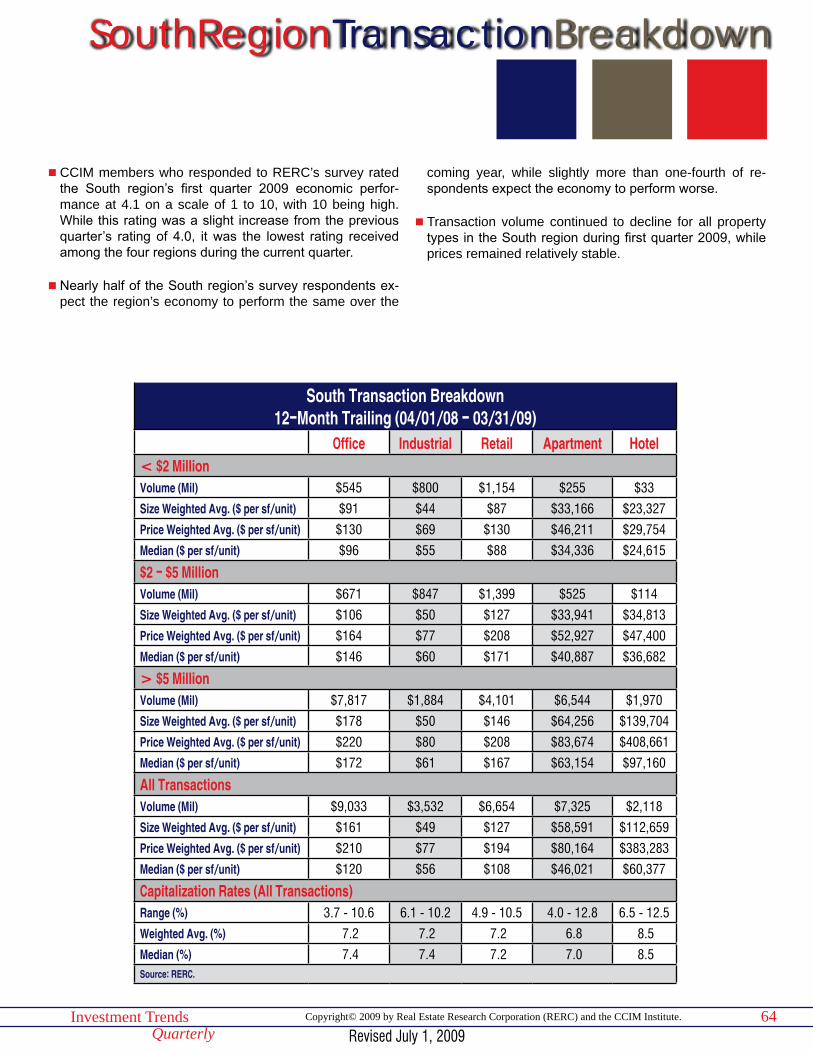
64Investment TrendsQuarterly
Copyright© 2009 by Real Estate Research Corporation (RERC) and the CCIM Institute.
SouthRegionTransactionBreakdown
South Transaction Breakdown12-Month Trailing (04/01/08 - 03/31/09)
Office Industrial Retail Apartment Hotel< $2 MillionVolume (Mil) $545 $800 $1,154 $255 $33
Size Weighted Avg. ($ per sf/unit) $91 $44 $87 $33,166 $23,327
Price Weighted Avg. ($ per sf/unit) $130 $69 $130 $46,211 $29,754
Median ($ per sf/unit) $96 $55 $88 $34,336 $24,615
$2 - $5 MillionVolume (Mil) $671 $847 $1,399 $525 $114
Size Weighted Avg. ($ per sf/unit) $106 $50 $127 $33,941 $34,813
Price Weighted Avg. ($ per sf/unit) $164 $77 $208 $52,927 $47,400
Median ($ per sf/unit) $146 $60 $171 $40,887 $36,682
> $5 MillionVolume (Mil) $7,817 $1,884 $4,101 $6,544 $1,970
Size Weighted Avg. ($ per sf/unit) $178 $50 $146 $64,256 $139,704
Price Weighted Avg. ($ per sf/unit) $220 $80 $208 $83,674 $408,661
Median ($ per sf/unit) $172 $61 $167 $63,154 $97,160
All TransactionsVolume (Mil) $9,033 $3,532 $6,654 $7,325 $2,118
Size Weighted Avg. ($ per sf/unit) $161 $49 $127 $58,591 $112,659
Price Weighted Avg. ($ per sf/unit) $210 $77 $194 $80,164 $383,283
Median ($ per sf/unit) $120 $56 $108 $46,021 $60,377
Capitalization Rates (All Transactions)Range (%) 3.7 - 10.6 6.1 - 10.2 4.9 - 10.5 4.0 - 12.8 6.5 - 12.5
Weighted Avg. (%) 7.2 7.2 7.2 6.8 8.5
Median (%) 7.4 7.4 7.2 7.0 8.5 Source: RERC.
n CCIM members who responded to RERC’s survey rated the South region’s first quarter 2009 economic perfor-mance at 4.1 on a scale of 1 to 10, with 10 being high. While this rating was a slight increase from the previous quarter’s rating of 4.0, it was the lowest rating received among the four regions during the current quarter.
n Nearly half of the South region’s survey respondents ex-pect the region’s economy to perform the same over the
coming year, while slightly more than one-fourth of re-spondents expect the economy to perform worse.
n Transaction volume continued to decline for all property types in the South region during first quarter 2009, while prices remained relatively stable.
Revised July 1, 2009
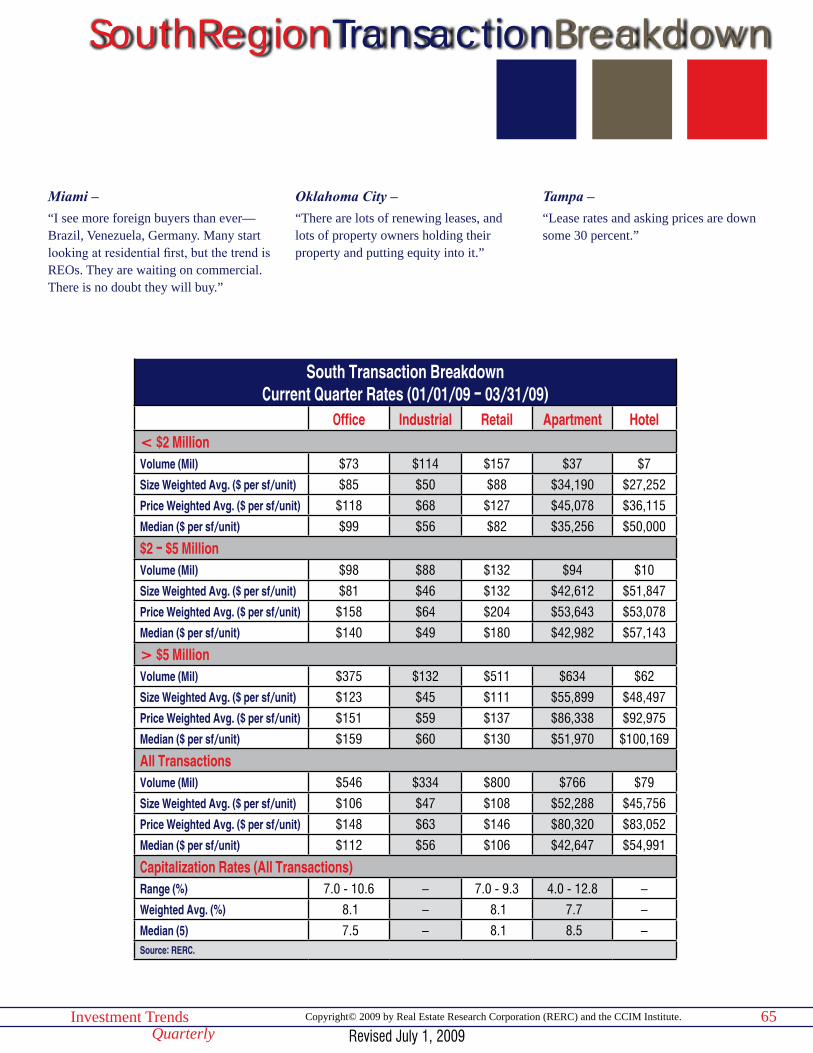
65Investment TrendsQuarterly
Copyright© 2009 by Real Estate Research Corporation (RERC) and the CCIM Institute.
SouthRegionTransactionBreakdown
South Transaction BreakdownCurrent Quarter Rates (01/01/09 - 03/31/09)
Office Industrial Retail Apartment Hotel< $2 MillionVolume (Mil) $73 $114 $157 $37 $7
Size Weighted Avg. ($ per sf/unit) $85 $50 $88 $34,190 $27,252
Price Weighted Avg. ($ per sf/unit) $118 $68 $127 $45,078 $36,115
Median ($ per sf/unit) $99 $56 $82 $35,256 $50,000
$2 - $5 MillionVolume (Mil) $98 $88 $132 $94 $10
Size Weighted Avg. ($ per sf/unit) $81 $46 $132 $42,612 $51,847
Price Weighted Avg. ($ per sf/unit) $158 $64 $204 $53,643 $53,078
Median ($ per sf/unit) $140 $49 $180 $42,982 $57,143
> $5 MillionVolume (Mil) $375 $132 $511 $634 $62
Size Weighted Avg. ($ per sf/unit) $123 $45 $111 $55,899 $48,497
Price Weighted Avg. ($ per sf/unit) $151 $59 $137 $86,338 $92,975
Median ($ per sf/unit) $159 $60 $130 $51,970 $100,169
All TransactionsVolume (Mil) $546 $334 $800 $766 $79
Size Weighted Avg. ($ per sf/unit) $106 $47 $108 $52,288 $45,756
Price Weighted Avg. ($ per sf/unit) $148 $63 $146 $80,320 $83,052
Median ($ per sf/unit) $112 $56 $106 $42,647 $54,991
Capitalization Rates (All Transactions)Range (%) 7.0 - 10.6 – 7.0 - 9.3 4.0 - 12.8 –
Weighted Avg. (%) 8.1 – 8.1 7.7 –
Median (5) 7.5 – 8.1 8.5 –Source: RERC.
Miami –“I see more foreign buyers than ever—Brazil, Venezuela, Germany. Many start looking at residential first, but the trend is REOs. They are waiting on commercial. There is no doubt they will buy.”
Oklahoma City –“There are lots of renewing leases, and lots of property owners holding their property and putting equity into it.”
Tampa –“Lease rates and asking prices are down some 30 percent.”
Revised July 1, 2009
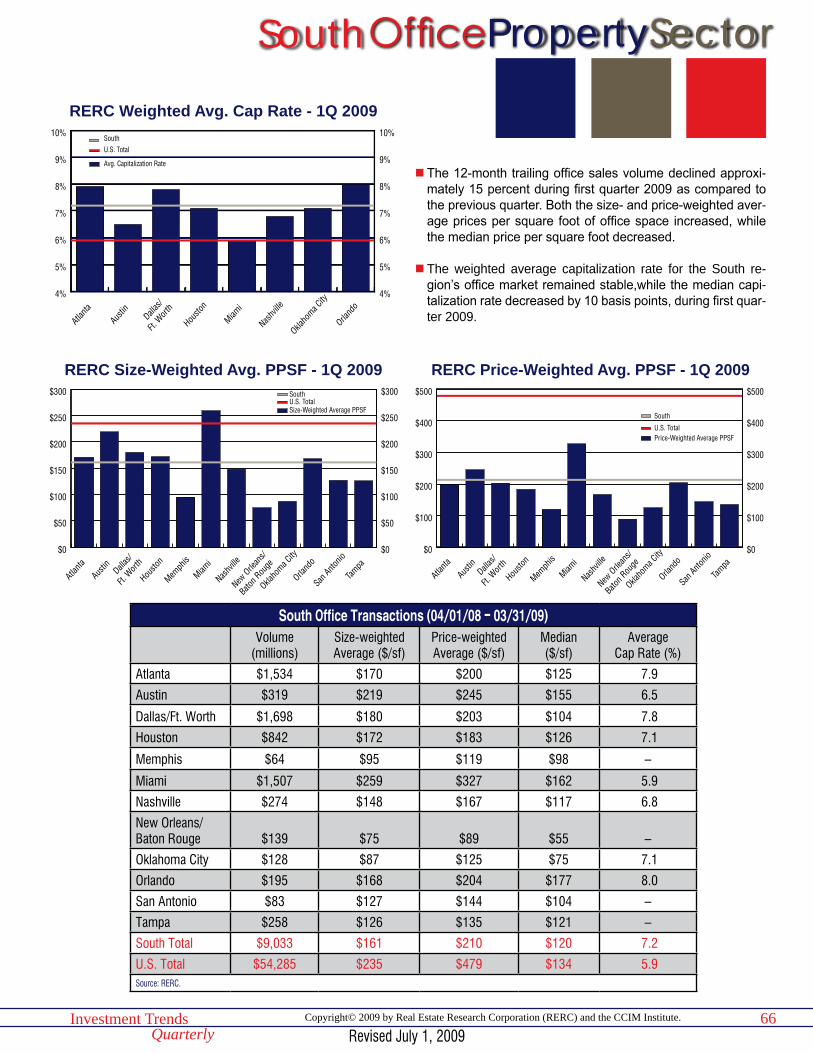
OfficePropertySector
66Investment TrendsQuarterly
Copyright© 2009 by Real Estate Research Corporation (RERC) and the CCIM Institute.
$0
$100
$200
$300
$400
$500
$0
$100
$200
$300
$400
$500
South
U.S. TotalPrice-Weighted Average PPSF
Tampa
San Anto
nio
Orland
o
Oklaho
ma City
New O
rlean
s/
Baton R
ouge
Nashv
ille
Miami
Memph
is
Housto
nDall
as/
Ft. W
orth
Austin
Atlanta
RERC Price-Weighted Avg. PPSF - 1Q 2009
4%
5%
6%
7%
8%
9%
10%
4%
5%
6%
7%
8%
9%
10%SouthU.S. Total
Avg. Capitalization Rate
Orland
o
Oklaho
ma City
Nashv
ille
Miami
Housto
nDall
as/
Ft. W
orth
Austi
n
Atlan
ta
RERC Weighted Avg. Cap Rate - 1Q 2009
South Office Transactions (04/01/08 - 03/31/09)Volume
(millions)Size-weighted Average ($/sf)
Price-weighted Average ($/sf)
Median($/sf)
Average Cap Rate (%)
Atlanta $1,534 $170 $200 $125 7.9
Austin $319 $219 $245 $155 6.5
Dallas/Ft. Worth $1,698 $180 $203 $104 7.8
Houston $842 $172 $183 $126 7.1
Memphis $64 $95 $119 $98 –
Miami $1,507 $259 $327 $162 5.9
Nashville $274 $148 $167 $117 6.8
New Orleans/Baton Rouge $139 $75 $89 $55 –
Oklahoma City $128 $87 $125 $75 7.1
Orlando $195 $168 $204 $177 8.0
San Antonio $83 $127 $144 $104 –
Tampa $258 $126 $135 $121 –
South Total $9,033 $161 $210 $120 7.2
U.S. Total $54,285 $235 $479 $134 5.9 Source: RERC.
$0
$50
$100
$150
$200
$250
$300
$0
$50
$100
$150
$200
$250
$300SouthU.S. TotalSize-Weighted Average PPSF
Tampa
San Anto
nio
Orland
o
Oklaho
ma City
New O
rlean
s/
Baton R
ouge
Nashv
ille
Miami
Memph
is
Housto
nDall
as/
Ft. W
orth
Austin
Atlanta
RERC Size-Weighted Avg. PPSF - 1Q 2009
n The 12-month trailing office sales volume declined approxi-mately 15 percent during first quarter 2009 as compared to the previous quarter. Both the size- and price-weighted aver-age prices per square foot of office space increased, while the median price per square foot decreased.
n The weighted average capitalization rate for the South re-gion’s office market remained stable,while the median capi-talization rate decreased by 10 basis points, during first quar-ter 2009.
South
Revised July 1, 2009
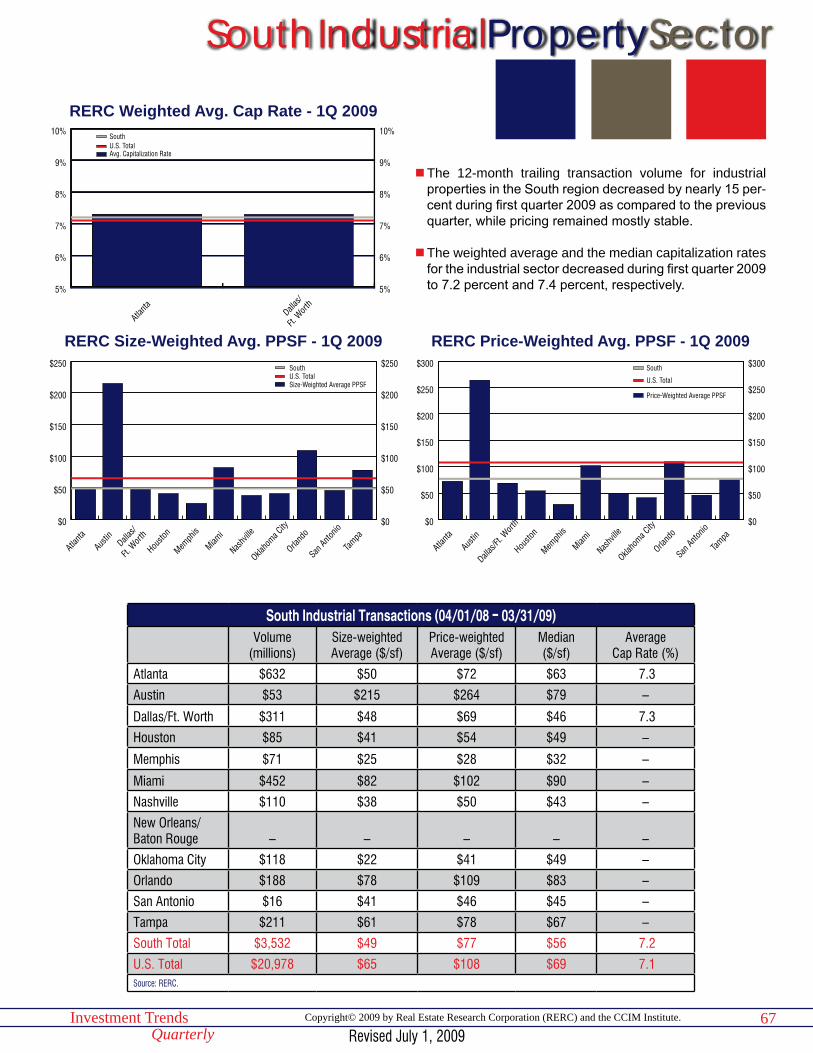
67Investment TrendsQuarterly
Copyright© 2009 by Real Estate Research Corporation (RERC) and the CCIM Institute.
IndustrialPropertySector
$0
$50
$100
$150
$200
$250
$300
$0
$50
$100
$150
$200
$250
$300South
U.S. Total
Price-Weighted Average PPSF
Tampa
San Anto
nio
Orland
o
Oklaho
ma City
Nashv
ille
Miami
Memph
is
Housto
n
Dallas
/Ft. W
orth
Austin
Atlanta
RERC Price-Weighted Avg. PPSF - 1Q 2009
South Industrial Transactions (04/01/08 - 03/31/09)Volume
(millions)Size-weighted Average ($/sf)
Price-weighted Average ($/sf)
Median($/sf)
Average Cap Rate (%)
Atlanta $632 $50 $72 $63 7.3
Austin $53 $215 $264 $79 –
Dallas/Ft. Worth $311 $48 $69 $46 7.3
Houston $85 $41 $54 $49 –
Memphis $71 $25 $28 $32 –
Miami $452 $82 $102 $90 –
Nashville $110 $38 $50 $43 –
New Orleans/Baton Rouge – – – – –
Oklahoma City $118 $22 $41 $49 –
Orlando $188 $78 $109 $83 –
San Antonio $16 $41 $46 $45 –
Tampa $211 $61 $78 $67 –
South Total $3,532 $49 $77 $56 7.2
U.S. Total $20,978 $65 $108 $69 7.1 Source: RERC.
$0
$50
$100
$150
$200
$250
$0
$50
$100
$150
$200
$250SouthU.S. TotalSize-Weighted Average PPSF
Tampa
San Anto
nio
Orland
o
Oklaho
ma City
Nashv
ille
Miami
Memph
is
Housto
nDall
as/
Ft. W
orth
Austin
Atlanta
RERC Size-Weighted Avg. PPSF - 1Q 2009
n The 12-month trailing transaction volume for industrial properties in the South region decreased by nearly 15 per-cent during first quarter 2009 as compared to the previous quarter, while pricing remained mostly stable.
n The weighted average and the median capitalization rates for the industrial sector decreased during first quarter 2009 to 7.2 percent and 7.4 percent, respectively.
South
Revised July 1, 2009
5%
6%
7%
8%
9%
10%
5%
6%
7%
8%
9%
10%SouthU.S. TotalAvg. Capitalization Rate
Dallas
/
Ft. W
orth
Atlanta
RERC Weighted Avg. Cap Rate - 1Q 2009
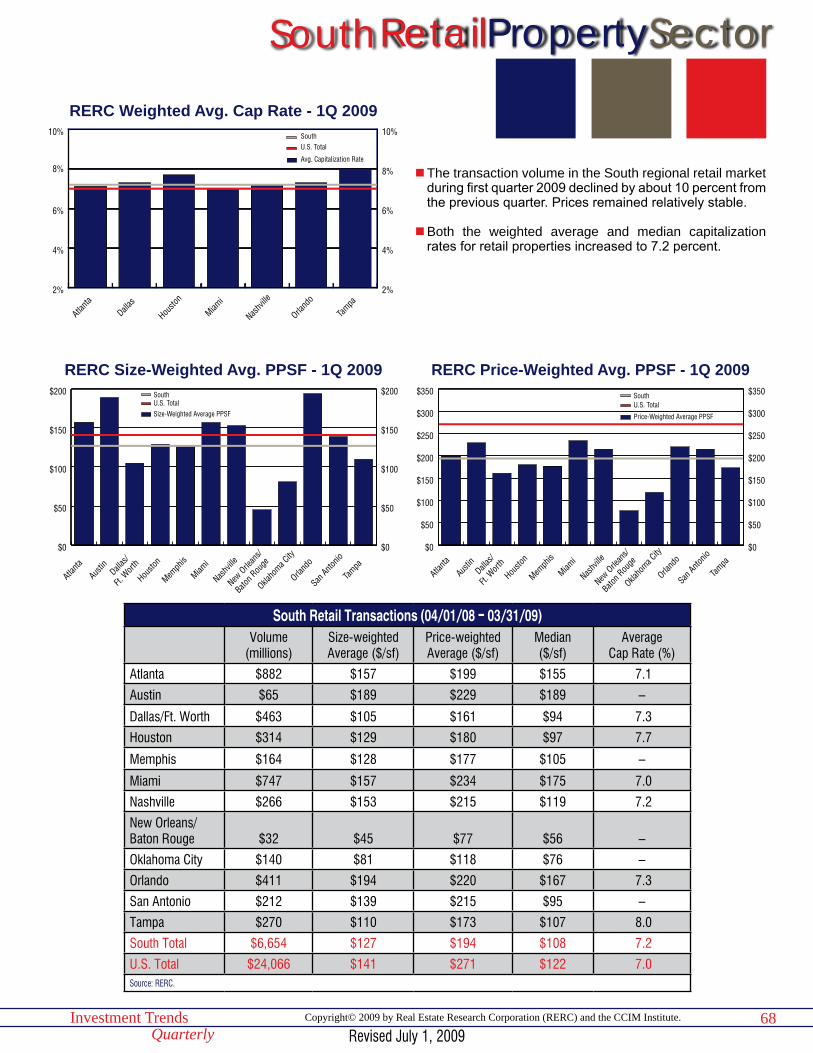
68Investment TrendsQuarterly
Copyright© 2009 by Real Estate Research Corporation (RERC) and the CCIM Institute.
RetailPropertySector
$0
$50
$100
$150
$200
$250
$300
$350
$0
$50
$100
$150
$200
$250
$300
$350SouthU.S. Total
Price-Weighted Average PPSF
Tampa
San Anto
nio
Orland
o
Oklaho
ma City
New O
rlean
s/
Baton R
ouge
Nashv
ille
Miami
Memph
is
Housto
nDall
as/
Ft. W
orth
Austin
Atlanta
RERC Price-Weighted Avg. PPSF - 1Q 2009
2%
4%
6%
8%
10%
2%
4%
6%
8%
10%SouthU.S. Total
Avg. Capitalization Rate
Tampa
Orland
o
Nashv
ille
Miami
Housto
n
Dallas
Atlanta
RERC Weighted Avg. Cap Rate - 1Q 2009
South Retail Transactions (04/01/08 - 03/31/09)Volume
(millions)Size-weighted Average ($/sf)
Price-weighted Average ($/sf)
Median($/sf)
Average Cap Rate (%)
Atlanta $882 $157 $199 $155 7.1
Austin $65 $189 $229 $189 –
Dallas/Ft. Worth $463 $105 $161 $94 7.3
Houston $314 $129 $180 $97 7.7
Memphis $164 $128 $177 $105 –
Miami $747 $157 $234 $175 7.0
Nashville $266 $153 $215 $119 7.2
New Orleans/Baton Rouge $32 $45 $77 $56 –
Oklahoma City $140 $81 $118 $76 –
Orlando $411 $194 $220 $167 7.3
San Antonio $212 $139 $215 $95 –
Tampa $270 $110 $173 $107 8.0
South Total $6,654 $127 $194 $108 7.2
U.S. Total $24,066 $141 $271 $122 7.0 Source: RERC.
$0
$50
$100
$150
$200
$0
$50
$100
$150
$200SouthU.S. TotalSize-Weighted Average PPSF
Tampa
San Anto
nio
Orland
o
Oklaho
ma City
New O
rlean
s/
Baton R
ouge
Nashv
ille
Miami
Memph
is
Housto
nDall
as/
Ft. W
orth
Austin
Atlanta
RERC Size-Weighted Avg. PPSF - 1Q 2009
n The transaction volume in the South regional retail market during first quarter 2009 declined by about 10 percent from the previous quarter. Prices remained relatively stable.
n Both the weighted average and median capitalization rates for retail properties increased to 7.2 percent.
South
Revised July 1, 2009
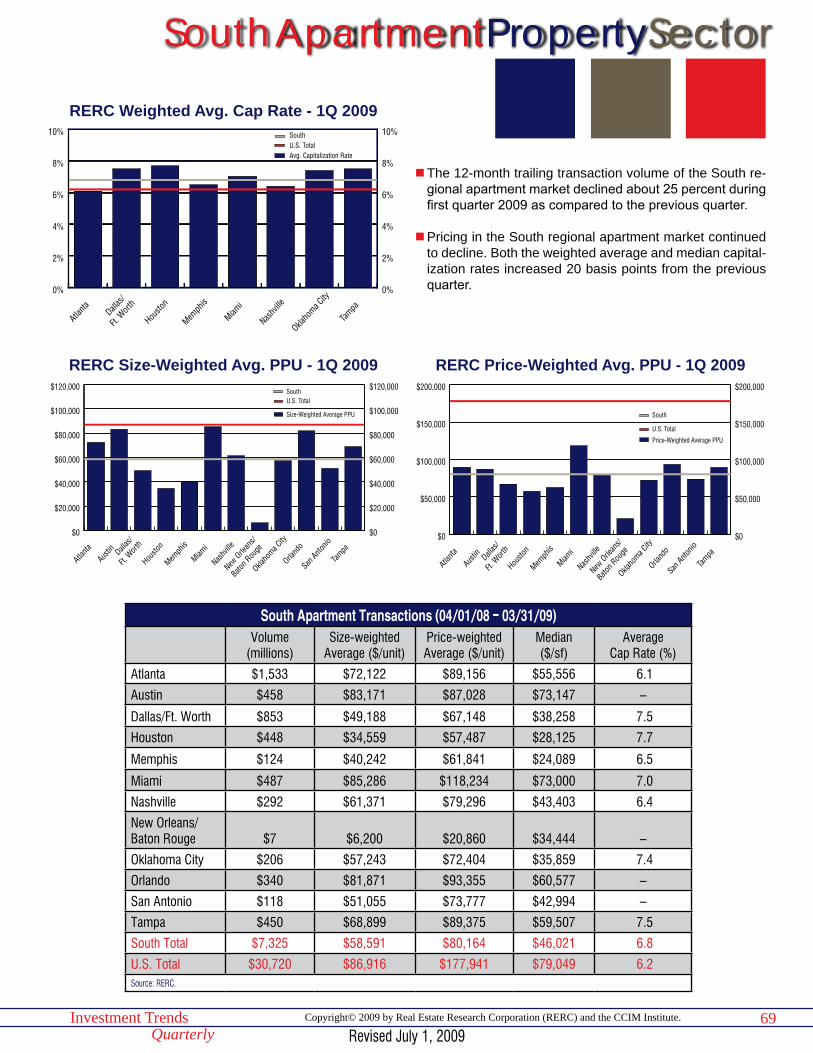
69Investment TrendsQuarterly
Copyright© 2009 by Real Estate Research Corporation (RERC) and the CCIM Institute.
ApartmentPropertySector
$0
$50,000
$100,000
$150,000
$200,000
$0
$50,000
$100,000
$150,000
$200,000
South
U.S. Total
Price-Weighted Average PPU
Tampa
San A
ntonio
Orland
o
Oklaho
ma City
New O
rlean
s/
Baton
Rou
ge
Nashv
ille
Miami
Memph
is
Housto
nDall
as/
Ft. W
orth
Austi
n
Atlan
ta
RERC Price-Weighted Avg. PPU - 1Q 2009
South Apartment Transactions (04/01/08 - 03/31/09)Volume
(millions)Size-weighted
Average ($/unit)Price-weighted Average ($/unit)
Median($/sf)
Average Cap Rate (%)
Atlanta $1,533 $72,122 $89,156 $55,556 6.1
Austin $458 $83,171 $87,028 $73,147 –
Dallas/Ft. Worth $853 $49,188 $67,148 $38,258 7.5
Houston $448 $34,559 $57,487 $28,125 7.7
Memphis $124 $40,242 $61,841 $24,089 6.5
Miami $487 $85,286 $118,234 $73,000 7.0
Nashville $292 $61,371 $79,296 $43,403 6.4
New Orleans/Baton Rouge $7 $6,200 $20,860 $34,444 –
Oklahoma City $206 $57,243 $72,404 $35,859 7.4
Orlando $340 $81,871 $93,355 $60,577 –
San Antonio $118 $51,055 $73,777 $42,994 –
Tampa $450 $68,899 $89,375 $59,507 7.5
South Total $7,325 $58,591 $80,164 $46,021 6.8
U.S. Total $30,720 $86,916 $177,941 $79,049 6.2 Source: RERC.
$0
$20,000
$40,000
$60,000
$80,000
$100,000
$120,000
$0
$20,000
$40,000
$60,000
$80,000
$100,000
$120,000SouthU.S. Total
Size-Weighted Average PPU
Tampa
San Anto
nio
Orland
o
Oklaho
ma City
New O
rlean
s/
Baton R
ouge
Nashv
ille
Miami
Memph
is
Housto
nDall
as/
Ft. W
orth
Austin
Atlanta
RERC Size-Weighted Avg. PPU - 1Q 2009
n The 12-month trailing transaction volume of the South re-gional apartment market declined about 25 percent during first quarter 2009 as compared to the previous quarter.
n Pricing in the South regional apartment market continued to decline. Both the weighted average and median capital-ization rates increased 20 basis points from the previous quarter.
South
0%
2%
4%
6%
8%
10%
0%
2%
4%
6%
8%
10%SouthU.S. TotalAvg. Capitalization Rate
Tampa
Oklaho
ma City
Nashv
ille
Miami
Memph
is
Housto
nDall
as/
Ft. W
orth
Atlanta
RERC Weighted Avg. Cap Rate - 1Q 2009
Revised July 1, 2009
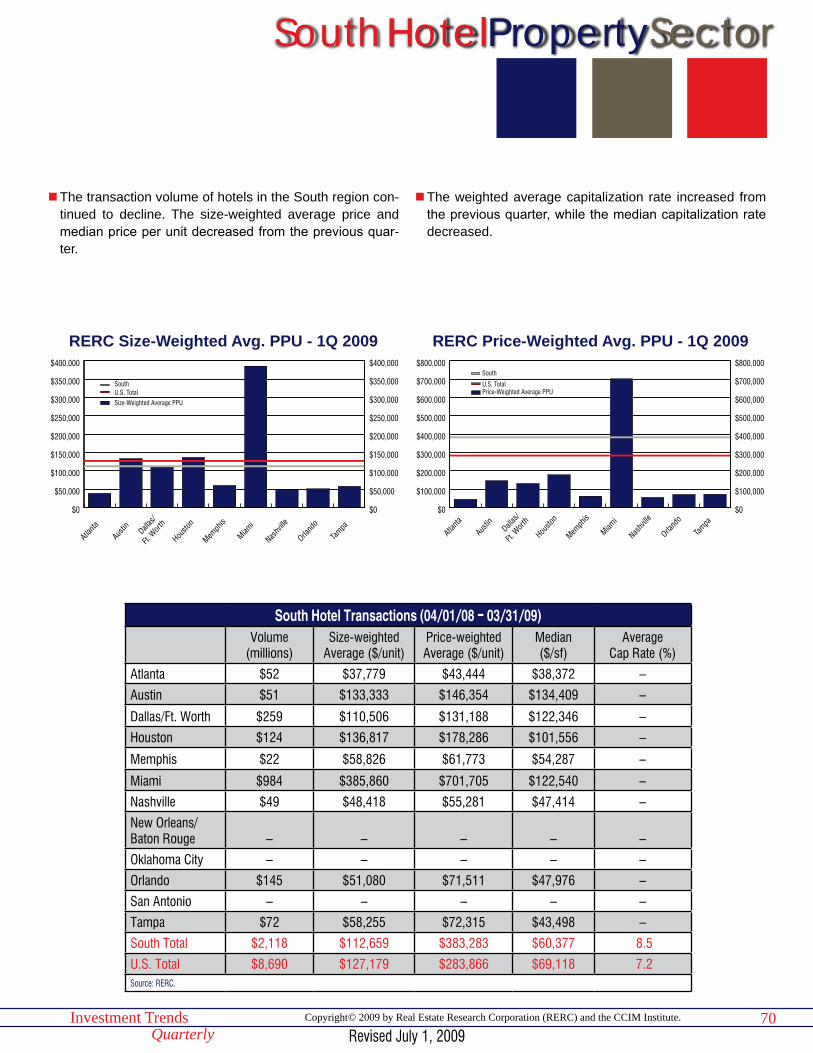
70Investment TrendsQuarterly
Copyright© 2009 by Real Estate Research Corporation (RERC) and the CCIM Institute.
HotelPropertySector
$0
$100,000
$200,000
$300,000
$400,000
$500,000
$600,000
$700,000
$800,000
$0
$100,000
$200,000
$300,000
$400,000
$500,000
$600,000
$700,000
$800,000South
U.S. TotalPrice-Weighted Average PPU
Tampa
Orland
o
Nashv
ille
Miami
Memph
is
Housto
nDall
as/
Ft. W
orth
Austin
Atlanta
RERC Price-Weighted Avg. PPU - 1Q 2009
South Hotel Transactions (04/01/08 - 03/31/09)Volume
(millions)Size-weighted
Average ($/unit)Price-weighted Average ($/unit)
Median($/sf)
Average Cap Rate (%)
Atlanta $52 $37,779 $43,444 $38,372 –
Austin $51 $133,333 $146,354 $134,409 –
Dallas/Ft. Worth $259 $110,506 $131,188 $122,346 –
Houston $124 $136,817 $178,286 $101,556 –
Memphis $22 $58,826 $61,773 $54,287 –
Miami $984 $385,860 $701,705 $122,540 –
Nashville $49 $48,418 $55,281 $47,414 –
New Orleans/Baton Rouge – – – – –
Oklahoma City – – – – –
Orlando $145 $51,080 $71,511 $47,976 –
San Antonio – – – – –
Tampa $72 $58,255 $72,315 $43,498 –
South Total $2,118 $112,659 $383,283 $60,377 8.5
U.S. Total $8,690 $127,179 $283,866 $69,118 7.2 Source: RERC.
$0
$50,000
$100,000
$150,000
$200,000
$250,000
$300,000
$350,000
$400,000
$0
$50,000
$100,000
$150,000
$200,000
$250,000
$300,000
$350,000
$400,000
SouthU.S. TotalSize-Weighted Average PPU
Tampa
Orland
o
Nashv
ille
Miami
Memph
is
Housto
nDall
as/
Ft. W
orth
Austin
Atlanta
RERC Size-Weighted Avg. PPU - 1Q 2009
n The transaction volume of hotels in the South region con-tinued to decline. The size-weighted average price and median price per unit decreased from the previous quar-ter.
n The weighted average capitalization rate increased from the previous quarter, while the median capitalization rate decreased.
South
Revised July 1, 2009
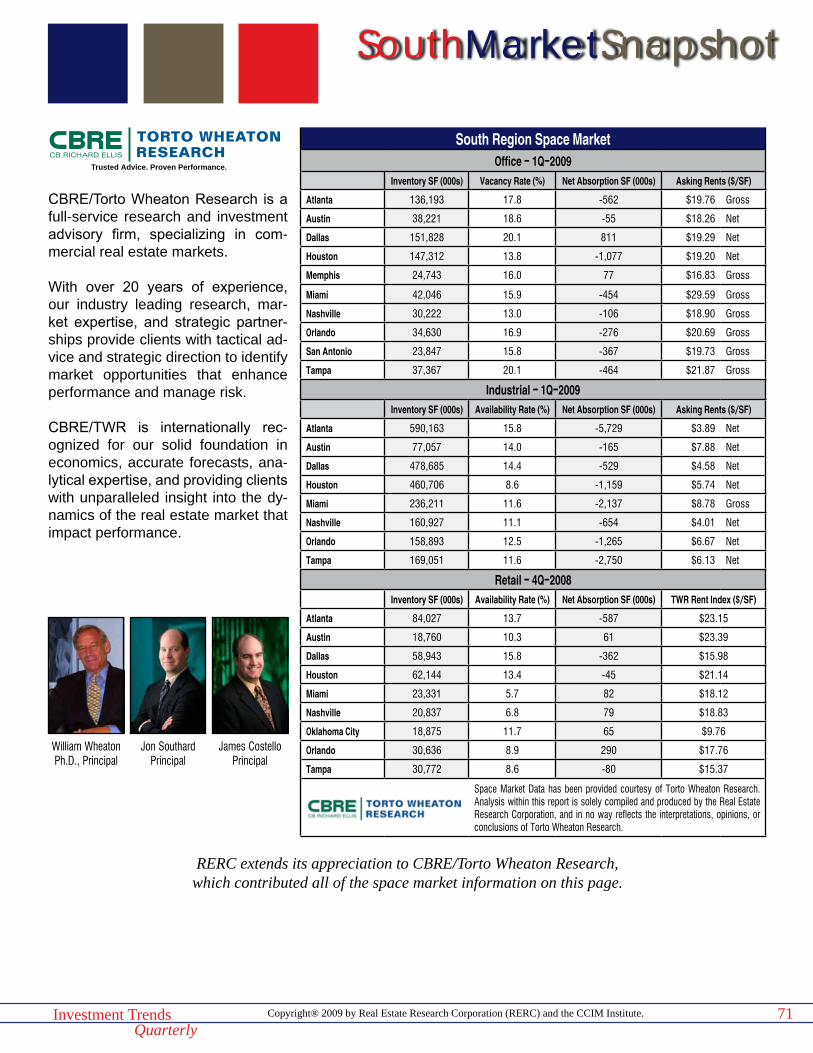
Copyright® 2009 by Real Estate Research Corporation (RERC) and the CCIM Institute.Investment TrendsQuarterly
SouthMarketSnapshot
71
South Region Space MarketOffice - 1Q-2009
Inventory SF (000s) Vacancy Rate (%) Net Absorption SF (000s) Asking Rents ($/SF)
Atlanta 136,193 17.8 -562 $19.76 Gross
Austin 38,221 18.6 -55 $18.26 Net
Dallas 151,828 20.1 811 $19.29 Net
Houston 147,312 13.8 -1,077 $19.20 Net
Memphis 24,743 16.0 77 $16.83 Gross
Miami 42,046 15.9 -454 $29.59 Gross
Nashville 30,222 13.0 -106 $18.90 Gross
Orlando 34,630 16.9 -276 $20.69 Gross
San Antonio 23,847 15.8 -367 $19.73 Gross
Tampa 37,367 20.1 -464 $21.87 Gross
Industrial - 1Q-2009Inventory SF (000s) Availability Rate (%) Net Absorption SF (000s) Asking Rents ($/SF)
Atlanta 590,163 15.8 -5,729 $3.89 Net
Austin 77,057 14.0 -165 $7.88 Net
Dallas 478,685 14.4 -529 $4.58 Net
Houston 460,706 8.6 -1,159 $5.74 Net
Miami 236,211 11.6 -2,137 $8.78 Gross
Nashville 160,927 11.1 -654 $4.01 Net
Orlando 158,893 12.5 -1,265 $6.67 Net
Tampa 169,051 11.6 -2,750 $6.13 Net
Retail - 4Q-2008Inventory SF (000s) Availability Rate (%) Net Absorption SF (000s) TWR Rent Index ($/SF)
Atlanta 84,027 13.7 -587 $23.15
Austin 18,760 10.3 61 $23.39
Dallas 58,943 15.8 -362 $15.98
Houston 62,144 13.4 -45 $21.14
Miami 23,331 5.7 82 $18.12
Nashville 20,837 6.8 79 $18.83
Oklahoma City 18,875 11.7 65 $9.76
Orlando 30,636 8.9 290 $17.76
Tampa 30,772 8.6 -80 $15.37
Space Market Data has been provided courtesy of Torto Wheaton Research. Analysis within this report is solely compiled and produced by the Real Estate Research Corporation, and in no way reflects the interpretations, opinions, or conclusions of Torto Wheaton Research.
Trusted Advice. Proven Performance.
RERC extends its appreciation to CBRE/Torto Wheaton Research, which contributed all of the space market information on this page.
CBRE/Torto Wheaton Research is a full-service research and investment advisory firm, specializing in com-mercial real estate markets.
With over 20 years of experience, our industry leading research, mar-ket expertise, and strategic partner-ships provide clients with tactical ad-vice and strategic direction to identify market opportunities that enhance performance and manage risk.
CBRE/TWR is internationally rec-ognized for our solid foundation in economics, accurate forecasts, ana-lytical expertise, and providing clients with unparalleled insight into the dy-namics of the real estate market that impact performance.
William WheatonPh.D., Principal
Jon SouthardPrincipal
James CostelloPrincipal
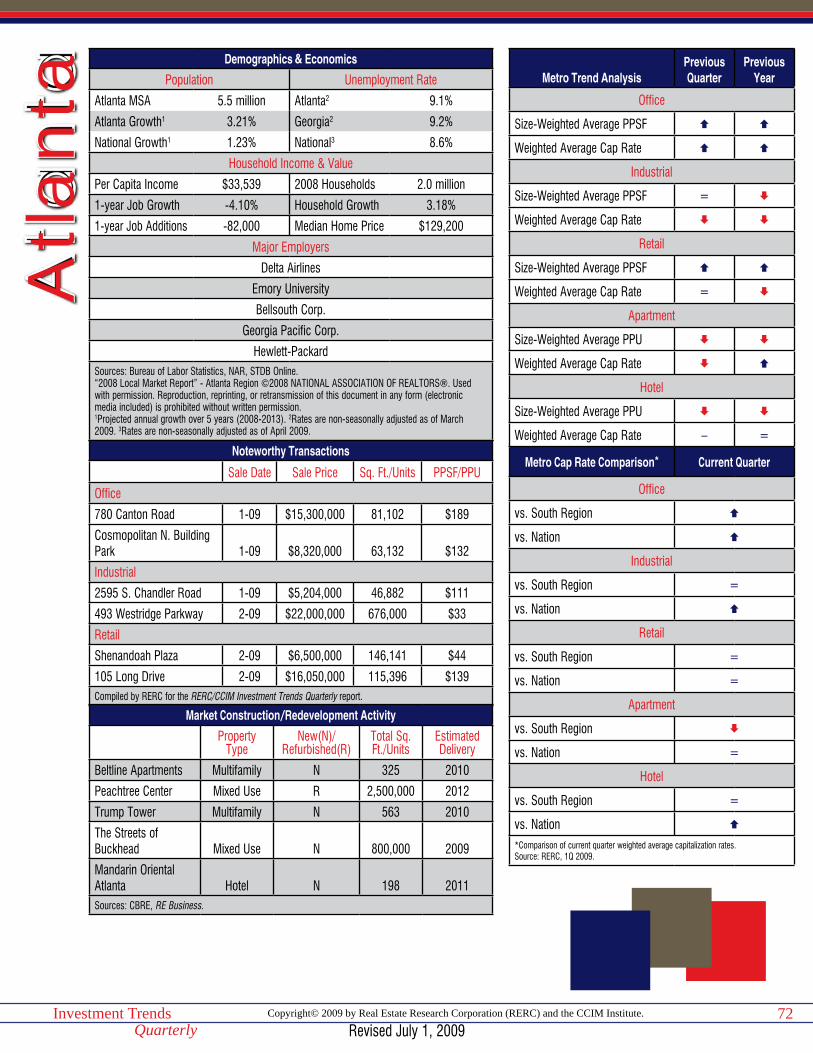
Copyright© 2009 by Real Estate Research Corporation (RERC) and the CCIM Institute.Investment TrendsQuarterly
72
Demographics & Economics
Population Unemployment Rate
Atlanta MSA 5.5 million Atlanta2 9.1%
Atlanta Growth1 3.21% Georgia2 9.2%
National Growth1 1.23% National3 8.6%
Household Income & Value
Per Capita Income $33,539 2008 Households 2.0 million
1-year Job Growth -4.10% Household Growth 3.18%
1-year Job Additions -82,000 Median Home Price $129,200
Major Employers
Delta Airlines
Emory University
Bellsouth Corp.
Georgia Pacific Corp.
Hewlett-PackardSources: Bureau of Labor Statistics, NAR, STDB Online.“2008 Local Market Report” - Atlanta Region ©2008 NATIONAL ASSOCIATION OF REALTORS®. Used with permission. Reproduction, reprinting, or retransmission of this document in any form (electronic media included) is prohibited without written permission.1Projected annual growth over 5 years (2008-2013). 2Rates are non-seasonally adjusted as of March 2009. 3Rates are non-seasonally adjusted as of April 2009.
Noteworthy Transactions
Sale Date Sale Price Sq. Ft./Units PPSF/PPU
Office
780 Canton Road 1-09 $15,300,000 81,102 $189
Cosmopolitan N. Building Park 1-09 $8,320,000 63,132 $132
Industrial
2595 S. Chandler Road 1-09 $5,204,000 46,882 $111
493 Westridge Parkway 2-09 $22,000,000 676,000 $33
Retail
Shenandoah Plaza 2-09 $6,500,000 146,141 $44
105 Long Drive 2-09 $16,050,000 115,396 $139Compiled by RERC for the RERC/CCIM Investment Trends Quarterly report.
Market Construction/Redevelopment Activity
Property Type
New(N)/Refurbished(R)
Total Sq. Ft./Units
Estimated Delivery
Beltline Apartments Multifamily N 325 2010
Peachtree Center Mixed Use R 2,500,000 2012
Trump Tower Multifamily N 563 2010
The Streets of Buckhead Mixed Use N 800,000 2009
Mandarin Oriental Atlanta Hotel N 198 2011Sources: CBRE, RE Business.
Atla
nta Metro Trend Analysis
Previous Quarter
Previous Year
Office
Size-Weighted Average PPSF
Weighted Average Cap Rate
Industrial
Size-Weighted Average PPSF =
Weighted Average Cap Rate
Retail
Size-Weighted Average PPSF
Weighted Average Cap Rate =
Apartment
Size-Weighted Average PPU
Weighted Average Cap Rate
Hotel
Size-Weighted Average PPU
Weighted Average Cap Rate – =
Metro Cap Rate Comparison* Current Quarter
Office
vs. South Region
vs. Nation
Industrial
vs. South Region =
vs. Nation
Retail
vs. South Region =
vs. Nation =
Apartment
vs. South Region
vs. Nation =
Hotel
vs. South Region =
vs. Nation
*Comparison of current quarter weighted average capitalization rates.Source: RERC, 1Q 2009.
Revised July 1, 2009

Copyright© 2009 by Real Estate Research Corporation (RERC) and the CCIM Institute.Investment TrendsQuarterly
73
Atlanta Transaction Breakdown12-Month Trailing (04/01/08 - 03/31/09)
Office Industrial Retail Apartment Hotel< $5 MillionVolume (Mil) $98 $195 $206 $72 $12
Size Weighted Avg. ($ per sf/unit) $105 $51 $145 $37,505 $24,652
Price Weighted Avg. ($ per sf/unit) $130 $67 $207 $41,228 $27,460
Median ($ per sf/unit) $106 $61 $147 $40,063 $27,720
> $5 MillionVolume (Mil) $1,436 $437 $675 $1,461 $40
Size Weighted Avg. ($ per sf/unit) $177 $49 $161 $75,544 $45,351
Price Weighted Avg. ($ per sf/unit) $205 $75 $196 $91,508 $48,455
Median ($ per sf/unit) $167 $82 $169 $73,246 $45,558
All TransactionsVolume (Mil) $1,534 $632 $882 $1,533 $52
Size Weighted Avg. ($ per sf/unit) $170 $50 $157 $72,122 $37,779
Price Weighted Avg. ($ per sf/unit) $200 $72 $199 $89,156 $43,444
Median ($ per sf/unit) $125 $63 $155 $55,556 $38,372
Capitalization Rates (All Transactions)Weighted Average (%) 7.9 7.3 7.1 6.1 –
Median (%) 7.5 7.0 7.1 6.4 –Source: RERC.
Atlanta Transaction Trends12-Month Trailing (04/01/08 - 03/31/09)
Office Industrial Retail Apartment HotelMedian Price% Change Quarter Ago 0% 4% -3% -4% -14%
% Change Year Ago 3% 11% -2% -22% –
Volume % Change Quarter Ago -13% -3% -9% -22% -67%
% Change Year Ago -52% -58% -51% -60% –Source: RERC.
Revised July 1, 2009

Copyright© 2009 by Real Estate Research Corporation (RERC) and the CCIM Institute.Investment TrendsQuarterly
74
Demographics & Economics
Population Unemployment Rate
Austin MSA 1.6 million Austin2 6.2%
Austin Growth1 3.30% Texas2 6.7%
National Growth1 1.23% National3 8.6%
Household Income & Value
Per Capita Income $32,756 2008 Households 607,151
1-year Job Growth 1.20% Household Growth 3.23%
1-year Job Additions 9,600 Median Home Price $184,800
Major Employers
Freescale Semiconductor Incorporated
Dell
Advanced Micro Devices Incorporated
U.S. Internal Revenue Service
FlextronicsSources: Bureau of Labor Statistics, NAR, STDB Online.“2008 Local Market Report” - Austin Region ©2008 NATIONAL ASSOCIATION OF REALTORS®. Used with permission. Reproduction, reprinting, or retransmission of this document in any form (electronic media included) is prohibited without written permission.1Projected annual growth over 5 years (2008-2013). 2Rates are non-seasonally adjusted as of March 2009. 3Rates are non-seasonally adjusted as of April 2009.
Noteworthy Transactions
Sale Date Sale Price Sq. Ft./Units PPSF/PPU
Office
12885 Research Blvd. 1-09 $5,600,000 50,836 $110
901 MoPac Expressway 2-09 $41,800,000 238,594 $175
Retail
101 W. Koenig Lane 2-09 $2,000,000 14,763 $135
9711 Manchaca Road 3-09 $1,170,000 7,534 $155Compiled by RERC for the RERC/CCIM Investment Trends Quarterly report.
Market Construction/Redevelopment Activity
Property Type
New(N)/Refurbished(R)
Total Sq. Ft./Units
Estimated Delivery
Andaz Hotel N 210 2010
Courtyard by Marriott Hotel N 145 2009
The Offices at East Avenue Office N 215,000 N/A
Northpointe Trade Center Industrial N 500,000 2009Sources: CBRE, RE Business.
Aus
tinMetro Trend Analysis
Previous Quarter
Previous Year
Office
Size-Weighted Average PPSF
Weighted Average Cap Rate =
Industrial
Size-Weighted Average PPSF
Retail
Size-Weighted Average PPSF
Apartment
Size-Weighted Average PPU
Hotel
Size-Weighted Average PPU
Metro Cap Rate Comparison* Current Quarter
Office
vs. South Region
vs. Nation
Apartment
vs. South Region
vs. Nation
*Comparison of current quarter weighted average capitalization rates.Source: RERC, 1Q 2009.
Revised July 1, 2009

Copyright© 2009 by Real Estate Research Corporation (RERC) and the CCIM Institute.Investment TrendsQuarterly
75
Austin Transaction Breakdown12-Month Trailing (04/01/08 - 03/31/09)
Office Industrial Retail Apartment Hotel< $5 MillionVolume (Mil) $12 $8 $49 $16 –
Size Weighted Avg. ($ per sf/unit) $92 $88 $169 $40,088 –
Price Weighted Avg. ($ per sf/unit) $111 $96 $205 $46,673 –
Median ($ per sf/unit) $126 $78 $176 $54,266 –
> $5 MillionVolume (Mil) $307 – – $442 –
Size Weighted Avg. ($ per sf/unit) $232 – – $86,482 –
Price Weighted Avg. ($ per sf/unit) $251 – – $88,466 –
Median ($ per sf/unit) $213 – – $90,452 –
All TransactionsVolume (Mil) $319 $53 $65 $458 $51
Size Weighted Avg. ($ per sf/unit) $219 $215 $189 $83,171 $133,333
Price Weighted Avg. ($ per sf/unit) $245 $264 $229 $87,028 $146,354
Median ($ per sf/unit) $155 $79 $189 $73,147 $134,409
Capitalization Rates (All Transactions)Weighted Average (%) 6.5 – – – –
Median (%) 6.3 – – – –Source: RERC.
Austin Transaction Trends12-Month Trailing (04/01/08 - 03/31/09)
Office Industrial Retail Apartment HotelMedian Price% Change Quarter Ago 0% 2% 8% 2% 9%
% Change Year Ago – -3% – 12% 0%
Volume % Change Quarter Ago – 76% -18% -19% -5%
% Change Year Ago -79% -54% – -33% -79%Source: RERC.
Revised July 1, 2009
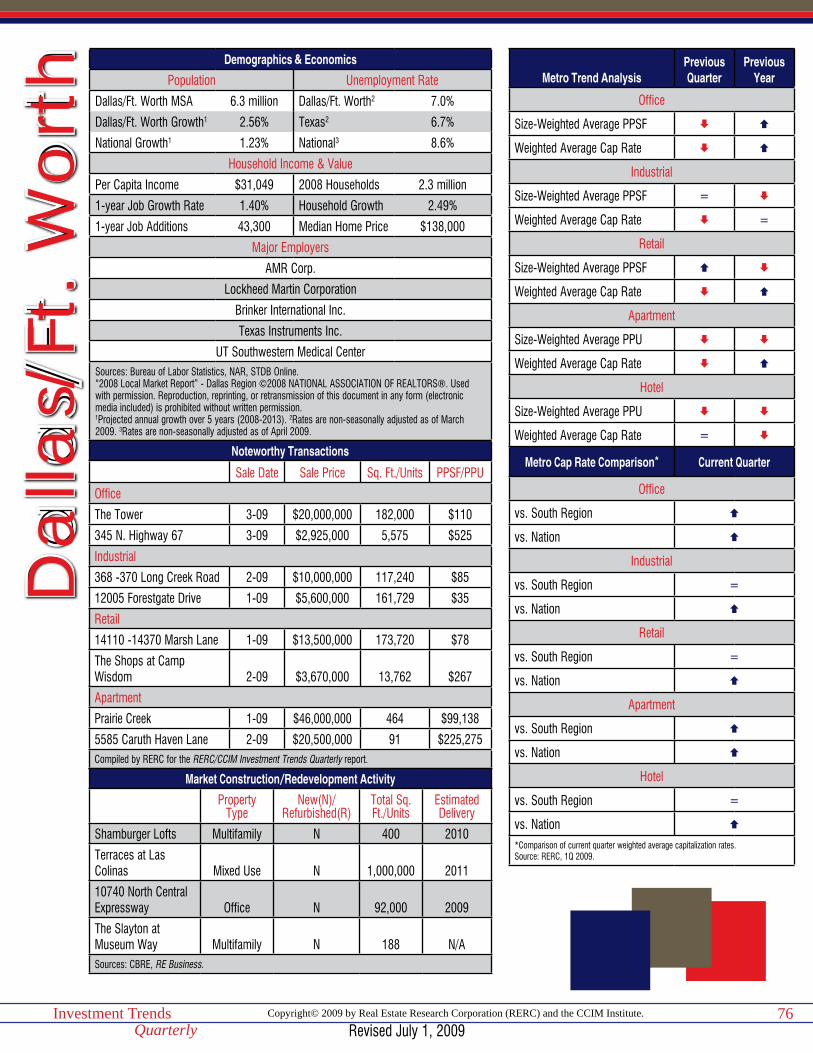
Copyright© 2009 by Real Estate Research Corporation (RERC) and the CCIM Institute.Investment TrendsQuarterly
76
Demographics & Economics
Population Unemployment Rate
Dallas/Ft. Worth MSA 6.3 million Dallas/Ft. Worth2 7.0%
Dallas/Ft. Worth Growth1 2.56% Texas2 6.7%
National Growth1 1.23% National3 8.6%
Household Income & Value
Per Capita Income $31,049 2008 Households 2.3 million
1-year Job Growth Rate 1.40% Household Growth 2.49%
1-year Job Additions 43,300 Median Home Price $138,000
Major Employers
AMR Corp.
Lockheed Martin Corporation
Brinker International Inc.
Texas Instruments Inc.
UT Southwestern Medical CenterSources: Bureau of Labor Statistics, NAR, STDB Online.“2008 Local Market Report” - Dallas Region ©2008 NATIONAL ASSOCIATION OF REALTORS®. Used with permission. Reproduction, reprinting, or retransmission of this document in any form (electronic media included) is prohibited without written permission.1Projected annual growth over 5 years (2008-2013). 2Rates are non-seasonally adjusted as of March 2009. 3Rates are non-seasonally adjusted as of April 2009.
Noteworthy Transactions
Sale Date Sale Price Sq. Ft./Units PPSF/PPU
Office
The Tower 3-09 $20,000,000 182,000 $110
345 N. Highway 67 3-09 $2,925,000 5,575 $525
Industrial
368 -370 Long Creek Road 2-09 $10,000,000 117,240 $85
12005 Forestgate Drive 1-09 $5,600,000 161,729 $35
Retail
14110 -14370 Marsh Lane 1-09 $13,500,000 173,720 $78
The Shops at Camp Wisdom 2-09 $3,670,000 13,762 $267
Apartment
Prairie Creek 1-09 $46,000,000 464 $99,138
5585 Caruth Haven Lane 2-09 $20,500,000 91 $225,275Compiled by RERC for the RERC/CCIM Investment Trends Quarterly report.
Market Construction/Redevelopment Activity
Property Type
New(N)/Refurbished(R)
Total Sq. Ft./Units
Estimated Delivery
Shamburger Lofts Multifamily N 400 2010
Terraces at Las Colinas Mixed Use N 1,000,000 2011
10740 North Central Expressway Office N 92,000 2009
The Slayton at Museum Way Multifamily N 188 N/ASources: CBRE, RE Business.
Da
llas/
Ft. W
ort
h Metro Trend AnalysisPrevious Quarter
Previous Year
Office
Size-Weighted Average PPSF
Weighted Average Cap Rate
Industrial
Size-Weighted Average PPSF =
Weighted Average Cap Rate =
Retail
Size-Weighted Average PPSF
Weighted Average Cap Rate
Apartment
Size-Weighted Average PPU
Weighted Average Cap Rate
Hotel
Size-Weighted Average PPU
Weighted Average Cap Rate =
Metro Cap Rate Comparison* Current Quarter
Office
vs. South Region
vs. Nation
Industrial
vs. South Region =
vs. Nation
Retail
vs. South Region =
vs. Nation
Apartment
vs. South Region
vs. Nation
Hotel
vs. South Region =
vs. Nation
*Comparison of current quarter weighted average capitalization rates.Source: RERC, 1Q 2009.
Revised July 1, 2009

Copyright© 2009 by Real Estate Research Corporation (RERC) and the CCIM Institute.Investment TrendsQuarterly
77
Dallas Transaction Breakdown12-Month Trailing (04/01/08 - 03/31/09)
Office Industrial Retail Apartment Hotel< $5 MillionVolume (Mil) $59 $81 $207 $104 $15
Size Weighted Avg. ($ per sf/unit) $90 $39 $97 $28,913 $34,059
Price Weighted Avg. ($ per sf/unit) $130 $51 $149 $38,939 $38,997
Median ($ per sf/unit) $95 $46 $92 $30,769 $36,864
> $5 MillionVolume (Mil) $1,639 $230 $256 $749 $244
Size Weighted Avg. ($ per sf/unit) $187 $52 $113 $54,518 $127,552
Price Weighted Avg. ($ per sf/unit) $205 $76 $171 $71,081 $136,677
Median ($ per sf/unit) $192 $47 $105 $42,062 $138,407
All TransactionsVolume (Mil) $1,698 $311 $463 $853 $259
Size Weighted Avg. ($ per sf/unit) $180 $48 $105 $49,188 $110,506
Price Weighted Avg. ($ per sf/unit) $203 $69 $161 $67,148 $131,188
Median ($ per sf/unit) $104 $46 $94 $38,258 $122,346
Capitalization Rates (All Transactions)Weighted Average ($ per sf/unit) 7.8 7.3 7.3 7.5 –
Median ($ per sf/unit) 6.5 7.5 7.3 7.7 –Source: RERC.
Dallas Transaction Trends12-Month Trailing (04/01/08 - 03/31/09)
Office Industrial Retail Apartment HotelMedian Price% Change Quarter Ago -13% -2% 5% -3% -6%
% Change Year Ago -13% -11% -18% -11% 8%
Volume % Change Quarter Ago -26% -10% -7% -34% -17%
% Change Year Ago -53% -73% -83% -65% -71%Source: RERC.
Revised July 1, 2009
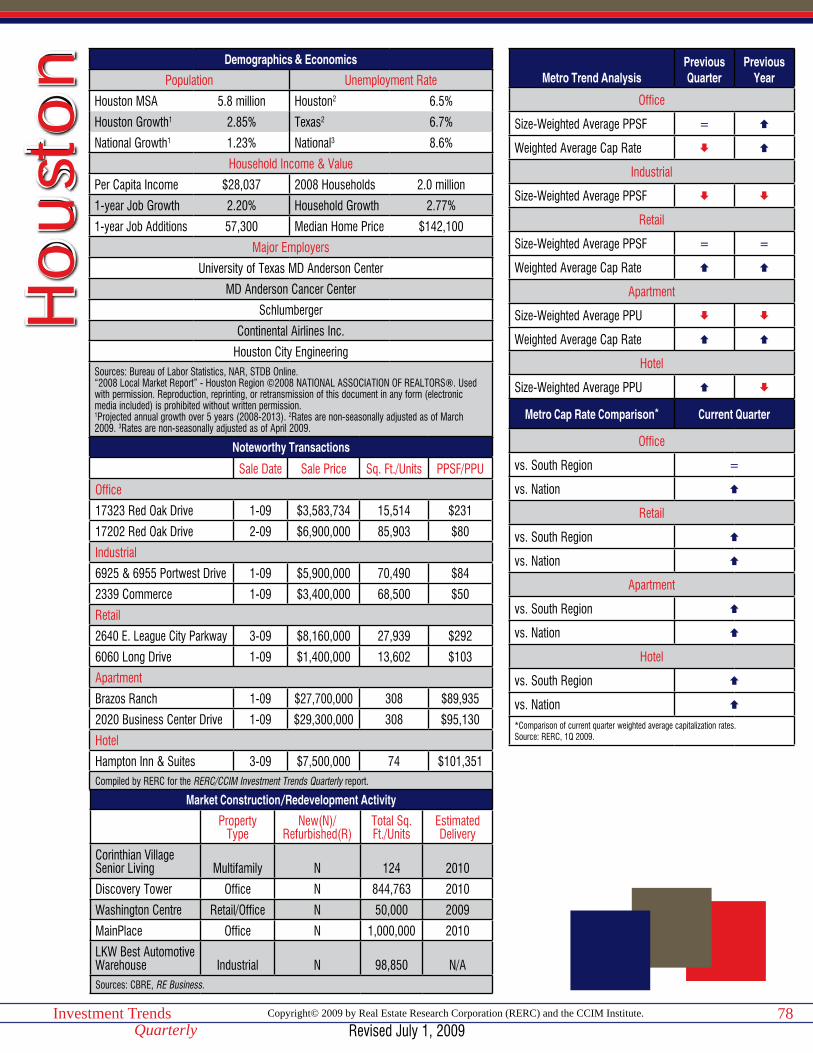
Copyright© 2009 by Real Estate Research Corporation (RERC) and the CCIM Institute.Investment TrendsQuarterly
78
Demographics & Economics
Population Unemployment Rate
Houston MSA 5.8 million Houston2 6.5%
Houston Growth1 2.85% Texas2 6.7%
National Growth1 1.23% National3 8.6%
Household Income & Value
Per Capita Income $28,037 2008 Households 2.0 million
1-year Job Growth 2.20% Household Growth 2.77%
1-year Job Additions 57,300 Median Home Price $142,100
Major Employers
University of Texas MD Anderson Center
MD Anderson Cancer Center
Schlumberger
Continental Airlines Inc.
Houston City Engineering Sources: Bureau of Labor Statistics, NAR, STDB Online.“2008 Local Market Report” - Houston Region ©2008 NATIONAL ASSOCIATION OF REALTORS®. Used with permission. Reproduction, reprinting, or retransmission of this document in any form (electronic media included) is prohibited without written permission.1Projected annual growth over 5 years (2008-2013). 2Rates are non-seasonally adjusted as of March 2009. 3Rates are non-seasonally adjusted as of April 2009.
Noteworthy Transactions
Sale Date Sale Price Sq. Ft./Units PPSF/PPU
Office
17323 Red Oak Drive 1-09 $3,583,734 15,514 $231
17202 Red Oak Drive 2-09 $6,900,000 85,903 $80
Industrial
6925 & 6955 Portwest Drive 1-09 $5,900,000 70,490 $84
2339 Commerce 1-09 $3,400,000 68,500 $50
Retail
2640 E. League City Parkway 3-09 $8,160,000 27,939 $292
6060 Long Drive 1-09 $1,400,000 13,602 $103
Apartment
Brazos Ranch 1-09 $27,700,000 308 $89,935
2020 Business Center Drive 1-09 $29,300,000 308 $95,130
Hotel
Hampton Inn & Suites 3-09 $7,500,000 74 $101,351Compiled by RERC for the RERC/CCIM Investment Trends Quarterly report.
Market Construction/Redevelopment Activity
Property Type
New(N)/Refurbished(R)
Total Sq. Ft./Units
Estimated Delivery
Corinthian Village Senior Living Multifamily N 124 2010
Discovery Tower Office N 844,763 2010
Washington Centre Retail/Office N 50,000 2009
MainPlace Office N 1,000,000 2010
LKW Best Automotive Warehouse Industrial N 98,850 N/ASources: CBRE, RE Business.
Ho
usto
n Metro Trend AnalysisPrevious Quarter
Previous Year
Office
Size-Weighted Average PPSF =
Weighted Average Cap Rate
Industrial
Size-Weighted Average PPSF
Retail
Size-Weighted Average PPSF = =
Weighted Average Cap Rate
Apartment
Size-Weighted Average PPU
Weighted Average Cap Rate
Hotel
Size-Weighted Average PPU
Metro Cap Rate Comparison* Current Quarter
Office
vs. South Region =
vs. Nation
Retail
vs. South Region
vs. Nation
Apartment
vs. South Region
vs. Nation
Hotel
vs. South Region
vs. Nation
*Comparison of current quarter weighted average capitalization rates.Source: RERC, 1Q 2009.
Revised July 1, 2009

Copyright© 2009 by Real Estate Research Corporation (RERC) and the CCIM Institute.Investment TrendsQuarterly
79
Houston Transaction Breakdown12-Month Trailing (04/01/08 - 03/31/09)
Office Industrial Retail Apartment Hotel< $5 MillionVolume (Mil) $25 $58 $88 $50 –
Size Weighted Avg. ($ per sf/unit) $130 $45 $92 $17,526 –
Price Weighted Avg. ($ per sf/unit) $177 $58 $142 $23,033 –
Median ($ per sf/unit) $103 $50 $87 $25,110 –
> $5 MillionVolume (Mil) $817 $27 $226 $399 $121
Size Weighted Avg. ($ per sf/unit) $174 $35 $153 $39,308 $160,674
Price Weighted Avg. ($ per sf/unit) $183 $45 $195 $61,769 $181,766
Median ($ per sf/unit) $153 $44 $223 $33,834 $139,203
All TransactionsVolume (Mil) $842 $85 $314 $448 $124
Size Weighted Avg. ($ per sf/unit) $172 $41 $129 $34,559 $136,817
Price Weighted Avg. ($ per sf/unit) $183 $54 $180 $57,487 $178,286
Median ($ per sf/unit) $126 $49 $97 $28,125 $101,556
Capitalization Rates (All Transactions)Weighted Average (%) 7.1 – 7.7 7.7 –
Median (%) 7.3 – 7.3 7.7 –Source: RERC.
Houston Transaction Trends12-Month Trailing (04/01/08 - 03/31/09)
Office Industrial Retail Apartment HotelMedian Price% Change Quarter Ago -2% -4% -10% -17% –
% Change Year Ago 12% -3% -14% -29% 9%
Volume % Change Quarter Ago -25% -66% -19% -54% –
% Change Year Ago -73% -85% -73% -75% -87%Source: RERC.
Revised July 1, 2009
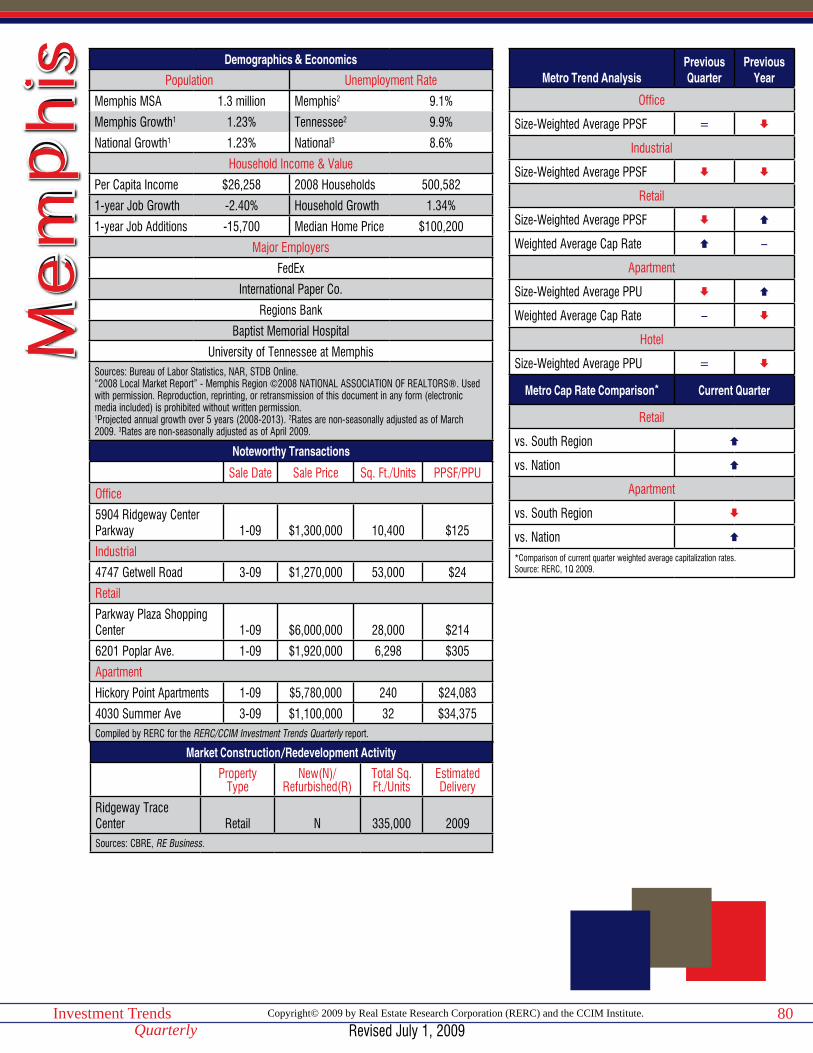
Copyright© 2009 by Real Estate Research Corporation (RERC) and the CCIM Institute.Investment TrendsQuarterly
80
Demographics & Economics
Population Unemployment Rate
Memphis MSA 1.3 million Memphis2 9.1%
Memphis Growth1 1.23% Tennessee2 9.9%
National Growth1 1.23% National3 8.6%
Household Income & Value
Per Capita Income $26,258 2008 Households 500,582
1-year Job Growth -2.40% Household Growth 1.34%
1-year Job Additions -15,700 Median Home Price $100,200
Major Employers
FedEx
International Paper Co.
Regions Bank
Baptist Memorial Hospital
University of Tennessee at MemphisSources: Bureau of Labor Statistics, NAR, STDB Online.“2008 Local Market Report” - Memphis Region ©2008 NATIONAL ASSOCIATION OF REALTORS®. Used with permission. Reproduction, reprinting, or retransmission of this document in any form (electronic media included) is prohibited without written permission.1Projected annual growth over 5 years (2008-2013). 2Rates are non-seasonally adjusted as of March 2009. 3Rates are non-seasonally adjusted as of April 2009.
Noteworthy Transactions
Sale Date Sale Price Sq. Ft./Units PPSF/PPU
Office
5904 Ridgeway Center Parkway 1-09 $1,300,000 10,400 $125
Industrial
4747 Getwell Road 3-09 $1,270,000 53,000 $24
Retail
Parkway Plaza Shopping Center 1-09 $6,000,000 28,000 $214
6201 Poplar Ave. 1-09 $1,920,000 6,298 $305
Apartment
Hickory Point Apartments 1-09 $5,780,000 240 $24,083
4030 Summer Ave 3-09 $1,100,000 32 $34,375Compiled by RERC for the RERC/CCIM Investment Trends Quarterly report.
Market Construction/Redevelopment Activity
Property Type
New(N)/Refurbished(R)
Total Sq. Ft./Units
Estimated Delivery
Ridgeway Trace Center Retail N 335,000 2009Sources: CBRE, RE Business.
Me
mp
his
Metro Trend AnalysisPrevious Quarter
Previous Year
Office
Size-Weighted Average PPSF =
Industrial
Size-Weighted Average PPSF
Retail
Size-Weighted Average PPSF
Weighted Average Cap Rate –
Apartment
Size-Weighted Average PPU
Weighted Average Cap Rate –
Hotel
Size-Weighted Average PPU =
Metro Cap Rate Comparison* Current Quarter
Retail
vs. South Region
vs. Nation
Apartment
vs. South Region
vs. Nation
*Comparison of current quarter weighted average capitalization rates.Source: RERC, 1Q 2009.
Revised July 1, 2009

Copyright© 2009 by Real Estate Research Corporation (RERC) and the CCIM Institute.Investment TrendsQuarterly
81
Memphis Transaction Breakdown12-Month Trailing (04/01/08 - 03/31/09)
Office Industrial Retail Apartment Hotel< $5 MillionVolume (Mil) $23 $35 $38 $23 –
Size Weighted Avg. ($ per sf/unit) $76 $26 $98 $24,475 –
Price Weighted Avg. ($ per sf/unit) $132 $32 $154 $35,753 –
Median ($ per sf/unit) $97 $34 $78 $21,591 –
> $5 MillionVolume (Mil) – $36 $126 $101 –
Size Weighted Avg. ($ per sf/unit) – $25 $141 $47,190 –
Price Weighted Avg. ($ per sf/unit) – $25 $184 $67,803 –
Median ($ per sf/unit) – $25 $174 $28,138 –
All TransactionsVolume (Mil) $64 $71 $164 $124 $22
Size Weighted Avg. ($ per sf/unit) $95 $25 $128 $40,242 $58,826
Price Weighted Avg. ($ per sf/unit) $119 $28 $177 $61,841 $61,773
Median ($ per sf/unit) $98 $32 $105 $24,089 $54,287
Capitalization Rates (All Transactions)Weighted Average (%) – – – 6.5 –
Median (%) – – – 8.5 –Source: RERC.
Memphis Transaction Trends12-Month Trailing (04/01/08 - 03/31/09)
Office Industrial Retail Apartment HotelMedian Price% Change Quarter Ago -11% 0% – -15% 0%
% Change Year Ago 14% 5% – -13% -24%
Volume % Change Quarter Ago -3% -47% – -28% 0%
% Change Year Ago -57% -78% – -61% -91%Source: RERC.
Revised July 1, 2009
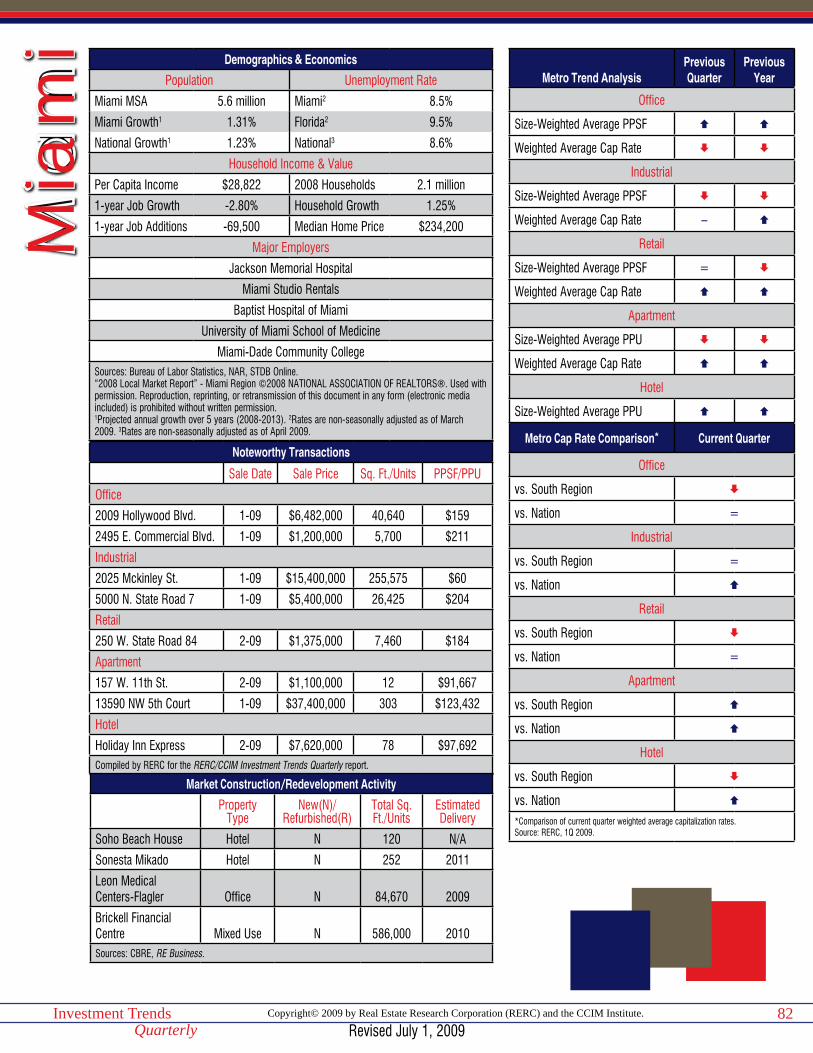
Copyright© 2009 by Real Estate Research Corporation (RERC) and the CCIM Institute.Investment TrendsQuarterly
82
Demographics & Economics
Population Unemployment Rate
Miami MSA 5.6 million Miami2 8.5%
Miami Growth1 1.31% Florida2 9.5%
National Growth1 1.23% National3 8.6%
Household Income & Value
Per Capita Income $28,822 2008 Households 2.1 million
1-year Job Growth -2.80% Household Growth 1.25%
1-year Job Additions -69,500 Median Home Price $234,200
Major Employers
Jackson Memorial Hospital
Miami Studio Rentals
Baptist Hospital of Miami
University of Miami School of Medicine
Miami-Dade Community CollegeSources: Bureau of Labor Statistics, NAR, STDB Online.“2008 Local Market Report” - Miami Region ©2008 NATIONAL ASSOCIATION OF REALTORS®. Used with permission. Reproduction, reprinting, or retransmission of this document in any form (electronic media included) is prohibited without written permission.1Projected annual growth over 5 years (2008-2013). 2Rates are non-seasonally adjusted as of March 2009. 3Rates are non-seasonally adjusted as of April 2009.
Noteworthy Transactions
Sale Date Sale Price Sq. Ft./Units PPSF/PPU
Office
2009 Hollywood Blvd. 1-09 $6,482,000 40,640 $159
2495 E. Commercial Blvd. 1-09 $1,200,000 5,700 $211
Industrial
2025 Mckinley St. 1-09 $15,400,000 255,575 $60
5000 N. State Road 7 1-09 $5,400,000 26,425 $204
Retail
250 W. State Road 84 2-09 $1,375,000 7,460 $184
Apartment
157 W. 11th St. 2-09 $1,100,000 12 $91,667
13590 NW 5th Court 1-09 $37,400,000 303 $123,432
Hotel
Holiday Inn Express 2-09 $7,620,000 78 $97,692Compiled by RERC for the RERC/CCIM Investment Trends Quarterly report.
Market Construction/Redevelopment Activity
Property Type
New(N)/Refurbished(R)
Total Sq. Ft./Units
Estimated Delivery
Soho Beach House Hotel N 120 N/A
Sonesta Mikado Hotel N 252 2011
Leon MedicalCenters-Flagler Office N 84,670 2009
Brickell Financial Centre Mixed Use N 586,000 2010Sources: CBRE, RE Business.
Mia
mi
Metro Trend AnalysisPrevious Quarter
Previous Year
Office
Size-Weighted Average PPSF
Weighted Average Cap Rate
Industrial
Size-Weighted Average PPSF
Weighted Average Cap Rate –
Retail
Size-Weighted Average PPSF =
Weighted Average Cap Rate
Apartment
Size-Weighted Average PPU
Weighted Average Cap Rate
Hotel
Size-Weighted Average PPU
Metro Cap Rate Comparison* Current Quarter
Office
vs. South Region
vs. Nation =
Industrial
vs. South Region =
vs. Nation
Retail
vs. South Region
vs. Nation =
Apartment
vs. South Region
vs. Nation
Hotel
vs. South Region
vs. Nation
*Comparison of current quarter weighted average capitalization rates.Source: RERC, 1Q 2009.
Revised July 1, 2009

Copyright© 2009 by Real Estate Research Corporation (RERC) and the CCIM Institute.Investment TrendsQuarterly
83
Miami Transaction Breakdown12-Month Trailing (04/01/08 - 03/31/09)
Office Industrial Retail Apartment Hotel< $5 MillionVolume (Mil) $167 $274 $211 $130 –
Size Weighted Avg. ($ per sf/unit) $132 $80 $159 $73,466 –
Price Weighted Avg. ($ per sf/unit) $175 $104 $210 $91,564 –
Median ($ per sf/unit) $145 $90 $169 $72,917 –
> $5 MillionVolume (Mil) $1,340 $177 $536 $357 $974
Size Weighted Avg. ($ per sf/unit) $295 $85 $156 $90,573 $401,726
Price Weighted Avg. ($ per sf/unit) $346 $99 $243 $127,912 $707,864
Median ($ per sf/unit) $277 $87 $177 $84,833 $133,761
All TransactionsVolume (Mil) $1,507 $452 $747 $487 $984
Size Weighted Avg. ($ per sf/unit) $259 $82 $157 $85,286 $385,860
Price Weighted Avg. ($ per sf/unit) $327 $102 $234 $118,234 $701,705
Median ($ per sf/unit) $162 $90 $175 $73,000 $122,540
Capitalization Rates (All Transactions)Weighted Average (%) 5.9 – 7.0 7.0 –
Median (%) 5.9 – 7.0 7.0 –Source: RERC.
Miami Transaction Trends12-Month Trailing (04/01/08 - 03/31/09)
Office Industrial Retail Apartment HotelMedian Price% Change Quarter Ago -9% -7% 3% -14% -17%
% Change Year Ago -9% -2% 0% -17% 7%
Volume % Change Quarter Ago -16% -7% -24% 22% -5%
% Change Year Ago -39% -68% -60% -38% -35%Source: RERC.
Revised July 1, 2009
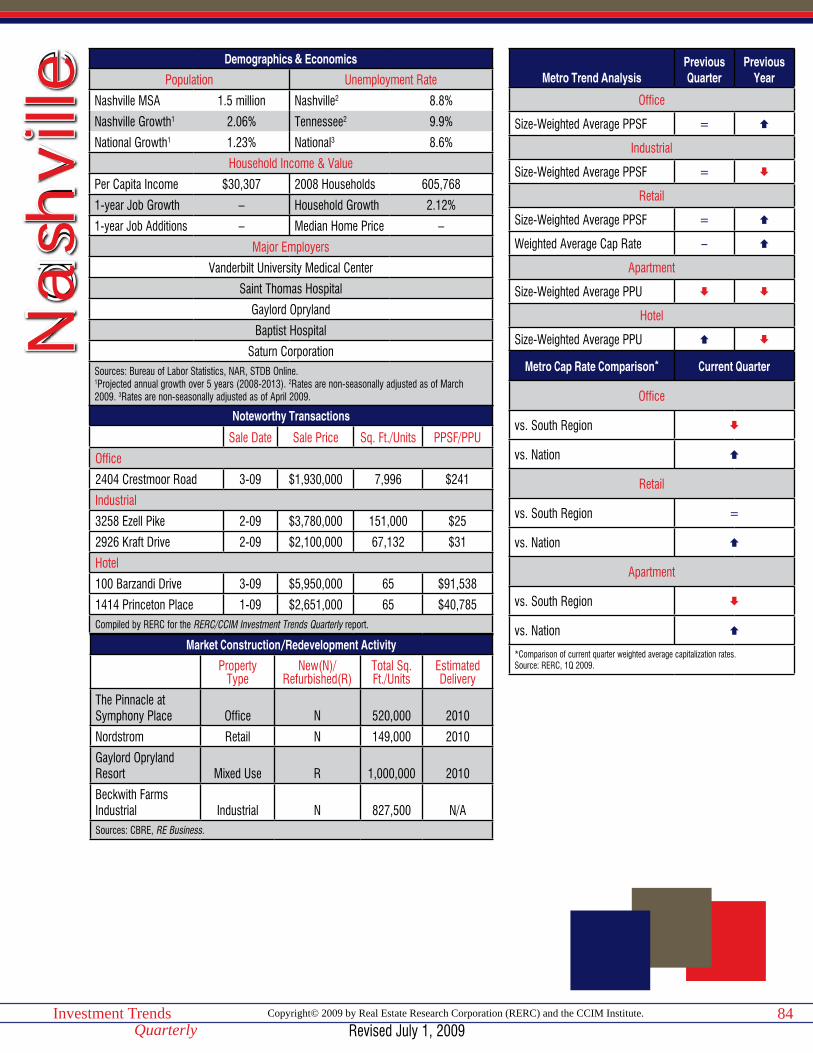
Copyright© 2009 by Real Estate Research Corporation (RERC) and the CCIM Institute.Investment TrendsQuarterly
84
Demographics & Economics
Population Unemployment Rate
Nashville MSA 1.5 million Nashville2 8.8%
Nashville Growth1 2.06% Tennessee2 9.9%
National Growth1 1.23% National3 8.6%
Household Income & Value
Per Capita Income $30,307 2008 Households 605,768
1-year Job Growth – Household Growth 2.12%
1-year Job Additions – Median Home Price –
Major Employers
Vanderbilt University Medical Center
Saint Thomas Hospital
Gaylord Opryland
Baptist Hospital
Saturn CorporationSources: Bureau of Labor Statistics, NAR, STDB Online.1Projected annual growth over 5 years (2008-2013). 2Rates are non-seasonally adjusted as of March 2009. 3Rates are non-seasonally adjusted as of April 2009.
Noteworthy Transactions
Sale Date Sale Price Sq. Ft./Units PPSF/PPU
Office
2404 Crestmoor Road 3-09 $1,930,000 7,996 $241
Industrial
3258 Ezell Pike 2-09 $3,780,000 151,000 $25
2926 Kraft Drive 2-09 $2,100,000 67,132 $31
Hotel
100 Barzandi Drive 3-09 $5,950,000 65 $91,538
1414 Princeton Place 1-09 $2,651,000 65 $40,785Compiled by RERC for the RERC/CCIM Investment Trends Quarterly report.
Market Construction/Redevelopment Activity
Property Type
New(N)/Refurbished(R)
Total Sq. Ft./Units
Estimated Delivery
The Pinnacle at Symphony Place Office N 520,000 2010
Nordstrom Retail N 149,000 2010
Gaylord Opryland Resort Mixed Use R 1,000,000 2010
Beckwith Farms Industrial Industrial N 827,500 N/ASources: CBRE, RE Business.
Na
shvi
lle Metro Trend AnalysisPrevious Quarter
Previous Year
Office
Size-Weighted Average PPSF =
Industrial
Size-Weighted Average PPSF =
Retail
Size-Weighted Average PPSF =
Weighted Average Cap Rate –
Apartment
Size-Weighted Average PPU
Hotel
Size-Weighted Average PPU
Metro Cap Rate Comparison* Current Quarter
Office
vs. South Region
vs. Nation
Retail
vs. South Region =
vs. Nation
Apartment
vs. South Region
vs. Nation
*Comparison of current quarter weighted average capitalization rates.Source: RERC, 1Q 2009.
Revised July 1, 2009

Copyright© 2009 by Real Estate Research Corporation (RERC) and the CCIM Institute.Investment TrendsQuarterly
85
Nashville Transaction Breakdown12-Month Trailing (04/01/08 - 03/31/09)
Office Industrial Retail Apartment Hotel< $5 MillionVolume (Mil) $63 $82 $110 $20 $12
Size Weighted Avg. ($ per sf/unit) $106 $41 $130 $44,255 $30,893
Price Weighted Avg. ($ per sf/unit) $138 $55 $183 $50,026 $33,646
Median ($ per sf/unit) $104 $49 $116 $40,000 $33,176
> $5 MillionVolume (Mil) $211 $27 $155 $272 –
Size Weighted Avg. ($ per sf/unit) $168 $31 $176 $63,153 –
Price Weighted Avg. ($ per sf/unit) $175 $33 $238 $81,432 –
Median ($ per sf/unit) $168 $35 $211 $44,030 –
All TransactionsVolume (Mil) $274 $110 $266 $292 $49
Size Weighted Avg. ($ per sf/unit) $148 $38 $153 $61,371 $48,418
Price Weighted Avg. ($ per sf/unit) $167 $50 $215 $79,296 $55,281
Median ($ per sf/unit) $117 $43 $119 $43,403 $47,414
Capitalization Rates (All Transactions)Weighted Average (%) 6.8 – 7.2 6.4 –
Median (%) 6.9 – 7.3 6.3 –Source: RERC.
Nashville Transaction Trends12-Month Trailing (04/01/08 - 03/31/09)
Office Industrial Retail Apartment HotelMedian Price% Change Quarter Ago -7% 0% 1% -2% 0%
% Change Year Ago 4% -21% - -21% -52%
Volume % Change Quarter Ago 8% 8% 0% -34% 21%
% Change Year Ago -16% -79% – -64% -89%Source: RERC.
Revised July 1, 2009
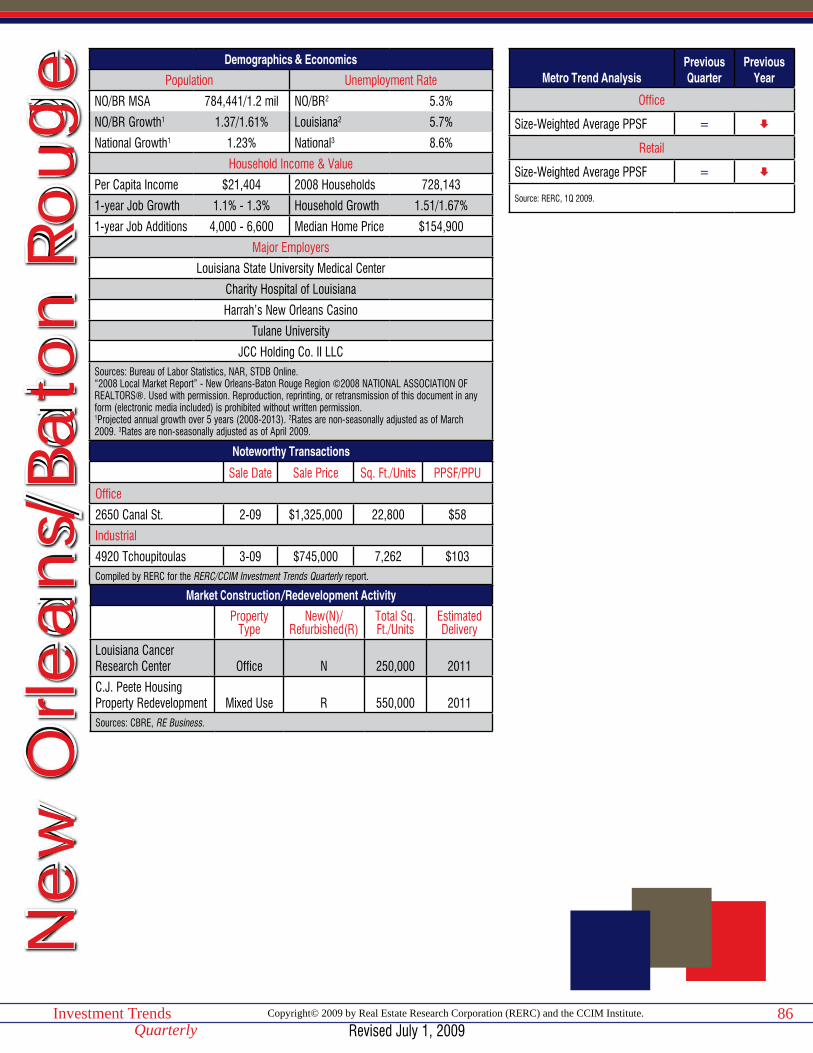
Copyright© 2009 by Real Estate Research Corporation (RERC) and the CCIM Institute.Investment TrendsQuarterly
86
Demographics & Economics
Population Unemployment Rate
NO/BR MSA 784,441/1.2 mil NO/BR2 5.3%
NO/BR Growth1 1.37/1.61% Louisiana2 5.7%
National Growth1 1.23% National3 8.6%
Household Income & Value
Per Capita Income $21,404 2008 Households 728,143
1-year Job Growth 1.1% - 1.3% Household Growth 1.51/1.67%
1-year Job Additions 4,000 - 6,600 Median Home Price $154,900
Major Employers
Louisiana State University Medical Center
Charity Hospital of Louisiana
Harrah’s New Orleans Casino
Tulane University
JCC Holding Co. II LLCSources: Bureau of Labor Statistics, NAR, STDB Online.“2008 Local Market Report” - New Orleans-Baton Rouge Region ©2008 NATIONAL ASSOCIATION OF REALTORS®. Used with permission. Reproduction, reprinting, or retransmission of this document in any form (electronic media included) is prohibited without written permission.1Projected annual growth over 5 years (2008-2013). 2Rates are non-seasonally adjusted as of March 2009. 3Rates are non-seasonally adjusted as of April 2009.
Noteworthy Transactions
Sale Date Sale Price Sq. Ft./Units PPSF/PPU
Office
2650 Canal St. 2-09 $1,325,000 22,800 $58
Industrial
4920 Tchoupitoulas 3-09 $745,000 7,262 $103Compiled by RERC for the RERC/CCIM Investment Trends Quarterly report.
Market Construction/Redevelopment Activity
Property Type
New(N)/Refurbished(R)
Total Sq. Ft./Units
Estimated Delivery
Louisiana Cancer Research Center Office N 250,000 2011
C.J. Peete Housing Property Redevelopment Mixed Use R 550,000 2011Sources: CBRE, RE Business.
New
Orle
ans
/Ba
ton
Roug
e Metro Trend AnalysisPrevious Quarter
Previous Year
Office
Size-Weighted Average PPSF =
Retail
Size-Weighted Average PPSF =
Source: RERC, 1Q 2009.
Revised July 1, 2009
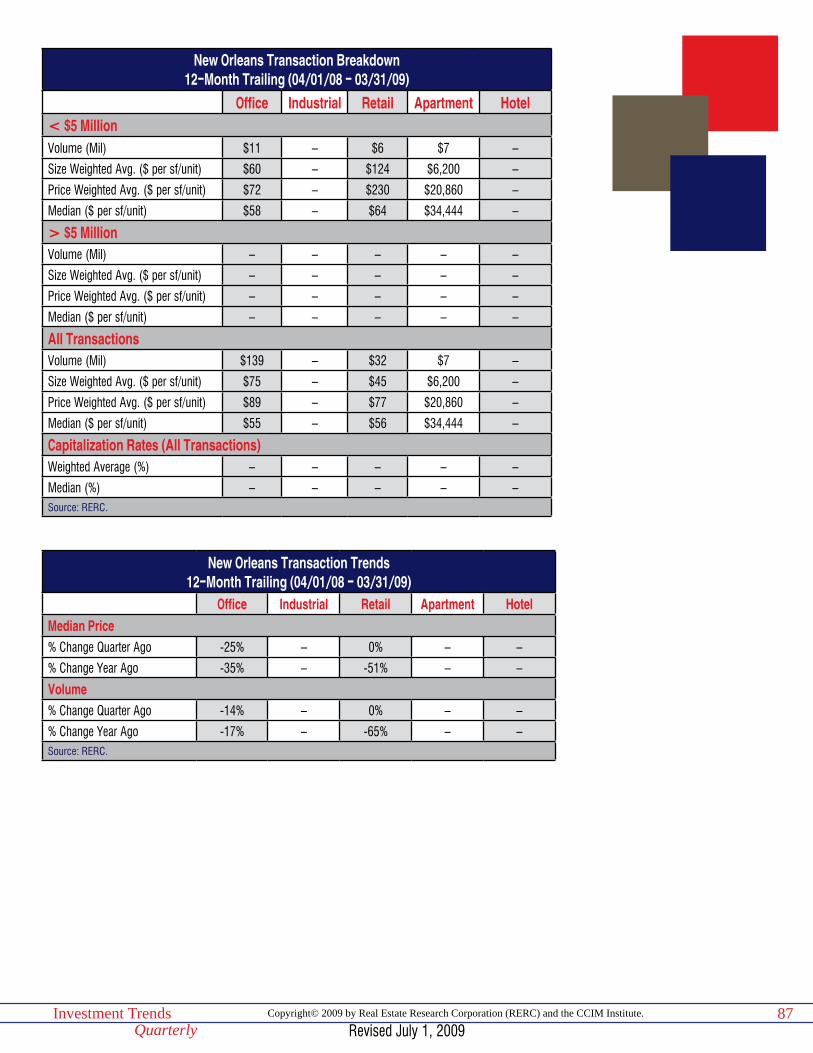
Copyright© 2009 by Real Estate Research Corporation (RERC) and the CCIM Institute.Investment TrendsQuarterly
87
New Orleans Transaction Breakdown12-Month Trailing (04/01/08 - 03/31/09)
Office Industrial Retail Apartment Hotel< $5 MillionVolume (Mil) $11 – $6 $7 –
Size Weighted Avg. ($ per sf/unit) $60 – $124 $6,200 –
Price Weighted Avg. ($ per sf/unit) $72 – $230 $20,860 –
Median ($ per sf/unit) $58 – $64 $34,444 –
> $5 MillionVolume (Mil) – – – – –
Size Weighted Avg. ($ per sf/unit) – – – – –
Price Weighted Avg. ($ per sf/unit) – – – – –
Median ($ per sf/unit) – – – – –
All TransactionsVolume (Mil) $139 – $32 $7 –
Size Weighted Avg. ($ per sf/unit) $75 – $45 $6,200 –
Price Weighted Avg. ($ per sf/unit) $89 – $77 $20,860 –
Median ($ per sf/unit) $55 – $56 $34,444 –
Capitalization Rates (All Transactions)Weighted Average (%) – – – – –
Median (%) – – – – –Source: RERC.
New Orleans Transaction Trends12-Month Trailing (04/01/08 - 03/31/09)
Office Industrial Retail Apartment HotelMedian Price% Change Quarter Ago -25% – 0% – –
% Change Year Ago -35% – -51% – –
Volume % Change Quarter Ago -14% – 0% – –
% Change Year Ago -17% – -65% – –Source: RERC.
Revised July 1, 2009
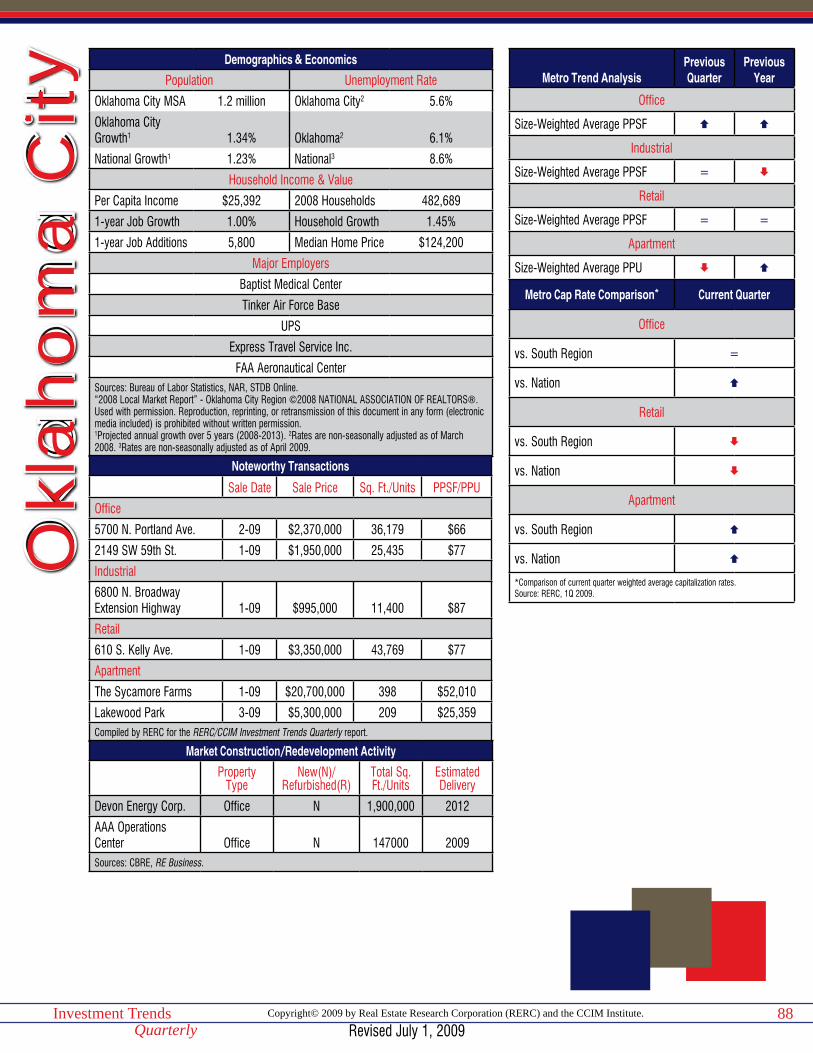
Copyright© 2009 by Real Estate Research Corporation (RERC) and the CCIM Institute.Investment TrendsQuarterly
88
Demographics & Economics
Population Unemployment Rate
Oklahoma City MSA 1.2 million Oklahoma City2 5.6%
Oklahoma City Growth1 1.34% Oklahoma2 6.1%
National Growth1 1.23% National3 8.6%
Household Income & Value
Per Capita Income $25,392 2008 Households 482,689
1-year Job Growth 1.00% Household Growth 1.45%
1-year Job Additions 5,800 Median Home Price $124,200
Major Employers
Baptist Medical Center
Tinker Air Force Base
UPS
Express Travel Service Inc.
FAA Aeronautical CenterSources: Bureau of Labor Statistics, NAR, STDB Online.“2008 Local Market Report” - Oklahoma City Region ©2008 NATIONAL ASSOCIATION OF REALTORS®. Used with permission. Reproduction, reprinting, or retransmission of this document in any form (electronic media included) is prohibited without written permission.1Projected annual growth over 5 years (2008-2013). 2Rates are non-seasonally adjusted as of March 2008. 3Rates are non-seasonally adjusted as of April 2009.
Noteworthy Transactions
Sale Date Sale Price Sq. Ft./Units PPSF/PPU
Office
5700 N. Portland Ave. 2-09 $2,370,000 36,179 $66
2149 SW 59th St. 1-09 $1,950,000 25,435 $77
Industrial
6800 N. BroadwayExtension Highway 1-09 $995,000 11,400 $87
Retail
610 S. Kelly Ave. 1-09 $3,350,000 43,769 $77
Apartment
The Sycamore Farms 1-09 $20,700,000 398 $52,010
Lakewood Park 3-09 $5,300,000 209 $25,359Compiled by RERC for the RERC/CCIM Investment Trends Quarterly report.
Market Construction/Redevelopment Activity
Property Type
New(N)/Refurbished(R)
Total Sq. Ft./Units
Estimated Delivery
Devon Energy Corp. Office N 1,900,000 2012
AAA Operations Center Office N 147000 2009Sources: CBRE, RE Business.
Okl
aho
ma
City Metro Trend Analysis
Previous Quarter
Previous Year
Office
Size-Weighted Average PPSF
Industrial
Size-Weighted Average PPSF =
Retail
Size-Weighted Average PPSF = =
Apartment
Size-Weighted Average PPU
Metro Cap Rate Comparison* Current Quarter
Office
vs. South Region =
vs. Nation
Retail
vs. South Region
vs. Nation
Apartment
vs. South Region
vs. Nation
*Comparison of current quarter weighted average capitalization rates.Source: RERC, 1Q 2009.
Revised July 1, 2009

Copyright© 2009 by Real Estate Research Corporation (RERC) and the CCIM Institute.Investment TrendsQuarterly
89
Oklahoma City Transaction Breakdown12-Month Trailing (04/01/08 - 03/31/09)
Office Industrial Retail Apartment Hotel< $5 MillionVolume (Mil) $27 $58 $97 $26 –
Size Weighted Avg. ($ per sf/unit) $41 $40 $79 $28,503 –
Price Weighted Avg. ($ per sf/unit) $73 $65 $133 $30,427 –
Median ($ per sf/unit) $68 $49 $74 $31,693 –
> $5 MillionVolume (Mil) $101 – – $180 –
Size Weighted Avg. ($ per sf/unit) $125 – – $66,898 –
Price Weighted Avg. ($ per sf/unit) $138 – – $78,413 –
Median ($ per sf/unit) $137 – – $64,912 –
All TransactionsVolume (Mil) $128 $118 $140 $206 –
Size Weighted Avg. ($ per sf/unit) $87 $22 $81 $57,243 –
Price Weighted Avg. ($ per sf/unit) $125 $41 $118 $72,404 –
Median ($ per sf/unit) $75 $49 $76 $35,859 –
Capitalization Rates (All Transactions)Weighted Average (%) 7.1 – – 7.4 –
Median (%) 6.3 – – 7.5 –Source: RERC.
Oklahoma City Transaction Trends12-Month Trailing (04/01/08 - 03/31/09)
Office Industrial Retail Apartment HotelMedian Price% Change Quarter Ago 7% 0% 6% -2% –
% Change Year Ago 9% 8% – 12% –
Volume % Change Quarter Ago 7% -27% -25% -31% –
% Change Year Ago -34% -12% – -7% –Source: RERC.
Revised July 1, 2009
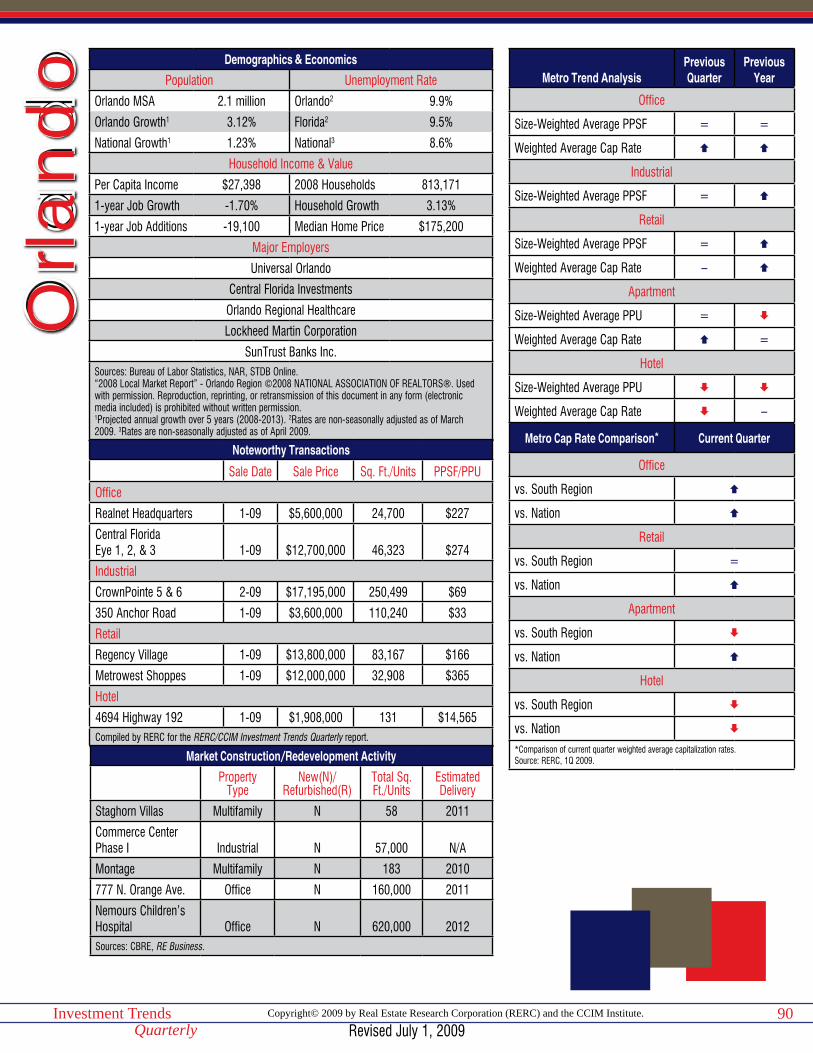
Copyright© 2009 by Real Estate Research Corporation (RERC) and the CCIM Institute.Investment TrendsQuarterly
90
Demographics & Economics
Population Unemployment Rate
Orlando MSA 2.1 million Orlando2 9.9%
Orlando Growth1 3.12% Florida2 9.5%
National Growth1 1.23% National3 8.6%
Household Income & Value
Per Capita Income $27,398 2008 Households 813,171
1-year Job Growth -1.70% Household Growth 3.13%
1-year Job Additions -19,100 Median Home Price $175,200
Major Employers
Universal Orlando
Central Florida Investments
Orlando Regional Healthcare
Lockheed Martin Corporation
SunTrust Banks Inc.Sources: Bureau of Labor Statistics, NAR, STDB Online.“2008 Local Market Report” - Orlando Region ©2008 NATIONAL ASSOCIATION OF REALTORS®. Used with permission. Reproduction, reprinting, or retransmission of this document in any form (electronic media included) is prohibited without written permission.1Projected annual growth over 5 years (2008-2013). 2Rates are non-seasonally adjusted as of March 2009. 3Rates are non-seasonally adjusted as of April 2009.
Noteworthy Transactions
Sale Date Sale Price Sq. Ft./Units PPSF/PPU
Office
Realnet Headquarters 1-09 $5,600,000 24,700 $227
Central FloridaEye 1, 2, & 3 1-09 $12,700,000 46,323 $274
Industrial
CrownPointe 5 & 6 2-09 $17,195,000 250,499 $69
350 Anchor Road 1-09 $3,600,000 110,240 $33
Retail
Regency Village 1-09 $13,800,000 83,167 $166
Metrowest Shoppes 1-09 $12,000,000 32,908 $365
Hotel
4694 Highway 192 1-09 $1,908,000 131 $14,565Compiled by RERC for the RERC/CCIM Investment Trends Quarterly report.
Market Construction/Redevelopment Activity
Property Type
New(N)/Refurbished(R)
Total Sq. Ft./Units
Estimated Delivery
Staghorn Villas Multifamily N 58 2011
Commerce Center Phase I Industrial N 57,000 N/A
Montage Multifamily N 183 2010
777 N. Orange Ave. Office N 160,000 2011
Nemours Children’s Hospital Office N 620,000 2012Sources: CBRE, RE Business.
Orla
ndo Metro Trend Analysis
Previous Quarter
Previous Year
Office
Size-Weighted Average PPSF = =
Weighted Average Cap Rate
Industrial
Size-Weighted Average PPSF =
Retail
Size-Weighted Average PPSF =
Weighted Average Cap Rate –
Apartment
Size-Weighted Average PPU =
Weighted Average Cap Rate =
Hotel
Size-Weighted Average PPU
Weighted Average Cap Rate –
Metro Cap Rate Comparison* Current Quarter
Office
vs. South Region
vs. Nation
Retail
vs. South Region =
vs. Nation
Apartment
vs. South Region
vs. Nation
Hotel
vs. South Region
vs. Nation
*Comparison of current quarter weighted average capitalization rates.Source: RERC, 1Q 2009.
Revised July 1, 2009

Copyright© 2009 by Real Estate Research Corporation (RERC) and the CCIM Institute.Investment TrendsQuarterly
91
Orlando Transaction Breakdown12-Month Trailing (04/01/08 - 03/31/09)
Office Industrial Retail Apartment Hotel< $5 MillionVolume (Mil) $55 $81 $85 – –
Size Weighted Avg. ($ per sf/unit) $150 $59 $155 – –
Price Weighted Avg. ($ per sf/unit) $222 $79 $227 – –
Median ($ per sf/unit) $162 $85 $163 – –
> $5 MillionVolume (Mil) $141 $108 $326 $332 $142
Size Weighted Avg. ($ per sf/unit) $176 $104 $207 $83,574 $54,132
Price Weighted Avg. ($ per sf/unit) $197 $131 $219 $94,527 $72,924
Median ($ per sf/unit) $180 $74 $189 $83,144 $58,848
All TransactionsVolume (Mil) $195 $188 $411 $340 $145
Size Weighted Avg. ($ per sf/unit) $168 $78 $194 $81,871 $51,080
Price Weighted Avg. ($ per sf/unit) $204 $109 $220 $93,355 $71,511
Median ($ per sf/unit) $177 $83 $167 $60,577 $47,976
Capitalization Rates (All Transactions)Weighted Average (%) 8.0 – 7.3 – –
Median (%) 8.0 – 7.0 – –Source: RERC.
Orlando Transaction Trends12-Month Trailing (04/01/08 - 03/31/09)
Office Industrial Retail Apartment HotelMedian Price% Change Quarter Ago 5% -6% 0% -7% -32%
% Change Year Ago -2% 4% – -16% -44%
Volume % Change Quarter Ago -38% -13% 17% -28% -17%
% Change Year Ago -85% -64% – -61% -71%Source: RERC.
Revised July 1, 2009
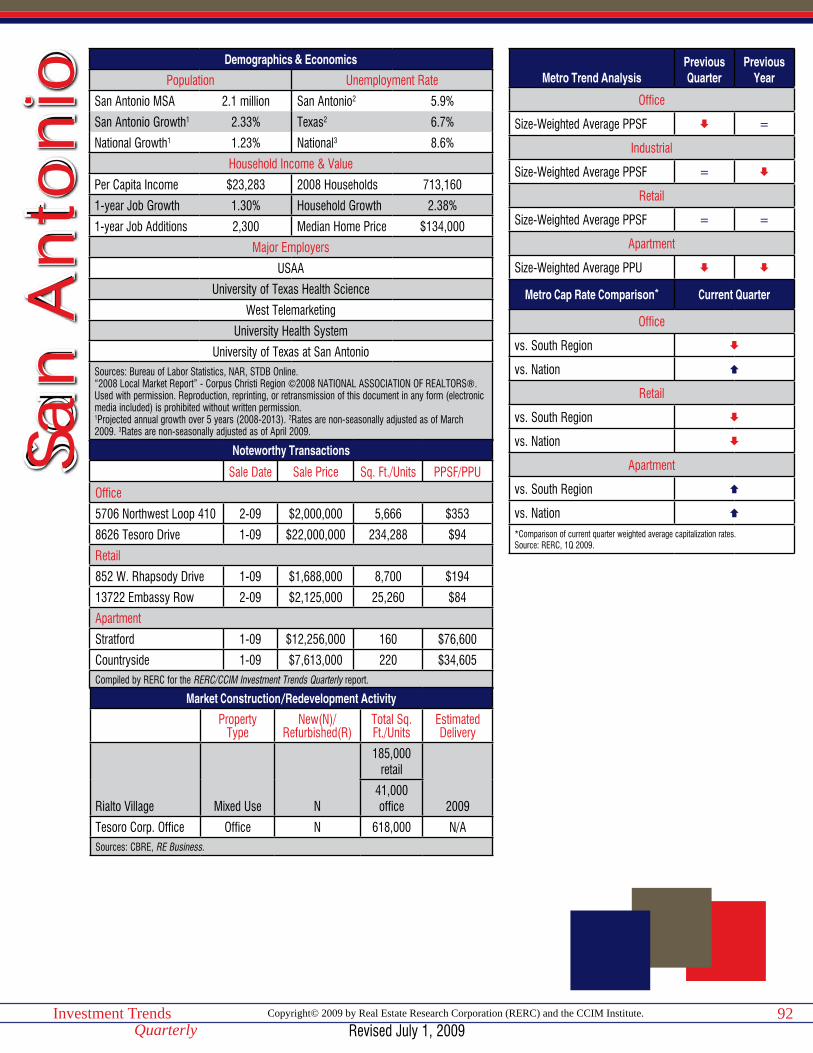
Copyright© 2009 by Real Estate Research Corporation (RERC) and the CCIM Institute.Investment TrendsQuarterly
92
Demographics & Economics
Population Unemployment Rate
San Antonio MSA 2.1 million San Antonio2 5.9%
San Antonio Growth1 2.33% Texas2 6.7%
National Growth1 1.23% National3 8.6%
Household Income & Value
Per Capita Income $23,283 2008 Households 713,160
1-year Job Growth 1.30% Household Growth 2.38%
1-year Job Additions 2,300 Median Home Price $134,000
Major Employers
USAA
University of Texas Health Science
West Telemarketing
University Health System
University of Texas at San AntonioSources: Bureau of Labor Statistics, NAR, STDB Online.“2008 Local Market Report” - Corpus Christi Region ©2008 NATIONAL ASSOCIATION OF REALTORS®. Used with permission. Reproduction, reprinting, or retransmission of this document in any form (electronic media included) is prohibited without written permission.1Projected annual growth over 5 years (2008-2013). 2Rates are non-seasonally adjusted as of March 2009. 3Rates are non-seasonally adjusted as of April 2009.
Noteworthy Transactions
Sale Date Sale Price Sq. Ft./Units PPSF/PPU
Office
5706 Northwest Loop 410 2-09 $2,000,000 5,666 $353
8626 Tesoro Drive 1-09 $22,000,000 234,288 $94
Retail
852 W. Rhapsody Drive 1-09 $1,688,000 8,700 $194
13722 Embassy Row 2-09 $2,125,000 25,260 $84
Apartment
Stratford 1-09 $12,256,000 160 $76,600
Countryside 1-09 $7,613,000 220 $34,605Compiled by RERC for the RERC/CCIM Investment Trends Quarterly report.
Market Construction/Redevelopment Activity
Property Type
New(N)/Refurbished(R)
Total Sq. Ft./Units
Estimated Delivery
Rialto Village Mixed Use N
185,000 retail
200941,000 office
Tesoro Corp. Office Office N 618,000 N/ASources: CBRE, RE Business.
San
Ant
oni
o Metro Trend AnalysisPrevious Quarter
Previous Year
Office
Size-Weighted Average PPSF =
Industrial
Size-Weighted Average PPSF =
Retail
Size-Weighted Average PPSF = =
Apartment
Size-Weighted Average PPU
Metro Cap Rate Comparison* Current Quarter
Office
vs. South Region
vs. Nation
Retail
vs. South Region
vs. Nation
Apartment
vs. South Region
vs. Nation
*Comparison of current quarter weighted average capitalization rates.Source: RERC, 1Q 2009.
Revised July 1, 2009

Copyright© 2009 by Real Estate Research Corporation (RERC) and the CCIM Institute.Investment TrendsQuarterly
93
San Antonio Transaction Breakdown12-Month Trailing (04/01/08 - 03/31/09)
Office Industrial Retail Apartment Hotel< $5 MillionVolume (Mil) $18 $16 $99 $7 –
Size Weighted Avg. ($ per sf/unit) $106 $41 $98 $37,643 –
Price Weighted Avg. ($ per sf/unit) $132 $46 $152 $40,756 –
Median ($ per sf/unit) $102 $45 $94 $38,415 –
> $5 MillionVolume (Mil) – – $112 $111 –
Size Weighted Avg. ($ per sf/unit) – – $222 $52,307 –
Price Weighted Avg. ($ per sf/unit) – – $270 $75,996 –
Median ($ per sf/unit) – – $252 $42,994 –
All TransactionsVolume (Mil) $83 $16 $212 $118 –
Size Weighted Avg. ($ per sf/unit) $127 $41 $139 $51,055 –
Price Weighted Avg. ($ per sf/unit) $144 $46 $215 $73,777 –
Median ($ per sf/unit) $104 $45 $95 $42,994 –
Capitalization Rates (All Transactions)Weighted Average (%) – – – – –
Median (%) – – – – –Source: RERC.
San Antonio Transaction Trends12-Month Trailing (04/01/08 - 03/31/09)
Office Industrial Retail Apartment HotelMedian Price% Change Quarter Ago 10% -3% -4% – –
% Change Year Ago -7% 8% -16% 28% –
Volume % Change Quarter Ago 9% -13% -21% – –
% Change Year Ago -55% -93% -66% -68% –Source: RERC.
Revised July 1, 2009
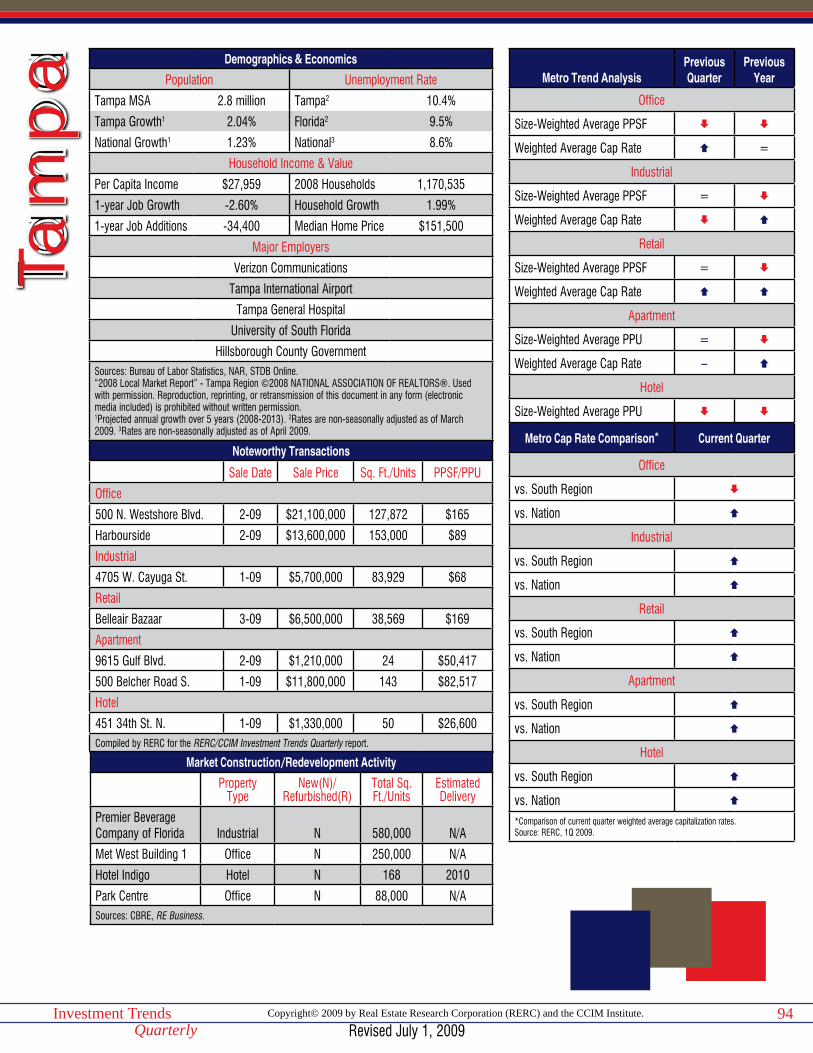
Copyright© 2009 by Real Estate Research Corporation (RERC) and the CCIM Institute.Investment TrendsQuarterly
94
Demographics & Economics
Population Unemployment Rate
Tampa MSA 2.8 million Tampa2 10.4%
Tampa Growth1 2.04% Florida2 9.5%
National Growth1 1.23% National3 8.6%
Household Income & Value
Per Capita Income $27,959 2008 Households 1,170,535
1-year Job Growth -2.60% Household Growth 1.99%
1-year Job Additions -34,400 Median Home Price $151,500
Major Employers
Verizon Communications
Tampa International Airport
Tampa General Hospital
University of South Florida
Hillsborough County GovernmentSources: Bureau of Labor Statistics, NAR, STDB Online.“2008 Local Market Report” - Tampa Region ©2008 NATIONAL ASSOCIATION OF REALTORS®. Used with permission. Reproduction, reprinting, or retransmission of this document in any form (electronic media included) is prohibited without written permission.1Projected annual growth over 5 years (2008-2013). 2Rates are non-seasonally adjusted as of March 2009. 3Rates are non-seasonally adjusted as of April 2009.
Noteworthy Transactions
Sale Date Sale Price Sq. Ft./Units PPSF/PPU
Office
500 N. Westshore Blvd. 2-09 $21,100,000 127,872 $165
Harbourside 2-09 $13,600,000 153,000 $89
Industrial
4705 W. Cayuga St. 1-09 $5,700,000 83,929 $68
Retail
Belleair Bazaar 3-09 $6,500,000 38,569 $169
Apartment
9615 Gulf Blvd. 2-09 $1,210,000 24 $50,417
500 Belcher Road S. 1-09 $11,800,000 143 $82,517
Hotel
451 34th St. N. 1-09 $1,330,000 50 $26,600Compiled by RERC for the RERC/CCIM Investment Trends Quarterly report.
Market Construction/Redevelopment Activity
Property Type
New(N)/Refurbished(R)
Total Sq. Ft./Units
Estimated Delivery
Premier Beverage Company of Florida Industrial N 580,000 N/A
Met West Building 1 Office N 250,000 N/A
Hotel Indigo Hotel N 168 2010
Park Centre Office N 88,000 N/ASources: CBRE, RE Business.
Tam
pa Metro Trend Analysis
Previous Quarter
Previous Year
Office
Size-Weighted Average PPSF
Weighted Average Cap Rate =
Industrial
Size-Weighted Average PPSF =
Weighted Average Cap Rate
Retail
Size-Weighted Average PPSF =
Weighted Average Cap Rate
Apartment
Size-Weighted Average PPU =
Weighted Average Cap Rate –
Hotel
Size-Weighted Average PPU
Metro Cap Rate Comparison* Current Quarter
Office
vs. South Region
vs. Nation
Industrial
vs. South Region
vs. Nation
Retail
vs. South Region
vs. Nation
Apartment
vs. South Region
vs. Nation
Hotel
vs. South Region
vs. Nation
*Comparison of current quarter weighted average capitalization rates.Source: RERC, 1Q 2009.
Revised July 1, 2009

Copyright© 2009 by Real Estate Research Corporation (RERC) and the CCIM Institute.Investment TrendsQuarterly
95
Tampa Transaction Breakdown12-Month Trailing (04/01/08 - 03/31/09)
Office Industrial Retail Apartment Hotel< $5 MillionVolume (Mil) $91 $130 $160 $30 –
Size Weighted Avg. ($ per sf/unit) $121 $64 $107 $51,547 –
Price Weighted Avg. ($ per sf/unit) $139 $78 $185 $68,799 –
Median ($ per sf/unit) $119 $67 $106 $58,636 –
> $5 MillionVolume (Mil) $167 $81 $110 $420 $66
Size Weighted Avg. ($ per sf/unit) $129 $57 $116 $70,622 $67,980
Price Weighted Avg. ($ per sf/unit) $133 $78 $154 $90,867 $76,834
Median ($ per sf/unit) $135 $65 $112 $59,827 $83,349
All TransactionsVolume (Mil) $258 $211 $270 $450 $72
Size Weighted Avg. ($ per sf/unit) $126 $61 $110 $68,899 $58,255
Price Weighted Avg. ($ per sf/unit) $135 $78 $173 $89,375 $72,315
Median ($ per sf/unit) $121 $67 $107 $59,507 $43,498
Capitalization Rates (All Transactions)Weighted Average (%) – – 8.0 7.5 –
Median (%) – – 8.0 7.6 –Source: RERC.
Tampa Transaction Trends12-Month Trailing (04/01/08 - 03/31/09)
Office Industrial Retail Apartment HotelMedian Price% Change Quarter Ago -9% -2% 2% -1% -52%
% Change Year Ago -11% -4% -25% -8% -41%
Volume % Change Quarter Ago -10% -19% 12% -21% 15%
% Change Year Ago -80% -64% -75% -51% -89%Source: RERC.
Revised July 1, 2009

Chicago • Cincinnati • Cleveland • Columbus • Detroit • Indianapolis Kansas City • Milwaukee • Minneapolis • Omaha • St. Louis • Toledo
Midwest Region
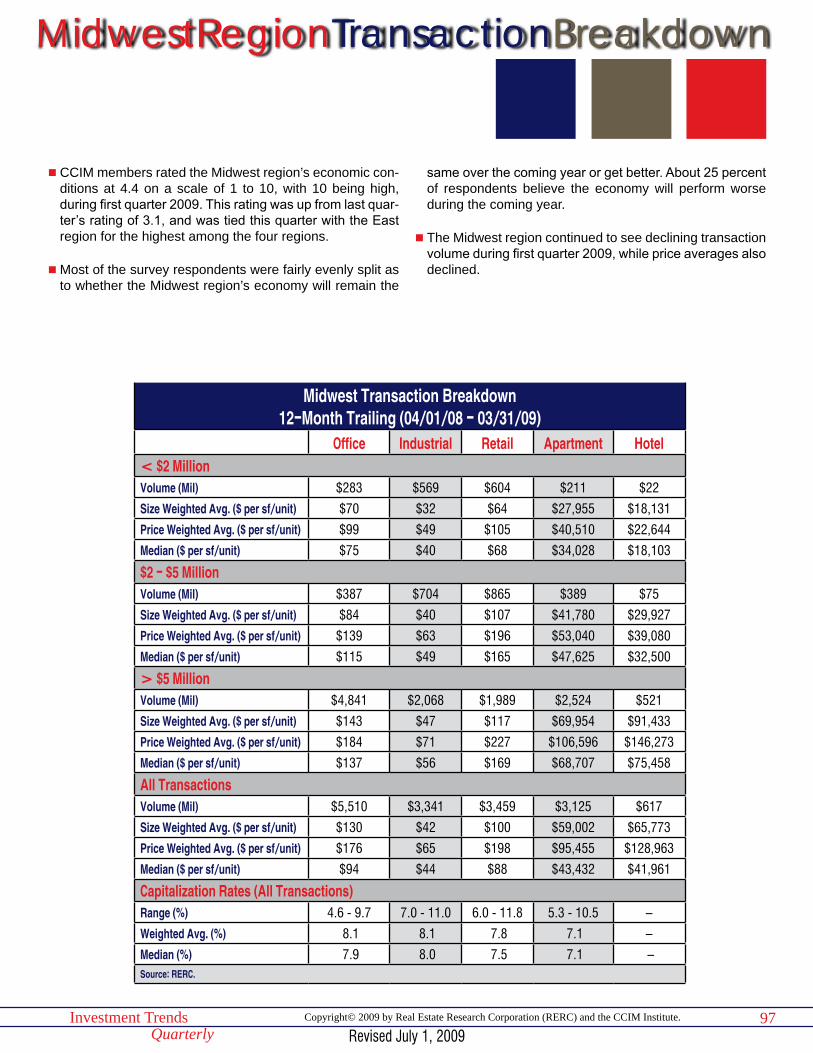
97Investment TrendsQuarterly
Copyright© 2009 by Real Estate Research Corporation (RERC) and the CCIM Institute.
MidwestRegionTransactionBreakdown
Midwest Transaction Breakdown12-Month Trailing (04/01/08 - 03/31/09)
Office Industrial Retail Apartment Hotel< $2 MillionVolume (Mil) $283 $569 $604 $211 $22
Size Weighted Avg. ($ per sf/unit) $70 $32 $64 $27,955 $18,131
Price Weighted Avg. ($ per sf/unit) $99 $49 $105 $40,510 $22,644
Median ($ per sf/unit) $75 $40 $68 $34,028 $18,103
$2 - $5 MillionVolume (Mil) $387 $704 $865 $389 $75
Size Weighted Avg. ($ per sf/unit) $84 $40 $107 $41,780 $29,927
Price Weighted Avg. ($ per sf/unit) $139 $63 $196 $53,040 $39,080
Median ($ per sf/unit) $115 $49 $165 $47,625 $32,500
> $5 MillionVolume (Mil) $4,841 $2,068 $1,989 $2,524 $521
Size Weighted Avg. ($ per sf/unit) $143 $47 $117 $69,954 $91,433
Price Weighted Avg. ($ per sf/unit) $184 $71 $227 $106,596 $146,273
Median ($ per sf/unit) $137 $56 $169 $68,707 $75,458
All TransactionsVolume (Mil) $5,510 $3,341 $3,459 $3,125 $617
Size Weighted Avg. ($ per sf/unit) $130 $42 $100 $59,002 $65,773
Price Weighted Avg. ($ per sf/unit) $176 $65 $198 $95,455 $128,963
Median ($ per sf/unit) $94 $44 $88 $43,432 $41,961
Capitalization Rates (All Transactions)Range (%) 4.6 - 9.7 7.0 - 11.0 6.0 - 11.8 5.3 - 10.5 –
Weighted Avg. (%) 8.1 8.1 7.8 7.1 –
Median (%) 7.9 8.0 7.5 7.1 –Source: RERC.
n CCIM members rated the Midwest region’s economic con-ditions at 4.4 on a scale of 1 to 10, with 10 being high, during first quarter 2009. This rating was up from last quar-ter’s rating of 3.1, and was tied this quarter with the East region for the highest among the four regions.
n Most of the survey respondents were fairly evenly split as to whether the Midwest region’s economy will remain the
same over the coming year or get better. About 25 percent of respondents believe the economy will perform worse during the coming year.
n The Midwest region continued to see declining transaction volume during first quarter 2009, while price averages also declined.
Revised July 1, 2009
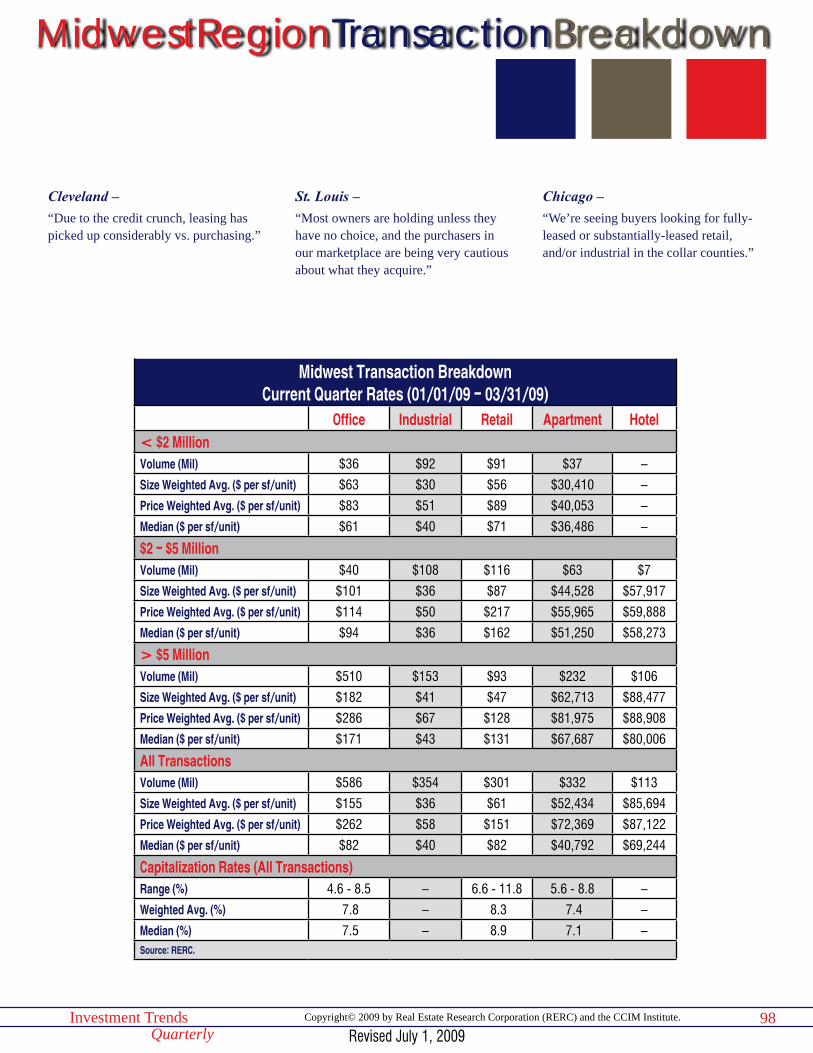
98Investment TrendsQuarterly
Copyright© 2009 by Real Estate Research Corporation (RERC) and the CCIM Institute.
MidwestRegionTransactionBreakdown
Midwest Transaction BreakdownCurrent Quarter Rates (01/01/09 - 03/31/09)
Office Industrial Retail Apartment Hotel< $2 MillionVolume (Mil) $36 $92 $91 $37 –
Size Weighted Avg. ($ per sf/unit) $63 $30 $56 $30,410 –
Price Weighted Avg. ($ per sf/unit) $83 $51 $89 $40,053 –
Median ($ per sf/unit) $61 $40 $71 $36,486 –
$2 - $5 MillionVolume (Mil) $40 $108 $116 $63 $7
Size Weighted Avg. ($ per sf/unit) $101 $36 $87 $44,528 $57,917
Price Weighted Avg. ($ per sf/unit) $114 $50 $217 $55,965 $59,888
Median ($ per sf/unit) $94 $36 $162 $51,250 $58,273
> $5 MillionVolume (Mil) $510 $153 $93 $232 $106
Size Weighted Avg. ($ per sf/unit) $182 $41 $47 $62,713 $88,477
Price Weighted Avg. ($ per sf/unit) $286 $67 $128 $81,975 $88,908
Median ($ per sf/unit) $171 $43 $131 $67,687 $80,006
All TransactionsVolume (Mil) $586 $354 $301 $332 $113
Size Weighted Avg. ($ per sf/unit) $155 $36 $61 $52,434 $85,694
Price Weighted Avg. ($ per sf/unit) $262 $58 $151 $72,369 $87,122
Median ($ per sf/unit) $82 $40 $82 $40,792 $69,244
Capitalization Rates (All Transactions)Range (%) 4.6 - 8.5 – 6.6 - 11.8 5.6 - 8.8 –
Weighted Avg. (%) 7.8 – 8.3 7.4 –
Median (%) 7.5 – 8.9 7.1 –Source: RERC.
Cleveland –“Due to the credit crunch, leasing has picked up considerably vs. purchasing.”
St. Louis –“Most owners are holding unless they have no choice, and the purchasers in our marketplace are being very cautious about what they acquire.”
Chicago –“We’re seeing buyers looking for fully-leased or substantially-leased retail, and/or industrial in the collar counties.”
Revised July 1, 2009
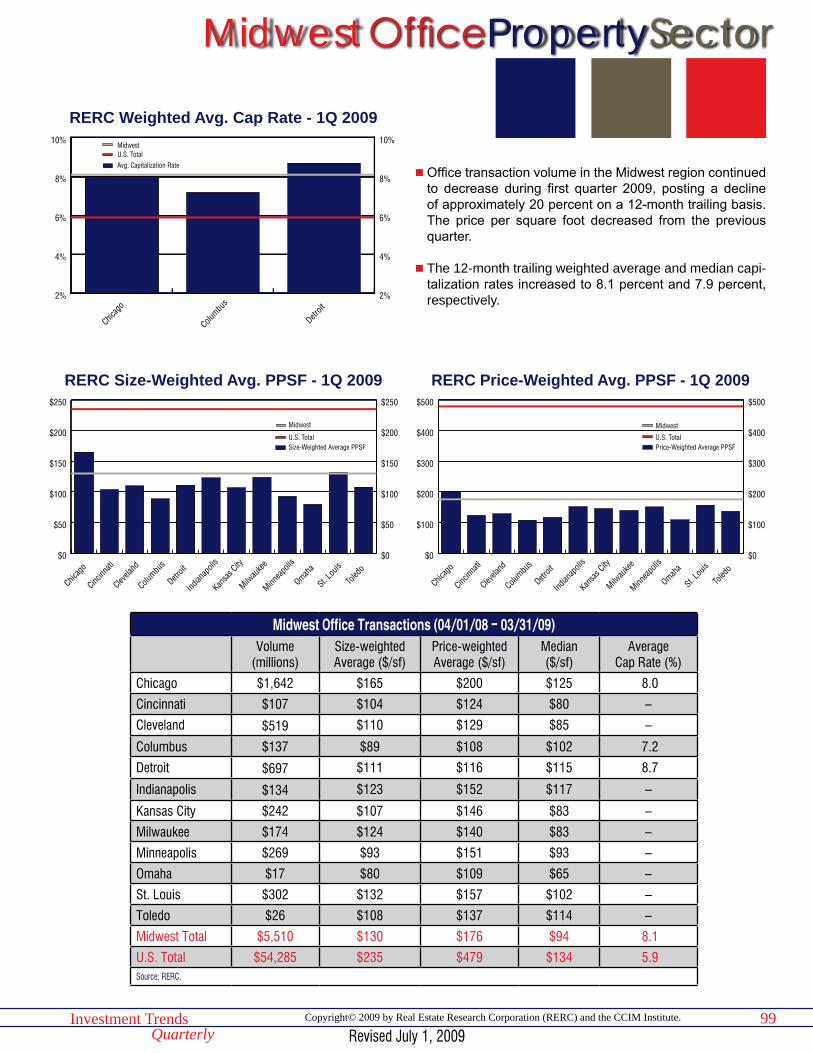
OfficePropertySector
99Investment TrendsQuarterly
Copyright© 2009 by Real Estate Research Corporation (RERC) and the CCIM Institute.
$0
$100
$200
$300
$400
$500
$0
$100
$200
$300
$400
$500
Midwest
U.S. TotalPrice-Weighted Average PPSF
Toled
o
St. Lou
is
Omaha
Minnea
polis
Milwau
kee
Kansa
s City
Indian
apoli
s
Detroit
Columbu
s
Clevela
nd
Cincinn
ati
Chicag
o
RERC Price-Weighted Avg. PPSF - 1Q 2009
2%
4%
6%
8%
10%
2%
4%
6%
8%
10%MidwestU.S. TotalAvg. Capitalization Rate
Detroit
Columbu
s
Chicag
o
RERC Weighted Avg. Cap Rate - 1Q 2009
Midwest Office Transactions (04/01/08 - 03/31/09)Volume
(millions)Size-weighted Average ($/sf)
Price-weighted Average ($/sf)
Median($/sf)
Average Cap Rate (%)
Chicago $1,642 $165 $200 $125 8.0
Cincinnati $107 $104 $124 $80 –
Cleveland $519 $110 $129 $85 –
Columbus $137 $89 $108 $102 7.2
Detroit $697 $111 $116 $115 8.7
Indianapolis $134 $123 $152 $117 –
Kansas City $242 $107 $146 $83 –
Milwaukee $174 $124 $140 $83 –
Minneapolis $269 $93 $151 $93 –
Omaha $17 $80 $109 $65 –
St. Louis $302 $132 $157 $102 –
Toledo $26 $108 $137 $114 –
Midwest Total $5,510 $130 $176 $94 8.1
U.S. Total $54,285 $235 $479 $134 5.9 Source: RERC.
$0
$50
$100
$150
$200
$250
$0
$50
$100
$150
$200
$250
Midwest
U.S. TotalSize-Weighted Average PPSF
Toled
o
St. Lou
is
Omaha
Minnea
polis
Milwau
kee
Kansa
s City
Indian
apoli
s
Detroit
Columbu
s
Clevela
nd
Cincinn
ati
Chicag
o
RERC Size-Weighted Avg. PPSF - 1Q 2009
n Office transaction volume in the Midwest region continued to decrease during first quarter 2009, posting a decline of approximately 20 percent on a 12-month trailing basis. The price per square foot decreased from the previous quarter.
n The 12-month trailing weighted average and median capi-talization rates increased to 8.1 percent and 7.9 percent, respectively.
Midwest
Revised July 1, 2009
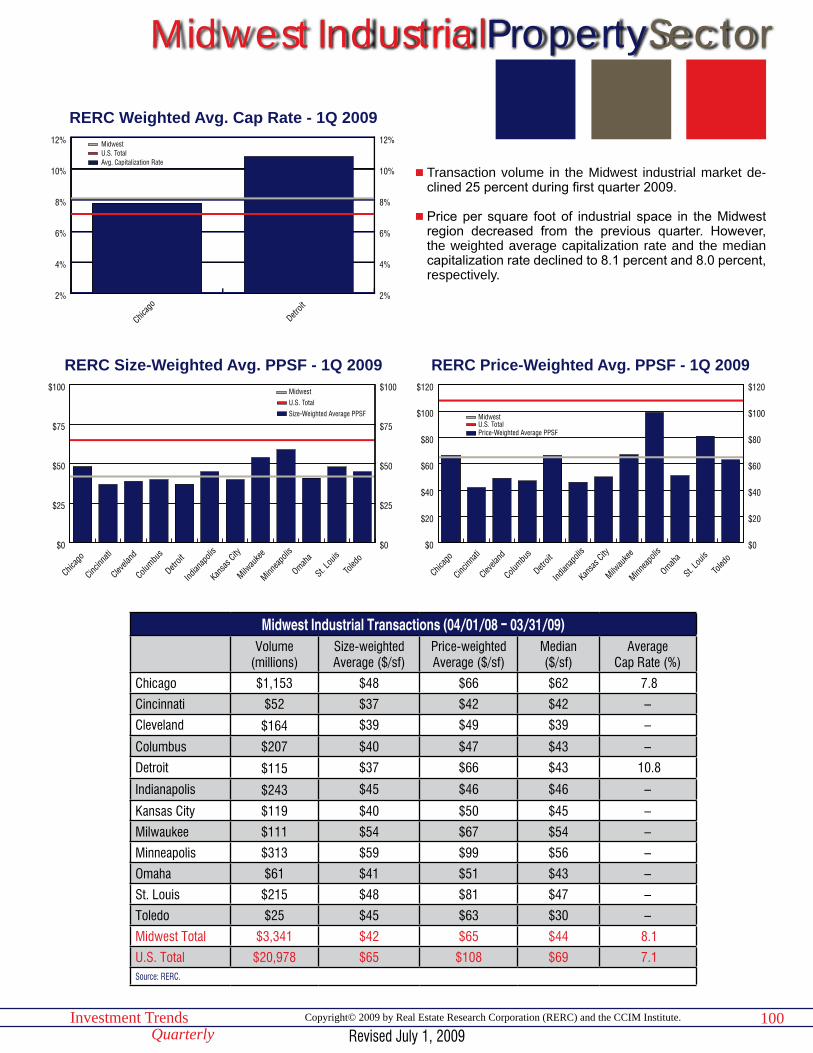
100Investment TrendsQuarterly
Copyright© 2009 by Real Estate Research Corporation (RERC) and the CCIM Institute.
IndustrialPropertySector
$0
$20
$40
$60
$80
$100
$120
$0
$20
$40
$60
$80
$100
$120
MidwestU.S. TotalPrice-Weighted Average PPSF
Toled
o
St. Lou
is
Omaha
Minnea
polis
Milwau
kee
Kansa
s City
Indian
apoli
s
Detroit
Columbu
s
Clevela
nd
Cincinn
ati
Chicag
o
RERC Price-Weighted Avg. PPSF - 1Q 2009
Midwest Industrial Transactions (04/01/08 - 03/31/09)Volume
(millions)Size-weighted Average ($/sf)
Price-weighted Average ($/sf)
Median($/sf)
Average Cap Rate (%)
Chicago $1,153 $48 $66 $62 7.8
Cincinnati $52 $37 $42 $42 –
Cleveland $164 $39 $49 $39 –
Columbus $207 $40 $47 $43 –
Detroit $115 $37 $66 $43 10.8
Indianapolis $243 $45 $46 $46 –
Kansas City $119 $40 $50 $45 –
Milwaukee $111 $54 $67 $54 –
Minneapolis $313 $59 $99 $56 –
Omaha $61 $41 $51 $43 –
St. Louis $215 $48 $81 $47 –
Toledo $25 $45 $63 $30 –
Midwest Total $3,341 $42 $65 $44 8.1
U.S. Total $20,978 $65 $108 $69 7.1 Source: RERC.
$0
$25
$50
$75
$100
$0
$25
$50
$75
$100MidwestU.S. TotalSize-Weighted Average PPSF
Toled
o
St. Lou
is
Omaha
Minnea
polis
Milwau
kee
Kansa
s City
Indian
apoli
s
Detroit
Columbu
s
Clevela
nd
Cincinn
ati
Chicag
o
RERC Size-Weighted Avg. PPSF - 1Q 2009
n Transaction volume in the Midwest industrial market de-clined 25 percent during first quarter 2009.
n Price per square foot of industrial space in the Midwest region decreased from the previous quarter. However, the weighted average capitalization rate and the median capitalization rate declined to 8.1 percent and 8.0 percent, respectively.
Midwest
2%
4%
6%
8%
10%
12%
2%
4%
6%
8%
10%
12%MidwestU.S. TotalAvg. Capitalization Rate
Detroit
Chicag
o
RERC Weighted Avg. Cap Rate - 1Q 2009
Revised July 1, 2009
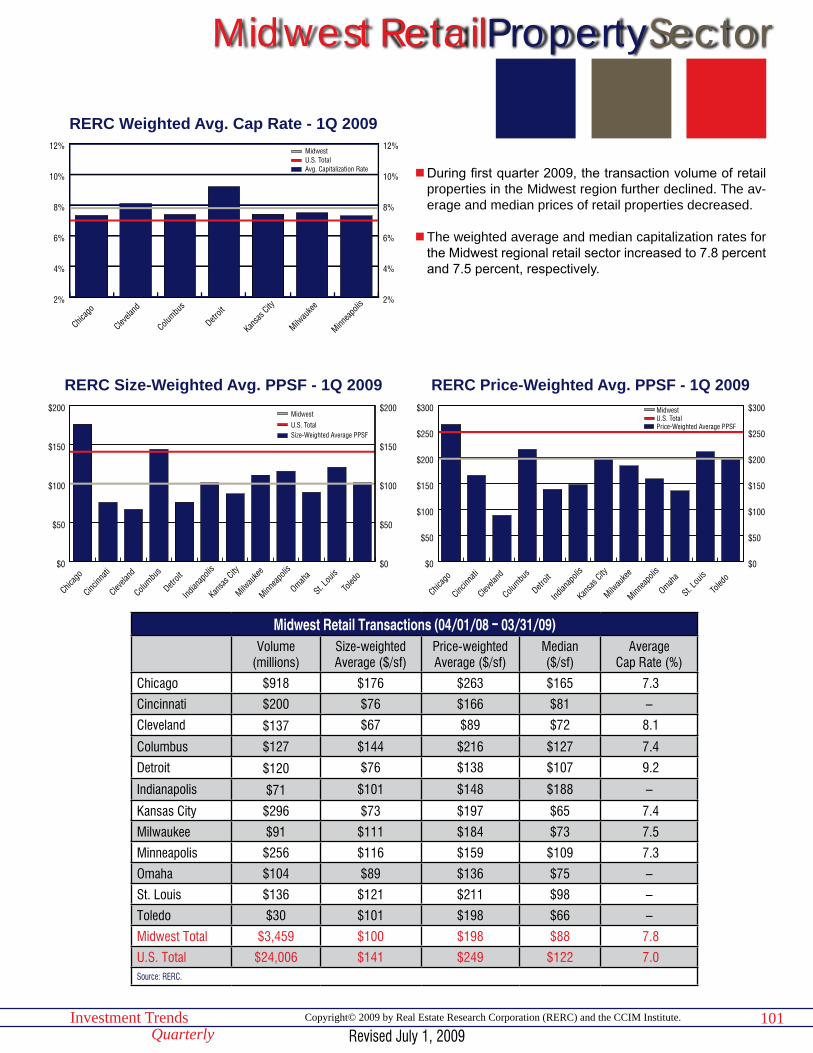
101Investment TrendsQuarterly
Copyright© 2009 by Real Estate Research Corporation (RERC) and the CCIM Institute.
RetailPropertySector
$0
$50
$100
$150
$200
$250
$300
$0
$50
$100
$150
$200
$250
$300MidwestU.S. TotalPrice-Weighted Average PPSF
Toled
o
St. Lou
is
Omaha
Minnea
polis
Milwau
kee
Kansa
s City
Indian
apoli
s
Detroit
Columbu
s
Clevela
nd
Cincinn
ati
Chicag
o
RERC Price-Weighted Avg. PPSF - 1Q 2009
2%
4%
6%
8%
10%
12%
2%
4%
6%
8%
10%
12%MidwestU.S. TotalAvg. Capitalization Rate
Minnea
polis
Milwau
kee
Kansa
s City
Detroit
Columbu
s
Clevela
nd
Chicag
o
RERC Weighted Avg. Cap Rate - 1Q 2009
Midwest Retail Transactions (04/01/08 - 03/31/09)Volume
(millions)Size-weighted Average ($/sf)
Price-weighted Average ($/sf)
Median($/sf)
Average Cap Rate (%)
Chicago $918 $176 $263 $165 7.3
Cincinnati $200 $76 $166 $81 –
Cleveland $137 $67 $89 $72 8.1
Columbus $127 $144 $216 $127 7.4
Detroit $120 $76 $138 $107 9.2
Indianapolis $71 $101 $148 $188 –
Kansas City $296 $73 $197 $65 7.4
Milwaukee $91 $111 $184 $73 7.5
Minneapolis $256 $116 $159 $109 7.3
Omaha $104 $89 $136 $75 –
St. Louis $136 $121 $211 $98 –
Toledo $30 $101 $198 $66 –
Midwest Total $3,459 $100 $198 $88 7.8
U.S. Total $24,006 $141 $249 $122 7.0 Source: RERC.
$0
$50
$100
$150
$200
$0
$50
$100
$150
$200MidwestU.S. TotalSize-Weighted Average PPSF
Toled
o
St. Lou
is
Omaha
Minnea
polis
Milwau
kee
Kansa
s City
Indian
apoli
s
Detroit
Columbu
s
Clevela
nd
Cincinn
ati
Chicag
o
RERC Size-Weighted Avg. PPSF - 1Q 2009
n During first quarter 2009, the transaction volume of retail properties in the Midwest region further declined. The av-erage and median prices of retail properties decreased.
n The weighted average and median capitalization rates for the Midwest regional retail sector increased to 7.8 percent and 7.5 percent, respectively.
Midwest
Revised July 1, 2009
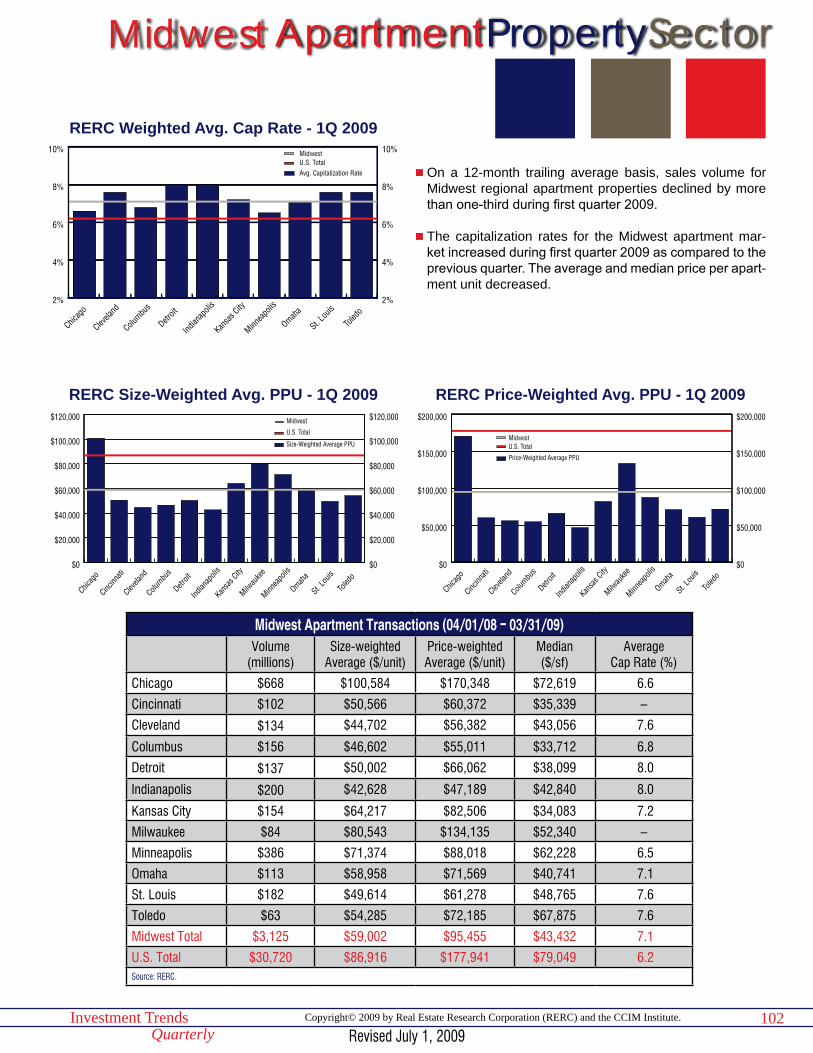
102Investment TrendsQuarterly
Copyright© 2009 by Real Estate Research Corporation (RERC) and the CCIM Institute.
ApartmentPropertySector
$0
$50,000
$100,000
$150,000
$200,000
$0
$50,000
$100,000
$150,000
$200,000
MidwestU.S. Total
Price-Weighted Average PPU
Toled
o
St. Lou
is
Omaha
Minnea
polis
Milwau
kee
Kansa
s City
Indian
apoli
s
Detroit
Columbu
s
Clevela
nd
Cincinn
ati
Chicag
o
RERC Price-Weighted Avg. PPU - 1Q 2009
2%
4%
6%
8%
10%
2%
4%
6%
8%
10%MidwestU.S. TotalAvg. Capitalization Rate
Toled
o
St. Lou
is
Omaha
Minnea
polis
Kansa
s City
Indian
apoli
s
Detroit
Columbu
s
Clevela
nd
Chicag
o
RERC Weighted Avg. Cap Rate - 1Q 2009
Midwest Apartment Transactions (04/01/08 - 03/31/09)Volume
(millions)Size-weighted
Average ($/unit)Price-weighted Average ($/unit)
Median($/sf)
Average Cap Rate (%)
Chicago $668 $100,584 $170,348 $72,619 6.6
Cincinnati $102 $50,566 $60,372 $35,339 –
Cleveland $134 $44,702 $56,382 $43,056 7.6
Columbus $156 $46,602 $55,011 $33,712 6.8
Detroit $137 $50,002 $66,062 $38,099 8.0
Indianapolis $200 $42,628 $47,189 $42,840 8.0
Kansas City $154 $64,217 $82,506 $34,083 7.2
Milwaukee $84 $80,543 $134,135 $52,340 –
Minneapolis $386 $71,374 $88,018 $62,228 6.5
Omaha $113 $58,958 $71,569 $40,741 7.1
St. Louis $182 $49,614 $61,278 $48,765 7.6
Toledo $63 $54,285 $72,185 $67,875 7.6
Midwest Total $3,125 $59,002 $95,455 $43,432 7.1
U.S. Total $30,720 $86,916 $177,941 $79,049 6.2 Source: RERC.
$0
$20,000
$40,000
$60,000
$80,000
$100,000
$120,000
$0
$20,000
$40,000
$60,000
$80,000
$100,000
$120,000Midwest
U.S. Total
Size-Weighted Average PPU
Toled
o
St. Lou
is
Omaha
Minnea
polis
Milwau
kee
Kansa
s City
Indian
apoli
s
Detroit
Columbu
s
Clevela
nd
Cincinn
ati
Chicag
o
RERC Size-Weighted Avg. PPU - 1Q 2009
n On a 12-month trailing average basis, sales volume for Midwest regional apartment properties declined by more than one-third during first quarter 2009.
n The capitalization rates for the Midwest apartment mar-ket increased during first quarter 2009 as compared to the previous quarter. The average and median price per apart-ment unit decreased.
Midwest
Revised July 1, 2009
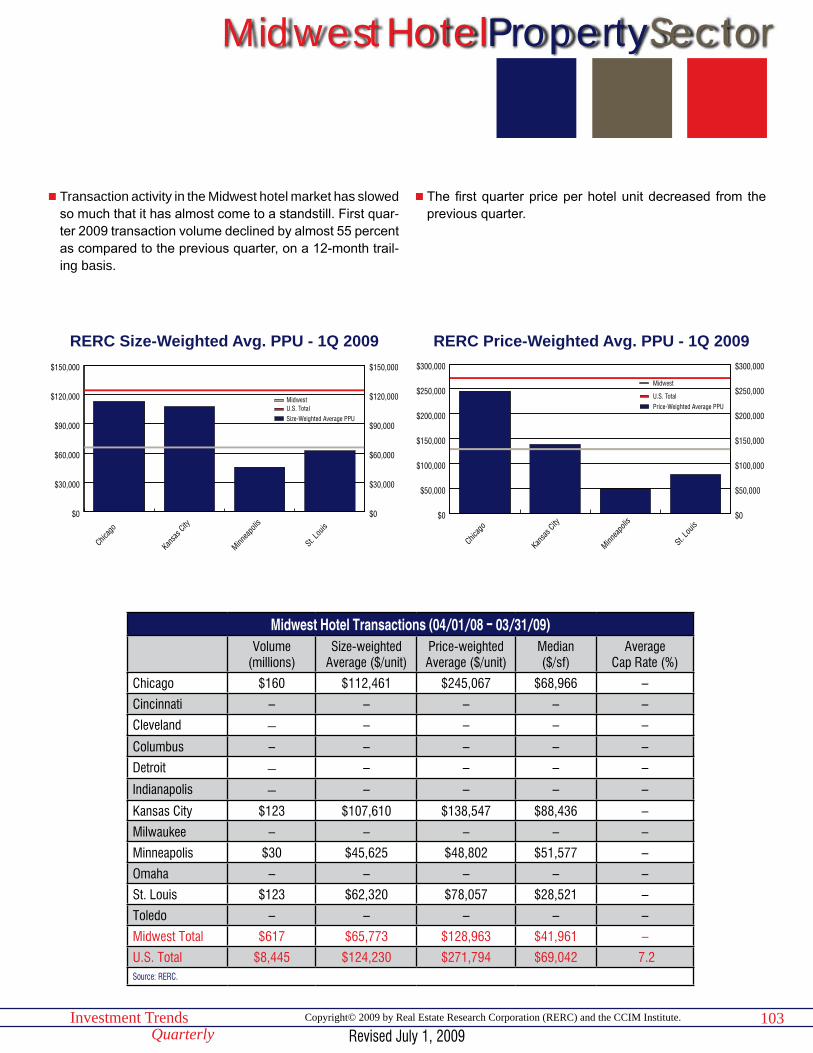
103Investment TrendsQuarterly
Copyright© 2009 by Real Estate Research Corporation (RERC) and the CCIM Institute.
HotelPropertySector
$0
$50,000
$100,000
$150,000
$200,000
$250,000
$300,000
$0
$50,000
$100,000
$150,000
$200,000
$250,000
$300,000
Midwest
U.S. TotalPrice-Weighted Average PPU
St. Lo
uis
Minnea
polis
Kans
as Ci
ty
Chica
go
RERC Price-Weighted Avg. PPU - 1Q 2009
Midwest Hotel Transactions (04/01/08 - 03/31/09)Volume
(millions)Size-weighted
Average ($/unit)Price-weighted Average ($/unit)
Median($/sf)
Average Cap Rate (%)
Chicago $160 $112,461 $245,067 $68,966 –
Cincinnati – – – – –
Cleveland – – – – –
Columbus – – – – –
Detroit – – – – –
Indianapolis – – – – –
Kansas City $123 $107,610 $138,547 $88,436 –
Milwaukee – – – – –
Minneapolis $30 $45,625 $48,802 $51,577 –
Omaha – – – – –
St. Louis $123 $62,320 $78,057 $28,521 –
Toledo – – – – –
Midwest Total $617 $65,773 $128,963 $41,961 –
U.S. Total $8,445 $124,230 $271,794 $69,042 7.2 Source: RERC.
$0
$30,000
$60,000
$90,000
$120,000
$150,000
$0
$30,000
$60,000
$90,000
$120,000
$150,000
MidwestU.S. TotalSize-Weighted Average PPU
St. Lou
is
Minnea
polis
Kansa
s City
Chicag
o
RERC Size-Weighted Avg. PPU - 1Q 2009
n Transaction activity in the Midwest hotel market has slowed so much that it has almost come to a standstill. First quar-ter 2009 transaction volume declined by almost 55 percent as compared to the previous quarter, on a 12-month trail-ing basis.
n The first quarter price per hotel unit decreased from the previous quarter.
Midwest
Revised July 1, 2009
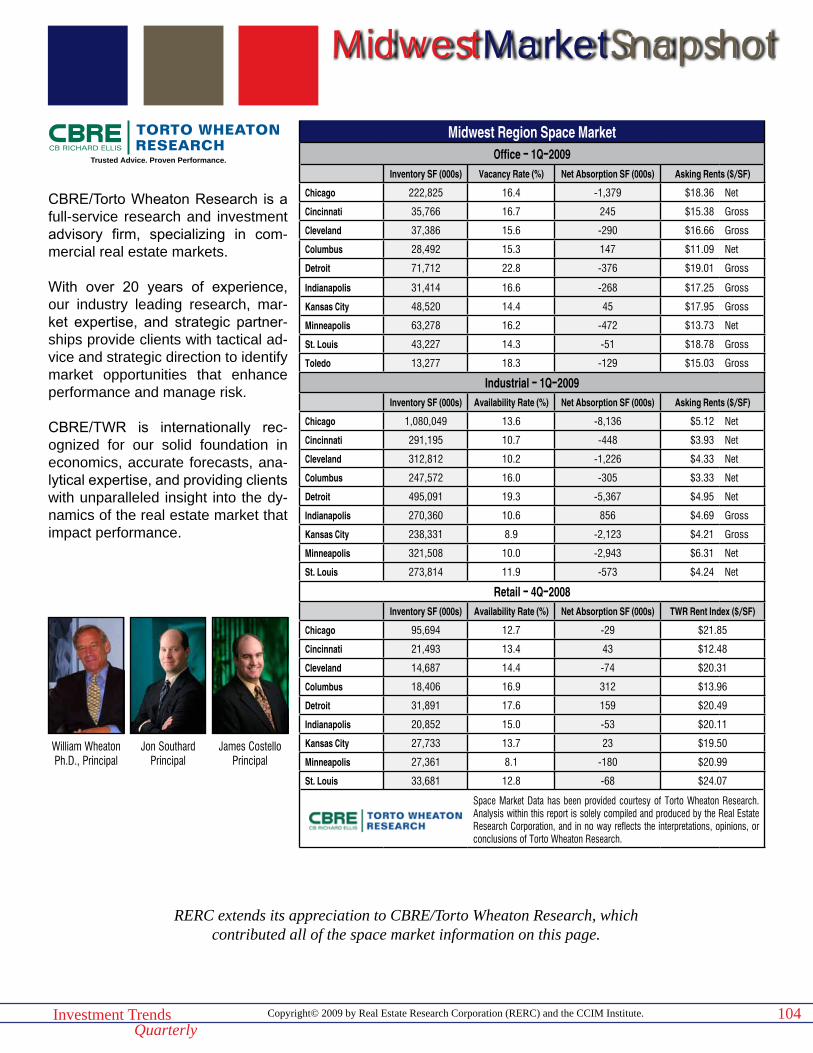
Copyright© 2009 by Real Estate Research Corporation (RERC) and the CCIM Institute.Investment TrendsQuarterly
MidwestMarketSnapshot
104
Midwest Region Space MarketOffice - 1Q-2009
Inventory SF (000s) Vacancy Rate (%) Net Absorption SF (000s) Asking Rents ($/SF)
Chicago 222,825 16.4 -1,379 $18.36 Net
Cincinnati 35,766 16.7 245 $15.38 Gross
Cleveland 37,386 15.6 -290 $16.66 Gross
Columbus 28,492 15.3 147 $11.09 Net
Detroit 71,712 22.8 -376 $19.01 Gross
Indianapolis 31,414 16.6 -268 $17.25 Gross
Kansas City 48,520 14.4 45 $17.95 Gross
Minneapolis 63,278 16.2 -472 $13.73 Net
St. Louis 43,227 14.3 -51 $18.78 Gross
Toledo 13,277 18.3 -129 $15.03 Gross
Industrial - 1Q-2009Inventory SF (000s) Availability Rate (%) Net Absorption SF (000s) Asking Rents ($/SF)
Chicago 1,080,049 13.6 -8,136 $5.12 Net
Cincinnati 291,195 10.7 -448 $3.93 Net
Cleveland 312,812 10.2 -1,226 $4.33 Net
Columbus 247,572 16.0 -305 $3.33 Net
Detroit 495,091 19.3 -5,367 $4.95 Net
Indianapolis 270,360 10.6 856 $4.69 Gross
Kansas City 238,331 8.9 -2,123 $4.21 Gross
Minneapolis 321,508 10.0 -2,943 $6.31 Net
St. Louis 273,814 11.9 -573 $4.24 Net
Retail - 4Q-2008Inventory SF (000s) Availability Rate (%) Net Absorption SF (000s) TWR Rent Index ($/SF)
Chicago 95,694 12.7 -29 $21.85
Cincinnati 21,493 13.4 43 $12.48
Cleveland 14,687 14.4 -74 $20.31
Columbus 18,406 16.9 312 $13.96
Detroit 31,891 17.6 159 $20.49
Indianapolis 20,852 15.0 -53 $20.11
Kansas City 27,733 13.7 23 $19.50
Minneapolis 27,361 8.1 -180 $20.99
St. Louis 33,681 12.8 -68 $24.07
Space Market Data has been provided courtesy of Torto Wheaton Research. Analysis within this report is solely compiled and produced by the Real Estate Research Corporation, and in no way reflects the interpretations, opinions, or conclusions of Torto Wheaton Research.
Trusted Advice. Proven Performance.
RERC extends its appreciation to CBRE/Torto Wheaton Research, whichcontributed all of the space market information on this page.
CBRE/Torto Wheaton Research is a full-service research and investment advisory firm, specializing in com-mercial real estate markets.
With over 20 years of experience, our industry leading research, mar-ket expertise, and strategic partner-ships provide clients with tactical ad-vice and strategic direction to identify market opportunities that enhance performance and manage risk.
CBRE/TWR is internationally rec-ognized for our solid foundation in economics, accurate forecasts, ana-lytical expertise, and providing clients with unparalleled insight into the dy-namics of the real estate market that impact performance.
William WheatonPh.D., Principal
Jon SouthardPrincipal
James CostelloPrincipal

Copyright© 2009 by Real Estate Research Corporation (RERC) and the CCIM Institute.Investment TrendsQuarterly
105
Demographics & Economics
Population Unemployment Rate
Chicago MSA 9.8 million Chicago2 9.4%
Chicago Growth1 0.98% Illinois2 9.4%
National Growth1 1.23% National3 8.6%
Household Income & Value
Per Capita Income $31,743 2008 Households 3.5 million
1-year Job Growth -1.30% Household Growth 0.94%
1-year Job Additions -59,100 Median Home Price $217,800
Major Employers
Johnston R. Bowman Health Center
U.S. Post Office
University of Chicago
Deloitte
CNA Financial Corp.Sources: Bureau of Labor Statistics, NAR, STDB Online.“2008 Local Market Report” - Chicago Region ©2008 NATIONAL ASSOCIATION OF REALTORS®. Used with permission. Reproduction, reprinting, or retransmission of this document in any form (electronic media included) is prohibited without written permission.1Projected annual growth over 5 years (2008-2013). 2Rates are non-seasonally adjusted as of March 2009. 3Rates are non-seasonally adjusted as of April 2009.
Noteworthy Transactions
Sale Date Sale Price Sq. Ft./Units PPSF/PPU
Office
2 Lincoln Center 1-09 $60,200,000 252,594 $238
FBI Regional HQ 1-09 $170,000,000 429,728 $396
Industrial
7351 S. 78th Ave. 1-09 $14,000,000 137,700 $102
948 Meridian Lake Drive 1-09 $23,400,000 595,000 $39
Retail
1925 N. Lincoln Park W 2-09 $1,600,000 13,500 $119
606 Randall Road 1-09 $20,100,000 138,212 $145
Apartment
Squire Village Apartments 2-09 $16,100,000 181 $88,950
Farcroft 1-09 $8,100,000 86 $94,186Compiled by RERC for the RERC/CCIM Investment Trends Quarterly report.
Market Construction/Redevelopment Activity
Property Type
New(N)/Refurbished(R)
Total Sq. Ft./Units
Estimated Delivery
215 W. Washington St. Multifamily N 389 2010
208 S. LaSalle Hotel R 610 2010
Preferred Freezer Services Warehouse Industrial N 175,000 2010
Park Huron Apartment Tower Multifamily N 221 2010
The Metropolis Retail N 123,000 2010Sources: CBRE, RE Business.
Chi
ca
go Metro Trend Analysis
Previous Quarter
Previous Year
Office
Size-Weighted Average PPSF
Weighted Average Cap Rate
Industrial
Size-Weighted Average PPSF =
Weighted Average Cap Rate
Retail
Size-Weighted Average PPSF
Weighted Average Cap Rate
Apartment
Size-Weighted Average PPU
Weighted Average Cap Rate
Hotel
Size-Weighted Average PPU
Metro Cap Rate Comparison* Current Quarter
Office
vs. Midwest Region =
vs. Nation
Industrial
vs. Midwest Region
vs. Nation
Retail
vs. Midwest Region
vs. Nation
Apartment
vs. Midwest Region
vs. Nation
*Comparison of current quarter weighted average capitalization rates.Source: RERC, 1Q 2009.
Revised July 1, 2009

Copyright© 2009 by Real Estate Research Corporation (RERC) and the CCIM Institute.Investment TrendsQuarterly
106
Chicago Transaction Breakdown12-Month Trailing (04/01/08 - 03/31/09)
Office Industrial Retail Apartment Hotel< $5 MillionVolume (Mil) $66 $299 $300 $91 –
Size Weighted Avg. ($ per sf/unit) $127 $50 $157 $60,652 –
Price Weighted Avg. ($ per sf/unit) $153 $70 $234 $76,346 –
Median ($ per sf/unit) $114 $62 $149 $59,355 –
> $5 MillionVolume (Mil) $1,576 $854 $619 $577 $148
Size Weighted Avg. ($ per sf/unit) $167 $47 $187 $112,247 $125,296
Price Weighted Avg. ($ per sf/unit) $202 $65 $277 $185,184 $260,990
Median ($ per sf/unit) $161 $62 $246 $87,083 $84,664
All TransactionsVolume (Mil) $1,642 $1,153 $918 $668 $160
Size Weighted Avg. ($ per sf/unit) $165 $48 $176 $100,584 $112,461
Price Weighted Avg. ($ per sf/unit) $200 $66 $263 $170,348 $245,067
Median ($ per sf/unit) $125 $62 $165 $72,619 $68,966
Capitalization Rates (All Transactions)Weighted Average (%) 8.0 7.8 7.3 6.6 –
Median (%) 8.0 7.8 7.5 6.7 –Source: RERC.
Chicago Transaction Trends12-Month Trailing (04/01/08 - 03/31/09)
Office Industrial Retail Apartment HotelMedian Price% Change Quarter Ago -6% -3% -6% -5% -24%
% Change Year Ago -17% -1% 1% 2% -36%
Volume % Change Quarter Ago -35% -22% -54% -41% -68%
% Change Year Ago -80% -60% -79% -72% -94%Source: RERC.
Revised July 1, 2009
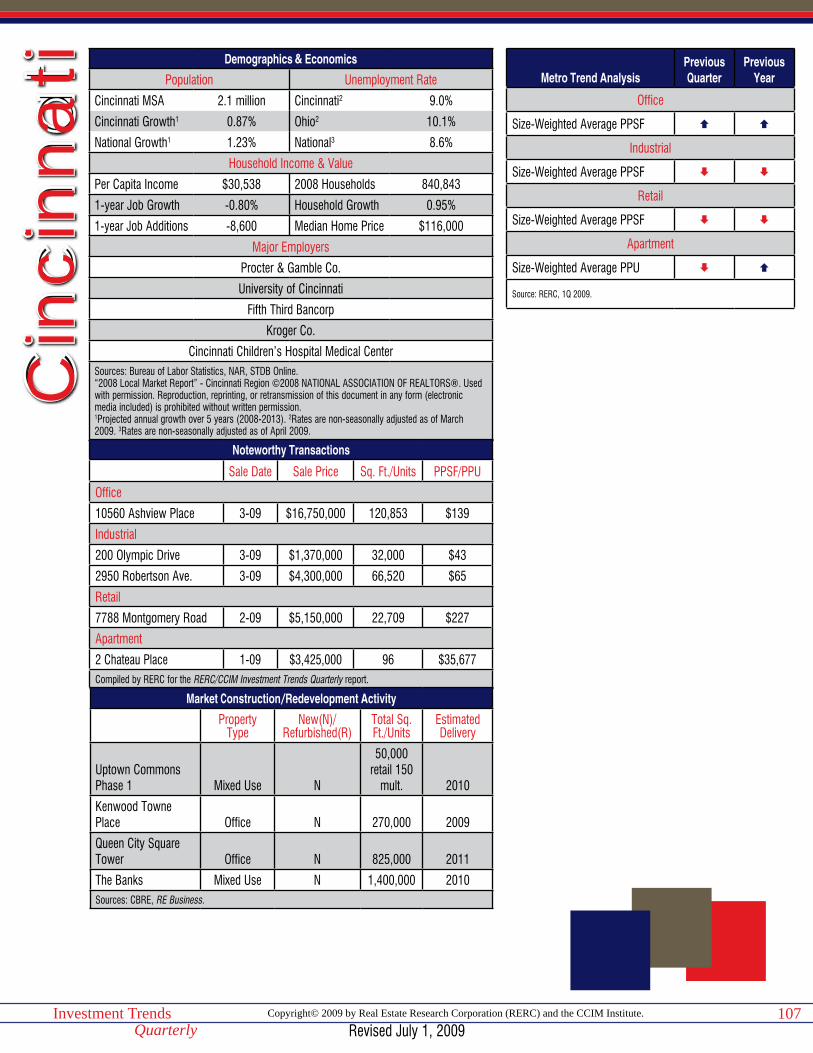
Copyright© 2009 by Real Estate Research Corporation (RERC) and the CCIM Institute.Investment TrendsQuarterly
107
Demographics & Economics
Population Unemployment Rate
Cincinnati MSA 2.1 million Cincinnati2 9.0%
Cincinnati Growth1 0.87% Ohio2 10.1%
National Growth1 1.23% National3 8.6%
Household Income & Value
Per Capita Income $30,538 2008 Households 840,843
1-year Job Growth -0.80% Household Growth 0.95%
1-year Job Additions -8,600 Median Home Price $116,000
Major Employers
Procter & Gamble Co.
University of Cincinnati
Fifth Third Bancorp
Kroger Co.
Cincinnati Children’s Hospital Medical CenterSources: Bureau of Labor Statistics, NAR, STDB Online.“2008 Local Market Report” - Cincinnati Region ©2008 NATIONAL ASSOCIATION OF REALTORS®. Used with permission. Reproduction, reprinting, or retransmission of this document in any form (electronic media included) is prohibited without written permission.1Projected annual growth over 5 years (2008-2013). 2Rates are non-seasonally adjusted as of March 2009. 3Rates are non-seasonally adjusted as of April 2009.
Noteworthy Transactions
Sale Date Sale Price Sq. Ft./Units PPSF/PPU
Office
10560 Ashview Place 3-09 $16,750,000 120,853 $139
Industrial
200 Olympic Drive 3-09 $1,370,000 32,000 $43
2950 Robertson Ave. 3-09 $4,300,000 66,520 $65
Retail
7788 Montgomery Road 2-09 $5,150,000 22,709 $227
Apartment
2 Chateau Place 1-09 $3,425,000 96 $35,677Compiled by RERC for the RERC/CCIM Investment Trends Quarterly report.
Market Construction/Redevelopment Activity
Property Type
New(N)/Refurbished(R)
Total Sq. Ft./Units
Estimated Delivery
Uptown Commons Phase 1 Mixed Use N
50,000 retail 150
mult. 2010
Kenwood Towne Place Office N 270,000 2009
Queen City Square Tower Office N 825,000 2011
The Banks Mixed Use N 1,400,000 2010Sources: CBRE, RE Business.
Cin
cin
nati Metro Trend Analysis
Previous Quarter
Previous Year
Office
Size-Weighted Average PPSF
Industrial
Size-Weighted Average PPSF
Retail
Size-Weighted Average PPSF
Apartment
Size-Weighted Average PPU
Source: RERC, 1Q 2009.
Revised July 1, 2009

Copyright© 2009 by Real Estate Research Corporation (RERC) and the CCIM Institute.Investment TrendsQuarterly
108
Cincinnati Transaction Breakdown12-Month Trailing (04/01/08 - 03/31/09)
Office Industrial Retail Apartment Hotel< $5 MillionVolume (Mil) $8 $31 $49 $25 –
Size Weighted Avg. ($ per sf/unit) $65 $34 $78 $33,380 –
Price Weighted Avg. ($ per sf/unit) $93 $43 $139 $38,921 –
Median ($ per sf/unit) $59 $42 $69 $34,792 –
> $5 MillionVolume (Mil) $99 – $151 $76 –
Size Weighted Avg. ($ per sf/unit) $110 – $76 $60,926 –
Price Weighted Avg. ($ per sf/unit) $126 – $174 $67,457 –
Median ($ per sf/unit) $114 – $182 $69,346 –
All TransactionsVolume (Mil) $107 $52 $200 $102 –
Size Weighted Avg. ($ per sf/unit) $104 $37 $76 $50,566 –
Price Weighted Avg. ($ per sf/unit) $124 $42 $166 $60,372 –
Median ($ per sf/unit) $80 $42 $81 $35,339 –
Capitalization Rates (All Transactions)Weighted Average (%) – – – – –
Median (%) – – – – –Source: RERC.
Cincinnati Transaction Trends12-Month Trailing (04/01/08 - 03/31/09)
Office Industrial Retail Apartment HotelMedian Price% Change Quarter Ago -8% 0% – -3% –
% Change Year Ago -6% -6% -23% – –
Volume % Change Quarter Ago 4% -50% – -50% –
% Change Year Ago -12% -87% -12% – –Source: RERC.
Revised July 1, 2009
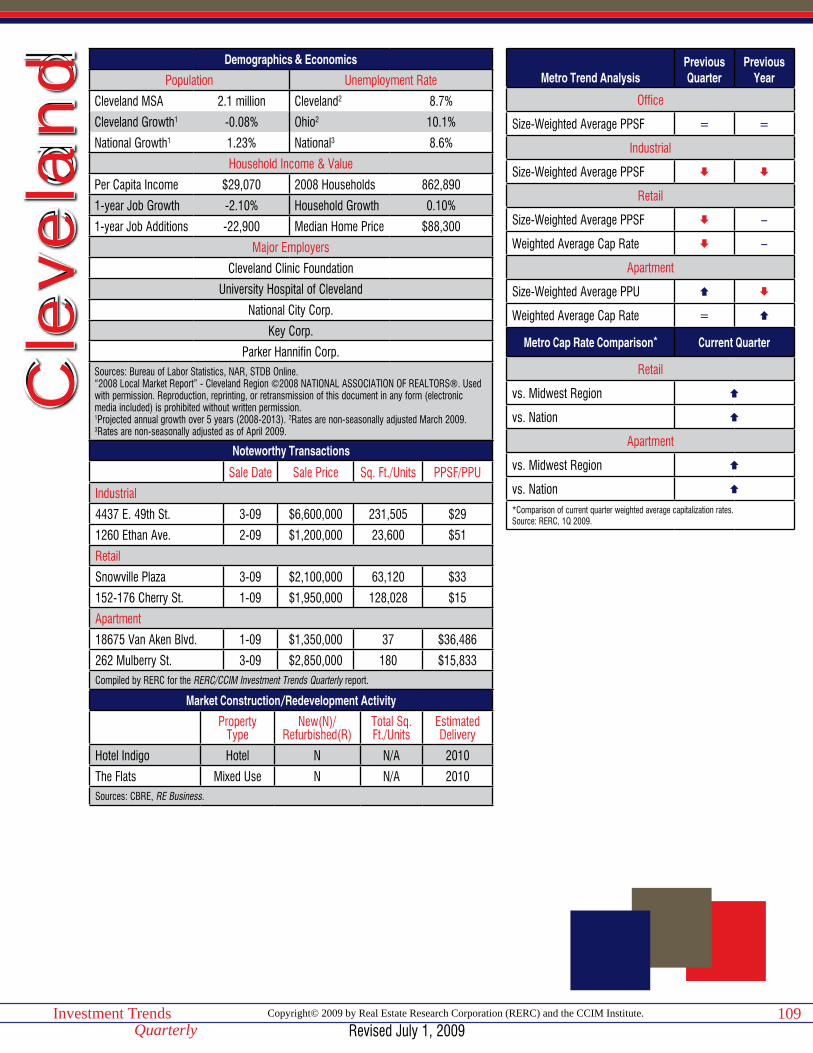
Copyright© 2009 by Real Estate Research Corporation (RERC) and the CCIM Institute.Investment TrendsQuarterly
109
Demographics & Economics
Population Unemployment Rate
Cleveland MSA 2.1 million Cleveland2 8.7%
Cleveland Growth1 -0.08% Ohio2 10.1%
National Growth1 1.23% National3 8.6%
Household Income & Value
Per Capita Income $29,070 2008 Households 862,890
1-year Job Growth -2.10% Household Growth 0.10%
1-year Job Additions -22,900 Median Home Price $88,300
Major Employers
Cleveland Clinic Foundation
University Hospital of Cleveland
National City Corp.
Key Corp.
Parker Hannifin Corp.Sources: Bureau of Labor Statistics, NAR, STDB Online.“2008 Local Market Report” - Cleveland Region ©2008 NATIONAL ASSOCIATION OF REALTORS®. Used with permission. Reproduction, reprinting, or retransmission of this document in any form (electronic media included) is prohibited without written permission.1Projected annual growth over 5 years (2008-2013). 2Rates are non-seasonally adjusted March 2009. 3Rates are non-seasonally adjusted as of April 2009.
Noteworthy Transactions
Sale Date Sale Price Sq. Ft./Units PPSF/PPU
Industrial
4437 E. 49th St. 3-09 $6,600,000 231,505 $29
1260 Ethan Ave. 2-09 $1,200,000 23,600 $51
Retail
Snowville Plaza 3-09 $2,100,000 63,120 $33
152-176 Cherry St. 1-09 $1,950,000 128,028 $15
Apartment
18675 Van Aken Blvd. 1-09 $1,350,000 37 $36,486
262 Mulberry St. 3-09 $2,850,000 180 $15,833Compiled by RERC for the RERC/CCIM Investment Trends Quarterly report.
Market Construction/Redevelopment Activity
Property Type
New(N)/Refurbished(R)
Total Sq. Ft./Units
Estimated Delivery
Hotel Indigo Hotel N N/A 2010
The Flats Mixed Use N N/A 2010Sources: CBRE, RE Business.
Cle
vela
ndMetro Trend Analysis
Previous Quarter
Previous Year
Office
Size-Weighted Average PPSF = =
Industrial
Size-Weighted Average PPSF
Retail
Size-Weighted Average PPSF –
Weighted Average Cap Rate –
Apartment
Size-Weighted Average PPU
Weighted Average Cap Rate =
Metro Cap Rate Comparison* Current Quarter
Retail
vs. Midwest Region
vs. Nation
Apartment
vs. Midwest Region
vs. Nation
*Comparison of current quarter weighted average capitalization rates.Source: RERC, 1Q 2009.
Revised July 1, 2009

Copyright© 2009 by Real Estate Research Corporation (RERC) and the CCIM Institute.Investment TrendsQuarterly
110
Cleveland Transaction Breakdown12-Month Trailing (04/01/08 - 03/31/09)
Office Industrial Retail Apartment Hotel< $5 MillionVolume (Mil) $48 $94 $75 $57 –
Size Weighted Avg. ($ per sf/unit) $66 $33 $67 $36,389 –
Price Weighted Avg. ($ per sf/unit) $89 $43 $99 $46,492 –
Median ($ per sf/unit) $73 $38 $72 $40,833 –
> $5 MillionVolume (Mil) $472 $70 $61 $76 –
Size Weighted Avg. ($ per sf/unit) $118 $51 $67 $54,024 –
Price Weighted Avg. ($ per sf/unit) $133 $57 $76 $63,853 –
Median ($ per sf/unit) $139 $63 $79 $73,726 –
All TransactionsVolume (Mil) $519 $164 $137 $134 –
Size Weighted Avg. ($ per sf/unit) $110 $39 $67 $44,702 –
Price Weighted Avg. ($ per sf/unit) $129 $49 $89 $56,382 –
Median ($ per sf/unit) $85 $39 $72 $43,056 –
Capitalization Rates (All Transactions)Weighted Average (%) – – 8.1 7.6 –
Median (%) – – 8.3 7.0 –Source: RERC.
Cleveland Transaction Trends12-Month Trailing (04/01/08 - 03/31/09)
Office Industrial Retail Apartment HotelMedian Price% Change Quarter Ago 0% -9% -3% -1% –
% Change Year Ago 1% -6% -11% 12% –
Volume % Change Quarter Ago -25% -24% -18% -19% –
% Change Year Ago -31% -63% -50% -47% –Source: RERC.
Revised July 1, 2009
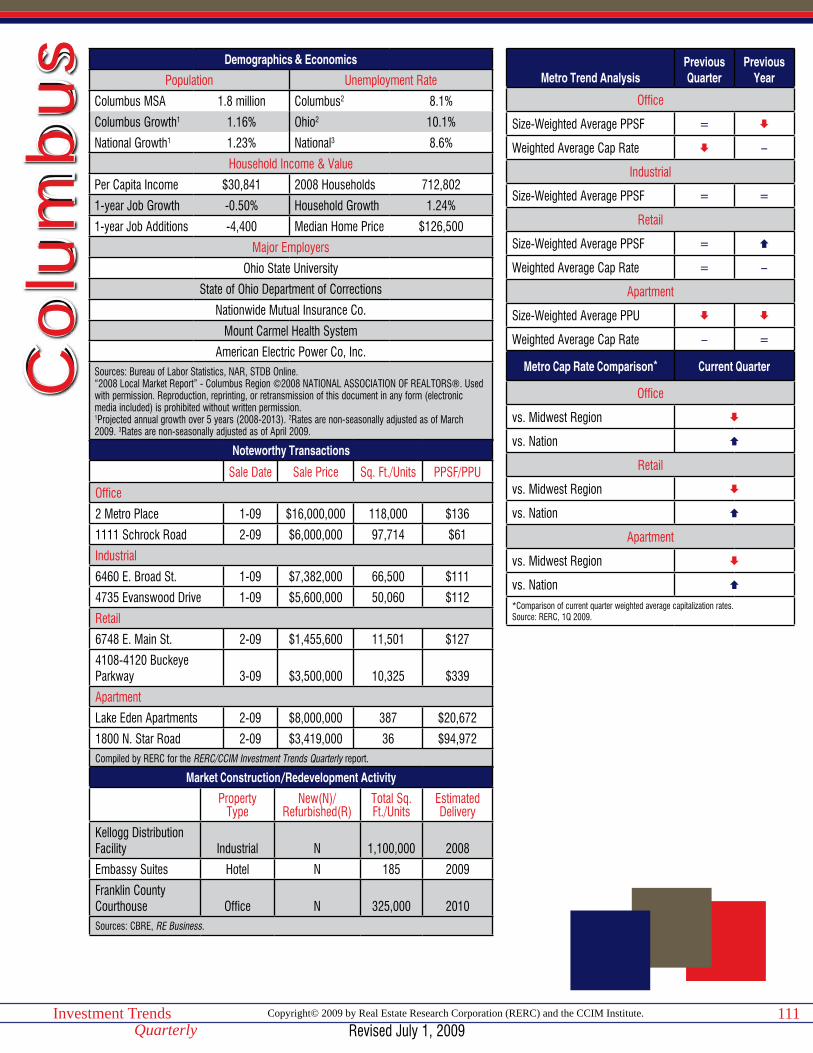
Copyright© 2009 by Real Estate Research Corporation (RERC) and the CCIM Institute.Investment TrendsQuarterly
111
Demographics & Economics
Population Unemployment Rate
Columbus MSA 1.8 million Columbus2 8.1%
Columbus Growth1 1.16% Ohio2 10.1%
National Growth1 1.23% National3 8.6%
Household Income & Value
Per Capita Income $30,841 2008 Households 712,802
1-year Job Growth -0.50% Household Growth 1.24%
1-year Job Additions -4,400 Median Home Price $126,500
Major Employers
Ohio State University
State of Ohio Department of Corrections
Nationwide Mutual Insurance Co.
Mount Carmel Health System
American Electric Power Co, Inc.Sources: Bureau of Labor Statistics, NAR, STDB Online.“2008 Local Market Report” - Columbus Region ©2008 NATIONAL ASSOCIATION OF REALTORS®. Used with permission. Reproduction, reprinting, or retransmission of this document in any form (electronic media included) is prohibited without written permission.1Projected annual growth over 5 years (2008-2013). 2Rates are non-seasonally adjusted as of March 2009. 3Rates are non-seasonally adjusted as of April 2009.
Noteworthy Transactions
Sale Date Sale Price Sq. Ft./Units PPSF/PPU
Office
2 Metro Place 1-09 $16,000,000 118,000 $136
1111 Schrock Road 2-09 $6,000,000 97,714 $61
Industrial
6460 E. Broad St. 1-09 $7,382,000 66,500 $111
4735 Evanswood Drive 1-09 $5,600,000 50,060 $112
Retail
6748 E. Main St. 2-09 $1,455,600 11,501 $127
4108-4120 Buckeye Parkway 3-09 $3,500,000 10,325 $339
Apartment
Lake Eden Apartments 2-09 $8,000,000 387 $20,672
1800 N. Star Road 2-09 $3,419,000 36 $94,972Compiled by RERC for the RERC/CCIM Investment Trends Quarterly report.
Market Construction/Redevelopment Activity
Property Type
New(N)/Refurbished(R)
Total Sq. Ft./Units
Estimated Delivery
Kellogg Distribution Facility Industrial N 1,100,000 2008
Embassy Suites Hotel N 185 2009
Franklin County Courthouse Office N 325,000 2010Sources: CBRE, RE Business.
Co
lum
bus Metro Trend Analysis
Previous Quarter
Previous Year
Office
Size-Weighted Average PPSF =
Weighted Average Cap Rate –
Industrial
Size-Weighted Average PPSF = =
Retail
Size-Weighted Average PPSF =
Weighted Average Cap Rate = –
Apartment
Size-Weighted Average PPU
Weighted Average Cap Rate – =
Metro Cap Rate Comparison* Current Quarter
Office
vs. Midwest Region
vs. Nation
Retail
vs. Midwest Region
vs. Nation
Apartment
vs. Midwest Region
vs. Nation
*Comparison of current quarter weighted average capitalization rates.Source: RERC, 1Q 2009.
Revised July 1, 2009

Copyright© 2009 by Real Estate Research Corporation (RERC) and the CCIM Institute.Investment TrendsQuarterly
112
Columbus Transaction Breakdown12-Month Trailing (04/01/08 - 03/31/09)
Office Industrial Retail Apartment Hotel< $5 MillionVolume (Mil) $60 $66 $45 $35 –
Size Weighted Avg. ($ per sf/unit) $86 $33 $121 $35,312 –
Price Weighted Avg. ($ per sf/unit) $107 $39 $188 $46,993 –
Median ($ per sf/unit) $102 $40 $121 $32,500 –
> $5 MillionVolume (Mil) $78 $141 $83 $120 –
Size Weighted Avg. ($ per sf/unit) $93 $44 $161 $51,437 –
Price Weighted Avg. ($ per sf/unit) $109 $50 $231 $57,368 –
Median ($ per sf/unit) $102 $50 $211 $57,028 –
All TransactionsVolume (Mil) $137 $207 $127 $156 –
Size Weighted Avg. ($ per sf/unit) $89 $40 $144 $46,602 –
Price Weighted Avg. ($ per sf/unit) $108 $47 $216 $55,011 –
Median ($ per sf/unit) $102 $43 $127 $33,712 –
Capitalization Rates (All Transactions)Weighted Average (%) 7.2 – 7.4 6.8 –
Median (%) 7.5 – 7.5 6.7 –Source: RERC.
Columbus Transaction Trends12-Month Trailing (04/01/08 - 03/31/09)
Office Industrial Retail Apartment HotelMedian Price% Change Quarter Ago -3% -2% 3% -47% –
% Change Year Ago -8% 5% – -18% –
Volume % Change Quarter Ago -13% -12% -8% -68% –
% Change Year Ago -63% -22% – -76% –Source: RERC.
Revised July 1, 2009
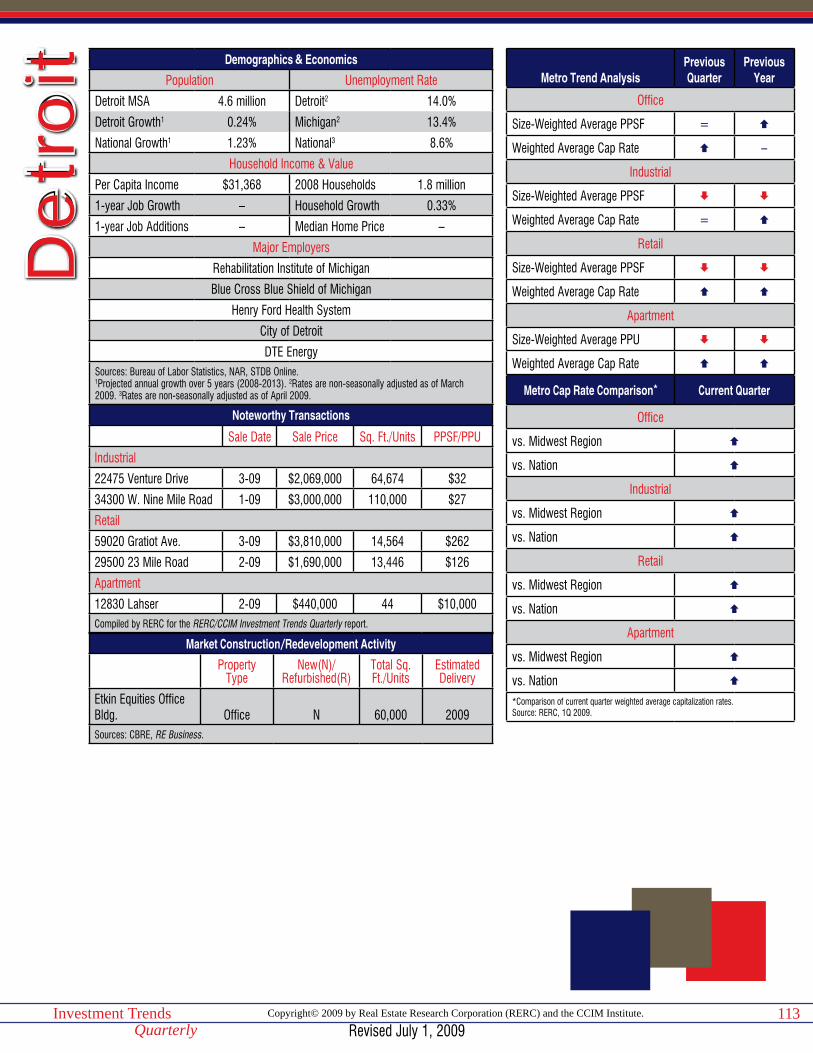
Copyright© 2009 by Real Estate Research Corporation (RERC) and the CCIM Institute.Investment TrendsQuarterly
113
Demographics & Economics
Population Unemployment Rate
Detroit MSA 4.6 million Detroit2 14.0%
Detroit Growth1 0.24% Michigan2 13.4%
National Growth1 1.23% National3 8.6%
Household Income & Value
Per Capita Income $31,368 2008 Households 1.8 million
1-year Job Growth – Household Growth 0.33%
1-year Job Additions – Median Home Price –
Major Employers
Rehabilitation Institute of Michigan
Blue Cross Blue Shield of Michigan
Henry Ford Health System
City of Detroit
DTE EnergySources: Bureau of Labor Statistics, NAR, STDB Online.1Projected annual growth over 5 years (2008-2013). 2Rates are non-seasonally adjusted as of March 2009. 3Rates are non-seasonally adjusted as of April 2009.
Noteworthy Transactions
Sale Date Sale Price Sq. Ft./Units PPSF/PPU
Industrial
22475 Venture Drive 3-09 $2,069,000 64,674 $32
34300 W. Nine Mile Road 1-09 $3,000,000 110,000 $27
Retail
59020 Gratiot Ave. 3-09 $3,810,000 14,564 $262
29500 23 Mile Road 2-09 $1,690,000 13,446 $126
Apartment
12830 Lahser 2-09 $440,000 44 $10,000Compiled by RERC for the RERC/CCIM Investment Trends Quarterly report.
Market Construction/Redevelopment Activity
Property Type
New(N)/Refurbished(R)
Total Sq. Ft./Units
Estimated Delivery
Etkin Equities Office Bldg. Office N 60,000 2009Sources: CBRE, RE Business.
De
tro
it Metro Trend AnalysisPrevious Quarter
Previous Year
Office
Size-Weighted Average PPSF =
Weighted Average Cap Rate –
Industrial
Size-Weighted Average PPSF
Weighted Average Cap Rate =
Retail
Size-Weighted Average PPSF
Weighted Average Cap Rate
Apartment
Size-Weighted Average PPU
Weighted Average Cap Rate
Metro Cap Rate Comparison* Current Quarter
Office
vs. Midwest Region
vs. Nation
Industrial
vs. Midwest Region
vs. Nation
Retail
vs. Midwest Region
vs. Nation
Apartment
vs. Midwest Region
vs. Nation
*Comparison of current quarter weighted average capitalization rates.Source: RERC, 1Q 2009.
Revised July 1, 2009

Copyright© 2009 by Real Estate Research Corporation (RERC) and the CCIM Institute.Investment TrendsQuarterly
114
Detroit Transaction Breakdown12-Month Trailing (04/01/08 - 03/31/09)
Office Industrial Retail Apartment Hotel< $5 MillionVolume (Mil) $26 $73 $62 $17 –
Size Weighted Avg. ($ per sf/unit) $69 $35 $112 $24,431 –
Price Weighted Avg. ($ per sf/unit) $109 $53 $209 $29,699 –
Median ($ per sf/unit) $109 $43 $112 $35,188 –
> $5 MillionVolume (Mil) $671 $42 $57 $120 –
Size Weighted Avg. ($ per sf/unit) $114 $41 $57 $58,891 –
Price Weighted Avg. ($ per sf/unit) $116 $87 $61 $71,306 –
Median ($ per sf/unit) $150 $61 $71 $68,750 –
All TransactionsVolume (Mil) $697 $115 $120 $137 –
Size Weighted Avg. ($ per sf/unit) $111 $37 $76 $50,002 –
Price Weighted Avg. ($ per sf/unit) $116 $66 $138 $66,062 –
Median ($ per sf/unit) $115 $43 $107 $38,099 –
Capitalization Rates (All Transactions)Weighted Average (%) 8.7 10.8 9.2 8.0 –
Median (%) 8.7 10.7 8.8 7.6 –Source: RERC.
Detroit Transaction Trends12-Month Trailing (04/01/08 - 03/31/09)
Office Industrial Retail Apartment HotelMedian Price% Change Quarter Ago 0% -12% – -17% –
% Change Year Ago 9% -16% -4% -11% –
Volume % Change Quarter Ago -4% -12% – -53% –
% Change Year Ago 13% -78% -65% -70% –Source: RERC.
Revised July 1, 2009
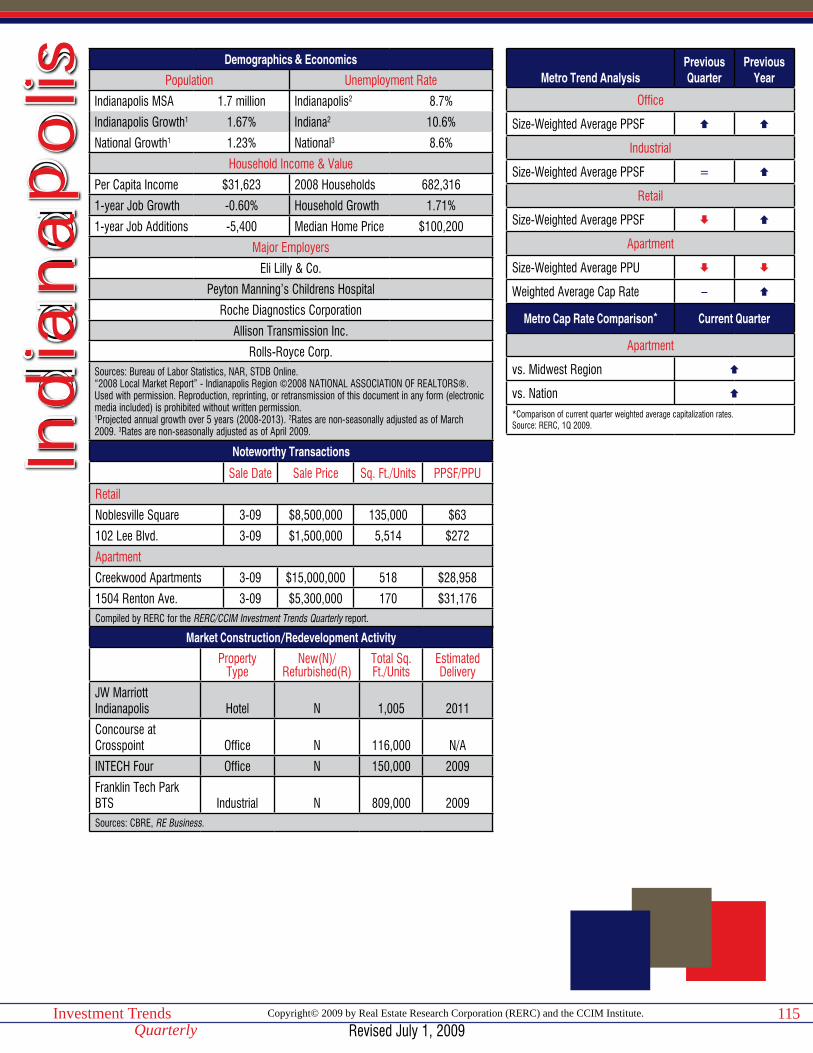
Copyright© 2009 by Real Estate Research Corporation (RERC) and the CCIM Institute.Investment TrendsQuarterly
115
Demographics & Economics
Population Unemployment Rate
Indianapolis MSA 1.7 million Indianapolis2 8.7%
Indianapolis Growth1 1.67% Indiana2 10.6%
National Growth1 1.23% National3 8.6%
Household Income & Value
Per Capita Income $31,623 2008 Households 682,316
1-year Job Growth -0.60% Household Growth 1.71%
1-year Job Additions -5,400 Median Home Price $100,200
Major Employers
Eli Lilly & Co.
Peyton Manning’s Childrens Hospital
Roche Diagnostics Corporation
Allison Transmission Inc.
Rolls-Royce Corp.Sources: Bureau of Labor Statistics, NAR, STDB Online.“2008 Local Market Report” - Indianapolis Region ©2008 NATIONAL ASSOCIATION OF REALTORS®. Used with permission. Reproduction, reprinting, or retransmission of this document in any form (electronic media included) is prohibited without written permission.1Projected annual growth over 5 years (2008-2013). 2Rates are non-seasonally adjusted as of March 2009. 3Rates are non-seasonally adjusted as of April 2009.
Noteworthy Transactions
Sale Date Sale Price Sq. Ft./Units PPSF/PPU
Retail
Noblesville Square 3-09 $8,500,000 135,000 $63
102 Lee Blvd. 3-09 $1,500,000 5,514 $272
Apartment
Creekwood Apartments 3-09 $15,000,000 518 $28,958
1504 Renton Ave. 3-09 $5,300,000 170 $31,176Compiled by RERC for the RERC/CCIM Investment Trends Quarterly report.
Market Construction/Redevelopment Activity
Property Type
New(N)/Refurbished(R)
Total Sq. Ft./Units
Estimated Delivery
JW MarriottIndianapolis Hotel N 1,005 2011
Concourse at Crosspoint Office N 116,000 N/A
INTECH Four Office N 150,000 2009
Franklin Tech Park BTS Industrial N 809,000 2009Sources: CBRE, RE Business.
Ind
iana
po
lis Metro Trend AnalysisPrevious Quarter
Previous Year
Office
Size-Weighted Average PPSF
Industrial
Size-Weighted Average PPSF =
Retail
Size-Weighted Average PPSF
Apartment
Size-Weighted Average PPU
Weighted Average Cap Rate –
Metro Cap Rate Comparison* Current Quarter
Apartment
vs. Midwest Region
vs. Nation
*Comparison of current quarter weighted average capitalization rates.Source: RERC, 1Q 2009.
Revised July 1, 2009
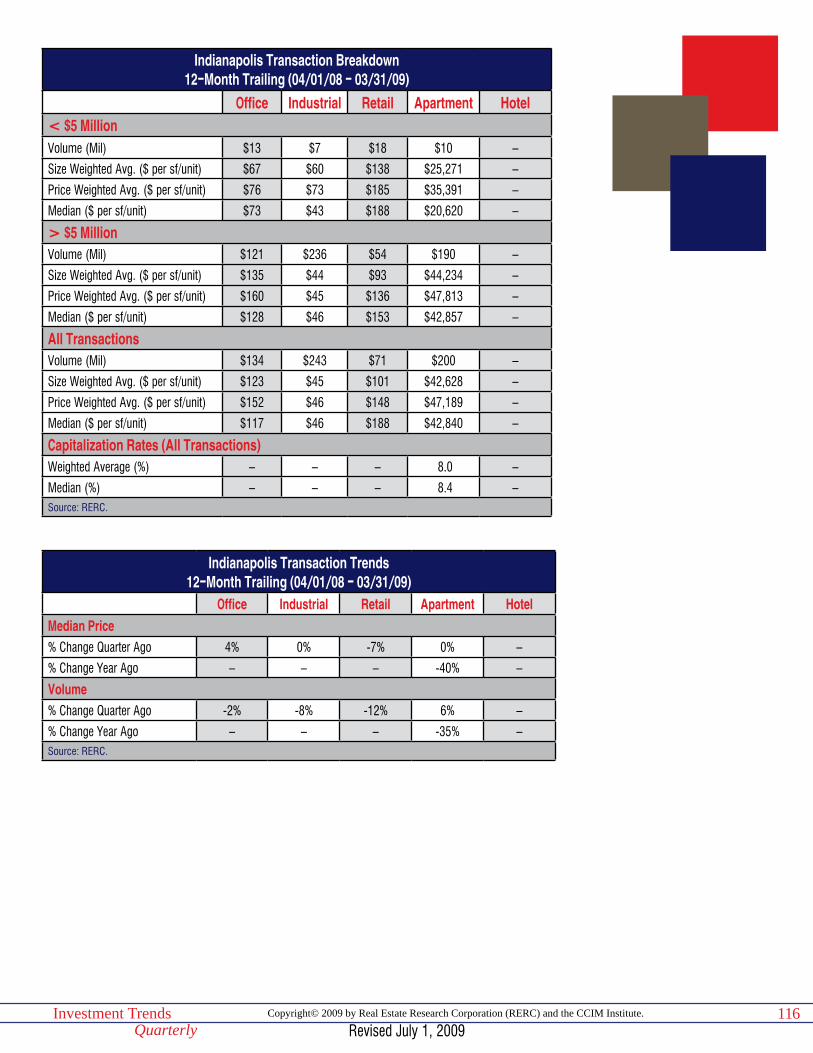
Copyright© 2009 by Real Estate Research Corporation (RERC) and the CCIM Institute.Investment TrendsQuarterly
116
Indianapolis Transaction Breakdown12-Month Trailing (04/01/08 - 03/31/09)
Office Industrial Retail Apartment Hotel< $5 MillionVolume (Mil) $13 $7 $18 $10 –
Size Weighted Avg. ($ per sf/unit) $67 $60 $138 $25,271 –
Price Weighted Avg. ($ per sf/unit) $76 $73 $185 $35,391 –
Median ($ per sf/unit) $73 $43 $188 $20,620 –
> $5 MillionVolume (Mil) $121 $236 $54 $190 –
Size Weighted Avg. ($ per sf/unit) $135 $44 $93 $44,234 –
Price Weighted Avg. ($ per sf/unit) $160 $45 $136 $47,813 –
Median ($ per sf/unit) $128 $46 $153 $42,857 –
All TransactionsVolume (Mil) $134 $243 $71 $200 –
Size Weighted Avg. ($ per sf/unit) $123 $45 $101 $42,628 –
Price Weighted Avg. ($ per sf/unit) $152 $46 $148 $47,189 –
Median ($ per sf/unit) $117 $46 $188 $42,840 –
Capitalization Rates (All Transactions)Weighted Average (%) – – – 8.0 –
Median (%) – – – 8.4 –Source: RERC.
Indianapolis Transaction Trends12-Month Trailing (04/01/08 - 03/31/09)
Office Industrial Retail Apartment HotelMedian Price% Change Quarter Ago 4% 0% -7% 0% –
% Change Year Ago – – – -40% –
Volume % Change Quarter Ago -2% -8% -12% 6% –
% Change Year Ago – – – -35% –Source: RERC.
Revised July 1, 2009
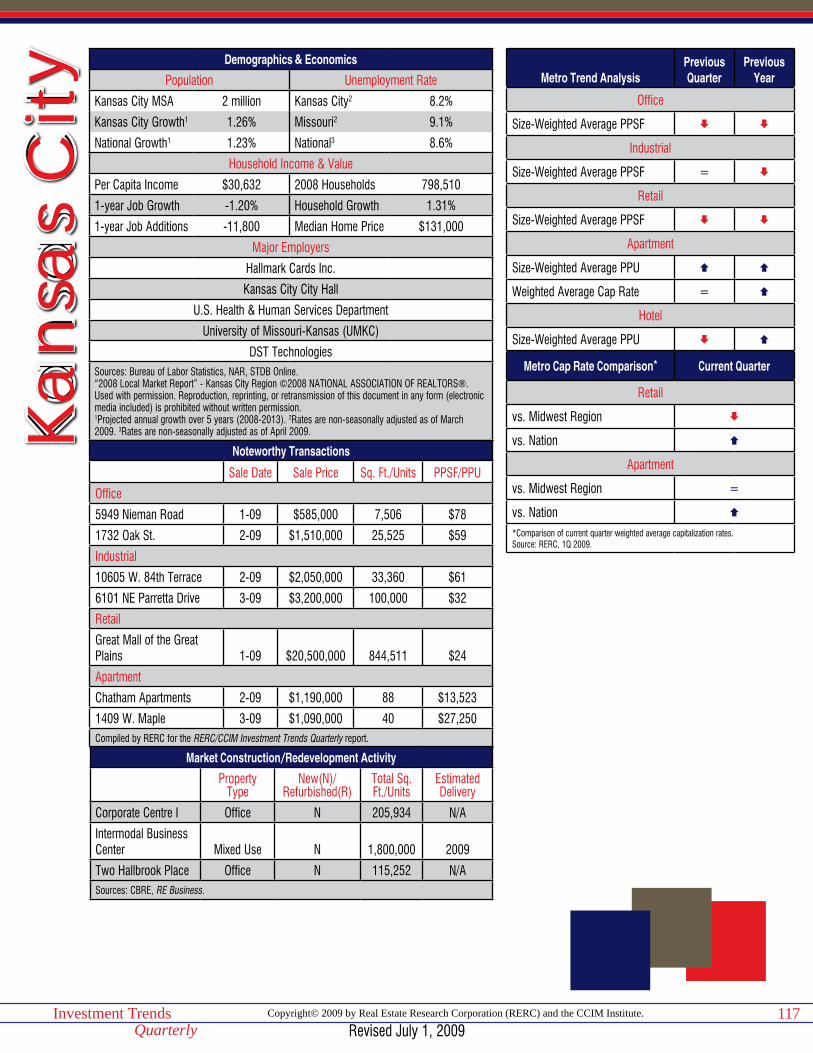
Copyright© 2009 by Real Estate Research Corporation (RERC) and the CCIM Institute.Investment TrendsQuarterly
117
Demographics & Economics
Population Unemployment Rate
Kansas City MSA 2 million Kansas City2 8.2%
Kansas City Growth1 1.26% Missouri2 9.1%
National Growth1 1.23% National3 8.6%
Household Income & Value
Per Capita Income $30,632 2008 Households 798,510
1-year Job Growth -1.20% Household Growth 1.31%
1-year Job Additions -11,800 Median Home Price $131,000
Major Employers
Hallmark Cards Inc.
Kansas City City Hall
U.S. Health & Human Services Department
University of Missouri-Kansas (UMKC)
DST TechnologiesSources: Bureau of Labor Statistics, NAR, STDB Online.“2008 Local Market Report” - Kansas City Region ©2008 NATIONAL ASSOCIATION OF REALTORS®. Used with permission. Reproduction, reprinting, or retransmission of this document in any form (electronic media included) is prohibited without written permission.1Projected annual growth over 5 years (2008-2013). 2Rates are non-seasonally adjusted as of March 2009. 3Rates are non-seasonally adjusted as of April 2009.
Noteworthy Transactions
Sale Date Sale Price Sq. Ft./Units PPSF/PPU
Office
5949 Nieman Road 1-09 $585,000 7,506 $78
1732 Oak St. 2-09 $1,510,000 25,525 $59
Industrial
10605 W. 84th Terrace 2-09 $2,050,000 33,360 $61
6101 NE Parretta Drive 3-09 $3,200,000 100,000 $32
Retail
Great Mall of the Great Plains 1-09 $20,500,000 844,511 $24
Apartment
Chatham Apartments 2-09 $1,190,000 88 $13,523
1409 W. Maple 3-09 $1,090,000 40 $27,250Compiled by RERC for the RERC/CCIM Investment Trends Quarterly report.
Market Construction/Redevelopment Activity
Property Type
New(N)/Refurbished(R)
Total Sq. Ft./Units
Estimated Delivery
Corporate Centre I Office N 205,934 N/A
Intermodal Business Center Mixed Use N 1,800,000 2009
Two Hallbrook Place Office N 115,252 N/ASources: CBRE, RE Business.
Kans
as
City Metro Trend Analysis
Previous Quarter
Previous Year
Office
Size-Weighted Average PPSF
Industrial
Size-Weighted Average PPSF =
Retail
Size-Weighted Average PPSF
Apartment
Size-Weighted Average PPU
Weighted Average Cap Rate =
Hotel
Size-Weighted Average PPU
Metro Cap Rate Comparison* Current Quarter
Retail
vs. Midwest Region
vs. Nation
Apartment
vs. Midwest Region =
vs. Nation
*Comparison of current quarter weighted average capitalization rates.Source: RERC, 1Q 2009.
Revised July 1, 2009

Copyright© 2009 by Real Estate Research Corporation (RERC) and the CCIM Institute.Investment TrendsQuarterly
118
Kansas City Transaction Breakdown12-Month Trailing (04/01/08 - 03/31/09)
Office Industrial Retail Apartment Hotel< $5 MillionVolume (Mil) $29 $64 $110 $30 –
Size Weighted Avg. ($ per sf/unit) $78 $39 $68 $34,523 –
Price Weighted Avg. ($ per sf/unit) $98 $56 $138 $38,605 –
Median ($ per sf/unit) $76 $46 $61 $30,208 –
> $5 MillionVolume (Mil) $213 $54 $186 $124 $119
Size Weighted Avg. ($ per sf/unit) $113 $41 $75 $81,201 $117,667
Price Weighted Avg. ($ per sf/unit) $153 $43 $232 $93,182 $141,858
Median ($ per sf/unit) $116 $45 $196 $85,402 $121,042
All TransactionsVolume (Mil) $242 $119 $296 $154 $123
Size Weighted Avg. ($ per sf/unit) $107 $40 $73 $64,217 $107,610
Price Weighted Avg. ($ per sf/unit) $146 $50 $197 $82,506 $138,547
Median ($ per sf/unit) $83 $45 $65 $34,083 $88,436
Capitalization Rates (All Transactions)Weighted Average (%) – – 7.4 7.2 –
Median (%) – – 7.5 7.9 –Source: RERC.
Kansas City Transaction Trends12-Month Trailing (04/01/08 - 03/31/09)
Office Industrial Retail Apartment HotelMedian Price% Change Quarter Ago -28% -1% -14% 0% -4%
% Change Year Ago -31% -15% -32% -10% 4%
Volume % Change Quarter Ago -37% -5% -12% -22% -9%
% Change Year Ago -69% -60% -32% -44% -59%Source: RERC.
Revised July 1, 2009
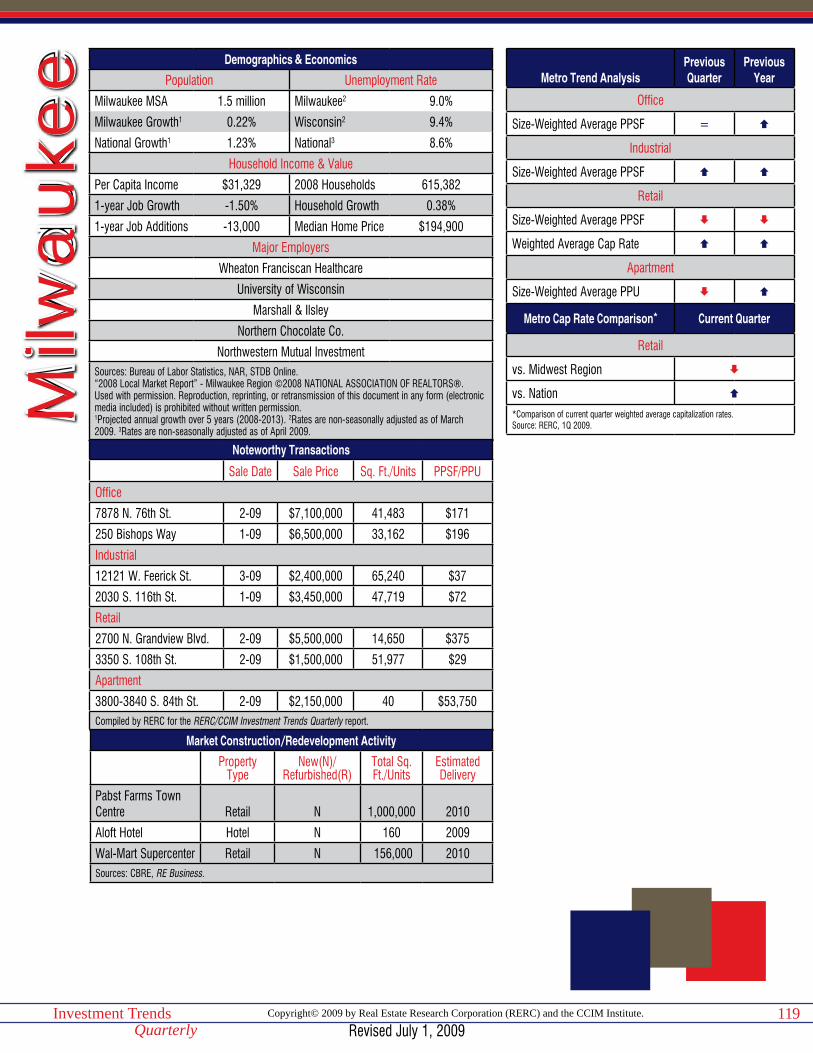
Copyright© 2009 by Real Estate Research Corporation (RERC) and the CCIM Institute.Investment TrendsQuarterly
119
Demographics & Economics
Population Unemployment Rate
Milwaukee MSA 1.5 million Milwaukee2 9.0%
Milwaukee Growth1 0.22% Wisconsin2 9.4%
National Growth1 1.23% National3 8.6%
Household Income & Value
Per Capita Income $31,329 2008 Households 615,382
1-year Job Growth -1.50% Household Growth 0.38%
1-year Job Additions -13,000 Median Home Price $194,900
Major Employers
Wheaton Franciscan Healthcare
University of Wisconsin
Marshall & Ilsley
Northern Chocolate Co.
Northwestern Mutual InvestmentSources: Bureau of Labor Statistics, NAR, STDB Online.“2008 Local Market Report” - Milwaukee Region ©2008 NATIONAL ASSOCIATION OF REALTORS®. Used with permission. Reproduction, reprinting, or retransmission of this document in any form (electronic media included) is prohibited without written permission.1Projected annual growth over 5 years (2008-2013). 2Rates are non-seasonally adjusted as of March 2009. 3Rates are non-seasonally adjusted as of April 2009.
Noteworthy Transactions
Sale Date Sale Price Sq. Ft./Units PPSF/PPU
Office
7878 N. 76th St. 2-09 $7,100,000 41,483 $171
250 Bishops Way 1-09 $6,500,000 33,162 $196
Industrial
12121 W. Feerick St. 3-09 $2,400,000 65,240 $37
2030 S. 116th St. 1-09 $3,450,000 47,719 $72
Retail
2700 N. Grandview Blvd. 2-09 $5,500,000 14,650 $375
3350 S. 108th St. 2-09 $1,500,000 51,977 $29
Apartment
3800-3840 S. 84th St. 2-09 $2,150,000 40 $53,750Compiled by RERC for the RERC/CCIM Investment Trends Quarterly report.
Market Construction/Redevelopment Activity
Property Type
New(N)/Refurbished(R)
Total Sq. Ft./Units
Estimated Delivery
Pabst Farms Town Centre Retail N 1,000,000 2010
Aloft Hotel Hotel N 160 2009
Wal-Mart Supercenter Retail N 156,000 2010Sources: CBRE, RE Business.
Milw
auk
ee Metro Trend Analysis
Previous Quarter
Previous Year
Office
Size-Weighted Average PPSF =
Industrial
Size-Weighted Average PPSF
Retail
Size-Weighted Average PPSF
Weighted Average Cap Rate
Apartment
Size-Weighted Average PPU
Metro Cap Rate Comparison* Current Quarter
Retail
vs. Midwest Region
vs. Nation
*Comparison of current quarter weighted average capitalization rates.Source: RERC, 1Q 2009.
Revised July 1, 2009

Copyright© 2009 by Real Estate Research Corporation (RERC) and the CCIM Institute.Investment TrendsQuarterly
120
Milwaukee Transaction Breakdown12-Month Trailing (04/01/08 - 03/31/09)
Office Industrial Retail Apartment Hotel< $5 MillionVolume (Mil) $35 $63 $44 $29 –
Size Weighted Avg. ($ per sf/unit) $81 $50 $76 $47,987 –
Price Weighted Avg. ($ per sf/unit) $119 $64 $150 $54,306 –
Median ($ per sf/unit) $69 $56 $65 $48,675 –
> $5 MillionVolume (Mil) $139 $48 $47 – –
Size Weighted Avg. ($ per sf/unit) $143 $61 $199 – –
Price Weighted Avg. ($ per sf/unit) $146 $71 $216 – –
Median ($ per sf/unit) $153 $54 $207 – –
All TransactionsVolume (Mil) $174 $111 $91 $84 –
Size Weighted Avg. ($ per sf/unit) $124 $54 $111 $80,543 –
Price Weighted Avg. ($ per sf/unit) $140 $67 $184 $134,135 –
Median ($ per sf/unit) $83 $54 $73 $52,340 –
Capitalization Rates (All Transactions)Weighted Average (%) – – 7.5 – –
Median (%) – – 7.3 – –Source: RERC.
Milwaukee Transaction Trends12-Month Trailing (04/01/08 - 03/31/09)
Office Industrial Retail Apartment HotelMedian Price% Change Quarter Ago 12% -7% -1% -4% –
% Change Year Ago -5% 15% -12% 0% –
Volume % Change Quarter Ago 4% -7% -13% 18% –
% Change Year Ago -58% -61% -57% -57% –Source: RERC.
Revised July 1, 2009
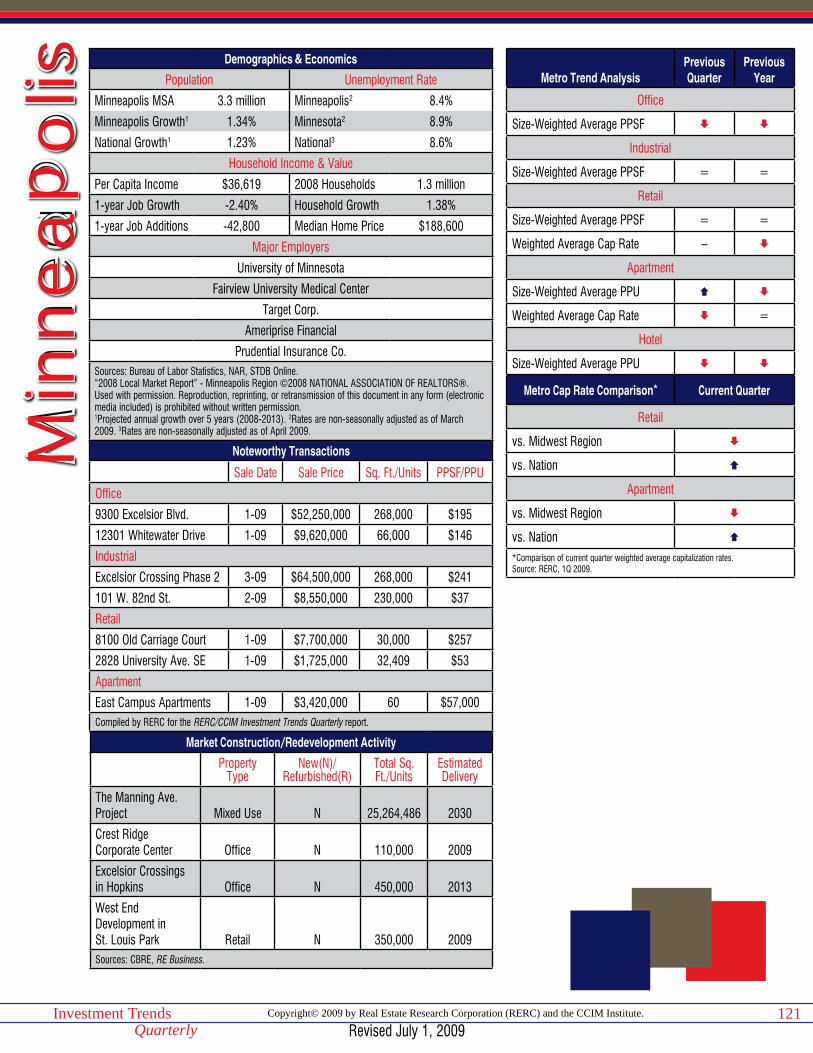
Copyright© 2009 by Real Estate Research Corporation (RERC) and the CCIM Institute.Investment TrendsQuarterly
121
Demographics & Economics
Population Unemployment Rate
Minneapolis MSA 3.3 million Minneapolis2 8.4%
Minneapolis Growth1 1.34% Minnesota2 8.9%
National Growth1 1.23% National3 8.6%
Household Income & Value
Per Capita Income $36,619 2008 Households 1.3 million
1-year Job Growth -2.40% Household Growth 1.38%
1-year Job Additions -42,800 Median Home Price $188,600
Major Employers
University of Minnesota
Fairview University Medical Center
Target Corp.
Ameriprise Financial
Prudential Insurance Co.Sources: Bureau of Labor Statistics, NAR, STDB Online.“2008 Local Market Report” - Minneapolis Region ©2008 NATIONAL ASSOCIATION OF REALTORS®. Used with permission. Reproduction, reprinting, or retransmission of this document in any form (electronic media included) is prohibited without written permission.1Projected annual growth over 5 years (2008-2013). 2Rates are non-seasonally adjusted as of March 2009. 3Rates are non-seasonally adjusted as of April 2009.
Noteworthy Transactions
Sale Date Sale Price Sq. Ft./Units PPSF/PPU
Office
9300 Excelsior Blvd. 1-09 $52,250,000 268,000 $195
12301 Whitewater Drive 1-09 $9,620,000 66,000 $146
Industrial
Excelsior Crossing Phase 2 3-09 $64,500,000 268,000 $241
101 W. 82nd St. 2-09 $8,550,000 230,000 $37
Retail
8100 Old Carriage Court 1-09 $7,700,000 30,000 $257
2828 University Ave. SE 1-09 $1,725,000 32,409 $53
Apartment
East Campus Apartments 1-09 $3,420,000 60 $57,000Compiled by RERC for the RERC/CCIM Investment Trends Quarterly report.
Market Construction/Redevelopment Activity
Property Type
New(N)/Refurbished(R)
Total Sq. Ft./Units
Estimated Delivery
The Manning Ave. Project Mixed Use N 25,264,486 2030
Crest RidgeCorporate Center Office N 110,000 2009
Excelsior Crossings in Hopkins Office N 450,000 2013
West EndDevelopment inSt. Louis Park Retail N 350,000 2009Sources: CBRE, RE Business.
Min
nea
po
lis Metro Trend AnalysisPrevious Quarter
Previous Year
Office
Size-Weighted Average PPSF
Industrial
Size-Weighted Average PPSF = =
Retail
Size-Weighted Average PPSF = =
Weighted Average Cap Rate –
Apartment
Size-Weighted Average PPU
Weighted Average Cap Rate =
Hotel
Size-Weighted Average PPU
Metro Cap Rate Comparison* Current Quarter
Retail
vs. Midwest Region
vs. Nation
Apartment
vs. Midwest Region
vs. Nation
*Comparison of current quarter weighted average capitalization rates.Source: RERC, 1Q 2009.
Revised July 1, 2009

Copyright© 2009 by Real Estate Research Corporation (RERC) and the CCIM Institute.Investment TrendsQuarterly
122
Minneapolis Transaction Breakdown12-Month Trailing (04/01/08 - 03/31/09)
Office Industrial Retail Apartment Hotel< $5 MillionVolume (Mil) $50 $122 $111 $57 –
Size Weighted Avg. ($ per sf/unit) $94 $49 $94 $54,036 –
Price Weighted Avg. ($ per sf/unit) $137 $69 $150 $57,262 –
Median ($ per sf/unit) $95 $56 $105 $57,778 –
> $5 MillionVolume (Mil) $219 $191 $144 $330 –
Size Weighted Avg. ($ per sf/unit) $92 $68 $142 $75,539 –
Price Weighted Avg. ($ per sf/unit) $154 $118 $166 $93,304 –
Median ($ per sf/unit) $91 $58 $157 $72,897 –
All TransactionsVolume (Mil) $269 $313 $256 $386 $30
Size Weighted Avg. ($ per sf/unit) $93 $59 $116 $71,374 $45,625
Price Weighted Avg. ($ per sf/unit) $151 $99 $159 $88,018 $48,802
Median ($ per sf/unit) $93 $56 $109 $62,228 $51,577
Capitalization Rates (All Transactions)Weighted Average (%) – – 7.3 6.5 –
Median (%) – – 7.2 6.5 –Source: RERC.
Minneapolis Transaction Trends12-Month Trailing (04/01/08 - 03/31/09)
Office Industrial Retail Apartment HotelMedian Price% Change Quarter Ago -26% 0% 2% 0% -1%
% Change Year Ago -27% -4% – -5% -18%
Volume % Change Quarter Ago -54% -20% -10% 0% -30%
% Change Year Ago -87% -42% – 7% -85%Source: RERC.
Revised July 1, 2009
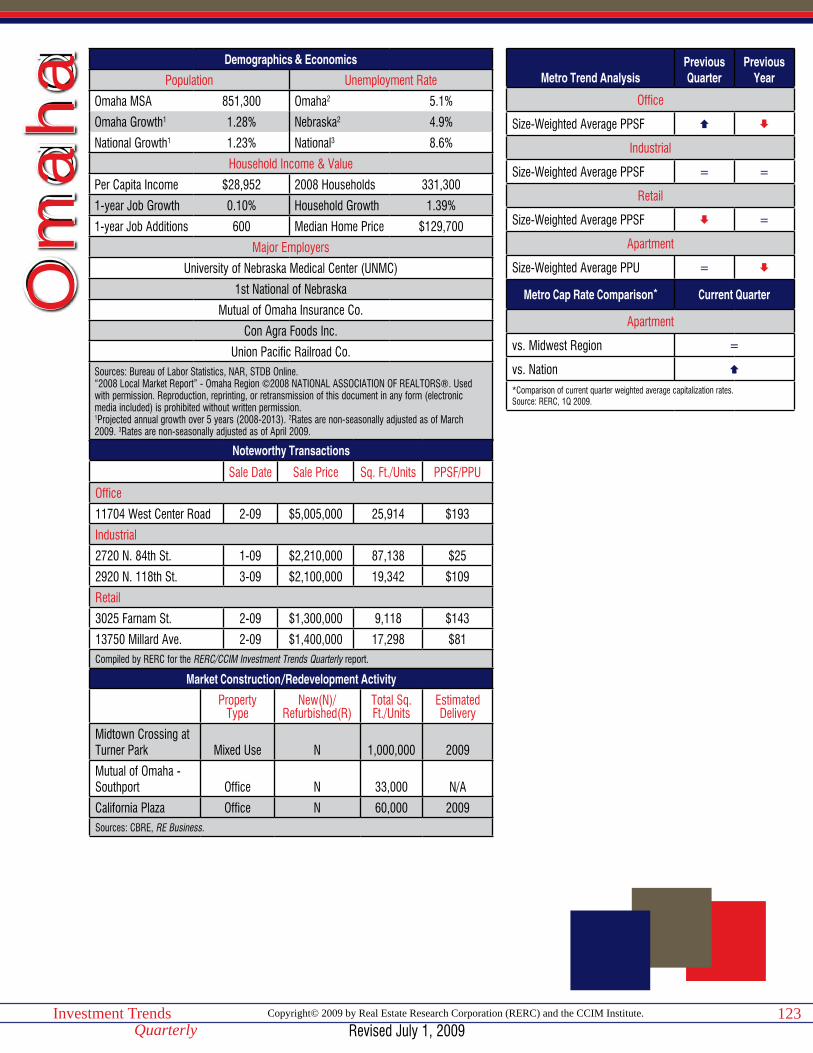
Copyright© 2009 by Real Estate Research Corporation (RERC) and the CCIM Institute.Investment TrendsQuarterly
123
Demographics & Economics
Population Unemployment Rate
Omaha MSA 851,300 Omaha2 5.1%
Omaha Growth1 1.28% Nebraska2 4.9%
National Growth1 1.23% National3 8.6%
Household Income & Value
Per Capita Income $28,952 2008 Households 331,300
1-year Job Growth 0.10% Household Growth 1.39%
1-year Job Additions 600 Median Home Price $129,700
Major Employers
University of Nebraska Medical Center (UNMC)
1st National of Nebraska
Mutual of Omaha Insurance Co.
Con Agra Foods Inc.
Union Pacific Railroad Co.Sources: Bureau of Labor Statistics, NAR, STDB Online.“2008 Local Market Report” - Omaha Region ©2008 NATIONAL ASSOCIATION OF REALTORS®. Used with permission. Reproduction, reprinting, or retransmission of this document in any form (electronic media included) is prohibited without written permission.1Projected annual growth over 5 years (2008-2013). 2Rates are non-seasonally adjusted as of March 2009. 3Rates are non-seasonally adjusted as of April 2009.
Noteworthy Transactions
Sale Date Sale Price Sq. Ft./Units PPSF/PPU
Office
11704 West Center Road 2-09 $5,005,000 25,914 $193
Industrial
2720 N. 84th St. 1-09 $2,210,000 87,138 $25
2920 N. 118th St. 3-09 $2,100,000 19,342 $109
Retail
3025 Farnam St. 2-09 $1,300,000 9,118 $143
13750 Millard Ave. 2-09 $1,400,000 17,298 $81Compiled by RERC for the RERC/CCIM Investment Trends Quarterly report.
Market Construction/Redevelopment Activity
Property Type
New(N)/Refurbished(R)
Total Sq. Ft./Units
Estimated Delivery
Midtown Crossing at Turner Park Mixed Use N 1,000,000 2009
Mutual of Omaha - Southport Office N 33,000 N/A
California Plaza Office N 60,000 2009Sources: CBRE, RE Business.
Om
aha
Metro Trend AnalysisPrevious Quarter
Previous Year
Office
Size-Weighted Average PPSF
Industrial
Size-Weighted Average PPSF = =
Retail
Size-Weighted Average PPSF =
Apartment
Size-Weighted Average PPU =
Metro Cap Rate Comparison* Current Quarter
Apartment
vs. Midwest Region =
vs. Nation
*Comparison of current quarter weighted average capitalization rates.Source: RERC, 1Q 2009.
Revised July 1, 2009

Copyright© 2009 by Real Estate Research Corporation (RERC) and the CCIM Institute.Investment TrendsQuarterly
124
Omaha Transaction Breakdown12-Month Trailing (04/01/08 - 03/31/09)
Office Industrial Retail Apartment Hotel< $5 MillionVolume (Mil) $12 $26 $65 $6 –
Size Weighted Avg. ($ per sf/unit) $95 $32 $69 $33,101 –
Price Weighted Avg. ($ per sf/unit) $132 $40 $109 $36,258 –
Median ($ per sf/unit) $69 $41 $73 $31,484 –
> $5 MillionVolume (Mil) – $35 – $107 –
Size Weighted Avg. ($ per sf/unit) – $51 – $61,627 –
Price Weighted Avg. ($ per sf/unit) – $58 – $73,526 –
Median ($ per sf/unit) – $70 – $45,382 –
All TransactionsVolume (Mil) $17 $61 $104 $113 –
Size Weighted Avg. ($ per sf/unit) $80 $41 $89 $58,958 –
Price Weighted Avg. ($ per sf/unit) $109 $51 $136 $71,569 –
Median ($ per sf/unit) $65 $43 $75 $40,741 –
Capitalization Rates (All Transactions)Weighted Average (%) – – – 7.1 –
Median (%) – – – 7.3 –Source: RERC.
Omaha Transaction Trends12-Month Trailing (04/01/08 - 03/31/09)
Office Industrial Retail Apartment HotelMedian Price% Change Quarter Ago 14% -6% -7% 5% –
% Change Year Ago -23% -12% -33% -11% –
Volume % Change Quarter Ago -41% 16% -17% 10% –
% Change Year Ago -91% -4% 60% -43% –Source: RERC.
Revised July 1, 2009
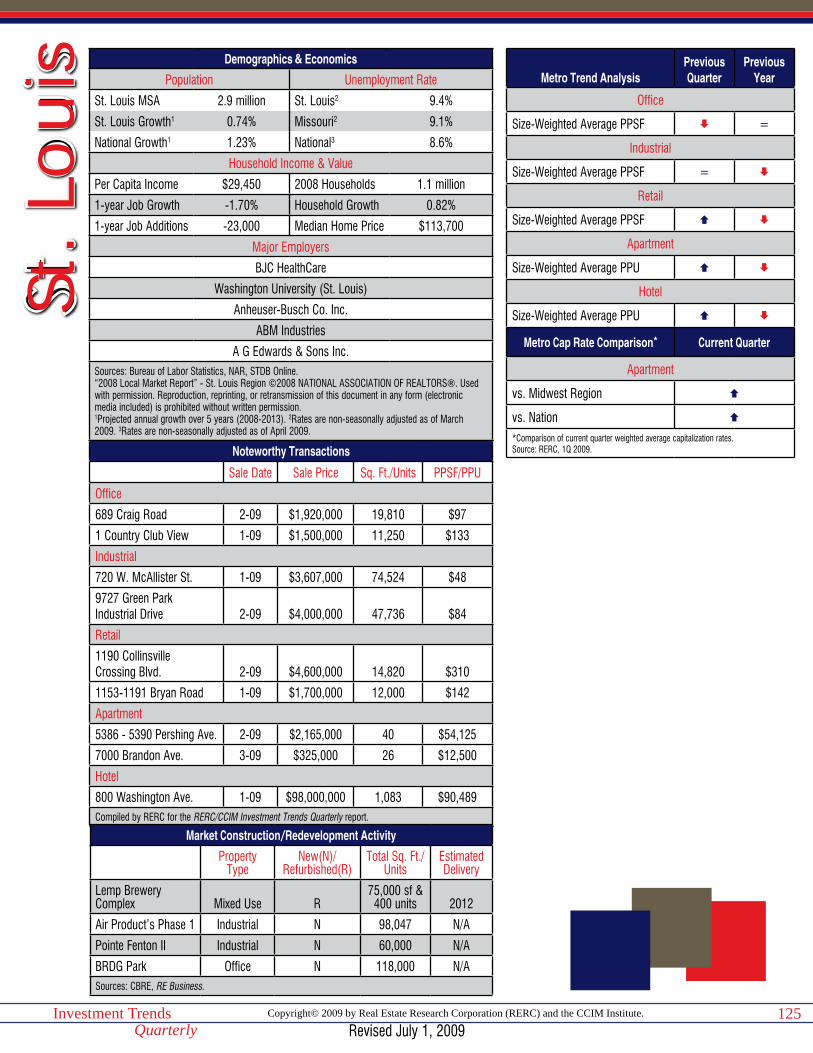
Copyright© 2009 by Real Estate Research Corporation (RERC) and the CCIM Institute.Investment TrendsQuarterly
125
Demographics & Economics
Population Unemployment Rate
St. Louis MSA 2.9 million St. Louis2 9.4%
St. Louis Growth1 0.74% Missouri2 9.1%
National Growth1 1.23% National3 8.6%
Household Income & Value
Per Capita Income $29,450 2008 Households 1.1 million
1-year Job Growth -1.70% Household Growth 0.82%
1-year Job Additions -23,000 Median Home Price $113,700
Major Employers
BJC HealthCare
Washington University (St. Louis)
Anheuser-Busch Co. Inc.
ABM Industries
A G Edwards & Sons Inc.Sources: Bureau of Labor Statistics, NAR, STDB Online.“2008 Local Market Report” - St. Louis Region ©2008 NATIONAL ASSOCIATION OF REALTORS®. Used with permission. Reproduction, reprinting, or retransmission of this document in any form (electronic media included) is prohibited without written permission.1Projected annual growth over 5 years (2008-2013). 2Rates are non-seasonally adjusted as of March 2009. 3Rates are non-seasonally adjusted as of April 2009.
Noteworthy Transactions
Sale Date Sale Price Sq. Ft./Units PPSF/PPU
Office
689 Craig Road 2-09 $1,920,000 19,810 $97
1 Country Club View 1-09 $1,500,000 11,250 $133
Industrial
720 W. McAllister St. 1-09 $3,607,000 74,524 $48
9727 Green ParkIndustrial Drive 2-09 $4,000,000 47,736 $84
Retail
1190 CollinsvilleCrossing Blvd. 2-09 $4,600,000 14,820 $310
1153-1191 Bryan Road 1-09 $1,700,000 12,000 $142
Apartment
5386 - 5390 Pershing Ave. 2-09 $2,165,000 40 $54,125
7000 Brandon Ave. 3-09 $325,000 26 $12,500
Hotel
800 Washington Ave. 1-09 $98,000,000 1,083 $90,489Compiled by RERC for the RERC/CCIM Investment Trends Quarterly report.
Market Construction/Redevelopment Activity
Property Type
New(N)/Refurbished(R)
Total Sq. Ft./Units
Estimated Delivery
Lemp Brewery Complex Mixed Use R
75,000 sf & 400 units 2012
Air Product’s Phase 1 Industrial N 98,047 N/A
Pointe Fenton II Industrial N 60,000 N/A
BRDG Park Office N 118,000 N/ASources: CBRE, RE Business.
St. L
oui
sMetro Trend Analysis
Previous Quarter
Previous Year
Office
Size-Weighted Average PPSF =
Industrial
Size-Weighted Average PPSF =
Retail
Size-Weighted Average PPSF
Apartment
Size-Weighted Average PPU
Hotel
Size-Weighted Average PPU
Metro Cap Rate Comparison* Current Quarter
Apartment
vs. Midwest Region
vs. Nation
*Comparison of current quarter weighted average capitalization rates.Source: RERC, 1Q 2009.
Revised July 1, 2009

Copyright© 2009 by Real Estate Research Corporation (RERC) and the CCIM Institute.Investment TrendsQuarterly
126
St. Louis Transaction Breakdown12-Month Trailing (04/01/08 - 03/31/09)
Office Industrial Retail Apartment Hotel< $5 MillionVolume (Mil) $46 $98 $79 $45 $13
Size Weighted Avg. ($ per sf/unit) $88 $41 $103 $34,851 $27,903
Price Weighted Avg. ($ per sf/unit) $145 $58 $157 $43,276 $28,998
Median ($ per sf/unit) $96 $46 $93 $37,500 $26,131
> $5 MillionVolume (Mil) $256 $116 $58 $137 –
Size Weighted Avg. ($ per sf/unit) $145 $56 $158 $57,653 –
Price Weighted Avg. ($ per sf/unit) $159 $100 $283 $67,204 –
Median ($ per sf/unit) $166 $55 $162 $63,786 –
All TransactionsVolume (Mil) $302 $215 $136 $182 $123
Size Weighted Avg. ($ per sf/unit) $132 $48 $121 $49,614 $62,320
Price Weighted Avg. ($ per sf/unit) $157 $81 $211 $61,278 $78,057
Median ($ per sf/unit) $102 $47 $98 $48,765 $28,521
Capitalization Rates (All Transactions)Weighted Average (%) – – – 7.6 –
Median (%) – – – 6.9 –Source: RERC.
St. Louis Transaction Trends12-Month Trailing (04/01/08 - 03/31/09)
Office Industrial Retail Apartment HotelMedian Price% Change Quarter Ago -20% -6% -9% 0% 9%
% Change Year Ago -17% -13% -12% – -60%
Volume % Change Quarter Ago -34% -21% -32% -9% 34%
% Change Year Ago -79% -56% -86% – -59%Source: RERC.
Revised July 1, 2009
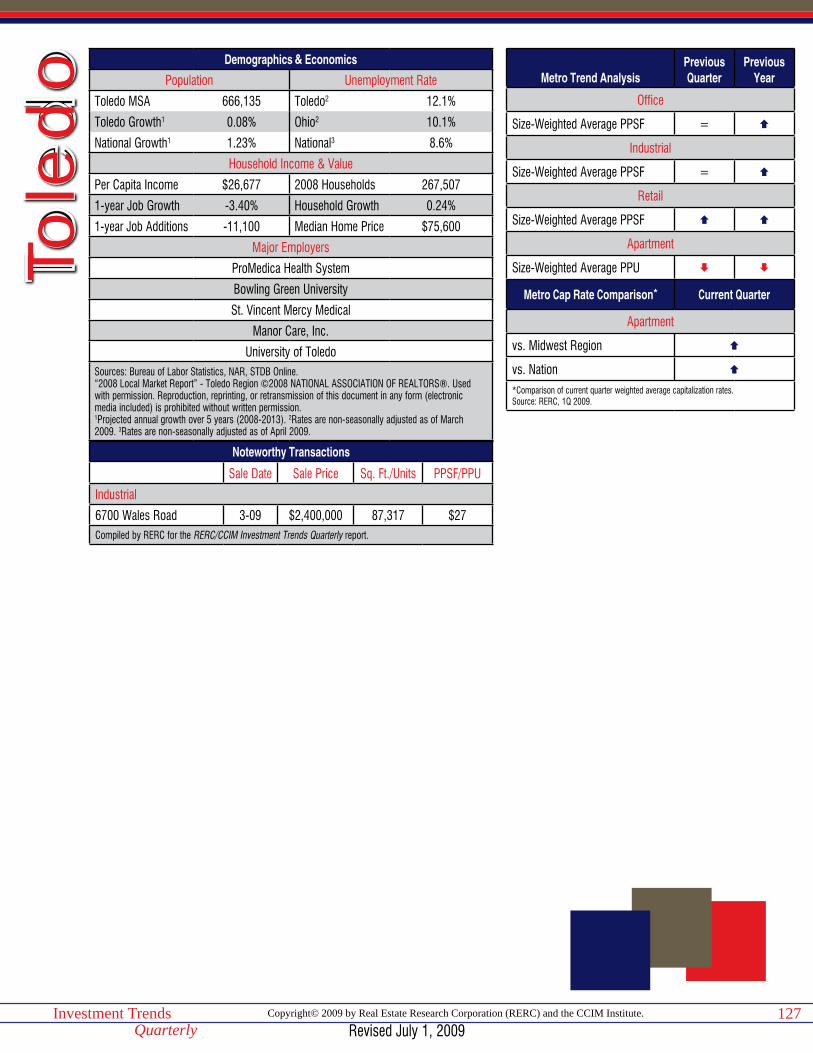
Copyright© 2009 by Real Estate Research Corporation (RERC) and the CCIM Institute.Investment TrendsQuarterly
127
Demographics & Economics
Population Unemployment Rate
Toledo MSA 666,135 Toledo2 12.1%
Toledo Growth1 0.08% Ohio2 10.1%
National Growth1 1.23% National3 8.6%
Household Income & Value
Per Capita Income $26,677 2008 Households 267,507
1-year Job Growth -3.40% Household Growth 0.24%
1-year Job Additions -11,100 Median Home Price $75,600
Major Employers
ProMedica Health System
Bowling Green University
St. Vincent Mercy Medical
Manor Care, Inc.
University of ToledoSources: Bureau of Labor Statistics, NAR, STDB Online.“2008 Local Market Report” - Toledo Region ©2008 NATIONAL ASSOCIATION OF REALTORS®. Used with permission. Reproduction, reprinting, or retransmission of this document in any form (electronic media included) is prohibited without written permission.1Projected annual growth over 5 years (2008-2013). 2Rates are non-seasonally adjusted as of March 2009. 3Rates are non-seasonally adjusted as of April 2009.
Noteworthy Transactions
Sale Date Sale Price Sq. Ft./Units PPSF/PPU
Industrial
6700 Wales Road 3-09 $2,400,000 87,317 $27Compiled by RERC for the RERC/CCIM Investment Trends Quarterly report.
Tole
do Metro Trend Analysis
Previous Quarter
Previous Year
Office
Size-Weighted Average PPSF =
Industrial
Size-Weighted Average PPSF =
Retail
Size-Weighted Average PPSF
Apartment
Size-Weighted Average PPU
Metro Cap Rate Comparison* Current Quarter
Apartment
vs. Midwest Region
vs. Nation
*Comparison of current quarter weighted average capitalization rates.Source: RERC, 1Q 2009.
Revised July 1, 2009

Copyright© 2009 by Real Estate Research Corporation (RERC) and the CCIM Institute.Investment TrendsQuarterly
128
Toledo Transaction Breakdown12-Month Trailing (04/01/08 - 03/31/09)
Office Industrial Retail Apartment Hotel< $5 MillionVolume (Mil) $26 $10 $18 $4 –
Size Weighted Avg. $108 $31 $101 $20,876 –
Price Weighted Avg. $137 $33 $187 $83,049 –
Median $114 $30 $64 $30,333 –
> $5 MillionVolume (Mil) – – – $59 –
Size Weighted Avg. – – – $59,954 –
Price Weighted Avg. – – – $71,543 –
Median – – – $69,188 –
All TransactionsVolume (Mil) $26 $25 $30 $63 –
Size Weighted Avg. $108 $45 $101 $54,285 –
Price Weighted Avg. $137 $63 $198 $72,185 –
Median $114 $30 $66 $67,875 –
Capitalization Rates (All Transactions)Weighted Average – – – 7.6 –
Median – – – 7.4 –Source: RERC.
Toledo Transaction Trends12-Month Trailing (04/01/08 - 03/31/09)
Office Industrial Retail Apartment HotelMedian Price% Change Quarter Ago – -8% 11% 4% –
% Change Year Ago – -5% -19% – –
Volume % Change Quarter Ago – 9% 32% -46% –
% Change Year Ago – 91% 28% – –Source: RERC.
Revised July 1, 2009

Denver • Honolulu • Las Vegas • Los Angeles • Phoenix • Portland • SacramentoSalt Lake City • San Diego • San Francisco • Seattle • Tucson
West Region
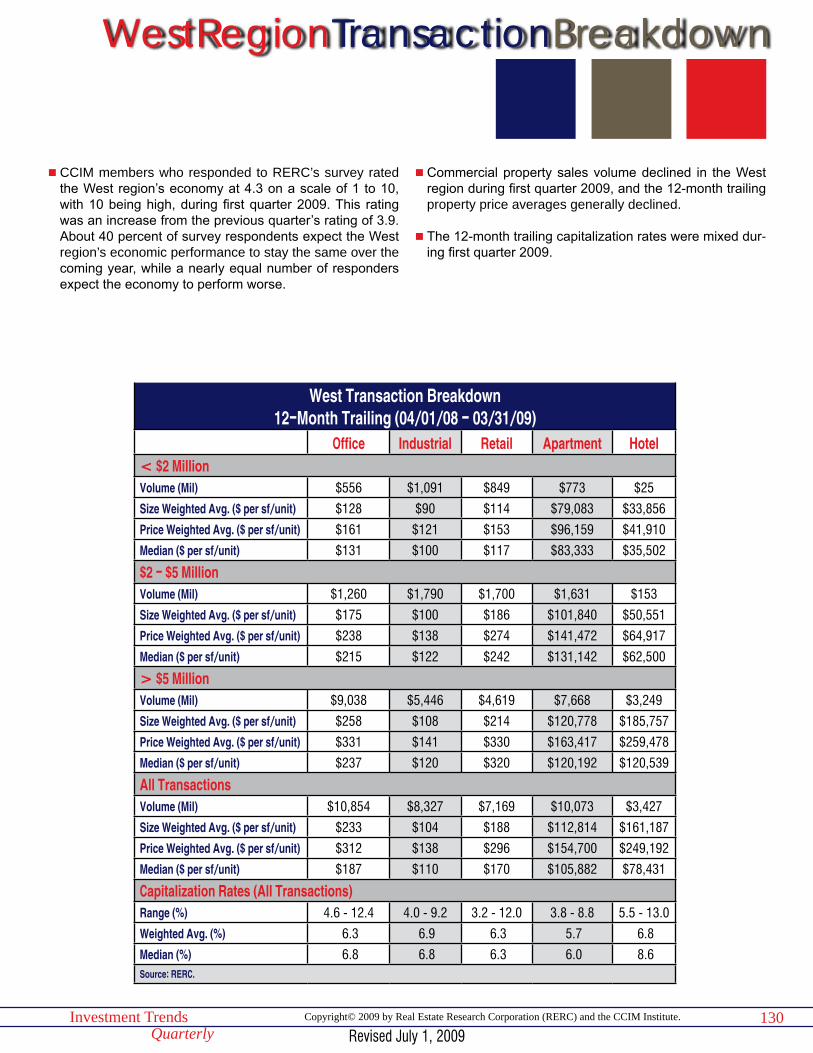
130Investment TrendsQuarterly
Copyright© 2009 by Real Estate Research Corporation (RERC) and the CCIM Institute.
WestRegionTransactionBreakdown
West Transaction Breakdown12-Month Trailing (04/01/08 - 03/31/09)
Office Industrial Retail Apartment Hotel< $2 MillionVolume (Mil) $556 $1,091 $849 $773 $25
Size Weighted Avg. ($ per sf/unit) $128 $90 $114 $79,083 $33,856
Price Weighted Avg. ($ per sf/unit) $161 $121 $153 $96,159 $41,910
Median ($ per sf/unit) $131 $100 $117 $83,333 $35,502
$2 - $5 MillionVolume (Mil) $1,260 $1,790 $1,700 $1,631 $153
Size Weighted Avg. ($ per sf/unit) $175 $100 $186 $101,840 $50,551
Price Weighted Avg. ($ per sf/unit) $238 $138 $274 $141,472 $64,917
Median ($ per sf/unit) $215 $122 $242 $131,142 $62,500
> $5 MillionVolume (Mil) $9,038 $5,446 $4,619 $7,668 $3,249
Size Weighted Avg. ($ per sf/unit) $258 $108 $214 $120,778 $185,757
Price Weighted Avg. ($ per sf/unit) $331 $141 $330 $163,417 $259,478
Median ($ per sf/unit) $237 $120 $320 $120,192 $120,539
All TransactionsVolume (Mil) $10,854 $8,327 $7,169 $10,073 $3,427
Size Weighted Avg. ($ per sf/unit) $233 $104 $188 $112,814 $161,187
Price Weighted Avg. ($ per sf/unit) $312 $138 $296 $154,700 $249,192
Median ($ per sf/unit) $187 $110 $170 $105,882 $78,431
Capitalization Rates (All Transactions)Range (%) 4.6 - 12.4 4.0 - 9.2 3.2 - 12.0 3.8 - 8.8 5.5 - 13.0
Weighted Avg. (%) 6.3 6.9 6.3 5.7 6.8
Median (%) 6.8 6.8 6.3 6.0 8.6 Source: RERC.
n CCIM members who responded to RERC’s survey rated the West region’s economy at 4.3 on a scale of 1 to 10, with 10 being high, during first quarter 2009. This rating was an increase from the previous quarter’s rating of 3.9. About 40 percent of survey respondents expect the West region’s economic performance to stay the same over the coming year, while a nearly equal number of responders expect the economy to perform worse.
n Commercial property sales volume declined in the West region during first quarter 2009, and the 12-month trailing property price averages generally declined.
n The 12-month trailing capitalization rates were mixed dur-ing first quarter 2009.
Revised July 1, 2009

131Investment TrendsQuarterly
Copyright© 2009 by Real Estate Research Corporation (RERC) and the CCIM Institute.
WestRegionTransactionBreakdown
West Transaction BreakdownCurrent Quarter Rates (01/01/09 - 03/31/09)
Office Industrial Retail Apartment Hotel< $2 MillionVolume (Mil) $77 $132 $116 $108 $5
Size Weighted Avg. ($ per sf/unit) $132 $77 $110 $85,636 $31,526
Price Weighted Avg. ($ per sf/unit) $165 $115 $144 $101,632 $36,040
Median ($ per sf/unit) $128 $93 $104 $92,138 $29,545
$2 - $5 MillionVolume (Mil) $171 $288 $238 $223 $22
Size Weighted Avg. ($ per sf/unit) $162 $109 $180 $102,428 $29,596
Price Weighted Avg. ($ per sf/unit) $218 $151 $264 $146,862 $34,610
Median ($ per sf/unit) $190 $137 $208 $138,640 $35,375
> $5 MillionVolume (Mil) $510 $363 $555 $535 $811
Size Weighted Avg. ($ per sf/unit) $274 $109 $237 $119,735 $243,701
Price Weighted Avg. ($ per sf/unit) $409 $157 $299 $174,674 $260,441
Median ($ per sf/unit) $234 $119 $273 $129,814 $81,053
All TransactionsVolume (Mil) $757 $783 $909 $866 $838
Size Weighted Avg. ($ per sf/unit) $217 $102 $193 $109,536 $197,736
Price Weighted Avg. ($ per sf/unit) $341 $148 $270 $158,413 $253,102
Median ($ per sf/unit) $179 $110 $152 $104,545 $44,875
Capitalization Rates (All Transactions)Range (%) 5.0 - 9.0 6.7 - 9.2 4.9 - 12.0 3.8 - 7.9 –
Weighted Avg. (%) 7.4 7.6 6.4 6.3 –
Median (%) 7.0 7.7 6.7 6.3 –Source: RERC.
San Diego –“Investors prefer cash flow over anything else. They want no rollover and no capital costs.”
Phoenix –“Vacancy rates in all product types are increasing. Landlord incentives are increasing to obtain new tenants. Cap rates are increasing, which in turn is having a negative impact on value.”
Los Angeles –“Things are slow, at best. ‘Sale or Lease’ and ‘Sub-Lease’ listings are posted daily. Fortunately, the demographics keep things moving. However, it seems that this year is lost to only a few decent commercial transactions.”
Revised July 1, 2009
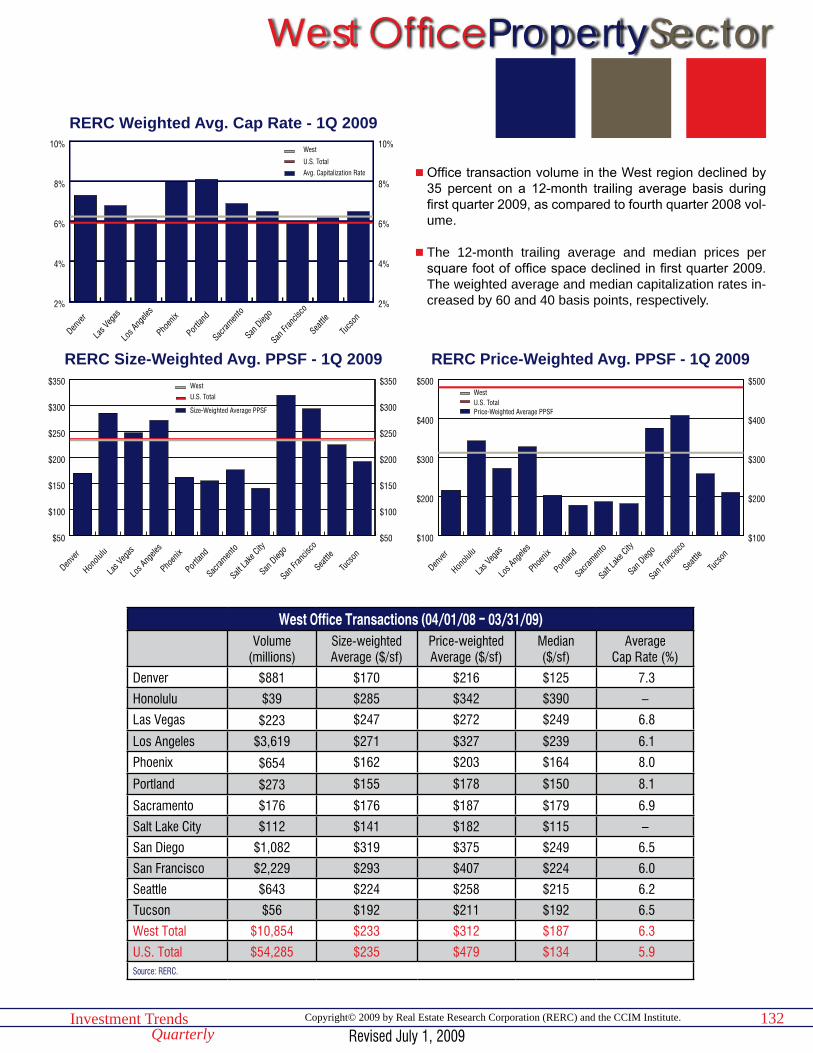
OfficePropertySector
132Investment TrendsQuarterly
Copyright© 2009 by Real Estate Research Corporation (RERC) and the CCIM Institute.
$100
$200
$300
$400
$500
$100
$200
$300
$400
$500WestU.S. TotalPrice-Weighted Average PPSF
Tucs
on
Seattle
San Fr
ancis
co
San D
iego
Salt La
ke City
Sacram
ento
Portlan
d
Phoen
ix
Los A
ngele
s
Las V
egas
Honolu
lu
Denve
r
RERC Price-Weighted Avg. PPSF - 1Q 2009
2%
4%
6%
8%
10%
2%
4%
6%
8%
10%West
U.S. TotalAvg. Capitalization Rate
Tucs
on
Seattle
San Fr
ancis
co
San D
iego
Sacram
ento
Portlan
d
Phoen
ix
Los A
ngele
s
Las V
egas
Denve
r
RERC Weighted Avg. Cap Rate - 1Q 2009
West Office Transactions (04/01/08 - 03/31/09)Volume
(millions)Size-weighted Average ($/sf)
Price-weighted Average ($/sf)
Median($/sf)
Average Cap Rate (%)
Denver $881 $170 $216 $125 7.3
Honolulu $39 $285 $342 $390 –
Las Vegas $223 $247 $272 $249 6.8
Los Angeles $3,619 $271 $327 $239 6.1
Phoenix $654 $162 $203 $164 8.0
Portland $273 $155 $178 $150 8.1
Sacramento $176 $176 $187 $179 6.9
Salt Lake City $112 $141 $182 $115 –
San Diego $1,082 $319 $375 $249 6.5
San Francisco $2,229 $293 $407 $224 6.0
Seattle $643 $224 $258 $215 6.2
Tucson $56 $192 $211 $192 6.5
West Total $10,854 $233 $312 $187 6.3
U.S. Total $54,285 $235 $479 $134 5.9 Source: RERC.
$50
$100
$150
$200
$250
$300
$350
$50
$100
$150
$200
$250
$300
$350WestU.S. Total
Size-Weighted Average PPSF
Tucs
on
Seattle
San Fr
ancis
co
San D
iego
Salt La
ke City
Sacram
ento
Portlan
d
Phoen
ix
Los A
ngele
s
Las V
egas
Honolu
lu
Denve
r
RERC Size-Weighted Avg. PPSF - 1Q 2009
n Office transaction volume in the West region declined by 35 percent on a 12-month trailing average basis during first quarter 2009, as compared to fourth quarter 2008 vol-ume.
n The 12-month trailing average and median prices per square foot of office space declined in first quarter 2009. The weighted average and median capitalization rates in-creased by 60 and 40 basis points, respectively.
West
Revised July 1, 2009
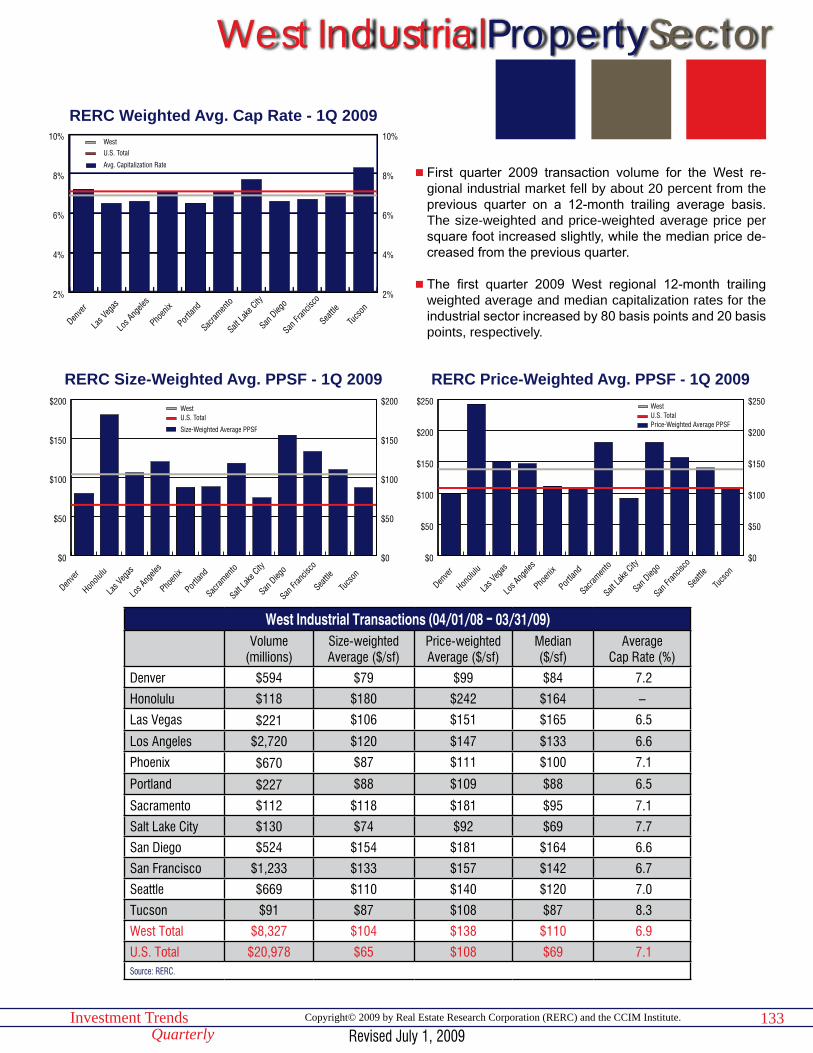
133Investment TrendsQuarterly
Copyright© 2009 by Real Estate Research Corporation (RERC) and the CCIM Institute.
IndustrialPropertySector
$0
$50
$100
$150
$200
$250
$0
$50
$100
$150
$200
$250WestU.S. TotalPrice-Weighted Average PPSF
Tucs
on
Seattle
San Fr
ancis
co
San D
iego
Salt La
ke City
Sacram
ento
Portlan
d
Phoen
ix
Los A
ngele
s
Las V
egas
Honolu
lu
Denve
r
RERC Price-Weighted Avg. PPSF - 1Q 2009
2%
4%
6%
8%
10%
2%
4%
6%
8%
10%WestU.S. Total
Avg. Capitalization Rate
Tucs
on
Seattle
San Fr
ancis
co
San D
iego
Salt La
ke City
Sacram
ento
Portlan
d
Phoen
ix
Los A
ngele
s
Las V
egas
Denve
r
RERC Weighted Avg. Cap Rate - 1Q 2009
West Industrial Transactions (04/01/08 - 03/31/09)Volume
(millions)Size-weighted Average ($/sf)
Price-weighted Average ($/sf)
Median($/sf)
Average Cap Rate (%)
Denver $594 $79 $99 $84 7.2
Honolulu $118 $180 $242 $164 –
Las Vegas $221 $106 $151 $165 6.5
Los Angeles $2,720 $120 $147 $133 6.6
Phoenix $670 $87 $111 $100 7.1
Portland $227 $88 $109 $88 6.5
Sacramento $112 $118 $181 $95 7.1
Salt Lake City $130 $74 $92 $69 7.7
San Diego $524 $154 $181 $164 6.6
San Francisco $1,233 $133 $157 $142 6.7
Seattle $669 $110 $140 $120 7.0
Tucson $91 $87 $108 $87 8.3
West Total $8,327 $104 $138 $110 6.9
U.S. Total $20,978 $65 $108 $69 7.1 Source: RERC.
$0
$50
$100
$150
$200
$0
$50
$100
$150
$200WestU.S. Total
Size-Weighted Average PPSF
Tucs
on
Seattle
San Fr
ancis
co
San D
iego
Salt La
ke City
Sacram
ento
Portlan
d
Phoen
ix
Los A
ngele
s
Las V
egas
Honolu
lu
Denve
r
RERC Size-Weighted Avg. PPSF - 1Q 2009
n First quarter 2009 transaction volume for the West re-gional industrial market fell by about 20 percent from the previous quarter on a 12-month trailing average basis. The size-weighted and price-weighted average price per square foot increased slightly, while the median price de-creased from the previous quarter.
n The first quarter 2009 West regional 12-month trailing weighted average and median capitalization rates for the industrial sector increased by 80 basis points and 20 basis points, respectively.
West
Revised July 1, 2009
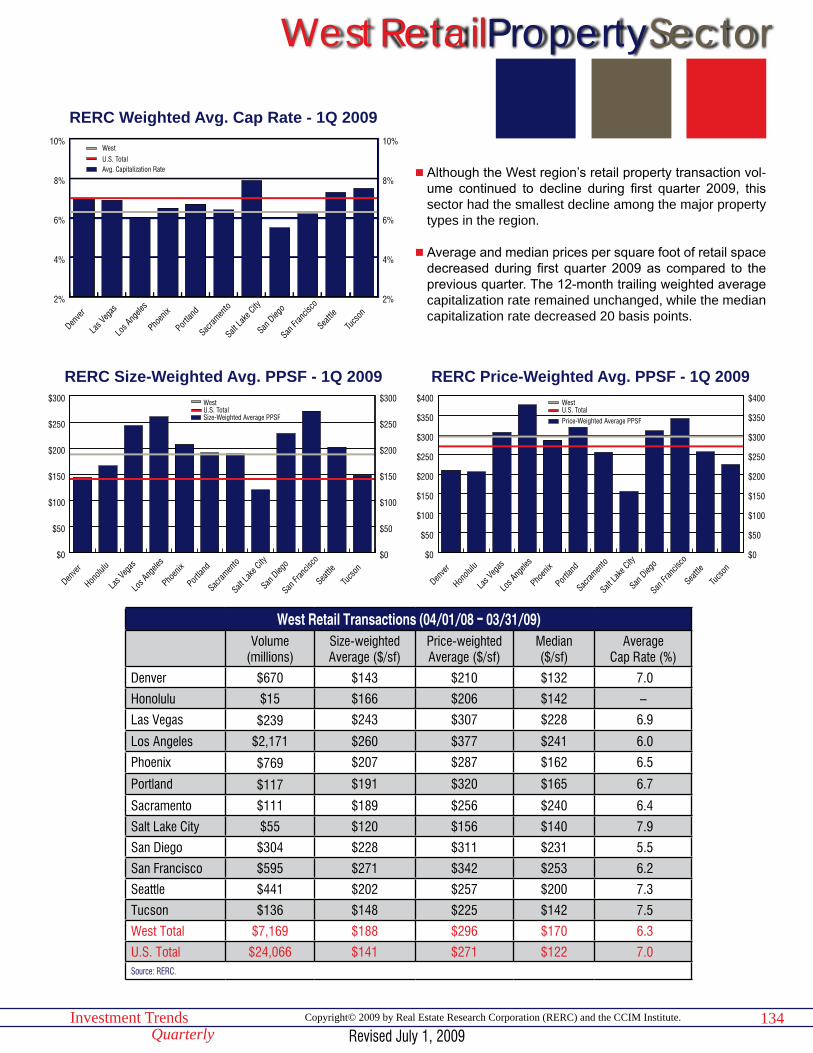
134Investment TrendsQuarterly
Copyright© 2009 by Real Estate Research Corporation (RERC) and the CCIM Institute.
RetailPropertySector
$0
$50
$100
$150
$200
$250
$300
$350
$400
$0
$50
$100
$150
$200
$250
$300
$350
$400WestU.S. TotalPrice-Weighted Average PPSF
Tucs
on
Seattle
San Fr
ancis
co
San D
iego
Salt La
ke City
Sacram
ento
Portlan
d
Phoen
ix
Los A
ngele
s
Las V
egas
Honolu
lu
Denve
r
RERC Price-Weighted Avg. PPSF - 1Q 2009
2%
4%
6%
8%
10%
2%
4%
6%
8%
10%WestU.S. TotalAvg. Capitalization Rate
Tucs
on
Seattle
San Fr
ancis
co
San D
iego
Salt La
ke City
Sacram
ento
Portlan
d
Phoen
ix
Los A
ngele
s
Las V
egas
Denve
r
RERC Weighted Avg. Cap Rate - 1Q 2009
West Retail Transactions (04/01/08 - 03/31/09)Volume
(millions)Size-weighted Average ($/sf)
Price-weighted Average ($/sf)
Median($/sf)
Average Cap Rate (%)
Denver $670 $143 $210 $132 7.0
Honolulu $15 $166 $206 $142 –
Las Vegas $239 $243 $307 $228 6.9
Los Angeles $2,171 $260 $377 $241 6.0
Phoenix $769 $207 $287 $162 6.5
Portland $117 $191 $320 $165 6.7
Sacramento $111 $189 $256 $240 6.4
Salt Lake City $55 $120 $156 $140 7.9
San Diego $304 $228 $311 $231 5.5
San Francisco $595 $271 $342 $253 6.2
Seattle $441 $202 $257 $200 7.3
Tucson $136 $148 $225 $142 7.5
West Total $7,169 $188 $296 $170 6.3
U.S. Total $24,066 $141 $271 $122 7.0 Source: RERC.
$0
$50
$100
$150
$200
$250
$300
$0
$50
$100
$150
$200
$250
$300WestU.S. TotalSize-Weighted Average PPSF
Tucs
on
Seattle
San Fr
ancis
co
San D
iego
Salt La
ke City
Sacram
ento
Portlan
d
Phoen
ix
Los A
ngele
s
Las V
egas
Honolu
lu
Denve
r
RERC Size-Weighted Avg. PPSF - 1Q 2009
n Although the West region’s retail property transaction vol-ume continued to decline during first quarter 2009, this sector had the smallest decline among the major property types in the region.
n Average and median prices per square foot of retail space decreased during first quarter 2009 as compared to the previous quarter. The 12-month trailing weighted average capitalization rate remained unchanged, while the median capitalization rate decreased 20 basis points.
West
Revised July 1, 2009
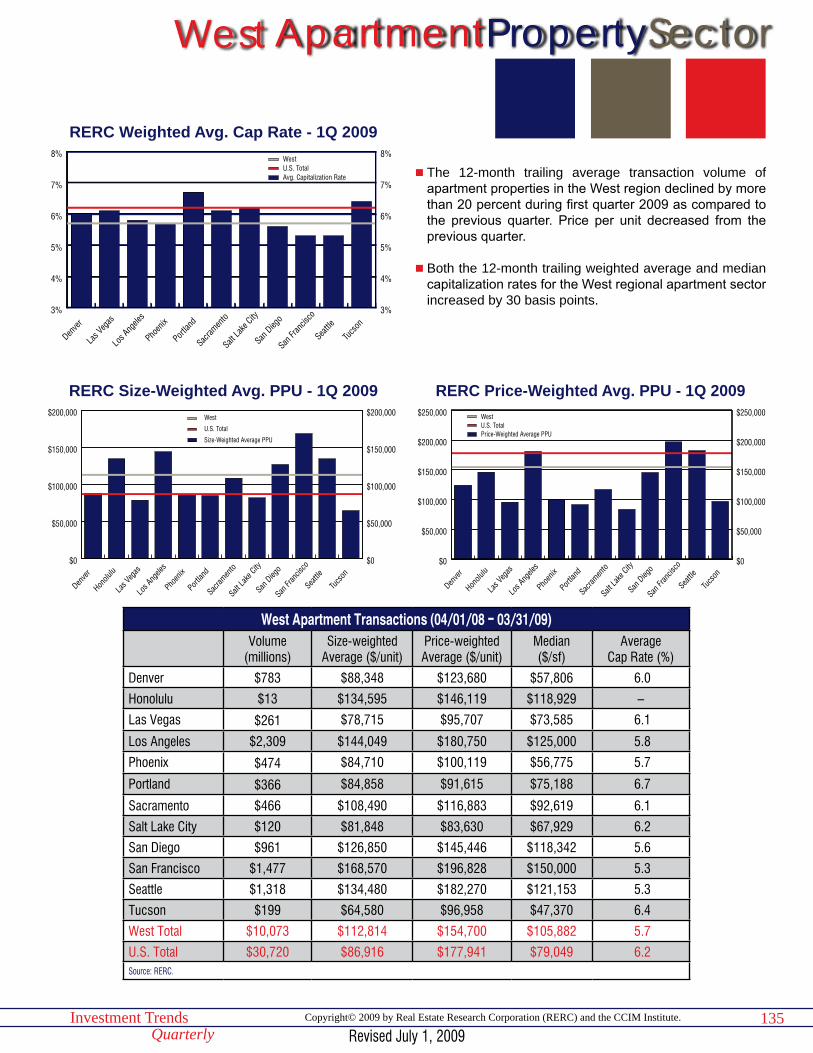
135Investment TrendsQuarterly
Copyright© 2009 by Real Estate Research Corporation (RERC) and the CCIM Institute.
ApartmentPropertySector
$0
$50,000
$100,000
$150,000
$200,000
$250,000
$0
$50,000
$100,000
$150,000
$200,000
$250,000WestU.S. TotalPrice-Weighted Average PPU
Tucs
on
Seatt
le
San F
rancis
co
San D
iego
Salt L
ake C
ity
Sacra
mento
Portla
nd
Phoe
nix
Los A
ngele
s
Las V
egas
Honolu
lu
Denve
r
RERC Price-Weighted Avg. PPU - 1Q 2009
3%
4%
5%
6%
7%
8%
3%
4%
5%
6%
7%
8%WestU.S. TotalAvg. Capitalization Rate
Tucs
on
Seattle
San Fr
ancis
co
San D
iego
Salt La
ke City
Sacram
ento
Portlan
d
Phoen
ix
Los A
ngele
s
Las V
egas
Denve
r
RERC Weighted Avg. Cap Rate - 1Q 2009
West Apartment Transactions (04/01/08 - 03/31/09)Volume
(millions)Size-weighted
Average ($/unit)Price-weighted Average ($/unit)
Median($/sf)
Average Cap Rate (%)
Denver $783 $88,348 $123,680 $57,806 6.0
Honolulu $13 $134,595 $146,119 $118,929 –
Las Vegas $261 $78,715 $95,707 $73,585 6.1
Los Angeles $2,309 $144,049 $180,750 $125,000 5.8
Phoenix $474 $84,710 $100,119 $56,775 5.7
Portland $366 $84,858 $91,615 $75,188 6.7
Sacramento $466 $108,490 $116,883 $92,619 6.1
Salt Lake City $120 $81,848 $83,630 $67,929 6.2
San Diego $961 $126,850 $145,446 $118,342 5.6
San Francisco $1,477 $168,570 $196,828 $150,000 5.3
Seattle $1,318 $134,480 $182,270 $121,153 5.3
Tucson $199 $64,580 $96,958 $47,370 6.4
West Total $10,073 $112,814 $154,700 $105,882 5.7
U.S. Total $30,720 $86,916 $177,941 $79,049 6.2 Source: RERC.
$0
$50,000
$100,000
$150,000
$200,000
$0
$50,000
$100,000
$150,000
$200,000West
U.S. Total
Size-Weighted Average PPU
Tucs
on
Seattle
San Fr
ancis
co
San D
iego
Salt La
ke City
Sacram
ento
Portlan
d
Phoen
ix
Los A
ngele
s
Las V
egas
Honolu
lu
Denve
r
RERC Size-Weighted Avg. PPU - 1Q 2009
n The 12-month trailing average transaction volume of apartment properties in the West region declined by more than 20 percent during first quarter 2009 as compared to the previous quarter. Price per unit decreased from the previous quarter.
n Both the 12-month trailing weighted average and median capitalization rates for the West regional apartment sector increased by 30 basis points.
West
Revised July 1, 2009
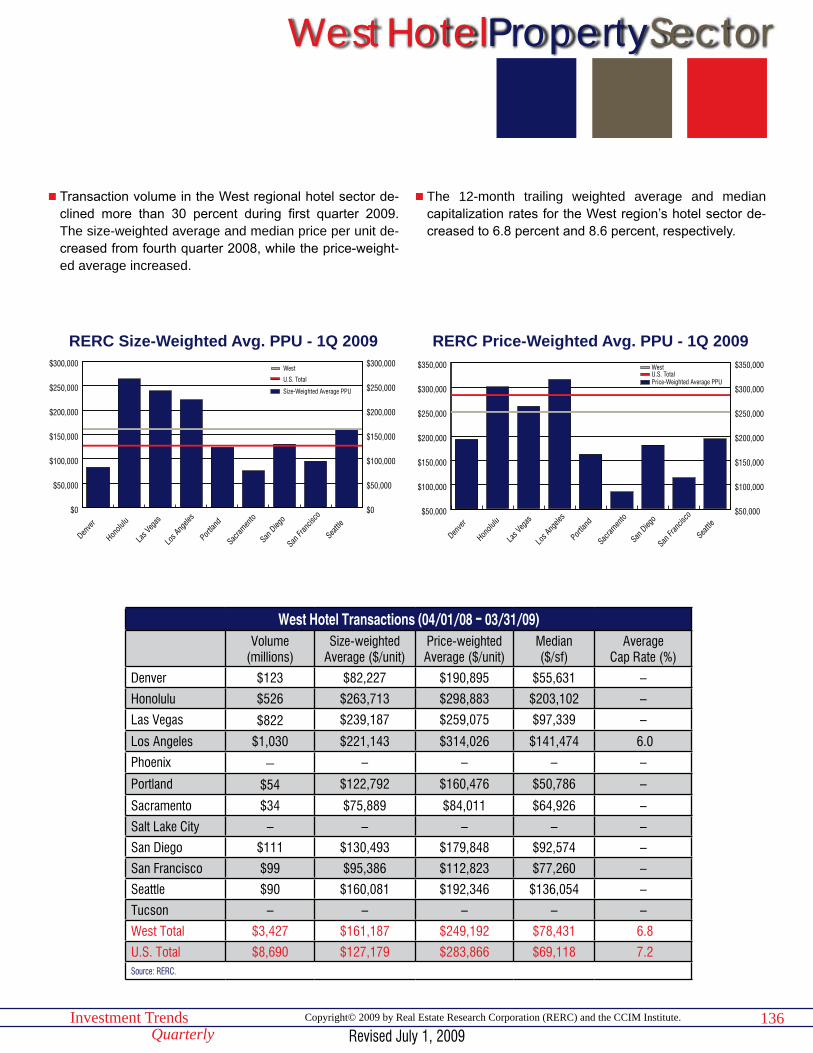
136Investment TrendsQuarterly
Copyright© 2009 by Real Estate Research Corporation (RERC) and the CCIM Institute.
HotelPropertySector
$50,000
$100,000
$150,000
$200,000
$250,000
$300,000
$350,000
$50,000
$100,000
$150,000
$200,000
$250,000
$300,000
$350,000WestU.S. TotalPrice-Weighted Average PPU
Seattle
San Fr
ancis
co
San D
iego
Sacram
ento
Portlan
d
Los A
ngele
s
Las V
egas
Honolu
lu
Denve
r
RERC Price-Weighted Avg. PPU - 1Q 2009
West Hotel Transactions (04/01/08 - 03/31/09)Volume
(millions)Size-weighted
Average ($/unit)Price-weighted Average ($/unit)
Median($/sf)
Average Cap Rate (%)
Denver $123 $82,227 $190,895 $55,631 –
Honolulu $526 $263,713 $298,883 $203,102 –
Las Vegas $822 $239,187 $259,075 $97,339 –
Los Angeles $1,030 $221,143 $314,026 $141,474 6.0
Phoenix – – – – –
Portland $54 $122,792 $160,476 $50,786 –
Sacramento $34 $75,889 $84,011 $64,926 –
Salt Lake City – – – – –
San Diego $111 $130,493 $179,848 $92,574 –
San Francisco $99 $95,386 $112,823 $77,260 –
Seattle $90 $160,081 $192,346 $136,054 –
Tucson – – – – –
West Total $3,427 $161,187 $249,192 $78,431 6.8
U.S. Total $8,690 $127,179 $283,866 $69,118 7.2 Source: RERC.
$0
$50,000
$100,000
$150,000
$200,000
$250,000
$300,000
$0
$50,000
$100,000
$150,000
$200,000
$250,000
$300,000West
U.S. Total
Size-Weighted Average PPU
Seattle
San Fr
ancis
co
San D
iego
Sacram
ento
Portlan
d
Los A
ngele
s
Las V
egas
Honolu
lu
Denve
r
RERC Size-Weighted Avg. PPU - 1Q 2009
n Transaction volume in the West regional hotel sector de-clined more than 30 percent during first quarter 2009. The size-weighted average and median price per unit de-creased from fourth quarter 2008, while the price-weight-ed average increased.
n The 12-month trailing weighted average and median capitalization rates for the West region’s hotel sector de-creased to 6.8 percent and 8.6 percent, respectively.
West
Revised July 1, 2009
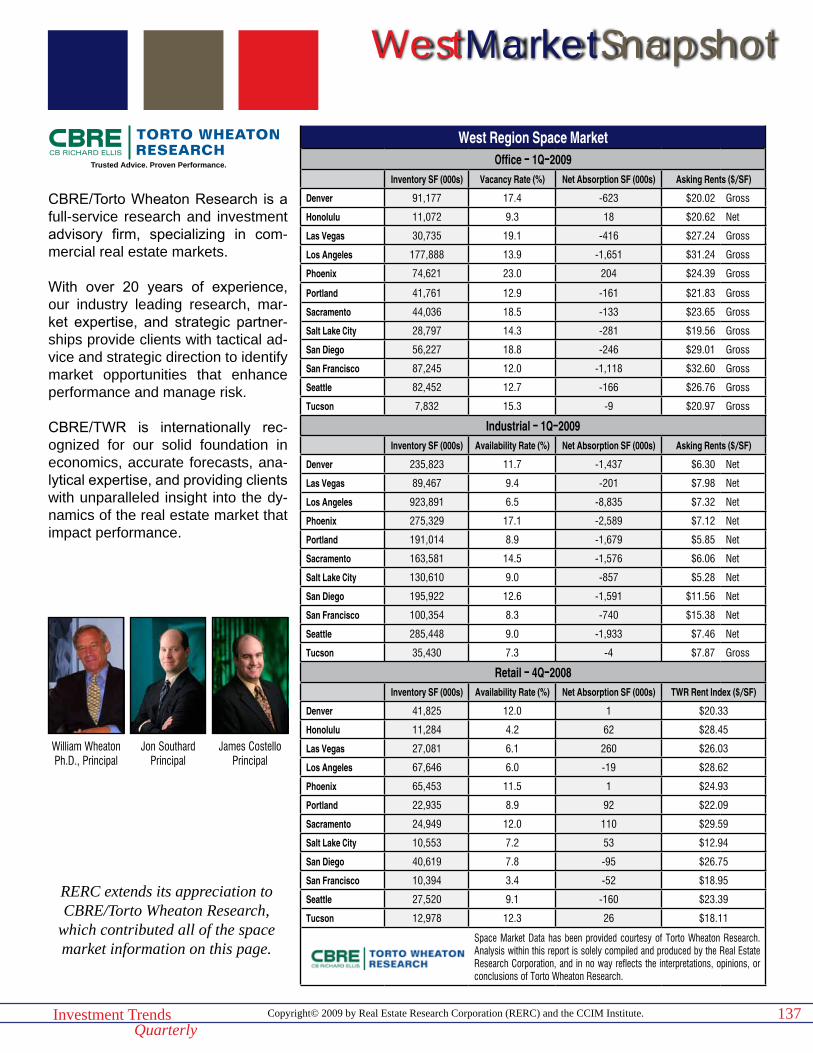
Copyright© 2009 by Real Estate Research Corporation (RERC) and the CCIM Institute.Investment TrendsQuarterly
WestMarketSnapshot
137
West Region Space MarketOffice - 1Q-2009
Inventory SF (000s) Vacancy Rate (%) Net Absorption SF (000s) Asking Rents ($/SF)
Denver 91,177 17.4 -623 $20.02 Gross
Honolulu 11,072 9.3 18 $20.62 Net
Las Vegas 30,735 19.1 -416 $27.24 Gross
Los Angeles 177,888 13.9 -1,651 $31.24 Gross
Phoenix 74,621 23.0 204 $24.39 Gross
Portland 41,761 12.9 -161 $21.83 Gross
Sacramento 44,036 18.5 -133 $23.65 Gross
Salt Lake City 28,797 14.3 -281 $19.56 Gross
San Diego 56,227 18.8 -246 $29.01 Gross
San Francisco 87,245 12.0 -1,118 $32.60 Gross
Seattle 82,452 12.7 -166 $26.76 Gross
Tucson 7,832 15.3 -9 $20.97 Gross
Industrial - 1Q-2009Inventory SF (000s) Availability Rate (%) Net Absorption SF (000s) Asking Rents ($/SF)
Denver 235,823 11.7 -1,437 $6.30 Net
Las Vegas 89,467 9.4 -201 $7.98 Net
Los Angeles 923,891 6.5 -8,835 $7.32 Net
Phoenix 275,329 17.1 -2,589 $7.12 Net
Portland 191,014 8.9 -1,679 $5.85 Net
Sacramento 163,581 14.5 -1,576 $6.06 Net
Salt Lake City 130,610 9.0 -857 $5.28 Net
San Diego 195,922 12.6 -1,591 $11.56 Net
San Francisco 100,354 8.3 -740 $15.38 Net
Seattle 285,448 9.0 -1,933 $7.46 Net
Tucson 35,430 7.3 -4 $7.87 Gross
Retail - 4Q-2008Inventory SF (000s) Availability Rate (%) Net Absorption SF (000s) TWR Rent Index ($/SF)
Denver 41,825 12.0 1 $20.33
Honolulu 11,284 4.2 62 $28.45
Las Vegas 27,081 6.1 260 $26.03
Los Angeles 67,646 6.0 -19 $28.62
Phoenix 65,453 11.5 1 $24.93
Portland 22,935 8.9 92 $22.09
Sacramento 24,949 12.0 110 $29.59
Salt Lake City 10,553 7.2 53 $12.94
San Diego 40,619 7.8 -95 $26.75
San Francisco 10,394 3.4 -52 $18.95
Seattle 27,520 9.1 -160 $23.39
Tucson 12,978 12.3 26 $18.11
Space Market Data has been provided courtesy of Torto Wheaton Research. Analysis within this report is solely compiled and produced by the Real Estate Research Corporation, and in no way reflects the interpretations, opinions, or conclusions of Torto Wheaton Research.
CBRE/Torto Wheaton Research is a full-service research and investment advisory firm, specializing in com-mercial real estate markets.
With over 20 years of experience, our industry leading research, mar-ket expertise, and strategic partner-ships provide clients with tactical ad-vice and strategic direction to identify market opportunities that enhance performance and manage risk.
CBRE/TWR is internationally rec-ognized for our solid foundation in economics, accurate forecasts, ana-lytical expertise, and providing clients with unparalleled insight into the dy-namics of the real estate market that impact performance.
William WheatonPh.D., Principal
Trusted Advice. Proven Performance.
RERC extends its appreciation to CBRE/Torto Wheaton Research,
which contributed all of the space market information on this page.
Jon SouthardPrincipal
James CostelloPrincipal
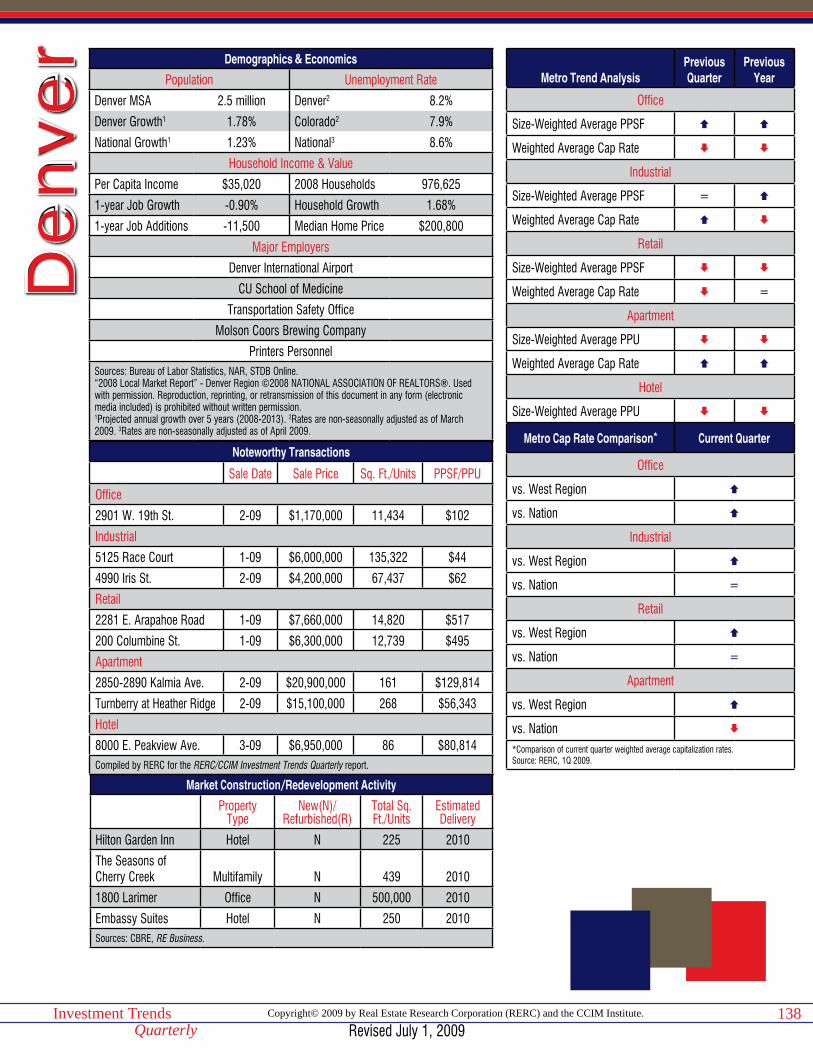
Copyright© 2009 by Real Estate Research Corporation (RERC) and the CCIM Institute.Investment TrendsQuarterly
138
Demographics & Economics
Population Unemployment Rate
Denver MSA 2.5 million Denver2 8.2%
Denver Growth1 1.78% Colorado2 7.9%
National Growth1 1.23% National3 8.6%
Household Income & Value
Per Capita Income $35,020 2008 Households 976,625
1-year Job Growth -0.90% Household Growth 1.68%
1-year Job Additions -11,500 Median Home Price $200,800
Major Employers
Denver International Airport
CU School of Medicine
Transportation Safety Office
Molson Coors Brewing Company
Printers PersonnelSources: Bureau of Labor Statistics, NAR, STDB Online.“2008 Local Market Report” - Denver Region ©2008 NATIONAL ASSOCIATION OF REALTORS®. Used with permission. Reproduction, reprinting, or retransmission of this document in any form (electronic media included) is prohibited without written permission.1Projected annual growth over 5 years (2008-2013). 2Rates are non-seasonally adjusted as of March 2009. 3Rates are non-seasonally adjusted as of April 2009.
Noteworthy Transactions
Sale Date Sale Price Sq. Ft./Units PPSF/PPU
Office
2901 W. 19th St. 2-09 $1,170,000 11,434 $102
Industrial
5125 Race Court 1-09 $6,000,000 135,322 $44
4990 Iris St. 2-09 $4,200,000 67,437 $62
Retail
2281 E. Arapahoe Road 1-09 $7,660,000 14,820 $517
200 Columbine St. 1-09 $6,300,000 12,739 $495
Apartment
2850-2890 Kalmia Ave. 2-09 $20,900,000 161 $129,814
Turnberry at Heather Ridge 2-09 $15,100,000 268 $56,343
Hotel
8000 E. Peakview Ave. 3-09 $6,950,000 86 $80,814Compiled by RERC for the RERC/CCIM Investment Trends Quarterly report.
Market Construction/Redevelopment Activity
Property Type
New(N)/Refurbished(R)
Total Sq. Ft./Units
Estimated Delivery
Hilton Garden Inn Hotel N 225 2010
The Seasons of Cherry Creek Multifamily N 439 2010
1800 Larimer Office N 500,000 2010
Embassy Suites Hotel N 250 2010Sources: CBRE, RE Business.
De
nve
rMetro Trend Analysis
Previous Quarter
Previous Year
Office
Size-Weighted Average PPSF
Weighted Average Cap Rate
Industrial
Size-Weighted Average PPSF =
Weighted Average Cap Rate
Retail
Size-Weighted Average PPSF
Weighted Average Cap Rate =
Apartment
Size-Weighted Average PPU
Weighted Average Cap Rate
Hotel
Size-Weighted Average PPU
Metro Cap Rate Comparison* Current Quarter
Office
vs. West Region
vs. Nation
Industrial
vs. West Region
vs. Nation =
Retail
vs. West Region
vs. Nation =
Apartment
vs. West Region
vs. Nation
*Comparison of current quarter weighted average capitalization rates.Source: RERC, 1Q 2009.
Revised July 1, 2009

Copyright© 2009 by Real Estate Research Corporation (RERC) and the CCIM Institute.Investment TrendsQuarterly
139
Denver Transaction Breakdown12-Month Trailing (04/01/08 - 03/31/09)
Office Industrial Retail Apartment Hotel< $5 MillionVolume (Mil) $166 $236 $188 $138 –
Size Weighted Avg. ($ per sf/unit) $113 $78 $130 $51,084 –
Price Weighted Avg. ($ per sf/unit) $145 $91 $190 $56,748 –
Median ($ per sf/unit) $114 $84 $120 $51,852 –
> $5 MillionVolume (Mil) $714 $358 $482 $645 $116
Size Weighted Avg. ($ per sf/unit) $192 $80 $149 $104,717 $95,738
Price Weighted Avg. ($ per sf/unit) $233 $104 $218 $138,023 $201,076
Median ($ per sf/unit) $150 $86 $252 $82,661 $64,386
All TransactionsVolume (Mil) $881 $594 $670 $783 $123
Size Weighted Avg. ($ per sf/unit) $170 $79 $143 $88,348 $82,227
Price Weighted Avg. ($ per sf/unit) $216 $99 $210 $123,680 $190,895
Median ($ per sf/unit) $125 $84 $132 $57,806 $55,631
Capitalization Rates (All Transactions)Weighted Average (%) 7.3 7.2 7.0 6.0 –
Median (%) 7.5 7.4 7.2 6.3 –Source: RERC.
Denver Transaction Trends12-Month Trailing (04/01/08 - 03/31/09)
Office Industrial Retail Apartment HotelMedian Price% Change Quarter Ago -3% 1% -12% -4% -5%
% Change Year Ago 0% 7% -6% -11% -49%
Volume % Change Quarter Ago -32% -18% 3% -24% -62%
% Change Year Ago -76% -24% -31% -57% -81%Source: RERC.
Revised July 1, 2009
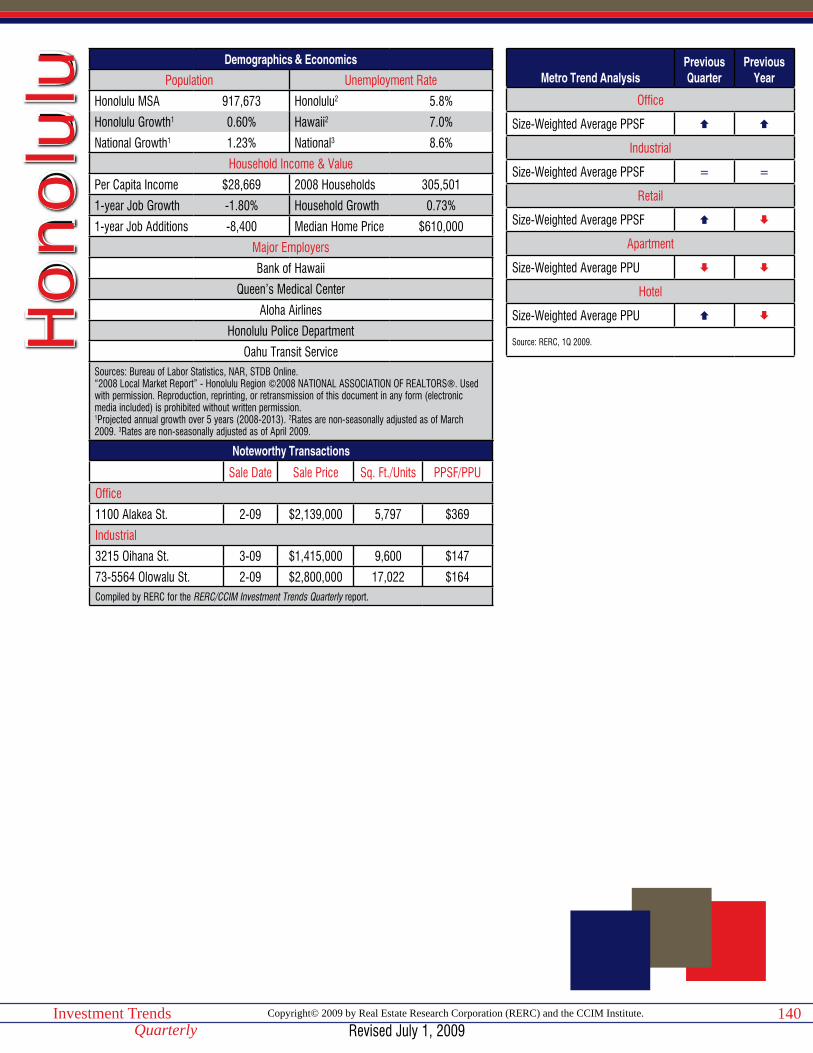
Copyright© 2009 by Real Estate Research Corporation (RERC) and the CCIM Institute.Investment TrendsQuarterly
140
Demographics & Economics
Population Unemployment Rate
Honolulu MSA 917,673 Honolulu2 5.8%
Honolulu Growth1 0.60% Hawaii2 7.0%
National Growth1 1.23% National3 8.6%
Household Income & Value
Per Capita Income $28,669 2008 Households 305,501
1-year Job Growth -1.80% Household Growth 0.73%
1-year Job Additions -8,400 Median Home Price $610,000
Major Employers
Bank of Hawaii
Queen’s Medical Center
Aloha Airlines
Honolulu Police Department
Oahu Transit Service Sources: Bureau of Labor Statistics, NAR, STDB Online.“2008 Local Market Report” - Honolulu Region ©2008 NATIONAL ASSOCIATION OF REALTORS®. Used with permission. Reproduction, reprinting, or retransmission of this document in any form (electronic media included) is prohibited without written permission.1Projected annual growth over 5 years (2008-2013). 2Rates are non-seasonally adjusted as of March 2009. 3Rates are non-seasonally adjusted as of April 2009.
Noteworthy Transactions
Sale Date Sale Price Sq. Ft./Units PPSF/PPU
Office
1100 Alakea St. 2-09 $2,139,000 5,797 $369
Industrial
3215 Oihana St. 3-09 $1,415,000 9,600 $147
73-5564 Olowalu St. 2-09 $2,800,000 17,022 $164Compiled by RERC for the RERC/CCIM Investment Trends Quarterly report.
Ho
nolu
lu Metro Trend AnalysisPrevious Quarter
Previous Year
Office
Size-Weighted Average PPSF
Industrial
Size-Weighted Average PPSF = =
Retail
Size-Weighted Average PPSF
Apartment
Size-Weighted Average PPU
Hotel
Size-Weighted Average PPU
Source: RERC, 1Q 2009.
Revised July 1, 2009

Copyright© 2009 by Real Estate Research Corporation (RERC) and the CCIM Institute.Investment TrendsQuarterly
141
Honolulu Transaction Breakdown12-Month Trailing (04/01/08 - 03/31/09)
Office Industrial Retail Apartment Hotel< $5 MillionVolume (Mil) $12 $37 $9 $13 –
Size Weighted Avg. ($ per sf/unit) $414 $151 $185 $134,595 –
Price Weighted Avg. ($ per sf/unit) $415 $174 $245 $146,119 –
Median ($ per sf/unit) $423 $149 $164 $118,929 –
> $5 MillionVolume (Mil) – $81 – – $526
Size Weighted Avg. ($ per sf/unit) – $197 – – $263,713
Price Weighted Avg. ($ per sf/unit) – $273 – – $298,883
Median ($ per sf/unit) – $248 – – $203,102
All TransactionsVolume (Mil) $39 $118 $15 $13 $526
Size Weighted Avg. ($ per sf/unit) $285 $180 $166 $134,595 $263,713
Price Weighted Avg. ($ per sf/unit) $342 $242 $206 $146,119 $298,883
Median ($ per sf/unit) $390 $164 $142 $118,929 $203,102
Capitalization Rates (All Transactions)Weighted Average (%) – – – – –
Median (%) – – – – –Source: RERC.
Honolulu Transaction Trends12-Month Trailing (04/01/08 - 03/31/09)
Office Industrial Retail Apartment HotelMedian Price% Change Quarter Ago 6% -17% – 0% 4%
% Change Year Ago – -13% – -20% -18%
Volume % Change Quarter Ago -23% -2% – -22% 2%
% Change Year Ago – -7% – -94% -78%Source: RERC.
Revised July 1, 2009

Copyright© 2009 by Real Estate Research Corporation (RERC) and the CCIM Institute.Investment TrendsQuarterly
142
Demographics & Economics
Population Unemployment Rate
Las Vegas MSA 2.0 million Las Vegas2 10.4%
Las Vegas Growth1 4.08% Nevada2 10.5%
National Growth1 1.23% National3 8.6%
Household Income & Value
Per Capita Income $27,934 2008 Households 731,059
1-year Job Growth -1.70% Household Growth 4.04%
1-year Job Additions -15,500 Median Home Price $181,700
Major Employers
Bellagio Hotel
Wynn Las Vegas
MGM Grand Las Vegas
Mirage
Venetian Resort Hotel & CasinoSources: Bureau of Labor Statistics, NAR, STDB Online.“2008 Local Market Report” - Las Vegas Region ©2008 NATIONAL ASSOCIATION OF REALTORS®. Used with permission. Reproduction, reprinting, or retransmission of this document in any form (electronic media included) is prohibited without written permission.1Projected annual growth over 5 years (2008-2013). 2Rates are non-seasonally adjusted as of March 2009. 3Rates are non-seasonally adjusted as of April 2009.
Noteworthy Transactions
Sale Date Sale Price Sq. Ft./Units PPSF/PPU
Office
7130 Smoke Ranch Road 2-09 $12,648,000 95,092 $133
823 S. Sixth St. 2-09 $3,000,000 10,134 $296
Industrial
6340 Sunset Corporate Drive 1-09 $3,000,000 19,924 $151
4111 W. Oquendo Road 3-09 $1,650,000 10,528 $157
Retail
3720 W. Tropicana Ave. 1-09 $7,500,000 20,642 $363
Horizon Village Square 1-09 $3,330,000 8,400 $396
Apartment
Woodcreek Villas 2-09 $7,500,000 75 $100,000Compiled by RERC for the RERC/CCIM Investment Trends Quarterly report.
Market Construction/Redevelopment Activity
Property Type
New(N)/Refurbished(R)
Total Sq.Ft./Units
Estimated Delivery
St. Regis Residences at Venetian Plazzo Multifamily N 398 2010
8845 W. Flamingo Road Office N 17,450 2009
Crowne Plaza Hotel N 386 2010
Par 3 Landscape and Maintenance
Industrial/Office N
28,603/12,000 2009
Sources: CBRE, RE Business.
Las
Ve
ga
sMetro Trend Analysis
Previous Quarter
Previous Year
Office
Size-Weighted Average PPSF
Weighted Average Cap Rate =
Industrial
Size-Weighted Average PPSF
Weighted Average Cap Rate =
Retail
Size-Weighted Average PPSF
Weighted Average Cap Rate
Apartment
Size-Weighted Average PPU
Weighted Average Cap Rate
Hotel
Size-Weighted Average PPU
Metro Cap Rate Comparison* Current Quarter
Office
vs. West Region
vs. Nation
Industrial
vs. West Region
vs. Nation
Retail
vs. West Region
vs. Nation =
Apartment
vs. West Region
vs. Nation =*Comparison of current quarter weighted average capitalization rates.Source: RERC, 1Q 2009.
Revised July 1, 2009

Copyright© 2009 by Real Estate Research Corporation (RERC) and the CCIM Institute.Investment TrendsQuarterly
143
Las Vegas Transaction Breakdown12-Month Trailing (04/01/08 - 03/31/09)
Office Industrial Retail Apartment Hotel< $5 MillionVolume (Mil) $77 $103 $105 $18 –
Size Weighted Avg. ($ per sf/unit) $248 $162 $195 $69,663 –
Price Weighted Avg. ($ per sf/unit) $265 $184 $241 $77,709 –
Median ($ per sf/unit) $245 $167 $203 $68,714 –
> $5 MillionVolume (Mil) $145 $118 $134 $243 $821
Size Weighted Avg. ($ per sf/unit) $247 $82 $301 $79,461 $240,926
Price Weighted Avg. ($ per sf/unit) $275 $122 $358 $97,008 $259,406
Median ($ per sf/unit) $295 $100 $339 $99,753 $127,639
All TransactionsVolume (Mil) $223 $221 $239 $261 $822
Size Weighted Avg. ($ per sf/unit) $247 $106 $243 $78,715 $239,187
Price Weighted Avg. ($ per sf/unit) $272 $151 $307 $95,707 $259,075
Median ($ per sf/unit) $249 $165 $228 $73,585 $97,339
Capitalization Rates (All Transactions)Weighted Average (%) 6.8 6.5 6.9 6.1 –
Median (%) 7.2 6.5 7.1 6.2 –Source: RERC.
Las Vegas Transaction Trends12-Month Trailing (04/01/08 - 03/31/09)
Office Industrial Retail Apartment HotelMedian Price% Change Quarter Ago 0% -3% -9% 0% -29%
% Change Year Ago 0% 5% -14% -10% -46%
Volume % Change Quarter Ago -33% -16% -60% -29% -60%
% Change Year Ago -76% -67% -80% -71% -93%Source: RERC.
Revised July 1, 2009
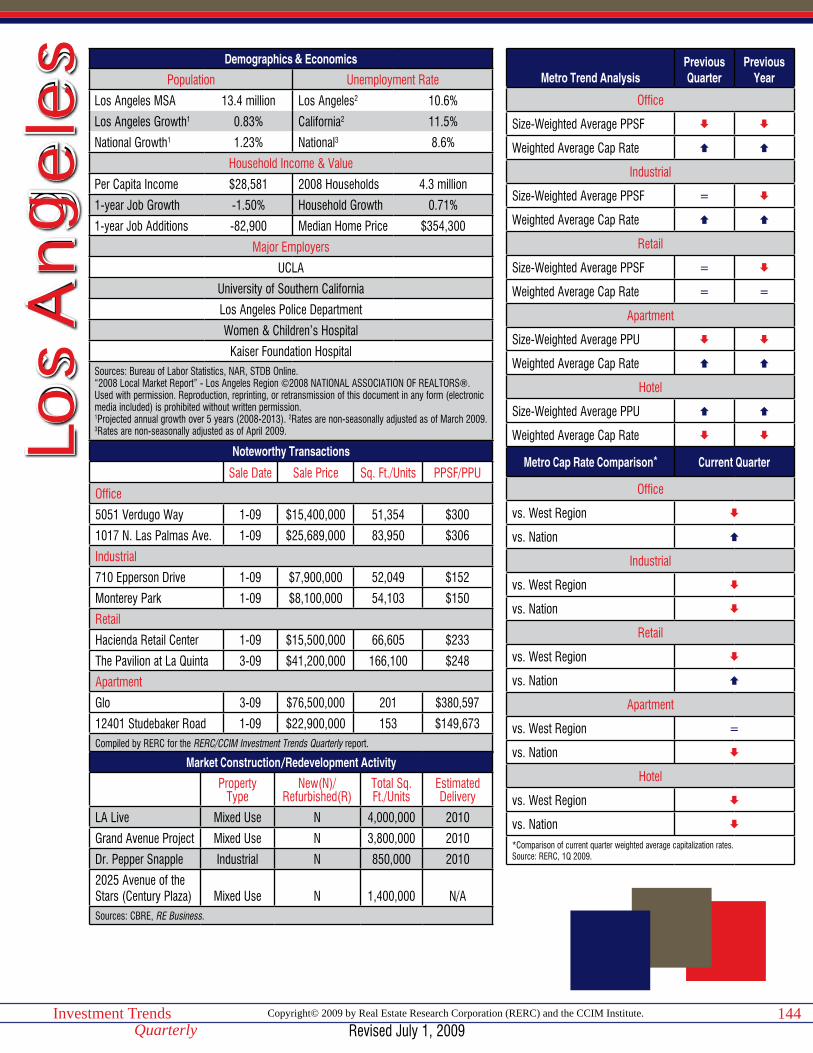
Copyright© 2009 by Real Estate Research Corporation (RERC) and the CCIM Institute.Investment TrendsQuarterly
144
Demographics & Economics
Population Unemployment Rate
Los Angeles MSA 13.4 million Los Angeles2 10.6%
Los Angeles Growth1 0.83% California2 11.5%
National Growth1 1.23% National3 8.6%
Household Income & Value
Per Capita Income $28,581 2008 Households 4.3 million
1-year Job Growth -1.50% Household Growth 0.71%
1-year Job Additions -82,900 Median Home Price $354,300
Major Employers
UCLA
University of Southern California
Los Angeles Police Department
Women & Children’s Hospital
Kaiser Foundation HospitalSources: Bureau of Labor Statistics, NAR, STDB Online.“2008 Local Market Report” - Los Angeles Region ©2008 NATIONAL ASSOCIATION OF REALTORS®. Used with permission. Reproduction, reprinting, or retransmission of this document in any form (electronic media included) is prohibited without written permission.1Projected annual growth over 5 years (2008-2013). 2Rates are non-seasonally adjusted as of March 2009. 3Rates are non-seasonally adjusted as of April 2009.
Noteworthy Transactions
Sale Date Sale Price Sq. Ft./Units PPSF/PPU
Office
5051 Verdugo Way 1-09 $15,400,000 51,354 $300
1017 N. Las Palmas Ave. 1-09 $25,689,000 83,950 $306
Industrial
710 Epperson Drive 1-09 $7,900,000 52,049 $152
Monterey Park 1-09 $8,100,000 54,103 $150
Retail
Hacienda Retail Center 1-09 $15,500,000 66,605 $233
The Pavilion at La Quinta 3-09 $41,200,000 166,100 $248
Apartment
Glo 3-09 $76,500,000 201 $380,597
12401 Studebaker Road 1-09 $22,900,000 153 $149,673Compiled by RERC for the RERC/CCIM Investment Trends Quarterly report.
Market Construction/Redevelopment Activity
Property Type
New(N)/Refurbished(R)
Total Sq. Ft./Units
Estimated Delivery
LA Live Mixed Use N 4,000,000 2010
Grand Avenue Project Mixed Use N 3,800,000 2010
Dr. Pepper Snapple Industrial N 850,000 2010
2025 Avenue of the Stars (Century Plaza) Mixed Use N 1,400,000 N/ASources: CBRE, RE Business.
Los
Ang
ele
sMetro Trend Analysis
Previous Quarter
Previous Year
Office
Size-Weighted Average PPSF
Weighted Average Cap Rate
Industrial
Size-Weighted Average PPSF =
Weighted Average Cap Rate
Retail
Size-Weighted Average PPSF =
Weighted Average Cap Rate = =
Apartment
Size-Weighted Average PPU
Weighted Average Cap Rate
Hotel
Size-Weighted Average PPU
Weighted Average Cap Rate
Metro Cap Rate Comparison* Current Quarter
Office
vs. West Region
vs. Nation
Industrial
vs. West Region
vs. Nation
Retail
vs. West Region
vs. Nation
Apartment
vs. West Region =
vs. Nation
Hotel
vs. West Region
vs. Nation
*Comparison of current quarter weighted average capitalization rates.Source: RERC, 1Q 2009.
Revised July 1, 2009

Copyright© 2009 by Real Estate Research Corporation (RERC) and the CCIM Institute.Investment TrendsQuarterly
145
Los Angeles Transaction Breakdown12-Month Trailing (04/01/08 - 03/31/09)
Office Industrial Retail Apartment Hotel< $5 MillionVolume (Mil) $420 $931 $658 $978 $14
Size Weighted Avg. ($ per sf/unit) $208 $117 $190 $124,663 $79,853
Price Weighted Avg. ($ per sf/unit) $265 $148 $277 $146,058 $83,176
Median ($ per sf/unit) $221 $137 $190 $120,000 $82,624
> $5 MillionVolume (Mil) $3,199 $1,789 $1,513 $1,331 $1,016
Size Weighted Avg. ($ per sf/unit) $283 $121 $310 $162,641 $226,497
Price Weighted Avg. ($ per sf/unit) $335 $147 $420 $206,252 $317,110
Median ($ per sf/unit) $264 $126 $397 $166,815 $158,265
All TransactionsVolume (Mil) $3,619 $2,720 $2,171 $2,309 $1,030
Size Weighted Avg. ($ per sf/unit) $271 $120 $260 $144,049 $221,143
Price Weighted Avg. ($ per sf/unit) $327 $147 $377 $180,750 $314,026
Median ($ per sf/unit) $239 $133 $241 $125,000 $141,474
Capitalization Rates (All Transactions)Weighted Average (%) 6.1 6.6 6.0 5.8 6.0
Median (%) 6.5 6.5 6.1 5.7 8.0 Source: RERC.
Los Angeles Transaction Trends12-Month Trailing (04/01/08 - 03/31/09)
Office Industrial Retail Apartment HotelMedian Price% Change Quarter Ago -5% -1% -3% -4% –
% Change Year Ago -11% -5% -1% -1% –
Volume % Change Quarter Ago -39% -20% -9% -19% –
% Change Year Ago -75% -52% -50% -72% –Source: RERC.
Revised July 1, 2009
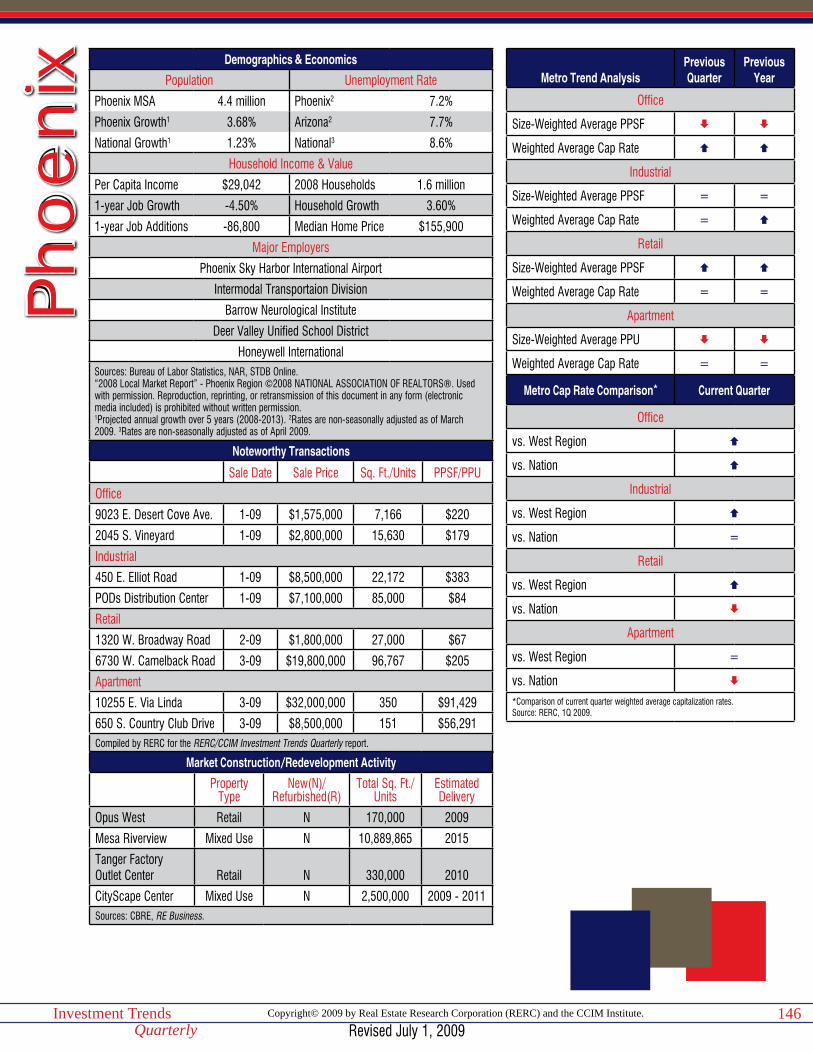
Copyright© 2009 by Real Estate Research Corporation (RERC) and the CCIM Institute.Investment TrendsQuarterly
146
Demographics & Economics
Population Unemployment Rate
Phoenix MSA 4.4 million Phoenix2 7.2%
Phoenix Growth1 3.68% Arizona2 7.7%
National Growth1 1.23% National3 8.6%
Household Income & Value
Per Capita Income $29,042 2008 Households 1.6 million
1-year Job Growth -4.50% Household Growth 3.60%
1-year Job Additions -86,800 Median Home Price $155,900
Major Employers
Phoenix Sky Harbor International Airport
Intermodal Transportaion Division
Barrow Neurological Institute
Deer Valley Unified School District
Honeywell InternationalSources: Bureau of Labor Statistics, NAR, STDB Online.“2008 Local Market Report” - Phoenix Region ©2008 NATIONAL ASSOCIATION OF REALTORS®. Used with permission. Reproduction, reprinting, or retransmission of this document in any form (electronic media included) is prohibited without written permission.1Projected annual growth over 5 years (2008-2013). 2Rates are non-seasonally adjusted as of March 2009. 3Rates are non-seasonally adjusted as of April 2009.
Noteworthy Transactions
Sale Date Sale Price Sq. Ft./Units PPSF/PPU
Office
9023 E. Desert Cove Ave. 1-09 $1,575,000 7,166 $220
2045 S. Vineyard 1-09 $2,800,000 15,630 $179
Industrial
450 E. Elliot Road 1-09 $8,500,000 22,172 $383
PODs Distribution Center 1-09 $7,100,000 85,000 $84
Retail
1320 W. Broadway Road 2-09 $1,800,000 27,000 $67
6730 W. Camelback Road 3-09 $19,800,000 96,767 $205
Apartment
10255 E. Via Linda 3-09 $32,000,000 350 $91,429
650 S. Country Club Drive 3-09 $8,500,000 151 $56,291Compiled by RERC for the RERC/CCIM Investment Trends Quarterly report.
Market Construction/Redevelopment Activity
Property Type
New(N)/Refurbished(R)
Total Sq. Ft./Units
Estimated Delivery
Opus West Retail N 170,000 2009
Mesa Riverview Mixed Use N 10,889,865 2015
Tanger FactoryOutlet Center Retail N 330,000 2010
CityScape Center Mixed Use N 2,500,000 2009 - 2011Sources: CBRE, RE Business.
Pho
eni
x Metro Trend AnalysisPrevious Quarter
Previous Year
Office
Size-Weighted Average PPSF
Weighted Average Cap Rate
Industrial
Size-Weighted Average PPSF = =
Weighted Average Cap Rate =
Retail
Size-Weighted Average PPSF
Weighted Average Cap Rate = =
Apartment
Size-Weighted Average PPU
Weighted Average Cap Rate = =
Metro Cap Rate Comparison* Current Quarter
Office
vs. West Region
vs. Nation
Industrial
vs. West Region
vs. Nation =
Retail
vs. West Region
vs. Nation
Apartment
vs. West Region =
vs. Nation
*Comparison of current quarter weighted average capitalization rates.Source: RERC, 1Q 2009.
Revised July 1, 2009

Copyright© 2009 by Real Estate Research Corporation (RERC) and the CCIM Institute.Investment TrendsQuarterly
147
Phoenix Transaction Breakdown12-Month Trailing (04/01/08 - 03/31/09)
Office Industrial Retail Apartment Hotel< $5 MillionVolume (Mil) $182 $253 $212 $57 –
Size Weighted Avg. ($ per sf/unit) $143 $90 $150 $47,125 –
Price Weighted Avg. ($ per sf/unit) $177 $122 $220 $64,695 –
Median ($ per sf/unit) $160 $102 $135 $53,125 –
> $5 MillionVolume (Mil) $472 $417 $557 $417 –
Size Weighted Avg. ($ per sf/unit) $170 $86 $242 $95,001 –
Price Weighted Avg. ($ per sf/unit) $213 $104 $313 $104,930 –
Median ($ per sf/unit) $169 $91 $323 $91,678 –
All TransactionsVolume (Mil) $654 $670 $769 $474 –
Size Weighted Avg. ($ per sf/unit) $162 $87 $207 $84,710 –
Price Weighted Avg. ($ per sf/unit) $203 $111 $287 $100,119 –
Median ($ per sf/unit) $164 $100 $162 $56,775 –
Capitalization Rates (All Transactions)Weighted Average (%) 8.0 7.1 6.5 5.7 –
Median (%) 7.7 8.0 6.6 5.8 –Source: RERC.
Phoenix Transaction Trends12-Month Trailing (04/01/08 - 03/31/09)
Office Industrial Retail Apartment HotelMedian Price% Change Quarter Ago -1% 1% -5% -14% –
% Change Year Ago -1% -6% -10% -21% –
Volume % Change Quarter Ago -52% -56% -16% -34% –
% Change Year Ago -86% -78% -53% -86% –Source: RERC.
Revised July 1, 2009
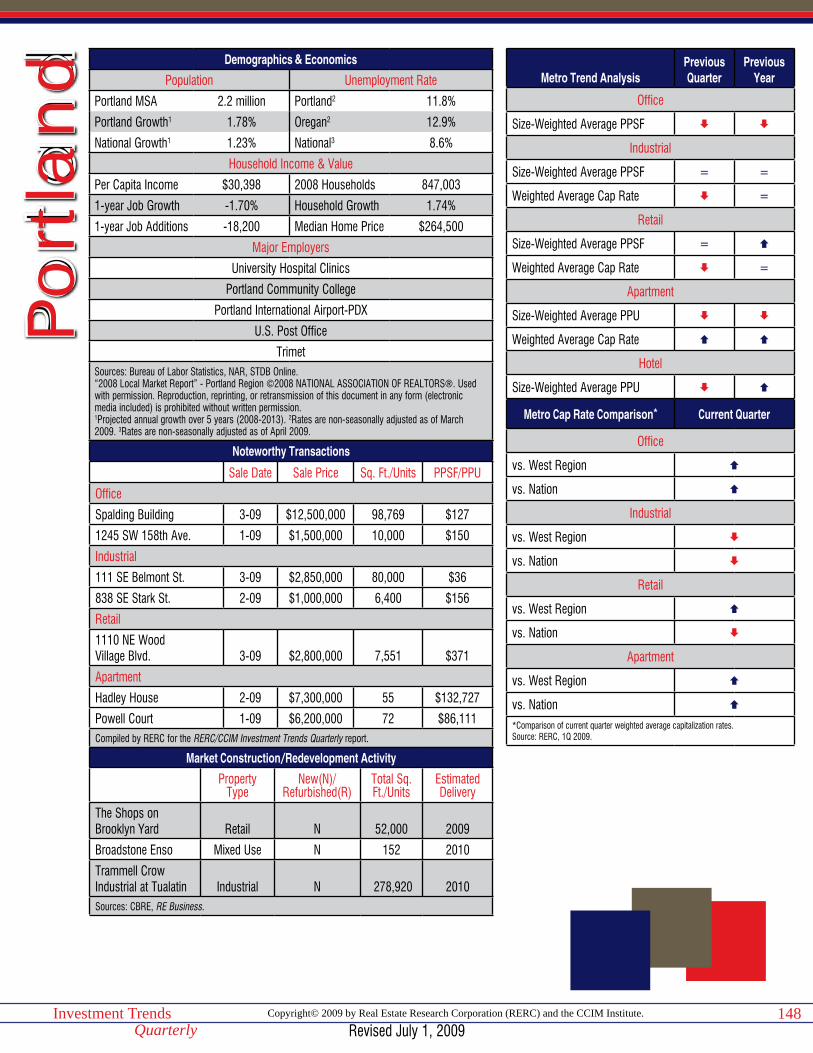
Copyright© 2009 by Real Estate Research Corporation (RERC) and the CCIM Institute.Investment TrendsQuarterly
148
Demographics & Economics
Population Unemployment Rate
Portland MSA 2.2 million Portland2 11.8%
Portland Growth1 1.78% Oregan2 12.9%
National Growth1 1.23% National3 8.6%
Household Income & Value
Per Capita Income $30,398 2008 Households 847,003
1-year Job Growth -1.70% Household Growth 1.74%
1-year Job Additions -18,200 Median Home Price $264,500
Major Employers
University Hospital Clinics
Portland Community College
Portland International Airport-PDX
U.S. Post Office
TrimetSources: Bureau of Labor Statistics, NAR, STDB Online.“2008 Local Market Report” - Portland Region ©2008 NATIONAL ASSOCIATION OF REALTORS®. Used with permission. Reproduction, reprinting, or retransmission of this document in any form (electronic media included) is prohibited without written permission.1Projected annual growth over 5 years (2008-2013). 2Rates are non-seasonally adjusted as of March 2009. 3Rates are non-seasonally adjusted as of April 2009.
Noteworthy Transactions
Sale Date Sale Price Sq. Ft./Units PPSF/PPU
Office
Spalding Building 3-09 $12,500,000 98,769 $127
1245 SW 158th Ave. 1-09 $1,500,000 10,000 $150
Industrial
111 SE Belmont St. 3-09 $2,850,000 80,000 $36
838 SE Stark St. 2-09 $1,000,000 6,400 $156
Retail
1110 NE WoodVillage Blvd. 3-09 $2,800,000 7,551 $371
Apartment
Hadley House 2-09 $7,300,000 55 $132,727
Powell Court 1-09 $6,200,000 72 $86,111Compiled by RERC for the RERC/CCIM Investment Trends Quarterly report.
Market Construction/Redevelopment Activity
Property Type
New(N)/Refurbished(R)
Total Sq. Ft./Units
Estimated Delivery
The Shops onBrooklyn Yard Retail N 52,000 2009
Broadstone Enso Mixed Use N 152 2010
Trammell Crow Industrial at Tualatin Industrial N 278,920 2010Sources: CBRE, RE Business.
Port
land
Metro Trend AnalysisPrevious Quarter
Previous Year
Office
Size-Weighted Average PPSF
Industrial
Size-Weighted Average PPSF = =
Weighted Average Cap Rate =
Retail
Size-Weighted Average PPSF =
Weighted Average Cap Rate =
Apartment
Size-Weighted Average PPU
Weighted Average Cap Rate
Hotel
Size-Weighted Average PPU
Metro Cap Rate Comparison* Current Quarter
Office
vs. West Region
vs. Nation
Industrial
vs. West Region
vs. Nation
Retail
vs. West Region
vs. Nation
Apartment
vs. West Region
vs. Nation
*Comparison of current quarter weighted average capitalization rates.Source: RERC, 1Q 2009.
Revised July 1, 2009

Copyright© 2009 by Real Estate Research Corporation (RERC) and the CCIM Institute.Investment TrendsQuarterly
149
Portland Transaction Breakdown12-Month Trailing (04/01/08 - 03/31/09)
Office Industrial Retail Apartment Hotel< $5 MillionVolume (Mil) $51 $76 $31 $114 $7
Size Weighted Avg. ($ per sf/unit) $135 $77 $120 $66,369 $43,006
Price Weighted Avg. ($ per sf/unit) $150 $93 $176 $74,604 $46,563
Median ($ per sf/unit) $131 $84 $115 $69,444 $37,210
> $5 MillionVolume (Mil) $223 $151 $86 $252 –
Size Weighted Avg. ($ per sf/unit) $161 $95 $244 $97,063 –
Price Weighted Avg. ($ per sf/unit) $185 $117 $373 $99,293 –
Median ($ per sf/unit) $214 $105 $326 $91,837 –
All TransactionsVolume (Mil) $273 $227 $117 $366 $54
Size Weighted Avg. ($ per sf/unit) $155 $88 $191 $84,858 $122,792
Price Weighted Avg. ($ per sf/unit) $178 $109 $320 $91,615 $160,476
Median ($ per sf/unit) $150 $88 $165 $75,188 $50,786
Capitalization Rates (All Transactions)Weighted Average (%) 8.1 6.5 6.7 6.7 –
Median (%) 8.1 6.6 6.8 6.4 –Source: RERC.
Portland Transaction Trends12-Month Trailing (04/01/08 - 03/31/09)
Office Industrial Retail Apartment HotelMedian Price% Change Quarter Ago -1% -10% -1% -6% -48%
% Change Year Ago -6% 1% 10% 0% -44%
Volume % Change Quarter Ago -22% -25% -28% -57% 7%
% Change Year Ago -77% -56% -68% -64% -79%Source: RERC.
Revised July 1, 2009
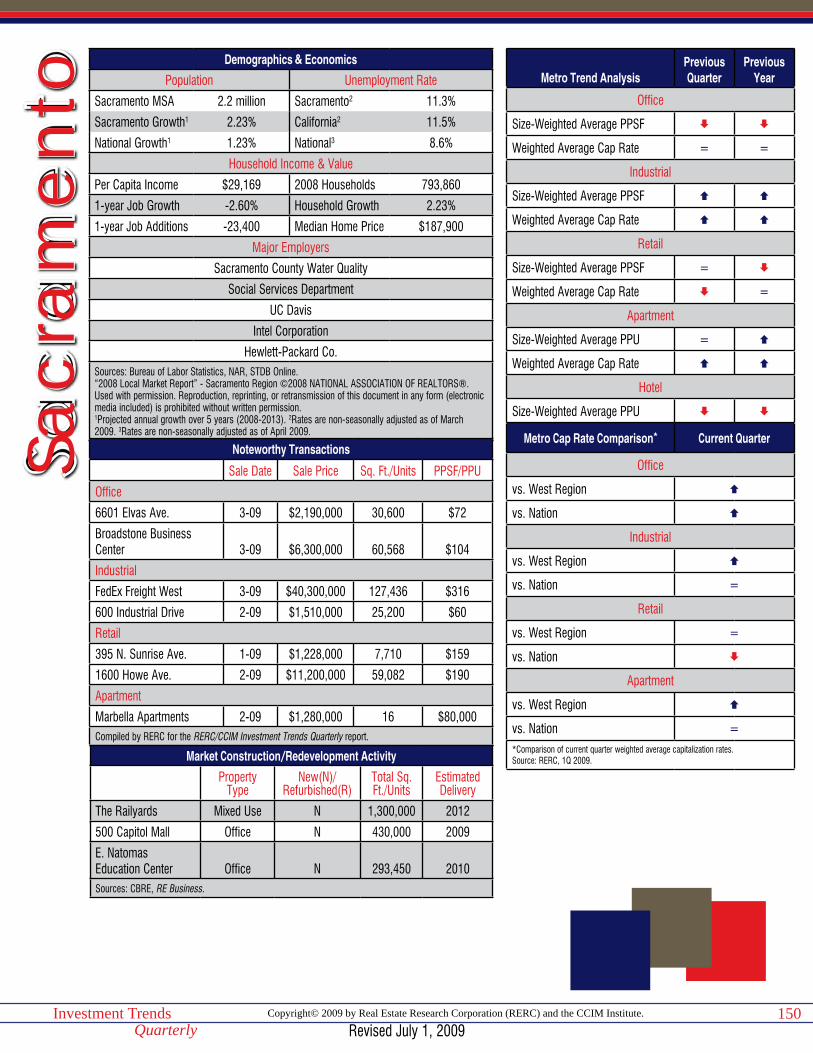
Copyright© 2009 by Real Estate Research Corporation (RERC) and the CCIM Institute.Investment TrendsQuarterly
150
Demographics & Economics
Population Unemployment Rate
Sacramento MSA 2.2 million Sacramento2 11.3%
Sacramento Growth1 2.23% California2 11.5%
National Growth1 1.23% National3 8.6%
Household Income & Value
Per Capita Income $29,169 2008 Households 793,860
1-year Job Growth -2.60% Household Growth 2.23%
1-year Job Additions -23,400 Median Home Price $187,900
Major Employers
Sacramento County Water Quality
Social Services Department
UC Davis
Intel Corporation
Hewlett-Packard Co.Sources: Bureau of Labor Statistics, NAR, STDB Online.“2008 Local Market Report” - Sacramento Region ©2008 NATIONAL ASSOCIATION OF REALTORS®. Used with permission. Reproduction, reprinting, or retransmission of this document in any form (electronic media included) is prohibited without written permission.1Projected annual growth over 5 years (2008-2013). 2Rates are non-seasonally adjusted as of March 2009. 3Rates are non-seasonally adjusted as of April 2009.
Noteworthy Transactions
Sale Date Sale Price Sq. Ft./Units PPSF/PPU
Office
6601 Elvas Ave. 3-09 $2,190,000 30,600 $72
Broadstone Business Center 3-09 $6,300,000 60,568 $104
Industrial
FedEx Freight West 3-09 $40,300,000 127,436 $316
600 Industrial Drive 2-09 $1,510,000 25,200 $60
Retail
395 N. Sunrise Ave. 1-09 $1,228,000 7,710 $159
1600 Howe Ave. 2-09 $11,200,000 59,082 $190
Apartment
Marbella Apartments 2-09 $1,280,000 16 $80,000Compiled by RERC for the RERC/CCIM Investment Trends Quarterly report.
Market Construction/Redevelopment Activity
Property Type
New(N)/Refurbished(R)
Total Sq. Ft./Units
Estimated Delivery
The Railyards Mixed Use N 1,300,000 2012
500 Capitol Mall Office N 430,000 2009
E. NatomasEducation Center Office N 293,450 2010Sources: CBRE, RE Business.
Sac
ram
ent
o Metro Trend AnalysisPrevious Quarter
Previous Year
Office
Size-Weighted Average PPSF
Weighted Average Cap Rate = =
Industrial
Size-Weighted Average PPSF
Weighted Average Cap Rate
Retail
Size-Weighted Average PPSF =
Weighted Average Cap Rate =
Apartment
Size-Weighted Average PPU =
Weighted Average Cap Rate
Hotel
Size-Weighted Average PPU
Metro Cap Rate Comparison* Current Quarter
Office
vs. West Region
vs. Nation
Industrial
vs. West Region
vs. Nation =
Retail
vs. West Region =
vs. Nation
Apartment
vs. West Region
vs. Nation =*Comparison of current quarter weighted average capitalization rates.Source: RERC, 1Q 2009.
Revised July 1, 2009

Copyright© 2009 by Real Estate Research Corporation (RERC) and the CCIM Institute.Investment TrendsQuarterly
151
Sacramento Transaction Breakdown12-Month Trailing (04/01/08 - 03/31/09)
Office Industrial Retail Apartment Hotel< $5 MillionVolume (Mil) $37 $52 $44 $26 –
Size Weighted Avg. ($ per sf/unit) $166 $81 $189 $74,027 –
Price Weighted Avg. ($ per sf/unit) $208 $99 $298 $81,706 –
Median ($ per sf/unit) $166 $81 $238 $75,000 –
> $5 MillionVolume (Mil) $139 $60 $67 $440 –
Size Weighted Avg. ($ per sf/unit) $179 $198 $189 $111,586 –
Price Weighted Avg. ($ per sf/unit) $181 $253 $227 $118,979 –
Median ($ per sf/unit) $191 $142 $259 $101,250 –
All TransactionsVolume (Mil) $176 $112 $111 $466 $34
Size Weighted Avg. ($ per sf/unit) $176 $118 $189 $108,490 $75,889
Price Weighted Avg. ($ per sf/unit) $187 $181 $256 $116,883 $84,011
Median ($ per sf/unit) $179 $95 $240 $92,619 $64,926
Capitalization Rates (All Transactions)Weighted Average (%) 6.9 7.1 6.4 6.1 –
Median (%) 7.0 7.1 6.3 5.6 –Source: RERC.
Sacramento Transaction Trends12-Month Trailing (04/01/08 - 03/31/09)
Office Industrial Retail Apartment HotelMedian Price% Change Quarter Ago -1% – 2% 2% -35%
% Change Year Ago -38% 12% 3% 13% -33%
Volume % Change Quarter Ago -43% – -33% -15% -6%
% Change Year Ago -91% -46% -80% -5% -89%Source: RERC.
Revised July 1, 2009
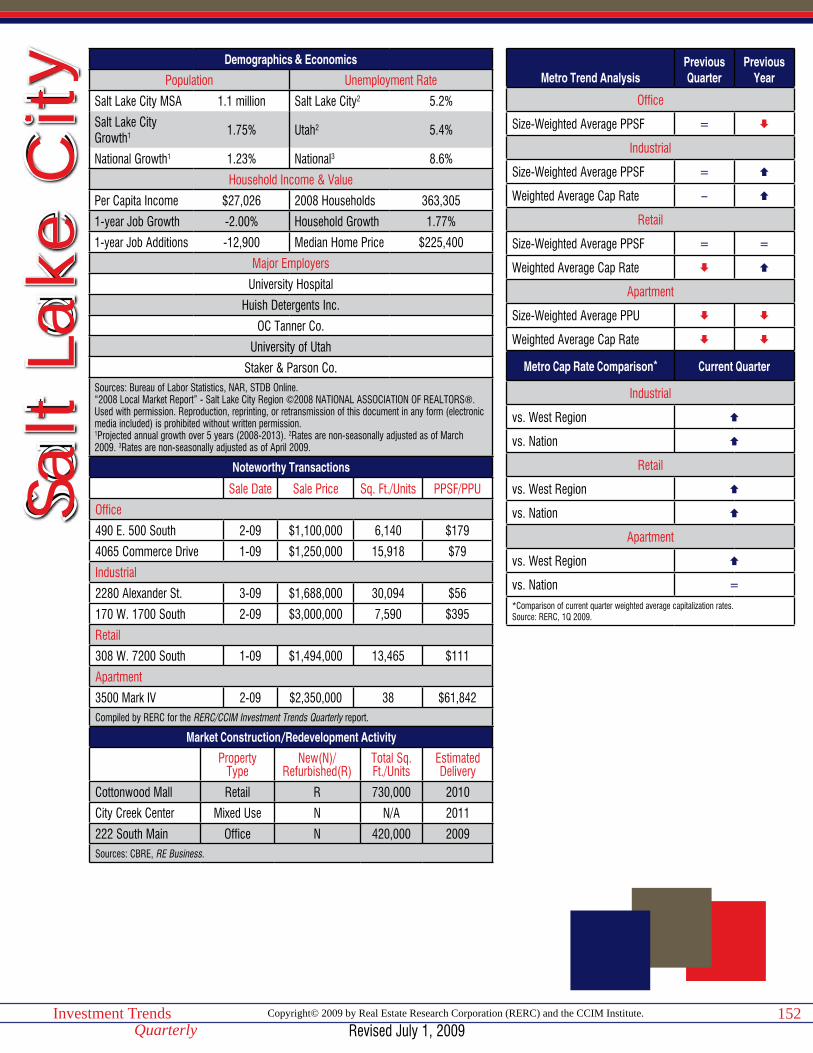
Copyright© 2009 by Real Estate Research Corporation (RERC) and the CCIM Institute.Investment TrendsQuarterly
152
Demographics & Economics
Population Unemployment Rate
Salt Lake City MSA 1.1 million Salt Lake City2 5.2%
Salt Lake City Growth1 1.75% Utah2 5.4%
National Growth1 1.23% National3 8.6%
Household Income & Value
Per Capita Income $27,026 2008 Households 363,305
1-year Job Growth -2.00% Household Growth 1.77%
1-year Job Additions -12,900 Median Home Price $225,400
Major Employers
University Hospital
Huish Detergents Inc.
OC Tanner Co.
University of Utah
Staker & Parson Co.Sources: Bureau of Labor Statistics, NAR, STDB Online.“2008 Local Market Report” - Salt Lake City Region ©2008 NATIONAL ASSOCIATION OF REALTORS®. Used with permission. Reproduction, reprinting, or retransmission of this document in any form (electronic media included) is prohibited without written permission.1Projected annual growth over 5 years (2008-2013). 2Rates are non-seasonally adjusted as of March 2009. 3Rates are non-seasonally adjusted as of April 2009.
Noteworthy Transactions
Sale Date Sale Price Sq. Ft./Units PPSF/PPU
Office
490 E. 500 South 2-09 $1,100,000 6,140 $179
4065 Commerce Drive 1-09 $1,250,000 15,918 $79
Industrial
2280 Alexander St. 3-09 $1,688,000 30,094 $56
170 W. 1700 South 2-09 $3,000,000 7,590 $395
Retail
308 W. 7200 South 1-09 $1,494,000 13,465 $111
Apartment
3500 Mark IV 2-09 $2,350,000 38 $61,842Compiled by RERC for the RERC/CCIM Investment Trends Quarterly report.
Market Construction/Redevelopment Activity
Property Type
New(N)/Refurbished(R)
Total Sq. Ft./Units
Estimated Delivery
Cottonwood Mall Retail R 730,000 2010
City Creek Center Mixed Use N N/A 2011
222 South Main Office N 420,000 2009Sources: CBRE, RE Business.
Salt
Lake
City Metro Trend Analysis
Previous Quarter
Previous Year
Office
Size-Weighted Average PPSF =
Industrial
Size-Weighted Average PPSF =
Weighted Average Cap Rate –
Retail
Size-Weighted Average PPSF = =
Weighted Average Cap Rate
Apartment
Size-Weighted Average PPU
Weighted Average Cap Rate
Metro Cap Rate Comparison* Current Quarter
Industrial
vs. West Region
vs. Nation
Retail
vs. West Region
vs. Nation
Apartment
vs. West Region
vs. Nation =*Comparison of current quarter weighted average capitalization rates.Source: RERC, 1Q 2009.
Revised July 1, 2009

Copyright© 2009 by Real Estate Research Corporation (RERC) and the CCIM Institute.Investment TrendsQuarterly
153
Salt Lake City Transaction Breakdown12-Month Trailing (04/01/08 - 03/31/09)
Office Industrial Retail Apartment Hotel< $5 MillionVolume (Mil) $65 $50 $55 $8 –
Size Weighted Avg. $111 $71 $120 $53,119 –
Price Weighted Avg. $142 $101 $156 $56,799 –
Median $115 $66 $140 $55,714 –
> $5 MillionVolume (Mil) – $79 – $112 –
Size Weighted Avg. – $76 – $84,958 –
Price Weighted Avg. – $87 – $85,445 –
Median – $69 – $82,996 –
All TransactionsVolume (Mil) $112 $130 $55 $120 –
Size Weighted Avg. $141 $74 $120 $81,848 –
Price Weighted Avg. $182 $92 $156 $83,630 –
Median $115 $69 $140 $67,929 –
Capitalization Rates (All Transactions)Weighted Average – 7.7 7.9 6.2 –
Median – 7.7 7.8 6.0 –Source: RERC.
Salt Lake City Transaction Trends12-Month Trailing (04/01/08 - 03/31/09)
Office Industrial Retail Apartment HotelMedian Price% Change Quarter Ago -6% -8% 7% -8% –
% Change Year Ago 4% 7% 8% -15% –
Volume % Change Quarter Ago -9% -23% -36% -36% –
% Change Year Ago -81% -35% -74% -67% –Source: RERC.
Revised July 1, 2009
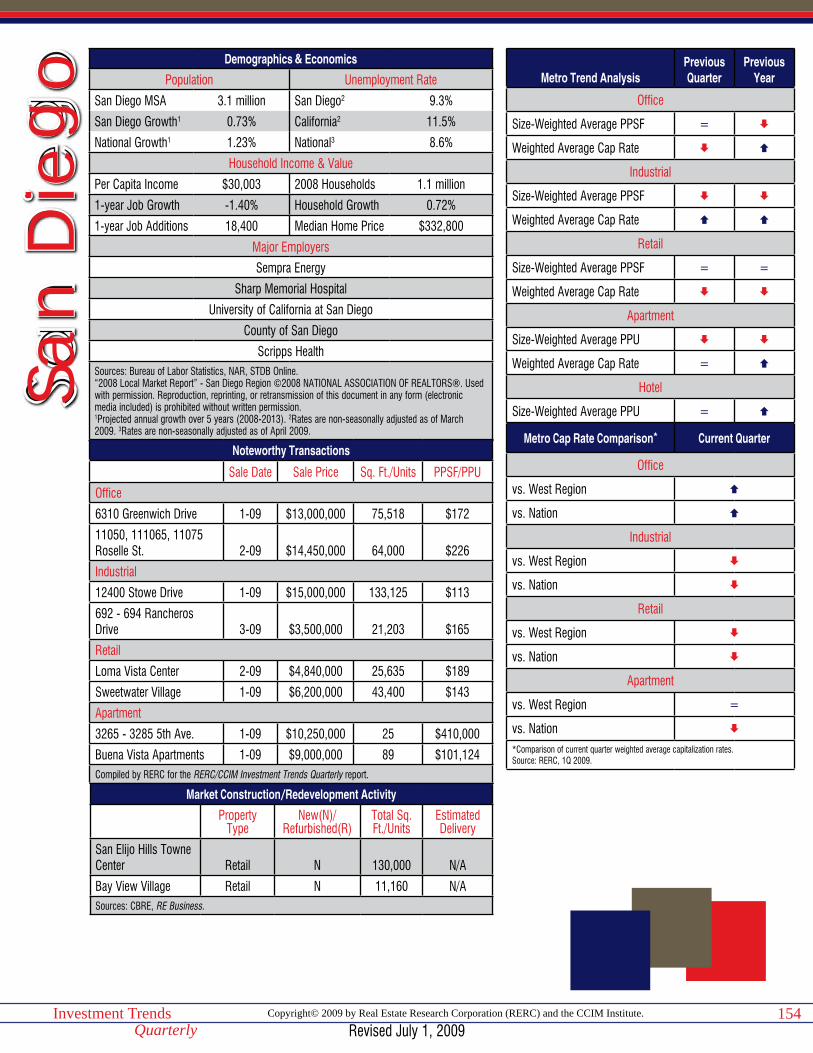
Copyright© 2009 by Real Estate Research Corporation (RERC) and the CCIM Institute.Investment TrendsQuarterly
154
Demographics & Economics
Population Unemployment Rate
San Diego MSA 3.1 million San Diego2 9.3%
San Diego Growth1 0.73% California2 11.5%
National Growth1 1.23% National3 8.6%
Household Income & Value
Per Capita Income $30,003 2008 Households 1.1 million
1-year Job Growth -1.40% Household Growth 0.72%
1-year Job Additions 18,400 Median Home Price $332,800
Major Employers
Sempra Energy
Sharp Memorial Hospital
University of California at San Diego
County of San Diego
Scripps HealthSources: Bureau of Labor Statistics, NAR, STDB Online.“2008 Local Market Report” - San Diego Region ©2008 NATIONAL ASSOCIATION OF REALTORS®. Used with permission. Reproduction, reprinting, or retransmission of this document in any form (electronic media included) is prohibited without written permission.1Projected annual growth over 5 years (2008-2013). 2Rates are non-seasonally adjusted as of March 2009. 3Rates are non-seasonally adjusted as of April 2009.
Noteworthy Transactions
Sale Date Sale Price Sq. Ft./Units PPSF/PPU
Office
6310 Greenwich Drive 1-09 $13,000,000 75,518 $172
11050, 111065, 11075 Roselle St. 2-09 $14,450,000 64,000 $226
Industrial
12400 Stowe Drive 1-09 $15,000,000 133,125 $113
692 - 694 Rancheros Drive 3-09 $3,500,000 21,203 $165
Retail
Loma Vista Center 2-09 $4,840,000 25,635 $189
Sweetwater Village 1-09 $6,200,000 43,400 $143
Apartment
3265 - 3285 5th Ave. 1-09 $10,250,000 25 $410,000
Buena Vista Apartments 1-09 $9,000,000 89 $101,124Compiled by RERC for the RERC/CCIM Investment Trends Quarterly report.
Market Construction/Redevelopment Activity
Property Type
New(N)/Refurbished(R)
Total Sq. Ft./Units
Estimated Delivery
San Elijo Hills Towne Center Retail N 130,000 N/A
Bay View Village Retail N 11,160 N/ASources: CBRE, RE Business.
San
Die
go Metro Trend Analysis
Previous Quarter
Previous Year
Office
Size-Weighted Average PPSF =
Weighted Average Cap Rate
Industrial
Size-Weighted Average PPSF
Weighted Average Cap Rate
Retail
Size-Weighted Average PPSF = =
Weighted Average Cap Rate
Apartment
Size-Weighted Average PPU
Weighted Average Cap Rate =
Hotel
Size-Weighted Average PPU =
Metro Cap Rate Comparison* Current Quarter
Office
vs. West Region
vs. Nation
Industrial
vs. West Region
vs. Nation
Retail
vs. West Region
vs. Nation
Apartment
vs. West Region =
vs. Nation
*Comparison of current quarter weighted average capitalization rates.Source: RERC, 1Q 2009.
Revised July 1, 2009

Copyright© 2009 by Real Estate Research Corporation (RERC) and the CCIM Institute.Investment TrendsQuarterly
155
San Diego Transaction Breakdown12-Month Trailing (04/01/08 - 03/31/09)
Office Industrial Retail Apartment Hotel< $5 MillionVolume (Mil) $75 $160 $143 $170 –
Size Weighted Avg. ($ per sf/unit) $196 $136 $218 $111,720 –
Price Weighted Avg. ($ per sf/unit) $229 $164 $293 $130,633 –
Median ($ per sf/unit) $207 $160 $225 $110,000 –
> $5 MillionVolume (Mil) $1,007 $364 $161 $792 $111
Size Weighted Avg. ($ per sf/unit) $334 $163 $236 $130,645 $130,493
Price Weighted Avg. ($ per sf/unit) $385 $189 $328 $148,624 $179,848
Median ($ per sf/unit) $299 $170 $289 $130,760 $92,574
All TransactionsVolume (Mil) $1,082 $524 $304 $961 $111
Size Weighted Avg. ($ per sf/unit) $319 $154 $228 $126,850 $130,493
Price Weighted Avg. ($ per sf/unit) $375 $181 $311 $145,446 $179,848
Median ($ per sf/unit) $249 $164 $231 $118,342 $92,574
Capitalization Rates (All Transactions)Weighted Average (%) 6.5 6.6 5.5 5.6 –
Median (%) 6.7 6.5 5.8 6.0 –Source: RERC.
San Diego Transaction Trends12-Month Trailing (04/01/08 - 03/31/09)
Office Industrial Retail Apartment HotelMedian Price% Change Quarter Ago -1% -2% -1% -3% -4%
% Change Year Ago -3% 3% 9% 0% -19%
Volume % Change Quarter Ago -18% -6% -28% -5% -14%
% Change Year Ago -77% -75% -73% -40% -70%Source: RERC.
Revised July 1, 2009
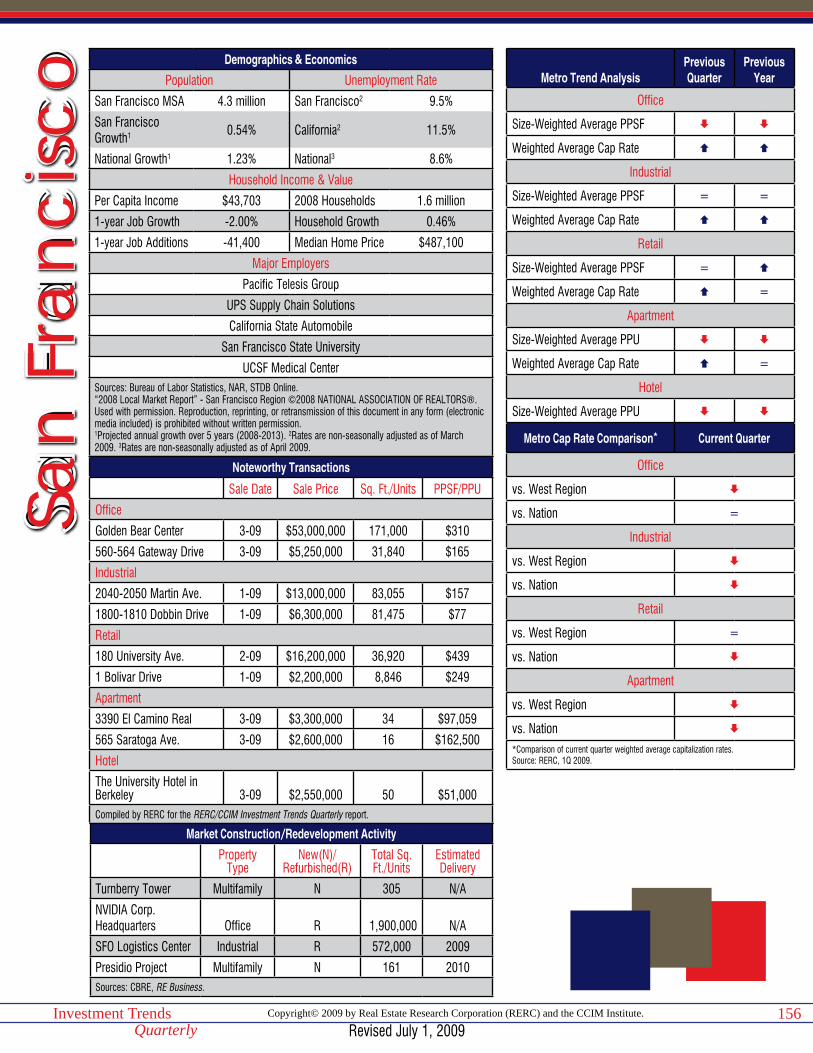
Copyright© 2009 by Real Estate Research Corporation (RERC) and the CCIM Institute.Investment TrendsQuarterly
156
Demographics & Economics
Population Unemployment Rate
San Francisco MSA 4.3 million San Francisco2 9.5%
San Francisco Growth1 0.54% California2 11.5%
National Growth1 1.23% National3 8.6%
Household Income & Value
Per Capita Income $43,703 2008 Households 1.6 million
1-year Job Growth -2.00% Household Growth 0.46%
1-year Job Additions -41,400 Median Home Price $487,100
Major Employers
Pacific Telesis Group
UPS Supply Chain Solutions
California State Automobile
San Francisco State University
UCSF Medical CenterSources: Bureau of Labor Statistics, NAR, STDB Online.“2008 Local Market Report” - San Francisco Region ©2008 NATIONAL ASSOCIATION OF REALTORS®. Used with permission. Reproduction, reprinting, or retransmission of this document in any form (electronic media included) is prohibited without written permission.1Projected annual growth over 5 years (2008-2013). 2Rates are non-seasonally adjusted as of March 2009. 3Rates are non-seasonally adjusted as of April 2009.
Noteworthy Transactions
Sale Date Sale Price Sq. Ft./Units PPSF/PPU
Office
Golden Bear Center 3-09 $53,000,000 171,000 $310
560-564 Gateway Drive 3-09 $5,250,000 31,840 $165
Industrial
2040-2050 Martin Ave. 1-09 $13,000,000 83,055 $157
1800-1810 Dobbin Drive 1-09 $6,300,000 81,475 $77
Retail
180 University Ave. 2-09 $16,200,000 36,920 $439
1 Bolivar Drive 1-09 $2,200,000 8,846 $249
Apartment
3390 El Camino Real 3-09 $3,300,000 34 $97,059
565 Saratoga Ave. 3-09 $2,600,000 16 $162,500
Hotel
The University Hotel in Berkeley 3-09 $2,550,000 50 $51,000Compiled by RERC for the RERC/CCIM Investment Trends Quarterly report.
Market Construction/Redevelopment Activity
Property Type
New(N)/Refurbished(R)
Total Sq. Ft./Units
Estimated Delivery
Turnberry Tower Multifamily N 305 N/A
NVIDIA Corp.Headquarters Office R 1,900,000 N/A
SFO Logistics Center Industrial R 572,000 2009
Presidio Project Multifamily N 161 2010Sources: CBRE, RE Business.
San
Fra
ncis
co Metro Trend Analysis
Previous Quarter
Previous Year
Office
Size-Weighted Average PPSF
Weighted Average Cap Rate
Industrial
Size-Weighted Average PPSF = =
Weighted Average Cap Rate
Retail
Size-Weighted Average PPSF =
Weighted Average Cap Rate =
Apartment
Size-Weighted Average PPU
Weighted Average Cap Rate =
Hotel
Size-Weighted Average PPU
Metro Cap Rate Comparison* Current Quarter
Office
vs. West Region
vs. Nation =
Industrial
vs. West Region
vs. Nation
Retail
vs. West Region =
vs. Nation
Apartment
vs. West Region
vs. Nation
*Comparison of current quarter weighted average capitalization rates.Source: RERC, 1Q 2009.
Revised July 1, 2009

Copyright© 2009 by Real Estate Research Corporation (RERC) and the CCIM Institute.Investment TrendsQuarterly
157
San Francisco Transaction Breakdown12-Month Trailing (04/01/08 - 03/31/09)
Office Industrial Retail Apartment Hotel< $5 MillionVolume (Mil) $182 $268 $182 $406 $23
Size Weighted Avg. ($ per sf/unit) $183 $121 $206 $144,046 $68,991
Price Weighted Avg. ($ per sf/unit) $243 $165 $296 $171,812 $86,564
Median ($ per sf/unit) $200 $142 $204 $139,773 $70,126
> $5 MillionVolume (Mil) $2,047 $965 $413 $1,071 $75
Size Weighted Avg. ($ per sf/unit) $309 $137 $315 $180,203 $108,223
Price Weighted Avg. ($ per sf/unit) $421 $155 $363 $206,313 $120,964
Median ($ per sf/unit) $268 $146 $375 $178,774 $94,782
All TransactionsVolume (Mil) $2,229 $1,233 $595 $1,477 $99
Size Weighted Avg. ($ per sf/unit) $293 $133 $271 $168,570 $95,386
Price Weighted Avg. ($ per sf/unit) $407 $157 $342 $196,828 $112,823
Median ($ per sf/unit) $224 $142 $253 $150,000 $77,260
Capitalization Rates (All Transactions)Weighted Average (%) 6.0 6.7 6.2 5.3 –
Median (%) 5.9 6.6 6.1 5.5 –Source: RERC.
San Francisco Transaction Trends12-Month Trailing (04/01/08 - 03/31/09)
Office Industrial Retail Apartment HotelMedian Price% Change Quarter Ago -9% 0% -1% 0% 2%
% Change Year Ago -19% 4% 6% -3% -31%
Volume % Change Quarter Ago -43% -7% -12% -9% -13%
% Change Year Ago -88% -57% -63% -62% -96%Source: RERC.
Revised July 1, 2009
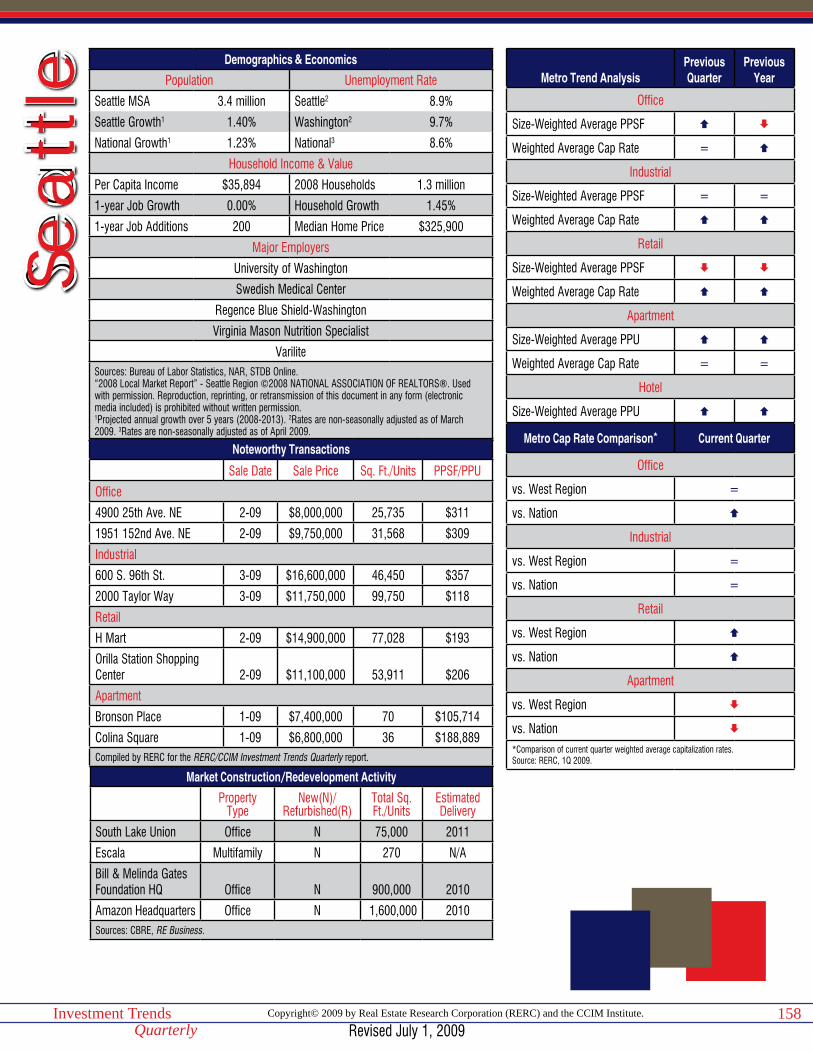
Copyright© 2009 by Real Estate Research Corporation (RERC) and the CCIM Institute.Investment TrendsQuarterly
158
Demographics & Economics
Population Unemployment Rate
Seattle MSA 3.4 million Seattle2 8.9%
Seattle Growth1 1.40% Washington2 9.7%
National Growth1 1.23% National3 8.6%
Household Income & Value
Per Capita Income $35,894 2008 Households 1.3 million
1-year Job Growth 0.00% Household Growth 1.45%
1-year Job Additions 200 Median Home Price $325,900
Major Employers
University of Washington
Swedish Medical Center
Regence Blue Shield-Washington
Virginia Mason Nutrition Specialist
VariliteSources: Bureau of Labor Statistics, NAR, STDB Online.“2008 Local Market Report” - Seattle Region ©2008 NATIONAL ASSOCIATION OF REALTORS®. Used with permission. Reproduction, reprinting, or retransmission of this document in any form (electronic media included) is prohibited without written permission.1Projected annual growth over 5 years (2008-2013). 2Rates are non-seasonally adjusted as of March 2009. 3Rates are non-seasonally adjusted as of April 2009.
Noteworthy Transactions
Sale Date Sale Price Sq. Ft./Units PPSF/PPU
Office
4900 25th Ave. NE 2-09 $8,000,000 25,735 $311
1951 152nd Ave. NE 2-09 $9,750,000 31,568 $309
Industrial
600 S. 96th St. 3-09 $16,600,000 46,450 $357
2000 Taylor Way 3-09 $11,750,000 99,750 $118
Retail
H Mart 2-09 $14,900,000 77,028 $193
Orilla Station Shopping Center 2-09 $11,100,000 53,911 $206
Apartment
Bronson Place 1-09 $7,400,000 70 $105,714
Colina Square 1-09 $6,800,000 36 $188,889Compiled by RERC for the RERC/CCIM Investment Trends Quarterly report.
Market Construction/Redevelopment Activity
Property Type
New(N)/Refurbished(R)
Total Sq. Ft./Units
Estimated Delivery
South Lake Union Office N 75,000 2011
Escala Multifamily N 270 N/A
Bill & Melinda Gates Foundation HQ Office N 900,000 2010
Amazon Headquarters Office N 1,600,000 2010Sources: CBRE, RE Business.
Sea
ttle Metro Trend Analysis
Previous Quarter
Previous Year
Office
Size-Weighted Average PPSF
Weighted Average Cap Rate =
Industrial
Size-Weighted Average PPSF = =
Weighted Average Cap Rate
Retail
Size-Weighted Average PPSF
Weighted Average Cap Rate
Apartment
Size-Weighted Average PPU
Weighted Average Cap Rate = =
Hotel
Size-Weighted Average PPU
Metro Cap Rate Comparison* Current Quarter
Office
vs. West Region =
vs. Nation
Industrial
vs. West Region =
vs. Nation =
Retail
vs. West Region
vs. Nation
Apartment
vs. West Region
vs. Nation
*Comparison of current quarter weighted average capitalization rates.Source: RERC, 1Q 2009.
Revised July 1, 2009

Copyright© 2009 by Real Estate Research Corporation (RERC) and the CCIM Institute.Investment TrendsQuarterly
159
Seattle Transaction Breakdown12-Month Trailing (04/01/08 - 03/31/09)
Office Industrial Retail Apartment Hotel< $5 MillionVolume (Mil) $169 $230 $182 $212 –
Size Weighted Avg. ($ per sf/unit) $186 $105 $195 $99,441 –
Price Weighted Avg. ($ per sf/unit) $251 $133 $255 $124,370 –
Median ($ per sf/unit) $197 $123 $183 $111,914 –
> $5 MillionVolume (Mil) $474 $439 $259 $1,106 $79
Size Weighted Avg. ($ per sf/unit) $242 $113 $208 $144,205 $179,339
Price Weighted Avg. ($ per sf/unit) $260 $144 $258 $193,351 $205,417
Median ($ per sf/unit) $245 $109 $257 $129,648 $193,597
All TransactionsVolume (Mil) $643 $669 $441 $1,318 $90
Size Weighted Avg. ($ per sf/unit) $224 $110 $202 $134,480 $160,081
Price Weighted Avg. ($ per sf/unit) $258 $140 $257 $182,270 $192,346
Median ($ per sf/unit) $215 $120 $200 $121,153 $136,054
Capitalization Rates (All Transactions)Weighted Average (%) 6.2 7.0 7.3 5.3 –
Median (%) 6.2 6.8 7.2 5.4 –Source: RERC.
Seattle Transaction Trends12-Month Trailing (04/01/08 - 03/31/09)
Office Industrial Retail Apartment HotelMedian Price% Change Quarter Ago 1% -1% -2% 6% –
% Change Year Ago -12% 0% 0% 9% –
Volume % Change Quarter Ago -34% -20% -1% -32% –
% Change Year Ago -92% -70% -59% -50% –Source: RERC.
Revised July 1, 2009
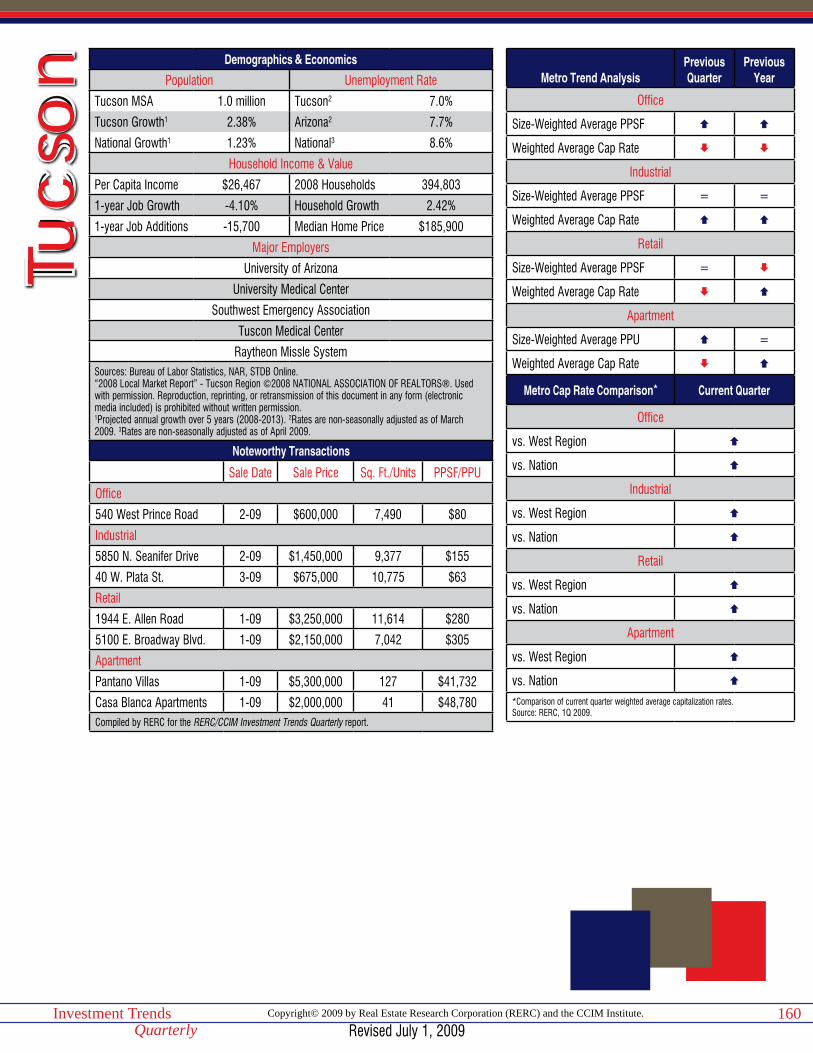
Copyright© 2009 by Real Estate Research Corporation (RERC) and the CCIM Institute.Investment TrendsQuarterly
160
Demographics & Economics
Population Unemployment Rate
Tucson MSA 1.0 million Tucson2 7.0%
Tucson Growth1 2.38% Arizona2 7.7%
National Growth1 1.23% National3 8.6%
Household Income & Value
Per Capita Income $26,467 2008 Households 394,803
1-year Job Growth -4.10% Household Growth 2.42%
1-year Job Additions -15,700 Median Home Price $185,900
Major Employers
University of Arizona
University Medical Center
Southwest Emergency Association
Tuscon Medical Center
Raytheon Missle SystemSources: Bureau of Labor Statistics, NAR, STDB Online.“2008 Local Market Report” - Tucson Region ©2008 NATIONAL ASSOCIATION OF REALTORS®. Used with permission. Reproduction, reprinting, or retransmission of this document in any form (electronic media included) is prohibited without written permission.1Projected annual growth over 5 years (2008-2013). 2Rates are non-seasonally adjusted as of March 2009. 3Rates are non-seasonally adjusted as of April 2009.
Noteworthy Transactions
Sale Date Sale Price Sq. Ft./Units PPSF/PPU
Office
540 West Prince Road 2-09 $600,000 7,490 $80
Industrial
5850 N. Seanifer Drive 2-09 $1,450,000 9,377 $155
40 W. Plata St. 3-09 $675,000 10,775 $63
Retail
1944 E. Allen Road 1-09 $3,250,000 11,614 $280
5100 E. Broadway Blvd. 1-09 $2,150,000 7,042 $305
Apartment
Pantano Villas 1-09 $5,300,000 127 $41,732
Casa Blanca Apartments 1-09 $2,000,000 41 $48,780Compiled by RERC for the RERC/CCIM Investment Trends Quarterly report.
Tuc
son Metro Trend Analysis
Previous Quarter
Previous Year
Office
Size-Weighted Average PPSF
Weighted Average Cap Rate
Industrial
Size-Weighted Average PPSF = =
Weighted Average Cap Rate
Retail
Size-Weighted Average PPSF =
Weighted Average Cap Rate
Apartment
Size-Weighted Average PPU =
Weighted Average Cap Rate
Metro Cap Rate Comparison* Current Quarter
Office
vs. West Region
vs. Nation
Industrial
vs. West Region
vs. Nation
Retail
vs. West Region
vs. Nation
Apartment
vs. West Region
vs. Nation
*Comparison of current quarter weighted average capitalization rates.Source: RERC, 1Q 2009.
Revised July 1, 2009

Copyright© 2009 by Real Estate Research Corporation (RERC) and the CCIM Institute.Investment TrendsQuarterly
161
Tucson Transaction Breakdown12-Month Trailing (04/01/08 - 03/31/09)
Office Industrial Retail Apartment Hotel< $5 MillionVolume (Mil) $22 $29 $48 $21 –
Size Weighted Avg. ($ per sf/unit) $163 $84 $148 $48,690 –
Price Weighted Avg. ($ per sf/unit) $196 $95 $204 $72,496 –
Median ($ per sf/unit) $183 $87 $139 $39,803 –
> $5 MillionVolume (Mil) $34 – $88 $178 –
Size Weighted Avg. ($ per sf/unit) $217 – $147 $67,199 –
Price Weighted Avg. ($ per sf/unit) $221 – $237 $99,880 –
Median ($ per sf/unit) $204 – $194 $50,610 –
All TransactionsVolume (Mil) $56 $91 $136 $199 –
Size Weighted Avg. ($ per sf/unit) $192 $87 $148 $64,580 –
Price Weighted Avg. ($ per sf/unit) $211 $108 $225 $96,958 –
Median ($ per sf/unit) $192 $87 $142 $47,370 –
Capitalization Rates (All Transactions)Weighted Average (%) 6.5 8.3 7.5 6.4 –
Median (%) 6.4 7.7 7.8 6.5 –Source: RERC.
Tucson Transaction Trends12-Month Trailing (04/01/08 - 03/31/09)
Office Industrial Retail Apartment HotelMedian Price% Change Quarter Ago 0% 2% 2% -3% –
% Change Year Ago – 14% 5% 2% –
Volume % Change Quarter Ago -58% -27% -3% -4% –
% Change Year Ago – -61% 41% -41% –Source: RERC.
Revised July 1, 2009