second edition satp2 2011–2012 school year … · mississippi subject area testing program...
TRANSCRIPT
ALGEBRA I
MS00005700
,,SECOND EDITION
SATP22011–2012 School Year
The Office of Student Assessment at the Mississippi Department of Education (MDE)
maintains a website that contains important information about
the Mississippi Subject Area Testing Program.
The following link contains the Algebra I Test information:http://www.mde.k12.ms.us/osa
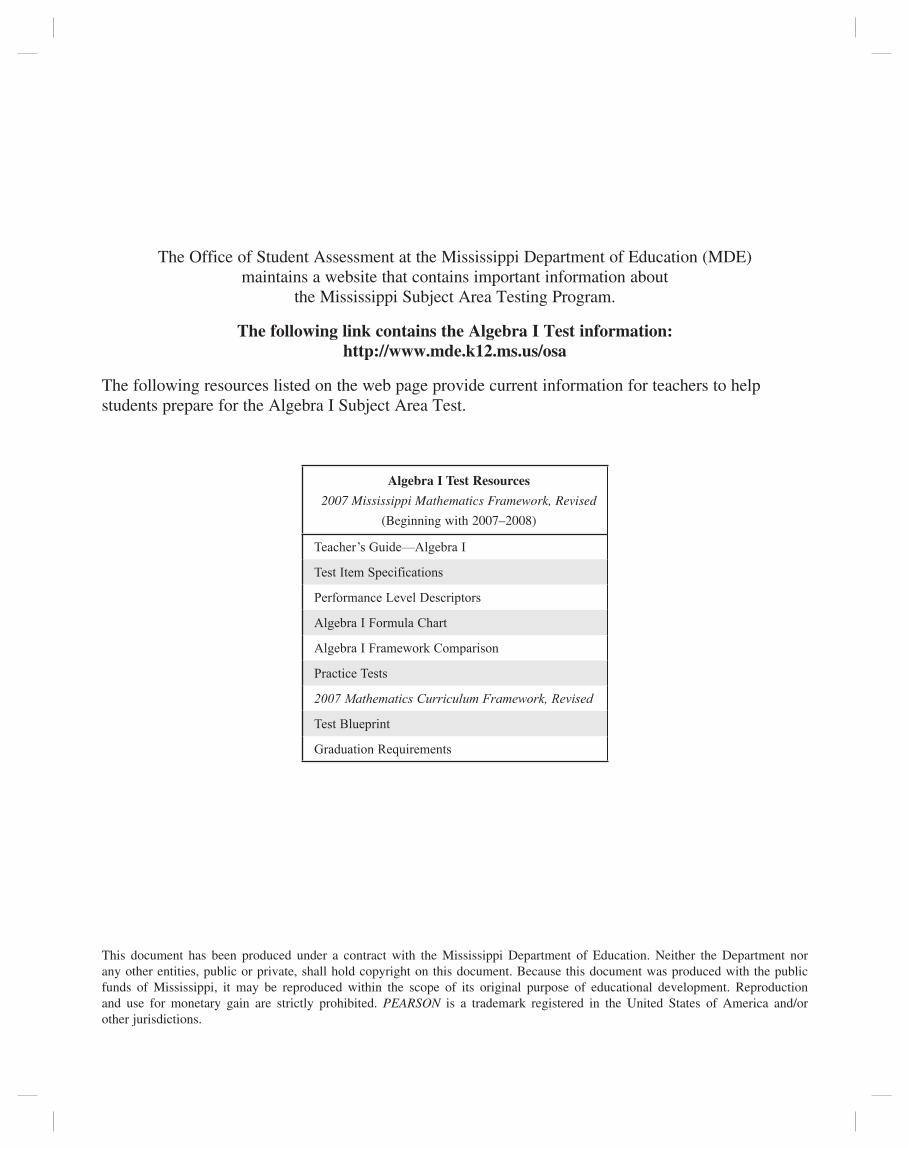
The following resources listed on the web page provide current information for teachers to help
students prepare for the Algebra I Subject Area Test.
Algebra I Test Resources
2007 Mississippi Mathematics Framework, Revised
(Beginning with 2007–2008)
Teacher’s Guide—Algebra I
Test Item Specifications
Performance Level Descriptors
Algebra I Formula Chart
Algebra I Framework Comparison
Practice Tests
2007 Mathematics Curriculum Framework, Revised
Test Blueprint
Graduation Requirements
This document has been produced under a contract with the Mississippi Department of Education. Neither the Department nor
any other entities, public or private, shall hold copyright on this document. Because this document was produced with the public
funds of Mississippi, it may be reproduced within the scope of its original purpose of educational development. Reproduction
and use for monetary gain are strictly prohibited. PEARSON is a trademark registered in the United States of America and/or
other jurisdictions.

Mississippi Subject Area Testing Program Teacher’s Guide 2011–2012 ALGEBRA I
SATP2 2011–2012 Algebra I Teacher’s Guide—Copyright © 2011 MDE 3
Table of Contents
Introduction to the SATP2 . . . . . . . . . . . . . . . . 4
Overview of the Algebra I Test . . . . . . . . . . . . . . 4
Information about Calculator Use
on the Algebra I Test . . . . . . . . . . . . . . . . . . . 5
Curriculum Framework . . . . . . . . . . . . . . . . . . 6
Test Specifi cations . . . . . . . . . . . . . . . . . . . . 8
Test Blueprint . . . . . . . . . . . . . . . . . . . . . . . 9
Depth of Knowledge . . . . . . . . . . . . . . . . . . 10
Performance Level Descriptors . . . . . . . . . . . . . 11
The Formula Chart . . . . . . . . . . . . . . . . . . . 13
Samples of Algebra I Test Items . . . . . . . . . . . . 14
Interpretation of Score Reports for Algebra I . . . . . 25
Glossary of Test Terms . . . . . . . . . . . . . . . . . 30

2011–2012 ALGEBRA I Mississippi Subject Area Testing Program Teacher’s Guide
4 SATP2 2011–2012 Algebra I Teacher’s Guide—Copyright © 2011 MDE
Introduction to the SATP2In 1999 the Mississippi Senate approved the Mississippi Student Achievement Improvement Act, which states that
standards for high school graduation shall include student “mastery of minimum academic skills as measured by
assessments developed and administered by the State Board of Education.” To meet the intent of this legislation, four new
subject area tests were developed: Algebra I, Biology I, U.S. History, and English II with a writing component. Students
earning a high school diploma must pass all four subject area tests to meet graduation requirements.
Overview of the Algebra I TestThe Algebra I Subject Area Test measures a student’s knowledge of and skill level in applied algebra. There are sixty-five
multiple-choice items. Many items contain charts, graphs, or diagrams that the student will use to determine the correct
answer. Questions from the following competencies are distributed throughout the test: Number and Operations, Algebra,
Geometry, Measurement, and Data Analysis and Probability.
Additional information is provided in this guide to educate teachers about the test development process for the Algebra I
Subject Area Test. Our hope is that the material contained in this guide will be useful to Algebra I teachers throughout the
state of Mississippi in preparing their students for success on the Algebra I Subject Area Test.

Mississippi Subject Area Testing Program Teacher’s Guide 2011–2012 ALGEBRA I
SATP2 2011–2012 Algebra I Teacher’s Guide—Copyright © 2011 MDE 5
Information about Calculator Use on the Algebra I Test
At the beginning of the course of study, teachers will notify each student that they will need a graphing calculator for the test. Students may either bring their own graphing calculators or use those provided by the school. Sharing calculators between students is prohibited in the same test session. Students may use personal calculators.
Beginning with the 2011–2012 school year, all formulas, applications, and/or programs (including, but not limited to, Zoom Math/Zoom Algebra) must be disabled or removed from the calculators to be used by students during the SATP2 Algebra I exam for fi rst-time test takers. The District Test Security Plan must address the processes and/or procedures to be used to ensure that NO personal calculators used by students during a state assessment administration have any stored formulas, applications, and/or programs.
School districts will be given the authority to allow retesters who participated in the SATP2 Algebra I test administration prior to 2011–2012 to continue to use graphing calculators with formulas, applications, and/or programs under the following conditions:
Districts • must test these students in a room separate from any testing room that is used for fi rst-time test takers in 2011–2012 and thereafter.
Districts • must address these procedures for retesters in the District and School Test Security Plans.
The following chart only applies for students who completed Algebra I prior to the 2011-2012 school year:
Allowed Not Allowedalphanumeric keypads (e.g., TI-83, TI-83 Plus• ®,
TI-84, TI-84 Plus®, HP 38g, ALGEFX1.0, FX7400,
CFX-9850G Plus, EL-9600C)
Computer Algebra System (CAS) (e.g., TI-89, •
TI-92 Plus, TI-Nspire™ *, ALGEFX2.0,
ALGEFX2.0 Plus, CFX-9970)
QWERTY keyboards (similar to typewriter •
keyboards, e.g., TI-92)
attached electronic pens;•
printing attachments;•
distracting sound effects;•
raised screens;•
attached cords;•
electronic devices that have calculators, such as •
Palm Pilots, cellular phones, BlackBerries®, iPods®,
Bluetooth® technology devices, etc.
*Exception: The TI-Nspire calculator is allowed only when the TI-84 faceplate is on and in working mode. It is the responsibility of the test administrators to ensure that all calculators used on the Algebra I Subject Area Test
are allowable. Use of a TI-Nspire calculator without the TI-84 faceplate is considered a testing irregularity and
will result in the student’s score being invalidated.

2011–2012 ALGEBRA I Mississippi Subject Area Testing Program Teacher’s Guide
6 SATP2 2011–2012 Algebra I Teacher’s Guide—Copyright © 2011 MDE
Curriculum FrameworkThe Algebra I Subject Area Test is aligned with the 2007 Mississippi Mathematics Framework, Revised for Algebra I.
The following chart shows a direct relationship between the curriculum and the subject area test. This chart is useful as a
tool to plan classroom instruction.
The competencies (reporting categories of the test) and objectives are listed below.
Competency 1: Number and Operations
1. Understand relationships between numbers and their properties and perform operations fluently.
1a. Apply properties of real numbers to simplify algebraic expressions, including polynomials. (DOK 1)
1b. Use matrices to solve mathematical situations and contextual problems. (DOK 2)
Competency 2: Algebra
2. Understand, represent, and analyze patterns, relations, and functions.
2a. Solve, check, and graph multi-step linear equations and inequalities in one variable, including rational
coefficients in mathematical and real-world situations. (DOK 2)
2b. Solve and graph absolute value equations and inequalities in one variable. (DOK 2)
2c. Analyze the relationship between x and y values, determine whether a relation is a function, and identify
domain and range. (DOK 2)
2d. Explain and illustrate how a change in one variable may result in a change in another variable and apply to
the relationships between independent and dependent variables. (DOK 2)
2e. Graph and analyze linear functions. (DOK 2)
2f. Use algebraic and graphical methods to solve systems of linear equations and inequalities in mathematical
and real-world situations. (DOK 2)
2g. Add, subtract, multiply, and divide polynomial expressions. (DOK 1)
2h. Factor polynomials by using Greatest Common Factor (GCF) and factor quadratics that have only rational
roots. (DOK 1)
2i. Determine the solutions to quadratic equations by using graphing, tables, completing the square, the
Quadratic formula, and factoring. (DOK 1)
2j. Justify why some polynomials are prime over the rational number system. (DOK 2)
2k. Graph and analyze absolute value and quadratic functions. (DOK 2)
2l. Write, graph, and analyze inequalities in two variables. (DOK 2)
Mississippi Subject Area Testing Program Teacher’s Guide 2011–2012 ALGEBRA I
SATP2 2011–2012 Algebra I Teacher’s Guide—Copyright © 2011 MDE 7
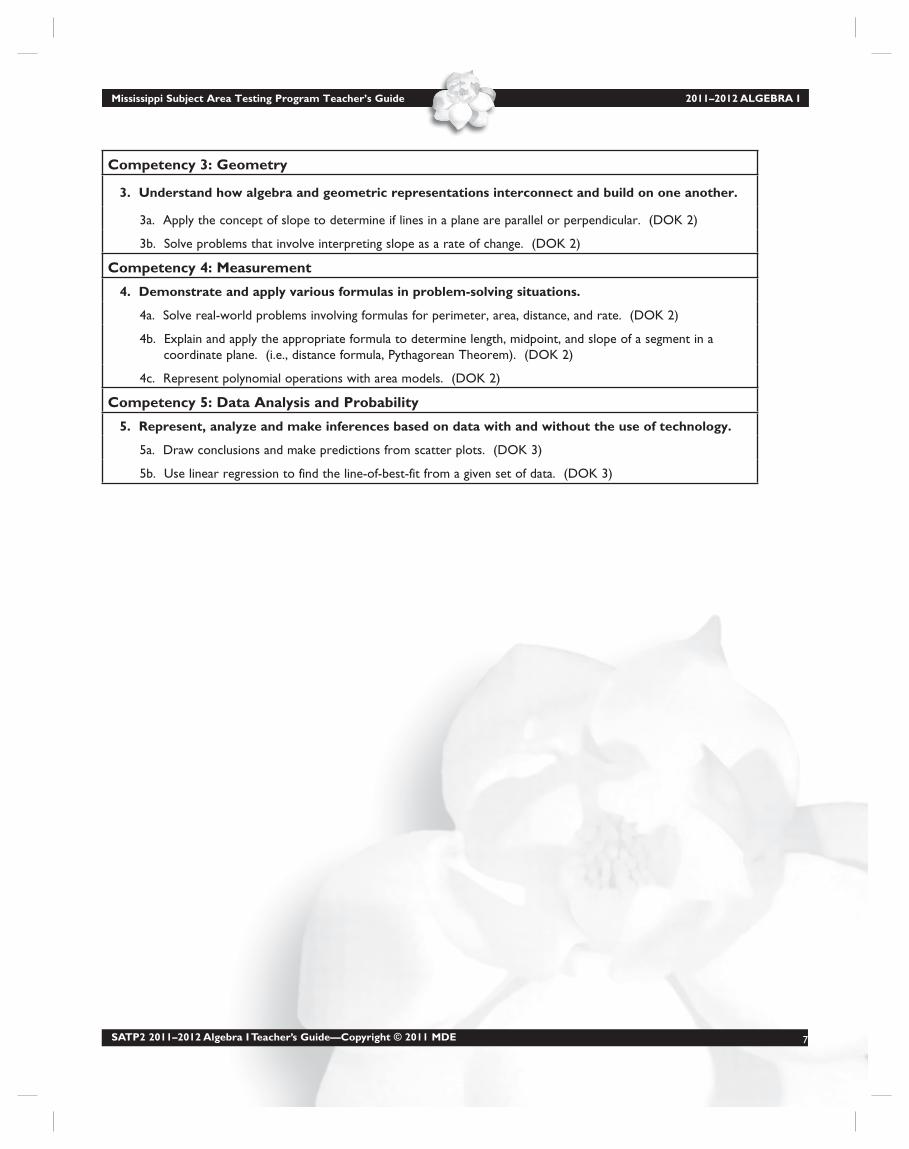
Competency 3: Geometry
3. Understand how algebra and geometric representations interconnect and build on one another.
3a. Apply the concept of slope to determine if lines in a plane are parallel or perpendicular. (DOK 2)
3b. Solve problems that involve interpreting slope as a rate of change. (DOK 2)
Competency 4: Measurement
4. Demonstrate and apply various formulas in problem-solving situations.
4a. Solve real-world problems involving formulas for perimeter, area, distance, and rate. (DOK 2)
4b. Explain and apply the appropriate formula to determine length, midpoint, and slope of a segment in a
coordinate plane. (i.e., distance formula, Pythagorean Theorem). (DOK 2)
4c. Represent polynomial operations with area models. (DOK 2)
Competency 5: Data Analysis and Probability
5. Represent, analyze and make inferences based on data with and without the use of technology.
5a. Draw conclusions and make predictions from scatter plots. (DOK 3)
5b. Use linear regression to find the line-of-best-fit from a given set of data. (DOK 3)

2011–2012 ALGEBRA I Mississippi Subject Area Testing Program Teacher’s Guide
8 SATP2 2011–2012 Algebra I Teacher’s Guide—Copyright © 2011 MDE
Test SpecificationsTest specifications are the guidelines used by the Mississippi Department of Education, test developers, and members of
the Algebra I Teacher Committee in developing the Algebra I Test. The test specifications were drafted and finalized based
upon the following information:
General Considerations—considerations used in developing each subject area test•
Item Format—description of criteria for the development of the multiple-choice test items•
Test Format—general information on how the test is presented•
General ConsiderationsItems will be written to measure the competencies of the •
2007 Mississippi Mathematics Framework, Revised.
Items will be appropriate in terms of difficulty, interest, •
reading level (8th grade), and experience.
Items included in the assessment will be reviewed •
specifically for the purpose of eliminating stereotyping
and bias related to age, sex, ethnicity, creed, economic
status, geographic location, disability, etc.
Test items will be machine-scorable multiple-choice •
(MC) questions.
When possible and appropriate, items will be presented •
in a real-world context or will show relationships
to real-world situations. The term real-world is
defined as “typical of an average person’s actual life
experiences.” Students will be expected to demonstrate
a refined ability to analyze, synthesize, and correlate
information to determine the correct response to such
test questions.
Information will be presented through written text or •
through visual materials such as graphs, tables, maps,
models, or other illustrations.
Items may require students to apply previously acquired •
knowledge. Other items will provide information the
student can use to answer the item.
Some items may require mathematical computations.•
Decimal numbers less than 1 will be written with •
leading zeros.
Item FormatOptions such as “none of the above,” “both A and B,” •
and “all of the above” will NOT be used as answer
choices.
The item stem and answer choices should be on the •
same page with answer choices arranged beneath the
item stem. Items with art in the answer choices may
have the answer choices stacked beneath the item
stem.
Item stems will be in the form of a question.•
Numerical answer choices will be arranged in •
ascending or descending order. Answer choices will be
expressed as letters and arranged in alphabetical order.
In no case will a letter answer choice coincide with its
answer option.
Test FormatThe test will be printed in black ink on white paper.•
Scenarios, graphic displays, corresponding items, and •
answer choices will appear on the same or facing
pages.
Negatives and superlatives used in item stems will •
be typed in capital letters and boldfaced (e.g. NOT,
LEAST, BEST, and EXCEPT).
The test will consist of 53 scorable and 12 experimental •
multiple-choice items.
Mississippi Subject Area Testing Program Teacher’s Guide 2011–2012 ALGEBRA I
SATP2 2011–2012 Algebra I Teacher’s Guide—Copyright © 2011 MDE 9
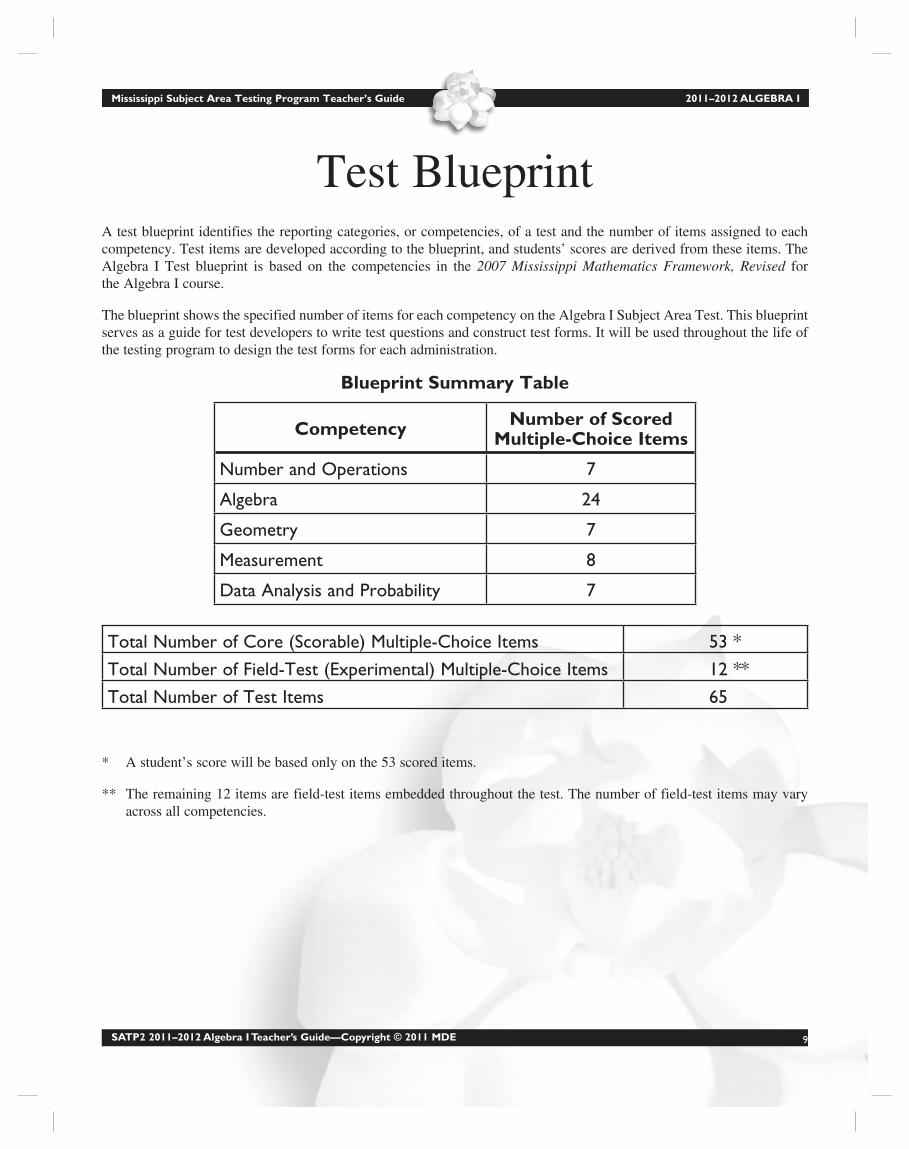
Test BlueprintA test blueprint identifies the reporting categories, or competencies, of a test and the number of items assigned to each
competency. Test items are developed according to the blueprint, and students’ scores are derived from these items. The
Algebra I Test blueprint is based on the competencies in the 2007 Mississippi Mathematics Framework, Revised for
the Algebra I course.
The blueprint shows the specified number of items for each competency on the Algebra I Subject Area Test. This blueprint
serves as a guide for test developers to write test questions and construct test forms. It will be used throughout the life of
the testing program to design the test forms for each administration.
Blueprint Summary Table
Competency Number of Scored Multiple-Choice Items
Number and Operations 7
Algebra 24
Geometry 7
Measurement 8
Data Analysis and Probability 7
Total Number of Core (Scorable) Multiple-Choice Items 53 *
Total Number of Field-Test (Experimental) Multiple-Choice Items 12 **
Total Number of Test Items 65
* A student’s score will be based only on the 53 scored items.
** The remaining 12 items are field-test items embedded throughout the test. The number of field-test items may vary
across all competencies.

2011–2012 ALGEBRA I Mississippi Subject Area Testing Program Teacher’s Guide
10 SATP2 2011–2012 Algebra I Teacher’s Guide—Copyright © 2011 MDE
Depth of KnowledgeDepth of Knowledge (DOK) is a measure of the cognitive demand of the task students are being asked to perform. Each
objective listed for a competency has been assigned a DOK level. There are many factors/dimensions that contribute to
DOK. These include the following:
the level of conceptualization required of students;•
the type and level of generalization students must reach;•
the amount of prerequisite knowledge and contexts students need to synthesize from to complete the task;•
the level and complexity of reasoning required;•
the types and variety of representations (written, verbal, pictorial, symbolic, etc.) required to complete a •
response;
the number and strength of connections students must make between facts, procedures, mental networks, •
concepts, and ideas;
the required degree of generalization and transfer of knowledge and experience into new and/or different •
situations; and
the grade level to which the item is assigned.•
Below is a brief, general description of each level.
Level 1: Recall — Asks students to recall a fact, information, or a procedure
Level 2: Basic Reasoning — Asks students to use information or conceptual knowledge, often requiring two or more
steps*
Level 3: Complex Reasoning — Asks students to use complex thinking and consideration of more than one possible
approach and answer
Level 4: Extended Reasoning — Asks students to use strategic thinking to consider, plan, analyze, etc., usually
resulting in a finished product
* While these guidelines are helpful, they should not be used as strict rules. For example, some “two-step processes/
procedures” are, in fact, only DOK 1 if the multiple steps are just rote, defined, etc.; therefore, not every two-step
process is automatically a DOK 2. For more comprehensive information about DOK, please visit the Office of Student
Assessment website at http://www.mde.k12.ms.us/osa.

Mississippi Subject Area Testing Program Teacher’s Guide 2011–2012 ALGEBRA I
SATP2 2011–2012 Algebra I Teacher’s Guide—Copyright © 2011 MDE 11
Performance Level Descriptors
Performance Levels and Score ReportsThe Student Report* for the Mississippi Subject Area Tests provides information regarding how well a student has
demonstrated mastery of the skills and content outlined in the Mississippi Curriculum Frameworks. In addition to
numerical scores, the report will specify the student’s performance level, which is based on the student’s scale score. Those
levels are as follows: advanced, proficient, basic, and minimal. The range for each level is determined by the standard
setting for each subject area.
*A sample copy of a new Algebra I Student Report showing this information is on page 29 of this guide.
Purpose of Performance Level DescriptorsThe performance level descriptors (PLDs) serve a dual purpose:
1. to guide the development of the assessments, help establish cut scores during standard setting, and act as descriptors,
as well as
2. to guide teachers’ instructional efforts to ensure that students reach the proficient level of performance on the
content standards.
The No Child Left Behind (NCLB) Act requires that PLDs for at least three levels, including basic, proficient, and
advanced, will be set forth. The PLD for proficient must reflect the intended cognitive processes at the appropriate grade
level as set forth in the standards. The total description for the PLDs must reflect the full range of the content standards in
terms of the cognitive challenge, cognitive complexity, and cognitive depth indicated by the DOK level.
Content-Specific Performance Level DescriptorsAt a specific performance level, the student must demonstrate the performance described at that level. The student may
be able to do more, but until the student is able to demonstrate mastery of what is described in the next-higher level of
performance, the student is assigned the lower level. The following page shows the content-specific performance level
descriptors for Algebra I.

2011–2012 ALGEBRA I Mississippi Subject Area Testing Program Teacher’s Guide
12 SATP2 2011–2012 Algebra I Teacher’s Guide—Copyright © 2011 MDE
Algebra I Mathematics Performance Level Descriptors
Advanced Students performing at the advanced level:
In Number and Operations: Justify solutions to mathematical situations involving matrices.
In Algebra: Evaluate algebraic and graphical methods used to solve systems of linear equations and
inequalities.
In Geometry: Justify solutions of problems that involve interpreting slope as a rate of change.
In Measurement: Justify the representation of polynomial operations with area models.
In Data Analysis and Probability: Justify conclusions and predictions made from scatter plots.
Proficient Students performing at the proficient level:
In Number and Operations: Use matrices to solve mathematical situations and contextual
problems.
In Algebra: Solve and graph multi-step linear equations and inequalities in one variable. Solve
and graph absolute value equations and inequalities in one variable. Analyze the relationship
between x and y values, determine whether a relation is a function, and identify domain and
range. Explain and illustrate how a change in one variable may result in a change in another
variable and apply to the relationships between independent and dependent variables. Graph and
analyze linear functions. Use algebraic and graphical methods to solve systems of linear equations
and inequalities in mathematical and real-world situations. Multiply and divide polynomial
expressions. Factor polynomials by using Greatest Common Factor (GCF) and factor quadratics
that have only rational roots. Justify why some polynomials are prime over the rational number
system. Graph and analyze absolute value and quadratic functions. Analyze inequalities in two
variables.
In Geometry: Apply the concept of slope to determine if lines in a plane are parallel or
perpendicular. Solve problems that involve interpreting slope as a rate of change.
In Measurement: Explain and apply the appropriate formula to determine length, midpoint, and
slope of a segment in a coordinate plane. Represent polynomial operations with area models.
In Data Analysis and Probability: Use linear regression to determine the line-of-best-fi t from a
given set of data. Draw conclusions and make predictions from scatter plots.
Basic Students performing at the basic level:
In Number and Operations: Apply properties of real numbers to simplify algebraic expressions.
In Algebra: Check multi-step linear inequalities in one variable. Write and graph inequalities in
two variables. Add and subtract polynomial expressions. Determine the solutions to quadratic
equations.
In Measurement: Solve real world problems involving formulas for perimeter, area, distance and
rate.
Minimal Students performing at the minimal level inconsistently demonstrate the knowledge or skills that define
basic level performance.
Mississippi Subject Area Testing Program Teacher’s Guide 2011–2012 ALGEBRA I
SATP2 2011–2012 Algebra I Teacher’s Guide—Copyright © 2011 MDE 13
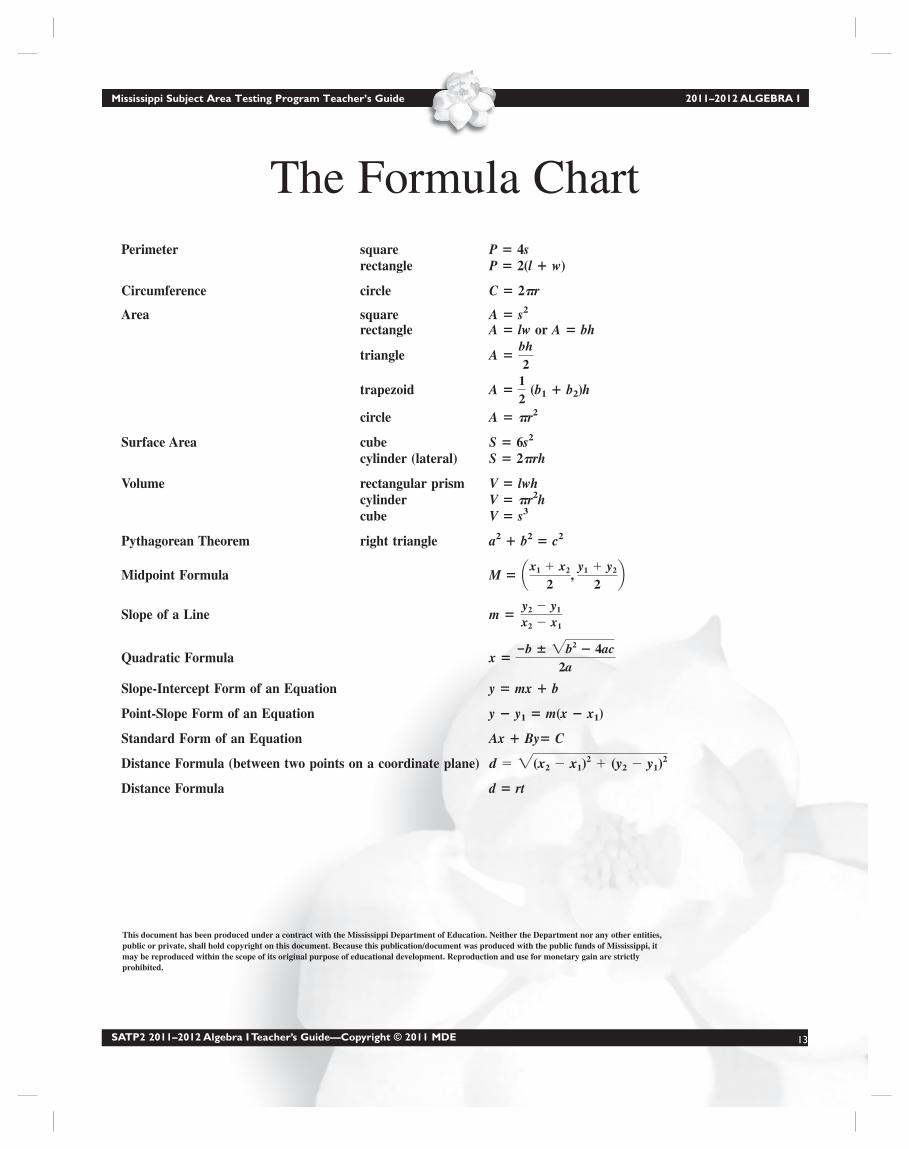
The Formula Chart
Perimeter square P � 4srectangle P � 2(l � w)
Circumference circle C � 2�r
Area square A � s2
rectangle A � lw or A � bh
triangle A �
trapezoid A � (b1 � b2)h
circle A � �r2
Surface Area cube S � 6s2
cylinder (lateral) S � 2�rh
Volume rectangular prism V � lwhcylinder V � �r2hcube V � s3
Pythagorean Theorem right triangle a2 � b2 � c2
Midpoint Formula M �
Slope of a Line m �
Quadratic Formula x �
Slope-Intercept Form of an Equation y � mx � b
Point-Slope Form of an Equation y � y1 � m(x � x1)
Standard Form of an Equation Ax � By� C
Distance Formula (between two points on a coordinate plane)
Distance Formula d � rt
d � 2(x2 � x1)2 � (y2 � y1)
2
�b � 2b2 � 4ac2a
y2 � y1
x2 � x1
ax1 � x2
2,
y1 � y2
2b
12
bh2
This document has been produced under a contract with the Mississippi Department of Education. Neither the Department nor any other entities,public or private, shall hold copyright on this document. Because this publication/document was produced with the public funds of Mississippi, itmay be reproduced within the scope of its original purpose of educational development. Reproduction and use for monetary gain are strictlyprohibited.
2011–2012 ALGEBRA I Mississippi Subject Area Testing Program Teacher’s Guide
14 SATP2 2011–2012 Algebra I Teacher’s Guide—Copyright © 2011 MDE
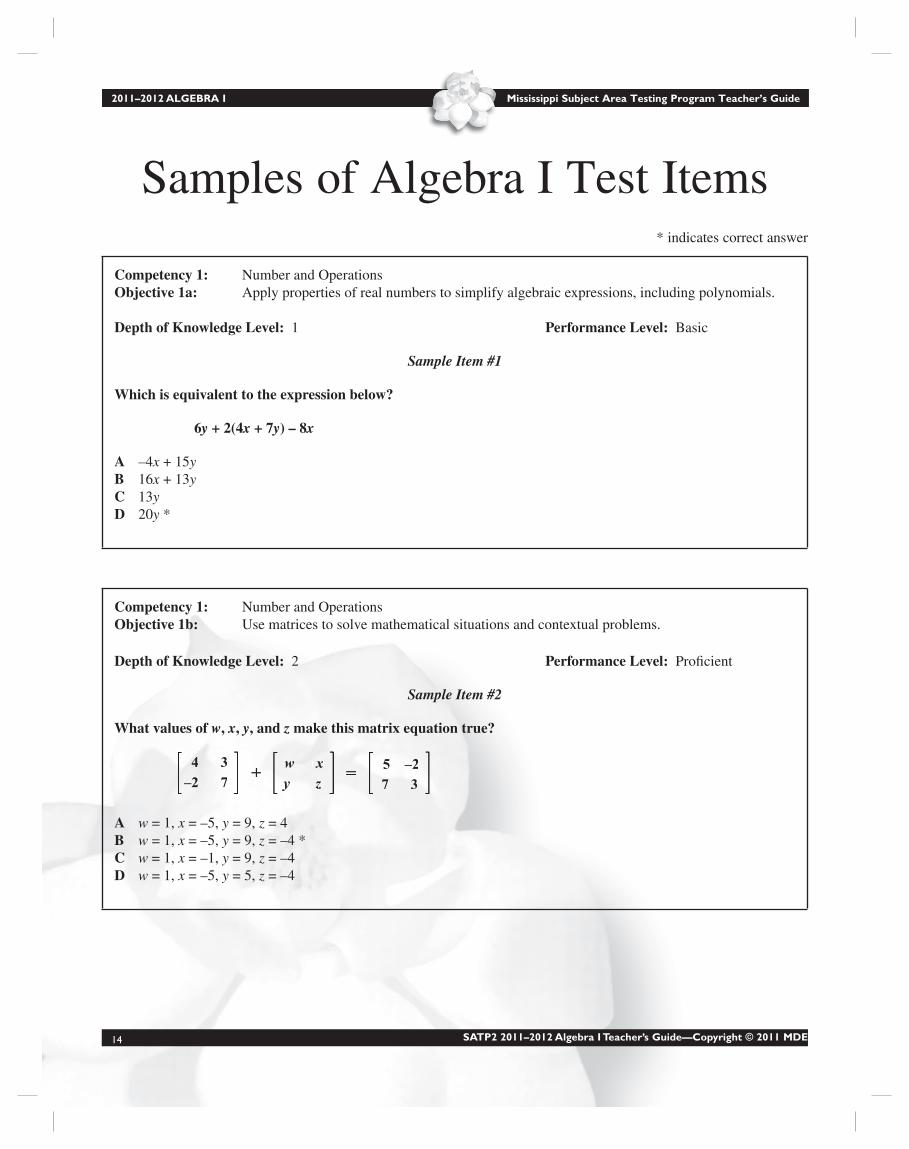
Samples of Algebra I Test Items* indicates correct answer
Competency 1: Number and Operations
Objective 1a: Apply properties of real numbers to simplify algebraic expressions, including polynomials.
Depth of Knowledge Level: 1 Performance Level: Basic
Sample Item #1
Which is equivalent to the expression below?
6y + 2(4x + 7y) – 8x
–4A x + 15y16B x + 13y13C y20D y *
Competency 1: Number and Operations
Objective 1b: Use matrices to solve mathematical situations and contextual problems.
Depth of Knowledge Level: 2 Performance Level: Profi cient
Sample Item #2
What values of w, x, y, and z make this matrix equation true?
w x
y z+ =
4 3–2 7
5 –2 7 3
w A = 1, x = –5, y = 9, z = 4
w B = 1, x = –5, y = 9, z = –4 *
w C = 1, x = –1, y = 9, z = –4
w D = 1, x = –5, y = 5, z = –4
Mississippi Subject Area Testing Program Teacher’s Guide 2011–2012 ALGEBRA I
SATP2 2011–2012 Algebra I Teacher’s Guide—Copyright © 2011 MDE 15
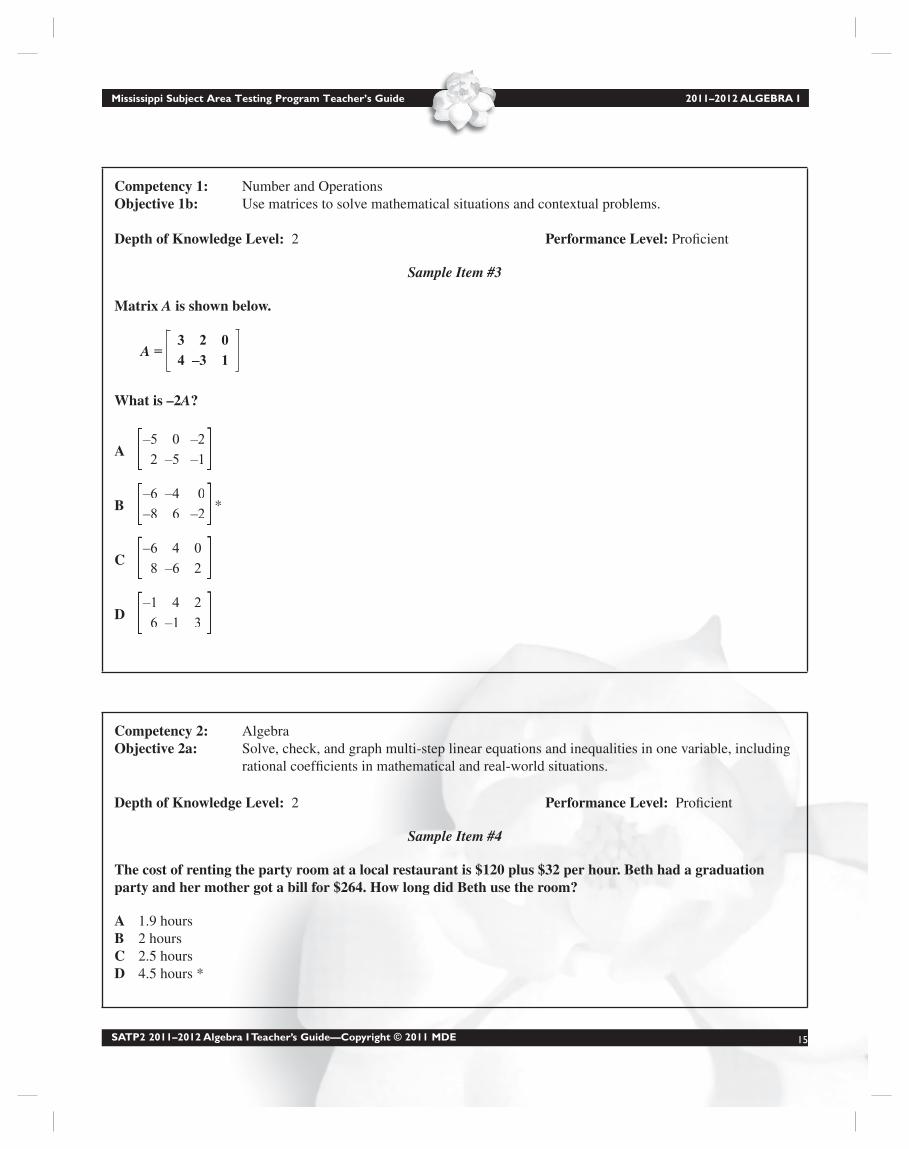
Competency 1: Number and Operations
Objective 1b: Use matrices to solve mathematical situations and contextual problems.
Depth of Knowledge Level: 2 Performance Level: Profi cient
Sample Item #3
Matrix A is shown below.
3 2 0 4 –3 1
A =
What is –2A?
–5 0 –2
2 –5 –1A
–6 –4 0
–8 6 –2B *
–6 4 0
8 –6 2C
–1 4 2
6 –1 3D
Competency 2: Algebra
Objective 2a: Solve, check, and graph multi-step linear equations and inequalities in one variable, including
rational coeffi cients in mathematical and real-world situations.
Depth of Knowledge Level: 2 Performance Level: Profi cient
Sample Item #4
The cost of renting the party room at a local restaurant is $120 plus $32 per hour. Beth had a graduation party and her mother got a bill for $264. How long did Beth use the room?
1.9 hoursA 2 hoursB 2.5 hoursC 4.5 hours *D

2011–2012 ALGEBRA I Mississippi Subject Area Testing Program Teacher’s Guide
16 SATP2 2011–2012 Algebra I Teacher’s Guide—Copyright © 2011 MDE
Competency 2: Algebra
Objective 2a: Solve, check, and graph multi-step linear equations and inequalities in one variable, including
rational coeffi cients in mathematical and real-world situations.
Depth of Knowledge Level: 2 Performance Level: Profi cient
Sample Item #5
What is the solution set for this inequality?
4x – 2 � 9x – 20 + x
A
{B x : x � –3}
{C x : x � 3}*
D
Competency 2: Algebra
Objective 2b: Solve and graph absolute value equations and equalities in one variable.
Depth of Knowledge Level: 2 Performance Level: Profi cient
Sample Item #6
What is the product of the solutions to the equation?
|2x – 1| = 3
–4A –2 *B 2C 4D
Mississippi Subject Area Testing Program Teacher’s Guide 2011–2012 ALGEBRA I
SATP2 2011–2012 Algebra I Teacher’s Guide—Copyright © 2011 MDE 17
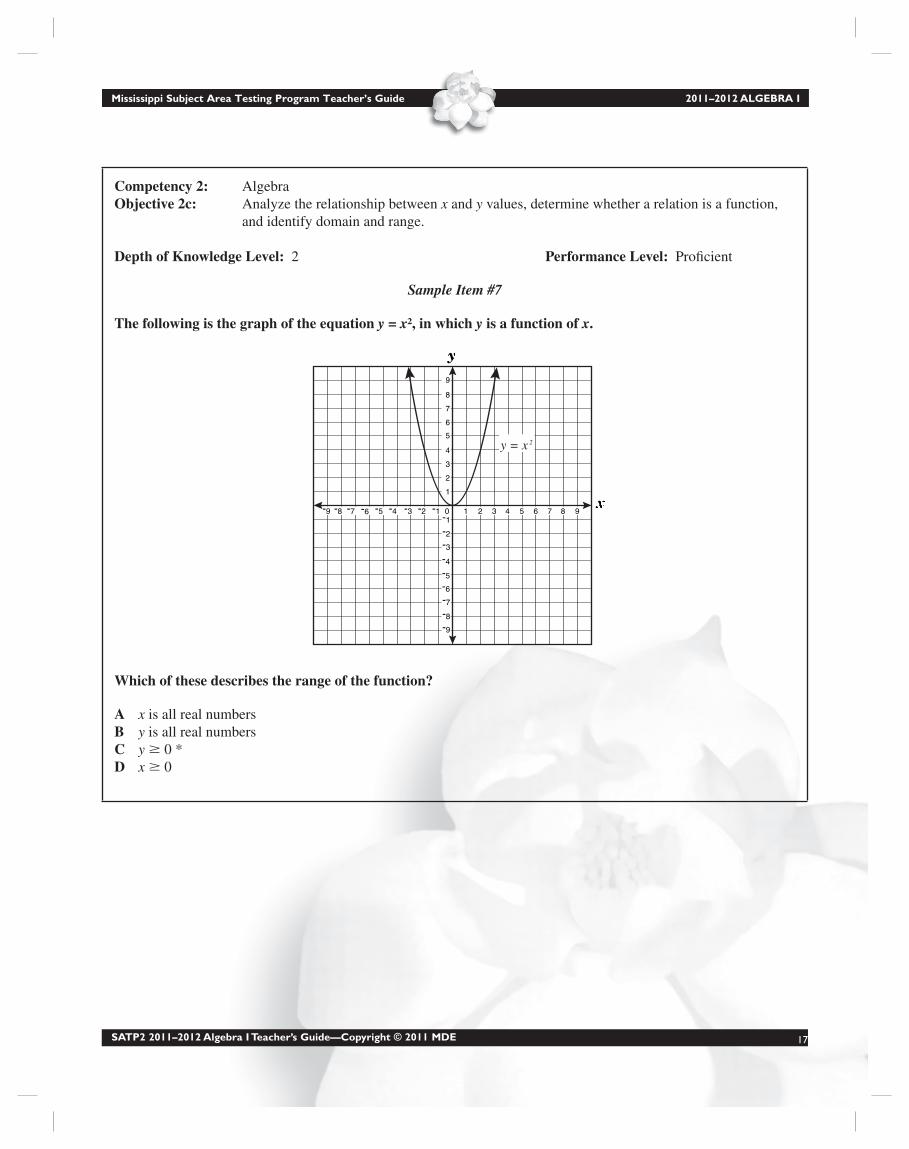
Competency 2: Algebra
Objective 2c: Analyze the relationship between x and y values, determine whether a relation is a function,
and identify domain and range.
Depth of Knowledge Level: 2 Performance Level: Profi cient
Sample Item #7
The following is the graph of the equation y = x², in which y is a function of x.
y
x-1-1
-2
-3
-4
-5
-6
-7
-8
-9
1
1
2
3
4
5
6
7
8
9
3 52 4 7 96 8-2-3-4-5-6-7-8-9 0
y = x 2
Which of these describes the range of the function?
xA is all real numbers
yB is all real numbers
yC � 0 *
xD � 0
2011–2012 ALGEBRA I Mississippi Subject Area Testing Program Teacher’s Guide
18 SATP2 2011–2012 Algebra I Teacher’s Guide—Copyright © 2011 MDE
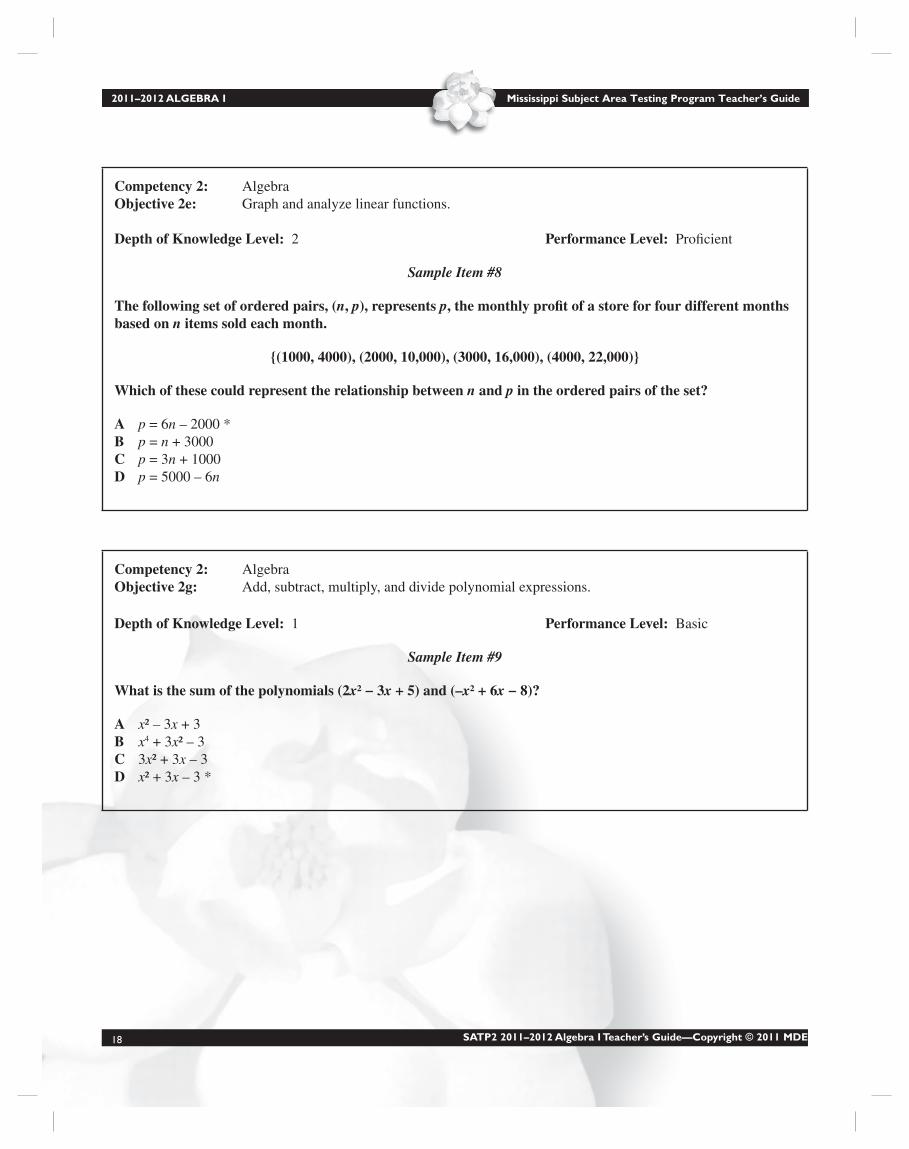
Competency 2: Algebra
Objective 2e: Graph and analyze linear functions.
Depth of Knowledge Level: 2 Performance Level: Profi cient
Sample Item #8
The following set of ordered pairs, (n, p), represents p, the monthly profi t of a store for four different months based on n items sold each month.
{(1000, 4000), (2000, 10,000), (3000, 16,000), (4000, 22,000)}
Which of these could represent the relationship between n and p in the ordered pairs of the set?
pA = 6n – 2000 *
pB = n + 3000
pC = 3n + 1000
pD = 5000 – 6n
Competency 2: Algebra
Objective 2g: Add, subtract, multiply, and divide polynomial expressions.
Depth of Knowledge Level: 1 Performance Level: Basic
Sample Item #9
What is the sum of the polynomials (2x² − 3x + 5) and (–x² + 6x − 8)?
xA ² – 3x + 3
xB 4 + 3x² – 3
3C x² + 3x – 3
xD ² + 3x – 3 *

Mississippi Subject Area Testing Program Teacher’s Guide 2011–2012 ALGEBRA I
SATP2 2011–2012 Algebra I Teacher’s Guide—Copyright © 2011 MDE 19
Competency 2: Algebra
Objective 2h: Factor polynomials by using Greatest Common Factor (GCF) and factor quadratics that have
only rational roots.
Depth of Knowledge Level: 1 Performance Level: Profi cient
Sample Item #10
Which shows the following polynomial factored completely?
9b3 + 24b2 + 16b
bA (3b – 4)2
3B b(3b2 + 8b)
3C b2(3b + 8)
bD (3b + 4)2 *
Competency 2: Algebra
Objective 2k: Graph and analyze absolute value and quadratic functions.
Depth of Knowledge Level: 2 Performance Level: Profi cient
Sample Item #11
What is the sum of the solutions to the quadratic equation?
x² − 4x − 5 = 0
0A 4 *B 5C 6D
2011–2012 ALGEBRA I Mississippi Subject Area Testing Program Teacher’s Guide
20 SATP2 2011–2012 Algebra I Teacher’s Guide—Copyright © 2011 MDE
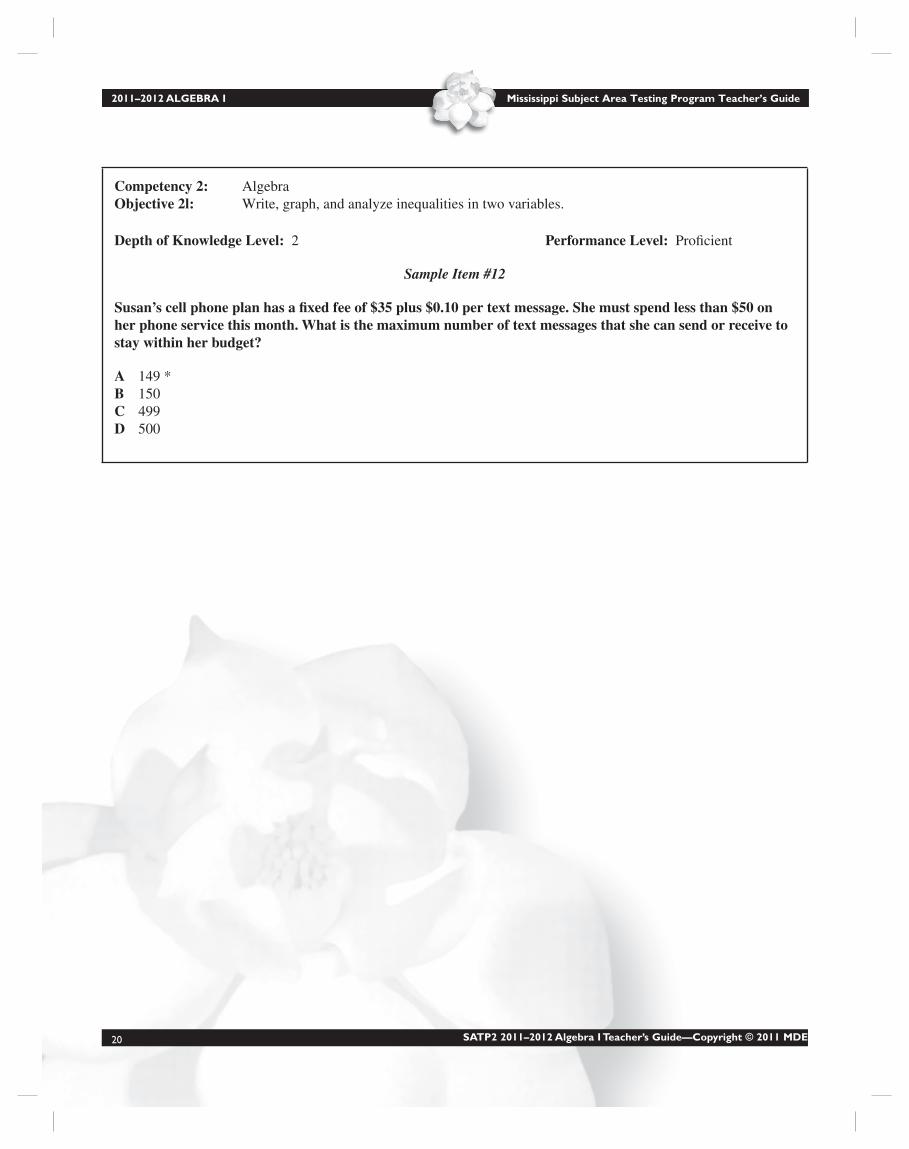
Competency 2: Algebra
Objective 2l: Write, graph, and analyze inequalities in two variables.
Depth of Knowledge Level: 2 Performance Level: Profi cient
Sample Item #12
Susan’s cell phone plan has a fi xed fee of $35 plus $0.10 per text message. She must spend less than $50 on her phone service this month. What is the maximum number of text messages that she can send or receive to stay within her budget?
149 *A 150B 499C 500D

Mississippi Subject Area Testing Program Teacher’s Guide 2011–2012 ALGEBRA I
SATP2 2011–2012 Algebra I Teacher’s Guide—Copyright © 2011 MDE 21
Competency 3: Geometry
Objective 3a: Apply the concept of slope to determine if lines in a plane are parallel or perpendicular.
Depth of Knowledge Level: 2 Performance Level: Profi cient
Sample Item #13
The graph of y = –3x − 1 is shown below.
y
x-1-1
-2
-3
-4
-5
-6
-7
-8
-9
1
1
2
3
4
5
6
7
8
9
3 52 4 7 96 8-2-3-4-5-6-7-8-9 0
Which of the following equations represents the line perpendicular to y = –3x − 1 and passing through the point (4, 3)?
yA = –3x + 15
y = – x + –x3 3
1 5B
yC = 3x – 9
y = x +1
3
5
3D *

2011–2012 ALGEBRA I Mississippi Subject Area Testing Program Teacher’s Guide
22 SATP2 2011–2012 Algebra I Teacher’s Guide—Copyright © 2011 MDE
Competency 3: Geometry
Objective 3b: Solve problems that involve interpreting slope as a rate of change.
Depth of Knowledge Level: 2 Performance Level: Profi cient
Sample Item #14
Between which time interval is the rate of change the greatest?
Time in Seconds (t)
Dis
tance
in F
eet
1 2 3 4
0 A � t � 1
1 B � t � 2 *
2 C � t � 3
3 D � t � 4

Mississippi Subject Area Testing Program Teacher’s Guide 2011–2012 ALGEBRA I
SATP2 2011–2012 Algebra I Teacher’s Guide—Copyright © 2011 MDE 23
Competency 4: Measurement
Objective 4a: Solve real-world problems involving formulas for perimeter, area, distance, and rate.
Depth of Knowledge Level: 2 Performance Level: Basic
Sample Item #15
Brenita has a rectangular garden that is 12 feet wide and has a diagonal of 20 feet. She wants to put a border around the perimeter of the garden. How many feet of border will she need?
32A 56 *B 64C 76D
2011–2012 ALGEBRA I Mississippi Subject Area Testing Program Teacher’s Guide
24 SATP2 2011–2012 Algebra I Teacher’s Guide—Copyright © 2011 MDE
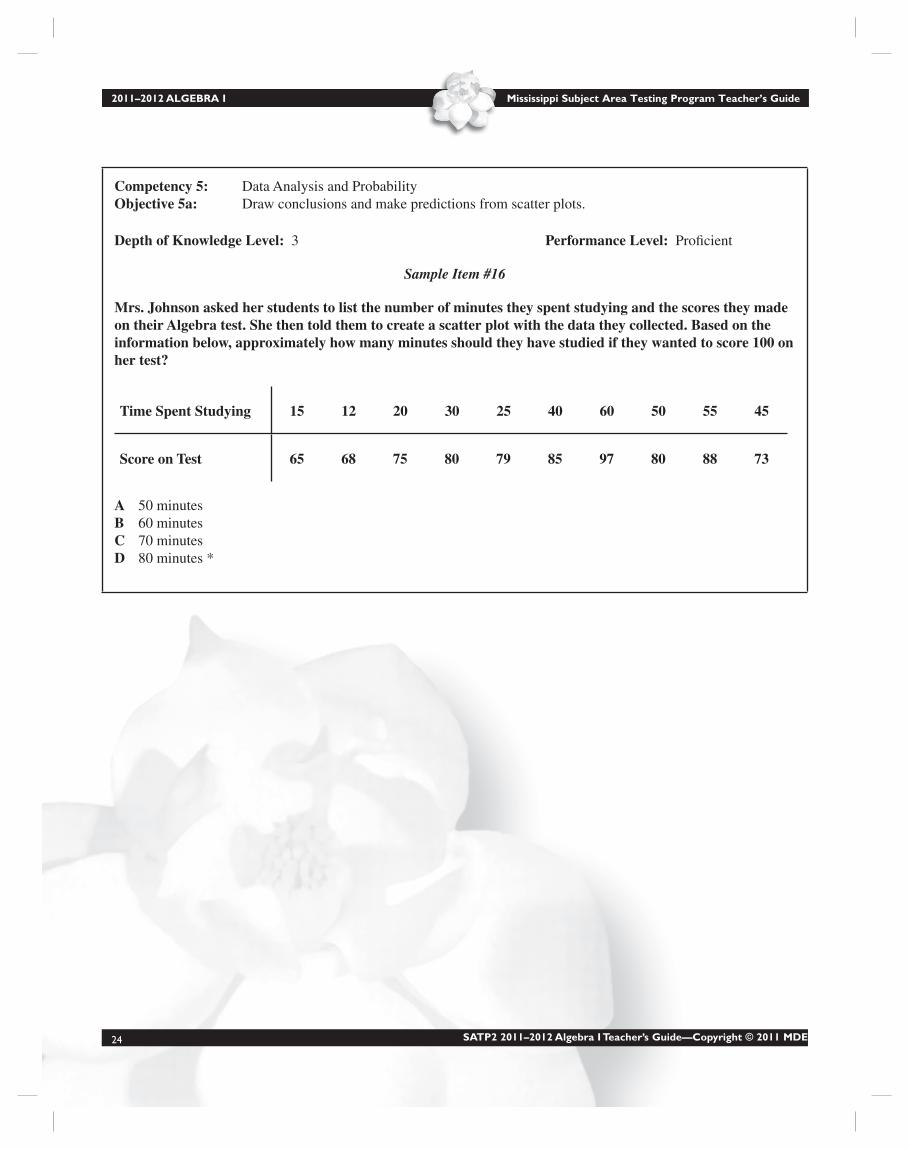
Competency 5: Data Analysis and Probability
Objective 5a: Draw conclusions and make predictions from scatter plots.
Depth of Knowledge Level: 3 Performance Level: Profi cient
Sample Item #16
Mrs. Johnson asked her students to list the number of minutes they spent studying and the scores they made on their Algebra test. She then told them to create a scatter plot with the data they collected. Based on the information below, approximately how many minutes should they have studied if they wanted to score 100 on her test?
Time Spent Studying 15 12 20 30 25 40 60 50 55 45
Score on Test 65 68 75 80 79 85 97 80 88 73
50 minutesA 60 minutesB 70 minutesC 80 minutes *D

Mississippi Subject Area Testing Program Teacher’s Guide 2011–2012 ALGEBRA I
SATP2 2011–2012 Algebra I Teacher’s Guide—Copyright © 2011 MDE 25
Interpretation of Score Reports for Algebra I
Several different score reports are available following administrations of the Mississippi Subject Area Tests:
The • Student Report gives the scores for an individual student.
The • Class Performance Report gives the scores for all students in a particular class.
The • School Summary Report by Competency displays the total performance of an entire school.
The • Student Roster & Summary gives a summary of each student’s performance in a school.
The • School Summary Report Combined Standard Administrations gives a summary of all the scores for students
in a school who participated for the first time in the fall and spring administrations.
Because the most immediate interest for a classroom teacher is the performance of his or her own students, the following
discussion explains how to interpret the information contained in the Class Performance Report and the Student Report. A sample Class Performance Report and a sample Student Report appear on pages 27 and 29, respectively.
Score Report InformationBeginning in 2007–2008, all students enrolled in Algebra I for the first time were tested on material from the 2007 Mississippi Mathematics Framework, Revised. Sample reports for the 2007 Mississippi Mathematics Framework, Revised
are included in this guide.
Students who were enrolled in Algebra I prior to the 2007–2008 school year were taught from the Mississippi Mathematics Framework 2000. Any of these students who did not obtain a passing score will continue to be assessed based on the
Mississippi Mathematics Framework 2000. These students will receive reports that differ slightly from the reports featured
in this guide. To obtain more information about the Class Performance Report and the Student Report for students who
were taught from the Mississippi Mathematics Framework 2000, please access the Office of Student Assessment website
at http://www.mde.k12.ms.us/osa.
2011–2012 ALGEBRA I Mississippi Subject Area Testing Program Teacher’s Guide
26 SATP2 2011–2012 Algebra I Teacher’s Guide—Copyright © 2011 MDE
The Class Performance Report shows the scores for each
student within a classroom who will take the Algebra I
test during the 2011–2012 school year. Two copies are
provided for each school.
The top portion of the report displays the teacher’s •
name, administration name, school name, district
name, and district and school code.
The top-left portion of the report labeled SUMMARY •
shows the following information for included students:
the TOTAL N-COUNT (the number of students within
the classroom who took the test), the number of
students included in the SUMMARY, the mean scale
score, the number of students who passed, and the
percentage of students who passed.
Below the SUMMARY information is an alphabetical •
list of the students in the class who took the Algebra
I test. Each student’s MSIS identification number, as
recorded on the student’s answer sheet at the time of
testing, is also displayed.
The data portion of the Class Performance Report includes
the SCALE SCORE, Summary Exclusion Flag, the PASS/
FAIL STATUS, and the raw scores for MULTIPLE-
CHOICE ITEMS.
The SCALE SCORE is each student’s total test score. •
Each student’s raw score is converted to a scale score.
A raw score is the number of points earned for a domain or
competency. Scale scores represent approximately equal
units on a continuous scale of numbers that will typically
range from 620 to 680. The raw scores from different
forms may not be comparable because forms can vary in
difficulty. Because the raw scores may not be comparable
across forms, they are converted to scale scores through a
statistical process that adjusts for any differences in test
difficulty between forms. For this reason, the scale scores
are especially suitable for comparing student performance
across years and for ensuring that the same level of
difficulty of a performance standard is maintained across
years.
On the Class Performance Report, the scale score is each
student’s total test score. A scale score is provided only if
the student attained a valid raw score.
The Summary Exclusion Flag indicates if the student’s •
score is not included in the SUMMARY. Explanations
of the status codes assigned to students who are not
included in the SUMMARY are shown at the bottom
of the report in the Legend section.
Next to the Summary Exclusion Flags is a column •
indicating PASS/FAIL STATUS. This status indicates
the comparison of the student’s scale score to the
passing score (647) for the test. If a student’s scale
score is equal to or greater than the passing score, this
column indicates PASS. If the student’s scale score
is less than the passing score, this column indicates
FAIL.
The columns beneath the MULTIPLE-CHOICE •
ITEMS heading provide information on the tested
competencies from the 2007 Mississippi Mathematics Framework, Revised. The top of the first column shows
the Total Raw Score (the maximum number of points
possible). Points are based on the number of correct
answers. Each student’s Total Raw score is displayed
in this column. If the student did not obtain a score, then
a status code is displayed and explained by the legend
at the bottom of the report. The tops of the remaining
columns show the five competencies (Number and
Operations, Algebra, Geometry, Measurement, and
Data Analysis and Probability) being tested and
the maximum number of points possible for each
competency. Raw scores within each competency for
each student are displayed in these columns.
At the bottom of the table, the MEAN RAW SCORE •
and AVERAGE PERCENT CORRECT values are
listed by competency. The MEAN RAW SCORE
and AVERAGE PERCENT CORRECT values are
calculated only for first-time test takers who are
included in the SUMMARY. The MEAN RAW
SCORE is the raw score of the students included in the
SUMMARY. The AVERAGE PERCENT CORRECT
is the mean raw score per competency divided by
the maximum number of points possible for that
competency.
Class Performance Report

Mississippi Subject Area Testing Program Teacher’s Guide 2011–2012 ALGEBRA I
SATP2 2011–2012 Algebra I Teacher’s Guide—Copyright © 2011 MDE 27
2007 Mississippi Mathematics Framework, Revised Sample Algebra I Class Performance Report
Mississippi Subject AreaTesting Program,Second Edition
SATP2
For the classroom ofTEACHER NAME
SATP2 Dec 20YY Paper/Pencil
Class Performance Report — Algebra I
Zbatch or Process NoCopy: 01 Page X of Y
2007 Mathematics Framework, Revised
School Name: <SCHOOL NAME>District Name: <DISTRICT NAME>
Code: ####-###
ALGEBRA ICompetency
TotalNumberCorrect
Number andOperations Algebra Geometry Measurement Data Analysis
and Probability
NumberPossible 53 7 24 7 8 7
STUDENT NAME MSIS IDSCALESCORE
PASS/FAILSTATUS Number Correct
LASTNAME FIRSTNAME I ######### ### #### ### ### ### ### ### ###LASTNAME FIRSTNAME I ######### ### #### ### ### ### ### ### ###LASTNAME FIRSTNAME I ######### ### #### ### ### ### ### ### ###LASTNAME FIRSTNAME I ######### DNA DNA DNA DNA DNA DNA DNALASTNAME FIRSTNAME I ######### ### #### ### ### ### ### ### ###
LASTNAME FIRSTNAME I ######### ### #### ### ### ### ### ### ###LASTNAME FIRSTNAME I ######### ### #### ### ### ### ### ### ###LASTNAME FIRSTNAME I ######### ### R #### ### ### ### ### ### ###LASTNAME FIRSTNAME I ######### INV E INV INV INV INV INV INVLASTNAME FIRSTNAME I ######### ### #### ### ### ### ### ### ###
LASTNAME FIRSTNAME I ######### DNF DNF DNF DNF DNF DNF DNFLASTNAME FIRSTNAME I ######### ### #### ### ### ### ### ### ###LASTNAME FIRSTNAME I ######### 05 E FAIL 05 05 05 05 05 05LASTNAME FIRSTNAME I ######### ### #### ### ### ### ### ### ###LASTNAME FIRSTNAME I ######### DNA E DNA DNA DNA DNA DNA DNA
LASTNAME FIRSTNAME I ######### 04 E FAIL 04 04 04 04 04 04LASTNAME FIRSTNAME I ######### ### R #### ### ### ### ### ### ###LASTNAME FIRSTNAME I ######### ### #### ### ### ### ### ### ###LASTNAME FIRSTNAME I ######### ### R #### ### ### ### ### ### ###LASTNAME FIRSTNAME I ######### ### M #### ### ### ### ### ### ###
LASTNAME FIRSTNAME I ######### ### #### ### ### ### ### ### ###LASTNAME FIRSTNAME I ######### ### #### ### ### ### ### ### ###LASTNAME FIRSTNAME I ######### ### #### ### ### ### ### ### ###LASTNAME FIRSTNAME I ######### ### #### ### ### ### ### ### ###LASTNAME FIRSTNAME I ######### ### #### ### ### ### ### ### ###
AVERAGE NUMBER CORRECT ##.# ##.# ##.# ##.# ##.# ##.#AVERAGE PERCENT CORRECT ###.# ###.# ###.# ###.# ###.# ###.#
SUMMARY:TOTAL N-COUNT #####NUMBER INCLUDED #####MEAN SCALE SCORE ###.#NUMBER PASSING #####PERCENT PASSING ###.#%
Legend: E= Excluded from Summary R = Retest, Excluded from Summary INV = Invalid Test DNA = Did Not Attempt M = Maximum Number CorrectDNF = Did Not Finish 04 = Student Refused to Take Test 05 = Unfair Advantage COND = Pass status is pending official confirmation
2011–2012 ALGEBRA I Mississippi Subject Area Testing Program Teacher’s Guide
28 SATP2 2011–2012 Algebra I Teacher’s Guide—Copyright © 2011 MDE
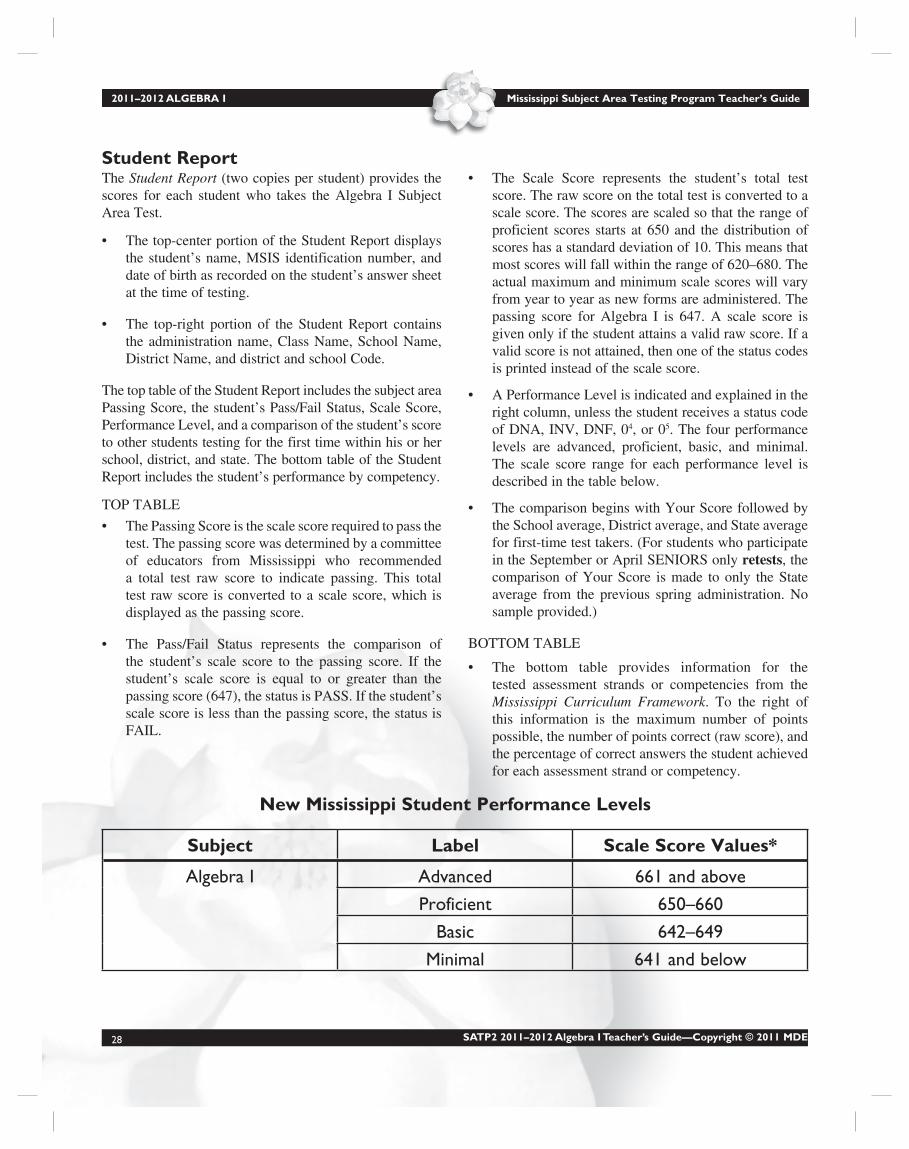
New Mississippi Student Performance Levels
Subject Label Scale Score Values*
Algebra I Advanced 661 and above
Proficient 650–660
Basic 642–649
Minimal 641 and below
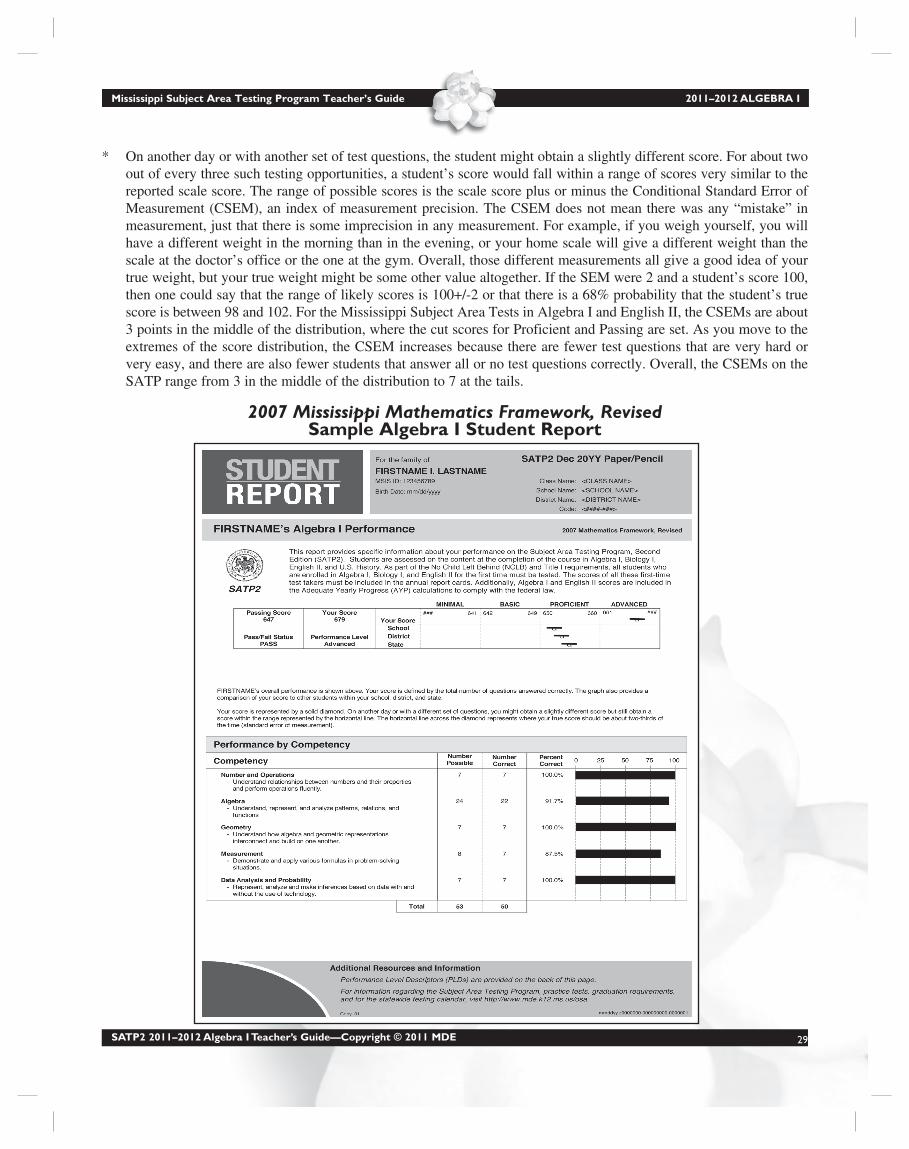
The Student Report (two copies per student) provides the
scores for each student who takes the Algebra I Subject
Area Test.
The top-center portion of the Student Report displays •
the student’s name, MSIS identification number, and
date of birth as recorded on the student’s answer sheet
at the time of testing.
The top-right portion of the Student Report contains •
the administration name, Class Name, School Name,
District Name, and district and school Code.
The top table of the Student Report includes the subject area
Passing Score, the student’s Pass/Fail Status, Scale Score,
Performance Level, and a comparison of the student’s score
to other students testing for the first time within his or her
school, district, and state. The bottom table of the Student
Report includes the student’s performance by competency.
TOP TABLE
The Passing Score is the scale score required to pass the •
test. The passing score was determined by a committee
of educators from Mississippi who recommended
a total test raw score to indicate passing. This total
test raw score is converted to a scale score, which is
displayed as the passing score.
The Pass/Fail Status represents the comparison of •
the student’s scale score to the passing score. If the
student’s scale score is equal to or greater than the
passing score (647), the status is PASS. If the student’s
scale score is less than the passing score, the status is
FAIL.
The Scale Score represents the student’s total test •
score. The raw score on the total test is converted to a
scale score. The scores are scaled so that the range of
proficient scores starts at 650 and the distribution of
scores has a standard deviation of 10. This means that
most scores will fall within the range of 620–680. The
actual maximum and minimum scale scores will vary
from year to year as new forms are administered. The
passing score for Algebra I is 647. A scale score is
given only if the student attains a valid raw score. If a
valid score is not attained, then one of the status codes
is printed instead of the scale score.
A Performance Level is indicated and explained in the •
right column, unless the student receives a status code
of DNA, INV, DNF, 04, or 05. The four performance
levels are advanced, proficient, basic, and minimal.
The scale score range for each performance level is
described in the table below.
The comparison begins with Your Score followed by •
the School average, District average, and State average
for first-time test takers. (For students who participate
in the September or April SENIORS only retests, the
comparison of Your Score is made to only the State
average from the previous spring administration. No
sample provided.)
BOTTOM TABLE
The bottom table provides information for the •
tested assessment strands or competencies from the
Mississippi Curriculum Framework. To the right of
this information is the maximum number of points
possible, the number of points correct (raw score), and
the percentage of correct answers the student achieved
for each assessment strand or competency.
Student Report
Mississippi Subject Area Testing Program Teacher’s Guide 2011–2012 ALGEBRA I
SATP2 2011–2012 Algebra I Teacher’s Guide—Copyright © 2011 MDE 29
2007 Mississippi Mathematics Framework, Revised Sample Algebra I Student Report
* On another day or with another set of test questions, the student might obtain a slightly different score. For about two
out of every three such testing opportunities, a student’s score would fall within a range of scores very similar to the
reported scale score. The range of possible scores is the scale score plus or minus the Conditional Standard Error of
Measurement (CSEM), an index of measurement precision. The CSEM does not mean there was any “mistake” in
measurement, just that there is some imprecision in any measurement. For example, if you weigh yourself, you will
have a different weight in the morning than in the evening, or your home scale will give a different weight than the
scale at the doctor’s office or the one at the gym. Overall, those different measurements all give a good idea of your
true weight, but your true weight might be some other value altogether. If the SEM were 2 and a student’s score 100,
then one could say that the range of likely scores is 100+/-2 or that there is a 68% probability that the student’s true
score is between 98 and 102. For the Mississippi Subject Area Tests in Algebra I and English II, the CSEMs are about
3 points in the middle of the distribution, where the cut scores for Proficient and Passing are set. As you move to the
extremes of the score distribution, the CSEM increases because there are fewer test questions that are very hard or
very easy, and there are also fewer students that answer all or no test questions correctly. Overall, the CSEMs on the
SATP range from 3 in the middle of the distribution to 7 at the tails.
2011–2012 ALGEBRA I Mississippi Subject Area Testing Program Teacher’s Guide
30 SATP2 2011–2012 Algebra I Teacher’s Guide—Copyright © 2011 MDE
Glossary of Test TermsBlueprint: The blueprint indicates the number of items
from each competency that must appear on a test.
Competencies: Objectives used for test-construction
purposes are combined for reporting purposes into
competencies. The test items are written to the objectives,
not to the competencies.
Core items: This term refers to the scorable test items that
count toward the student’s score.
Criterion-referenced test (CRT): CRTs are constructed
to assess a student’s understanding of given competencies
or objectives. The Mississippi Subject Area Tests are
criterion-referenced tests.
Depth of Knowledge (DOK): DOK measures the cognitive
demand of the task students are being asked to perform.
Distractors: This term refers to the incorrect choices to a
multiple-choice item.
Enhanced multiple-choice items: This term refers to test
items that ask the student to use graphic information or to
use information provided about the world outside of the
school setting.
Equating: This term refers to the process that uses linking
items to construct different forms of a test so that each form
has the same degree of difficulty.
Field-test items: Field-test items have never been on a
test before. These items have no statistical data and are not
counted for or against the student’s score. Once these items
have been tested and statistically evaluated, they may appear
on new forms of the test or they may be deleted. Because
field-test items are not identified on the test, students will
not know which items count and which do not.
Forms: Different test forms are used at each administration.
All forms are constructed so that they have the same number
of items in each of the competencies. In addition, they have
the same statistical qualities; that is, they have the same
degree of difficulty.
Item: This term refers to a single question or problem in
a test.
Lead art: This term refers to the graphic portion of the item
that precedes the written portion of the item. Lead art is
different from the art that may be used as options.
Linking items: This term refers to items that are found
across more than one test form. They are used for equating
forms and must be identical on all test forms.
Multiple-choice items: This term refers to items that ask
students to choose the correct answer from several given
answers or options.
Objective: This term refers to the knowledge, skill, process,
or strategy that an item measures.
Objective/item match: There must be alignment between
a given objective and an item that measures the objective.
During item review, each item must match the objective or
the item will be moved to the appropriate objective.
Options: This term refers to the possible responses in
multiple-choice items, including the correct response and
all distractors. Some options will appear as art.
Selected-response item: This is another term for a
multiple-choice item.
Standardized test: This term refers to a test that contains
the same content administered in the same way for everyone
taking the test.
Stem: The item stem states the problem and is posed as a
question or as an incomplete statement.
Stimulus: The item stem, piece of art, or referent that
prompts a response is called a stimulus.
Test construction: This term refers to the selection of the
items that go into each form of a test and to the arrangement
of the items in an appropriate sequence.

MS00005700
MISSISSIPPISUBJECT AREA TESTING PROGRAM,
SECOND EDITIONSATP2
Algebra I Teacher’s Guide
2011–2012
School Year
MS00005700 1 2 3 4 5 A B C D E Printed in the USA