sebeka student enrollment projection to 2024/25 enrollment... · this enrollment projection was...
TRANSCRIPT

Sebeka
Student Enrollment Projection
to 2024/25
Slide 1 Notes: Introduction
This enrollment projection was prepared for Foster Jacobs Johnson by Applied Insightsnorth [John Powers, Principal / 181 Farley Lane, Duluth MN 55803 / 218.724.2332 /
August 14, 2015
School logo used with permission.
Previous enrollment projections and education projects by Applied Insightsnorth: Enrollment projections: Minnesota: Greenway, Nashwauk-Keewatin, Mora, Grand Rapids/Bigfork, Thief River Falls, Deer River, St. Louis County, Mountain Lake, Hermantown, Fosston, Northland (Remer), Nevis, Wheaton, Melrose, Red Lake Falls North Dakota: Grafton, Minto, Park River, North Border, Carrington, Thompson Wisconsin: Northwestern (Maple, WI), Washburn, Ashland Red Lake College Enrollment Assessment Iron Range Higher Education Committee Northeast Higher Education District (Minnesota State College and University system) St. Louis County Schools long-range facilities plan
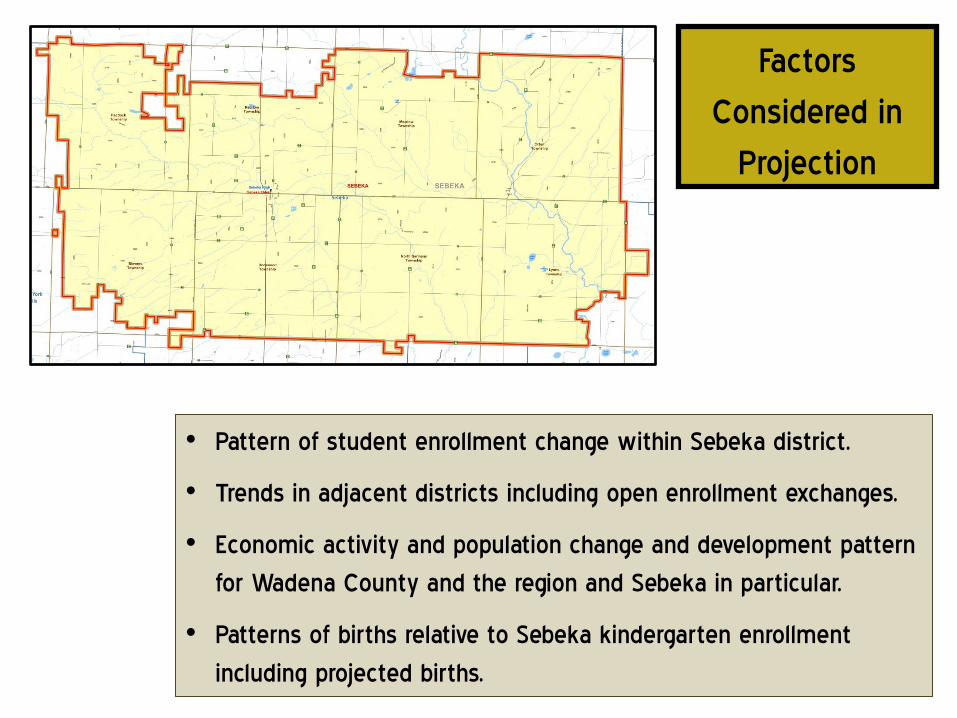
• Pattern of student enrollment change within Sebeka district.
• Trends in adjacent districts including open enrollment exchanges.
• Economic activity and population change and development pattern
for Wadena County and the region and Sebeka in particular.
• Patterns of births relative to Sebeka kindergarten enrollment
including projected births.
Factors
Considered in
Projection
Source: MDE, district.
0
100
200
300
400
500
600
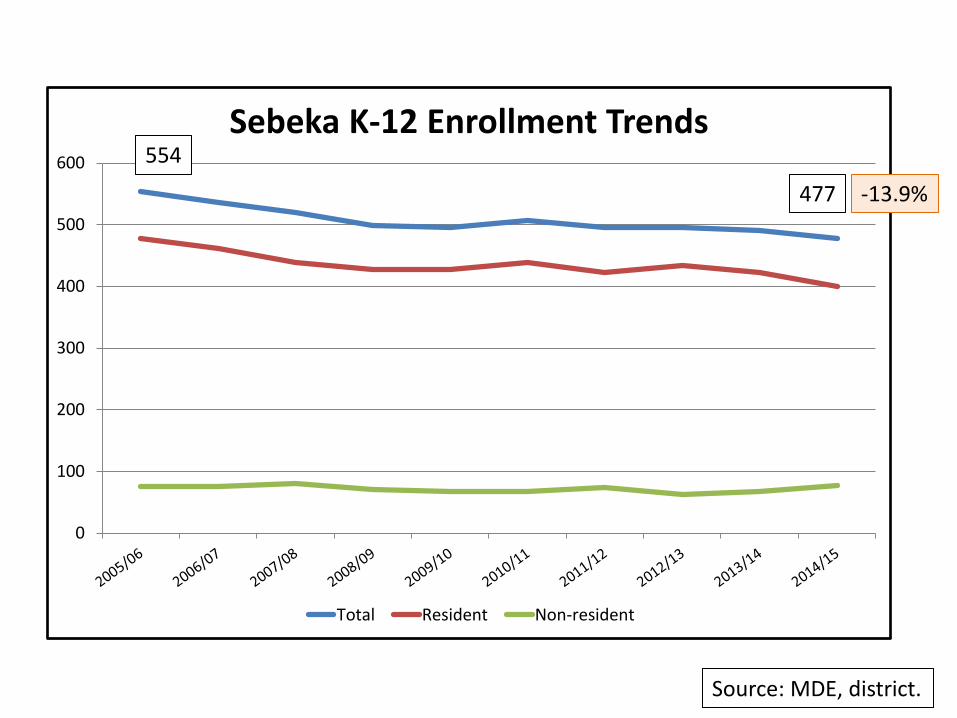
Sebeka K-12 Enrollment Trends
Total Resident Non-resident
554
477 -13.9%

Sebeka Enrollment, 2005/06 – 2014/15
Grade 2005/06 2006/07 2007/08 2008/09 2009/10 2010/11 2011/12 2012/13 2013/14 2014/15
Pk 36 36 36 36 37 36 37 37 36 37
Kg 40 31 29 31 28 45 29 32 34 30
1 38 37 29 27 36 26 45 34 30 39
2 34 38 33 28 31 37 29 46 36 35
3 35 37 38 33 28 29 39 28 46 37
4 51 38 40 40 31 34 29 39 30 46
5 40 51 40 39 40 30 34 31 38 33
6 46 40 51 40 37 44 31 35 33 37
7 47 43 42 50 41 36 42 34 31 36
8 43 44 45 39 49 41 38 44 35 31
9 45 43 43 46 40 50 41 39 43 35
10 44 48 43 41 50 41 49 44 37 43
11 43 42 44 44 39 56 38 52 45 34
12 48 44 42 40 45 38 52 38 53 41
Total Pk - 12 590 572 555 534 532 543 533 533 527 514
Total Kg - 12 554 536 519 498 495 507 496 496 491 477
K - 6 284 272 260 238 231 245 236 245 247 257
7 - 12 270 264 259 260 264 262 260 251 244 220
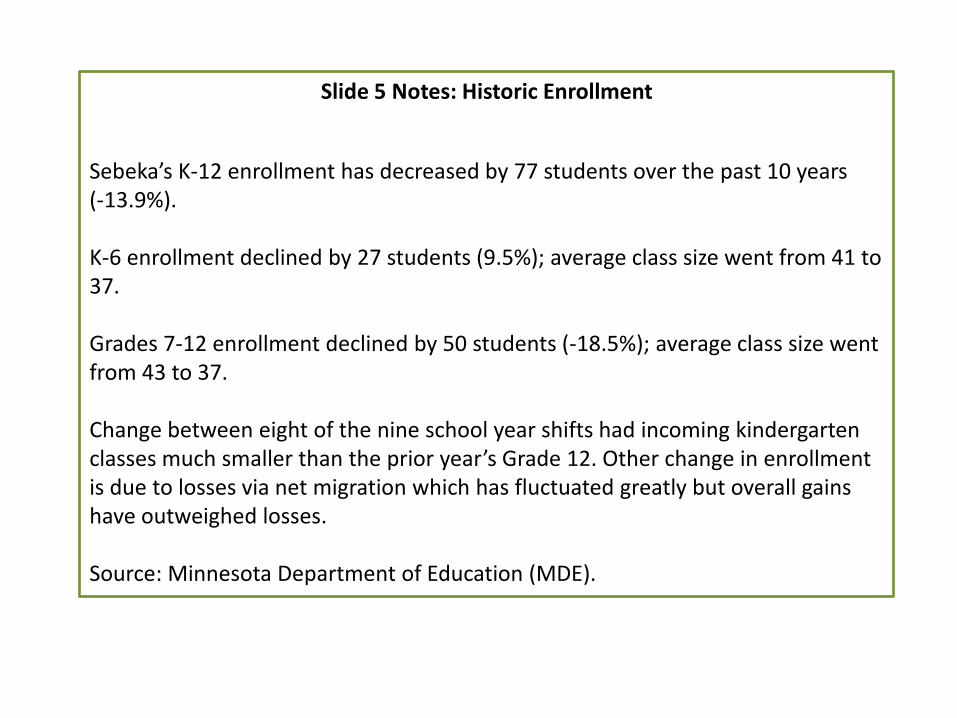
Slide 5 Notes: Historic Enrollment
Sebeka’s K-12 enrollment has decreased by 77 students over the past 10 years (-13.9%). K-6 enrollment declined by 27 students (9.5%); average class size went from 41 to 37. Grades 7-12 enrollment declined by 50 students (-18.5%); average class size went from 43 to 37. Change between eight of the nine school year shifts had incoming kindergarten classes much smaller than the prior year’s Grade 12. Other change in enrollment is due to losses via net migration which has fluctuated greatly but overall gains have outweighed losses. Source: Minnesota Department of Education (MDE).
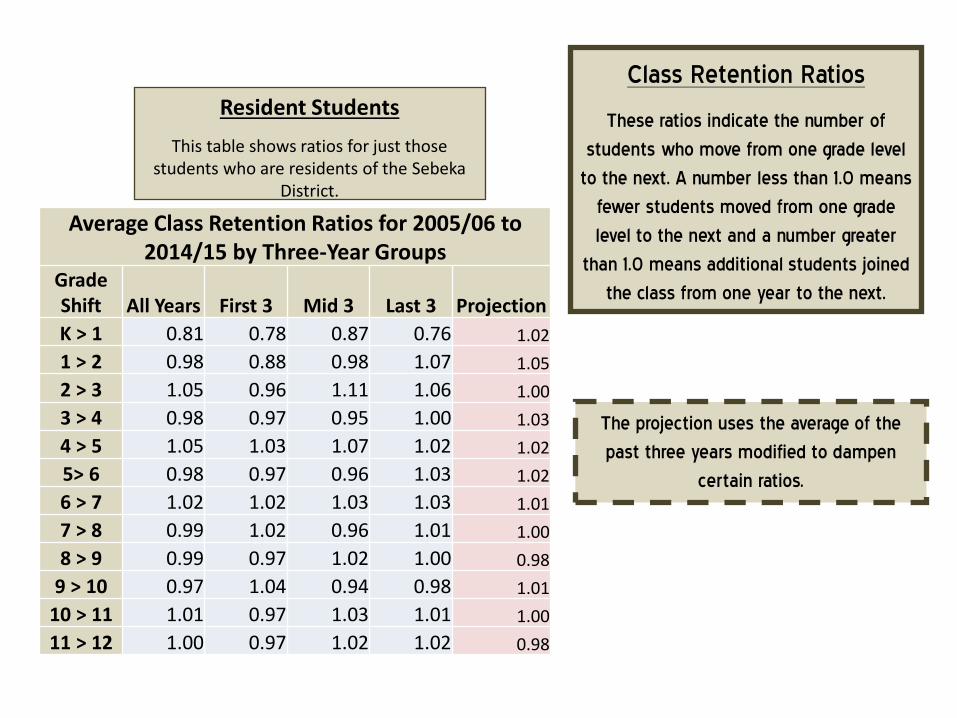
Average Class Retention Ratios for 2005/06 to 2014/15 by Three-Year Groups
Grade Shift All Years First 3 Mid 3 Last 3 Projection
K > 1 0.81 0.78 0.87 0.76 1.02
1 > 2 0.98 0.88 0.98 1.07 1.05
2 > 3 1.05 0.96 1.11 1.06 1.00
3 > 4 0.98 0.97 0.95 1.00 1.03
4 > 5 1.05 1.03 1.07 1.02 1.02
5> 6 0.98 0.97 0.96 1.03 1.02
6 > 7 1.02 1.02 1.03 1.03 1.01
7 > 8 0.99 1.02 0.96 1.01 1.00
8 > 9 0.99 0.97 1.02 1.00 0.98
9 > 10 0.97 1.04 0.94 0.98 1.01
10 > 11 1.01 0.97 1.03 1.01 1.00
11 > 12 1.00 0.97 1.02 1.02 0.98
Class Retention Ratios
These ratios indicate the number of
students who move from one grade level
to the next. A number less than 1.0 means
fewer students moved from one grade
level to the next and a number greater
than 1.0 means additional students joined
the class from one year to the next.
The projection uses the average of the
past three years modified to dampen
certain ratios.
Resident Students
This table shows ratios for just those students who are residents of the Sebeka
District.

Slide 7 Notes: Class Retention Rates
Class Retention Ratios are a key component of the enrollment projection. They are the primary factor used to advance students from one grade to the next over the 10-year projection period. Even minor changes, especially in the lower elementary grades, can generate substantive changes in the projection. Recent patterns (separately for Resident and Non-Resident students) are evaluated and then modified when and if appropriate to best approximate the patterns that are expected to occur in the near future. The right-most column in the table shows the ratios used for the projection.
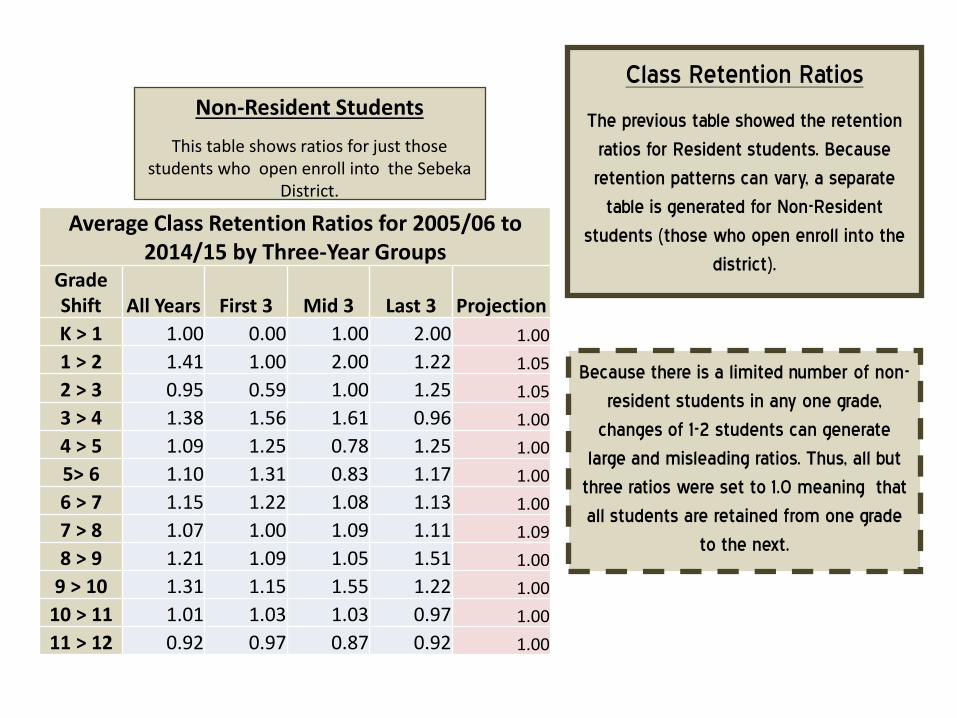
Average Class Retention Ratios for 2005/06 to 2014/15 by Three-Year Groups
Grade Shift All Years First 3 Mid 3 Last 3 Projection
K > 1 1.00 0.00 1.00 2.00 1.00
1 > 2 1.41 1.00 2.00 1.22 1.05
2 > 3 0.95 0.59 1.00 1.25 1.05
3 > 4 1.38 1.56 1.61 0.96 1.00
4 > 5 1.09 1.25 0.78 1.25 1.00
5> 6 1.10 1.31 0.83 1.17 1.00
6 > 7 1.15 1.22 1.08 1.13 1.00
7 > 8 1.07 1.00 1.09 1.11 1.09
8 > 9 1.21 1.09 1.05 1.51 1.00
9 > 10 1.31 1.15 1.55 1.22 1.00
10 > 11 1.01 1.03 1.03 0.97 1.00
11 > 12 0.92 0.97 0.87 0.92 1.00
Class Retention Ratios
The previous table showed the retention
ratios for Resident students. Because
retention patterns can vary, a separate
table is generated for Non-Resident
students (those who open enroll into the
district).
Because there is a limited number of non-
resident students in any one grade,
changes of 1-2 students can generate
large and misleading ratios. Thus, all but
three ratios were set to 1.0 meaning that
all students are retained from one grade
to the next.
Non-Resident Students
This table shows ratios for just those students who open enroll into the Sebeka
District.

Context:
Area Schools
0
200
400
600
800
1,000
1,200
1,400
K-12 Enrollment for Adjoining Districts, 2005/06 - 2014/15
Staples-Motley
Menagha
Wadena-Deer Crk
Pine River-Backus
Frazee-Vergas
New York Mills
Verndale
Sebeka
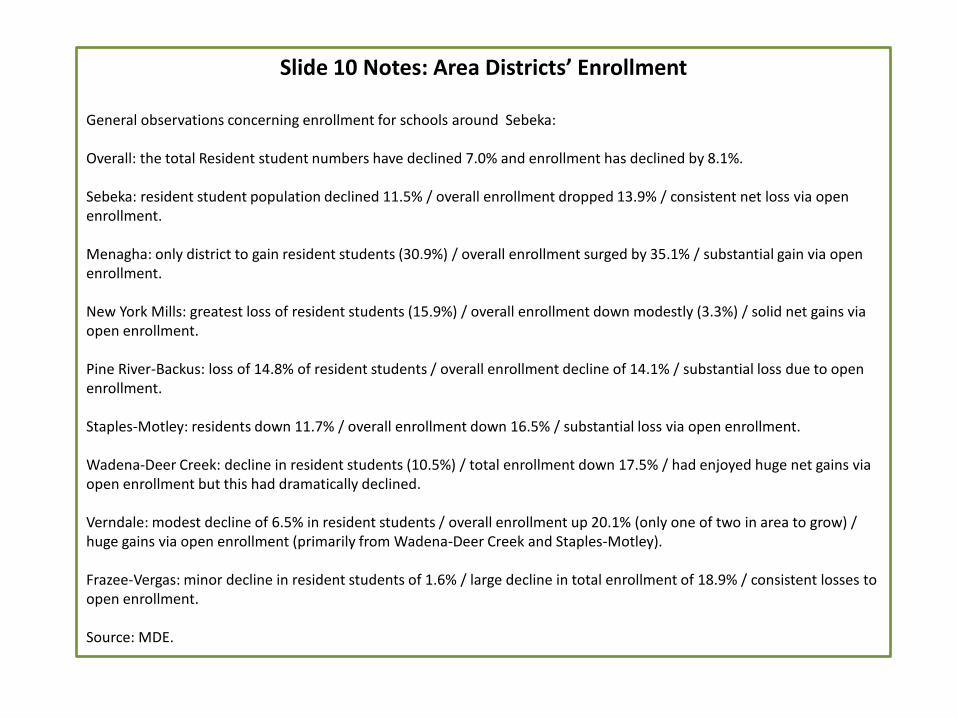
Slide 10 Notes: Area Districts’ Enrollment
General observations concerning enrollment for schools around Sebeka: Overall: the total Resident student numbers have declined 7.0% and enrollment has declined by 8.1%. Sebeka: resident student population declined 11.5% / overall enrollment dropped 13.9% / consistent net loss via open enrollment. Menagha: only district to gain resident students (30.9%) / overall enrollment surged by 35.1% / substantial gain via open enrollment. New York Mills: greatest loss of resident students (15.9%) / overall enrollment down modestly (3.3%) / solid net gains via open enrollment. Pine River-Backus: loss of 14.8% of resident students / overall enrollment decline of 14.1% / substantial loss due to open enrollment. Staples-Motley: residents down 11.7% / overall enrollment down 16.5% / substantial loss via open enrollment. Wadena-Deer Creek: decline in resident students (10.5%) / total enrollment down 17.5% / had enjoyed huge net gains via open enrollment but this had dramatically declined. Verndale: modest decline of 6.5% in resident students / overall enrollment up 20.1% (only one of two in area to grow) / huge gains via open enrollment (primarily from Wadena-Deer Creek and Staples-Motley). Frazee-Vergas: minor decline in resident students of 1.6% / large decline in total enrollment of 18.9% / consistent losses to open enrollment. Source: MDE.

Resident Student Base
These charts show the number of
resident students living within each
district regardless of where they
actually were enrolled. This removes
the distortion caused by open
enrollment and shows the size of the
“pool” of students in each district.
0
200
400
600
800
1,000
1,200
1,400
1,600
1,800
Resident K-12 Students Regardless of Where Enrolled, 2005/06 - 2014/15
Staples-Motley
Wadena-Deer Crk
Frazee-Vergas
Pine River-Backus
Menagha
New York Mills
Sebeka
Verndale

Slide 12 Notes: Resident Student Population
As noted, these charts presents the pool of resident K-12 students living within each of the area districts regardless of where they actually attend school. Every district except Menagha lost resident students over the 10-year period. Menagha’s resident pool grew by 31%. Sebeka’s resident student population declined from 575 to 508 (-11.5%). Source: MDE.

-100
-50
0
50
100
150
Sebeka Open Enrollment, 2006/07-2014/15
In
Out
Net
Open Enrollment
Open Enrollment Exchange Summary Average of Past Three Years
District In Out Net Verndale 11 19 -8 New York Mills 4 12 -8
Menagha 14 43 -29 Wadena-Deer Creek 25 15 10 Pine River-Backus 5 1 4
Frazee-Vergas 0 0 0 Staples-Motley 7 3 4
Freshwater Ed District 0 17 -17 All Other Districts 4 6 -2 Charters 0 2 -2
Total 70 118 -48

Slide 14 Notes: Open Enrollment
Over a third of students who open enroll out of the district attend the Freshwater Education District of which Sebeka is a member. This situation should not be considered losses due to “competition” with another district. Menagha attracts the largest number of Sebeka students. However, Menagha has instituted an enrollment cap beginning with the 2015/16 school year which will likely reduce the number of students who will be able to opt for that district. Source: MDE.
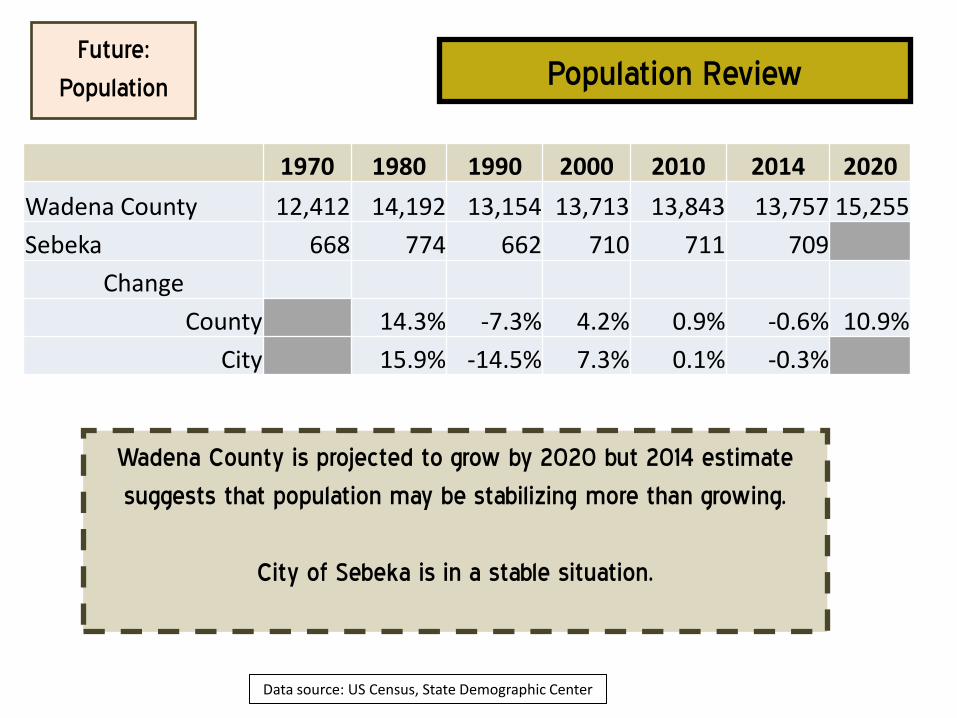
Wadena County is projected to grow by 2020 but 2014 estimate
suggests that population may be stabilizing more than growing.
City of Sebeka is in a stable situation.
Data source: US Census, State Demographic Center
Future:
Population Population Review
1970 1980 1990 2000 2010 2014 2020
Wadena County 12,412 14,192 13,154 13,713 13,843 13,757 15,255
Sebeka 668 774 662 710 711 709
Change
County 14.3% -7.3% 4.2% 0.9% -0.6% 10.9%
City 15.9% -14.5% 7.3% 0.1% -0.3%

Slide 16 Notes: Population Dynamics Data sources: US Census (1970-2010, 2014), State Demographic Center projection. Observations generated through research and interviews with people knowledgeable of economic development in the area: (1) The phrase “Wadena is the poorest county in Minnesota” was offered by several observers. Also, it was noted that the
county has been struggling for some time.
(2) Economic development has been stagnant generally within Wadena County and the county has not been proactive in this regard. This is changing with a new development staff position, more assertive leadership, and initiatives.
(3) Historically, the city of Wadena has been the primary commercial/service center with the other communities being less fully developed.
(4) Sebeka has traditionally been less than aggressive in terms of promoting economic development. However, this has been changing with new leadership.
(5) Agriculture is the economic base for the county as a whole although there is a need to establish value-added agricultural based ventures to augment the commodity side of the sector. Overall manufacturing sector is doing well.
(6) Menagha is viewed as a solid example of what a small rural community should be doing to promote economic development and is showing solid results for its efforts.
(7) Sebeka is starting to move in a positive direction. City driven housing development is making headway although there are still some vacant lots. A new restaurant project has injected vitality into the downtown. National Precision and Engineering is considering an expansion within the near future. The school is seen as an asset for attracting families.

Analyze 2000-2010 trends:
Changes in age groups
Births per year
Key factor is women age 15-44.
Sources: US Census
State Demographic Center projections State Department of Health.
Add in county level projections by
State Demographic Center
Evaluate optional fertility rates
Future:
Estimating Births
and
Kindergarteners

Slide 18 Notes: Estimating Births and Kindergarteners
Estimating future kindergarten enrollment is part science and part art. This slide illustrates the inputs considered in projecting incoming classes. As noted in a previous slide, the Sebeka school district area is expected to stabilize to maybe grow in population over the next decade or more. In the five years of 2000 to 2004 there was average of 164 births per year in Wadena County; this rose to 191 for 2005-2009 and then decreased to 176 during 2010-2014. The respective fertility rates (births / 1000 women ages 15-44) were: 67.7, 78.8 and 83.3. To these are added estimated births to residents living in the Otter Tail County portion of the district. These have averaged 7-8 per year. Data sources: U.S. Census (population), State Demographic Center projections), Minnesota Department of Health (birth statistics).

For the past three years 18.8% of births have
been to residents within the Sebeka district.
This is projected to continue.
Future:
Estimating Births and
Kindergarteners
0
50
100
150
200
250
20
00
20
01
20
02
20
03
20
04
20
05
20
06
20
07
20
08
20
09
20
10
20
11
20
12
20
13
20
14
20
15
20
16
20
17
20
18
20
19
20
20
20
21
20
22
20
23
20
24
20
25
Wadena County Births*
*Includes average of 8 from Otter Tail County.
Projected Births

Slide 20 Notes: Estimating Births and Kindergarteners
Births are projected to average 177 per year through 2019 and then rise to 191 after that. The fertility rate used for the projection is the average for the 2000-2014 period; this allows for including the much higher recent rates but with a modification downward to accommodate the likely tailing off of the period of high fertility rates. Births that have already occurred will impact kindergarten enrollment through the 2019/20 school year. After that the projected births form the basis for enrollment. A portion of the Sebeka district is within Otter Tail County. A proportionate share, based on total population, of births within that county are added to Wadena County figures. Sources: State Department of Health (historic information); Applied Insights North (projected births).

• No change in school district boundary.
• Open enrollment dynamics remain essentially constant except for
Menagha.
• Pattern of recent grade-to-grade succession rates continue with
slight modification to moderate variations due to small enrollment
numbers for non-resident students.
• Area population is expected to stabilize or modestly grow.
• Incoming kindergarten classes reflect district’s current proportion
of births within the county.
Assumptions for Projection

• Menagha has experienced exceptional growth in both its resident
and non-resident student enrollment.
• On average, 43 Sebeka students are enrolled in Menagha while 14
of their students come to Sebeka.
• In response to serious overcrowding and a failed referendum
Menagha has instituted a cap on open enrollment. The actual
impact of this on Sebeka is at best an educated guess.
• This projection assumes: (1) the average number of Sebeka
students enrolling as kindergarteners in Menagha will decrease
from 4 per year to 2; and (2) 9 of the current elementary students
at Menagha will opt to shift back to Sebeka over the next two
years.
The Menagha Factor

Slide 23 Notes: The Menagha Factor
Menagha is truly a confounding factor for this projection. The school is overcrowded now and is expected to remain so for at least five years. Even if the district passed a referendum in 2016 to add classroom space it would take 2-3 years before that space would be operational. As noted, it is being assumed that the cap on open enrollment will remain in force for the foreseeable future. It is assumed this will mean fewer Sebeka students will be able to attend Menagha. What cannot be even guessed at is the possible ripple effect of continued overcrowding at Menagha and the enrollment cap. More Menagha students may opt to attend Sebeka and students from other districts that open enroll into Menagha may decide to attend Sebeka instead. At this time there is no way to put a number on this highly fluid and multi-dimensional situation.

Sebeka PreK-12 Enrollment Projection to 2024/25
Grade 2014/15 2015/16 2016/17 2017/18 2018/19 2019/20 2020/21 2021/22 2022/23 2023/24 2024/25
Pk 37 31 31 32 32 32 31 31 31 31 31
Kg 30 32 31 31 32 32 32 31 31 31 31
1 39 31 34 31 33 33 34 33 33 32 33
2 35 42 34 36 33 35 34 36 34 35 34
3 37 35 43 35 36 33 35 34 36 34 35
4 46 38 37 45 36 37 34 36 35 37 35
5 33 49 41 38 46 37 38 34 37 36 38
6 37 35 50 42 38 47 37 39 35 38 36
7 36 38 35 51 43 39 48 38 40 36 38
8 31 37 38 36 51 43 39 48 39 40 36
9 35 28 37 38 35 50 43 39 47 38 39
10 43 38 28 37 38 35 51 43 39 48 38
11 34 43 38 28 37 38 35 51 43 39 48
12 41 32 42 38 27 36 37 35 50 42 38
Total Pk - 12 514 508 518 518 518 528 528 528 530 517 512
Total Kg - 12 477 478 487 486 486 496 497 497 499 486 480
K-6 257 261 269 259 254 253 244 243 241 243 243
7 - 12 220 217 219 226 232 243 253 254 257 242 238

Slide 25 Notes: Enrollment Projection
Base school year is 2014/15. 2015/16 enrollment is based on district’s current registrations for that year. For resident students the average class retention rates of the past three years are used but modified slightly downward to account for a flattening county population; non-resident student rates are modified to moderate variability due to small enrollment numbers. Open enrollment dynamics remain constant except for Menagha for which the number of kindergarten students has been reduced. Fertility rate in Wadena County is average of past decade; district will average 18.8% of these births (this includes a small number of births in the Otter Tail County portion of the district).

0
100
200
300
400
500
600
Sebeka PreK-12 Projection
Total
Resident
Non-resident

• This is a projection not a prediction. It is built on assumptions regarding
the best understanding of district dynamics such as open enrollment and
future births.
• The projection produces relatively smooth trend lines because it uses
averages and constants. The reality is there will be annual fluctuations
especially in such things as incoming kindergarten classes.
• Do not be concerned when actual numbers vary in a given year from the
projection. Each year:
• Check to see if the TREND and the MAGNITUDE of the projection
align with the unfolding actual numbers. Evaluate deviations to
determine the likely reason. Monitor the Menagha student exchange.
• Monitor annual births (state health department data) to see if there
are significant deviations from what is assumed in the projection.
Using the Projection

Highlights • Enrollment should remain relatively steady. This is consistent
with a county population anticipated to be steady to modestly growing.
• Sebeka area is positioning itself for more assertive economic development activity.
• Schools around Sebeka are expected to stabilize or continue moderated downward trends in enrollment.
• Menagha is a wildcard factor, but the situation there should result in some amount of increased enrollment for Sebeka.
Sebeka
Student Enrollment Projection
to 2024/25