claims experience projection cy2016 – cy2019 · d l @∗ c i) projected membership/enrollment...
TRANSCRIPT

Copyright © 2016 by The Segal Group, Inc. All rights reserved.
State of Wyoming
CLAIMS EXPERIENCE PROJECTION CY2016 – CY2019
June 20, 2016
Gary L. Petersen, FCA, ASA, MAAA Vice President and Consulting Actuary 602.381.4024 [email protected]

1230 West Washington Street Suite 501 Tempe, AZ 85281-1248 P.O. Box 63610 Phoenix, AZ 85082-3610 T 602.381.4024 www.segalco.com
Benefits, Compensation and HR Consulting. Member of The Segal Group. Offices throughout the United States and Canada
June 20, 2016
Ms. Rory L. Horsley State of Wyoming Department of Administration and Information 2001 Capitol Avenue, Room 106 Cheyenne, WY 82002
Dear Rory:
Enclosed please find a reporting package consisting of the following items:
Historical trends for the State program
Claims projections for current and subsequent three years
Plan incurred but not paid claims liability
The historical trends and claims projections reflect claims and enrollment through April 30, 2016. The claims projections have also been adjusted to reflect a proposed deductible increase to two of the Medical plan options effective January 1, 2017.
This reporting package should be transmitted and considered only in its entirety. Our analysis is intended to support the rate setting and reserving process for the State of Wyoming group health and welfare programs and should not be relied upon for any other purpose.
To prepare our analysis we relied upon data from several sources, which are detailed in the following description of our methodology. We did not audit this data and our review was limited to determining that it appears to be reasonable and acceptable for estimating claim liabilities and projecting claims expenditures of the State of Wyoming’s benefits program. This report contains claim components only and excludes any non-claim expenditures of the State’s benefits program. We certify to the best of our knowledge, the data, methods, and assumptions used to develop our projections are reasonable and are calculated in accordance with generally accepted and consistently applied actuarial principles.
The projections in this report are estimates of future costs and are based on information available to Segal Consulting at the time the projections were made. Segal Consulting has not audited the information provided. Projections are not a guarantee of future results. Actual experience may differ due to, but not limited to, such variables as changes in the regulatory environment, local

Ms. Rory L. Horsley June 20, 2016 Page 2
market pressure, changes in group demographics, overall inflation rates, and claims volatility, and this difference may be material. The accuracy and reliability of health projections decrease as the projection period increases. Our analysis does not include any projection of changes in the relative size of the State’s membership or the health status of future members.
I meet the Qualification Standards for Actuaries Issuing Statements of Opinion in the United States promulgated by the American Academy of Actuaries and am qualified to render an opinion with regard to health plan projections, valuations, and related items.
If you should have any questions regarding the information contained herein, please feel free to contact me via the telephone numbers and/or e-mail addresses provided below.
Sincerely,
Gary Petersen, FCA, ASA, MAAA Vice President and Consulting Actuary 602-381-4024 [email protected]

i
Ta b l e o f C o n t e n t s
State of Wyoming Actuarial Services July 20, 2016
Projection Methodology and Definitions ................................................................................ 1
Membership/Enrollment .................................................................................................. 1
Projected Claim Expenses ............................................................................................. 1 a) PMPM Incurred Claims (Most recent 12 mos) ..................................................... 1 b) PMPM Incurred Claims (Prior 12 mos benefit adj & trended to current) ............. 1 c) Credibility Factor (Weight to current period) ........................................................ 1 d) Weighted Average Incurred Claim Cost PMPM .................................................. 2 e) Annual Trend ....................................................................................................... 2 f) Midpoint Months .................................................................................................... 2 g) Midpoint Trend Factor .......................................................................................... 2 h) Projected Incurred Claims PMPM ........................................................................ 2 i) Projected Membership/Enrollment ........................................................................ 2 j) Projection Period # of Months ............................................................................... 3 k) Projected Incurred Claims Based on Experience (Current Plan) ........................ 3 l) Proposed Plan Design Changes ........................................................................... 3 m) Total Projected Claim Expenses ......................................................................... 3 n) Total Projected Claim Expenses – 95% Confidence Level ................................. 3 o) Total Projected Claim Expenses – 99% Confidence Level ................................. 3
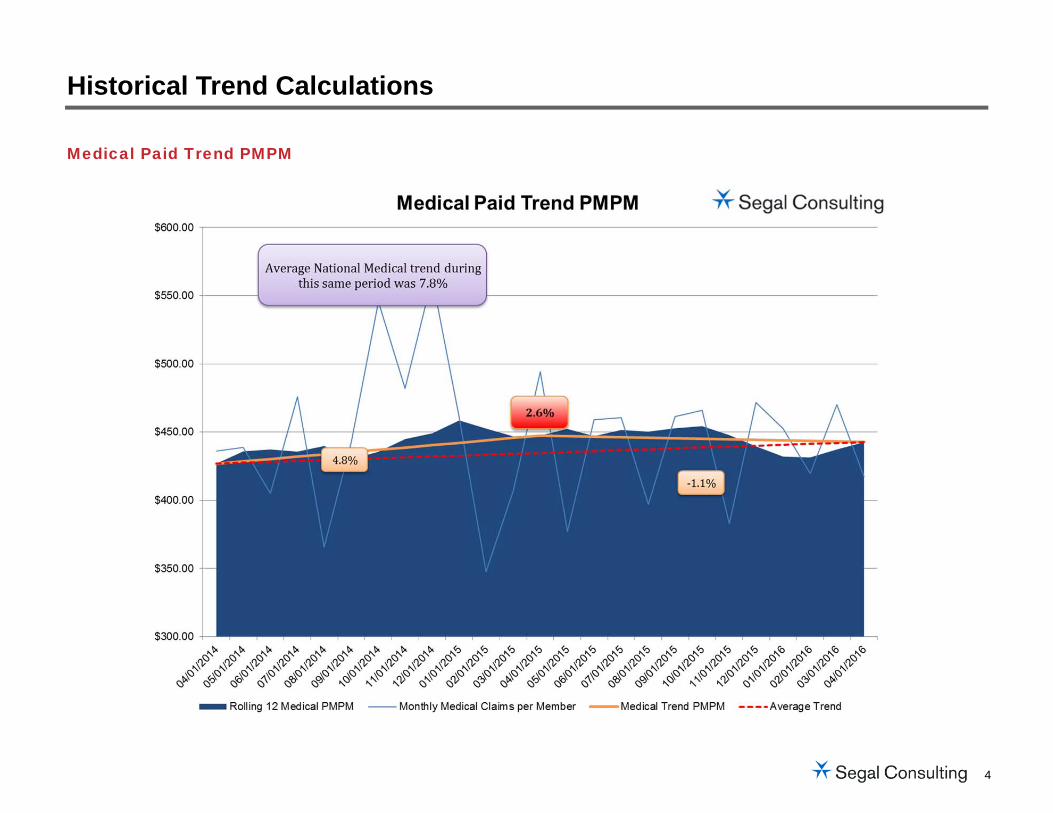
Historical Trend Calculations ................................................................................................ 4
Medical Paid Trend PMPM ............................................................................................. 4
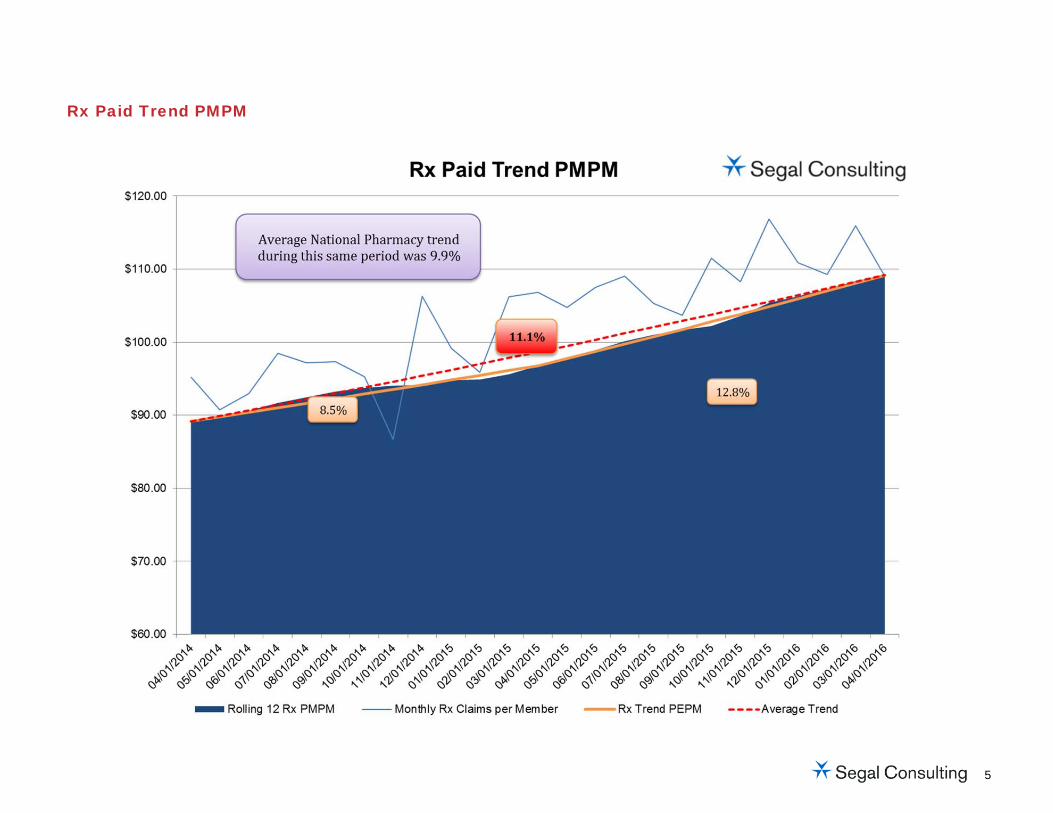
Rx Paid Trend PMPM ..................................................................................................... 5
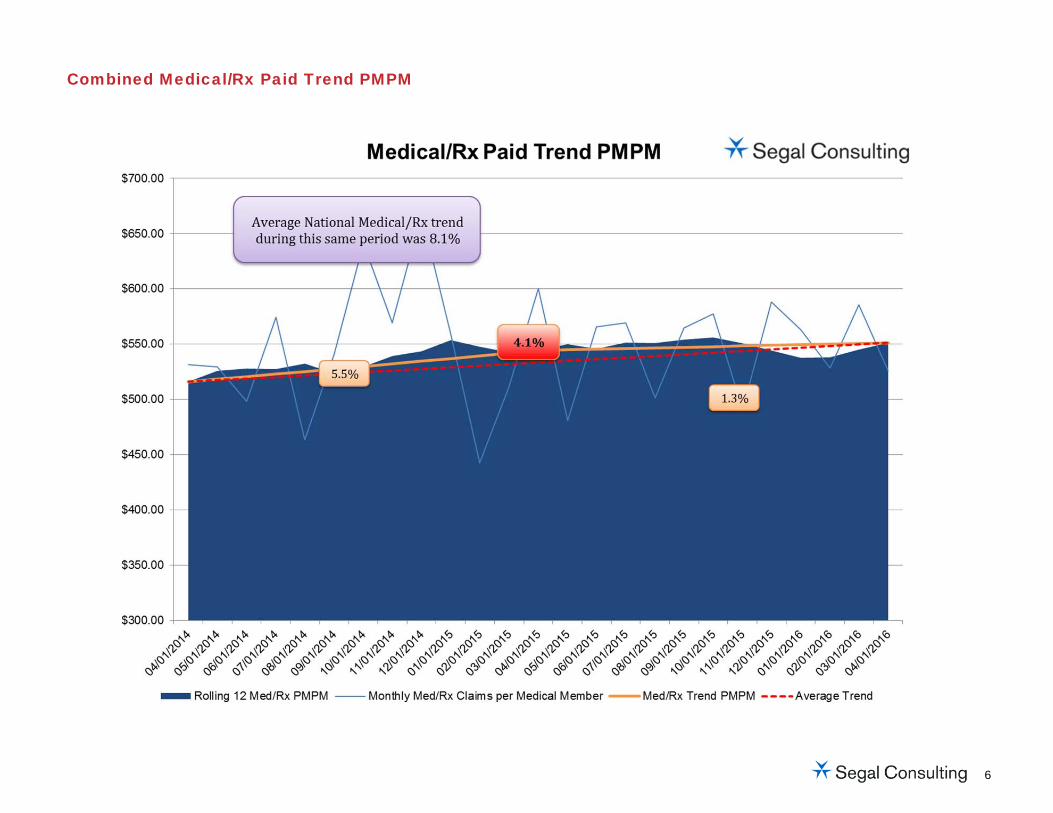
Combined Medical/Rx Paid Trend PMPM ...................................................................... 6
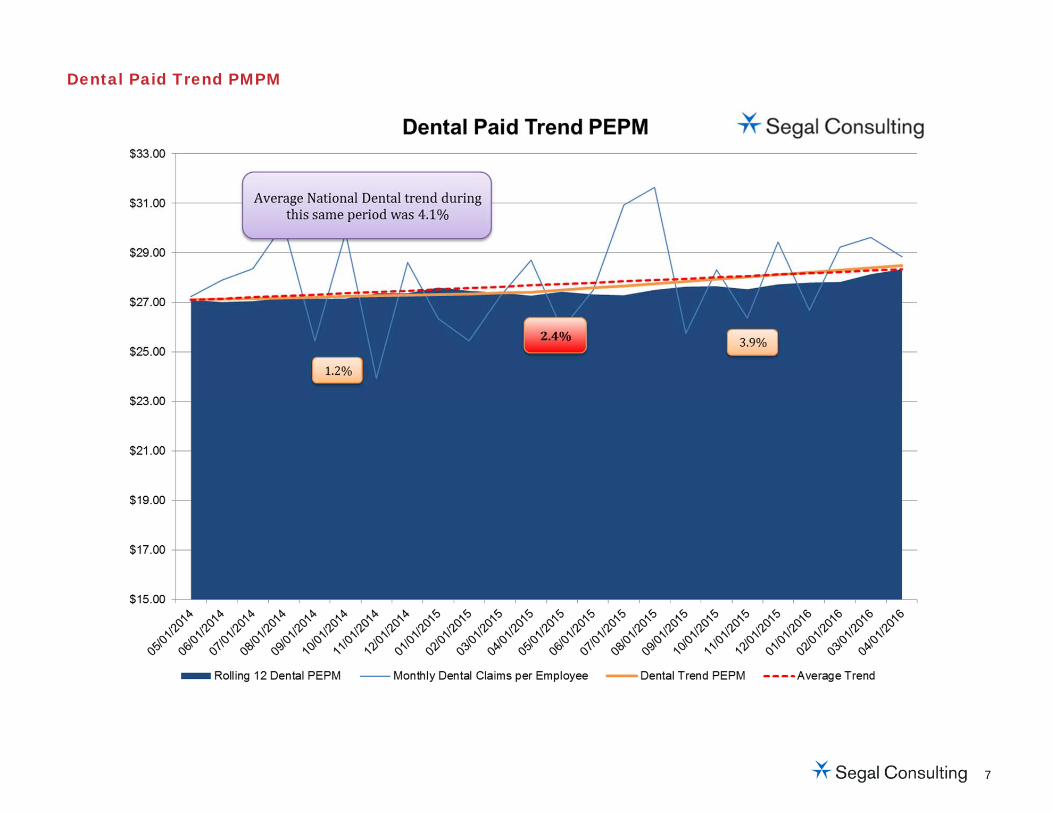
Dental Paid Trend PMPM ............................................................................................... 7
Medical/Rx Assumptions ....................................................................................................... 8
Experience Period .......................................................................................................... 8
Trend Assumption .......................................................................................................... 8
IBNR Reserve Factor (% of 12 month gross paid claims) .............................................. 8
Period Credibility Weighting (to most recent 12 months) ............................................... 8
Historical Plan Changes ................................................................................................. 8
Proposed Plan Changes ................................................................................................. 8
Expected Membership Changes .................................................................................... 8
Medical/Rx Projection ........................................................................................................... 9
For the period January 1, 2016 through December 31, 2016 ........................................ 9
For the period January 1, 2017 through December 31, 2017 ........................................ 9
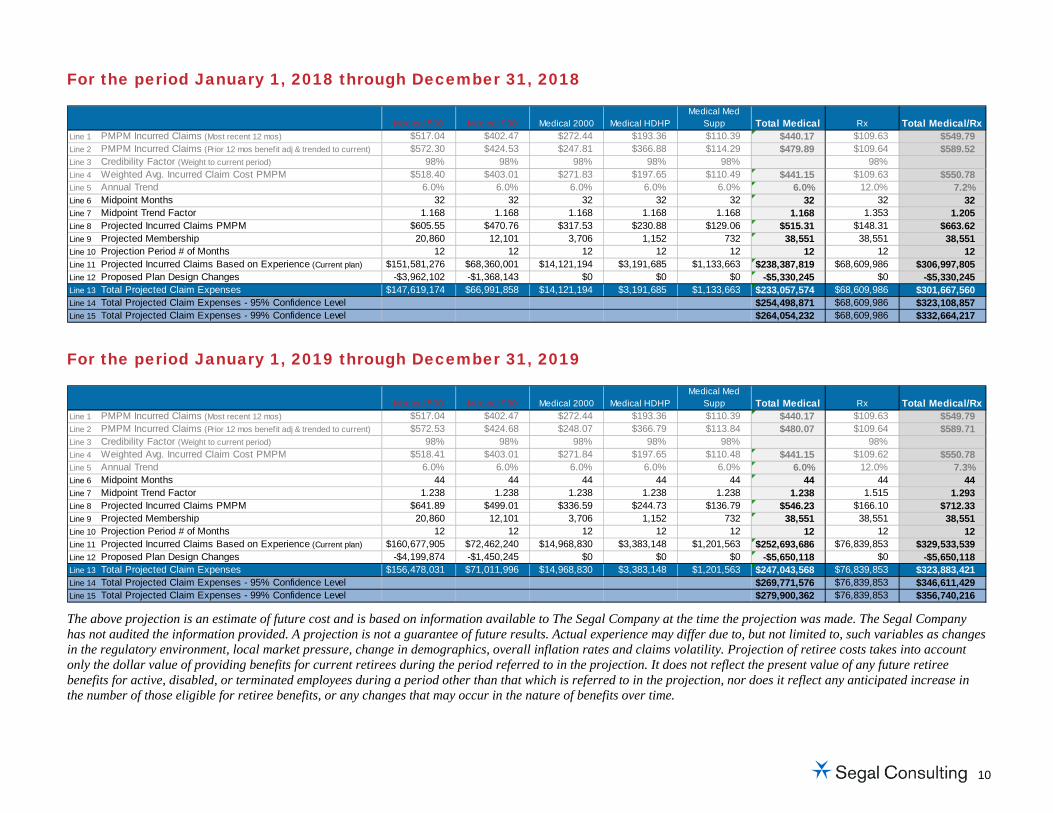
For the period January 1, 2018 through December 31, 2018 ........................................ 10
ii
For the period January 1, 2019 through December 31, 2019 ........................................ 10
Dental Assumptions .............................................................................................................. 11
Experience Period .......................................................................................................... 11
Trend Assumption .......................................................................................................... 11
IBNR Reserve Factor (% of 12 month gross paid claims) .............................................. 11
Period Credibility Weighting (to most recent 12 months) ............................................... 11
Historical Plan Changes ................................................................................................. 11
Proposed Plan Changes ................................................................................................. 11
Expected Membership Changes .................................................................................... 11
Dental Projection ................................................................................................................... 12
For the period January 1, 2016 through December 31, 2016 ........................................ 12
For the period January 1, 2017 through December 31, 2017 ........................................ 12
For the period January 1, 2018 through December 31, 2018 ........................................ 13
For the period January 1, 2019 through December 31, 2019 ........................................ 13
CY2016 – CY2019 Projection Summary ............................................................................... 14
Medical/Rx Projection Summary .................................................................................... 14
Dental Projection Summary ............................................................................................ 14
Estimate of Health IBNR as of December 31, 2015 ............................................................. 15
IBNR Certification Letter ................................................................................................. 15
EXHIBIT I ........................................................................................................................ 17
EXHIBIT II ....................................................................................................................... 18
The Segal IBNR Reserve Model .................................................................................... 20

1
Projection Methodology and Definitions
Membership/Enrollment
Members refers to covered lives (bellybuttons) including spouses and children. Subscribers refers to covered employees (doorbells). For the CY2016-CY2019 Medical/Rx and Dental projections for the State of Wyoming:
Medical membership and enrollment is based on data provided by Cigna Health Insurance through April 2016,
Rx membership is based on data provided by MedImpact through April 2016, and
Dental membership and enrollment is based on data provided by Delta Dental of Wyoming through April 2016.
Projected Claim Expenses
a) PMPM Incurred Claims (Most recent 12 mos)
This item represents our best estimate of the incurred claim cost per member per month during the most recent 12-month experience period. In order to obtain this estimate, we begin by considering the aggregate paid claims during this period, adjusting for the value of any historical plan changes. This number is then adjusted by the estimated change in reserves for claims incurred but not paid to arrive at our estimate of aggregate incurred claims during the period. To provide this on a per member per month basis, we divide by the member months during the incurral period. For the CY2016-CY2019 Medical/Rx and Dental projections for the State of Wyoming, we have assumed that there have been no material plan or network changes during the experience period.
b) PMPM Incurred Claims (Prior 12 mos benefit adj & trended to current)
This item represents our best estimate of the incurred claim cost per member per month during the prior 12 month experience period, trended forward so that the two incurred claim cost estimates may be compared. Following the methodology outlined above, we estimate the incurred claim cost per member per month and then add a trend factor.
c) Credibility Factor (Weight to current period)
In order to estimate incurred claim costs during the two year experience period, we need to calculate a weighted average of the two items above. The weighting is based on the enrollment: a high employee count increases the weight on the most recent period. For the CY2016-CY2019 Medical/Rx projections for the State of Wyoming, the credibility factors were based on total Medical enrollment. For the CY2016-CY2019 Dental projections, we developed separate credibility factors based on enrollment in each Dental plan. The credibility factors used are summarized in the table on the following page:
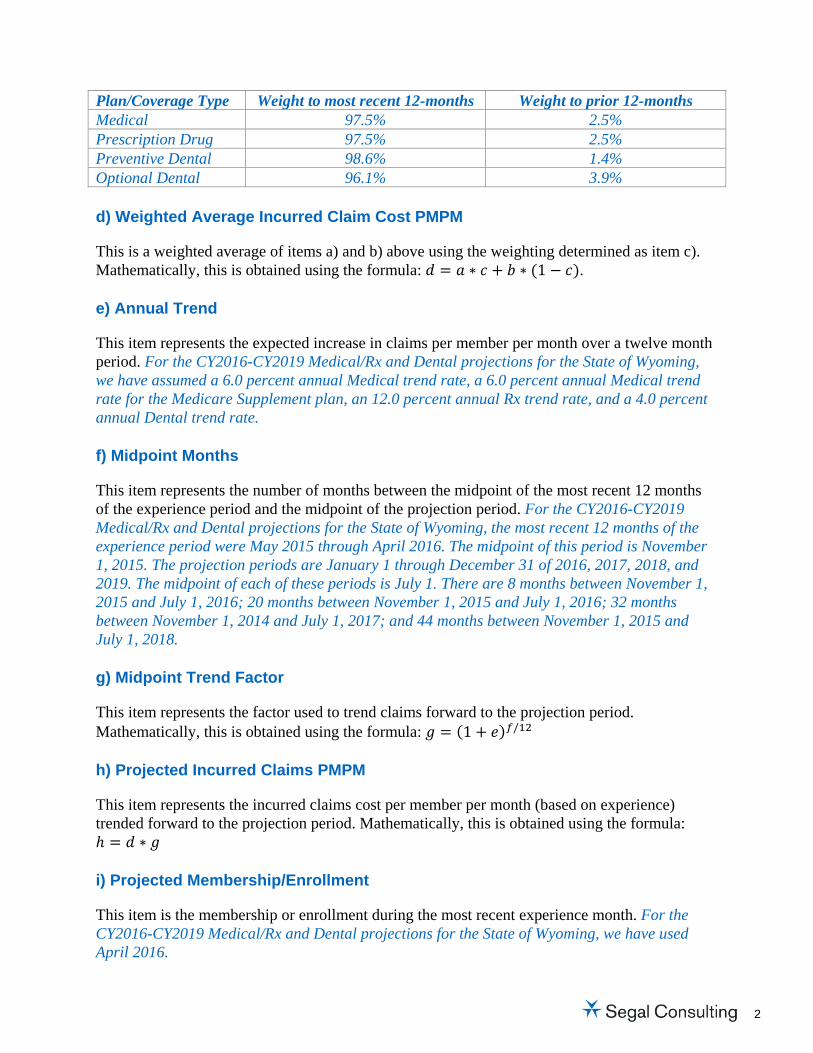
2
Plan/Coverage Type Weight to most recent 12-months Weight to prior 12-months Medical 97.5% 2.5% Prescription Drug 97.5% 2.5% Preventive Dental 98.6% 1.4% Optional Dental 96.1% 3.9%
d) Weighted Average Incurred Claim Cost PMPM
This is a weighted average of items a) and b) above using the weighting determined as item c). Mathematically, this is obtained using the formula: ∗ ∗ 1 .
e) Annual Trend
This item represents the expected increase in claims per member per month over a twelve month period. For the CY2016-CY2019 Medical/Rx and Dental projections for the State of Wyoming, we have assumed a 6.0 percent annual Medical trend rate, a 6.0 percent annual Medical trend rate for the Medicare Supplement plan, an 12.0 percent annual Rx trend rate, and a 4.0 percent annual Dental trend rate.
f) Midpoint Months
This item represents the number of months between the midpoint of the most recent 12 months of the experience period and the midpoint of the projection period. For the CY2016-CY2019 Medical/Rx and Dental projections for the State of Wyoming, the most recent 12 months of the experience period were May 2015 through April 2016. The midpoint of this period is November 1, 2015. The projection periods are January 1 through December 31 of 2016, 2017, 2018, and 2019. The midpoint of each of these periods is July 1. There are 8 months between November 1, 2015 and July 1, 2016; 20 months between November 1, 2015 and July 1, 2016; 32 months between November 1, 2014 and July 1, 2017; and 44 months between November 1, 2015 and July 1, 2018.
g) Midpoint Trend Factor
This item represents the factor used to trend claims forward to the projection period. Mathematically, this is obtained using the formula: 1 /
h) Projected Incurred Claims PMPM
This item represents the incurred claims cost per member per month (based on experience) trended forward to the projection period. Mathematically, this is obtained using the formula:
∗
i) Projected Membership/Enrollment
This item is the membership or enrollment during the most recent experience month. For the CY2016-CY2019 Medical/Rx and Dental projections for the State of Wyoming, we have used April 2016.
3
j) Projection Period # of Months
This item is the duration of the projection period and is typically 12 months. For the CY2016-CY2019 Medical/Rx and Dental projections for the State of Wyoming, the projection period is 12 months.
k) Projected Incurred Claims Based on Experience (Current Plan)
This item represents the estimated incurred claims during the projection period under the current plan design. Mathematically, this is obtained using the formula: ∗ ∗
l) Proposed Plan Design Changes
This item represents the impact of any plan design changes during the projection period and is used to scale the experience projected claims cost (item k) to the proposed new plan design. For the CY2016 Medical and CY2016-CY2019 Rx and Dental projections for the State of Wyoming, there are no proposed plan design changes. The CY2017-CY2019 Medical projections include an assumption that the deductible for both the $350 deductible PPO option and the $750 deductible PPO option will increase by $150 effective January 1, 2017 to a $500 deductible PPO and a $900 deductible PPO, respectively.
m) Total Projected Claim Expenses
This item represents our best estimate of claims that will be incurred during the projection period. This amount incorporates the value of any proposed plan design changes and is provided as an annualized amount. Mathematically, this is obtained using the formula: . Our claim projections exclude explicit margin and any fees for capitated services.
n) Total Projected Claim Expenses – 95% Confidence Level
This item provides a cushion in the case of any atypically large claims in the future that would have been impossible to predict given the claims experience. The confidence level is based on the total number of adult participants in the group as well as the individual stop-loss level, if applicable. The 95% confidence level indicates a statistical probability of 95% that the claims will be less than or equal to the amount shown. For the CY2016-CY2019 Medical projections for the State of Wyoming, there is no stop loss coverage so the confidence level is based only on the total number of adult participants.
o) Total Projected Claim Expenses – 99% Confidence Level
This item provides a cushion in the case of any atypically large claims in the future that would have been impossible to predict given the claims experience. The confidence level is based on the total number of adult participants in the group as well as the individual stop-loss level, if applicable. The 99% confidence level indicates a statistical probability of 99% that the claims will be less than or equal to the amount shown. For the CY2016-CY2019 Medical projections for the State of Wyoming, there is no stop loss coverage so the confidence level is based only on the total number of adult participants.
4
Historical Trend Calculations
Medical Paid Trend PMPM
5
Rx Paid Trend PMPM
6
Combined Medical/Rx Paid Trend PMPM
7
Dental Paid Trend PMPM

8
Medical/Rx Assumptions
Experience Period
The Medical and Rx projections are based on the following two 12-month experience periods:
May 1, 2015 through April 30, 2016
May 1, 2014 through April 30, 2015
Trend Assumption
The Medical projections utilize a 6.0 percent annual trend assumption and the Rx projection utilizes a 12.0 percent annual trend assumption.
IBNR Reserve Factor (% of 12 month gross paid claims)
The IBNR reserve factors utilized in the Medical/Rx projection were based on Segal’s calculation of IBNR claims as of December 31, 2015. For the experience period ending April 30, 2016, a Medical IBNR factor of 12.1 percent was used. For the experience period ending April 30, 2015, a Medical IBNR factor of 10.8 percent was used. This factor was calculated based on actual runout.
For both experience periods, a Rx IBNR factor of 1.9 percent was used. This reflects the assumption that at most one invoice (or 1/52nd of annual claims) would potentially be due and unpaid by the State as of the end of any month.
Period Credibility Weighting (to most recent 12 months)
Credibility factors for Medical and Rx were based on total Medical enrollment. The table below summarizes the credibility factors used:
Plan/Coverage Type Weight to most recent
12-month period Weight to prior 12-month period
Medical/Prescription Drug 97.5% 2.5%
Historical Plan Changes
Based on information from the State of Wyoming, there have been no significant plan changes during the experience period.
Proposed Plan Changes
For the CY2016 Medical and CY2016-CY2019 Rx and Dental projections, there are no proposed plan design changes. The CY2017-CY2019 Medical projections include an assumption that the deductible for both the $350 deductible PPO option and the $750 deductible PPO option will increase by $150 effective January 1, 2017 to a $500 deductible PPO and a $900 deductible PPO, respectively.
Expected Membership Changes
There are no expected membership changes. Projected Rx membership is assumed to be consistent with Medical membership.

9
Medical/Rx Projection
For the period January 1, 2016 through December 31, 2016
For the period January 1, 2017 through December 31, 2017
Medical 350 Medical 750 Medical 2000 Medical HDHPMedical Med
Supp Total Medical Rx Total Medical/RxLine 1 PMPM Incurred Claims (Most recent 12 mos) $517.04 $402.47 $272.44 $193.36 $110.39 $440.17 $109.63 $549.79Line 2 PMPM Incurred Claims (Prior 12 mos benefit adj & trended to current) $572.79 $424.74 $247.78 $366.79 $114.17 $480.21 $109.64 $589.85Line 3 Credibility Factor (Weight to current period) 98% 98% 98% 98% 98% 98%Line 4 Weighted Avg. Incurred Claim Cost PMPM $518.42 $403.02 $271.83 $197.65 $110.48 $441.16 $109.63 $550.78Line 5 Annual Trend 6.0% 6.0% 6.0% 6.0% 6.0% 6.0% 12.0% 7.2%Line 6 Midpoint Months 8 8 8 8 8 8 8 8Line 7 Midpoint Trend Factor 1.040 1.040 1.040 1.040 1.040 1.040 1.078 1.047Line 8 Projected Incurred Claims PMPM $538.95 $418.98 $282.60 $205.48 $114.86 $458.63 $118.23 $576.86Line 9 Projected Membership 20,860 12,101 3,706 1,152 732 38,551 38,551 38,551Line 10 Projection Period # of Months 12 12 12 12 12 12 12 12Line 11 Projected Incurred Claims Based on Experience (Current plan) $134,909,964 $60,840,924 $12,567,787 $2,840,556 $1,008,930 $212,168,161 $54,694,617 $266,862,777Line 12 Proposed Plan Design Changes $0 $0 $0 $0 $0 $0 $0 $0Line 13 Total Projected Claim Expenses $134,909,964 $60,840,924 $12,567,787 $2,840,556 $1,008,930 $212,168,161 $54,694,617 $266,862,777Line 14 Total Projected Claim Expenses - 95% Confidence Level $231,687,632 $54,694,617 $286,382,248Line 15 Total Projected Claim Expenses - 99% Confidence Level $240,386,526 $54,694,617 $295,081,143
Medical 500 Medical 900 Medical 2000 Medical HDHPMedical Med
Supp Total Medical Rx Total Medical/RxLine 1 PMPM Incurred Claims (Most recent 12 mos) $517.04 $402.47 $272.44 $193.36 $110.39 $440.17 $109.63 $549.79Line 2 PMPM Incurred Claims (Prior 12 mos benefit adj & trended to current) $572.53 $424.78 $247.93 $366.83 $114.12 $480.10 $109.64 $589.73Line 3 Credibility Factor (Weight to current period) 98% 98% 98% 98% 98% 98%Line 4 Weighted Avg. Incurred Claim Cost PMPM $518.41 $403.02 $271.84 $197.65 $110.48 $441.15 $109.63 $550.78Line 5 Annual Trend 6.0% 6.0% 6.0% 6.0% 6.0% 6.0% 12.0% 7.2%Line 6 Midpoint Months 20 20 20 20 20 20 20 20Line 7 Midpoint Trend Factor 1.102 1.102 1.102 1.102 1.102 1.102 1.208 1.123Line 8 Projected Incurred Claims PMPM $571.28 $444.12 $299.56 $217.81 $121.75 $486.15 $132.42 $618.57Line 9 Projected Membership 20,860 12,101 3,706 1,152 732 38,551 38,551 38,551Line 10 Projection Period # of Months 12 12 12 12 12 12 12 12Line 11 Projected Incurred Claims Based on Experience (Current plan) $143,002,810 $64,491,553 $13,322,032 $3,011,005 $1,069,452 $224,896,853 $61,259,081 $286,155,934Line 12 Proposed Plan Design Changes -$3,737,874 -$1,290,721 $0 $0 $0 -$5,028,595 $0 -$5,028,595Line 13 Total Projected Claim Expenses $139,264,936 $63,200,833 $13,322,032 $3,011,005 $1,069,452 $219,868,258 $61,259,081 $281,127,339Line 14 Total Projected Claim Expenses - 95% Confidence Level $240,096,138 $61,259,081 $301,355,219Line 15 Total Projected Claim Expenses - 99% Confidence Level $249,110,736 $61,259,081 $310,369,817
10
For the period January 1, 2018 through December 31, 2018
For the period January 1, 2019 through December 31, 2019
The above projection is an estimate of future cost and is based on information available to The Segal Company at the time the projection was made. The Segal Company has not audited the information provided. A projection is not a guarantee of future results. Actual experience may differ due to, but not limited to, such variables as changes in the regulatory environment, local market pressure, change in demographics, overall inflation rates and claims volatility. Projection of retiree costs takes into account only the dollar value of providing benefits for current retirees during the period referred to in the projection. It does not reflect the present value of any future retiree benefits for active, disabled, or terminated employees during a period other than that which is referred to in the projection, nor does it reflect any anticipated increase in the number of those eligible for retiree benefits, or any changes that may occur in the nature of benefits over time.
Medical 500 Medical 900 Medical 2000 Medical HDHPMedical Med
Supp Total Medical Rx Total Medical/RxLine 1 PMPM Incurred Claims (Most recent 12 mos) $517.04 $402.47 $272.44 $193.36 $110.39 $440.17 $109.63 $549.79Line 2 PMPM Incurred Claims (Prior 12 mos benefit adj & trended to current) $572.30 $424.53 $247.81 $366.88 $114.29 $479.89 $109.64 $589.52Line 3 Credibility Factor (Weight to current period) 98% 98% 98% 98% 98% 98%Line 4 Weighted Avg. Incurred Claim Cost PMPM $518.40 $403.01 $271.83 $197.65 $110.49 $441.15 $109.63 $550.78Line 5 Annual Trend 6.0% 6.0% 6.0% 6.0% 6.0% 6.0% 12.0% 7.2%Line 6 Midpoint Months 32 32 32 32 32 32 32 32Line 7 Midpoint Trend Factor 1.168 1.168 1.168 1.168 1.168 1.168 1.353 1.205Line 8 Projected Incurred Claims PMPM $605.55 $470.76 $317.53 $230.88 $129.06 $515.31 $148.31 $663.62Line 9 Projected Membership 20,860 12,101 3,706 1,152 732 38,551 38,551 38,551Line 10 Projection Period # of Months 12 12 12 12 12 12 12 12Line 11 Projected Incurred Claims Based on Experience (Current plan) $151,581,276 $68,360,001 $14,121,194 $3,191,685 $1,133,663 $238,387,819 $68,609,986 $306,997,805Line 12 Proposed Plan Design Changes -$3,962,102 -$1,368,143 $0 $0 $0 -$5,330,245 $0 -$5,330,245Line 13 Total Projected Claim Expenses $147,619,174 $66,991,858 $14,121,194 $3,191,685 $1,133,663 $233,057,574 $68,609,986 $301,667,560Line 14 Total Projected Claim Expenses - 95% Confidence Level $254,498,871 $68,609,986 $323,108,857Line 15 Total Projected Claim Expenses - 99% Confidence Level $264,054,232 $68,609,986 $332,664,217
Medical 500 Medical 900 Medical 2000 Medical HDHPMedical Med
Supp Total Medical Rx Total Medical/RxLine 1 PMPM Incurred Claims (Most recent 12 mos) $517.04 $402.47 $272.44 $193.36 $110.39 $440.17 $109.63 $549.79Line 2 PMPM Incurred Claims (Prior 12 mos benefit adj & trended to current) $572.53 $424.68 $248.07 $366.79 $113.84 $480.07 $109.64 $589.71Line 3 Credibility Factor (Weight to current period) 98% 98% 98% 98% 98% 98%Line 4 Weighted Avg. Incurred Claim Cost PMPM $518.41 $403.01 $271.84 $197.65 $110.48 $441.15 $109.62 $550.78Line 5 Annual Trend 6.0% 6.0% 6.0% 6.0% 6.0% 6.0% 12.0% 7.3%Line 6 Midpoint Months 44 44 44 44 44 44 44 44Line 7 Midpoint Trend Factor 1.238 1.238 1.238 1.238 1.238 1.238 1.515 1.293Line 8 Projected Incurred Claims PMPM $641.89 $499.01 $336.59 $244.73 $136.79 $546.23 $166.10 $712.33Line 9 Projected Membership 20,860 12,101 3,706 1,152 732 38,551 38,551 38,551Line 10 Projection Period # of Months 12 12 12 12 12 12 12 12Line 11 Projected Incurred Claims Based on Experience (Current plan) $160,677,905 $72,462,240 $14,968,830 $3,383,148 $1,201,563 $252,693,686 $76,839,853 $329,533,539Line 12 Proposed Plan Design Changes -$4,199,874 -$1,450,245 $0 $0 $0 -$5,650,118 $0 -$5,650,118Line 13 Total Projected Claim Expenses $156,478,031 $71,011,996 $14,968,830 $3,383,148 $1,201,563 $247,043,568 $76,839,853 $323,883,421Line 14 Total Projected Claim Expenses - 95% Confidence Level $269,771,576 $76,839,853 $346,611,429Line 15 Total Projected Claim Expenses - 99% Confidence Level $279,900,362 $76,839,853 $356,740,216

11
Dental Assumptions
Experience Period
The Dental projections are based on the following two 12-month experience periods:
May 1, 2015 through April 30, 2016
May 1, 2014 through April 30, 2015
Trend Assumption
The Dental projections utilize a 4.0 percent annual trend assumption.
IBNR Reserve Factor (% of 12 month gross paid claims)
The IBNR reserve factors utilized in the Dental projection were based on Segal’s calculation of IBNR claims as of December 31, 2015. For the experience period ending April 30, 2016, a factor 3.6 percent was used. For the experience period ending April 30, 2015, a factor of 3.8 percent was used. This factor was calculated based on actual runout.
Period Credibility Weighting (to most recent 12 months)
Credibility factors were developed separately for each Dental plan. These factors were based on enrollment in each plan. The table below summarizes the credibility factors used:
Plan/Coverage Type Weight to most recent
12-month period Weight to prior 12-month period
Preventive Dental 98.6% 1.4% Optional Dental 96.1% 3.9%
Historical Plan Changes
Based on information from the State of Wyoming, there have been no significant plan changes during the experience period.
Proposed Plan Changes
There are no proposed plan changes.
Expected Membership Changes
There are no expected membership changes.
12
Dental Projection
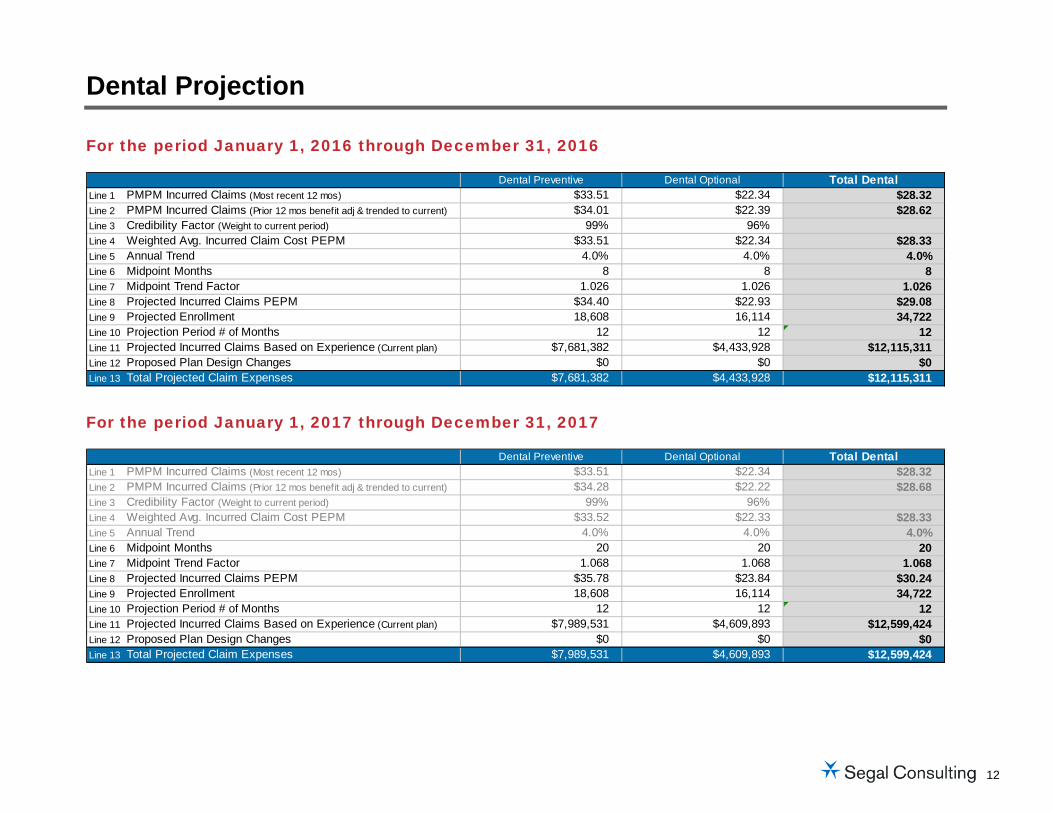
For the period January 1, 2016 through December 31, 2016
For the period January 1, 2017 through December 31, 2017
Dental Preventive Dental Optional Total DentalLine 1 PMPM Incurred Claims (Most recent 12 mos) $33.51 $22.34 $28.32Line 2 PMPM Incurred Claims (Prior 12 mos benefit adj & trended to current) $34.01 $22.39 $28.62Line 3 Credibility Factor (Weight to current period) 99% 96%Line 4 Weighted Avg. Incurred Claim Cost PEPM $33.51 $22.34 $28.33Line 5 Annual Trend 4.0% 4.0% 4.0%Line 6 Midpoint Months 8 8 8Line 7 Midpoint Trend Factor 1.026 1.026 1.026Line 8 Projected Incurred Claims PEPM $34.40 $22.93 $29.08Line 9 Projected Enrollment 18,608 16,114 34,722Line 10 Projection Period # of Months 12 12 12Line 11 Projected Incurred Claims Based on Experience (Current plan) $7,681,382 $4,433,928 $12,115,311Line 12 Proposed Plan Design Changes $0 $0 $0Line 13 Total Projected Claim Expenses $7,681,382 $4,433,928 $12,115,311
Dental Preventive Dental Optional Total DentalLine 1 PMPM Incurred Claims (Most recent 12 mos) $33.51 $22.34 $28.32Line 2 PMPM Incurred Claims (Prior 12 mos benefit adj & trended to current) $34.28 $22.22 $28.68Line 3 Credibility Factor (Weight to current period) 99% 96%Line 4 Weighted Avg. Incurred Claim Cost PEPM $33.52 $22.33 $28.33Line 5 Annual Trend 4.0% 4.0% 4.0%Line 6 Midpoint Months 20 20 20Line 7 Midpoint Trend Factor 1.068 1.068 1.068Line 8 Projected Incurred Claims PEPM $35.78 $23.84 $30.24Line 9 Projected Enrollment 18,608 16,114 34,722Line 10 Projection Period # of Months 12 12 12Line 11 Projected Incurred Claims Based on Experience (Current plan) $7,989,531 $4,609,893 $12,599,424Line 12 Proposed Plan Design Changes $0 $0 $0Line 13 Total Projected Claim Expenses $7,989,531 $4,609,893 $12,599,424
13
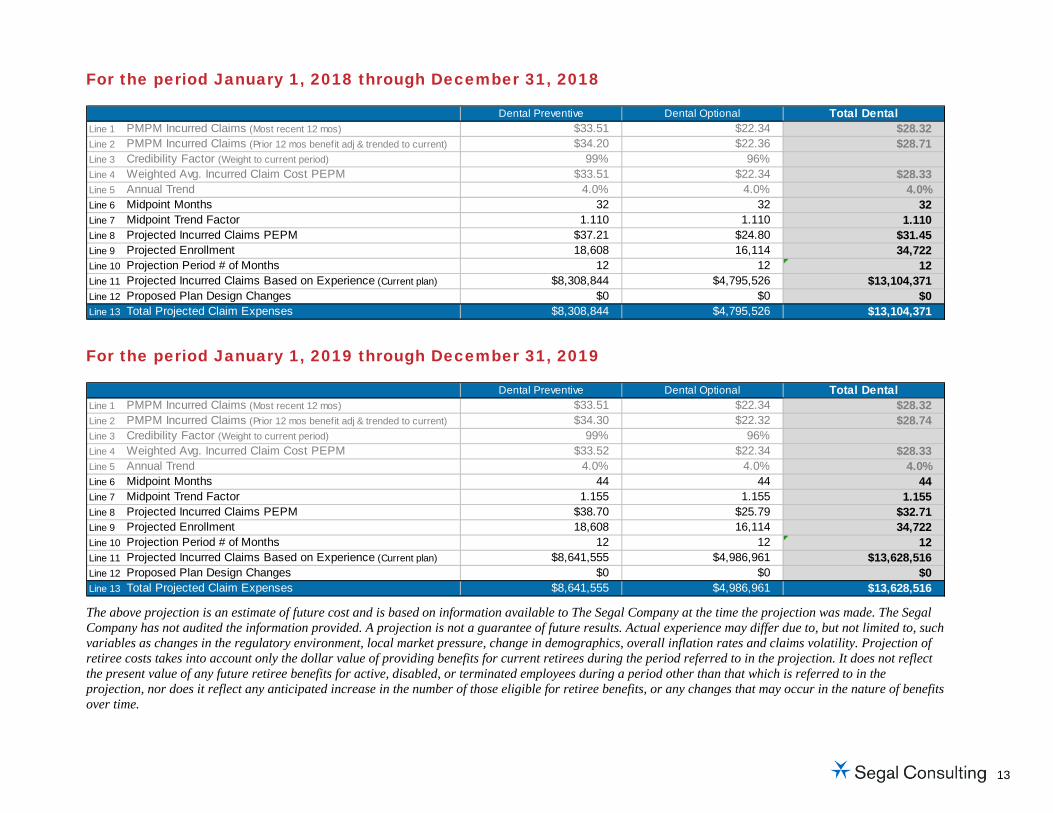
For the period January 1, 2018 through December 31, 2018
For the period January 1, 2019 through December 31, 2019
The above projection is an estimate of future cost and is based on information available to The Segal Company at the time the projection was made. The Segal Company has not audited the information provided. A projection is not a guarantee of future results. Actual experience may differ due to, but not limited to, such variables as changes in the regulatory environment, local market pressure, change in demographics, overall inflation rates and claims volatility. Projection of retiree costs takes into account only the dollar value of providing benefits for current retirees during the period referred to in the projection. It does not reflect the present value of any future retiree benefits for active, disabled, or terminated employees during a period other than that which is referred to in the projection, nor does it reflect any anticipated increase in the number of those eligible for retiree benefits, or any changes that may occur in the nature of benefits over time.
Dental Preventive Dental Optional Total DentalLine 1 PMPM Incurred Claims (Most recent 12 mos) $33.51 $22.34 $28.32Line 2 PMPM Incurred Claims (Prior 12 mos benefit adj & trended to current) $34.20 $22.36 $28.71Line 3 Credibility Factor (Weight to current period) 99% 96%Line 4 Weighted Avg. Incurred Claim Cost PEPM $33.51 $22.34 $28.33Line 5 Annual Trend 4.0% 4.0% 4.0%Line 6 Midpoint Months 32 32 32Line 7 Midpoint Trend Factor 1.110 1.110 1.110Line 8 Projected Incurred Claims PEPM $37.21 $24.80 $31.45Line 9 Projected Enrollment 18,608 16,114 34,722Line 10 Projection Period # of Months 12 12 12Line 11 Projected Incurred Claims Based on Experience (Current plan) $8,308,844 $4,795,526 $13,104,371Line 12 Proposed Plan Design Changes $0 $0 $0Line 13 Total Projected Claim Expenses $8,308,844 $4,795,526 $13,104,371
Dental Preventive Dental Optional Total DentalLine 1 PMPM Incurred Claims (Most recent 12 mos) $33.51 $22.34 $28.32Line 2 PMPM Incurred Claims (Prior 12 mos benefit adj & trended to current) $34.30 $22.32 $28.74Line 3 Credibility Factor (Weight to current period) 99% 96%Line 4 Weighted Avg. Incurred Claim Cost PEPM $33.52 $22.34 $28.33Line 5 Annual Trend 4.0% 4.0% 4.0%Line 6 Midpoint Months 44 44 44Line 7 Midpoint Trend Factor 1.155 1.155 1.155Line 8 Projected Incurred Claims PEPM $38.70 $25.79 $32.71Line 9 Projected Enrollment 18,608 16,114 34,722Line 10 Projection Period # of Months 12 12 12Line 11 Projected Incurred Claims Based on Experience (Current plan) $8,641,555 $4,986,961 $13,628,516Line 12 Proposed Plan Design Changes $0 $0 $0Line 13 Total Projected Claim Expenses $8,641,555 $4,986,961 $13,628,516

14
CY2016 – CY2019 Projection Summary
Medical/Rx Projection Summary
Dental Projection Summary
ProjectedEmployees PEPM Annual PEPM Annual PEPM Annual PEPM Annual
Medical 350* 8,519 $1,319.70 $134,909,964 $1,362.30 $139,264,936 $1,444.02 $147,619,174 $1,530.68 $156,478,031
Medical 750** 5,990 $846.42 $60,840,924 $879.25 $63,200,833 $932.00 $66,991,858 $987.92 $71,011,996
Medical 2000 1,820 $575.45 $12,567,787 $609.98 $13,322,032 $646.57 $14,121,194 $685.39 $14,968,830
Medical HDHP 597 $396.50 $2,840,556 $420.30 $3,011,005 $445.52 $3,191,685 $472.24 $3,383,148
Medical Med Supp 602 $139.66 $1,008,930 $148.04 $1,069,452 $156.93 $1,133,663 $166.33 $1,201,563
Total Medical 17,528 $1,008.71 $212,168,161 $1,045.32 $219,868,258 $1,108.03 $233,057,574 $1,174.52 $247,043,568
Total Rx 17,528 $260.03 $54,694,617 $291.24 $61,259,081 $326.19 $68,609,986 $365.32 $76,839,853
Total Medical/Rx 17,528 $1,268.75 $266,862,777 $1,336.56 $281,127,339 $1,434.22 $301,667,560 $1,539.84 $323,883,421
$1,361.55 $286,382,248 $1,432.73 $301,355,219 $1,536.16 $323,108,857 $1,647.89 $346,611,429
$1,402.90 $295,081,143 $1,475.59 $310,369,817 $1,581.58 $332,664,217 $1,696.05 $356,740,216*Changes to Medical 500 in 2017 and beyond**Changes to Medical 900 in 2017 and beyond
95% Confidence Level
99% Confidence Level
2016 2017 2018 2019
ProjectedEmployees PEPM Annual PEPM Annual PEPM Annual PEPM Annual
Preventive Dental 18,608 $34.40 $7,681,382 $35.78 $7,989,531 $37.21 $8,308,844 $38.70 $8,641,555
Optional Dental 16,114 $22.93 $4,433,928 $23.84 $4,609,893 $24.80 $4,795,526 $25.79 $4,986,961
Total Dental 18,608 $54.26 $12,115,311 $56.42 $12,599,424 $58.69 $13,104,371 $61.03 $13,628,516
2016 2017 2018 2019

1230 West Washington Street Suite 501 Tempe, AZ 85281-1248 P.O. Box 63610 Phoenix, AZ 85082-3610 T 602.381.4024 www.segalco.com
Benefits,CompensationandHRConsulting.MemberofTheSegalGroup. OfficesthroughouttheUnitedStatesandCanada
Estimate of Health IBNR as of December 31, 2015 IBNR Certification Letter
June 20, 2016 Mr. Ralph Hayes Program Manager Wyoming Department of Administration and Information 2001 Capitol Avenue Cheyenne, WY 82002 Re: Estimate of Health IBNR as of December 31, 2015
Dear Ralph:
Segal Consulting has completed its evaluation of Health Reserves for the State of Wyoming’s self-funded program. The reserve is calculated to estimate the outstanding liability for covered services received prior to January 1, 2016 and paid after December 31, 2015. Our estimate of incurred but not reported (IBNR) claims includes unreported claims, reported but unprocessed claims, and claims processed but unpaid by your administrator.
Our estimate does not include any amounts for accounts payable due to claims paid by the administrator prior to January 1, 2016 that had been recorded as paid on or before December 31, 2015 on the lag report produced by the claims administrator. Furthermore, if your financial statements split out actual amounts known to be paid after December 31, 2015 for services that were incurred prior to January 1, 2016 (that are not otherwise recorded as an account payable) from the unknown amounts, those known amounts should be subtracted from the estimated liability we have provided so that the total amount of known and unknown liability remains equal to our estimate. The total liability is shown numerically in the enclosed Exhibit I and graphically in Exhibits II and III. A description of our standard calculation methodology, which was employed for our Medical and Dental estimates, is also enclosed. Our Pharmacy estimate is based on the assumption that at most one invoice (or 1/52nd of annual claims) would potentially be due and unpaid by the State as of December 31, 2015.
Our Medical estimates rely upon claims paid through April 30, 2016, as furnished by Cigna Insurance. Our Dental estimates rely upon claims paid through April 30, 2016, as furnished by Delta Dental of Wyoming. Our Pharmacy estimate relies upon claims paid through December 31, 2015, as furnished by MedImpact. We did not audit this data and our review was limited to determining that it appears to be reasonable and acceptable for the projection of outstanding liabilities under the plan. We certify to the best of our knowledge, the data, methods, and assumptions used to develop the estimated liability for IBNR claims are reasonable and are calculated in accordance with generally accepted and consistently applied actuarial principles. Although our conclusions are based on assumptions and methods that are

Mr. Ralph Hayes June 20, 2016 Page 2
reasonable for this purpose, actual experience can vary from our estimate, and this difference may be material. This estimate is intended to measure the State of Wyoming’s liability for unpaid claims as of December 31, 2015 and it should not be relied upon for any other purpose.
I am a Fellow of the Conference of Consulting Actuaries, an Associate of the Society of Actuaries, and a Member of the American Academy of Actuaries. I meet the Qualification Standards for Actuaries Issuing Statements of Opinion in the United States promulgated by the American Academy of Actuaries and am qualified to render an opinion with regard to loss reserves, actuarial liabilities, and related items.
Sincerely,
Gary Petersen, FCA, ASA, MAAA
Vice President and Consulting Actuary
Enclosure
cc:
5437056v1/02252.003

EXHIBIT I STATE OF WYOMING
Coverage
% of Prior 12 Months Paid
Claims* IBNR Reserve as of December 31, 2015
95% Confidence
Level
99% Confidence
Level
Change from December 31,
2014
Medical 14.4% $28,204,000 $29,613,000 $30,055,000 20.1%
Dental 3.5% $405,000 $412,000 $415,000 27.7%
Pharmacy 1.9% $922,000 $922,000 $922,000 12.9%
Total IBNR
11.6% $29,531,000 $30,948,000 $31,392,000 19.9%
* Percentages displayed reflect unrounded IBNR estimate as a percentage of claims paid during the twelve months ending December 31, 2015, as provided in claim lag reports. Additional components that may be desired:
IBNR Reserve as of December 31, 2015
95% Confidence
Level
99% Confidence
Level
Administration* N/A N/A N/A
Margin on IBNR** $738,000 $774,000 $785,000
Total IBNR with Administration and Margin
$30,270,000 $31,721,000 $32,177,000
Health Average Members (Subscribers, Spouses, and Children)
37,837 37,837 37,837
Average Total per Member $800 $838 $850
* Segal recommends an additional Administration reserve to allow for claims adjustment expenses associated with paying IBNR claims in the event of plan termination.
** 2.5% margin applied to Medical, Prescription Drug, and Dental IBNR.

18
EXHIBIT II STATE OF WYOMING MEDICAL
19
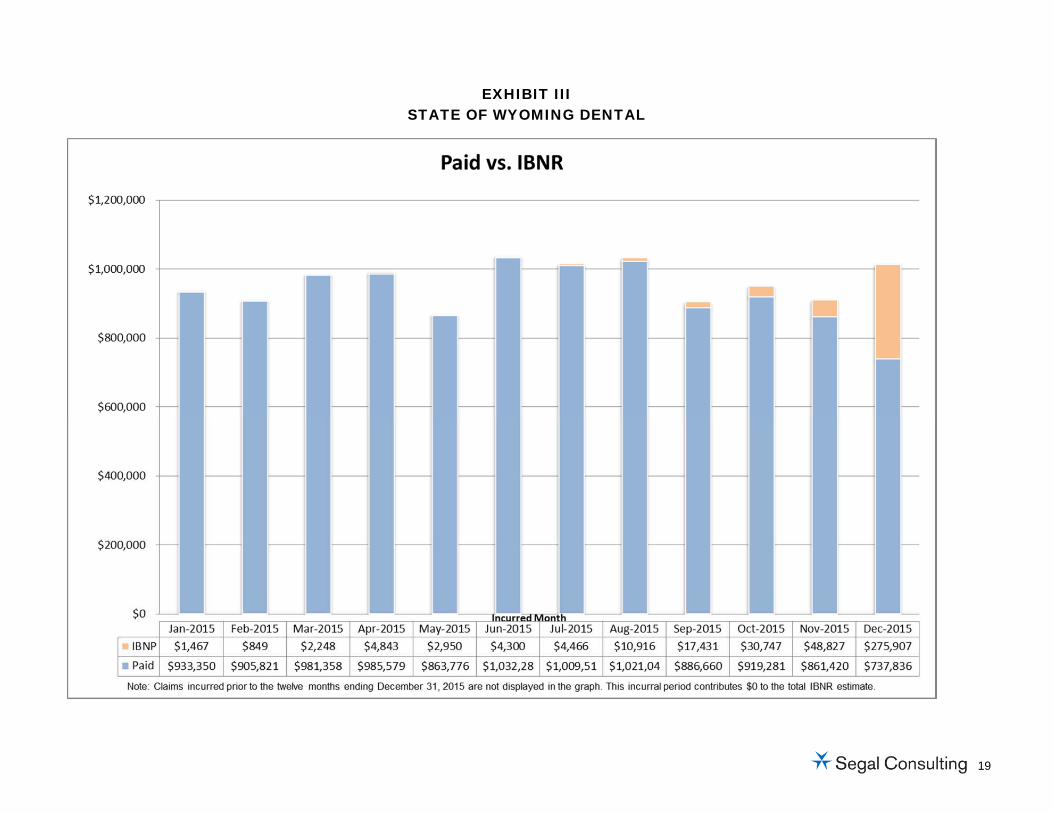
EXHIBIT III STATE OF WYOMING DENTAL
The Segal IBNR Reserve Model
Segal calculates IBNR reserves from prior histories of claim payments by blending completion factors from the Reserve Factor Development Method, with incurred claims developed by the Projection Method.
The Reserve Factor Development Method assumes that the historical runoff patterns remain stable over time. To the extent Segal possesses knowledge of administrative and other issues that may affect the accuracy of this assumption; the Model allows modification of the Completion Factors in accordance with actuarial judgment of the impact of such environmental factors on future runoff patterns. Such environmental factors include changes in claims payment cycles or electronic claim submission rates, plan design, changes in insurance carriers, large dollar shock claims, emerging claim trends and other factors.
The Segal IBNR model utilizes detailed monthly claims data that shows the amount of monthly claim dollars paid in each month of the reserve determination period relative to the month services were incurred. We project total Incurred Claims by month and then subtract known Paid Claim runoff by incurred month to calculate the completion factors for the estimated IBNR reserves. This method results in highly accurate estimates of IBNR reserves in large stable environments. Calculation Scheme Segal blends two very different calculation methods to project monthly incurred claims: 1. Claims Lag Estimate - The first method estimates incurred claims by projecting the monthly
payments for each future paid month for each incurred month. The method used is to estimate, from the claims data, the ratio of claims paid through each duration to claims paid through the prior duration. For example, for the duration 5 ratio, the result would be the assumed ratio of claims paid through duration 5 divided by claims paid through duration 4. We multiply the relevant average of these durational ratios by the actual claims paid to date in each incurred month to forecast the claims paid in the next month. We accumulate the claims estimated in this manner as the basis to estimate the next successive month’s paid claims, etc.
2. Claims Projection Estimate - The Claim Lag Estimate method is not very accurate for the most
recent incurred months, when very little or no actual claims have been paid to date. Therefore, we use a projection method instead. In this calculation, the incurred claims estimates for prior months that result from the Claims Lag Estimate for the designated period are projected based on trend calculated from the midpoint of the designated period to each incurred month to be estimated using the Claims Projection method. We perform this calculation on a per enrollment basis. We typically recommend the use of the claim projection method for 3 months on medical claims. The number of months used in the projection may be increased or decreased depending on the availability of actual runoff data, the typical lag pattern of the type of benefit being projected (e.g. medical, dental, vision, etc.), and an analysis of the statistical deviation of the underlying lag patterns.