seasonal amino acid profile and nutritional … potentials-composition-k… · seaweed potentials...
TRANSCRIPT
Seaweed potentials – evaluation of year-round biomass composition of
commercial cultivated sugarkelp - results from project KOMBI
Susan L. Holdt, Goncalo.S. Marinho, Irini Angelidaki
DTU Food and DTU Environment
5th Nordic Seaweed Conference- Oct 7-8, Grenaa Denmark

Menu • Experimental setup • Conclusions • Comparisons to other foods and feeds • Protein by season • Amino acid profile/quality • Lipids and fatty acids • Trace metals (good and bad!) • Vitamins • Pigments • Feed evaluation
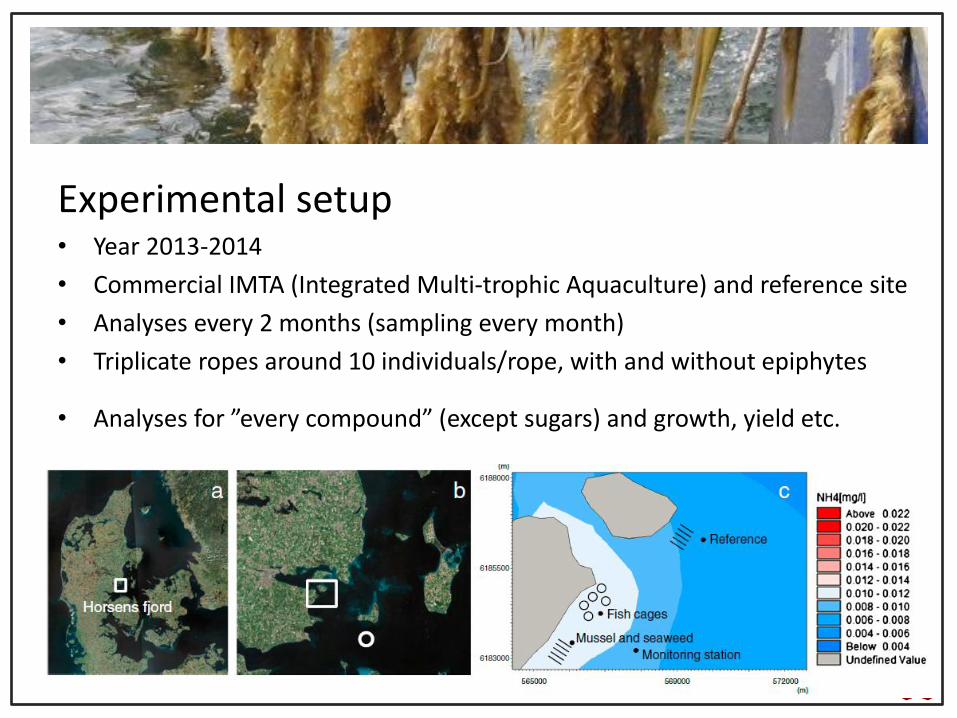
Experimental setup • Year 2013-2014
• Commercial IMTA (Integrated Multi-trophic Aquaculture) and reference site
• Analyses every 2 months (sampling every month)
• Triplicate ropes around 10 individuals/rope, with and without epiphytes
• Analyses for ”every compound” (except sugars) and growth, yield etc.

Conclusions • Biomass available all year • Generally no difference between sites • Seasonal variations during a year -harvest time very important for different applications -seaweed growth cycle (loss of old thalli) -content -epiphytes -value (biofilter or price!) • Large standard deviations especially on biomass with epiphytes • Feed producers may be sceptical going into details! –but all biomass! • Food and feed applications are already proven through other studies!

Sept
Conclusions
• Application and harvest time
May
Saccharina latissima is comparable with wheat as a protein ingredient for fish feed, and appears to be a suitable protein/amino acid source for human consumption. This study proposes that there may be a mismatch between harvest time and nutritional value. The preferable harvest time for S. latissima is November, due to high protein content (and EAA score). However, higher yield and cleaner biomass for human consumption would be found in May. Highest biofilter capacity in September

Conclusions • Application and harvest time
• Low in lipids (max 3.35% of dw) highest in November • Polyunsaturated fatty acids (PUFA’s) made up more than half of the fatty
acids in July. • This including the most appreciated health beneficial PUFA’s, EPA
and DHA
• Season of harvest is important for the choice of lipid quantity and quality, but the marine vegetable provide better source of EPA, DHA and long chained-PUFA’s in general compared to traditionally vegetables.
• Compared to fat (salmon) and lean fish (cod) this seaweed species contains higher proportions of ARA and SDA, but lower EPA and DHA.
Conclusions…
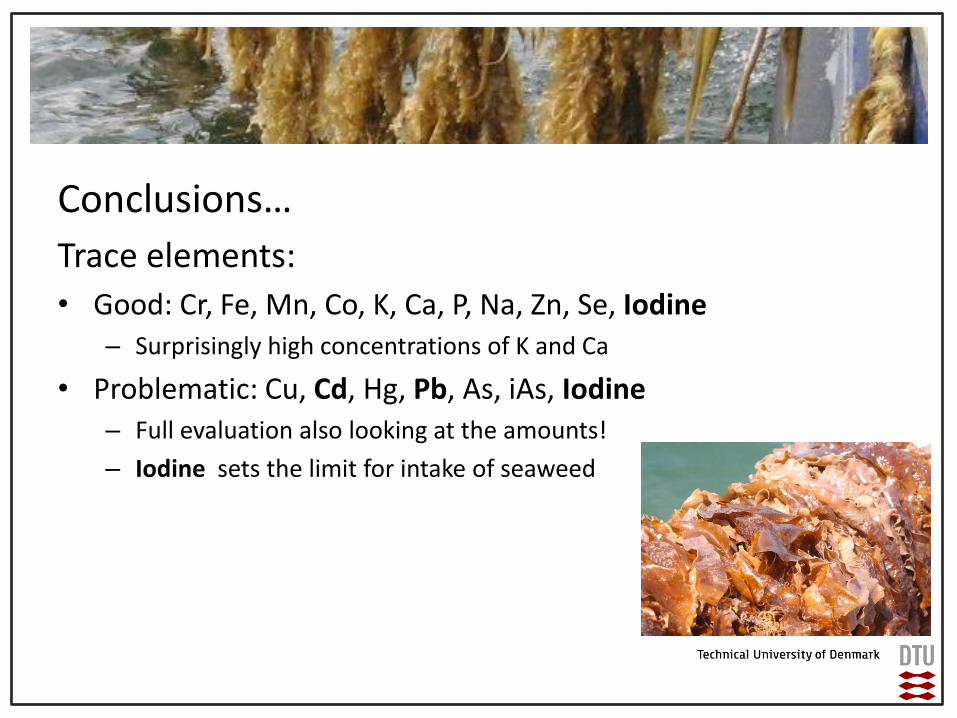
Trace elements:
• Good: Cr, Fe, Mn, Co, K, Ca, P, Na, Zn, Se, Iodine – Surprisingly high concentrations of K and Ca
• Problematic: Cu, Cd, Hg, Pb, As, iAs, Iodine – Full evaluation also looking at the amounts!
– Iodine sets the limit for intake of seaweed

Conclusions…
Vitamins and pigments:
• Vitamin A and E conc. were not higher than good sources from vegetables
• Data on pigments show high conc. of fucoxanthin
• Same pattern in the two locations
• Seasonal changes (no statistics yet!)
• Protein content
0
2
4
6
8
10
12
14
16
18
Pro
tein
(%
DW
)
0
2
4
6
8
10
12
14
16
May July Sept Nov Jan Mar May
a
b
b
b
c d
a
b
b
REF
IMTA
REF incl. epiphytes
IMTA incl. epiphytes
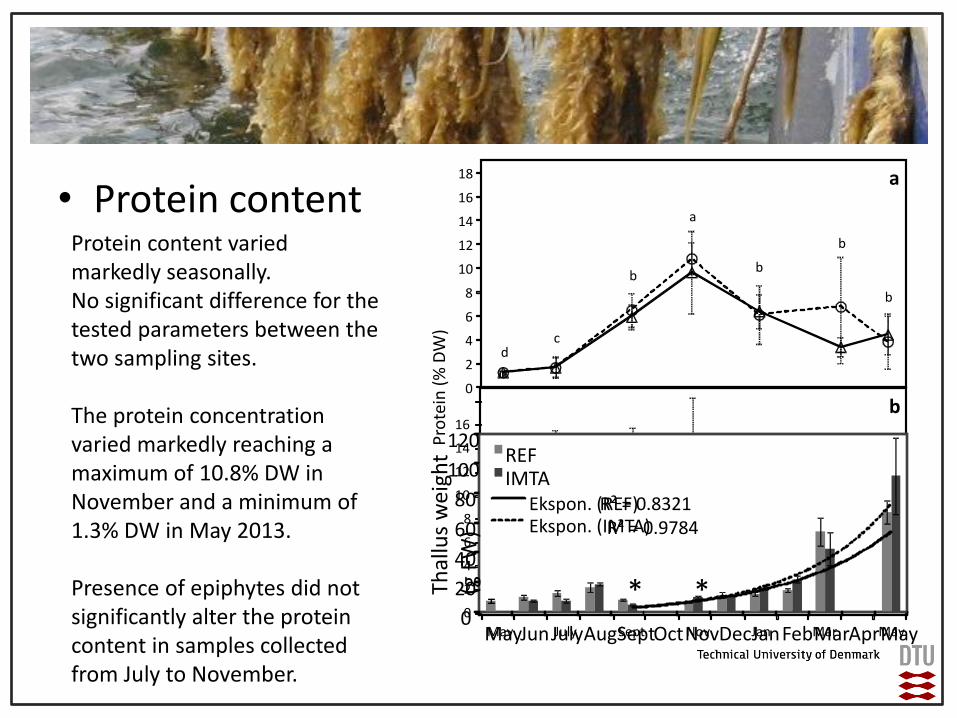
Protein content varied markedly seasonally. No significant difference for the tested parameters between the two sampling sites. The protein concentration varied markedly reaching a maximum of 10.8% DW in November and a minimum of 1.3% DW in May 2013. Presence of epiphytes did not significantly alter the protein content in samples collected from July to November.
0
20
40
60
80
100
120 Th
allu
s w
eigh
t (g
FW
) REF IMTA
May Jun July Aug Sept Nov Dec Jan Feb Mar May Oct Apr
R² = 0.8321
R² = 0.9784
Ekspon. (REF) Ekspon. (IMTA)
* *

• Amino acid profile Table 1 Year-round variation in the amino acid composition (mg amino acid g
-1 protein), total amino acid (% DW), total essential amino acid content, essential amino acid
ratio (EAA/AA) and EAA score of S. latissima cultivated at both reference (REF) and IMTA site.
May Jul Sep Nov Jan Mar May
Patt
ern3 FM4 SM4 WM4
Amino acid INITIAL REF IMTA REF IMTA REF IMTA REF IMTA REF IMTA REF IMTA
LYS1 53.1±0.9
61.8±8.2 58.7±16.1
56.7±8.3 64.6±14.9
65.1±7.3 62.8±1.4
58.4±11.1 53.5±2.4
47.4±8.1 45.9±16.3
52.3±8.9 52.7±14.9 52.0
0 113.1
5 139.5
6 21.68
ALA 155.2±17.5
121.2±31.2 95.7±27.7
141.8±6.9 135.9±8.8
112.9±30.9 120.8±12.3
109.9±31.0 105.2±28.0
197.8±56.9 138.4±17.0
107.0±58.
9 90.6±45.1
ARG2 58.6±2.4
69.4±6.1 66.3±6.1
40.9±17.1 49.9±20.8
80.6±32.3 50.3±18.5
44.0±13.0 32.5±7.2
68.2±16.9 59.5±5.6
71.1±25.9 69.1±36.9 83.45
154.2
2 31.47
CYS1 4.1±0.6
1.0±0.6 1.1±0.3
2.9±0.7 2.9±2.4
n.d n.d
n.d n.d
n.d n.d
n.d n.d
MET1 29.8±5.1
60.4±55.9 39.6±17.5
26.3±9.0 26.7±5.5
24.3±9.2 23.2±0.7
22.9±16.2 26.2±15.7
31.4±13.2 24.3±15.0
44.2±6.1 43.0±19.6 26.0
0 41.02 30.67 13.99
LEU1 102.5±1.2
128.7±35.4 128.1±43.3
82.3±15.0 107.3±36.8
64.2±8.7 66.1±10.4
79.2±6.4 73.3±10.4
53.0±17.7 53.1±37.2
69.1±11.4 59.4±11.8
63.0
0
108.9
1
167.5
6 65.73
TYR1 28.9±1.8
23.6±1.7 22.9±0.5
19.9±1.4 22.4±4.5
20.2±0.2 17.6±2.0
19.7±4.3 21.7±9.0
15.1±3.6 17.2±8.3
25.3±5.8 21.6±2.8
46.0
0 16.97 26.22 8.39
PHE1 112.6±7.3
83.1±11.8 97.3±31.0
54.7±7.4 63.8±17.5
38.3±9.1 38.8±1.3
49.2±3.0 42.0±6.3
33.9±6.7 36.4±14.9
47.2±10.7 44.7±7.3 59.41 111.7
8 44.76
PRO 51.6±3.5
61.3±4.4 51.5±4.6
46.7±2.6 50.7±4.5
47.4±5.0 45.8±10.9
59.1±9.3 65.5±10.2
47.1±10.8 43.7±23.7
42.8±3.9 37.4±6.5
THR1 26.5±2.3
33.7±2.5 38.4±7.7
35.5±3.9 32.9±7.6
33.7±15.8 37.8±2.4
39.3±3.2 25.8±3.6
23.9±4.7 27.0±8.5
41.4±9.7 43.0±13.8 27.0
0 62.23 109.3
3 24.48
ASP 157.5±10.9
121.6±23.4 117.3±19.5
112.0±19.1 117.4±15.9
193.4±36.8 181.5±35.8
182.5±32.1 190.7±49.7
211.2±85.3
270.1±114.
4
205.3±12.
4 174.7±17.4
SER 75.2±2.3
79.5±25.6 68.4±6.3
55.5±8.1 43.6±17.7
54.3±25.6 52.9±19.4
69.7±34.2 125.1±50.6
n.d n.d
73.3±7.1 70.1±8.1
HYP 4.1±0.4
19.1±13.3 8.4±3.5
31.7±11.5 28.3±10.7
18.4±16.5 17.9±8.6
12.0±2.8 8.7±3.7
10.3±2.8 5.8±1.4
n.d n.d
GLU 160.2±36.6
146.9±0.6 190.1±62.9
266.5±33.3 204.2±40.6
233.6±17.2 260.9±93.2
236.1±72.8 213.5±32.3
281.9±64.0
304.4±142.
0
225.3±8.3 299.9±29.5
VAL1 25.1±4.6
57.0±12.7 50.0±4.2
53.6±6.0 57.0±7.7
45.0±19.6 64.2±14.3
52.1±5.4 44.0±4.3
21.7±4.8 22.8±23.7
37.5±8.6 39.5±10.9 42.0
0 76.38 104.8
9 37.06
HIS1 10.5±0.9
9.4±1.3 6.7±2.4
3.0±1.0 8.9±2.9
8.7±5.1 12.4±6.2
8.1±1.0 12.2±7.3
n.d n.d
7.1±3.3 6.2±2.6
18.0
0 35.36 58.67 18.88
TRP1 n.d
n.d n.d
n.d n.d
n.d n.d
n.d n.d
n.d n.d
n.d n.d
ILE1 12.0±0.1
35.9±2.4 38.1±3.3
28.1±4.6 43.2±9.1
30.8±14.7 33.6±2.4
39.5±5.0 28.7±3.1
17.4±5.1 16.6±9.9
28.1±13.2 31.4±10.9
31.0
0 66.48
111.3
3 34.97
GLY 109.4±8.1
119.9±9.3 91.8±7.4
121.1±21.3 118.5±15.7
101.6±36.1 86.1±12.9
91.7±41.6 112.8±44.9
87.5±21.7 77.8±39.4
87.5±37.1 77.4±32.6
? AA (% DW) 1.5±0.2d
2.0±0.9 2.0±1.1c
7.0±1.2 7.6±1.7b
11.3±4.0 12.7±1.6a
7.5±1.6 7.2±2.9b
4.0±1.0 8.0±4.9b
5.2±1.9 4.5±2.7b
? EAA
405.0±20.4b
494.2±40.8 480.7±65.3
a
368.3±13.1
428.6±76.0b
330.4±73.8
356.5±35.1bc
368.5±18.2
327.5±36.9bc
247.5±54.7
248.2±141.
6c
352.1±58.
0
341.5±48.4bc
305.
0
EAA/AA 0.34±0.02b
0.42±0.03 0.41±0.06a
0.31±0.01
0.36±0.07b
0.28±0.06
0.30±0.03bc
0.31±0.01
0.28±0.03bc
0.21±0.05 0.21±0.12c
0.30±0.05
0.29±0.04bc
EAA score
(%) 38.7±0.4
52.0±7.3 37.1±13.3
16.7±5.7 49.5±16.2
48.4±28.4 68.9±34.4
45.0±5.5 67.7±40.8
n.d n.d
39.3±18.6 34.2±14.4
Aspartic and glutamic acids dominated the amino acid profile, accounting for up to 49% of the total. Greatest seasonal differences in amino acid composition occurred in July, with leucine contributing most (22.7-26.7%) of the observed differences.

• Essential amino acid score
0
20
40
60
80
100
120
Esse
nti
al a
min
o a
cid
sco
re (
%)
0
20
40
60
80
100
May July Sept Nov Jan Mar May
b
a
REF
IMTA
REF incl. epiphytes
IMTA incl. epiphytes
A maximal essential amino acid (EAA) score of 68.9% (based on WHO/FAO/UNU requirements) was achieved in November 2013. Without significant difference in none of the sites compared to the other months. The presence of epiphytes in July to November changed neither the amino acid content nor the EAA score. Histidine and isoleucine first limiting EAA’s.
EAA score % =g of first limiting EAA in 100 g of test protein
g of limiting EAA in 100 g of WHO/FAO/UNU reference pattern × 100

• Lipids
0
1
2
3
4
5REF
IMTA
May Jul Sep Nov Jan Mar May
ab
c
aba
bc
d
abc
Lip
ids (
% D
W)
Generally there was no significant difference in the biomass composition between sites. The lipid concentration varied from 0.62-0.88% DW in July to 3.33-3.35% DW in November (P<0.05). The fatty acid composition in January was significantly different from all the other sampling months.
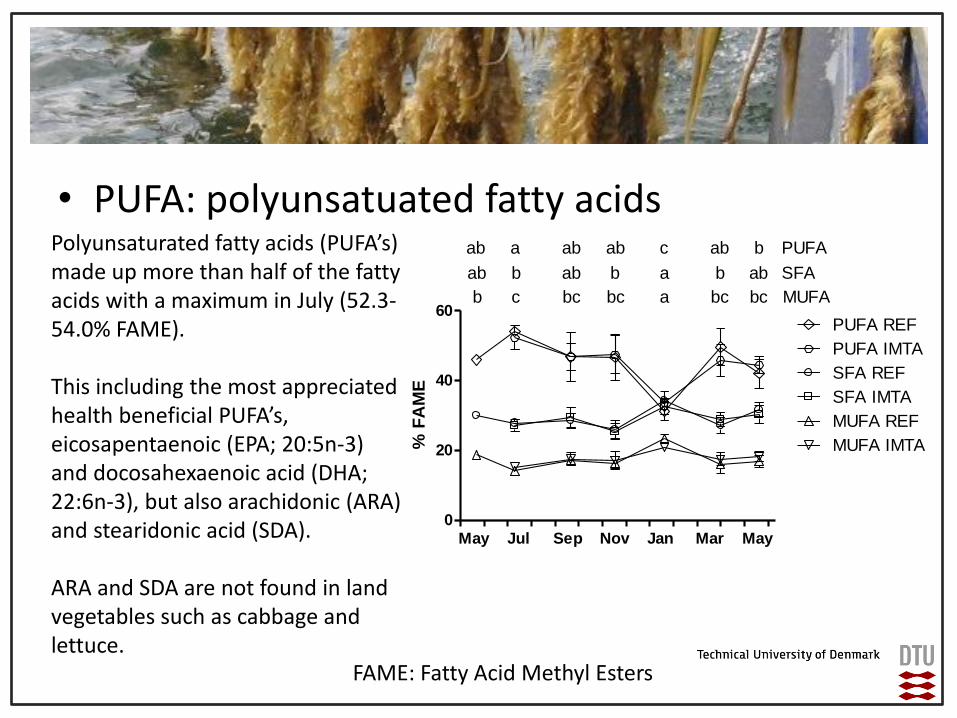
• PUFA: polyunsatuated fatty acids
0
20
40
60
SFA REF
SFA IMTA
MUFA REF
MUFA IMTA
PUFA REF
PUFA IMTA
May Jul Sep Nov Jan Mar May
aab ab ab abc b
b b a bab abab
a bc bcbcbcb c
PUFA
SFA
MUFA
% F
AM
E
Polyunsaturated fatty acids (PUFA’s) made up more than half of the fatty acids with a maximum in July (52.3-54.0% FAME). This including the most appreciated health beneficial PUFA’s, eicosapentaenoic (EPA; 20:5n-3) and docosahexaenoic acid (DHA; 22:6n-3), but also arachidonic (ARA) and stearidonic acid (SDA). ARA and SDA are not found in land vegetables such as cabbage and lettuce.
FAME: Fatty Acid Methyl Esters

Tracemetals- Good….
• Calcium
Ca
0
50
100
150
200
May Jul Sep Nov Jan Mar May
REF
IMTA
g k
g-1
DW
Milk: 122 mg/100 g Cheese: 960 mg/100 g
Source: www.foodcomp.dk

• Potassium (kalium)
K
0
50
100
150
May Jul Sep Nov Jan Mar May
REF
IMTA
g k
g-1
DW
Milk: 153 mg/100 g Cheese: 71 mg/100 g

• Sodium (natrium)
Na
0
10
20
30
40
50
May Jul Sep Nov Jan Mar May
REF
IMTA
g k
g-1
DW
Crisps: 606 mg/100 g Cheese: 723 mg/100 g
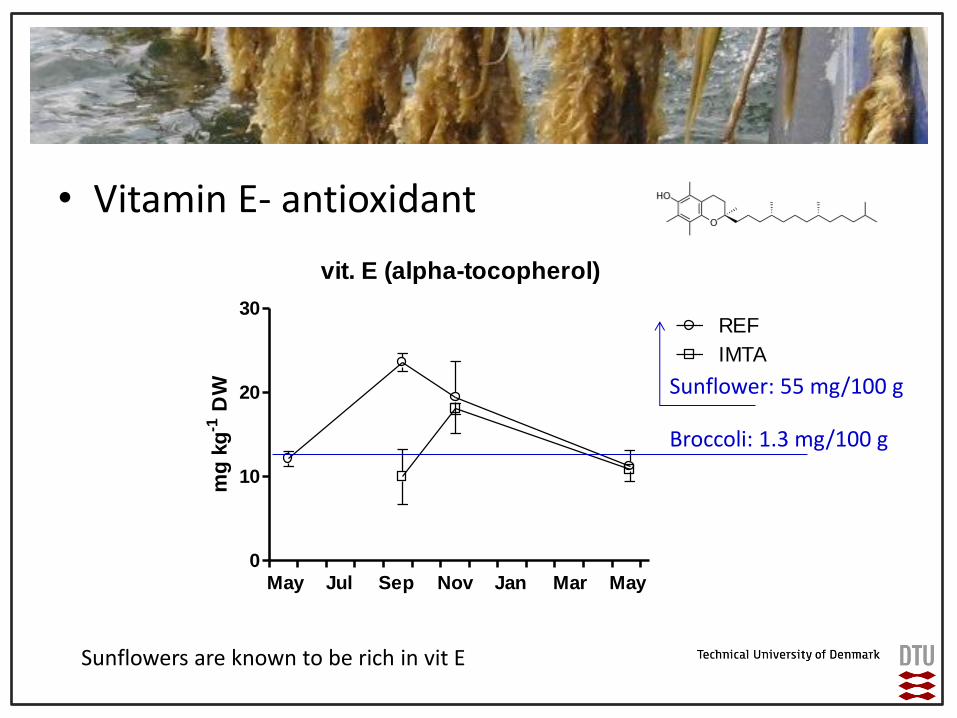
• Vitamin E- antioxidant
Sunflowers are known to be rich in vit E
vit. E (alpha-tocopherol)
0
10
20
30REF
IMTA
May Jul Sep Nov Jan Mar May
mg
kg
-1 D
W
Broccoli: 1.3 mg/100 g
Sunflower: 55 mg/100 g
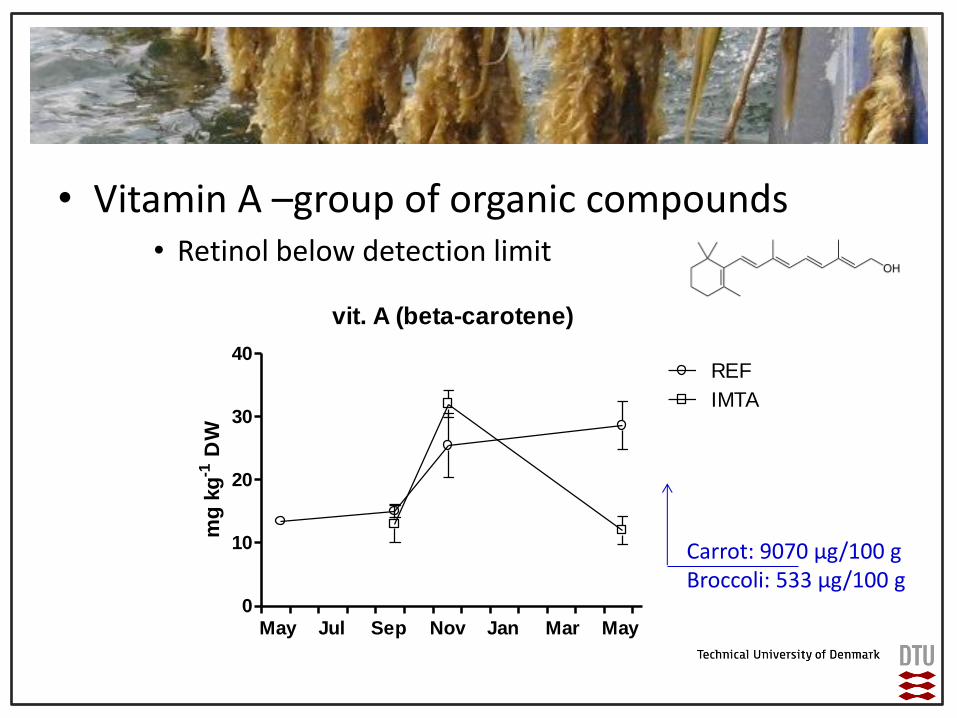
• Vitamin A –group of organic compounds • Retinol below detection limit
vit. A (beta-carotene)
0
10
20
30
40
May Jul Sep Nov Jan Mar May
REF
IMTA
mg
kg
-1 D
W
Carrot: 9070 µg/100 g Broccoli: 533 µg/100 g

• Tracemetals- Problematic…. • Besides essential macro- and microminerals macroalgae also assimilate
heavy metals such as inorganic arsenic, cadmium and mercury, undesirable toxic compounds that constitute a human health safety issue.
• Food (supplement (EU)) treshold values
Table: Overview of EU treshold values for food supplement, and certain national limits for seaweed for food. All values are based on dry weight.
EU legislation only on food supplent level. Food authorities that will make an evaluation if for food.
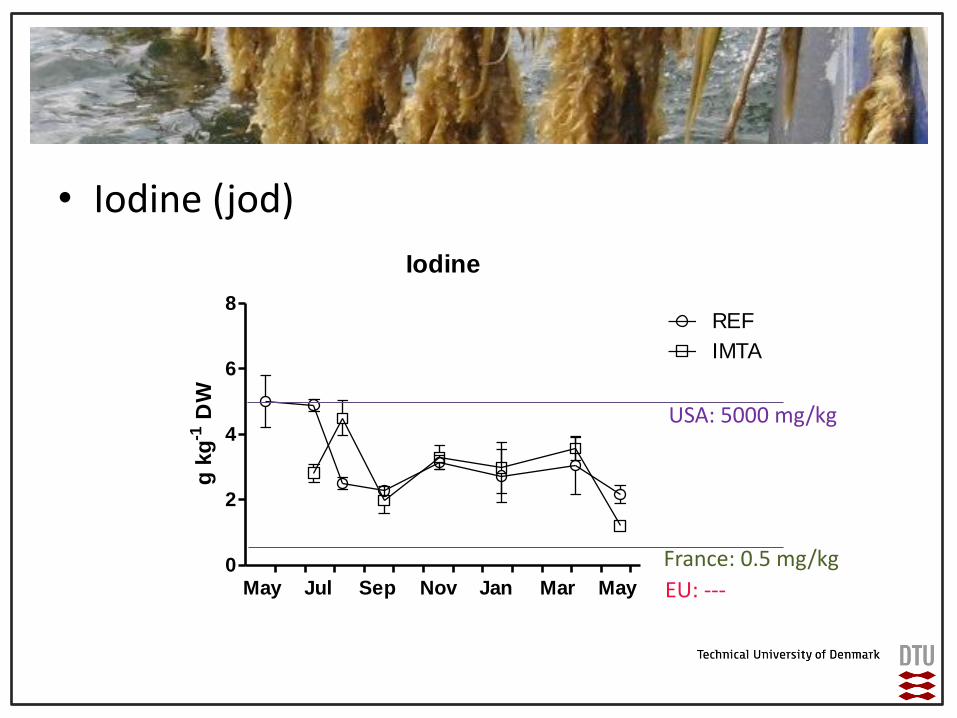
• Iodine (jod)
Iodine
0
2
4
6
8
May Jul Sep Nov Jan Mar May
REF
IMTA
g k
g-1
DW
EU: ---
France: 0.5 mg/kg
USA: 5000 mg/kg

• Inorganic arsenic that is highly problematic
– In the sugarkelp worse case ~1.5 mg/kg
– Below treshold values
As
0
20
40
60
80
May Jul Sep Nov Jan Mar May
REF
IMTA
mg
kg
-1 D
W
USA: 3 mg/kg France: 3 mg/kg
EU: ---
Inorg-As
0.0
0.5
1.0
1.5
2.0
May Jul Sep Nov Jan Mar May
REF
IMTA
mg
kg
-1 D
W
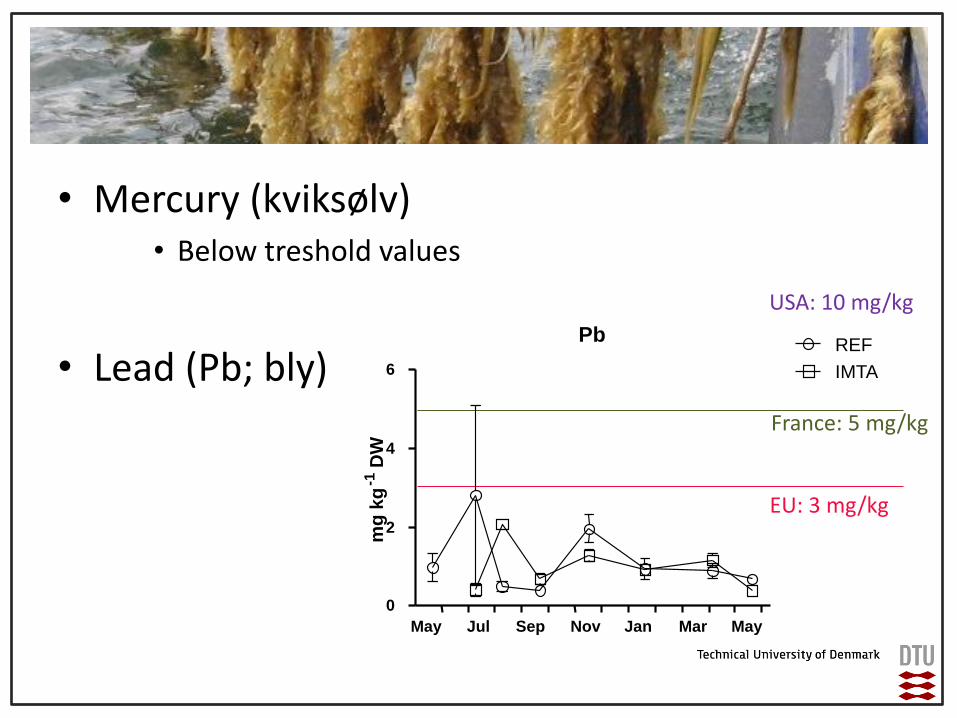
• Mercury (kviksølv) • Below treshold values
• Lead (Pb; bly)
EU: 3 mg/kg
France: 5 mg/kg
USA: 10 mg/kg
May Jul Sep Nov Jan Mar May
Pb
0
2
4
6
REF
IMTA m
g k
g -1
DW

• Cadmium Cd
0.0
0.2
0.4
0.6
0.8
May Jul Sep Nov Jan Mar May
REF
IMTA
mg
kg
-1 D
W
EU: 5 mg/kg
France: 0,3 mg/kg
USA: ---
Cadmium concentration (0.24-0.64 mg kg-1) in August samples was above the limit established in France, but below the EU regulation. However, in order to reach the provisional tolerable weekly intake limit set for cadmium (7 µg kg-1 body weight per week) (JECFA 1996) a person weighing 70 kg would need an intake of 0.77-2.0 kg DW of S. latissima, depending on harvest time.

• Cupper (kobber)
Cu
0
20
40
60
May Jul Sep Nov Jan Mar May
REF
IMTA
mg
kg
-1 D
W
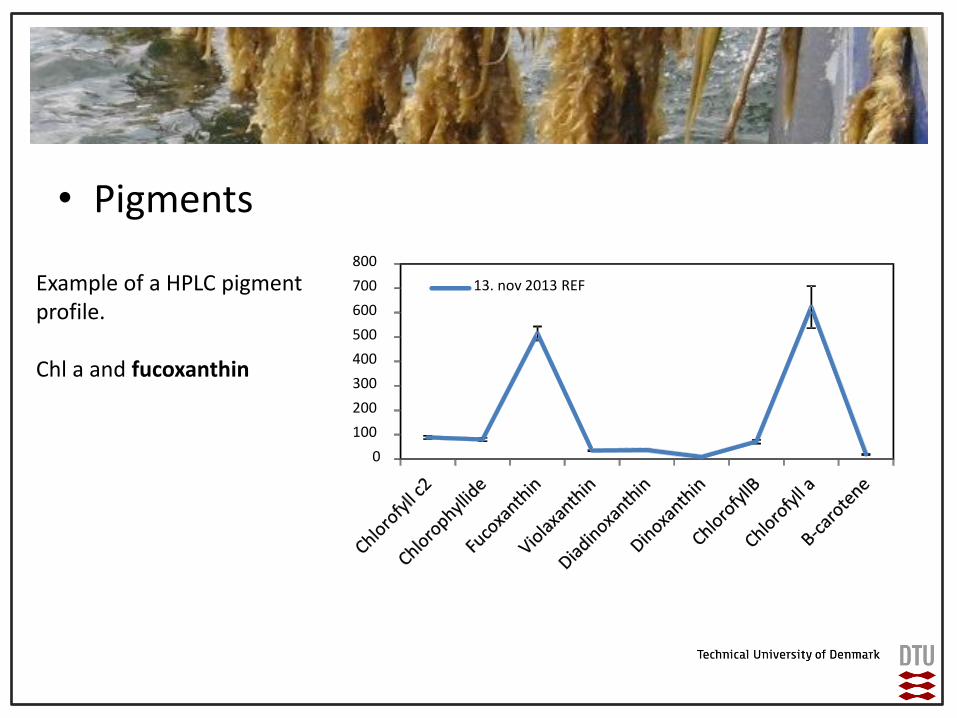
• Pigments
0
100
200
300
400
500
600
700
800
13. nov 2013 REF Example of a HPLC pigment profile. Chl a and fucoxanthin
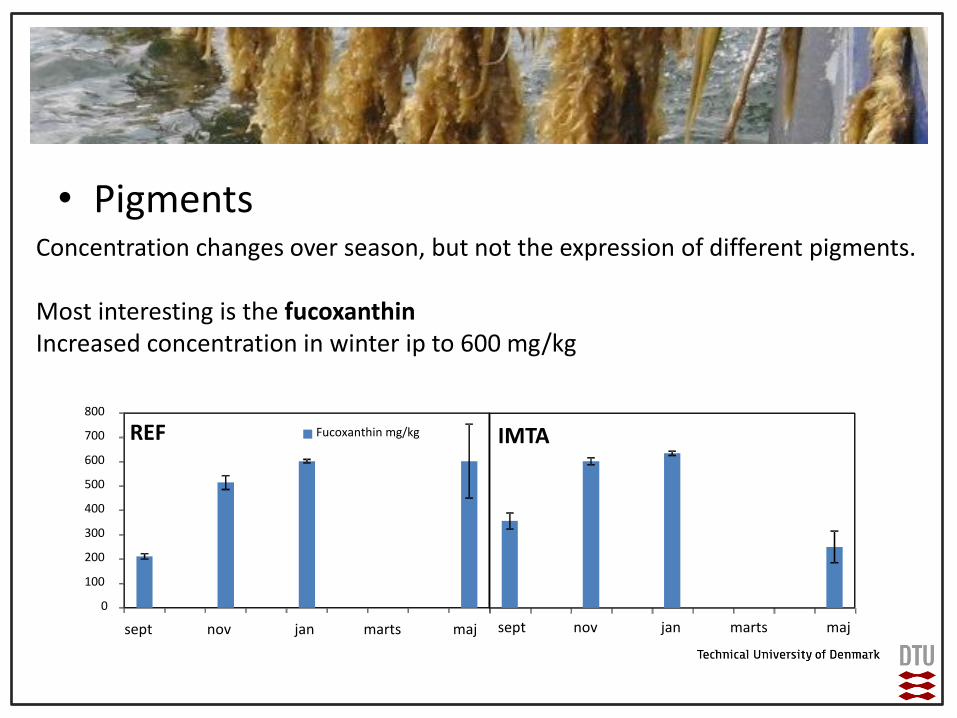
• Pigments
0
100
200
300
400
500
600
700
800
REF Fucoxanthin mg/kg
sept jan nov maj marts
IMTA
sept jan nov maj marts
Concentration changes over season, but not the expression of different pigments. Most interesting is the fucoxanthin Increased concentration in winter ip to 600 mg/kg

Feed producers evaluate by: • Total protein content
– High content for species as salmon (60%) – Low for species such as tilapia, catfish and carps
• Lysine and methionine (histidin). Data not shown here • Sugar species • Heavy metals • Incl. all biomass or extract of the protein or single
compound • Multiple compound’s effects • Stability of biomass they receive
References • www.foodcomp.dk
• More details please read the publications available and upcoming… • Final report (Danish) soon available on www.havbrug.dk Publications: • Gonçalo S. Marinho, Susan L. Holdt, Charlotte Jacobsen and Irini Angelidaki (2015). Lipids and
composition of fatty acids of Saccharina latissima as seasonal marine vegetable. Marine Drugs
• Marinho, G.S., Holdt, S.L., Angelidaki I (2015). Year-round variations in the amino acid profile and protein nutritional value of Saccharina latissima cultivated in a commercial IMTA system. Journal of Applied Phycology DOI: 10.1007/s10811-015-0546-0
• Marinho, G.S., Holdt, S.L., Birkeland, M.J.Angelidaki I (2015). Bioremediation of sugarkelp, Saccharina latissima, cultivated in a commercial off-shore integrated multi-trophic aquaculture (IMTA). Journal of Applied Phycology, DOI: 10.1007/s10811-014-0519-8
Thank you and thanks to: Gonҫalo S. Marinho
GUDP: Project number: 3405-11-0375