search - fisica.unige.itrocca/files pdf articoli/jpc2000francy.pdf · ‡ centro di fisica delle...
TRANSCRIPT

This article has been downloaded from IOPscience.
(http://iopscience.iop.org/0953-8984/12/6/201)
is available
Download details:
IP Address: 130.251.188.1
The article was downloaded on 06/11/2007 at 14:14
Please note that terms and conditions apply.
More related content
HOME | SEARCH | PACS & MSC | JOURNALS | ABOUT | CONTACT US

J. Phys.: Condens. Matter12 (2000) R53–R82. Printed in the UK PII: S0953-8984(00)06108-7
REVIEW ARTICLE
Negative ion resonances of O2 adsorbed on Ag surfaces
R Franchy†+, F Bartolucci†, F Buatier de Mongeot‡, F Cemic‡, M Rocca‡,U Valbusa‡, L Vattuone‡, S Lacombe§, K Jacobi§, K B K Tang‖∗,R E Palmer‖, J Villette¶, D Teillet-Billy¶ and J P Gauyacq¶† Institut fur Grenzflachenforschung und Vakuumphysik des Forschungszentrums Julich,D-52425 Julich, Germany‡ Centro di Fisica delle Superfici e delle Basse Temperature del CNR andIstituto Nazionale per la Fisica della Materia, Dipartimento di Fisica, via Dodecaneso 33,16146 Genova, Italy§ Fritz-Haber-Institut der Max-Planck-Gesellschaft, D-14195 Berlin, Germany‖ Nanoscale Physics Research Laboratory, School of Physics and Astronomy,The University of Birmingham, Edgbaston, Birmingham B15 2TT, UK¶ Laboratoire des Collisions Atomiques et Moleculaires (Unite associee au CNRS 281),Universite Paris-Sud, Batiment 351, 91405 Orsay, France
E-mail: [email protected]
Received 16 July 1999, in final form 26 October 1999
Abstract. This article gathers together a collection of recent experimental studies of theadsorption of oxygen on (001), (110) and (111) crystal surfaces of silver with special emphasison the negative ion states of this model system for oxygen adsorption. These investigationswere performed in a network entitled ‘Negative ion resonances of adsorbed molecules’ supportedfinancially by the European Union within the ‘Human capital and mobility programme’. Thekinetics and thermodynamics of adsorption are investigated by measuring the sticking coefficientand by thermal desorption spectroscopy (TDS). The vibrational spectra provided by high-resolutionelectron energy loss spectroscopy (HREELS) are used to analyse the adsorbed species (physisorbedand chemisorbed) in the case of O2 on Ag(110) and on Ag(111). The mechanisms of inelasticelectron scattering by adsorbed O2 are further investigated with special reference to the negativeion resonances (NIRs), formed by electron capture, which are involved in the electron–moleculecollision process.
1. Introduction
The O2–Ag system has recently developed into a model system for the understanding of theinteraction of a gas-phase molecule with a solid surface. The reasons for this developmentarise from the fact that oxygen chemisorption, in particular, and oxidation reactions in general,are of paramount importance for both fundamental and applied studies [1]. The O2–Ag systemlooks simple enough to provide hope that we can reach a complete description of the adsorptionreaction, yet it is complex enough to allow us to draw general conclusions. Moreover, thissystem is particularly intriguing because of the central, and so far not entirely explained, roleplayed by adsorbed oxygen in the partial oxidation reaction of ethylene to ethylene epoxide[2] for which Ag substrates show a special selectivity. A large number of good papers onthis subject have been published over the last decade dealing in particular with O2 and O on
+ Corresponding author.∗ Current address: Edwards High Vacuum International, Manor Royal, Crawley, West Sussex RH10 2LW, UK.
0953-8984/00/060053+30$30.00 © 2000 IOP Publishing Ltd R53

R54 R Franchy et al
Ag(110) (see e.g. [3–24]). The other low-Miller-index surfaces have attracted somewhat lessattention because of their lower reactivity (see [4, 25–27] for O2–Ag(111) and [28–32] forO2–Ag(001)). Taken together these investigations showed (i) that the dissociative adsorptionof dioxygen on Ag is activated and proceeds via a negatively charged chemisorbed precursorof peroxo type; this is characterized by a total charge transfer of approximately one electronto the molecule [33], and an internal vibrational frequency of 80 meV, strongly down shiftedcompared to the gas-phase value of 194 meV, (ii) that three wells are present, correspondingto physisorption, chemisorption and dissociative chemisorption, and (iii) that the adsorptionprocess is strongly anisotropic with respect to the crystallographic face, with the stickingcoefficient on the (110) face being about three orders of magnitude larger than on the (111)face.
In the present report we will demonstrate that the reality of this prototype system is evenricher. The chemisorbed O−2 state was accessed either by overcoming the adsorption barrierwith the help of a supersonic molecular beam, which allows one to select the impact energyand angle of incidence [18–22, 30, 32, 34, 35], as done in Genova, or by first trapping themolecule in the physisorption well with the crystal cooled with liquid He, and than exploitingthe conversion into the chemisorbed state which takes place when heating the crystal, as donein Berlin [36], Birmingham [16] and Julich [37, 38]. Two vibrational modes (at 79.5 meV and85 meV) were observed by high-resolution electron energy loss spectroscopy (HREELS) inthe molecularly chemisorbed regime both for Ag(001) [39] and Ag(110) [37, 38]. For Ag(110)one of these species desorbs at∼100 K and therefore escaped previous investigations. Onlythis state can be accessed by conversion from the physisorption well for Ag(110). For Ag(001),in contrast, both moieties are stable up to 150 K.
A description of negative ion resonance scattering (NIR) by molecules adsorbed onsurfaces can be found in the reviews of Sanche [40] and Palmer and Rous [41]; resonancescattering in the gas phase has been a well established phenomenon since the 1960s [42].Andersson and Davenport in 1978 [43] found the first evidence for the formation of NIR atsurfaces, for the system OH/NiO(111). Resonance scattering was then observed for severalphysisorbed molecules [40, 41, 44, 45]. In an increasing number of chemisorption studies(e.g. C6H6/Pd(100) [46] and HCOO/Ni(110) [47]) resonance scattering has been observed.Resonance scattering leads to a set of typical properties and in particular to an energeticallyselective enhancement of a specific vibrational mode together with, typically, the observationof intense overtones of this mode [48]. One of the aims of the present paper is to explore andexploit the specificities of resonant electron scattering for the widely unexplored oxygen onAg system.
This paper is organized as follows: section 2 deals with the initial sticking coefficientof oxygen on Ag(001) and Ag(110). In section 3, the observation of NIR behaviour inO2 physisorbed on Ag(111) is demonstrated. Section 4.1 describes experimental studies ofNIR scattered by physisorbed O2 on Ag(110) while section 4.2 presents experimental andtheoretical investigations of the angular distribution of NIR of O2 on Ag(110). Section 5deals with the nature of the chemisorbed and physisorbed states of O2 on Ag(110). The paperends with a summary of what we have learnt about the O2/Ag system from these resonancestudies.
2. Dynamics of the molecule surface interaction and initial sticking coefficient of O2 onAg(100) and Ag(110)
The investigation of the dynamics of the O2–Ag gas–surface interaction via deposition of theO2 by a supersonic molecular beam allows the angle and the energy of the incident molecules

Negative ion resonances of O2 on Ag R55
to be controlled easily. The impact energy of the molecules can be varied either by heating thenozzle (a procedure which affects both translational energy and internal degrees of freedom ofthe molecules) and/or by seeding the O2 molecules in He (which affects only the translationalmotion). Collisions during the supersonic expansion of the gas mixture cause equilibration ofits velocity components [49]. Using typically 3% concentrations of the heavier component,impact energies (Ei) of up to 1.1 eV can be reached for O2. Beam energy and flux weredetermined by time of flight with a quadrupole mass spectrometer and by a spinning rotorgauge, respectively [50]. The sticking coefficient can be measured either directly by theretarded reflector method developed by King and Wells [51] (henceforth KW) or indirectly bymonitoring the variation of coverage with exposure. The former method is very accurate whenthe sticking coefficient is larger than a few percent and allows an accurate determination of thesurface coverage,2(O2), from the integral of missing O2 pressure over exposure time. Forvery low sticking coefficients either thermal desorption spectroscopy (TDS) or high-resolutionelectron energy loss spectroscopy (HREELS) were used to monitor the coverage. Details ofthe experimental apparatus in Genova and the surface preparation can be found elsewhere[21, 50].
The energy and angle dependence of the initial sticking coefficientS0 is shown in figure 1for Ag(001). In (a) we report data deduced from the coverage–exposure curves estimatedby the intensity of the HREELS loss associated with the dipole active intermolecular stretchvibration. Similar curves were measured for O2–Ag(110) [19, 21] and were confirmed byan independent investigation in Amsterdam [52]. As one can see the data scale with normalenergy,En = Ei cos2 θi , as indeed expected for a flat surface for which only the verticalcomponent of the velocity needs either to be dissipated at the first strike in order to allowto reach the trapped state or plays a role in overcoming a potential energy barrier.S0
grows by three orders of magnitude betweenEn = 20 meV andEn = 0.8 eV indicatingthat the process is activated. No enhancement at low impact energy is present althoughunder such conditions trapping in the physisorption well is expected to become important.An increase ofS0 was observed for most systems when loweringEi below the energycorresponding to the physisorption well depth (approximately 100 meV) [53, 54]. Such aneffect is absent, to our knowledge, only for O2–Ag and N2–Fe(111) [55]. Both systems arecharacterized by activated non-dissociative chemisorption but no clear understanding existsso far for the different behaviour of e.g. O2 on Pt, where trapping has a strong influenceon S0(En). Moreover physisorbed O2 is known to convert to chemisorbed O−2 (peroxide) athigher coverage of the physisorbed species for Ag(110). For the latter conditions a moleculardynamics study showed that the axis of the molecules lies nearly parallel to the surface pointingalong〈100〉, while for dilute conditions the〈110〉 direction is preferred ([38] and see belowsection 4).
In part (b) of figure 1 we report sticking coefficient data recorded with the more accurate,but less sensitive, KW method.S0 has a maximum at 0.6 eV and decreases slowly thereafter.A similar behaviour was also reported for Ag(110) by Kleynet al [52], for which, howeverthe behaviour at higher energies is less pronounced (Vattuoneet al [51]). Such an effect isindicative of the ability of energetic molecules to overcome the chemisorption barrier againafter the collision with the Ag atoms of the surface. The difference from Ag(110) is associatedwith the different corrugation of the chemisorption potential, which is also responsible for thedeviation from normal energy scaling.
The KW sticking data recorded atEi = 0.39 eV and 0.8 eV for the ‘open’ (001) and(110) Ag surfaces are compared in figure 2. By inspection one can see that the data in (a)and (b) corresponding to Ag(001) and the close-packed direction of Ag(110) coincide withinexperimental error. In both cases we observe overall scaling withEn although the points at

R56 R Franchy et al
(a)
(b)
Figure 1. Dependence of the non-dissociative sticking coefficient onEn for Ag(001): (a) forcoverage–exposure data (from [34]); (b) KW measurements (from [51]). The dotted line in (b)indicates the behaviour reported for Ag(110) [52].
Ei = 390 meV and normal incidence are clearly higher than the points recorded at the sameEnbut forEi = 800 meV, because of the inelastic interaction with the corrugated chemisorption

Negative ion resonances of O2 on Ag R57
Figure 2. Retarded reflector measurements of the sticking coefficient of O2 on (a) Ag(001),(b) Ag(110)〈110〉, (c) Ag(110)〈001〉 againstEn. As one can see the data coincide for the flatAg(001) surface and for the flat〈110〉 direction of the one-dimensionally corrugated Ag(110)surface (from [35]).
potential. The data recorded for Ag(110) along〈001〉, see figure 2(c), show the same behaviourat largeEi but the spread can be eliminated assuming a dependence withEeff = Ei cosn θiwith n ≈ 1 indicating that parallel momentum also helps in overcoming the barrier. Asdemonstrated theoretically by Darling and Holloway [56] a corrugation can produce this effectby a steering action on the impinging molecules. The physical picture behind this is that thetranslational energy is most effective in overcoming the barrier when the molecules impinge

R58 R Franchy et al
Figure 3. Thermal desorption spectra from O2 on Ag(001) against O2 coverage. As one can see astrong shoulder develops on the low-temperature side. Contrary to expectation, the signal at 160 Khowever continues to grow (from [57]).
along the local normal to the surface. Such an effect dominates at low impact energy wherethe steering is most effective.
To be more quantitative the dependence ofS0 on impact energy and angle is generallydescribed by the functional form:
S0(Eeff ) = η∫ Eeff
0exp−(Eeff − E0)
2/W 2 dEeff
which allows us to estimate the average height of the distribution of barriers to adsorption,E0,and its width,W . E0 andW turn out to be 368± 50 meV and 167± 25 meV, respectively,identical within experimental error for all surfaces and directions.
The average barrier found in the present experiment is thus much higher than the valuedetermined by TDS [4]. Such a finding is connected with the fact that with the beam we areaveraging over the whole unit cell and over all possible orientations of the impinging molecules.In contrast, in a TDS experiment the adsorbed molecules have time to search for the lowestenergy path which allows them to leave the surface.
The sticking probability,S, is strongly influenced by surface coverage due to the chargedstate of the admolecules. In the limit of high coverage an exponential decrease ofS wasobserved for Ag(001). In TDS a growth of a strong shoulder at lower temperatures isobserved with coverage. The thermal desorption spectra thereby show the particularitythat the higher temperature peak does not saturate (see figure 3) [58]. Such behaviour

Negative ion resonances of O2 on Ag R59
Figure 4. Atomic oxygen coverage obtained by thermal dissociation of O2 at two differentcoverages on Ag(001) [34].
could be qualitatively reproduced by de Mongeotet al [58] who demonstrated that thisfeature is strictly determined by the exponentialS(2) = S0 e−(202) dependence, wherebythe constant is a measure of the repulsive interaction between the admolecules. Theanharmonicity of the molecular potential was also analysed against2(O2) [59]. Bothovertones and combined modes were observed indicating a strong, coverage dependentanharmonicity. In particular the frequency shift of the internal stretch vibration of the O2
molecule with2(O2) is smaller than expected, due to dipole–dipole interaction, indicatingthat it must be counterbalanced by a strong chemical shift towards lower frequencies. Both theintermolecular bond and the bond to the surface are thus weakened by an increase in surfacecoverage.
At room temperature very similar initial sticking–energy curves were measured as seen infigure 1(a), except that the absolute values ofS0 are multiplied by the dissociation probabilityPdiss . This result and the non-observation of loss peaks corresponding to O-adatom vibrationsafter adsorption at low crystal temperature prove that dissociative adsorption is alwayspromoted by molecular adsorption and takes place eventually only if the crystal temperatureis high enough. Collision induced dissociation can be observed forEi above 0.8 eV. At lowcoveragePdiss turned out to be 0.63 on Ag(110) and 4.4 × 10⁻³ on Ag(001). The valuefor Ag(110) decreases with crystal temperature,T , as expected due to competition betweendesorption and dissociation; in contrast for Ag(001) it increases withT as shown in figure 4.Such anomalous dependence indicates that dissociation on Ag(001) is induced by thermallyactivated defects [34]; on Ag(110) it also takes place on the atomically flat terraces. Indeed itwas recently proven by STM that for Ag(110) at room temperature the supply of Ag adatomsnecessary to form the Ag–O adrows of the (n × 1) reconstructions is not rate limiting forthe dissociation reaction [23]. The oxygen molecules can therefore dissociate and can searcheventually for the Ag adatoms necessary to form the adrows. In contrast on Ag(001) most ofthe O2 admolecules on the terraces desorb.
The O2–Ag potential energy surface was also investigated in Genova by collision withXe and Ar atoms at hyperthermal energies for Ag(110) [60] and Ag(001) [61] covered withperoxide. Interestingly, in the collision induced processes the dissociation probability for O2

R60 R Franchy et al
on Ag(001) and Ag(110) are nearly equal. The strong anisotropy between the two faces is thusremoved when the energy for dissociation is transferred in a local process.
Finally for O2–Ag(111) at an ambient gas temperature, in contrast with earlier findings[46, 57], we found that the non-dissociative adsorptionSM,O is very small (SM,O < 1× 10⁻⁸)[62] which is near to the value of Buatier de Mongeotet al [27] who estimatedSM,O < 6×10⁻⁷
[62]. Our upper limit of 1× 10⁻⁸ is smaller by a factor of 50 than the value derived fromthe data of Raukemaet al [46] which may be attributed to a smaller number of surfaceimperfections in our case [62]. The probability for the transiently trapped molecules (reportedby Raukema and Kleyn [26]) to evolve into the chemisorbed state depends therefore on thepresence of defects or coadsorbates. According to the result of Butleret al [63], only moleculeswith a kinetic energy larger than 0.2 eV can overcome the activation barrier for molecularchemisorption.
3. Physisorption of O2 on Ag(111)
The Ag(111) surface is thus suitable to study physisorption of molecular dioxygen. Bylowering the surface temperature to 20 K, one is able to condense physisorbed mono- or multi-layers of O2 with a high sticking coefficient (near to unity) as known for many physisorptionsystems. The measured HREEL spectra are easy to interpret since there is no coadsorptionof chemisorbed O2 as found for the other low-index surfaces of Ag (see the followingsections).
Figure 5 shows HREEL spectra for an O2 dose of 1 L [36]. From the change of thisspectrum for higher doses (see also figure 9 below) it can be concluded that the coverage isabout one monolayer. The energy resolution is 3 meV, an unprecedentedly low value for an Hecooled surface. Besides the O–O stretching mode at 0.192 eV its first (at 0.382 eV) and secondovertone (at 0.571 eV) are observed. The inelastic tails extend to higher loss energies indicatinga combination of the stretching mode and another lower-lying loss. The excitation mechanismwas identified [36] as a negative ion resonance (NIR) involving the46−u shape resonanceof O2. The spectrum exhibits all typical signs of NIR [64] which are (1) high intensity ofovertone excitation of the stretching mode, (2) strong inelastic tails of the vibrational modesand the elastic peak and (3) high scattering intensity out of the specular angle. (1) and (2) areclearly recognized in figure 5. (3) is also evident from the fact that the spectrum in figure 5 ismeasured 30◦ off the specular direction. The stretching mode (n = 0→ n = 1) is observedat 192.4 meV near to the gas phase value of 194 meV.
In the anharmonic-oscillator model, the loss energy1E associated with the vibrationalovertones is related to the vibrational frequencyω and the anharmonicityωx of the anharmonicoscillator by the equation1E(ν=0→ν=n) = nω − n2ω2x2 [65]. The dissociation energy ofthe Morse oscillator is given byD = −(ω + ωx)2/4ωx. We findω = 194.4± 0.3 meV,ωx = −1.6± 0.2 meV andD = 5.8± 0.6 meV. These values are in agreement with valuesobtained for O2 on polycrystalline Ag [65].
For the O2 multilayer (see figure 9 below), as prepared by dosing with 10 L O2, thespectrum of figure 5 changes slightly as can be seen from figure 9 discussed below in thecontext of O3 formation: according to a—compared with the gas phase—less reduced lifetimeof the NIR, the inelastic tails to higher energies are more intense. Furthermore, there is astructure at 7 meV below the stretching mode indicative of contributions from translationalmodes. The46−u shape resonance energy for the multilayer is depicted in figure 6. It’s peak atan incidence energy of 9 eV is near to the value of 9.5 eV found for the gas phase [66]. Withinthe experimental error it is independent of the angle of incoming and outgoing electrons. Ourcurve is in very good agreement with that reported by Tanget al[67] for Ag(110) (see figure 11).

Negative ion resonances of O2 on Ag R61
Figure 5. HREEL spectra for 1 Langmuir (1.33× 10⁻⁶ mbar× s) O2 physisorbed on Ag(111) ata temperatureTs below 30 K. The primary energyEp is indicated. Angle of incidenceθi = 75◦and angle of emissionθe = 45◦, both with respect to the surface normal. From [36].
Figure 6. O2 stretching mode (n = 0→ 1) intensity (hω = 193 meV) versus energy of the incidentelectrons. The data are for three different couples of incidence and emission angles (relative tothe surface normal). The intensity is normalized against the background on the left side of the O2stretching mode.
These authors also found the same curve shifted to lower energies by 2 eV for the O2 monolayerdue to interaction with the Ag(110) surface. We have not measured this curve for Ag(111).
Despite the high-energy resolution, the inelastic tail was not resolved into single vibrationalor rotational modes. This can be seen more clearly in a narrow energy scan around thevibrational mode depicted in figure 7(c). A similar observation was made for N2 physisorbedon Ag(111) shown in figure 7(b). For comparison an earlier spectrum is shown in figure 7(a)[68]. At that time it was believed that the N2 vibrations against the surface were not resolveddue to a limited energy resolution. The same conclusion was drawn for N2 on Al(111) [69].Compared with Ag(111) the inelastic tail was found to be more intense than the N2 vibrationalmode for Al(111) [69].

R62 R Franchy et al
Figure 7. HREEL spectra around the (n = 0→ 1) stretching mode for: (a) N2 on Ag(111) from[68]; (b) N2 on Ag(111) at better energy resolution from [70]; (c) O2 on Ag(111) from [36].
The formation and deexcitation of the46−u resonance are due to the capture (and emission)of an electron with pσ (l = 1) and fσ (l = 3) symmetries [71]. In each step the total angularmomentum of the system is conserved, giving the selection rules for the target moleculerotational statej 1(j) = ±1 and1(j) = ±3 in the gas phase respectively forl = 1 andl = 3.The selection rules that apply to the two-step rotational excitation of O2 (j = 0→ j ′ > 0)through the46−u resonance are:1(j) = 0; ±2; ±4; ±6. The ratios between the differentseries are not calculated yet. Moreover, O2 which is a boson of nuclear spin equal to 0, admitsexclusively a rotational population with oddj [72]. Considering the rotational constant equalto B = 0.18 meV [72], we calculated the theoretical energy spectrum of the pure rotationalexcitation of O2 in the gas phase (at 25 K) as shown in figure 8. This does not display anyintense structure in the range 6–8 meV. Hence the shape of the experimental loss peaks cannotbe fully explained as being solely due to pure rotational excitation of the molecule. This resultis also supported by the fact that the peak shapes of the overtones are different from each other,contrary to what is expected if the shape were only due to the initial population (j ) of O2.
Although the inelastic tail could not be resolved into individual losses, it is very likely thattranslational modes with energies of 6–8 meV are involved in establishing the tail. Thisconclusion is drawn due to the large width of the tails, the negligible intensity gain (tothe left of the stretching mode) and one resolved structure of about this energy for the O2
multilayer.
Negative ion resonances of O2 on Ag R63
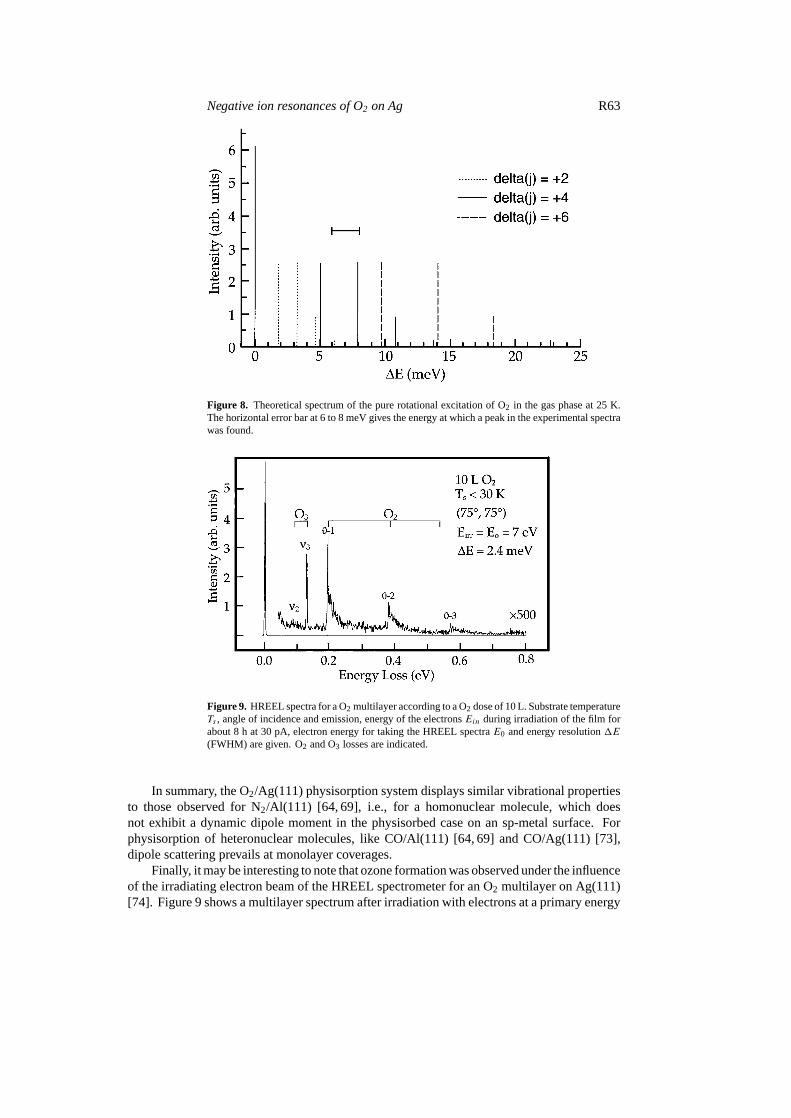
Figure 8. Theoretical spectrum of the pure rotational excitation of O2 in the gas phase at 25 K.The horizontal error bar at 6 to 8 meV gives the energy at which a peak in the experimental spectrawas found.
Figure 9. HREEL spectra for a O2 multilayer according to a O2 dose of 10 L. Substrate temperatureTs , angle of incidence and emission, energy of the electronsEin during irradiation of the film forabout 8 h at 30 pA,electron energy for taking the HREEL spectraE0 and energy resolution1E(FWHM) are given. O2 and O3 losses are indicated.
In summary, the O2/Ag(111) physisorption system displays similar vibrational propertiesto those observed for N2/Al(111) [64, 69], i.e., for a homonuclear molecule, which doesnot exhibit a dynamic dipole moment in the physisorbed case on an sp-metal surface. Forphysisorption of heteronuclear molecules, like CO/Al(111) [64, 69] and CO/Ag(111) [73],dipole scattering prevails at monolayer coverages.
Finally, it may be interesting to note that ozone formation was observed under the influenceof the irradiating electron beam of the HREEL spectrometer for an O2 multilayer on Ag(111)[74]. Figure 9 shows a multilayer spectrum after irradiation with electrons at a primary energy

R64 R Franchy et al
Figure 10. Intensity of theν3 (asymmetric stretching) mode as a function of the energy of theincident electrons (full squares). The full line is for the46−u shape resonance of physisorbed O2from figure 6.
of 7 eV and a current of 30 pA for about 8 h. Besides the O2 derived losses, as known fromfigure 5, a very sharp loss atν3 = 128.6 meV is observed. The peak atν2 = 86 meV isbetter resolved after reducing the energy of the primary electron beam to 3 eV. These lines areassigned to O3, ν3 being the asymmetric stretching mode andν2 the bending mode of O3, andare in very good agreement with EELS measurements for gas-phase O3 [75]. It is also worthnoticing that the presence of O3 has also been proven by electron stimulated O− desorption[74]. Both peaks are dipole active; this can be verified by changing the measuring angle andby the dependence on the impact energy which is shown in figure 10. One clearly recognizesthat the excitation does not show any clear resonance. The slight antiresonance around 9 eVmay be due to the normalization procedure. Actually, one should subtract first the part of theprimary electrons which is responsible for the NIR channel. This would reduce the intensityof the elastic peak which is used to normalize the dipole active modes thus increasing thenormalized intensity of the dipole mode. This example demonstrated that NIR is also veryhelpful in identifying unknown physisorbed species as, in addition to the NIR scattering fromO2, dipole scattering from O3 is observed.
4. O2/Ag(110): physisorption
The scattering properties of an electron by a molecule are dominated by the formation ofmolecular negative ion intermediates. Such resonant processes play a very important role inthe energy transfer from an electron to a molecule, leading very efficiently to the electronicand/or vibrational excitation of molecules. A wealth of information (energy position, lifetime,symmetry) on negative ion resonances was accumulated for free molecules in the 1970s [42]and more recently for adsorbed molecules [40, 41, 64] using the high-resolution electron energyloss spectroscopy (HREELS) technique. It has been shown that the resonances observed forphysisorbed molecules can be associated with those observed for free molecules, howeverwith their characteristics modified by the metal environment. Section 4.1 will consider themodification of resonance energy position and lifetime due to the physisorption and section 4.2will focus on the angular behaviour of the resonant electron scattering.

Negative ion resonances of O2 on Ag R65
Figure 11. Resonance energy profiles obtained from physisorbedO2 on Ag(110) atT = 20 K. The experimentally observedintensity of the 190 meVv = 0→ 1 vibrational excitation of theO2 molecule, normalized to the diffuse elastic intensity, is plottedas a function of the incident electron energy. The incident angleis 60◦ and the detection angle is 40◦ in both cases. Resonancesare observed at (a) 7 eV for an O2 dose of 1 L, and (b) at 9 eV foran O2 dose of 10 L. The solid curves are drawn as a guide to theeye.
4.1. Resonance energy and lifetime
This section examines how the formation of negative ion resonances is exploited, viathe HREELS technique, to study the resonance characteristics of oriented physisorbed O2
molecules on the Ag(110) surface. The focus is on the resonance energy and lifetime, asa function of the structure of the adsorbed layer. Resonance energy shifts in physisorbedmolecules [41], e.g. O2 physisorbed on graphite [76, 77], a semi-metallic substrate, are nowwell established. Previous studies of the resonance lifetime in physisorbed monolayers alsoindicated significant changes with respect to the gas-phase resonance lifetime [41, 78, 79]. It istherefore valuable to explore the precise mechanisms by which these fundamental parametersof the resonance state are perturbed on a well defined Ag(110) surface. The experimental resultsare compared with theoretical calculations which employ the layer-Korringa–Kohn–Rostoker(LKKR) model [80–84] to predict the resonance energy and lifetime of an adsorbed moleculeas a function of adsorption height.
HREELS measurements of physisorbed O2/Ag(110) were performed for both monolayerand multilayer coverages, corresponding to 1 L and 10 L exposures, at 20 K. The experimentaldetails can be found in [67]. Typical HREEL spectra show that thev = 0→ 1 vibrationalexcitation of the physisorbed O2 molecule is manifest as a peak in the HREEL spectra at anenergy loss of 190±5 meV [67]. This value is approximately the same as that observed in thegas phase [66] and on both Pt(111) [85], Ag(111) [36] and graphite [77], and is an indicationthat the O2 molecule is only weakly perturbed on adsorption. Intense vibrational overtoneexcitations, which are characteristic of the resonant excitation mechanism and arise from therelatively long lifetime of the electron–molecule interaction, are also observed [36, 67].
The intensity of thev = 0 → 1 loss peak was monitored as a function of the incidentelectron energy and normalized to the diffuse elastic intensity [41] to give the resonanceenergy profile for the vibrational excitation of physisorbed O2/Ag(110). The resulting energydependence, for both monolayer and multilayer coverages of O2, is shown in figures 11(a) and(b). As the O2 dose is increased, the well defined resonance centred at≈7 eV in figure 11(a) isshifted to higher energy, with a peak at≈9 eV in figure 11(b). This resonance is assigned to the46−u negative ion state, which is formed by adding an electron to the lowest unoccupied 2pσ ∗u

R66 R Franchy et al
orbital of the O236−g ground state, and is observed at an energy of about 9.5 eV in the gas phase
[66]. The shift in resonance energy is attributed to the effect of the image potential, which hassimilarly been observed on graphite [76, 77] and Pt(111) [85]. This conclusion is in agreementwith prior theoretical studies by Gerber and Herzenberg [86] as well as the coupled angularmomentum (CAM) calculations of Teillet-Billyet al [87, 88], and is confirmed by a recentstudy [67] which employed the LKKR method [80–84] to take into account any influence ofthe substrate atomic potential. The results of the LKKR calculations showed that the resonanceenergy varies as the surface barrier (image) potential, independent of the adsorption site, andis thus largely unaffected by the unoccupied electronic states of the substrate [67]. Therefore,the reduction of the energy of the negative ion upon physisorption is primarily a consequenceof the electrostatic screening of the negative ion.
The resonance lifetime, although accessible to HREELS, cannot be measured directly.Rather, the change in the relative overtone intensities as a function of exposure reflects thelifetime of the O−2 resonance state. Thus, if the resonance lifetime of a molecule,tR, is alteredby adsorption, then this will be manifest in the rate of decay of the intensity of the loss featuresas a function of the overtone number. A decrease in the resonance lifetime will cause thevibrational overtones to decay more rapidly than for the free molecule, whilst an increase ofthe resonance lifetime will tend to have the opposite effect.
An analysis of the decay of the vibrational overtone intensities to extract the lifetime ofO2 physisorbed on Ag(110) was performed [67, 78, 79]. The analysis employs the displacedharmonic oscillator model proposed by Gadzuk [78, 79], which was employed previously toestimate the lifetime of the25g resonance (2.3 eV) of N2 physisorbed on polycrystalline Ag[78, 79]. In figure 12(a) we show the overtone intensities computed by using the displacedharmonic oscillator model described above, plotted as a function of the resonance lifetime(expressed as a percentage of the lifetime of the free molecule= 100%). Also shown are theloss intensities (after background subtraction) of thev = 0→ 2 andv = 0→ 3 overtones,normalized to thev = 0→ 1 transition, measured for both monolayer and multilayer coveragesof O2 on Ag(110).
Figure 12(a) also includes the measured decay of the overtones for the free molecule, asmeasured by Wonget al [66]; good agreement is obtained with the predictions of the displacedharmonic oscillator model. For both the 1 and the 10 L coverages of O2 physisorbed onAg(110), we observe that the measured overtone intensities decay more rapidly than those forthe molecule in the gas phase. This feature, which has also been observed in the loss spectrumfor resonance scattering by N2 on polycrystalline Ag [78, 79], indicates that the resonancelifetime is reduced upon adsorption and that the resonance lifetime is shorter for a coverageof 1 L (the monolayer) than for 10 L (the multilayer). The coverage effect on the overtoneexcitation has been calculated in the N2 case [88]. The calculation using the CAM methodshows that the overtone excitation strongly depends on the adsorption height and decreaseswhen this height is decreased. From figure 12(a) we observe that the calculated rate of decay ofthe overtone intensities from the physisorbed molecule at 1 L coverage is in excellent agreementwith the measured intensities, if the resonance lifetime of the adsorbed molecule is reducedto 70± 10% of the lifetime of the free molecule. The lifetime reduction for 10 L coverage issignificantly smaller; in this case, the lifetime of the adsorbed molecule is 90± 10% of thelifetime of the free molecule. These results suggest that the negative ion state in adsorbed O2
is more strongly quenched in the monolayer than in the multilayer.Figure 12(b) shows the resonance lifetime computed by the LKKR method for the O2
molecule adsorbed parallel to the Ag(110) surface. The calculated lifetime of the resonance isplotted as a function of the adsorption height of an isolated molecule above the twofold hollowsite, and shows distinctive oscillations. For the monolayer phase, the LKKR calculation of the

Negative ion resonances of O2 on Ag R67
(a) (b)
Figure 12. (a) Overtone intensities in resonance electron scattering by O2 (via the46−u resonance)plotted as a function of the overtone number and normalized to thev = 0→ 1 loss. Filled squares:overtone intensities for the free molecule measured by Wonget al [66]. Filled circles: overtoneintensities for 1 L of O2 physisorbed on Ag(110). Filled triangles: overtone intensities for 10 L ofO2 physisorbed on Ag(110). The dashed curves are calculated overtone intensities obtained fromthe displaced harmonic oscillator model, where the resonance lifetime (labelled as a percentage ofthe lifetime of free O2) is treated parametrically. The solid curves indicate the upper and lowerbounds of the resonance lifetime that are consistent with the experimental data for physisorbed O2at 1 L coverage. (b) The relative resonance lifetime (1.0 = gas phase lifetime) of the46−u shaperesonance of O2, evaluated by a layer-KKR calculation, plotted as a function of the adsorptionheight of the molecule. Solid curve: full LKKR calculation, including full multiple scattering ofthe trapped electron by the substrate. Dashed curve: the empty crystal approximation where onlythe image interaction between the negative ion and the metallic substrate is included. Solid circle:the resonance lifetime determined for 1 L coverage of the physisorbed molecule corresponding toan adsorption height of 2.5± 0.3 Å.
resonance energy as a function of the molecular adsorption height suggests (after comparisonwith the experimental resonance energy) that the molecule is adsorbed 2.5 ± 0.3 Å abovethe first atomic plane of Ag(110) [67]. From figure 12(b), we see that an O2 moleculeadsorbed at this height has a calculated lifetime of 80± 10% compared with the lifetime ofthe negative ion in the free molecule. This reduction of the lifetime is in reasonable agreementwith the resonance lifetime extracted from the measured decay of the overtone intensities,70± 10%.
When the lifetime is computed for an empty crystal, also shown in figure 12(b), we seethat there is almost no variation in lifetime over a range of realistic adsorption heights. Theempty crystal neglects any electron scattering among the substrate atoms and considers onlythe image interaction between the negative ion and the metallic substrate, a strategy adoptedby the CAM method. Qualitatively, the surface barrier potential of Ag, estimated from thesum of the Fermi energy and the work function of the metallic substrate, is about 9.8 eV [86].The incident energy of the probe electron, corresponding to the46−u negative ion state of O2,is comparable with this barrier height. Therefore, the probe electron would not be strongly

R68 R Franchy et al
Figure 13. Resonance energy profile for the X36−g → a11gelectronic excitation, normalized to the diffuse elastic intensity,from O2/Ag(110) atT ∼ 20 K. The incident angle is 60◦ andthe detection angle 40◦. Resonances are observed at incidentenergies of (a) 6, 8.5 and 12 eV in the low-coverage regime, and(b) 7, 10 and 13 eV in the high-coverage regime, respectively.
scattered by the surface barrier and would be expected to interact predominantly with theunoccupied electronic band structure of the crystalline substrate.
Resonance states are not only manifest in the cross-sections for vibrational excitation ofmolecules but also in electronic excitation. HREELS was employed to study the X36−g →a11g electronic excitation of O2 molecules physisorbed on Ag(110) [89]. The X36−g → a11g
excitation, evident as a peak in the HREEL spectrum at 975± 5 meV, was monitored as afunction of the incident electron energy. The results are shown in figure 13. Three resonances,peaks A, B and C, were observed to occur at incident electron energies of≈7, 10 and 13 eVin the multilayer regime, figure 13(a), and shifted to lower energies by about 1–1.5 eV in themonolayer, figure 13(b). This perturbation of the resonance energy of the negative ion stateby the metallic Ag(110) surface is consistent with the discussion above, and therefore is againbelieved to arise from image potential screening.
It is interesting to further note that the relative intensities of these peaks also changedramatically as a function of coverage, figure 13, possibly reflecting a modification in therelative lifetimes of the resonances. Since peaks B and C were not seen in earlier gas phasestudies, the appearance of these resonant states is of particular significance and can be comparedwith similar features observed in electron stimulated desorption (ESD) studies of condensedO2 [90–92]. These ESD studies reported two resonances at 9 and 13 eV, whose appearancewas attributed to the violation of the6+ → 6− symmetry selection rule through O2–O2
coupling [90, 93]. However, in figure 13, peaks B and C are enhanced, compared with peak A,in the monolayer regime rather than in the multilayer where the O2–O2 interaction wouldbe strongest. An intuitive explanation for this observation would be that the O2–surfaceinteraction is responsible for enhancing the B and C resonances. Rous [82] has shown that thelifetime of a negative ion can beincreasedupon adsorption, when the effects of the substrateelectronic states on the resonance scattering are taken into consideration. We have seen,figure 12(b), the dramatic effect that the interaction between the molecular resonance stateand the unoccupied electronic states of the surface has on the resonance lifetime. Moreover,Sambeet al [94] have reported an increase in the cross-section for molecular dissociationvia electron capture on the surface compared with the gas phase, due to the quenching of

Negative ion resonances of O2 on Ag R69
intramolecular electronic deexcitation of the resonance state [94]. Therefore, the argument forenhanced lifetime in the monolayer offers a plausible alternative explanation of the appearanceof peaks B and C.
In conclusion, HREELS measurements reveal that both the resonance energy and lifetimeof the negative ion states of O2 is dependent on coverage on the Ag(110) surface. The downwardshift in resonance energy from the multilayer regime to the monolayer regime is attributed tothe effect of the image charge potential. The perturbation of the resonance lifetime, however,is found to be more complicated, and depends critically on the interaction of the resonancestate with the unoccupied electronic states of the substrate.
4.2. Angular distribution of resonant electron scattering by oriented physisorbed molecules:study of the O2/Ag(110) system
There is a correspondence between the resonances for free molecules and for physisorbedmolecules. However, the change in the molecular environment modifies the characteristicsof the resonant scattering, as discussed for the overtone excitation in the previous section.The angular properties of the resonant scattering for physisorbed molecules will be discussedhere. For free molecules, the angular behaviour of the inelastically scattered electron onlydepends on the molecular asymmetry of the intermediate state: the symmetry assignment isobtained from the analysis of the electron angular distribution [95]. The electron angulardistribution directly reflects the molecular symmetry of the resonance, averaged over the freeorientation of the molecule in space. The angular analysis makes use of a very small numberof partial waves (one or two) to describe the angular behaviour of the incident and emittedelectron scattering in the case of low-energy resonances. On a surface, the adsorbed moleculeis often oriented, the orientation being held fixed by the molecule-to-substrate and molecule-to-molecule interactions. For physisorbed molecules, the angular distribution of scatteredelectrons is then expected to reflect not only the symmetry of the resonant state (known fromthe gas phase studies but which may be perturbed by adsorption) but also the orientation of themolecular axis, and consequently it can probe both these aspects [96–98]. Our purpose here isto present and discuss the relevance of an electron emission angular study for the determinationof the orientation of adsorbed molecules. The present theoretical study is based on a classicalmodel for the electron scattering that takes into account the orientation of the molecular axis,both in azimuthal (in-plane) and polar (out-of-plane) orientation with respect to the surface. Wewill show that the angular properties of the electron emission strongly depend on the orientationof the molecular axis and that an angular study as a function of both the azimuthal and polarangles can provide a three-dimensional view of the oriented molecule, helpful for the structuredetermination. The present paper focuses on what can be learned on one particular system ofinterest—O2 molecules physisorbed on a silver substrate—by the use of the specific propertiesof resonant inelastic electron scattering. The O2/Ag(110) system is of particular interest since,according to a near-edge x-ray-absorption fine-structure (NEXAFS) study [103], the adsorbedmolecules have a well defined orientation, both in azimuthal and polar angles, with respect tothe Ag crystal. We will present below the case of the angular distribution of electrons resonantlyscattered by O2 molecules physisorbed by Ag(110) via the46−u resonance. Our study showsthat the structural changes with coverage (from the monolayer to the multilayer regime) canbe followed quantitatively by the change in the angular distributions of resonantly scatteredelectrons, with a satisfactory agreement with the previous determination of the structuralparameters by the x-ray absorption technique. This work confirms the possible use of resonantelectron scattering and of its angular properties as a relevant tool for structural analysis ofphysisorbed species.
R70 R Franchy et al
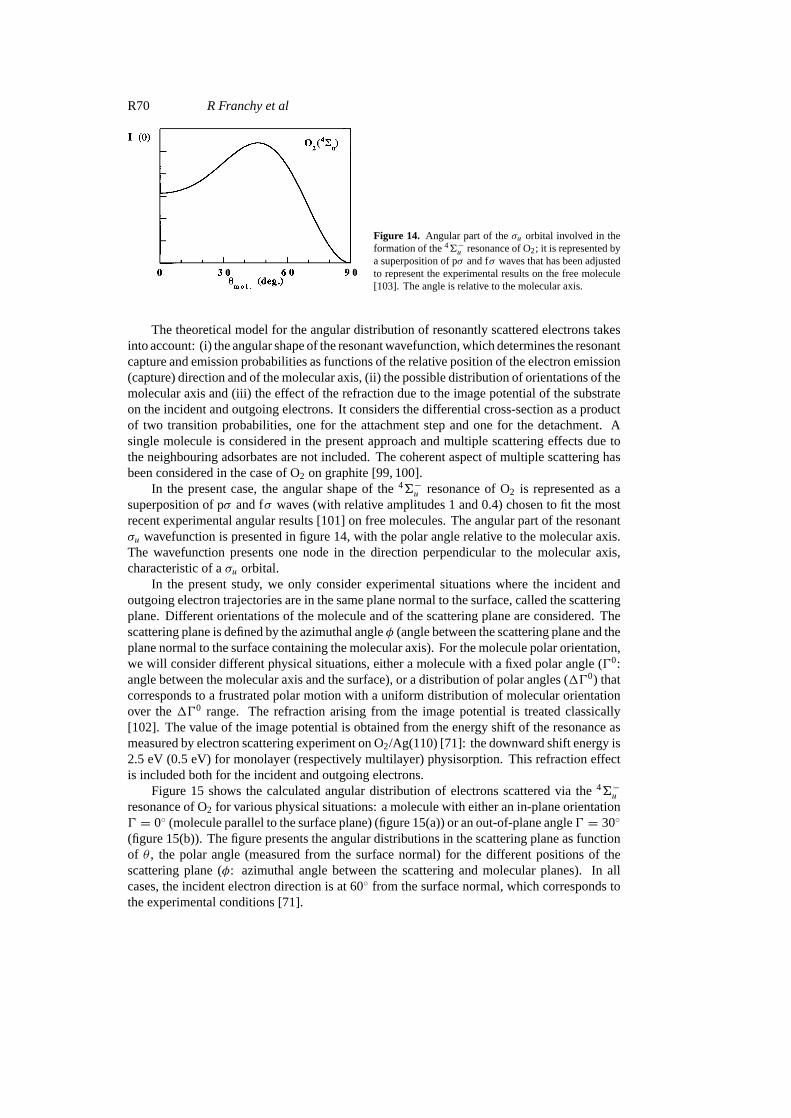
Figure 14. Angular part of theσu orbital involved in theformation of the46−u resonance of O2; it is represented bya superposition of pσ and fσ waves that has been adjustedto represent the experimental results on the free molecule[103]. The angle is relative to the molecular axis.
The theoretical model for the angular distribution of resonantly scattered electrons takesinto account: (i) the angular shape of the resonant wavefunction, which determines the resonantcapture and emission probabilities as functions of the relative position of the electron emission(capture) direction and of the molecular axis, (ii) the possible distribution of orientations of themolecular axis and (iii) the effect of the refraction due to the image potential of the substrateon the incident and outgoing electrons. It considers the differential cross-section as a productof two transition probabilities, one for the attachment step and one for the detachment. Asingle molecule is considered in the present approach and multiple scattering effects due tothe neighbouring adsorbates are not included. The coherent aspect of multiple scattering hasbeen considered in the case of O2 on graphite [99, 100].
In the present case, the angular shape of the46−u resonance of O2 is represented as asuperposition of pσ and fσ waves (with relative amplitudes 1 and 0.4) chosen to fit the mostrecent experimental angular results [101] on free molecules. The angular part of the resonantσu wavefunction is presented in figure 14, with the polar angle relative to the molecular axis.The wavefunction presents one node in the direction perpendicular to the molecular axis,characteristic of aσu orbital.
In the present study, we only consider experimental situations where the incident andoutgoing electron trajectories are in the same plane normal to the surface, called the scatteringplane. Different orientations of the molecule and of the scattering plane are considered. Thescattering plane is defined by the azimuthal angleφ (angle between the scattering plane and theplane normal to the surface containing the molecular axis). For the molecule polar orientation,we will consider different physical situations, either a molecule with a fixed polar angle (00:angle between the molecular axis and the surface), or a distribution of polar angles (100) thatcorresponds to a frustrated polar motion with a uniform distribution of molecular orientationover the100 range. The refraction arising from the image potential is treated classically[102]. The value of the image potential is obtained from the energy shift of the resonance asmeasured by electron scattering experiment on O2/Ag(110) [71]: the downward shift energy is2.5 eV (0.5 eV) for monolayer (respectively multilayer) physisorption. This refraction effectis included both for the incident and outgoing electrons.
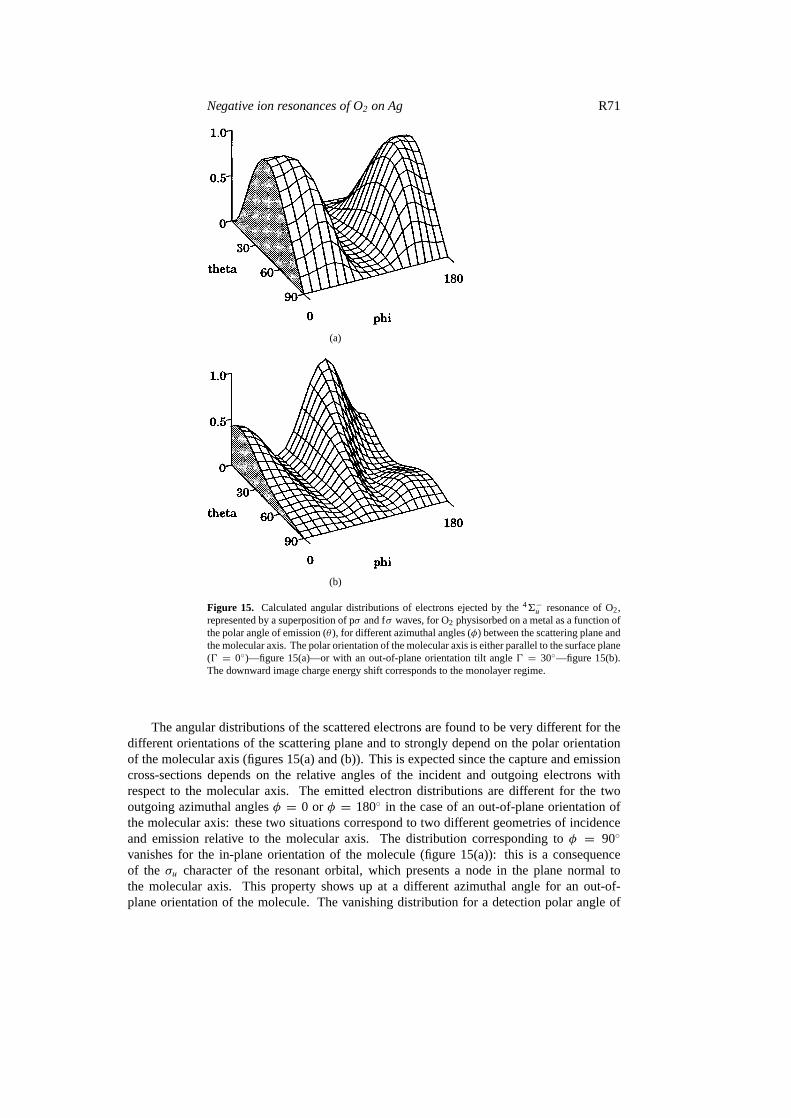
Figure 15 shows the calculated angular distribution of electrons scattered via the46−uresonance of O2 for various physical situations: a molecule with either an in-plane orientation0 = 0◦ (molecule parallel to the surface plane) (figure 15(a)) or an out-of-plane angle0 = 30◦
(figure 15(b)). The figure presents the angular distributions in the scattering plane as functionof θ , the polar angle (measured from the surface normal) for the different positions of thescattering plane (φ: azimuthal angle between the scattering and molecular planes). In allcases, the incident electron direction is at 60◦ from the surface normal, which corresponds tothe experimental conditions [71].
Negative ion resonances of O2 on Ag R71
(a)
(b)
Figure 15. Calculated angular distributions of electrons ejected by the46−u resonance of O2,represented by a superposition of pσ and fσ waves, for O2 physisorbed on a metal as a function ofthe polar angle of emission (θ ), for different azimuthal angles (φ) between the scattering plane andthe molecular axis. The polar orientation of the molecular axis is either parallel to the surface plane(0 = 0◦)—figure 15(a)—or with an out-of-plane orientation tilt angle0 = 30◦—figure 15(b).The downward image charge energy shift corresponds to the monolayer regime.
The angular distributions of the scattered electrons are found to be very different for thedifferent orientations of the scattering plane and to strongly depend on the polar orientationof the molecular axis (figures 15(a) and (b)). This is expected since the capture and emissioncross-sections depends on the relative angles of the incident and outgoing electrons withrespect to the molecular axis. The emitted electron distributions are different for the twooutgoing azimuthal anglesφ = 0 or φ = 180◦ in the case of an out-of-plane orientation ofthe molecular axis: these two situations correspond to two different geometries of incidenceand emission relative to the molecular axis. The distribution corresponding toφ = 90◦
vanishes for the in-plane orientation of the molecule (figure 15(a)): this is a consequenceof the σu character of the resonant orbital, which presents a node in the plane normal tothe molecular axis. This property shows up at a different azimuthal angle for an out-of-plane orientation of the molecule. The vanishing distribution for a detection polar angle of

R72 R Franchy et al
Figure 16. Comparison between the experimental angular distributions for physisorbedO2/Ag(110) (filled circles with error bars) and calculated distributions (full line) which use theorientational parameters derived from NEXAFS experiments [103]. (a) Monolayer coverage regime[71]. Calculated distribution (——): the azimuthal angle,φ, is 30◦, the mean orientation of themolecular axis is parallel to the surface plane (0 = 0◦) and the molecule executes a frustratedrotation given by10 = ±20◦. (b) Multilayer coverage regime [71]. Calculated distribution(——): the azimuthal orientation of the molecular axis is fixed (φ = 30◦), the molecule is tiltedaway from the surface (0 = ±30◦) and the molecule executes a frustrated rotation given by10 = ±15◦.
90◦ (i.e. parallel to the surface plane) is common to all the distributions; it is due to theimage charge potential [102] that generates a node in the surface direction for any resonancesymmetry.
Strong coverage effects have been observed by x-ray absorption [103] and by electronscattering for the O2/Ag(110) system, in the energy range corresponding to the46−u resonance[71]. This clearly demonstrates that resonant electron scattering studies are sensitive to changesin structural properties of adsorbed molecules. The experimental angular distribution for themonolayer (figure 16(a)) and for the multilayer case (figure 16(b)) shows several distinctivefeatures: a minimum along the sample normal in the monolayer case in contrast to themultilayer case which presents a substantial signal in the direction of the surface normal [71].These features can be interpreted qualitatively and quantitatively by our model. Accordingto theσu symmetry of the intermediate state (see figure 14), the minimum along the surfacenormal clearly indicates a molecular orientation approximately parallel to the surface in themonolayer and the absence of the node normal to the surface plane in the angular distributionfrom the multilayer suggests a departure from the lying down orientation. This qualitativelyagrees with the NEXAFS study [103].
Using our model, we have calculated the angular distributions in resonant electronscattering by physisorbed O2/Ag(110) based on the conclusions of the NEXAFS study with theincident and exit angles corresponding to the experimental electron scattering geometry. Theelectron experiment has been performed as a function of the exit polar angle but for only onescattering plane. We have considered, according to the NEXAFS conclusion, a molecular axisperpendicular to the Ag rows and thus the azimuth angleφ—the angle between the experimentalcollision plane and the plane normal to the surface containing the molecular axis—is equalto 30◦. In the case of the monolayer, a good agreement with electron scattering experimentalresults is obtained for a mean in-plane orientation of the molecular axis (tilt angle0 = 0◦)with a distribution of tilt angles away from the surface (10 = ±20◦) (figure 16(a)). Thesmall distribution of out-of-plane tilt angles is responsible for the weak signal in the direction

Negative ion resonances of O2 on Ag R73
(a)
(b)
Figure 17. Calculated angular distributions of electrons ejected by the46−u resonance of O2 fordifferent azimuthal angles between the scattering plane and the molecular axis when a frustratedmotion is taken into account. (a) Polar orientation of the molecular axis (0 = 0◦, with10 = ±20◦).(b) Polar orientation of the molecular axis (0 = ±30◦, with 1 = ±15◦). The downward imagecharge energy shift corresponds to the monolayer (multilayer respectively) regime for (a) ((b)).These figures correspond to the calculated three-dimensional shape of the angular distribution, inpolar and azimuth angles, for the electron emission. Figures 16(a) and (b) correspond to the cut atφ = 30◦.
of the surface normal. For the multilayer regime, the distribution of figure 16(b) is obtainedfor molecules again normal to the surface troughs (φ = 30◦) and tilted away from the surfaceplane. The agreement is obtained for an out-of-plane angle0 = ±30◦ that takes into accountthe two equivalent up and down direction of tilt and a frustrated tilt of10 = ±15◦, thatexcludes the in-plane orientation. This conclusion is consistent with the NEXAFS study [103]which concludes that the molecules progressively align more towards the surface normal withincreasing coverage. In the present model, the enhancement of the angular distribution at adetection angle of around 60◦, figure 16(b), comes from the shape of the46−u resonant orbital.The angular distribution of resonantly scattered electrons thus appears to be a powerful methodto address the problem of the orientation of physisorbed molecules as part of the structuralproperties of an adsorbed layer.
R74 R Franchy et al
The angular distributions reflect the three-dimensional shape of the resonant orbitalas shown in figure 15. However, an experiment performed with a fixed azimuthal angleφ (as in the present case) only looks at a cut through this orbital and this could lead toambiguities. The frustrated motion in polar angles has appeared as an important parameterto interpret quantitatively the experiments and one many wonder if the three-dimensionalinformation presented in figure 15 is not smoothed away by the frustrated polar motion.Figure 17 presents the three-dimensional view of the angular distributions of the emittedelectron for physical conditions similar to the experimental ones. As in figure 15, the angulardistribution in the scattering plane is given as a function ofθ for different positions of thescattering plane (φ). In figures 17(a) and (b) the same frustrated motion in polar angles asin figure 16 has been taken into account (figure 17(a) corresponds to0 = 0◦, 10 = ±20◦
and figure 17(b) to0 = ±30◦, 10 = ±15◦). Figure 17 shows that even with this frustratedpolar motion, the anisotropy of the electron scattering by the molecule can still be clearlyanalysed by an angular study. A three-dimensional analysis of the angular distribution, in bothazimuthal and polar angles, would be useful to extract orientational properties of adsorbedmolecules.
We have presented a theoretical model for angular distributions in resonant electronscattering: it has been applied to the electron scattering by physisorbed O2 on Ag(110)involving the46−u resonance. The change in the molecular orientation as the O2 coverageis increased from the monolayer to the multilayer regime can be followed by an angulardistribution study of the electron emission. The model calculation quantitatively confirmsthe orientation of the O2 molecule as determined by an x-ray absorption study [103]: themolecule lies approximately parallel to the surface and perpendicular to the rows of atoms onthe Ag(110) in the monolayer regime and is substantially tilted away from the surface in themultilayer. The present results show a very strong dependence of the angular distributions ofresonantly scattered electrons on the geometrical properties of the molecule–surface system:relative position of the molecular and scattering planes, relative molecule–surface orientations.This confirms the capability of the HREELS angular analysis for providing geometricalinformation on adsorption systems. Indeed, an unambiguous assignment of the adsorbedmolecule orientation can only be extracted from measurements involving both polar andazimuthal angles. Experiments of this kind would helpfully contribute to the analysis ofadsorbed molecules.
5. NIR of physisorbed and chemisorbed states of O2 on Ag(110)
This section examines the adsorption of oxygen on Ag(110) at 15 and 75 K studied bythermal desorption spectroscopy (TDS) and high-resolution electron energy loss spectroscopy(HREELS). In this section we will focus on the formation of physisorbed and chemisorbedstates of oxygen on Ag(110) and some of their NIR properties. A detailed discussion of thelifetime and energy of the O−2 (46−u ) resonance in the case of physisorbed O2 on Ag(110)is shown in section 4.1, while the corresponding analysis of the angular distribution of theelectron inelastically scattered is presented in section 4.2. The experimental details of thepresent section can be found in [104] and [105].
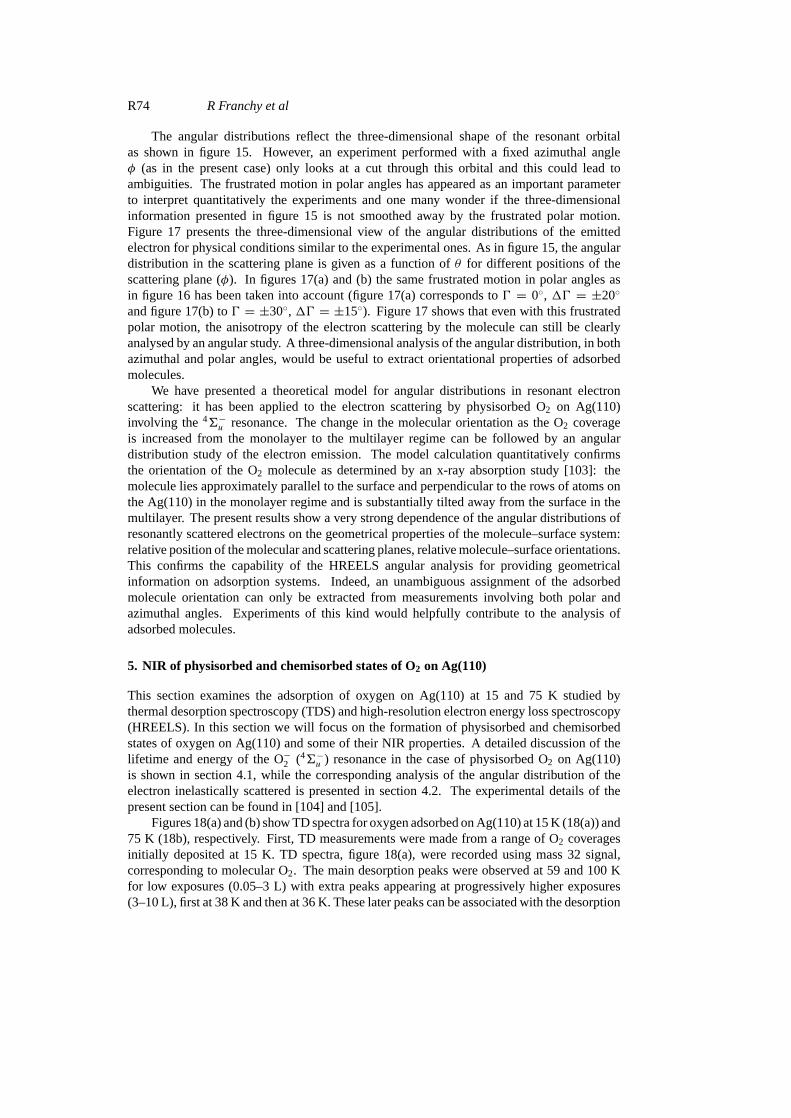
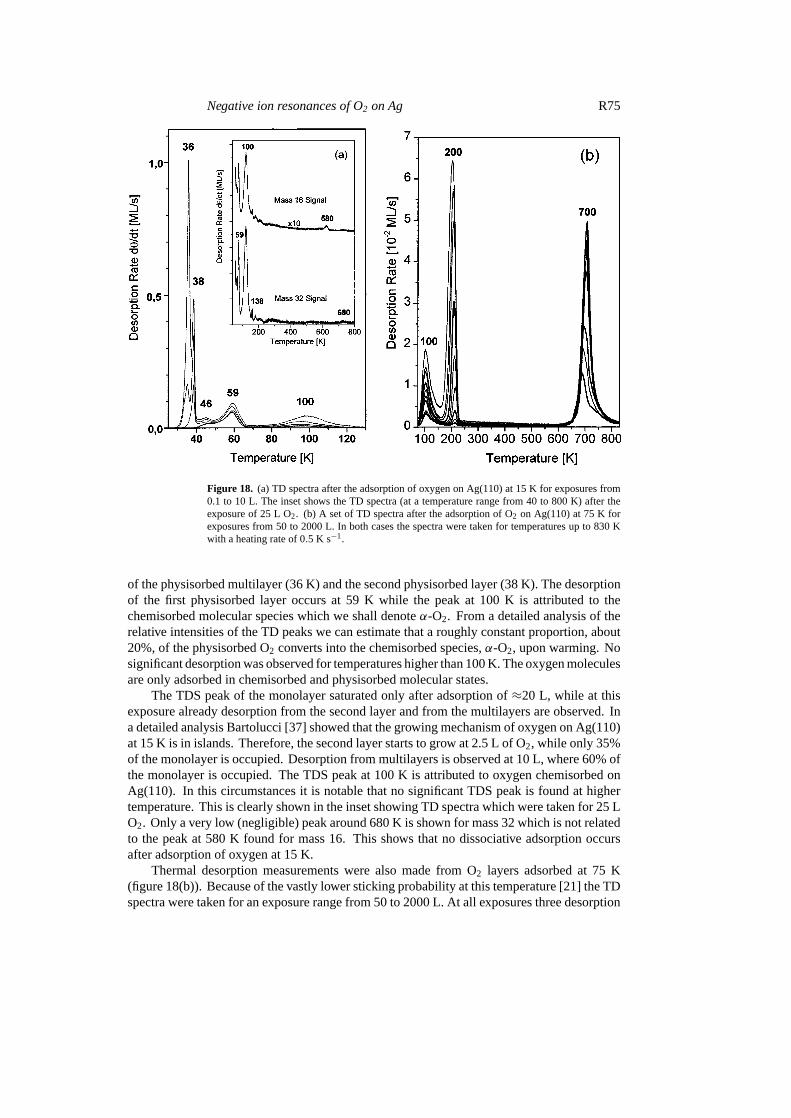
Figures 18(a) and (b) show TD spectra for oxygen adsorbed on Ag(110) at 15 K (18(a)) and75 K (18b), respectively. First, TD measurements were made from a range of O2 coveragesinitially deposited at 15 K. TD spectra, figure 18(a), were recorded using mass 32 signal,corresponding to molecular O2. The main desorption peaks were observed at 59 and 100 Kfor low exposures (0.05–3 L) with extra peaks appearing at progressively higher exposures(3–10 L), first at 38 K and then at 36 K. These later peaks can be associated with the desorption
Negative ion resonances of O2 on Ag R75
Figure 18. (a) TD spectra after the adsorption of oxygen on Ag(110) at 15 K for exposures from0.1 to 10 L. The inset shows the TD spectra (at a temperature range from 40 to 800 K) after theexposure of 25 L O2. (b) A set of TD spectra after the adsorption of O2 on Ag(110) at 75 K forexposures from 50 to 2000 L. In both cases the spectra were taken for temperatures up to 830 Kwith a heating rate of 0.5 K s−1.
of the physisorbed multilayer (36 K) and the second physisorbed layer (38 K). The desorptionof the first physisorbed layer occurs at 59 K while the peak at 100 K is attributed to thechemisorbed molecular species which we shall denoteα-O2. From a detailed analysis of therelative intensities of the TD peaks we can estimate that a roughly constant proportion, about20%, of the physisorbed O2 converts into the chemisorbed species,α-O2, upon warming. Nosignificant desorption was observed for temperatures higher than 100 K. The oxygen moleculesare only adsorbed in chemisorbed and physisorbed molecular states.
The TDS peak of the monolayer saturated only after adsorption of≈20 L, while at thisexposure already desorption from the second layer and from the multilayers are observed. Ina detailed analysis Bartolucci [37] showed that the growing mechanism of oxygen on Ag(110)at 15 K is in islands. Therefore, the second layer starts to grow at 2.5 L of O2, while only 35%of the monolayer is occupied. Desorption from multilayers is observed at 10 L, where 60% ofthe monolayer is occupied. The TDS peak at 100 K is attributed to oxygen chemisorbed onAg(110). In this circumstances it is notable that no significant TDS peak is found at highertemperature. This is clearly shown in the inset showing TD spectra which were taken for 25 LO2. Only a very low (negligible) peak around 680 K is shown for mass 32 which is not relatedto the peak at 580 K found for mass 16. This shows that no dissociative adsorption occursafter adsorption of oxygen at 15 K.
Thermal desorption measurements were also made from O2 layers adsorbed at 75 K(figure 18(b)). Because of the vastly lower sticking probability at this temperature [21] the TDspectra were taken for an exposure range from 50 to 2000 L. At all exposures three desorption
R76 R Franchy et al
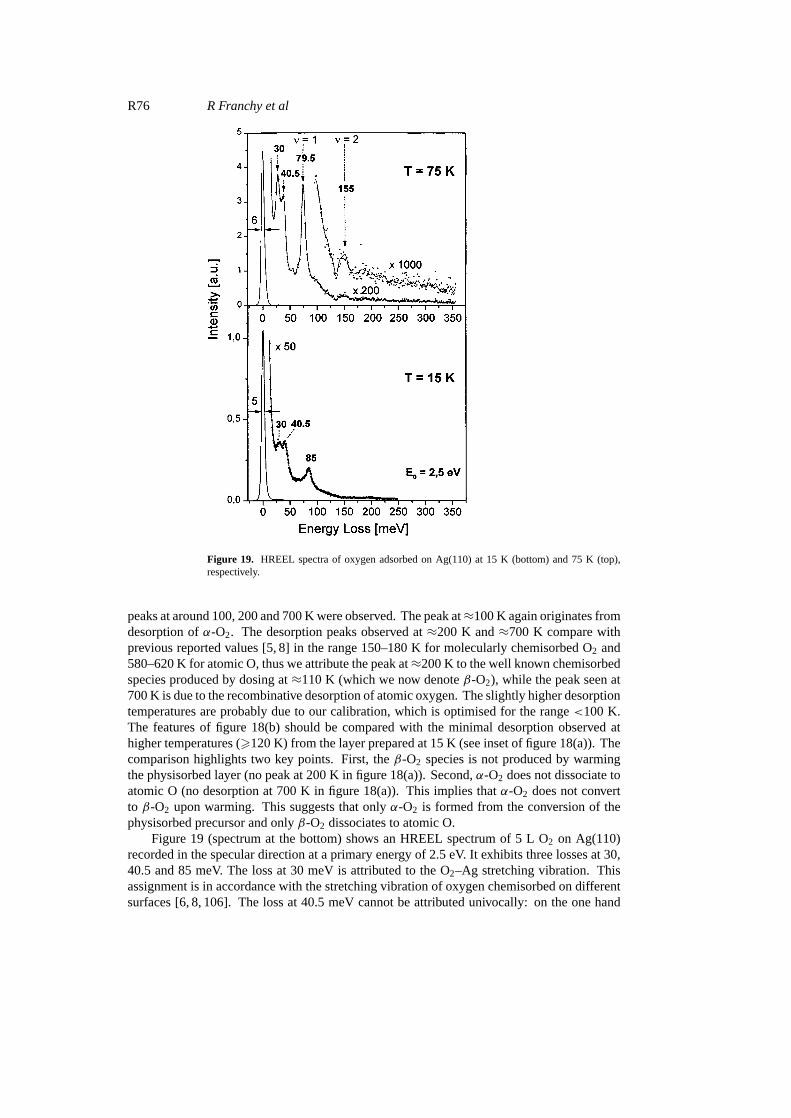
Figure 19. HREEL spectra of oxygen adsorbed on Ag(110) at 15 K (bottom) and 75 K (top),respectively.
peaks at around 100, 200 and 700 K were observed. The peak at≈100 K again originates fromdesorption ofα-O2. The desorption peaks observed at≈200 K and≈700 K compare withprevious reported values [5, 8] in the range 150–180 K for molecularly chemisorbed O2 and580–620 K for atomic O, thus we attribute the peak at≈200 K to the well known chemisorbedspecies produced by dosing at≈110 K (which we now denoteβ-O2), while the peak seen at700 K is due to the recombinative desorption of atomic oxygen. The slightly higher desorptiontemperatures are probably due to our calibration, which is optimised for the range<100 K.The features of figure 18(b) should be compared with the minimal desorption observed athigher temperatures (>120 K) from the layer prepared at 15 K (see inset of figure 18(a)). Thecomparison highlights two key points. First, theβ-O2 species is not produced by warmingthe physisorbed layer (no peak at 200 K in figure 18(a)). Second,α-O2 does not dissociate toatomic O (no desorption at 700 K in figure 18(a)). This implies thatα-O2 does not convertto β-O2 upon warming. This suggests that onlyα-O2 is formed from the conversion of thephysisorbed precursor and onlyβ-O2 dissociates to atomic O.
Figure 19 (spectrum at the bottom) shows an HREEL spectrum of 5 L O2 on Ag(110)recorded in the specular direction at a primary energy of 2.5 eV. It exhibits three losses at 30,40.5 and 85 meV. The loss at 30 meV is attributed to the O2–Ag stretching vibration. Thisassignment is in accordance with the stretching vibration of oxygen chemisorbed on differentsurfaces [6, 8, 106]. The loss at 40.5 meV cannot be attributed univocally: on the one hand
Negative ion resonances of O2 on Ag R77
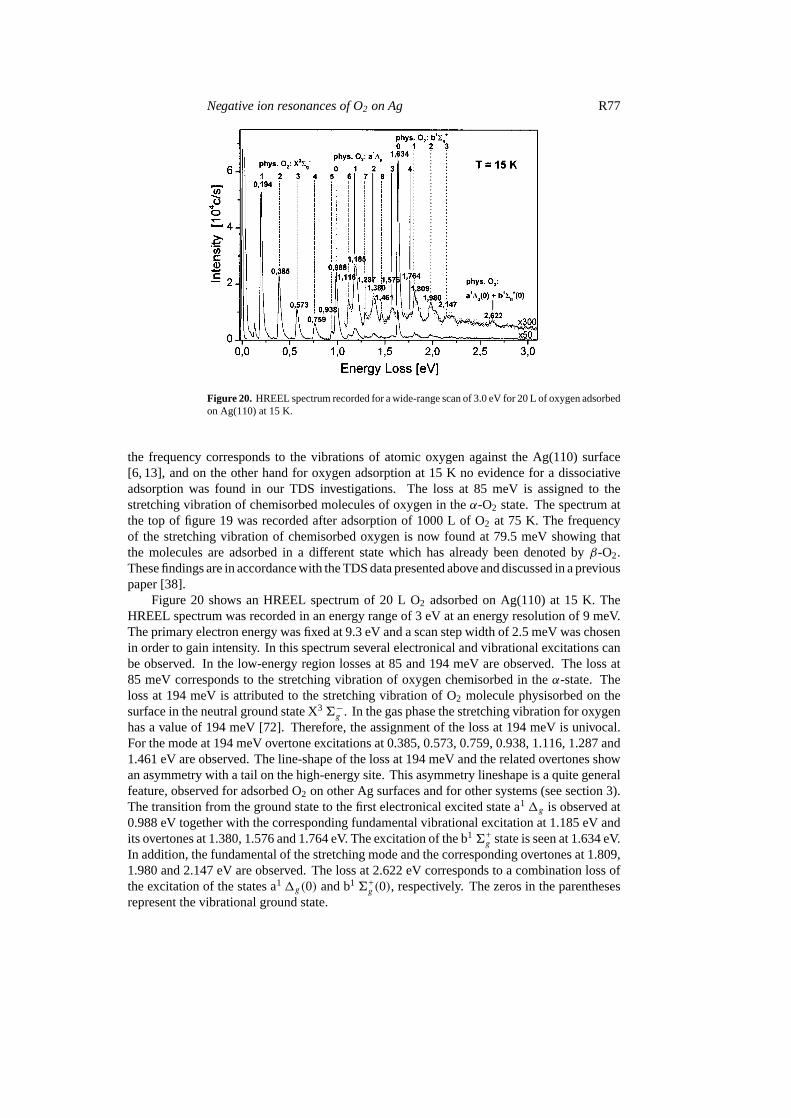
Figure 20. HREEL spectrum recorded for a wide-range scan of 3.0 eV for 20 L of oxygen adsorbedon Ag(110) at 15 K.
the frequency corresponds to the vibrations of atomic oxygen against the Ag(110) surface[6, 13], and on the other hand for oxygen adsorption at 15 K no evidence for a dissociativeadsorption was found in our TDS investigations. The loss at 85 meV is assigned to thestretching vibration of chemisorbed molecules of oxygen in theα-O2 state. The spectrum atthe top of figure 19 was recorded after adsorption of 1000 L of O2 at 75 K. The frequencyof the stretching vibration of chemisorbed oxygen is now found at 79.5 meV showing thatthe molecules are adsorbed in a different state which has already been denoted byβ-O2.These findings are in accordance with the TDS data presented above and discussed in a previouspaper [38].
Figure 20 shows an HREEL spectrum of 20 L O2 adsorbed on Ag(110) at 15 K. TheHREEL spectrum was recorded in an energy range of 3 eV at an energy resolution of 9 meV.The primary electron energy was fixed at 9.3 eV and a scan step width of 2.5 meV was chosenin order to gain intensity. In this spectrum several electronical and vibrational excitations canbe observed. In the low-energy region losses at 85 and 194 meV are observed. The loss at85 meV corresponds to the stretching vibration of oxygen chemisorbed in theα-state. Theloss at 194 meV is attributed to the stretching vibration of O2 molecule physisorbed on thesurface in the neutral ground state X36−g . In the gas phase the stretching vibration for oxygenhas a value of 194 meV [72]. Therefore, the assignment of the loss at 194 meV is univocal.For the mode at 194 meV overtone excitations at 0.385, 0.573, 0.759, 0.938, 1.116, 1.287 and1.461 eV are observed. The line-shape of the loss at 194 meV and the related overtones showan asymmetry with a tail on the high-energy site. This asymmetry lineshape is a quite generalfeature, observed for adsorbed O2 on other Ag surfaces and for other systems (see section 3).The transition from the ground state to the first electronical excited state a11g is observed at0.988 eV together with the corresponding fundamental vibrational excitation at 1.185 eV andits overtones at 1.380, 1.576 and 1.764 eV. The excitation of the b16+
g state is seen at 1.634 eV.In addition, the fundamental of the stretching mode and the corresponding overtones at 1.809,1.980 and 2.147 eV are observed. The loss at 2.622 eV corresponds to a combination loss ofthe excitation of the states a11g(0) and b16+
g (0), respectively. The zeros in the parenthesesrepresent the vibrational ground state.

R78 R Franchy et al
Figure 21. Resonance curves of oxygen chemisorbed in theα-state (mode at 85 meV) andphysisorbed (mode at 194 meV) on Ag(110) at 15 K.
Figure 21 shows the normalized intensity of the loss at 85 and 194 meV, respectively, versusthe primary energy of the electrons. The resonance curve for chemisorbed O2 (mode at 85 meV)was measured for an exposure of 5 L, while that for the loss at 194 meV (physisorbed O2)was measured after an exposure of 20 L. Both the adsorption and the HREELS measurementwere performed at 15 K. The exposure of 20 L oxygen corresponds to an oxygen film ofapproximately seven monolayers. For the mode at 85 meV a sharp maximum was found at2.0 eV. The FWHM (full width at half maximum) is approximately 1.5 eV. A similar resonanceeffect was found for oxygen chemisorbed on Pd(111) [107]. In that case the resonance curvesshow a maximum at 1–1.5 eV and the frequency of the stretching vibration lies at 104 meV.For the physisorbed molecules, corresponding to the loss at 194 meV the maximum is locatedat≈10 eV with an FWHM of 2.5 eV. In recent studies of O2/Ag(110) the maximum of theresonance curve was found at around 9 eV and was attributed to the excitation of the46−uresonance [67, 89].
In conclusion, the TDS and HREELS measurements show that the oxygen is chemisorbedon Ag(110) in two different states. Theα-state is characterized by a desorption temperaturecentred at 100 K and the frequency of the stretching vibration of the O2 molecules lies at85 meV. Theβ-state has a desorption temperature centred at 200 K and the frequency of thestretching vibration has a value of 79.5 meV. Theα-state occurs in coexistence with physisorbedoxygen and can also be prepared by conversion of physisorbed oxygen. The intensity of theloss corresponding to the stretching vibration of oxygen has a maximum at around 2 eV, whichis a characteristic of the formation of a short-lived negative ion. Theβ-state does not showresonance effects. For the multilayer regime of O2 physisorbed on Ag(110) a maximum in theresonance curve is found at 10 eV showing an excitation of the46−u resonance. Theα-statedoes not dissociate to atomic O.

Negative ion resonances of O2 on Ag R79
6. Summary
The adsorption of O2 on the (100), (110) and (111) surfaces of silver has been investigatedwith a number of complementary techniques. The thermodynamic aspects of the adsorption ofoxygen on silver were studied by measuring the sticking coefficient and by TDS. A comparisonbetween the adsorption properties of O2 on different crystallographic silver surfaces (Ag(100),Ag(110) and Ag(111)) has been presented. In summary, we have shown via supersonicmolecular beam studies that the O2–Ag interaction is strongly face dependent and characterizedby the dependence of the sticking coefficient on energy and angle of incidence of the gas-phasemolecules. The HREELS investigation showed the presence of two major molecular speciesfor both the (110) and the (001) faces. For Ag(110) one moiety desorbs upon heating thecrystal to 100 K, while the other leads to dissociation above 150 K. For Ag(001), in contrast,both dioxygen moieties lead to desorption. Only a minority species, associated with the verylow internal stretching frequency of 64 meV, undergoes dissociation on heating.
The Ag(111) surface is very suitable for the study of physisorption of O2 sincethe competing channel of non-dissociative chemisorption is very unlikely; we found theinitial sticking coefficient for non-dissociative chemisorption to be smaller than 10−8. Forphysisorbed O2 the intramolecular stretching mode at 192 meV (monolayer) exhibits strongovertones and inelastic tails due to combination losses, both typical of NIR formation. Thesame behaviour is observed for multilayers. The vibrational features typical of NIR are verysimilar to those found for physisorbed N2, another homonuclear molecule.
Oxygen is molecularly chemisorbed on Ag(110) in two different states. Theα-statecoexists with physisorbed oxygen, and is characterized by a desorption temperature centredat 100 K and a vibrational stretching vibration of 85 meV. This vibrational mode also showsNIR properties with a resonance energy at around 2 eV. Theβ-state desorbs at 200 K and themolecular stretching frequency has a value of 79.5 meV. No resonance was observed in thiscase.
A simple model was developed for the angular properties of a resonantly scattered electron.This model links the electron angular distribution to the symmetry of the NIR intermediate andto the orientation with respect to the surface of the molecular axis of an isolated physisorbedmolecule. It also takes into account the effect of refraction due to the electron–metal interactionon the electron scattering. This model allows a quantitative interpretation of the measurementsof the polar angle distributions for physisorbed O2 on Ag(110). The molecular axis orientationso obtained, and its dependence upon coverage, is in agreement with a previous determinationbased on NEXAFS measurements. Furthermore, the model study shows that ambiguities inthe determination of the molecular axis orientation could be removed if the theoretical analysiswere based on a complete measurement of the angular distribution, both in azimuth and polarangles.
Acknowledgment
This work was supported by the EU (HCM programme contract ERB CHRXCT930326).
References
[1] Besenbacher F and Norskov J K 1993Prog. Surf. Sci.445[2] Campbell C T and Paffett M 1984Surf. Sci.139396
Van Santen R A and Kuipers H P C1990Adv. Catal.35256[3] Engelhardt H A and Menzel D 1976Surf. Sci.57591

R80 R Franchy et al
[4] Campbell C T 1985Surf. Sci.15743Campbell C T 1986Surf. Sci.173L641
[5] Barteau M A and Madix R J 1980Surf. Sci.97101[6] Sexton B A and Madix R J 1980Chem. Phys. Lett.76294[7] Bowker M 1980Surf. Sci.100L472[8] Backx C, De Groot C P M andBiloen P 1981Surf. Sci.104300[9] Bange K, Madey T E and Sass J K 1985Chem. Phys. Lett.11356
[10] Prince K C, Paolucci G and Bradshow A M 1986Surf. Sci.175101[11] Stoehr J and Outka D A 1987Phys. Rev.B 367891[12] Upton T H, Stevens P and Madix R J 1988J. Chem. Phys.883988[13] Tjeng L H, Meinders M B and Sawatzky G A 1990Surf. Sci.223341[14] Puschmann A and Haase J 1984Surf. Sci.144559
Becker L, Aminpirooz S, Schmalz A, Hillert B, Pedio M and Hasse J 1991Phys. Rev.B 4413 655[15] Bracco G, Tatarek R and Vandoni G 1990Phys. Rev.B 421852[16] Guest R J, Hernnas B, Bennich P, Bjørneholm O, Nilsson A, Palmer R E and Martensson N 1992Surf. Sci.
278239[17] Taniguchi M, Tanaka K, Hashizume T and Sakurai T 1992Surf. Sci.262L123
Hashizume T 1992Surf. Sci.266282[18] Rocca M, Vattuone L, Boragno C and Valbusa U 1993J. Electron Spectrosc. Relat. Phenom.64/65577[19] Vattuone L, Boragno C, Pupo M, Restelli P, Rocca M and Valbusa U 1994Phys. Rev. Lett.72 510;
the data taken from this paper, and reported in figure 4, were corrected for the error in the energycalibration.
[20] Vattuone L, Rocca M, Restelli P, Pupo M, Boragno C and Valbusa U 1994Phys. Rev.B 495113[21] Vattuone L, Rocca M, Boragno C and Valbusa U 1994J. Chem. Phys.101713; the data taken from this paper,
and reported in figure 4, were corrected for the error in the energy calibration. See also Rocca M 1996Phys.Scr.T 66262
[22] Vattuone L, Rocca M, Boragno C and Valbusa U 1994J. Chem. Phys.101726[23] Pai W W, Bartelt N C, Peng M R and Reutt-Robey J E 1995Surf. Sci.330L679[24] Canepa M, Cantini P, Mattera L, Terreni S and Valdenazzi F 1992Phys. Scr.T 41226
Canepa M, Salvietti M, Traverso M and Mattera L 1995Surf. Sci.331–333183[25] Spruit M E M and Kleyn A W1989Chem. Phys. Lett.159342[26] Raukema A and Kleyn A W 1995Phys. Rev. Lett.744333[27] Buatier de Mongeot F, Valbusa U and Rocca M 1995Surf. Sci.339291[28] Garfunkel E L, Ding X, Dong G, Yang S, Hou X and Wang X 1985Surf. Sci.164511[29] Ares Fang C S 1990Surf. Sci.235L291[30] Rocca M, Traversaro P and Valbusa U 1990J. Electron Spectrosc. Relat. Phenom.54/55131[31] Torras J, Ricart J M, Illas F and Rubio J 1993Surf. Sci.29757[32] Buatier de Mongeot F, Valbusa U and Rocca M 1996Surf. Sci.36368[33] Van der Hock P J and Baerends E J 1989Surf. Sci.2211791[34] Buatier de Mongeot F, Cupolillo A, Valbusa U and Rocca M 1997Chem. Phys. Lett.270345[35] Rocca M 1996Phys. Scr.T 66202[36] Lacombe S, Cemic F, He P, Dietrich R, Geng P, Rocca M and Jacobi K 1996Surf. Sci.36838[37] Bartollucci F 1997PhD ThesisHeinrich-Heine-Universitat Dusseldorf[38] Bartollucci F, Franchy R, Barnard J C and Palmer R E 1998Phys. Rev. Lett.805224[39] Vattuone L, Gambardella P, Rocca M and Valbusa U 1997Surf. Sci.377/379671[40] Sanche L 1990J. Phys. B: At. Mol. Opt. Phys.231597[41] Palmer R E and Rous P J 1992Rev. Mod. Phys.64383[42] Schulz G L 1973Rev. Mod. Phys.45423[43] Andersson S and Davenport J W 1978Solid State Commun.28677[44] Sanche L and Michaud M 1984J. Chem. Phys.81257[45] Demuth J E, Schmeisser D and Avouris Ph 1981Phys. Rev. Lett.471166[46] Raukema A, Butler D A, Box F M A and Kleyn A1996Surf. Sci.347151[47] Jones T S and Richardson N V 1988Phys. Rev. Lett.611752[48] Jacobi K, Bertolo M and Hansen W 1990J. Electron. Spectrosc. Relat. Phenom.54/55529[49] Scoles G, Laine M and Valbusa U (eds) 1992Molecular Beam Methods(Oxford: Oxford University Press)[50] Rocca M, Valbusa W, Gussoni A, Maloberti G and Racca L 1991Rev. Sci. Instrum.622172[51] King D A and Wells M G 1972Surf. Sci.29454
Vattuone L, Burghaus U, Valbusa U and Rocca M 1998Surf. Sci.408L693[52] Kleyn A, Butler D A and Raukema A 1996Surf. Sci.36329

Negative ion resonances of O2 on Ag R81
[53] Luntz A C, Williams M D and Bethune D S 1988J. Chem. Phys.894381Rettner C T and Mullins C B 1991J. Chem. Phys.941626
[54] Rettner C T, Schweizer E K and Stein H 1990J. Chem. Phys.931442[55] Rettner C T and Stein H 1988Phys. Rev. Lett.592768[56] Darling G R and Holloway S 1994Surf. Sci.321L189[57] Carley A F, Davies P R, Roberts M W and Thomas K K 1990Surf. Sci.238L467[58] Buatier de Mongeot F, Cupolillo A, Rocca M, Valbusa U, Kreuzer J and Payne S H 1997J. Chem. Phys.107
711[59] Buatier de Mongeot F, Cupolillo A, Rocca M and Valbusa U 1997J. Chem. Phys.1069296[60] Akerlund C, Zoric I, Kasemo B, Cupolillo A, Buatier de Mongeot F and Rocca M 1997Chem. Phys. Lett.270
157[61] Vattuone L, Gambardella P, Cemic F, Valbusa U and Rocca M 1997Chem. Phys. Lett.278245
Valuone L, Gambordella P, Burghaus U, Cemic F, Cupolillo A, Valbusa V and Rocca M 1998J. Chem. Phys.1092490
[62] Rocca M, Cemic F, Buatier de Mongeot F, Valbusa U, Lacombe S and Jacobi K 1997Surf. Sci.373125[63] Butler D A, Reukema A and Kleyn A W 1969J. Chem. Soc. Faraday Trans.922319[64] Jacobi K, Astaldi C, Geng P and Bertolo M 1989Surf. Sci.223569[65] Schmeisser D, Demuth J E and Avouris P 1982Phys. Rev.B 264857[66] Wong S F, Boness M J W andSchultz G J 1973Phys. Rev. Lett.31969[67] Tang K B K, Rous P J and Palmer R E 1995Phys. Rev.B 5212 395[68] Hansen W 1991DissertationTU Berlin[69] Jacobi K and Bertolo M 1990Phys. Rev.B 423733[70] Guyters M and Jacobi K 1994Chem. Phys. Lett.225309[71] Tang K B K, Villette J, Teillet-Billy D, Gauyacq J P and Palmer R E 1996Surf. Sci.36843[72] Herzberg G 1950Spectra of Diatomic Molecules(New York: Van Nostrand-Reinhold)[73] Hansen W, Bertolo M and Jacobi K 1991Surf. Sci.2531[74] Lacombe S, Cemic F, Jacobi K, Hedhili M N, LeCoat Y, Azria R and Tronc M 1997Phys. Rev. Lett.79
1146[75] Allan M, Asmis K R, Propovic D B, Stepanovic M, Mason N J and Davies J A 1996J. Phys. B: At. Mol. Opt.
Phys.294727[76] Jensen E T, Palmer R E and Rous P J 1990Phys. Rev. Lett.641301[77] Rous P J, Jensen E T and Palmer R E 1989Phys. Rev. Lett.632496[78] Gadzuk J W 1983J. Chem. Phys.793982[79] Gadzuk J W 1988Annu. Rev. Phys. Chem.39395[80] Rous P J 1995Phys. Rev. Lett.741835[81] Rous P J 1996Phys. Rev.B 5311 076.[82] Rous P J 1995Surf. Sci.32667[83] Rous P J and Hartley D M 1995Chem. Phys. Lett.236299[84] Rous P J 1992Surf. Sci. Lett.279L191[85] Siller L, Wendelken J F, Hock K M and Palmer R E 1993Chem. Phys. Lett.21015[86] Gerber A and Herzenberg A 1985Phys. Rev.B 316219[87] Teillet-Billy D, Djamo V and Gauyacq J P 1992Surf. Sci.270425[88] Djamo V, Teillet-Billy D and Gauyacq J P 1995Phys. Rev.B 515418[89] Tang K B K and Palmer R E 1996Phys. Rev.B 531099[90] Azria R, Parenteau L and Sanche L 1987Phys. Rev. Lett.59638[91] Silva L A and Palmer R E 1992Surf. Sci.272313[92] Azria R, Coat Y L, Mharzi B and Tronc M 1995Nucl. Instrum. MethodsB 101184[93] Sambe H and Ramaker D E 1989Phys. Rev.A 403651[94] Sambe H, Ramaker D E, Deschenes M, Bass A D and Sanche L 1990Phys. Rev. Lett.64523[95] Andrick D and Read F H 1971J. Phys. B: At. Mol. Phys.4 389
Andrick D and Read F H 1971J. Phys. B: At. Mol. Phys.4 911[96] Davenport J W, Ho W and Schrieffer J R 1978Phys. Rev.B 173115[97] Barnard J C and Palmer R E 1992Surf. Sci.269/270420[98] Jensen E T, Palmer R E and Rous P J 1990Phys. Rev. Lett.641301[99] Rous P J, Palmer R E and Willis R F 1989Phys. Rev.B 397552
[100] Palmer R E, Rous P J, Wilkes J K and Willis R F 1988Phys. Rev. Lett.60329[101] Allan M 1995J. Phys. B: At. Mol. Opt. Phys.285163[102] Teillet-Billy D and Gauyacq J P 1991Nucl. Instrum. MethodsB 58393
Teillet-Billy D and Gauyacq J P 1995Nucl. Instrum. MethodsB 10188

R82 R Franchy et al
[103] Guest R J, Hernnas B, Bennich P, Bjorneholm O, Nilsson A, Palmer R E and Mårtensson N 1992Surf. Sci.278239
[104] Bartolucci F and Franchy R 1996Surf. Sci.36827[105] Bartolucci F, Franchy R, Silva J A M C,Moutinho A M C, Teillet-Billy D and Gauyacq J P 1998J. Chem.
Phys.1082251[106] Vattuone L, Rocca M and Valbusa V 1994Surf. Sci.314904[107] Cemic F, Dippel O, Kolasinski K W and Hasselbrink E 1995Surf. Sci.331–333267