search of the af447 wreckage area back drift estimations concerning the data • surface buoy, argo...
TRANSCRIPT

Michel Ollitrault*, Abderahim Bentamy, Bruno Blanke, Alain Colin de Verdière, Didier Delaitre, Marie Drévillon, Denis Croizé-Fillon, Catherine Kermabon, Pascal Lezaud, Richard Limeburner, Stéphanie Louazel, George Nurser, Denis Paradis, Jean-Philippe Rannou, Thierry Reynaud, Robert Scott and Sébastien Travadel
* Laboratoire de physique des Océans, IFREMER, Brest, France
Search of the AF447 wreckage area
Back drift estimations

Contents
• Reconstruction of the ocean circulation and estimation of a probable crash zone (Drift group, Spring 2010).
• Why did we miss the right place? A complementary approach, leading to propose instead the 20 N miles circle centred on LKP (Last Known Position) as the probable crash zone (Fall 2010).
• Can we better reconstruct the ocean surface circulation, should a similar accident occur in the future? (Spring 2011).

Debris and bodies found
Drift Group (June 2010) http://www.bea.aero/fr/enquetes/vol.af.447/vol.af.447.php
LKP: Last Known Position(ACARS circle is 40 Nm radius)
• : Body locations
U Ursulla sighting June 5 16hS1 Brazilian sighting June 5 21h
S2 Brazilian sighting June 6 11hG2 Galley June 6 12hBB First bodies (2) June 6 12h
E1 Body June 7 9hVTP Vertical Tail June 7 14h3Z Body June 7 17h
Note a pollution spot SAR detected June 2 8h

Experimental data
• 8 Argo floats (12 h at the surface every10 days)• 2 SVP buoys (drogued near 15 m depth)• 17 fisheries buoys (drogued near 10 to 15 m)• Doppler current measurements between 19 m and 350 m• Wind measurements (from on board satellite scatterometers)

Surface buoy trajectories May 26 to June 14 2009
17 fisheries surface buoys and 2 scientific drifters, both drogued near 10-15 m depth.(One black dot every day at 0h)
A few 12h surface displacements from Argo floats
Drift Group (June 2010) http://www.bea.aero/fr/enquetes/vol.af.447/vol.af.447.php

Vertical stratification, measured by Argo
Well mixed surface layer 35 m thick
Drift Group (June 2010) http://www.bea.aero/fr/enquetes/vol.af.447/vol.af.447.php

Comparison between ADCP and buoy velocities
Drift Group (June 2010) http://www.bea.aero/fr/enquetes/vol.af.447/vol.af.447.php

Conclusions concerning the data
• Surface buoy, Argo float and ADCP currents are compatible
• There is a 35-40 m thick well-mixed surface layer, over which the currents are almost constant
• However, on June 1 and 2 2009, the surface buoys are far away from LKP (at least 100 km) and thus may not represent well the currents near LKP.

Objective analysis (OA) of surface current data
• Current data from buoys is available every 6h• The surface velocity field is assumed non divergent• Spatial scales are estimated statistically with the whole buoy data
base• The velocity field is estimated as a linear function of the data, in a
least square sense.
Drift Group (June 2010) http://www.bea.aero/fr/enquetes/vol.af.447/vol.af.447.php

Back tracking of the first debris found using OA current field
Drift Group (June 2010) http://www.bea.aero/fr/enquetes/vol.af.447/vol.af.447.php
• June 1 2h back tracked positions
Without wind drag

Back tracking of the first debris found using OA plus windage
Drift Group (June 2010) http://www.bea.aero/fr/enquetes/vol.af.447/vol.af.447.php
• June 1 2h back tracked positions
With wind drag

Buoy trajectories: actual (dots), simulated (continuous line)
Drift Group (June 2010) http://www.bea.aero/fr/enquetes/vol.af.447/vol.af.447.php

Conclusions concerning OA
• Observed currents are well reproduced by the objective analysis (by construction)
• Only mesoscale features are possibly revealed• Absolute error on position is seemingly order of 25 km
after 5 days (obtained through a comparison with the PSY2V3 Mercator model current field, soon to appear)
• The wind drag on the bodies and debris partly emerged is important. The drag coefficient was calculated only for the Galley G2 (2.75 %).
• Approximate convergence of the backtracked objects is a necessary condition for the validity of the method used.

Ocean circulation numerical models
• One solves the fluid mechanics equations numerically, with a spatial resolution of order 10 km and hourly estimates. Forcings are the surface wind stress, solar heating, heat exchange with the atmosphere, long wave radiation, rainfall and evaporation.
• Temperature and salinity observations are assimilated into the model, thereby adjusting the model variables (to cope with the dependence on initial conditions problem)
• Only one model (FVCOM) assimilates velocity data

Mercator PSY2V3 model (T and S measurements assimilated)
Drift Group (June 2010) http://www.bea.aero/fr/enquetes/vol.af.447/vol.af.447.php

UMass FVCOMW model (T, S and some currents assimilated)
Drift Group (June 2010) http://www.bea.aero/fr/enquetes/vol.af.447/vol.af.447.php

Mercator PSY2V3 back drifts for U, S1,BB,G2,E1 and 3Z
Drift Group (June 2010) http://www.bea.aero/fr/enquetes/vol.af.447/vol.af.447.php

UMass FVCOMW back drifts for U, S1, BB, G2, E1 and 3Z
Drift Group (June 2010) http://www.bea.aero/fr/enquetes/vol.af.447/vol.af.447.php

Conclusions concerning numerical models• Comparison between numerical model and buoy velocities is
not satisfying, whatever the model.• Absolute error on trajectory positions after 5 days varies
between 35 and 100 km, depending on the model considered
• The three « best » models (FVCOM, ZOOM2 et PSY2AVG data fitted) all give a crash zone to the North Northwest of LKP
• Stokes drift (caused by surface waves) may be a few cm/s.
Drift Group (June 2010) http://www.bea.aero/fr/enquetes/vol.af.447/vol.af.447.php

Defining a wreckage area
Combining what we thought were the “best”model results (i.e. with the smallest deviations from the buoy data) we defined a 95% confidence area of 3000 km2 including possibly the plane wreck.

All impact points for all the models (numerical or OA)
• PSY2V3• PSY2V3 + Stokes• HYCOM• HYCOM + Stokes•INMOMO•INMOMC•INMOMC + Stokes•PSY2AVG datafitted•FVCOM•FVCOMW• ZOOM2• ZOOM2 + Stokes•OI50•OI85•AO75

Phase 3 research at sea
• In April and May 2010, acoustic searches were done over the 3000 km2 rectangle estimated by our drift group, and even over a much larger area, unfortunately without success.
• After a double check of the sonar images recorded (fall 2010), and considering their high quality, it became obvious that all our “best” estimates for the impact point (be they from models or data analysis) were probably wrong. But this does not mean the whole trajectories were wrong!

The area covered by the end of May 2010
AUV Remus Sonar OrionSonar SAR
Both FVCOMW and OA give close trajectories back to June 3, which are probably realistic.
But we were not so confident for June 1 and 2, because the buoys were too far.
Ollitrault (November 2010) http://archimer.ifremer.fr/doc/00027/13778/
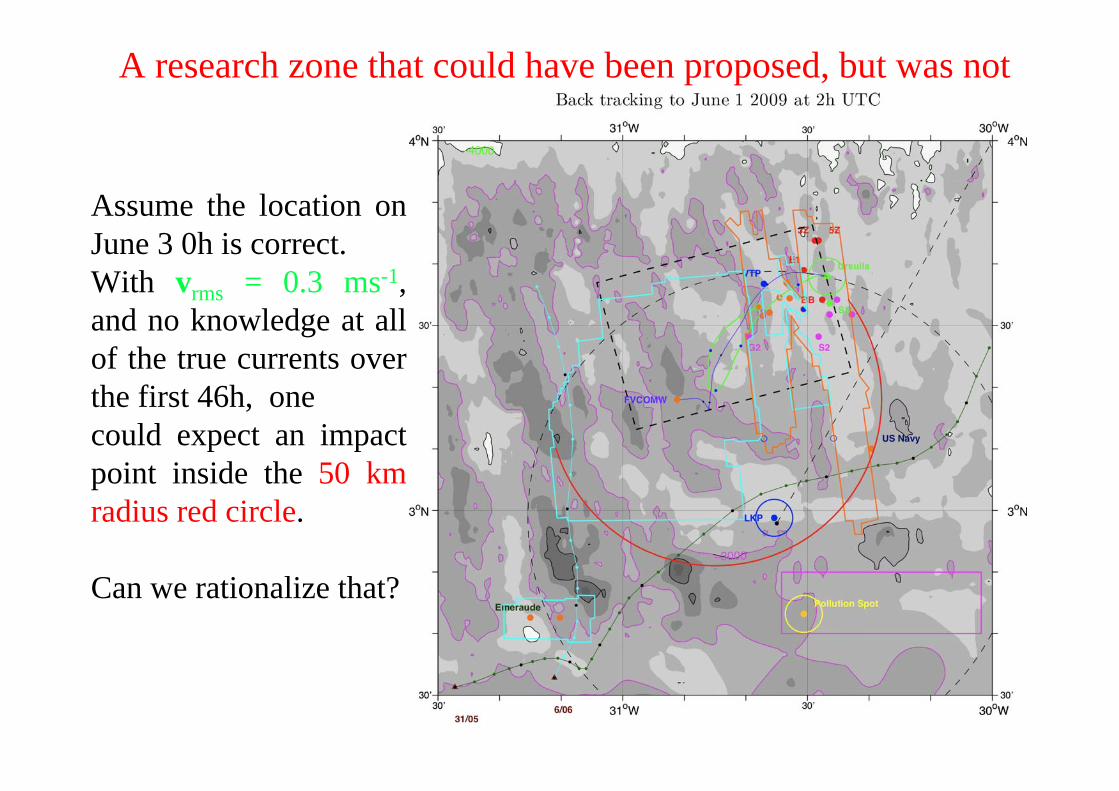
Assume the location on June 3 0h is correct.With vrms = 0.3 ms-1, and no knowledge at all of the true currents over the first 46h, one could expect an impact point inside the 50 km radius red circle.
Can we rationalize that?
A research zone that could have been proposed, but was not

The slab model• Since both FVCOMW and OA give close trajectories back to
June 3, we take that trajectory portion for granted.• Since buoys were located far from LKP during the first two
days (prior to June 3), weakly (or erroneously) constraining the current field for that period, we now estimate the back drifts with a simple physical (and analytic) model over the first 2 days (actually we will cover the first 3 days, for better initial conditions):
(+ uG the geostrophic velocity) u = uE + uG is the total velocity assumed uniform over the surface layer depth H and τS the surface wind stress (Ekman, Gill, Gonella).
uE
t ifuE
S
H
Ollitrault (November 2010) http://archimer.ifremer.fr/doc/00027/13778/

Slab model trajectories June 1 0h to June 3 24hWind stress is shown for June 1 12h
with geostrophic current added, without geostrophic current
Ollitrault (November 2010) http://archimer.ifremer.fr/doc/00027/13778/

Back drifts from June 4 0h
Initial position and velocity are those obtained through back tracking by OA from the Ursulla location
uG = 0.1 ms-1
uG = 0.1 + i0.05 ms-1
uG = 0.0 ms-1
uG = 0.0 + i0.08 ms-1
uG = 0.0 - i0.1 ms-1
uG = -0.1 ms-1
Ollitrault (November 2010) http://archimer.ifremer.fr/doc/00027/13778/

Combining slab model with OA:Back drifts for the cyan solution
Ollitrault (November 2010) http://archimer.ifremer.fr/doc/00027/13778/
Using the previous cyan reconstructed trajectory as an artificial drifter into the OA, one obtains the back tracked positions shown.
Note that the pollution spot is backtracked to the south!

Conclusion concerning the slab model
• Actually, several current fields were found compatible with the buoy velocity data (within the framework of this analysis). But of course, there is only one real current field!
• Impact locations can be found on a rational basis near LKP or near the pollution spot.
• However, this slab model remains quite simple (it is linear) anddoes not incorporate many features of the ocean dynamics. Some caution is required. For example, with this approach, the pollution spot is back tracked to the South, which is puzzling:the slab model may be wrong on June 1.
Excluding the area covered during phase 3, the 20 miles circle centred on LKP seemed, nevertheless, a potential target for investigation.

Potential search zone (November 2010)
Ollitrault (November 2010) http://archimer.ifremer.fr/doc/00027/13778/

The plane was found 5 miles north of LKP (April 2011)

Conclusions and recommendations• Too far away data precluded the correct reconstruction of
the current field over the first 2 days.• Present state of the art models did not supersede (and often
were worse than) a data (optimal) interpolation.• Data (and especially current data) is essential. • Inertial oscillations are an important component in the
ocean surface dynamics, whence the importance of a good knowledge of the wind.
• Launch at least one or two buoys near LKP after a plane lost at sea. An array of SLDM buoys on a 50 km grid will enable to resolve mesoscale motions.
• Models must assimilate velocity observations

We are thankful to:
F. Ardhuin(LOS), E. Blockley (UK MO), S. Cailleau (Mercator-Océan), B. Cappelle (Météo-France), E. Chassignet (RSMAS),, J. Condette (BEA), P. Daniel (Météo-France), D.
Delaitre (BEA), E. Durand (Mercator-Océan), G. Goa (Umass), B. Guéguen (Génavir), S. Guinehut (CLS), G.
Hajduch (CLS), Z. Lai (Umass), S. Law Chune (Mercator-Océan), J.M. Lellouche (Mercator-Océan), P. Lherminier
(LPO), H. Lin (Umass), J. Nègre (Météo-France), C. Payan (Météo-France), M. Pazos (NOAA), G. Reffray (Mercator-
Océan), M.H. Rio (CLS),V. Thierry (LPO), Q. Xu (UMass), L. Zhao (Umass).

We are also grateful to the scientists who accepted to review our work
Carl Wunsch (MIT, USA), Peter Niiler (SIO, USA),Laurent Bertino (NERSC, Norvège), Gilles Reverdin
(CNRS, France), Valérie Quiniou (Total, France) & Fraser Davidson (Fisheries and Ocean, Canada).
and to the BEA for sharing their data and knowledge and for its financial support to
several of us
Published documents:Ollitrault M, Blanke B, Chen C, Diansky N, Drevillon M, Greiner E,
Lefevre F, Limeburner R, Lezaud P, Louazel S, Nurser G, Paradis D and Scott R, Estimating the wreckage location of the Rio-Paris
AF447, Scientific Report from the Drift Group, June 30 2010, Available at http://archimer.ifremer.fr/doc/00027/13777/
or at http://www.bea.aero/fr/enquetes/vol.af.447/vol.af.447.php
Ollitrault M, Recherche de l’épave du vol AF447: Etudes complémentaires, Rapport LPO 2010_07, 17 Novembre 2010,
Available at http://archimer.ifremer.fr/doc/00027/13778/
Ollitrault M, Reynaud T, Complementary study n°2 search of the AF447 wreckage area, Rapport LPO 2011_01, February 21 2011,
Available at http://archimer.ifremer.fr/doc/00027/14279/
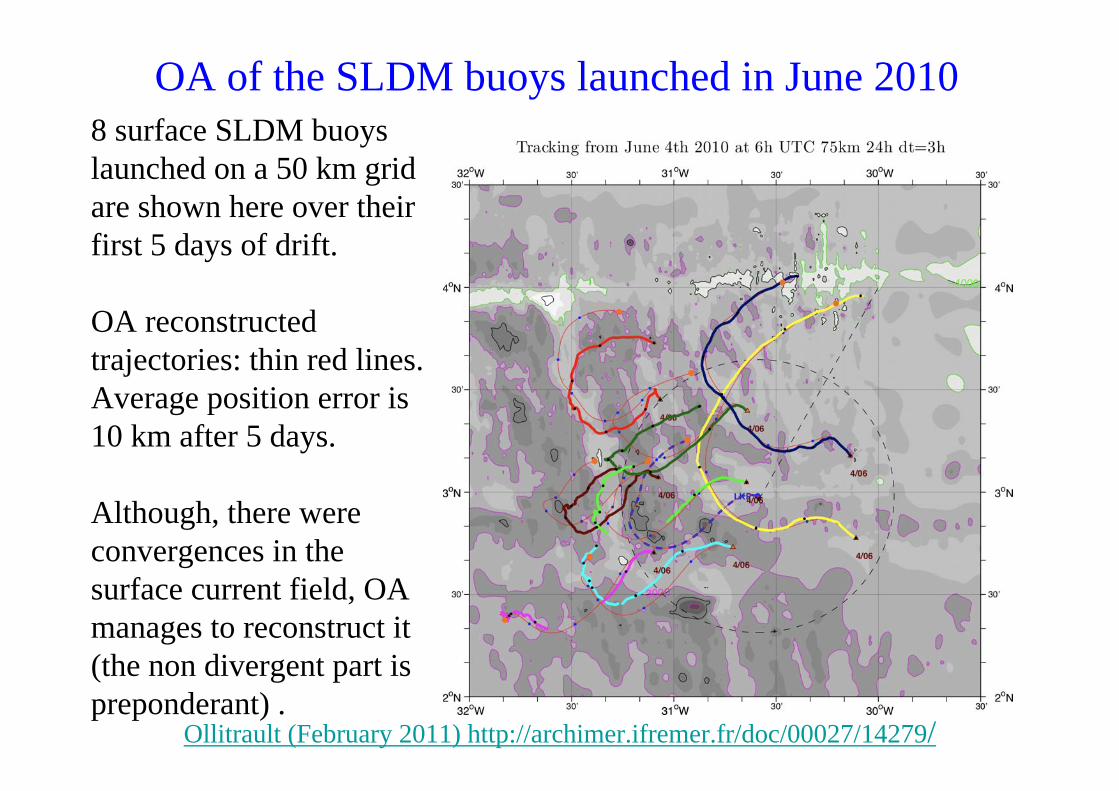
OA of the SLDM buoys launched in June 20108 surface SLDM buoys launched on a 50 km gridare shown here over their first 5 days of drift.
OA reconstructed trajectories: thin red lines.Average position error is 10 km after 5 days.
Although, there were convergences in the surface current field, OA manages to reconstruct it(the non divergent part is preponderant) .
Ollitrault (February 2011) http://archimer.ifremer.fr/doc/00027/14279/

The pollution spot problem
• Detected on June 2 at 8h 16 TU• Area ≈ 0.5 km2.• If kerosene (density ≈ 0.8 kg dm-3), the layer thickness can vary
between 0.05 et 5 μm.• Assuming a 1 μm layer, the volume would be 0.5 m3.• After a 3h 40 min flight, 43000 kg kerosene remains in the plane
tanks, that is 54 m3.• After 30h (i.e. on June 2 at 8h 16), there would remain only ≈ 1% of
the initial volume, that is 0.5 m3 at most, with a release of the kerosene at the impact time
• This pollution spot back tracked position is found near LKP, using PSY2V3 model or OA current fields.
Drift Group (June 2010) http://www.bea.aero/fr/enquetes/vol.af.447.php

Although, there are many clues to relate this spot to the plane kerosene, we have been unable yet to propose a trajectory that would include both the spot and the debris found 3 to 4 days later.
Maybe PSY2V3 trajectories are the closest?
COSMO SkyMed1 SAR image, June 2 2009 8h16