sea level rise adaptation tools for the san juan ......presentations and poster sessions in 2014...
TRANSCRIPT
Sea Level Rise Adaptation Tools for the San Juan Archipelago and the Salish Sea
2014 Interim Progress Report to the NPLCC
Friends of the San Juans December 2014
_____________________________________________________________________________________
2014 Project Accomplishments
Map Uncertainty in the Sea Level Rise Vulnerability Assessment:
Uncertainty mapping was completed, reviewed by the project’s technical advisory team and methods and results are included in the final vulnerability assessment report: MacLennan, A. and J. Waggoner. 2013. Sea Level Rise Vulnerability Assessment for San Juan County, Washington. Prepared by Coastal Geologic Services for Friends of the San Juans (attached).
• The report was distributed via email to over 100 local and regional shoreline researchers and managers and is available at the FSJ website www.sanjuans.org/NearshoreStudies.htm.
• In addition, assessment methods and results have been presented (and associated geodatabase have been provided) to San Juan County managers at multiple meetings/events.
Identify adaptation strategies and develop decision tools
Adaptation strategies from the sea level rise vulnerability assessment, related research and advisory team workshops conducted by FRIENDS and project partners were explored in a summary document for managers: Friends of the San Juans. 2014. Healthy Beaches for People and Fish: Protecting shorelines from the impacts of armoring today and rising seas tomorrow. Final Report to WDFW and the U.S. EPA. Friday Harbor, Washington (attached).
Work is underway to develop a decision support tool for use by managers as they work to apply and integrate the sea level rise vulnerability model into their planning.
Literature research has been conducted on the topic of climate adaptation decision frameworks.
FRIENDS Science Director and sea level rise adaptation tools project lead participated in a three day USFWS facilitated climate smart conservation planning training that directly informs upcoming work with local conservation managers as well as decision support tools for managers to integrate vulnerability assessment results into their project planning and development.
Host focus meetings with local, state and federal land managers, tribes and neighborhoods at risk of flooding or erosion and have priority conservation values
Initial meetings introduced and shared vulnerability assessment results and associated management recommendations. Meetings held in 2014 targeted shoreline managers and ngos with shoreline management interests and include the following:
• A meeting with Samish Indian Nation natural and cultural resource staff was held in the fall of 2013.
• San Juan County Public Works sea level rise meeting. Friday Harbor, WA. January 22, 2014 (10 participants);
• San Juan County Natural Resource Data Workshop, Friday Harbor. January 23, 2014 (approx. 30 participants from county departments (planning, land bank, parks, GIS, salmon recovery), elected officials, BLM, WDFW, and private land conservation and development entities);

• Regional conservation organization (Sound Action, Futurewise, Earth Justice, Whidbey Environmental Action Network, and Sierra Club) meeting Seattle. February 7, 2014 (10 participants);
Planned for early 2015…A workshop specifically targeting conservation managers is planned for January 29, 2015 and participants to date include BLM/San Juan Islands National Monument, San Juan County Parks, National Park Service, San Juan County Land Bank, and the San Juan Preservation Land Trust. The agenda will include the countywide sea level rise vulnerability assessment and decision support tools for applying it as well as an overview of climate smart conversation strategies using multiple local projects as examples in order to advance actual projects through the process of the workshop itself.
Develop the communication strategy
FRIENDs reviewed climate communication research, attended the following relevant trainings:
• Sea level rise adaptation: opportunities for planning in WA State facilitated by WA Dept. Ecology, NOAA and WA Sea Grant,
• Climate sessions at the Salish Sea Conference, and
• Climate Smart Conservation training facilitated by USFWS, NPLCC) and applied professional understanding from past outreach efforts with shoreline managers and property owners in the county to develop draft communication plans.
Resource Media provided FRIENDDs with a strategy memo to guide the general outreach approach (see attached memo) and reviewed draft documents and provided event specific input. Emphasis for working with non-managers and property owners was on solutions as well as the complimentary objectives that could be achieved through adaptation planning (cost savings, safety, protection of investment, recreation, etc) as well as a focus on the impacts that are already happening (flooding, erosion from storms etc.).
FRIENDS and project partner Coastal Geologic Services developed new graphics for use in communicating sea level rise concepts including the coastal squeeze impacts to forage fish spawning habitat and the impacts of rising seas on bluff erosion/recession (see attached diagrams).
Implement the communication strategy
Initial outreach and communication efforts in 2014 focused to a large extent on shoreline managers and practitioners. Presentations and poster sessions in 2014 included:
• Poster session at Storming the Sound Conference, La Conner. January 30, 2013 (approx. 100 participants).
• Poster session at shoreline permitting workshop, hosted by the Puget Sound Partnership, Washington Sea Grant and Futurewise, Edmonds. February 3, 2014 (approx. 60 participants).
• Continuing Legal Education Course Presentation - Climate Change: The Rules are Changing, Seattle University School of Law. April 25, 2014 (approx. 50 participants).
• Salish Sea Ecosystem Conference. One poster and two presentations in the shoreline track (New Tools for Sea Level Rise and State of the Science on Armor sessions) (approx. 300 participants).
• Sea level rise and cumulative impacts to forage fish spawning beaches presentation at a shoreline science and policy workshop, hosted by the Puget Sound Partnership, Washington Sea Grant and Futurewise, Georgetown. May 20, 2014 (approx. 60 participants).
Landowner and community outreach in San Juan County:
• To start introducing the topic of adaptation and the sea level rise vulnerability research to the broader community, FRIENDS worked with Resource Media to develop a feature article in the FRIENDS summer

2014 newsletter (pages 9 and 10 of attached). The theme of the 2014 annual publication was climate and energy and the focus of all the articles was on the positive work that is already underway in our community. The newsletter was distributed to our membership as well as all San Juan County box holders and reached over 11,000 residences.
• FRIENDS used King Tide and storm events in 2013 and 2014 to engage our staff, board and membership by soliciting (and then sharing, primarily via facebook) photos from all around the county that demonstrate current impacts to marine shorelines. In addition to building awareness within our base of the immediacy of climate change impacts, we are also developing a library of images to be used in future communication and adaptation efforts.
Focal community outreach (planned for early 2015):
• Planning is underway for a focal community outreach event in early spring 2015 with the community of Shaw Island. Shaw Island was selected as the focal community outreach site as it has:
multiple public and private shoreline regions vulnerable to inundation and/or erosion;
multiple adaptation/habitat restoration projects in different phases of development to provide concrete situations as examples;
Public works hosts an annual; Open House in early spring each year, providing an existing structure to build from;
a range of development types vulnerable (small private residential lots, county roads, a county park, estate properties, etc.); and
existing strong relationships with FRIENDS (our Executive Director lives on Shaw and we have developed and implemented numerous shoreline restoration and education projects here over the past 15 years).
• Meeting planning (agenda, presenters/content, and participant survey) is underway with FRIENDS, San Juan County Engineer, Resource Media and Coastal Geologic Services. In addition, FRIENDS Director and Science Director met personally with four community ‘influencers’ on Shaw Island to solicit feedback and inform development of the meeting agenda, community engagement strategy and participant survey (which is planned to be conducted via live voting at the meeting and electronic follow-up for residents unable to attend. Survey and general meeting results will help inform final communication strategies.

Healthy Beaches for People and Fish:
Protecting shorelines from the impacts of armoring today and rising seas tomorrow
Sea Level Rise Vulnerability in San Juan County, Washington
Prepared by: A. J. MacLennan, J. F. Waggoner, J. W. Johannessen, and S. A. Williams, Coastal Geologic Services Inc.
Prepared for: Friends of the San Juans
October 2013

Healthy Beaches for People and Fish The goal of the Healthy Beaches for People and Fish: Protecting shorelines from the impacts of armoring today and rising seas tomorrow project is to improve the long-term protection of nearshore marine ecosystems by developing new technical tools and identifying management strategies that specifically address sea level rise and the cumulative impacts of shoreline armoring. The Healthy Beaches for People and Fish project was completed by Friends of the San Juans in partnership with Coastal Geologic Services, Salish Sea Biological and the Washington Department of Fish and Wildlife in 2014. Project approach and work was guided by a technical advisory group, which included representatives from The University of Washington, United States Geological Survey, Puget Sound Partnership, Skagit River Systems Cooperative, Samish Indian Nation, San Juan County Public Works, San Juan County Salmon Recovery Lead Entity, The Tulalip Tribes, Padilla Bay National Estuarine Research Reserve and the Washington State Departments of Ecology, Natural Resources and Fish and Wildlife. The project contained four distinct areas that informed management recommendations:
• A legal review of existing local, state and federal shoreline regulations and their ability to address sea level rise and cumulative impacts;
• Sea level rise vulnerability assessment for San Juan County;
• Forage fish spawning habitat research; and
• Surveys of coastal managers, regulators and researchers.
Reports and data products associated with this project can be found online at www.sanjuans.org/NearshoreStudies.htm and include: Friends of the San Juans. 2014. Healthy Beaches for People and Fish: Protecting shorelines from the impacts of armoring today and rising seas tomorrow. Final Report to WDFW and the U.S. EPA. Friday Harbor, Washington. Loring, K. 2013. Addressing Sea Level Rise and Cumulative Ecological Impacts in San Juan County Washington Through Improved Implementation and Effective Amendment of Local, State, and Federal Laws. Friends of the San Juans. Friday Harbor, Washington. MacLennan, A., J. Waggoner and J. Johannessen. 2013. Sea Level Rise Vulnerability Assessment for San Juan County, Washington. Prepared by Coastal Geologic Services for Friends of the San Juans. Whitman, T., D. Penttila, K. Krueger, P. Dionne, K. Pierce, Jr. and T. Quinn. 2014. Tidal elevation of surf smelt spawn habitat study for San Juan County Washington. Friends of the San Juans, Salish Sea Biological and Washington Department of Fish and Wildlife. Whitman, T. and S. Hawkins. 2013. The impacts of shoreline armoring on beach spawning forage fish habitat in San Juan County, Washington. Friends of the San Juans. Friday Harbor, Washington. This project has been funded in part by the United States Environmental Protection Agency under assistance agreement PC 00J29801 to Washington Department of Fish and Wildlife. The contents of this document do not necessarily reflect the views and policies of the Environmental Protection Agency, nor does mention of trade names or commercial products constitute endorsement or recommendation for use. Match funding for the project was provided by the Bullitt Foundation and the North Pacific Landscape Conservation Cooperative. In kind match provided by FRIENDS of the San Juans, Coastal Geologic Services, Salish Sea Biological and technical advisory group participants.

Sea Level Rise Vulnerability in San Juan County Final Report, Page i COASTAL GEOLOGIC SERVICES, INC.
Table of Contents
Table of Contents ........................................................................................................................................... i
Table of Tables .............................................................................................................................................. ii
Table of Figures ............................................................................................................................................ iii
Acronyms and Abbreviations ....................................................................................................................... vi
1.0 Introduction ............................................................................................................................................ 1
2.0 Background ............................................................................................................................................. 2
2.1 Coastal Erosion .................................................................................................................................... 3
2.2 Coastal Flooding .................................................................................................................................. 4
2.3 Coastline Response to SLR................................................................................................................... 5
2.4 SLR in San Juan County ........................................................................................................................ 9
2.5 Data Availability................................................................................................................................. 10
3.0 Methods ................................................................................................................................................ 11
3.1 Shore Change Analysis....................................................................................................................... 12
3.2 DSAS and Statistical Analysis ............................................................................................................. 14
3.3 Estimating the Future Position of the Shoreline ............................................................................... 15
4.0 Results ................................................................................................................................................... 18
4.1 Shore Change Analysis....................................................................................................................... 18
4.2 Transgression Model Outputs ........................................................................................................... 21
4.3 Vulnerable Infrastructure .................................................................................................................. 25
4.4 Policy Recommendations .................................................................................................................. 29
4.5 Data Interpretation and Intended Utility .......................................................................................... 31
5.0 Conclusions ........................................................................................................................................... 38
References .................................................................................................................................................. 39

Sea Level Rise Vulnerability in San Juan County Final Report, Page ii COASTAL GEOLOGIC SERVICES, INC.
Table of Tables
Table 1. Members of the TAG and the entities they represent. Tina Whitman of Friends of the San Juans managed the greater project. ....................................................................................................................... 2
Table 2. Shoretypes description, response to climate change and potential impacts................................. 3
Table 3. Moderate and high sea level rise projections by the National Research Council (NAS 2012).. ... 10
Table 4. Sampling design displaying shoreforms, stratification of shoreforms by exposure and orientation. ................................................................................................................................................. 13
Table 5. Descriptive statistics for change rates (ft/yr) across geomorphic shoreforms (1960‐2009). Negative numbers are the lowest rates, if less than zero represents erosion. .......................................... 19
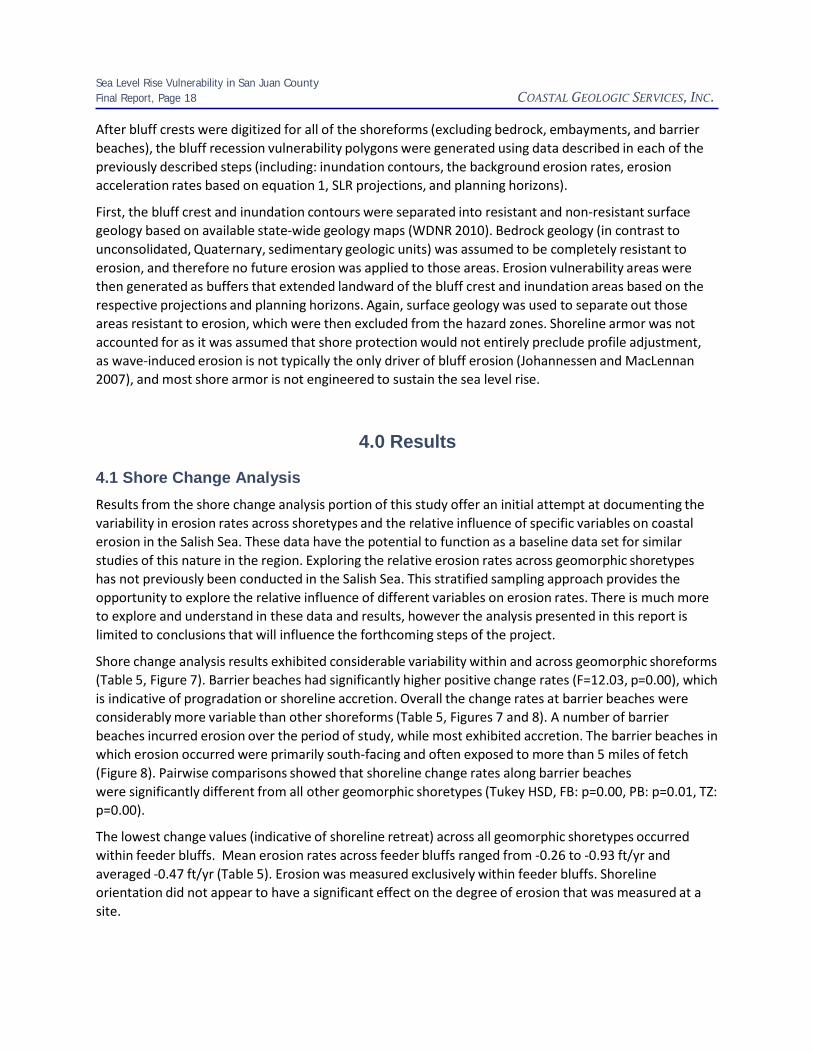
Table 6. Average change rates (ft/yr) of geomorphic shoretypes sorted by exposure category............... 21
Table 7. Decadal iterations of Equation 1 and resulting estimated feeder bluff erosion (ft) based on increasing SLR rates of various fetch categories and SLR scenarios (NAS 2012). ....................................... 21
Table 8. Final estimated erosion of shoreforms with short and long fetch for different SLR scenarios (moderate, high) and planning horizons (2050, 2100). .............................................................................. 22
Table 9. Length (in miles) of road vulnerable to inundation or erosion associated with SLR scenarios (moderate, high) and planning horizons (2050, 2100) in San Juan County. ............................................... 26
Table 10. Number of structures vulnerable to inundation or erosion associated with SLR scenarios (moderate, high) and planning horizons (2050, 2100) in San Juan County. ............................................... 27
Table 11. Number of structures vulnerable to inundation on SJC Islands associated with SLR scenarios (moderate, high) and planning horizons (2050, 2100) in San Juan County. ............................................... 28
Table 12. Number of structures vulnerable to erosion on SJC Islands associated with SLR scenarios (moderate, high) and planning horizons (2050, 2100) in San Juan County. ............................................... 28
Table 12. Variables, data sources, and descriptions of each type of error included in the error analysis. 34
Table 13. Variables, data sources, range of measured error and cumulative error measures. ................. 35
Table 14. Standard deviation of shore change rates across different shoretypes and exposure categories in San Juan County (1960‐2009). ................................................................................................................ 35
Table 15. Cumulative error margin for each shoretype and exposure category in San Juan County. ....... 35
Sea Level Rise Vulnerability in San Juan County Final Report, Page 3 COASTAL GEOLOGIC SERVICES, INC.
Table of Figures
Figure 1. Active cross‐shore beach profile geometry for derivation of the two‐dimensional Bruun Rule of beach erosion and Bruun Rule equation. ..................................................................................................... 7
Figure 2. Flow‐chart illustrating interactions of quasi‐three‐dimensional model (all lines) and a two‐ dimensional model ....................................................................................................................................... 8
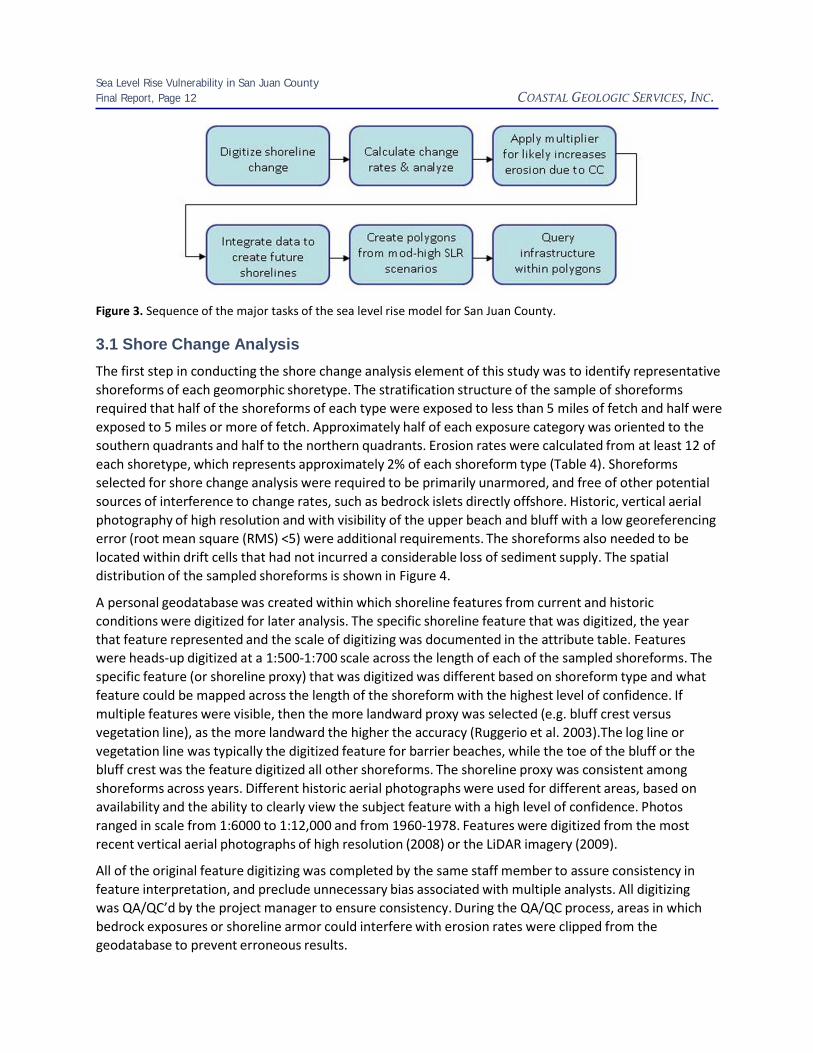
Figure 3. Sequence of the major tasks of the sea level rise model for San Juan County. .......................... 12
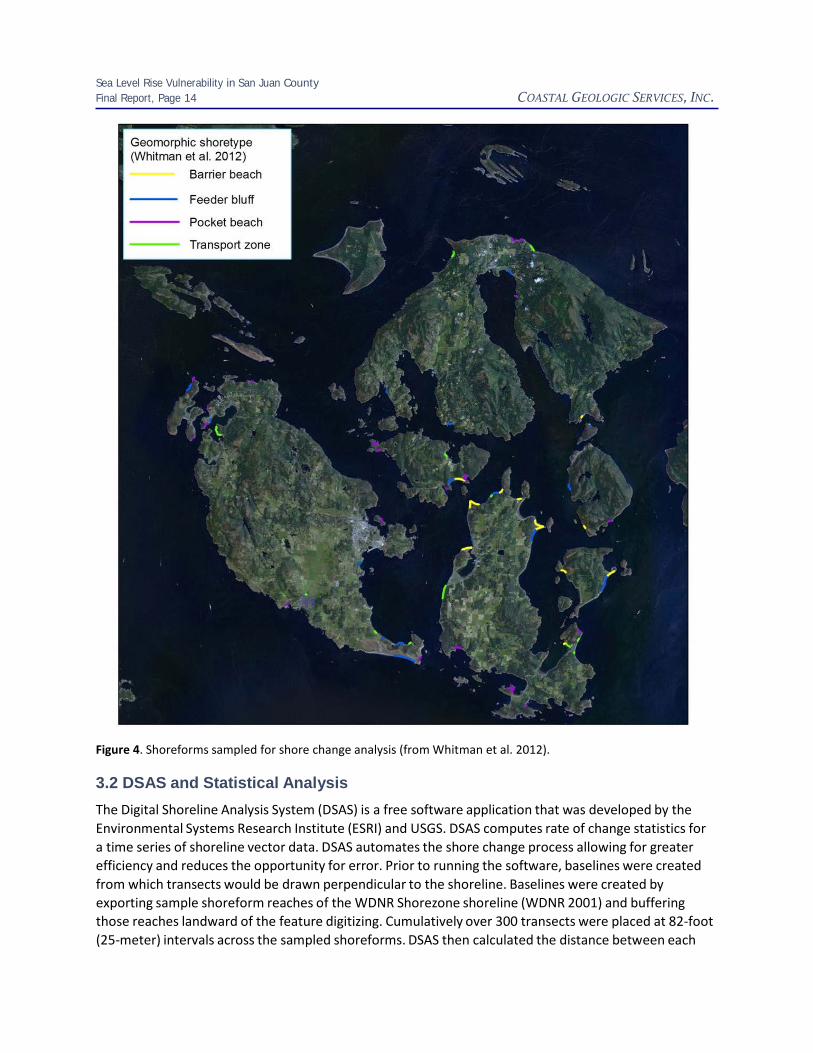
Figure 4. Shoreforms sampled for shore change analysis (from Whitman et al. 2012). ............................ 14
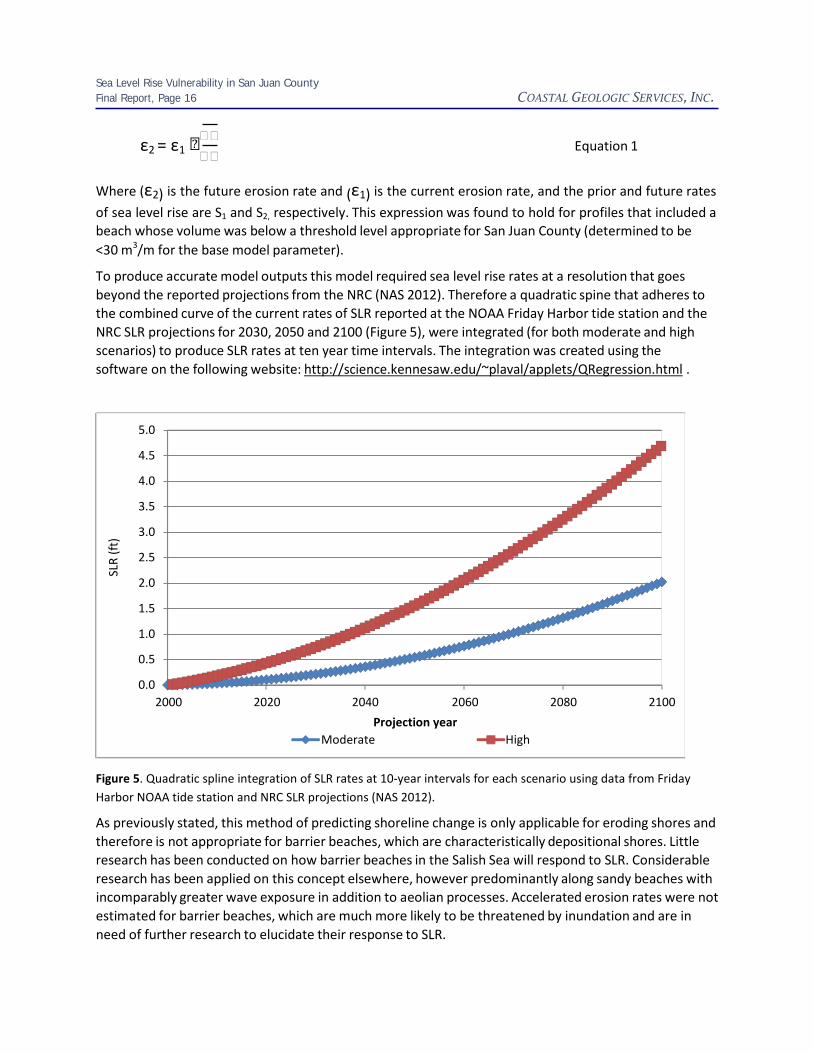
Figure 5. Quadratic spline integration of SLR rates at 10‐year intervals for each scenario using data from Friday Harbor NOAA tide station and NRC SLR projections (NAS 2012)..................................................... 16
Figure 6. Screen capture of bluff crest digitizing process. .......................................................................... 17
Figure 7. Minimum, maximum and average change rates across shoretypes. Minimum values represent the lowest change rates, which if less than zero represent erosion. ......................................................... 19
Figure 8. Average change rates within shoretypes of variable fetch and shore orientation. Values less than zero represent erosion or recession. .................................................................................................. 20
Figure 9. Average change rates of different shoretypes of different fetch categories. ............................. 20
Figure 10. Inundation mapping of northeast Lopez Island. ........................................................................ 23
Figures 11 & 12. Areas vulnerable to erosion and inundation on northwest Lopez Island in 2050, 2100. 24
Figure 13. Areas vulnerable to erosion and inundation on eastern Shaw Island across all scenarios and planning horizons........................................................................................................................................ 25
Figure 14. Roads vulnerable to erosion or inundation associated with SLR in San Juan County. .............. 26
Figure 15. Building types vulnerable to erosion or inundation. ................................................................. 29
Figure 16. Example of buffered error margins to erosion vulnerability for the moderate SLR scenario in 2050 for Fisherman’s Bay, Lopez Island, as found in project GIS geodatabase to facilitate communicating uncertainty in outreach efforts................................................................................................................... 36
Figure 17. Example of buffered error margins to erosion vulnerability for the high SLR scenario in 2100 for Fisherman’s Bay, Lopez Island, as found in project GIS geodatabase to facilitate communicating uncertainty in outreach efforts................................................................................................................... 37

Sea Level Rise Vulnerability in San Juan County Final Report, Page 4 COASTAL GEOLOGIC SERVICES, INC.
Glossary
Accretion The gradual addition of sediment to a beach or to marsh surface as a result of deposition by flowing water or air. Accretion leads to increases in the elevation of a marsh surface, the seaward building of the coastline, or an increase in the elevation of a beach profile (the opposite of erosion) (Shipman 2008).
Adaptation The adjustment of natural or human systems in response to actual or expected phenomena or their effects such that it minimizes harm and/or takes advantage of beneficial opportunities.
Adaptive capacity A community’s ability to respond to actual or expected phenomena or their effects, including the moderation of potential damages caused by them, taking advantage of opportunities presented by them, and coping with the consequences associated with them.
Anthropogenic Caused or produced by humans.
Backshore The upper zone of a beach beyond the reach of normal waves and tides, landward of the beachface. The backshore is subject to periodic flooding by storms and extreme tides, and is often the site of dunes and back‐barrier wetlands (Clancy et al. 2009).
Barrier beach A linear ridge of sand or gravel extending above high tide, built by wave action and sediment deposition seaward of the original coastline. Includes a variety of depositional coastal landforms, including spits, tombolos, cuspate forelands, and barrier islands (Shipman 2008).
Beach The gently sloping zone of unconsolidated sediment along the shoreline that is moved by waves, wind, and tidal currents (Shipman 2008).
Bluff A steep bank or slope rising from the shoreline, generally formed by erosion of poorly consolidated material such as glacial or fluvial sediments (Shipman 2008).
Conceptual model A model, either numerical or diagrammatic, that summarizes and describes the relationships and interactions between specified model components.
Drift cell A littoral [drift] cell is a coastal compartment that contains a complete cycle of sedimentation including sources, transport paths, and sinks. The cell boundaries delineate the geographical area within which the budget of sediment is balanced, providing the framework for the quantitative analysis of coastal erosion and accretion. See Johannessen and MacLennan (2007) for further description of drift cells.
Embayment An indentation of the shoreline larger in size than a cove but smaller than a gulf.
Equilibrium profile A “statistical average beach profile’ which maintains its form apart from fluctuations including seasonal effects at a particular water level.
Erosion The wearing away of land by the action of natural forces. On a beach, the
carrying away of beach material by wave action, tidal currents, littoral currents,
Sea Level Rise Vulnerability in San Juan County Final Report, Page 5 COASTAL GEOLOGIC SERVICES, INC.
or deflation (wind action) (opposite of accretion) (Shipman 2008).
Habitat The physical, biological, and chemical characteristics of a specific unit of the environment occupied by a specific plant or animal. Habitat is unique to specific organisms and provides all the physical, chemical and biological requirements of that organism within a specific location (Fresh et al. 2004).
Longshore transport Transport of sediment parallel to the shoreline by waves and currents (Shipman 2008).
Morphology The shape or form of the land surface or of the seabed and the study of its change over time (Clancy et al. 2009).
Progradation Occurs on a shoreline that is being built forward or outward into a sea or lake by deposition and accumulation as in a delta.
Protection Safeguarding ecosystems or ecosystem components from harm caused by human actions.
Resilience The ability of an entity or system to absorb some amount of change, including extreme events, and recover from or adjust easily to the change or other stress.
Risk A combination of the magnitude of the potential consequence(s) of climate change impact(s) and the probability or likelihood that the consequences will occur. The magnitude of the potential consequence(s) is the result of the climate change impact(s) and the system’s vulnerability to the changes.
Sediment transport Bedload and suspended transport of sediments and other matter by water and wind along (longshore) and across (cross‐shore) the shoreline. The continuity of sediment transport strongly influences the longshore structure of beaches.
Sediment Input Delivery of sediment from bluff, stream, and marine sources into the nearshore. Depending on landscape setting, inputs can vary in scale from acute, low‐ frequency episodes (hillslope mass wasting from bluffs) to chronic, high‐ frequency events (some streams and rivers). Sediment input interacts with sediment transport to control the structure of beaches.
Shoreform A term often used in Puget Sound to describe a coastal landform. The term is generally used to describe landscape features on the scale of hundreds to thousands of meters, such as coastal bluffs, estuaries, barrier beaches, or river deltas.
Vulnerability The degree to which a system is susceptible to, or unable to cope with, adverse effects of climate change, including climate variability and extremes. Vulnerability is a function of the character, magnitude, and rate of climate variation to which a system is exposed, its sensitivity, and its adaptive capacity.
Vulnerability assessment
Risk‐based evaluation of the likely sensitivity and response capacity of natural and human systems to the effects of expected phenomena..

Sea Level Rise Vulnerability in San Juan County Final Report, Page 6 COASTAL GEOLOGIC SERVICES, INC.
Acronyms and Abbreviations
BAB barrier beach CC climate change CGS Coastal Geologic Services DEM digital elevation model DOE Washington Department of Ecology FOSJ Friends of the San Juans GIS geographic information systems HOWL highest observed water level IPCC intergovernmental panel on climate change LWD large woody debris MHHW mean higher high water MHW mean high water MLLW mean lower low water NA not applicable NAD no appreciable drift NRC National Research Council PB pocket beach PSNERP Puget Sound Nearshore Ecosystem Restoration Project SCAPE soft cliff and platform erosion SMP Shoreline Master Program SLR sea level rise SJC San Juan County TAG technical advisory group USGS United States Geological Survey VLM vertical land movement WDFW Washington Department of Fish and Wildlife WDNR Washington Department of Natural Resources (also noted as DNR) USFWS United States Fish and Wildlife Service
Sea Level Rise Vulnerability in San Juan County Draft Report, Page 1 COASTAL GEOLOGIC SERVICES, INC.
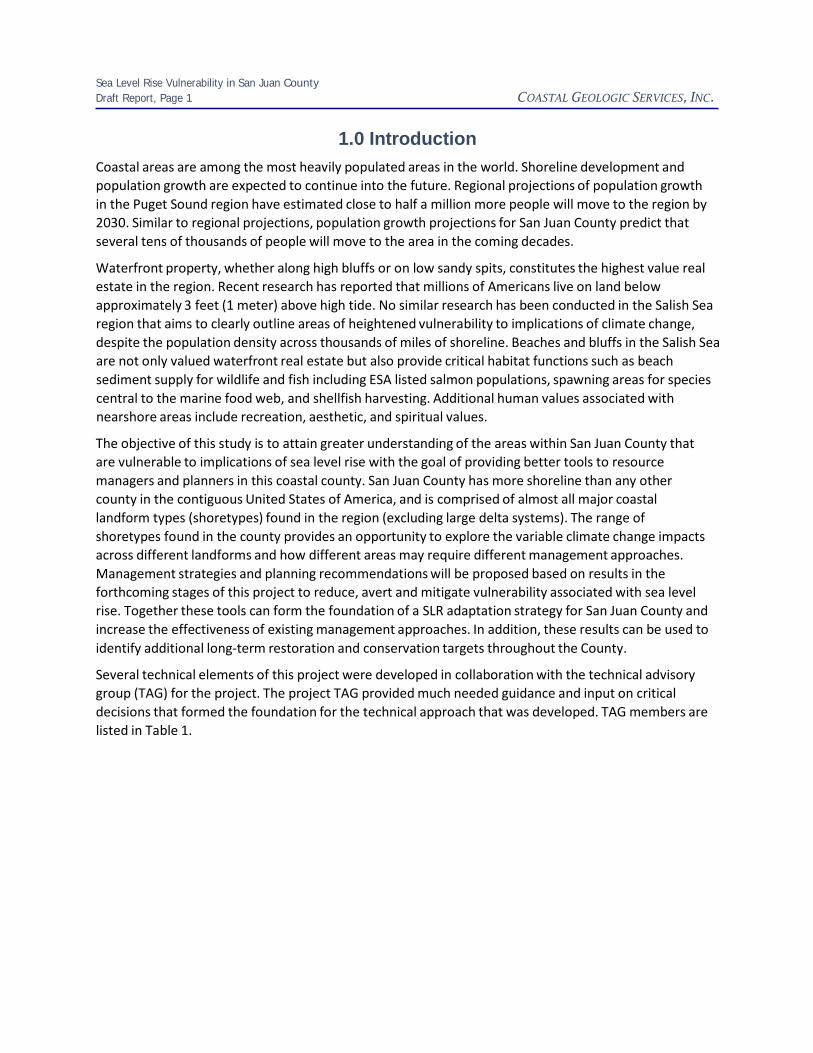
1.0 Introduction
Coastal areas are among the most heavily populated areas in the world. Shoreline development and population growth are expected to continue into the future. Regional projections of population growth in the Puget Sound region have estimated close to half a million more people will move to the region by 2030. Similar to regional projections, population growth projections for San Juan County predict that several tens of thousands of people will move to the area in the coming decades.
Waterfront property, whether along high bluffs or on low sandy spits, constitutes the highest value real estate in the region. Recent research has reported that millions of Americans live on land below approximately 3 feet (1 meter) above high tide. No similar research has been conducted in the Salish Sea region that aims to clearly outline areas of heightened vulnerability to implications of climate change, despite the population density across thousands of miles of shoreline. Beaches and bluffs in the Salish Sea are not only valued waterfront real estate but also provide critical habitat functions such as beach sediment supply for wildlife and fish including ESA listed salmon populations, spawning areas for species central to the marine food web, and shellfish harvesting. Additional human values associated with nearshore areas include recreation, aesthetic, and spiritual values.
The objective of this study is to attain greater understanding of the areas within San Juan County that are vulnerable to implications of sea level rise with the goal of providing better tools to resource managers and planners in this coastal county. San Juan County has more shoreline than any other county in the contiguous United States of America, and is comprised of almost all major coastal landform types (shoretypes) found in the region (excluding large delta systems). The range of shoretypes found in the county provides an opportunity to explore the variable climate change impacts across different landforms and how different areas may require different management approaches. Management strategies and planning recommendations will be proposed based on results in the forthcoming stages of this project to reduce, avert and mitigate vulnerability associated with sea level rise. Together these tools can form the foundation of a SLR adaptation strategy for San Juan County and increase the effectiveness of existing management approaches. In addition, these results can be used to identify additional long‐term restoration and conservation targets throughout the County.
Several technical elements of this project were developed in collaboration with the technical advisory group (TAG) for the project. The project TAG provided much needed guidance and input on critical decisions that formed the foundation for the technical approach that was developed. TAG members are listed in Table 1.

Sea Level Rise Vulnerability in San Juan County Final Report, Page 2 COASTAL GEOLOGIC SERVICES, INC.
Table 1. Members of the TAG and the entities they represent. Tina Whitman of Friends of the San Juans managed the greater project.
Last Name
First Name
Entity
Shipman
Hugh
Shoreline Geologist, WA State Department of Ecology
Grossman
Eric
Geologist, USGS
Williams
Terry
Tulalip Tribes
Mumford
Tom
Marine Biologist, DNR
Dethier
Megan
University of Washington Friday Harbor Labs
Lowry
Dayv
WDFW
Wenger
Barry
Shoreline Policy and Planning
Walsh
Stan
Skagit River System Co-op
Hardison
Prescott
Tulalip Tribes
Shull
Suzanne
Padilla Bay National Estuarine Research Reserve
Rawson
Kit
Tulalip Tribes
Rosenkotter
Barbara
WRIA 2 Salmon Recovery
Vekved
Dan
San Juan County Public Works Engineer
2.0 Background
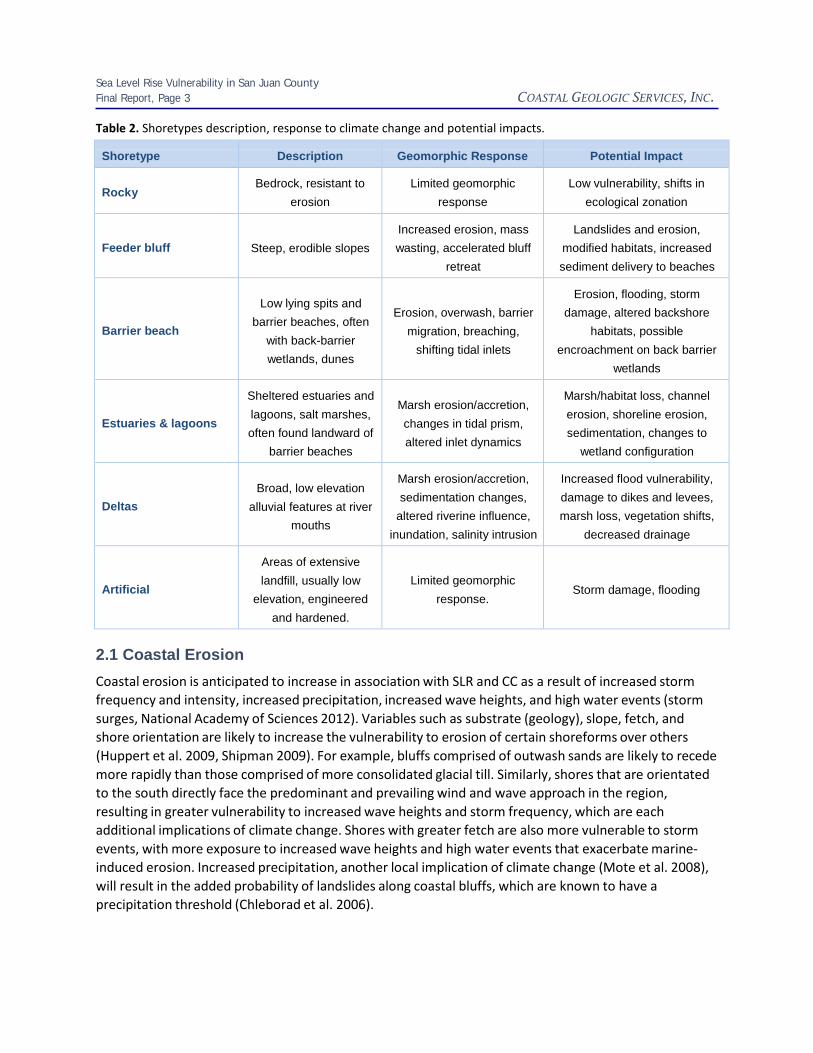
Sea level rise will produce a range of impacts from increased erosion of coastal bluffs, the inundation of low lying coastal areas, and the landward translation of beach profiles, among other impacts (Huppert et al. 2009). San Juan County is comprised of a wide variety of shoretypes (also referred to as shoreforms) which will respond to the rise in sea level in different ways. Certain shoretypes are likely to be more vulnerable to erosion, others to inundation, and some will be vulnerable to both. Certain shoretypes, such as plunging bedrock shores, are unlikely to incur considerable impacts outside of a vertical rise in the mean high water mark. Table 2 displays the projected risk by shoretype for the shoretypes that occur in San Juan County (adapted from Shipman 2009).
Sea Level Rise Vulnerability in San Juan County Final Report, Page 3 COASTAL GEOLOGIC SERVICES, INC.
Table 2. Shoretypes description, response to climate change and potential impacts.
Shoretype
Description
Geomorphic Response
Potential Impact
Rocky
Bedrock, resistant to
erosion
Limited geomorphic
response
Low vulnerability, shifts in
ecological zonation
Feeder bluff
Steep, erodible slopes
Increased erosion, mass wasting, accelerated bluff
retreat
Landslides and erosion,
modified habitats, increased sediment delivery to beaches
Barrier beach
Low lying spits and
barrier beaches, often with back-barrier wetlands, dunes
Erosion, overwash, barrier migration, breaching,
shifting tidal inlets
Erosion, flooding, storm
damage, altered backshore habitats, possible
encroachment on back barrier wetlands
Estuaries & lagoons
Sheltered estuaries and lagoons, salt marshes, often found landward of
barrier beaches
Marsh erosion/accretion, changes in tidal prism, altered inlet dynamics
Marsh/habitat loss, channel erosion, shoreline erosion, sedimentation, changes to
wetland configuration
Deltas
Broad, low elevation
alluvial features at river mouths
Marsh erosion/accretion, sedimentation changes,
altered riverine influence, inundation, salinity intrusion
Increased flood vulnerability, damage to dikes and levees, marsh loss, vegetation shifts,
decreased drainage
Artificial
Areas of extensive landfill, usually low
elevation, engineered and hardened.
Limited geomorphic response.
Storm damage, flooding
2.1 Coastal Erosion
Coastal erosion is anticipated to increase in association with SLR and CC as a result of increased storm frequency and intensity, increased precipitation, increased wave heights, and high water events (storm surges, National Academy of Sciences 2012). Variables such as substrate (geology), slope, fetch, and shore orientation are likely to increase the vulnerability to erosion of certain shoreforms over others (Huppert et al. 2009, Shipman 2009). For example, bluffs comprised of outwash sands are likely to recede more rapidly than those comprised of more consolidated glacial till. Similarly, shores that are orientated to the south directly face the predominant and prevailing wind and wave approach in the region, resulting in greater vulnerability to increased wave heights and storm frequency, which are each additional implications of climate change. Shores with greater fetch are also more vulnerable to storm events, with more exposure to increased wave heights and high water events that exacerbate marine‐ induced erosion. Increased precipitation, another local implication of climate change (Mote et al. 2008), will result in the added probability of landslides along coastal bluffs, which are known to have a precipitation threshold (Chleborad et al. 2006).

Sea Level Rise Vulnerability in San Juan County Final Report, Page 4 COASTAL GEOLOGIC SERVICES, INC.
Coastal erosion is a natural process that occurs along coastlines throughout the world. Each coastal landform type exhibits different forms and rates of erosion based on local drivers, such as beach and upland substrate composition and geology. Coastal bluffs and cliffs are typically classified as erosional landform types where erosion is driven primarily by sea level rise, large storms, and wave energy.
Bluffs typically recede through a combination of (bluff) toe erosion and subsequent mass wasting (commonly referred to as landslides). The effect of surface water and groundwater often exacerbates (Gerstel et al. 1997) bluff instability and triggers landslides. The rate at which a bluff retreats is dependent on several interacting variables (Shipman 2004). First order factors include climate and sea level rise. Second order drivers of erosion are more site‐specific and are commonly categorized as marine, subaerial or human induced erosion. Each driver of erosion may occur independently or simultaneously upon the bluff throughout time (Johannessen and MacLennan 2007). Marine‐induced erosion is the dominant type of erosion along coastal bluffs, which works in combination with bluff geology to shape the overall bluff profile. Bluff recession results in the landward migration of the shoreline which commonly results in structures becoming closer in proximity to the bluff crest and shoreline, often putting them at greater risk than either owners or insurers recognize. The Heinz Center (2000) estimated that over the next 60 years, erosion may claim one out of four houses within 500 feet of the shoreline. To the homeowners living within this narrow strip, the risk posed by erosion is comparable to the risk from flooding along low lying shores.
Coastal bluff retreat tends to be episodic, with much of the long‐term bluff failure taking place during a few severe storm events that occur every 15‐40 years (Johannessen and MacLennan 2007). The arrival of storm waves concurrent with higher high tides, along with elevated water level due to low atmospheric pressure associated with storm fronts is a common cause of bluff toe erosion. However, it is often major precipitation events which trigger or cause mass wasting events (Tubbs 1974). The combination of these conditions commonly occurs during major El Nino events and over extended periods (months) can result in dramatic coastal erosion throughout the region (Chleborad et al. 2006, Johannessen and MacLennan 2007, Russell and Griggs 2013). The frequency of El Nino events are likely to increase as an additional implication of climate change.
Although long‐term bluff retreat rates are low for most San Juan County shores, the episodic nature of bluff retreat can lead to considerable instantaneous recession, followed by little change for several decades. Therefore short‐term recession rates should be viewed with caution and are often a source of fear to new owners of coastal bluff properties. Little data is available on the variable retreat rates of bluffs throughout the Salish Sea and San Juan County.
2.2 Coastal Flooding
As sea levels rise, the lowest lying areas will be regularly flooded by high tides. This gradual process of sea level rise exhibits considerable spatial variability due the combined effects of global (eustatic) sea level rise and vertical land movement (isostatic uplift or subsidence), the net effect of which is referred to as relative sea level rise.
Relative sea level rise in Washington is variable due to spatial variability in vertical land movement throughout the state. Western Washington sits on the western edge of the North American continental plate which is converging with the (subducting) Juan de Fuca oceanic plate. This subduction zone, commonly referred to as the Cascadia subduction zone, generates many of the region’s largest
Sea Level Rise Vulnerability in San Juan County Final Report, Page 5 COASTAL GEOLOGIC SERVICES, INC.
earthquakes and far more subtle, locally variable vertical land movement. The northwestern Olympic Peninsula is gradually uplifting, while south Puget Sound gradually subsides. San Juan County is located at the hinge point between these two contrasts resulting in minimal vertical land movement. Therefore local relative sea level rise rates in San Juan County are anticipated to be in line with global (eustatic) sea level rise rates.
Water levels in San Juan County are variable at time scales ranging from daily tides (spring tide range of approximately 12 ft) to decadal cycles (El Nino – Southern Oscillation, Shipman 2009). Elevated mean sea level occurs several times a year, but is consistently much higher during El Nino events (on the order of 0.5 – 1 ft or more). Shipman reports that a one foot rise in water level leads to an increase in the number of high water events at a given elevation by roughly an order of magnitude, turning a 10‐year event into an annual event, or a 100‐year event into a 10‐year event.
Inundation of low lying coastal areas is likely to occur episodically in association with storms that coincide with high water events (storm surges). These will be determined by factors largely unrelated to climate change – for example, the joint probability of large wave‐producing wind storms and unusually high astronomic tides (Shipman 2009). Events such as this would result in overtopping of spits and barriers by wave run‐up, the increased likelihood of breaches or formation of new tide channels and barriers, the erosion of high marsh by wave action, and the inundation of low lying areas (Shipman 2009). Changes in the seasonal pattern of rainfall or increased peak run‐off from snow melt could exacerbate flooding near rivers and streams (Huppert et al. 2009).
An increase in maximum wave heights has been documented along the coast of Washington and Oregon (Ruggerio and Allen 2010). It is unlikely that this trend will result in a change in wave regime within the more protected shores of San Juan County. The west shore of San Juan Island and the south shore of Lopez Island are the only areas in which ocean swell persists and where increased wave height associated with climate change is likely to occur.
2.3 Coastline Response to SLR
Coastal response to SLR has been a complex and intriguing area of research in the field of coastal geomorphology since the 1960s. More recently, the widespread acceptance of the acceleration of sea level rise and anthropogenic climate change by scientists has led to concern worldwide. Planners and managers in coastal countries are developing a wide range of approaches to address these issues. Leatherman (1990) and Cooper and Pilkey (2007) stressed that understanding shoreline response to sea level rise is essential to inform policy makers, the coastal management community, and stakeholders (Defeo et al. 2009). The following section is comprised of a brief review of different approaches that have been used to understand how shorelines will respond to sea level rise and an analysis of which approach(es) would be appropriate for application or could inform the tools developed as part of this effort.
Several different approaches ranging from models to indices have been developed and applied at a range of scales to assess the vulnerability and response of different shores to sea level rise. Because coastal systems operate on a range of scales in space and time, understanding coastal response to SLR clearly requires an appropriate scale of investigation. The spatial scale of the most commonly applied models range from countywide assessments of variable resolution, to high‐resolution site‐specific modeling. The level of detail applied in each study is typically a function of data availability and the

Sea Level Rise Vulnerability in San Juan County Final Report, Page 6 COASTAL GEOLOGIC SERVICES, INC.
purpose of the study. Most models incorporate some measure of background (historic) retreat rates, topography (LiDAR), and regional SLR projections. Higher resolution models might also include shoretype (shoreline classification), geology (bluff lithology), wave data, bathymetry, and rate of sea level rise. Although site‐specific, high resolution models are not appropriate for use in this study due to the county‐wide scale and data limitations, however the fundamental principles and relationships driving the models can shed light on the most relevant variables to incorporate into this study.
The Bruun Rule (Bruun 1962, Schwartz 1967) has long been used to predict the effects of sea level rise on coastal recession. Based on conservation of mass principles, the Bruun model is used to predict the horizontal translation of the shoreline associated with a given rise in sea level. It provides a plausible process through which sea level rise may drive beach erosion. Its application has been the subject of considerable debate as it has several limitations and fundamental assumptions. The Bruun Rule assumes that the observed shoreline recession is controlled primarily by SLR and is not subsumed by other factors such as reduced sediment supply (Cooper and Pilkey 2007, Davidson‐Arnott 2005). The Bruun Rule has been adapted by several researchers (Figure 1) to better predict SLR and account for additional variables or limitations in the assumptions (Dean 1990, Davidson‐Arnott 2005, Leatherman, Zhang and Douglas 2000, Zhang, Douglas and Leatherman 2004, Stive 2004, Esteves et al. 2009, and Lymbery, Wisse, and Newton 2007) and generally includes the following assumptions:
• a two dimensional, equilibrium profile • sandy substrate • height and limit of the onshore boundary (of the beach profile) should not include any
significant change or increase in the elevation • does not account for cross‐shore or alongshore sediment transport • shoreline recession is controlled primarily by SLR and is not subsumed by other factors such as
reduced sediment supply (Cooper and Pilkey 2007 and Davidson‐Arnott 2005)
An adapted Bruun model (Nicholls 1998) was recently applied to several pocket beaches along the west shore of San Juan Island (Grilliot 2009). The SLR projections used in this application were from the IPCC’s Fourth Assessment Report and are now considered to be outdated as they under‐estimate future SLR. Results showed only the high sea level rise scenario will result in large transgression and erosion of the backshore. Data limitations, resource constraints, and the model’s assumptions preclude appropriate application of the Bruun Rule throughout San Juan County.

Sea Level Rise Vulnerability in San Juan County Final Report, Page 7 COASTAL GEOLOGIC SERVICES, INC.
Figure 1. Active cross‐shore beach profile geometry for derivation of the two‐dimensional Bruun Rule of beach erosion and Bruun Rule equation. DB is the elevation of the shore above sea level, DC is the depth of closure, a is the rise of sea level, and l is the distance from the shore to the ‘closure point’ (Schwartz 1967).
Many studies have projected beach response to sea level rise by integrating historic trends derived from air photo analysis with SLR projections. One approach developed by Leatherman (1990) and recently (built upon and) applied to the coast of California (Revell et al. 2011) links shoreline response with historic trends and local sea level change during a specified time period (e.g. through 2100). Historic trends were integrated into Revell et al.’s work from Hapke and Reid (2007) and other rigorous studies of erosion along the coast of California. Change rates were classified by shoreline type, wave exposure and other variables (e.g. bluff lithology). Additionally, a general hypothesis based on the relationship between SLR and shoreline recession is proposed and applied as a multiplier; therefore this model accounts for inherent variability in shoreline response based on differing coastal processes, sedimentary environments and exposure (Leatherman 1990). For some cases shoreline change rates were multiplied by the ratio between the historic and projected SLR rates.
Another commonly applied approach is the Coastal Vulnerability Index (CVI). This index incorporates six variables into the Index score, which rates the relative vulnerability of a reach of shore to SLR. The variables include geomorphic shoretype, coastal slope, relative SLR rate, erosion or accretion rate, mean tidal range, and mean wave height. This model has been applied at a very coarse resolution to much of the coast of the United States by the US Geologic Survey (Hammar‐Klose and Thieler 2001). The rates of shore change were based on dated, low resolution data sets. The study area did not include most of the

Sea Level Rise Vulnerability in San Juan County Final Report, Page 8 COASTAL GEOLOGIC SERVICES, INC.
shores of the Salish Sea and appeared to stop west of Dungeness Spit in the Strait of Juan de Fuca, thereby excluding San Juan County.
Sea level rise inundation models are commonly applied using the “bathtub model” or “single‐value surface model”, whereby digital elevation data (typically LiDAR data) and tidal surfaces are used to create future shorelines representing different SLR projections. This type of mapping has only two variables, the inundation level and the ground elevation. Upland slope is the controlling variable. This method is preferred for immobile substrates such as rocky or armored shorelines, especially along sheltered coasts with very low wave energy (Leatherman 1990). This method has been applied as part of several efforts to understand SLR implications in the Salish Sea including MacLennan et al. (2010), Glick et al. (2007), Peterson (2007), and City of Seattle Public Works (2012), among others.
Recently a geomorphologic model, SCAPE (Soft‐Cliff and Platform Erosion), was developed, which provides mesoscale outputs for informed coastal management (Figure 2, Walkden and Hall 2005, Dickson et al. 2007, and Walkden and Hall 2011). This processed‐based numerical model incorporates feedback mechanisms (such as colluvium buffering wave attack or decreasing slope resulting in less recession), which enables dynamic equilibrium forms to emerge and brings model stability (Dickson et al. 2007). Similarly, positive feedback also exists such as where the beach profile is excessively steep, positive feedback drives change toward more gentle slopes again (Walkden and Hall 2011). The model is designed for beaches with a low volume of sediment; on the order of 30 m3/m or less, which is generally the case for San Juan County shores.
Figure 2. Flow‐chart illustrating interactions of quasi‐three‐dimensional model (all lines) and a two‐dimensional model (solid lines only, Walkden and Hall 2011).
Analyses of SCAPE model results have documented a strong relationship between the rates of bluff retreat and SLR. SCAPE model outputs differ from those of the Bruun model, which proposes an equilibrium profile that is migrated upward and landward, maintaining its shape relative to still water.

Sea Level Rise Vulnerability in San Juan County Final Report, Page 9 COASTAL GEOLOGIC SERVICES, INC.
The SCAPE model outputs result in new equilibrium profiles that become increasingly steep under higher rates of SLR. Increased beach slope can be explained by the zone of wave attack moving landward faster than the beach can equilibrate under drastically accelerated SLR (Ashton et al. 2011, Walkden and Hall 2011). Where a bluff is present lesser areas of the beach are available to be flattened by wave action, resulting in profile steepening (Ashton et al. 2011). These results are not contradictory, but show the assumption of an unchanging equilibrium form under drastically accelerated SLR may be unrealistic for bluffs that are resistant enough to erosion and mass wasting that recession cannot keep pace with rapid SLR (Walkden and Hall 2011). However, the bluffs are locally less resistant to erosion then those of most European and other areas researched. The geology of the majority of the lower bluffs in San Juan County would likely not hinder profile adjustment; however there is little data on this topic.
In contrast to the Bruun model, the SCAPE model predicts that in the absence of SLR the bluff will recede at a lower velocity while the Bruun model suggests that no coastal recession will occur. The SCAPE model assumes that time required for the beach profile to reach equilibrium is associated with the rate of sea level rise. Although that time required for the new equilibrium profile to form may also be dependent on storm frequency and time lags in shore response are likely to occur (Walkden and Hall 2011, Ashton et al. 2011, Brunsden 2001). Comparison of SCAPE predictions with those made using the modified Bruun Rule show that SCAPE predicts a complex suite of responses and lower overall sensitivity of soft‐rock shores to SLR (Dickson et al. 2007).
The Scientific Committee on Ocean Research (SCOR ) Working Group 89 (1991) recommended a number of guidelines for use when employing coastline response models. SCOR (1991) suggested an application of an order‐of‐magnitude assessment to the model output; meaning that results of the model are not absolute. As with any predictive model, error associated with each variable incorporated into the model calculations can be compounded or magnified in the final outputs.
2.4 SLR in San Juan County
Data A number of oceanographic and meteorlogical processes can elevate regional sea level leading to high water events and coastal flooding. El Ninos, low atmospheric pressure, and storm surge caused by strong wave forcing in enclosed areas can all elevate sea levels above the standard tidal range for hours to months. Recorded water level data shows eight extreme high water events that exceeded the 10% annual exceedance probability levels at the Friday Harbor NOAA tide station (station 9449880, benchmark sheet published 2003). Storm and high water events are likely to result in the greatest flooding and inundation hazards to coastal communities, rather than the more gradual long term rise in sea level (Russell and Griggs 2013). Mean higher high water (MHHW) at Friday Harbor is +7.76 ft MLLW. The highest observed water level at Friday Harbor was measured at 3.4 ft above MHHW or + 11.1 ft MLLW. However, this is a still water level and does not account for wave run‐up.
A recent guidance document for assessing SLR vulnerability recommended assessing regional sea level trends from the closest tide gauge. The Friday Harbor station, run by NOAA records, indicates a relative rise in sea level of 1.13 mm/yr with a 95% confidence interval of +/‐ 0.33 mm/yr between 1937 and 2006. This is equivalent to a change of 0.37 ft in 100 years. This is only slightly lower than global SLR trends as tide gauge measures have documented a 1.7 mm/yr (+/‐ 0.5) rise in sea level. These data contrast more recent SLR measures from satellite altimetry since 1993, which shows an increased rise to 3.1 mm/yr.
Sea Level Rise Vulnerability in San Juan County Final Report, Page 10 COASTAL GEOLOGIC SERVICES, INC.
SLR Projections A recent review of regional sea level rise projections was reported by the National Research Council for the coasts of California, Oregon, and Washington (National Academy of Science 2012). Standard projections and ranges were reported to capture the range of model outputs from multiple emissions scenarios across three planning horizons; 2030, 2050, and 2100.
The NRC projections are generally rooted in IPCC projections based on multiple numerical models forced by different emission scenarios, as well as simple climate models. IPCC data was augmented, updated and applied to the Pacific Coast the by the NRC and included the following refinements:
• local steric and wind‐driven contributions to SLR were estimated using general circulation models,
• the land ice contribution was adjusted for gravitational and deformational effects and extrapolated,
• sea level finger printing, and • contributions from VLM data (at the state scale) estimated.
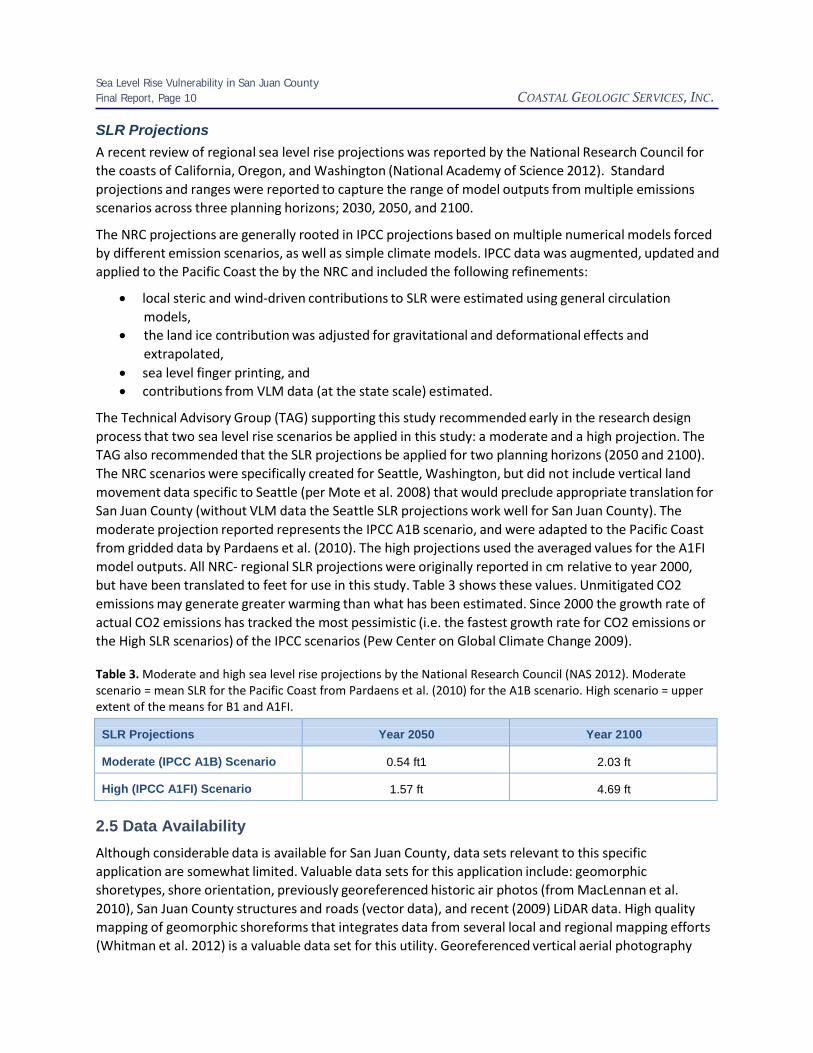
The Technical Advisory Group (TAG) supporting this study recommended early in the research design process that two sea level rise scenarios be applied in this study: a moderate and a high projection. The TAG also recommended that the SLR projections be applied for two planning horizons (2050 and 2100). The NRC scenarios were specifically created for Seattle, Washington, but did not include vertical land movement data specific to Seattle (per Mote et al. 2008) that would preclude appropriate translation for San Juan County (without VLM data the Seattle SLR projections work well for San Juan County). The moderate projection reported represents the IPCC A1B scenario, and were adapted to the Pacific Coast from gridded data by Pardaens et al. (2010). The high projections used the averaged values for the A1FI model outputs. All NRC‐ regional SLR projections were originally reported in cm relative to year 2000, but have been translated to feet for use in this study. Table 3 shows these values. Unmitigated CO2 emissions may generate greater warming than what has been estimated. Since 2000 the growth rate of actual CO2 emissions has tracked the most pessimistic (i.e. the fastest growth rate for CO2 emissions or the High SLR scenarios) of the IPCC scenarios (Pew Center on Global Climate Change 2009).
Table 3. Moderate and high sea level rise projections by the National Research Council (NAS 2012). Moderate scenario = mean SLR for the Pacific Coast from Pardaens et al. (2010) for the A1B scenario. High scenario = upper extent of the means for B1 and A1FI.
SLR Projections
Year 2050
Year 2100
Moderate (IPCC A1B) Scenario
0.54 ft1
2.03 ft
High (IPCC A1FI) Scenario
1.57 ft
4.69 ft
2.5 Data Availability
Although considerable data is available for San Juan County, data sets relevant to this specific application are somewhat limited. Valuable data sets for this application include: geomorphic shoretypes, shore orientation, previously georeferenced historic air photos (from MacLennan et al. 2010), San Juan County structures and roads (vector data), and recent (2009) LiDAR data. High quality mapping of geomorphic shoreforms that integrates data from several local and regional mapping efforts (Whitman et al. 2012) is a valuable data set for this utility. Georeferenced vertical aerial photography
Sea Level Rise Vulnerability in San Juan County Final Report, Page 11 COASTAL GEOLOGIC SERVICES, INC.
covers a large portion of the county at scales ranging from 1:6,000‐1:12,000. Structure and road vector data created by San Juan County Public Works Department can be used to identify threatened infrastructure. LiDAR data is available for much of the county from 2009.
Several data limitations exist that precluded the application of a more detailed transgression model. These data shortages include: wave data, higher resolution geologic mapping, complete LiDAR coverage flown at a low tidal height, and bathymetric data. There is a general absence of wave data for much of the Puget Sound/Salish Sea region. Wave data could help develop a model that would account for wave run‐up, although some might argue that run‐up is not a major driver of beach morphology in the fetch‐ limited environment of San Juan County. A fetch model was created for this project, and the outputs were linked with shoreform mapping. Geology mapping for San Juan County is coarse (1:100,000) and only represents surface geology. Surface geology is typically not consistent with the geology of the base of the bluff or overall bluff stratigraphy, both of which are relevant to bluff recession rates. Higher resolution geology data could also aid in the identification of pocket beaches (and other shoretypes) that may be naturally limited in their ability to transgress due to bedrock exposures. The current LiDAR data set does not include the northernmost portion of the County, and omits Stuart, Johns, and Waldron Islands. In addition, it was flown at a tidal height that precluded slope measures across approximately half of the county shores. Bathymetric mapping (multibeam sonar) in combination with wave data, would be an optimal data set for helping to fully understand the variable wave environments of San Juan County, as well as understanding how beaches will translate.
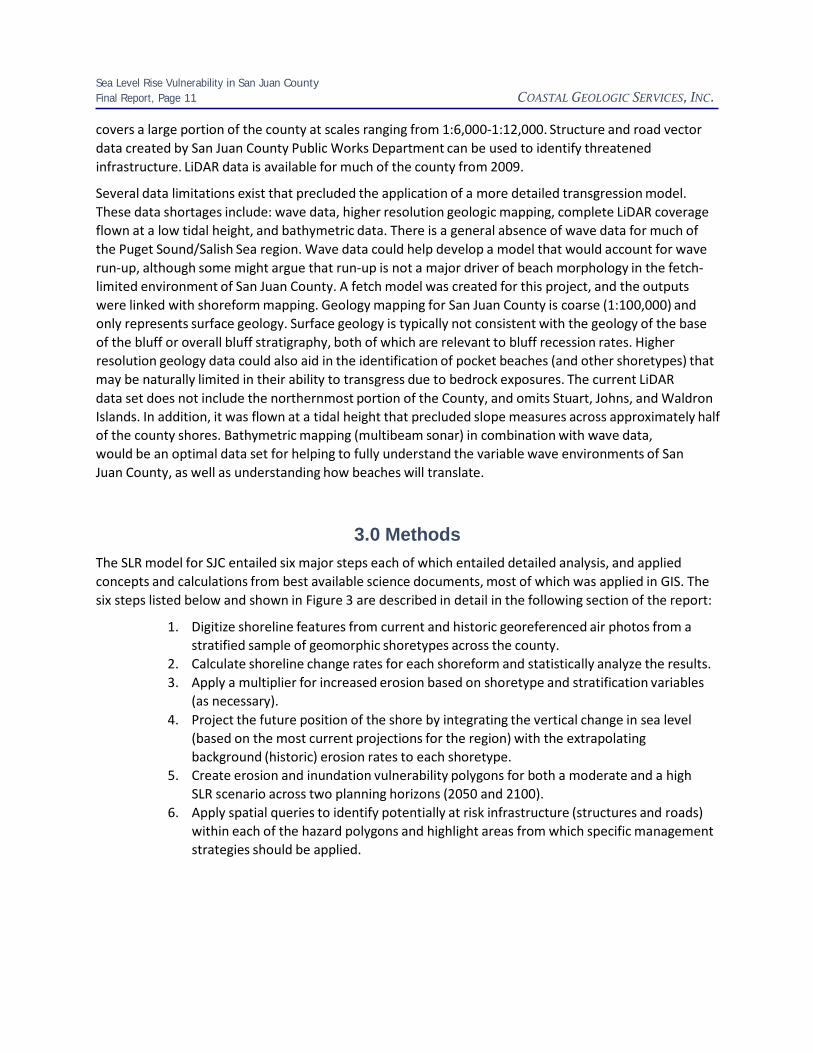
3.0 Methods
The SLR model for SJC entailed six major steps each of which entailed detailed analysis, and applied concepts and calculations from best available science documents, most of which was applied in GIS. The six steps listed below and shown in Figure 3 are described in detail in the following section of the report:
1. Digitize shoreline features from current and historic georeferenced air photos from a stratified sample of geomorphic shoretypes across the county.
2. Calculate shoreline change rates for each shoreform and statistically analyze the results. 3. Apply a multiplier for increased erosion based on shoretype and stratification variables
(as necessary). 4. Project the future position of the shore by integrating the vertical change in sea level
(based on the most current projections for the region) with the extrapolating background (historic) erosion rates to each shoretype.
5. Create erosion and inundation vulnerability polygons for both a moderate and a high SLR scenario across two planning horizons (2050 and 2100).
6. Apply spatial queries to identify potentially at risk infrastructure (structures and roads) within each of the hazard polygons and highlight areas from which specific management strategies should be applied.
Sea Level Rise Vulnerability in San Juan County Final Report, Page 12 COASTAL GEOLOGIC SERVICES, INC.
Figure 3. Sequence of the major tasks of the sea level rise model for San Juan County. 3.1 Shore Change Analysis
The first step in conducting the shore change analysis element of this study was to identify representative shoreforms of each geomorphic shoretype. The stratification structure of the sample of shoreforms required that half of the shoreforms of each type were exposed to less than 5 miles of fetch and half were exposed to 5 miles or more of fetch. Approximately half of each exposure category was oriented to the southern quadrants and half to the northern quadrants. Erosion rates were calculated from at least 12 of each shoretype, which represents approximately 2% of each shoreform type (Table 4). Shoreforms selected for shore change analysis were required to be primarily unarmored, and free of other potential sources of interference to change rates, such as bedrock islets directly offshore. Historic, vertical aerial photography of high resolution and with visibility of the upper beach and bluff with a low georeferencing error (root mean square (RMS) <5) were additional requirements. The shoreforms also needed to be located within drift cells that had not incurred a considerable loss of sediment supply. The spatial distribution of the sampled shoreforms is shown in Figure 4.
A personal geodatabase was created within which shoreline features from current and historic conditions were digitized for later analysis. The specific shoreline feature that was digitized, the year that feature represented and the scale of digitizing was documented in the attribute table. Features were heads‐up digitized at a 1:500‐1:700 scale across the length of each of the sampled shoreforms. The specific feature (or shoreline proxy) that was digitized was different based on shoreform type and what feature could be mapped across the length of the shoreform with the highest level of confidence. If multiple features were visible, then the more landward proxy was selected (e.g. bluff crest versus vegetation line), as the more landward the higher the accuracy (Ruggerio et al. 2003).The log line or vegetation line was typically the digitized feature for barrier beaches, while the toe of the bluff or the bluff crest was the feature digitized all other shoreforms. The shoreline proxy was consistent among shoreforms across years. Different historic aerial photographs were used for different areas, based on availability and the ability to clearly view the subject feature with a high level of confidence. Photos ranged in scale from 1:6000 to 1:12,000 and from 1960‐1978. Features were digitized from the most recent vertical aerial photographs of high resolution (2008) or the LiDAR imagery (2009).
All of the original feature digitizing was completed by the same staff member to assure consistency in feature interpretation, and preclude unnecessary bias associated with multiple analysts. All digitizing was QA/QC’d by the project manager to ensure consistency. During the QA/QC process, areas in which bedrock exposures or shoreline armor could interfere with erosion rates were clipped from the geodatabase to prevent erroneous results.

Sea Level Rise Vulnerability in San Juan County Final Report, Page 13 COASTAL GEOLOGIC SERVICES, INC.
Table 4. Sampling design displaying shoreforms, stratification of shoreforms by exposure and orientation, and hypothetical “likely acceleration rate”.
Shoreforms
Exposure
Orientation
13 Feeder Bluffs
NOT occurring in drift cells with highly impacted sediment supply
5 with <5 mi fetch
3 Southern quadrant
2 Northern quadrant
8 with >5 mi fetch
4 Southern quadrant
4 Northern quadrant
12 Transport Zones
5 with <5 mi fetch
3 Southern quadrant
2 Northern quadrant
7 with >5 mi fetch
3 Southern quadrant
4 Northern quadrant
12 Barrier Beaches
6 with <5 mi fetch
4 Southern quadrant
2 Northern quadrant
8 with >5 mi fetch
4 Southern quadrant
4 Northern quadrant
21 Pocket Beaches
11 with <5 mi fetch
6 Southern quadrant
5 Northern quadrant
10 with >5 mi fetch
6 Southern quadrant
4 Northern quadrant
Sea Level Rise Vulnerability in San Juan County Final Report, Page 14 COASTAL GEOLOGIC SERVICES, INC.
Figure 4. Shoreforms sampled for shore change analysis (from Whitman et al. 2012). 3.2 DSAS and Statistical Analysis
The Digital Shoreline Analysis System (DSAS) is a free software application that was developed by the Environmental Systems Research Institute (ESRI) and USGS. DSAS computes rate of change statistics for a time series of shoreline vector data. DSAS automates the shore change process allowing for greater efficiency and reduces the opportunity for error. Prior to running the software, baselines were created from which transects would be drawn perpendicular to the shoreline. Baselines were created by exporting sample shoreform reaches of the WDNR Shorezone shoreline (WDNR 2001) and buffering those reaches landward of the feature digitizing. Cumulatively over 300 transects were placed at 82‐foot (25‐meter) intervals across the sampled shoreforms. DSAS then calculated the distance between each
Sea Level Rise Vulnerability in San Juan County Final Report, Page 15 COASTAL GEOLOGIC SERVICES, INC.
shoreline feature and calculated an end point rate (EPR), which equates to the measured distance between the two features divided by the number of years between those features (e.g. 1960 and 2009). EPR measures were then analyzed within each individual shoreform and across each shoretype.
3.3 Estimating the Future Position of the Shoreline
This element of the vulnerability assessment is complex and although considerable uncertainties exist regarding when shorelines will reach the predicted locations, they will inevitably retreat to the vicinity of the predicted locations. The estimated future position of the shoreline for each planning horizon is the cumulative product of the background rate of erosion, the predicted degree of acceleration resulting from the increasing rate of sea level rise, combined with the vertical change in sea level across the number of years in that planning horizon.
Modeling Inundation The first step in applying this approach was to transpose the shoreform mapping from the WDNR best available science high water shoreline (2001 WDNR) to a shoreline that is linked with a vertical datum. This was conducted by first creating a MHHW digital elevation model (DEM) using VDatum (v 3.1 Spargo et al. 2006) with grid‐spacing of 100 ft. Each portion of the grid represented the difference between NAVD88 and MHHW at that location. The grid size (100 ft) was selected to both maximize processing time while also minimizing the different between adjacent grids. Very little difference (< 0.01 ft) was seen between grids at this resolution. Since VDatum only performs conversions for in‐water locations, portions of the grid on land were not calculated. An interpolation of nearby in‐water values was used to “extend” the conversion grid over the land. The conversion values were then applied to the LiDAR data to produce a new digital elevation model (DEM) in MHHW datum.
The MHHW shoreline was then linked to shoreform data by applying a mapping technique referred to as a euclidian allocation to accurately transpose the shoretype boundaries so as to pair shoreform data with other variables such as fetch.
The inundation areas for each SLR horizon where created from the MHHW DEM. The lower limits of the inundation polygons were the highest observed water level (HOWL) for 2009, which was +3.4 ft above MHHW (for Friday Harbor, http://tidesandcurrents.noaa.gov/data_menu.shtml?stn=9449880%20Friday%20Harbor,%20WA&type= Bench%20Mark%20Sheets). A contour line was generated using GIS for that elevation and additional contours to represent the upper boundary of the inundation polygons from both the moderate and high scenarios for 2050 and 2100. The lines were then converted to polygons that represent all regions between successive inundation steps (2050 moderate, 2050 high, 2100 moderate, and 2100 high). The contours were retained for further use in determining erosion hazard zones.
Modeling Bluff Recession Accelerated erosion rates were calculated using an equation well‐cited in peer reviewed literature and was also described in the background section of this report. Recent research conducted by Ashton et al. (2011) and Walkden and Hall (2011) documented a strong relationship between SLR rate and bluff recession rate. This equation was used to predict future erosion based on future rates of SLR. SCAPE simulations run across a wide range of model parameter space including variations in wave height, period, tidal range and rock strength revealed that a simple expression could be used to relate the rate of SLR and the equilibrium recession rate (Ashton et al. 2012, Walkden and Dickson 2008).
Sea Level Rise Vulnerability in San Juan County Final Report, Page 16 COASTAL GEOLOGIC SERVICES, INC.
SLR
(ft)
ට
�� ε2 = ε1 ��
Equation 1
Where (ε2) is the future erosion rate and (ε1) is the current erosion rate, and the prior and future rates of sea level rise are S1 and S2, respectively. This expression was found to hold for profiles that included a beach whose volume was below a threshold level appropriate for San Juan County (determined to be <30 m3/m for the base model parameter).
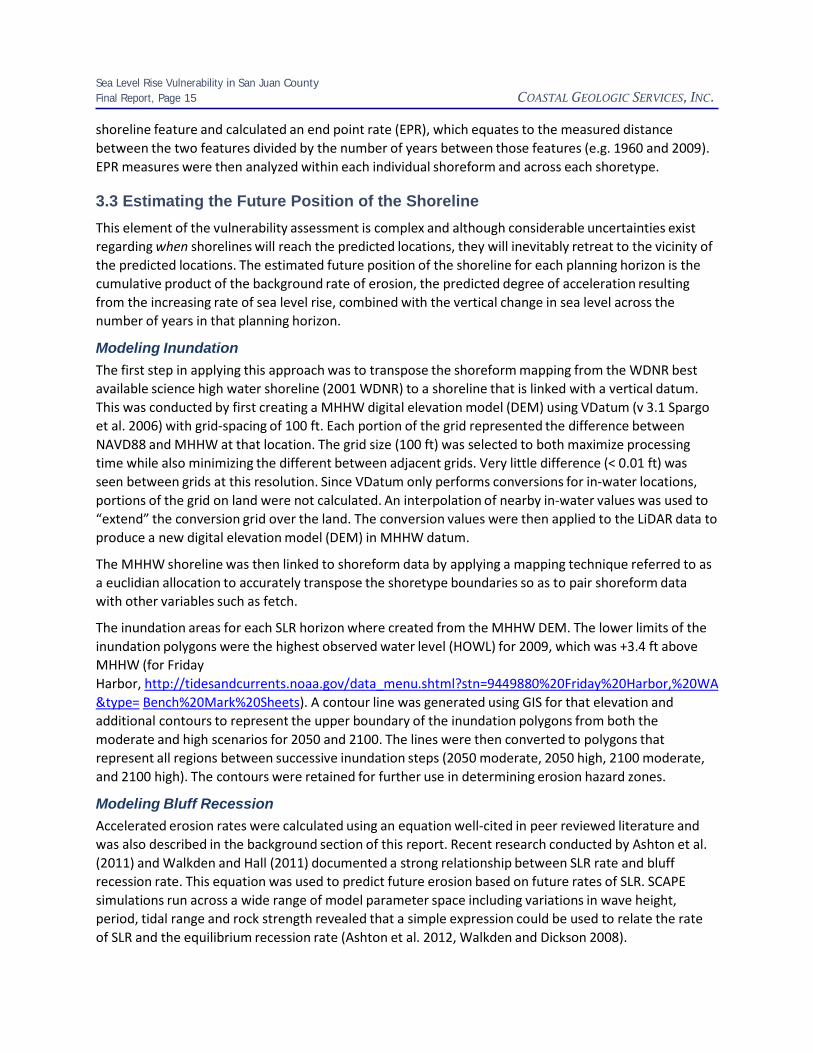
To produce accurate model outputs this model required sea level rise rates at a resolution that goes beyond the reported projections from the NRC (NAS 2012). Therefore a quadratic spine that adheres to the combined curve of the current rates of SLR reported at the NOAA Friday Harbor tide station and the NRC SLR projections for 2030, 2050 and 2100 (Figure 5), were integrated (for both moderate and high scenarios) to produce SLR rates at ten year time intervals. The integration was created using the software on the following website: http://science.kennesaw.edu/~plaval/applets/QRegression.html .
5.0
4.5
4.0
3.5
3.0
2.5
2.0
1.5
1.0
0.5
0.0 2000 2020 2040 2060 2080 2100
Projection year Moderate High
Figure 5. Quadratic spline integration of SLR rates at 10‐year intervals for each scenario using data from Friday Harbor NOAA tide station and NRC SLR projections (NAS 2012).
As previously stated, this method of predicting shoreline change is only applicable for eroding shores and therefore is not appropriate for barrier beaches, which are characteristically depositional shores. Little research has been conducted on how barrier beaches in the Salish Sea will respond to SLR. Considerable research has been applied on this concept elsewhere, however predominantly along sandy beaches with incomparably greater wave exposure in addition to aeolian processes. Accelerated erosion rates were not estimated for barrier beaches, which are much more likely to be threatened by inundation and are in need of further research to elucidate their response to SLR.

Sea Level Rise Vulnerability in San Juan County Final Report, Page 17 COASTAL GEOLOGIC SERVICES, INC.
For shoretypes with considerable upland relief (such as transport zones, feeder bluffs and some pocket beaches) inundation polygons appear as narrow bands that simply move vertically up the toe of the bluff, and clearly do not depict the landward recession of the bluff. To fully display the likely transgression of the beach profile, the position of the bluff crest needed to be delineated from which projections of bluff recession could be applied.
The bluff crest was mapped using GIS and LiDAR imagery at the break line that marked the greatest change in relief (from high to low slope) closest to the shoreline. In certain areas there were multiple slope changes and/or dramatic changes in relief. Care was taken to consistently interpret the bluff crest that would be the first to incur wave induced erosion in these areas. Where uncertainty occurred, the original LiDAR data and high resolution vertical and oblique shoreline imagery were referenced. All digitizing was conducted at a fine scale on the order of 1:500 with a maximum of 1:700. Vertices were placed every 10‐50 ft. Each shoreform was attributed with the shoreform ID, so it could later be linked with shoreform data including shoretype and fetch for forthcoming elements of model application. Figure 6 displays a screen capture of the digitizing process in which the waterward shoreform mapping was used to direct the alongshore boundaries of the digitizing area, as well as the slope data derived from LiDAR.
Figure 6. Screen capture of bluff crest digitizing process.
Sea Level Rise Vulnerability in San Juan County Final Report, Page 18 COASTAL GEOLOGIC SERVICES, INC.
After bluff crests were digitized for all of the shoreforms (excluding bedrock, embayments, and barrier beaches), the bluff recession vulnerability polygons were generated using data described in each of the previously described steps (including: inundation contours, the background erosion rates, erosion acceleration rates based on equation 1, SLR projections, and planning horizons).
First, the bluff crest and inundation contours were separated into resistant and non‐resistant surface geology based on available state‐wide geology maps (WDNR 2010). Bedrock geology (in contrast to unconsolidated, Quaternary, sedimentary geologic units) was assumed to be completely resistant to erosion, and therefore no future erosion was applied to those areas. Erosion vulnerability areas were then generated as buffers that extended landward of the bluff crest and inundation areas based on the respective projections and planning horizons. Again, surface geology was used to separate out those areas resistant to erosion, which were then excluded from the hazard zones. Shoreline armor was not accounted for as it was assumed that shore protection would not entirely preclude profile adjustment, as wave‐induced erosion is not typically the only driver of bluff erosion (Johannessen and MacLennan 2007), and most shore armor is not engineered to sustain the sea level rise.
4.0 Results 4.1 Shore Change Analysis
Results from the shore change analysis portion of this study offer an initial attempt at documenting the variability in erosion rates across shoretypes and the relative influence of specific variables on coastal erosion in the Salish Sea. These data have the potential to function as a baseline data set for similar studies of this nature in the region. Exploring the relative erosion rates across geomorphic shoretypes has not previously been conducted in the Salish Sea. This stratified sampling approach provides the opportunity to explore the relative influence of different variables on erosion rates. There is much more to explore and understand in these data and results, however the analysis presented in this report is limited to conclusions that will influence the forthcoming steps of the project.
Shore change analysis results exhibited considerable variability within and across geomorphic shoreforms (Table 5, Figure 7). Barrier beaches had significantly higher positive change rates (F=12.03, p=0.00), which is indicative of progradation or shoreline accretion. Overall the change rates at barrier beaches were considerably more variable than other shoreforms (Table 5, Figures 7 and 8). A number of barrier beaches incurred erosion over the period of study, while most exhibited accretion. The barrier beaches in which erosion occurred were primarily south‐facing and often exposed to more than 5 miles of fetch (Figure 8). Pairwise comparisons showed that shoreline change rates along barrier beaches were significantly different from all other geomorphic shoretypes (Tukey HSD, FB: p=0.00, PB: p=0.01, TZ: p=0.00).
The lowest change values (indicative of shoreline retreat) across all geomorphic shoretypes occurred within feeder bluffs. Mean erosion rates across feeder bluffs ranged from ‐0.26 to ‐0.93 ft/yr and averaged ‐0.47 ft/yr (Table 5). Erosion was measured exclusively within feeder bluffs. Shoreline orientation did not appear to have a significant effect on the degree of erosion that was measured at a site.

Sea Level Rise Vulnerability in San Juan County Final Report, Page 19 COASTAL GEOLOGIC SERVICES, INC.
Chan
ge ra
te (f
t/yr
)
Table 5. Descriptive statistics for change rates (ft/yr) across geomorphic shoreforms (1960‐2009). Negative numbers are the lowest rates, if less than zero represents erosion (e.g. bluff crest recession).
Shoretype
Minimum
Maximum
Average
Std. Dev.
Barrier beaches
-0.34
0.61
0.07
0.32
Feeder bluffs
-0.93
-0.26
-0.47
0.19
Pocket beaches
-0.37
0.09
-0.17
0.11
Transport zones -0.52 -0.07 -0.25 0.15
Transport zones and pocket beaches on average exhibited considerably less shoreline recession. A few pocket beaches exhibited minor accretion, while minor to moderate recession was documented along all transport zones. Shoreline change rates across all shoretypes were (significantly) inversely correlated with exposure or maximum measured fetch. In other words, sites with greater exposure or higher maximum measured fetch typically had higher erosion rates (measured as values less than zero, Regression: R2=0.14, adjusted R2=0.118, ANOVA F=4.68, p=0.013). On average, every mile increase in exposure is associated with a decrease the change rate (erosion) of ‐0.014 ft/yr (south orientation only). Based on the significance of the relationship between fetch and mean change rate, the authors concluded that fetch categories are a relevant variable to carry forward in to the later steps of this model.
0.8
0.6
0.4
0.2
0.0
‐0.2
‐0.4
‐0.6
‐0.8
‐1.0
‐1.2
Barrier beaches Feeder bluffs Pocket beaches Transport zones
Min Max Average
Figure 7. Minimum, maximum and average change rates across shoretypes. Minimum values represent the lowest change rates, which if less than zero represent erosion.

Sea Level Rise Vulnerability in San Juan County Final Report, Page 20 COASTAL GEOLOGIC SERVICES, INC.
Aver
age
Chan
ge R
ate
(ft/y
r)
Chan
ge R
ates
(ft/
yr)
0.40
0.20
0.00
‐0.20
N S N S N S N S feeder bluffs barrier beaches transport zones pocket beaches
‐0.40
‐0.60
‐0.80 <5 miles >5 miles
Figure 8. Average change rates within shoretypes of variable fetch and shore orientation. Values less than zero represent erosion or recession.
0.20
0.10
0.00
‐0.10
feeder bluffs barrier beaches transport zones pocket beaches
‐0.20
‐0.30
‐0.40
‐0.50 <5 miles >5 miles
Figure 9. Average change rates of different shoretypes of different fetch categories.
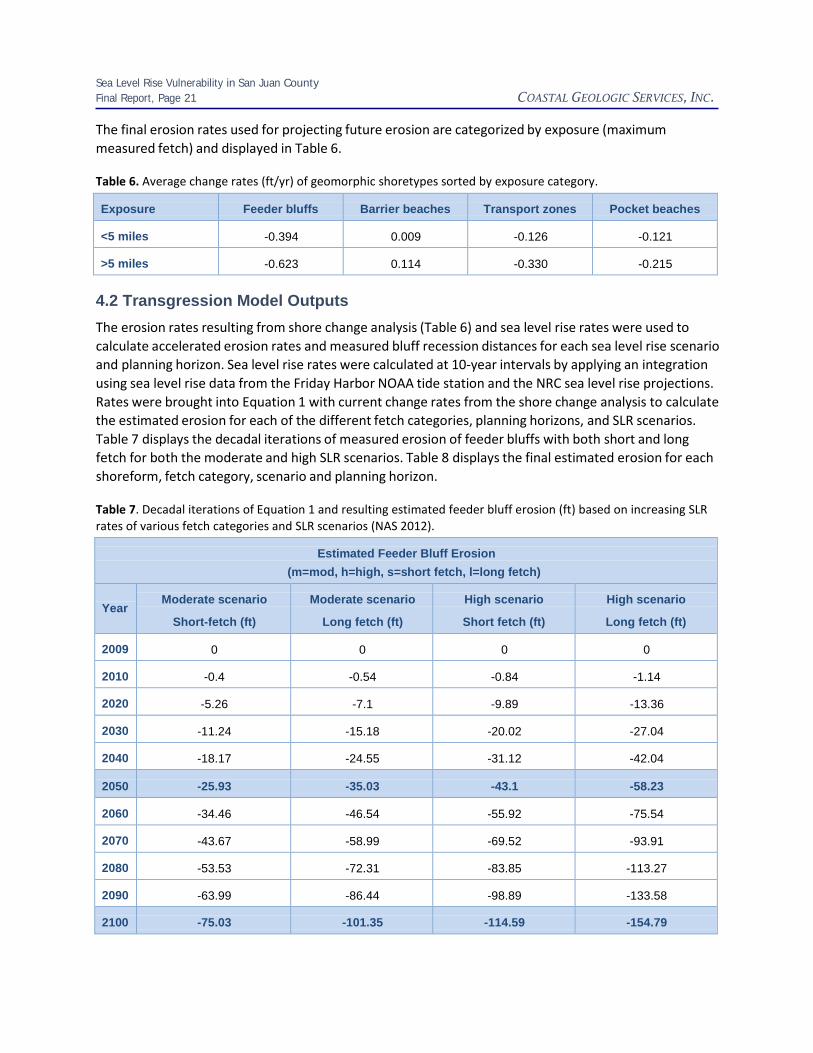
Sea Level Rise Vulnerability in San Juan County Final Report, Page 21 COASTAL GEOLOGIC SERVICES, INC.
The final erosion rates used for projecting future erosion are categorized by exposure (maximum measured fetch) and displayed in Table 6.
Table 6. Average change rates (ft/yr) of geomorphic shoretypes sorted by exposure category.
Exposure
Feeder bluffs
Barrier beaches
Transport zones
Pocket beaches
<5 miles
-0.394
0.009
-0.126
-0.121
>5 miles
-0.623
0.114
-0.330
-0.215
4.2 Transgression Model Outputs
The erosion rates resulting from shore change analysis (Table 6) and sea level rise rates were used to calculate accelerated erosion rates and measured bluff recession distances for each sea level rise scenario and planning horizon. Sea level rise rates were calculated at 10‐year intervals by applying an integration using sea level rise data from the Friday Harbor NOAA tide station and the NRC sea level rise projections. Rates were brought into Equation 1 with current change rates from the shore change analysis to calculate the estimated erosion for each of the different fetch categories, planning horizons, and SLR scenarios. Table 7 displays the decadal iterations of measured erosion of feeder bluffs with both short and long fetch for both the moderate and high SLR scenarios. Table 8 displays the final estimated erosion for each shoreform, fetch category, scenario and planning horizon.
Table 7. Decadal iterations of Equation 1 and resulting estimated feeder bluff erosion (ft) based on increasing SLR rates of various fetch categories and SLR scenarios (NAS 2012).
Estimated Feeder Bluff Erosion
(m=mod, h=high, s=short fetch, l=long fetch)
Year
Moderate scenario
Short-fetch (ft)
Moderate scenario
Long fetch (ft)
High scenario
Short fetch (ft)
High scenario
Long fetch (ft)
2009
0
0
0
0
2010
-0.4
-0.54
-0.84
-1.14
2020
-5.26
-7.1
-9.89
-13.36
2030
-11.24
-15.18
-20.02
-27.04
2040
-18.17
-24.55
-31.12
-42.04
2050
-25.93
-35.03
-43.1
-58.23
2060
-34.46
-46.54
-55.92
-75.54
2070
-43.67
-58.99
-69.52
-93.91
2080
-53.53
-72.31
-83.85
-113.27
2090
-63.99
-86.44
-98.89
-133.58
2100
-75.03
-101.35
-114.59
-154.79

Sea Level Rise Vulnerability in San Juan County Final Report, Page 22 COASTAL GEOLOGIC SERVICES, INC.
Table 8. Final estimated erosion of shoreforms with short and long fetch for different SLR scenarios (moderate, high) and planning horizons (2050, 2100).
Estimated change (ft) for shoreforms with less than 5 miles exposure
Average change
(ft/yr)
Shoretype
2050 Mod
2050 High
2100 Mod
2100 High
-0.39
Feeder bluffs
-25.9
-43.1
-75.0
-114.6
-0.12
Transport zones
-8.6
-14.4
-25.0
-38.2
-0.12
Pocket beaches
-8.4
-14.0
-24.4
-37.2
Estimated change (ft) for shoreforms with greater than 5 miles exposure
Average change
(ft/yr)
Shoretype
2050 Mod
2050 High
2100 Mod
2100 High
-0.62
Feeder bluffs
-35.0
-58.2
-101.4
-154.8
-0.33
Transport zones
-23.0
-38.2
-66.5
-101.5
-0.22
Pocket beaches
-15.0
-25.0
-43.4
-66.3
The final estimated erosion rates for feeder bluffs with less than 5 miles of fetch range from approximately 26 ft, based on a moderate SLR scenario in 2050, to approximately 115 ft in 2100 for the high SLR scenario. Feeder bluffs with greater than 5 miles of fetch are anticipated to incur greater bluff recession on the order of 10 ft by 2050 or 40 ft by 2100 (Table 8). Considerably less erosion is likely to occur along transport zones and pocket beaches, although transport zones with more than five miles of fetch will incur up to 100 ft of bluff recession in the high scenario by 2100. According to these results, pocket beaches with low exposure were by far the least vulnerable to bluff recession.
Erosion vulnerability polygons were generated using the buffer distances reported in Table 8. Buffers extended landward of the bluff crest were created for each shoretype within different fetch categories for each SLR scenario and planning horizon. Buffers were clipped or truncated where they intercepted bedrock geology, which presents a natural constraint to shoreline translation. In areas where the crest of the bank or shoreline was inundated the buffer was applied to the new inundated shoreline. Buffers were converted to polygons from which infrastructure could be selected.
Mapping results of erosion and inundation areas are best viewed at close scale due to the resolution of the data set. Figures 10 to 13 display snap shots of results to display the variety of ways the data can be displayed to enhance understanding of the relative vulnerability to SLR implications in San Juan County. Results can be displayed by scenario or planning horizon or specifically by the source of vulnerability.

Sea Level Rise Vulnerability in San Juan County Final Report, Page 23 COASTAL GEOLOGIC SERVICES, INC.
Figure 10. Inundation mapping of northeast Lopez Island.

Sea Level Rise Vulnerability in San Juan County Rna/ Report; Page 24 COASTAL GEOLOGIC SERVICES, INC.
2009
2050Mod
2050High
Figures 11& 12. Areas vulnerable to erosion and inundation on northwest Lopez Island in 2050,2100.

Sea Level Rise Vulnerability in San Juan County Final Report, Page 25 COASTAL GEOLOGIC SERVICES, INC.
Figure 13. Areas vulnerable to erosion and inundation on eastern Shaw Island across all scenarios and planning horizons.
4.3 Vulnerable Infrastructure
Roads and structures that were encompassed within inundation and erosion polygons were selected to identify areas of heightened vulnerability in San Juan County. In addition, roads and structures that are currently located below the highest observed water levels (MHHW plus 3.4 ft) were identified. In total 2.3 miles of San Juan County road are below the highest observed water levels and are likely inundated during storm events that coincide with high water. More road length appears to be threatened by inundation than erosion. More than eleven miles of road are likely to be threatened by erosion or inundation by 2050, according to the high SLR scenario. By 2100, based on the high SLR scenario, almost 20 miles of road will be vulnerable to erosion on inundation.
Vulnerable roads are distributed throughout the county however several specific pockets with more vulnerable road length exist. Several short stretches of vulnerable roads occur on San Juan Island around the middle of Griffin Bay, near Davidson Head and Mosquito Pass. False Bay Road is vulnerable in several locations as well as Cattle Point Road. The northeast and western shores of Shaw Island have several
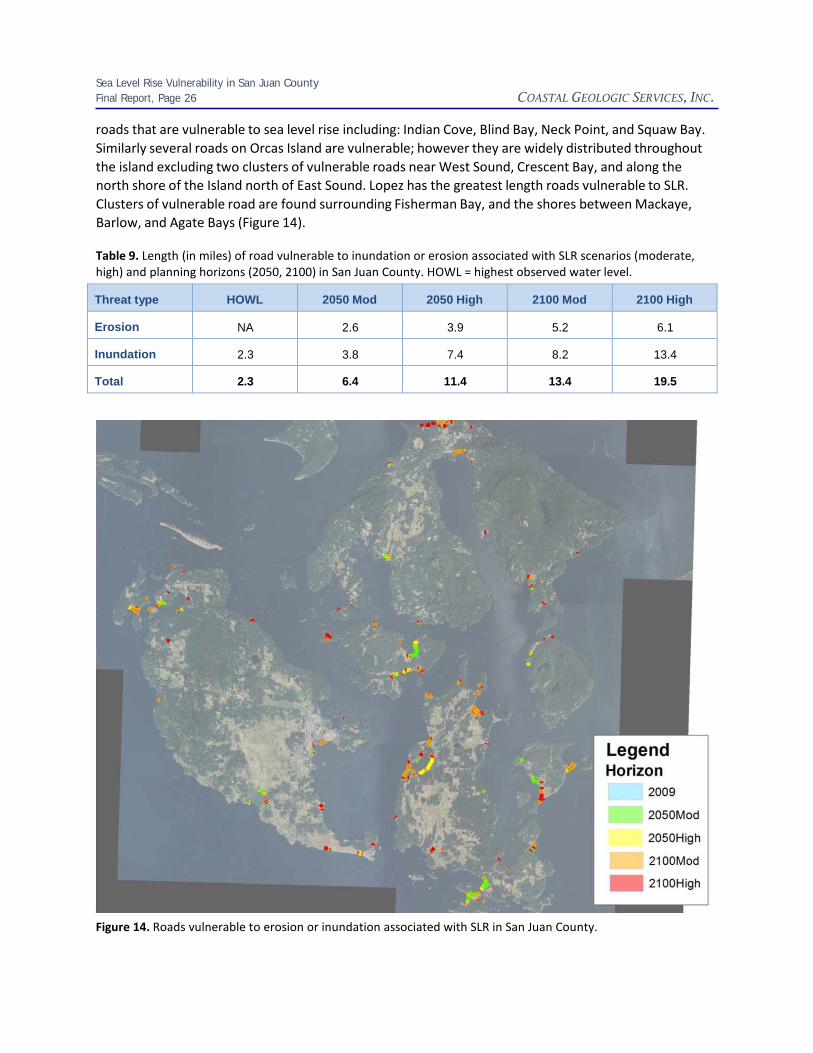
Sea Level Rise Vulnerability in San Juan County Final Report, Page 26 COASTAL GEOLOGIC SERVICES, INC.
roads that are vulnerable to sea level rise including: Indian Cove, Blind Bay, Neck Point, and Squaw Bay. Similarly several roads on Orcas Island are vulnerable; however they are widely distributed throughout the island excluding two clusters of vulnerable roads near West Sound, Crescent Bay, and along the north shore of the Island north of East Sound. Lopez has the greatest length roads vulnerable to SLR. Clusters of vulnerable road are found surrounding Fisherman Bay, and the shores between Mackaye, Barlow, and Agate Bays (Figure 14).
Table 9. Length (in miles) of road vulnerable to inundation or erosion associated with SLR scenarios (moderate, high) and planning horizons (2050, 2100) in San Juan County. HOWL = highest observed water level.
Threat type
HOWL
2050 Mod
2050 High
2100 Mod
2100 High
Erosion
NA
2.6
3.9
5.2
6.1
Inundation
2.3
3.8
7.4
8.2
13.4
Total
2.3
6.4
11.4
13.4
19.5
Figure 14. Roads vulnerable to erosion or inundation associated with SLR in San Juan County.

Sea Level Rise Vulnerability in San Juan County Final Report, Page 27 COASTAL GEOLOGIC SERVICES, INC.
Similar to roads, structures that were encompassed within the erosion and inundation polygons associated with different SLR scenarios and planning horizons were selected to better understand the spatial variability of SLR vulnerability across San Juan County. A 20‐ft buffer was placed around the structure points, as a home within 20 ft of the bluff crest is likely threatened by erosion. Similarly for inundation threats, structures that are within 20‐ft of the shoreline are likely to be threatened (particularly since this model does not include waves and HOWL does not integrate wave run‐up).
Structures that are currently located below the highest observed water levels were identified, as these structures could potentially be inundated during storm events that coincide with high water. Currently, 69 structures are located below the highest observed water levels (MHHW + 3.4 ft). These structures should be evaluated to determine if home owners are aware of the threat and have historically incurred storm damage.
Table 10. Number of structures vulnerable to inundation or erosion associated with SLR scenarios (moderate, high) and planning horizons (2050, 2100) in San Juan County. HOWL = highest observed water level.
Threat type
HOWL
2050 Mod
2050 High
2100 Mod
2100 High
Total
Erosion
9
247
127
233
235
842
Inundation
69
239
106
48
249
711
Both
9
57
19
12
7
104
Total
69
486
233
281
484
1553
Over one‐hundred structures are vulnerable to both inundation and erosion throughout San Juan County. Many of these structures are vulnerable to both threats as early as 2050 based on the moderate SLR scenario. Nine structures are currently threatened by both erosion and inundation (at or below the highest observed water level and within 20 ft of the bluff crest).
Tables 11 and 12 report the number of homes vulnerable to inundation and erosion (respectively) across each of the islands in San Juan County. Results show that slightly more homes are vulnerable to erosion than inundation in the County across most scenarios and planning horizons, excluding the high projection for 2100, in which slightly more structures will be threatened by inundation than erosion. Generally more structures are threatened on the more developed islands with greater populations and more structures. Lopez Island has far more structures threatened by erosion over inundation due to the prevalence of eroding bluffs on the Island (Tables 11 and 12). Orcas and San Juan Islands had similar counts of threatened structures.
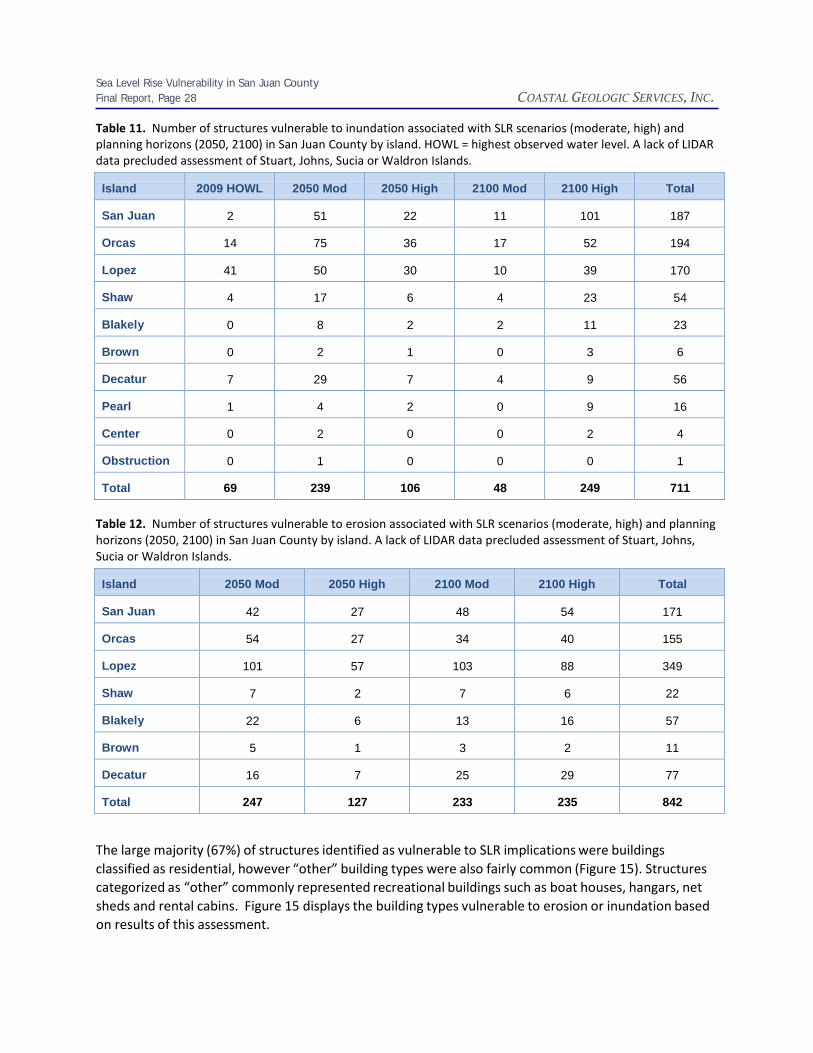
Sea Level Rise Vulnerability in San Juan County Final Report, Page 28 COASTAL GEOLOGIC SERVICES, INC.
Table 11. Number of structures vulnerable to inundation associated with SLR scenarios (moderate, high) and planning horizons (2050, 2100) in San Juan County by island. HOWL = highest observed water level. A lack of LIDAR data precluded assessment of Stuart, Johns, Sucia or Waldron Islands.
Island
2009 HOWL
2050 Mod
2050 High
2100 Mod
2100 High
Total
San Juan
2
51
22
11
101
187
Orcas
14
75
36
17
52
194
Lopez
41
50
30
10
39
170
Shaw
4
17
6
4
23
54
Blakely
0
8
2
2
11
23
Brown
0
2
1
0
3
6
Decatur
7
29
7
4
9
56
Pearl
1
4
2
0
9
16
Center
0
2
0
0
2
4
Obstruction
0
1
0
0
0
1
Total
69
239
106
48
249
711
Table 12. Number of structures vulnerable to erosion associated with SLR scenarios (moderate, high) and planning horizons (2050, 2100) in San Juan County by island. A lack of LIDAR data precluded assessment of Stuart, Johns, Sucia or Waldron Islands.
Island
2050 Mod
2050 High
2100 Mod
2100 High
Total
San Juan
42
27
48
54
171
Orcas
54
27
34
40
155
Lopez
101
57
103
88
349
Shaw
7
2
7
6
22
Blakely
22
6
13
16
57
Brown
5
1
3
2
11
Decatur
16
7
25
29
77
Total
247
127
233
235
842
The large majority (67%) of structures identified as vulnerable to SLR implications were buildings classified as residential, however “other” building types were also fairly common (Figure 15). Structures categorized as “other” commonly represented recreational buildings such as boat houses, hangars, net sheds and rental cabins. Figure 15 displays the building types vulnerable to erosion or inundation based on results of this assessment.

Sea Level Rise Vulnerability in San Juan County Final Report, Page 29 COASTAL GEOLOGIC SERVICES, INC.
1%
27%
1%
3%
67%
Residential
Commercial
Town
Other
Blank
Figure 15. Building types vulnerable to erosion or inundation. 4.4 Policy Recommendations
The tools developed as part of this project were designed to enhance local understanding of the impacts of SLR and effectively identify the most immediate threats and greatest areas of vulnerability across the County. Once informed of the vulnerability, policy makers can address the underlying causes and begin to ameliorate additional vulnerability (Pethick and Crooks 2001). Some of the most effective uses of these outputs are to inform coastal management, local engineering works, and related planning efforts. These tools can also form the basis for more in‐depth sea level rise resilience and adaptation planning such as those developed by Johnson (2000) and Russell and Griggs (2012). Because of the long‐term nature of climate change and sea level rise, the opportunity exists to adapt to climate change impacts while maintaining environmental, social, and economic health.
There are various approaches to identify adaptation strategies, actions, and priorities, which should reflect local planning objectives and align with regional management efforts, particularly those associated with natural hazards and critical areas. Variable costs are associated with different management approaches and cost‐benefit analyses can help inform decisions. For example the cost of protecting critical infrastructure will likely be much greater than changing shoreline management policies to create larger setback distances that would restrict future development in threatened areas. Project sequencing should also be considered as some areas will be threatened in the more immediate future, while others may not be vulnerable to until the latter half of this century.
The selection of feasible response strategies will likely be dependent on the overall objectives of local and regional managers and implementation costs. For example priorities could be identified based on the most immediate threats or threats to critical infrastructure, such as public utilities, hospitals and critical road networks.

Sea Level Rise Vulnerability in San Juan County Final Report, Page 30 COASTAL GEOLOGIC SERVICES, INC.
Results from this assessment can be used to clearly locate priority areas where multiple threats are likely to occur, particularly in a shorter time‐frame. For example, areas vulnerable to both inundation and erosion by 2050 represent the most immediate threats identified in this study. It also appears that considerably more road length and number of structures are vulnerable to inundation between now and 2050 than by erosion or between 2050‐2100 (Tables 11 and 12). In contrast, among the structures threatened by erosion (bluff recession), most are vulnerable between 2050 and 2100. Therefore developing management strategies for inundation hazards appears to be a greater priority in San Juan County. The greatest number of vulnerable structures to both erosion and inundation are found on Lopez Island, followed by Orcas and San Juan Island (Tables 11 and 12). Planners should consider relocating or adapting critical infrastructure in these areas and explore funding programs to help facilitate the selected actions (adaptation, protection, retreat). Long‐term strategies should also be developed for areas that are identified as vulnerable in 2100.
Development should be restricted in areas identified as vulnerable to SLR impacts and long‐term management plans should reflect the lack of sustainability. In a recently published guidance document designed to help local governments in BC prepare for climate change (West Coast Environmental Law 2012, http://www.retooling.ca/_Library/docs/WCEL_climate_change_FINAL.pdf) , governments are advised to review the context of potentially legal liability and a changing climate with regard to:
• The vulnerability of existing infrastructure • New infrastructure • Permitting and inspections • Approval of development in areas subject to increased risk of natural hazards such as flooding,
landslides (and other climate change impacts).
For example in British Columbia, some SLR adaptation guidance suggests applying current setback regulations to the 2100 location of the bluff crest (pers. com. J. Shah 2013). Long‐term sustainable coastal development should integrate future vulnerabilities associated with changing conditions due to SLR and CC. Sustainable development in coastal systems also requires the preservation of intact coastal processes for resilience.
Outreach and education to communities in which SLR vulnerability is high should also be conducted. Public input during the development of strategies and priorities can help to garner support and share the message with other community members. Education on how vulnerable areas were identified can help community members understand the origin of the mapping products and how the data can be used. Pilot outreach efforts could target the islands with the greatest vulnerability, such as Lopez Island. Pilot outreach and education efforts should focus on fostering community dialogue, enhancing understanding of sea level rise planning principles, and solicit input on the content and recommended potential solutions.
Results of this analysis can be paired with additional data for better management of natural coastal resources. For example, drift cells with large reductions in sediment supply (due to armored feeder bluffs), are likely to be less resilient (Pethick and Crooks 2000) and additional coastal recession and habitat loss may occur as a result. Recent work conducted by CGS and Friends of the San Juans in which the relative risk and/or resilience of priority nearshore habitats were assessed should be linked with the results of this analysis (MacLennan et al. 2012). Together these data could better inform management priorities from a habitat perspective. Priority habitats which are located waterward of areas vulnerable

Sea Level Rise Vulnerability in San Juan County Final Report, Page 31 COASTAL GEOLOGIC SERVICES, INC.
to erosion are at greater risk of being armored, which is known to degrade and eliminate habitats and the processes that sustain them. Outreach to property owners with structures that are threatened in the more immediate future (2050 moderate or high scenarios) located landward of priority habitat areas could be conducted to explore long‐term management options. Protecting structures with shore armor that will likely be threatened by bluff recession should be cautioned against, as this management response will likely exacerbate down‐drift and adjacent erosion, degrade important habitats, and may not be effective at preventing bluff recession over time.
The most effective uses of these tools are for improved long‐term coastal management. Intermediate and long‐term vulnerability to sea level rise implications in San Juan County have been identified from which management and planning strategies can be developed. A detailed SLR adaptation plan aimed at increasing local resilience, reducing vulnerability, and preserving resources would be a valuable follow up to this work.
4.5 Data Interpretation and Intended Utility
The purpose of this study was to provide an estimate of potential future hazards and NOT to predict actual erosion or flooding. Actual erosion from SLR may lag potential erosion, especially for bluffs composed of dense glacial deposits and/or due to potentially increased supply of littoral material. The ways in which the analysis could be improved are discussed further below, as well as important characteristics to be mindful of when interpreting this data.
This assessment was structured to provide a conservative estimate of areas vulnerable to sea level rise implications. When interpreting results it is important to be mindful of the assumptions and uncertainties built into the mapping and analysis. Quantifiable sources of uncertainty were analyzed and are described in detail in the forthcoming section of this report. Several additional sources of uncertainty that were not quantified as part of the error analysis, should be treated as fundamental assumptions and limitations (see bulleted list below) that should be minded during interpretation of results; while others can be used to improve this type of mapping and analysis in future studies.
Assumptions and Limitations:
• The SCAPE model equation is appropriate for consolidated glacial deposits found in San Juan County and is likely to underestimate the accelerated rate of bluff recession where bluff lithology is less consolidated.
• Projected rates of sea level rise are not significantly different from those reported in the NRC 2012 document.
• Other climate change impacts that could increase bluff erosion rates such as increased precipitation.
• The geologic mapping used in this assessment was low resolution (1:100,000) and did not account for bluff stratigraphy, which commonly affects bluff recession rates.
SLR projections were conservatively applied so as to map the likely upper limits of inundation. Inundation areas were mapped using the NRC SLR projections on the mean higher, high water shoreline plus the additional elevation of the highest observed water level to conservatively estimate the current upper limits of inundation during storm events. The highest observed water level represents both historic conditions (which are anticipated to change) as well as only standing water elevation, which does not account for wave run‐up. Wave modeling was not included in this assessment due to a lack of
Sea Level Rise Vulnerability in San Juan County Final Report, Page 32 COASTAL GEOLOGIC SERVICES, INC.
wave data in San Juan County. Data that were available were not appropriate to extrapolate countywide, and limited resources precluded the development of a new wave model for the county. Therefore, inundation associated with wave run‐up and wave‐induced bluff erosion was not well accounted for in the assessment results. Wave induced erosion is likely a driving force (but not the only source) in the background erosion rates used to delineate areas the vulnerable to erosion.
There are a number of ways in which this mapping effort could be improved. One of the most important refinements would be measuring background erosion rates at additional sites in a variety of shoretypes throughout the county, as this was one of the most limiting data sources. Additional years of analysis would also provide insight into the consistency in shoreline trends. It would also be informative to further stratify shoretypes based on backshore geology (bluff lithology and stratigraphy). Mapping of areas vulnerable to inundation could be improved with a comprehensive LiDAR coverage for San Juan County flown at low tides would also enable more comprehensive analysis. Additionally, reducing the uncertainty in how accretion shoreforms will to respond to sea level rise (in the region) needs attention. As well as further informing the baseline morphology of these shoreforms and what are the central drivers behind the huge variability in change rates as documented in this study.
4.6 Error Analysis
The error analysis conducted for this study included several efforts to reduce uncertainty and limit potential sources of error in addition to quantifying a range of cumulative error. The detailed methods applied in both of these approaches will be described further below. Although several sources of uncertainty are addressed in this effort, additional uncertainties exist both of which will be discussed in this section.
Error Associated with Inundation Mapping An important data source in the analysis of the impacts of sea level rise in San Juan County was the LiDAR elevation surface collected in 2009 by Watershed Sciences (2009). The report accompanying the LiDAR described the error analysis in the horizontal and vertical. The vertical error was stated as a standard deviation 0.12 ft, meaning that 95% of LiDAR points on a flat surface would have a value within 0.24 ft of their actual elevation.
As part of this error analysis the LiDAR elevation data reported accuracy was independently verified with elevation data derived from other methods. The LiDAR elevation data were compared to seven sites that were previously surveyed by CGS, each with multiple elevation measures of hard surfaces (e.g. paved roads). The sites were located on level terrain to minimize the impact of any horizontal error, vegetation must be minimal, and the reported horizontal and vertical accuracy was high degree. Three sites adjacent to high‐quality monuments in flat terrain at ground level were selected. Where multiple survey dates were available from a site, the data from dates closest to summer 2009 were selected to coincide with the dates of LiDAR data collection.
The average difference between the LiDAR and ground survey elevations was found to be 0.01 ft, with a standard deviation of 0.22 ft. This value does include several sources of additional error however. The MLLW datum elevations were based on direct observation of the water level at low tide. Also, the survey methods involved elevation error as high as approximately 0.1 ft. The accuracy reported by the LiDAR data provider was a mean difference of 0.002 ft with a standard deviation of 0.120 ft.
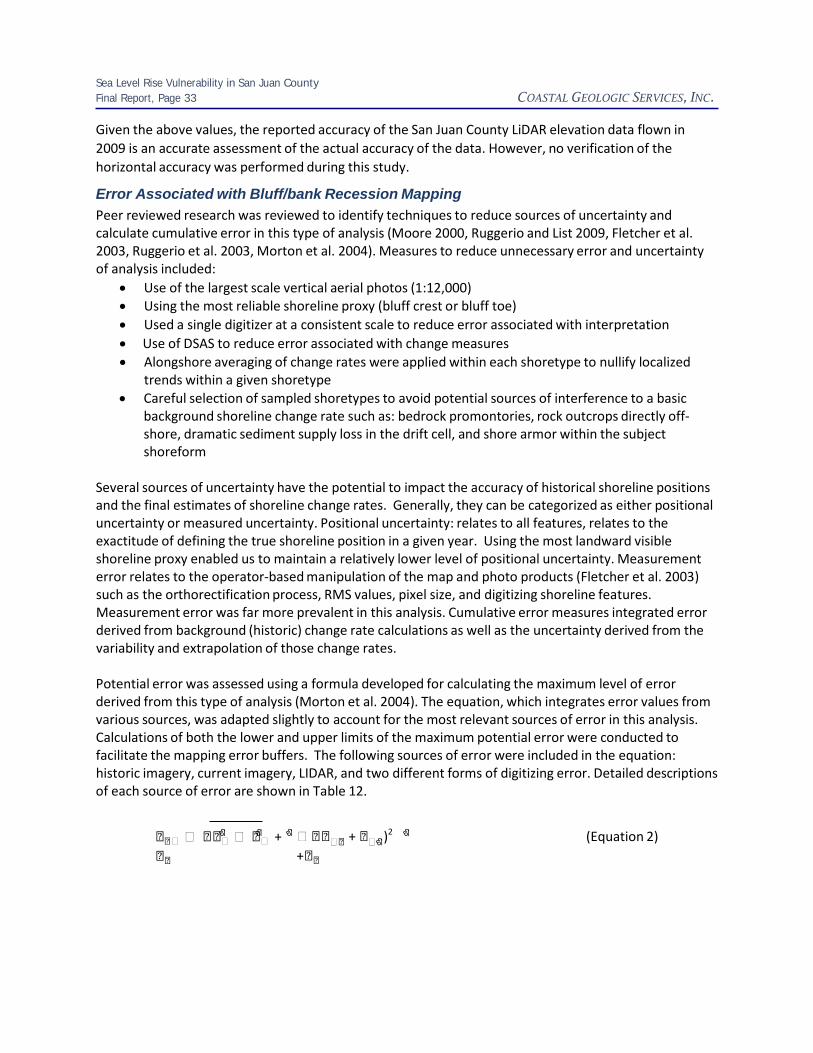
Sea Level Rise Vulnerability in San Juan County Final Report, Page 33 COASTAL GEOLOGIC SERVICES, INC.
Given the above values, the reported accuracy of the San Juan County LiDAR elevation data flown in 2009 is an accurate assessment of the actual accuracy of the data. However, no verification of the horizontal accuracy was performed during this study.
Error Associated with Bluff/bank Recession Mapping Peer reviewed research was reviewed to identify techniques to reduce sources of uncertainty and calculate cumulative error in this type of analysis (Moore 2000, Ruggerio and List 2009, Fletcher et al. 2003, Ruggerio et al. 2003, Morton et al. 2004). Measures to reduce unnecessary error and uncertainty of analysis included:
• Use of the largest scale vertical aerial photos (1:12,000) • Using the most reliable shoreline proxy (bluff crest or bluff toe) • Used a single digitizer at a consistent scale to reduce error associated with interpretation • Use of DSAS to reduce error associated with change measures • Alongshore averaging of change rates were applied within each shoretype to nullify localized
trends within a given shoretype • Careful selection of sampled shoretypes to avoid potential sources of interference to a basic
background shoreline change rate such as: bedrock promontories, rock outcrops directly off‐ shore, dramatic sediment supply loss in the drift cell, and shore armor within the subject shoreform
Several sources of uncertainty have the potential to impact the accuracy of historical shoreline positions and the final estimates of shoreline change rates. Generally, they can be categorized as either positional uncertainty or measured uncertainty. Positional uncertainty: relates to all features, relates to the exactitude of defining the true shoreline position in a given year. Using the most landward visible shoreline proxy enabled us to maintain a relatively lower level of positional uncertainty. Measurement error relates to the operator‐based manipulation of the map and photo products (Fletcher et al. 2003) such as the orthorectification process, RMS values, pixel size, and digitizing shoreline features. Measurement error was far more prevalent in this analysis. Cumulative error measures integrated error derived from background (historic) change rate calculations as well as the uncertainty derived from the variability and extrapolation of those change rates.
Potential error was assessed using a formula developed for calculating the maximum level of error derived from this type of analysis (Morton et al. 2004). The equation, which integrates error values from various sources, was adapted slightly to account for the most relevant sources of error in this analysis. Calculations of both the lower and upper limits of the maximum potential error were conducted to facilitate the mapping error buffers. The following sources of error were included in the equation: historic imagery, current imagery, LIDAR, and two different forms of digitizing error. Detailed descriptions of each source of error are shown in Table 12.
ଶ ଶ ଶ ଶ
ටට� � ටට� � ට� + ටට
� ටට�ට + ට�ଶ )2
+ටට
(Equation 2)
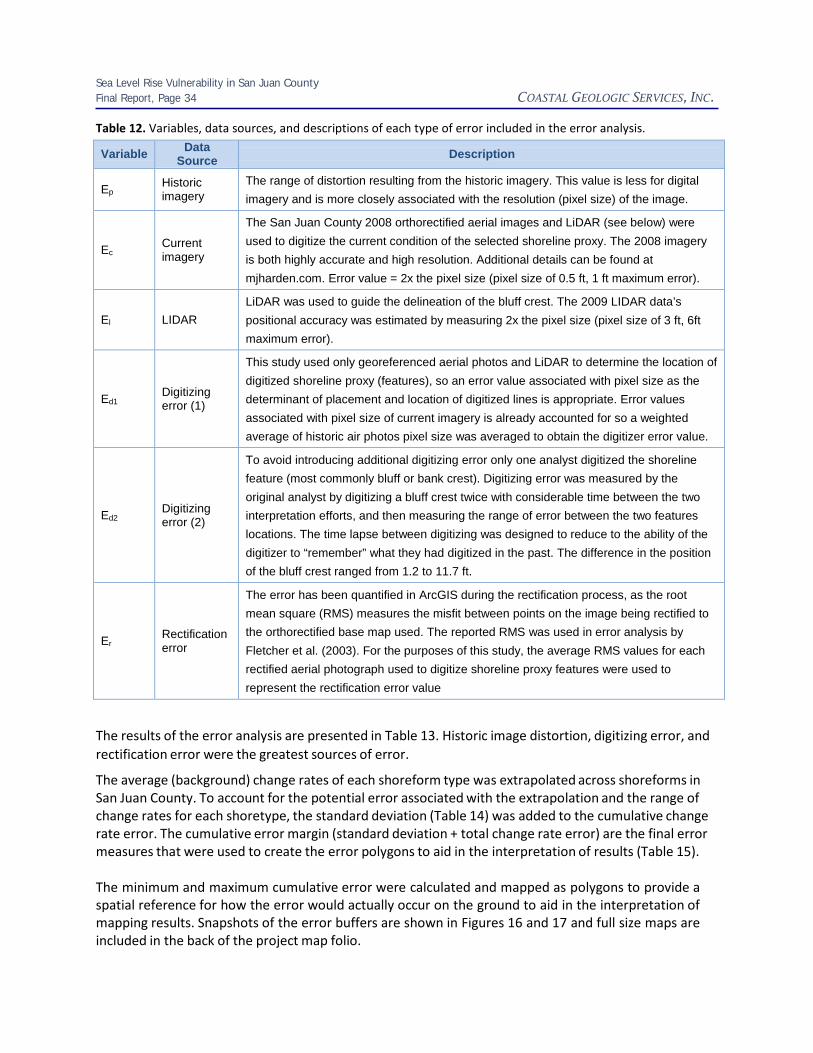
Sea Level Rise Vulnerability in San Juan County Final Report, Page 34 COASTAL GEOLOGIC SERVICES, INC.
Table 12. Variables, data sources, and descriptions of each type of error included in the error analysis.
Variable Data Source
Description
Ep
Historic imagery
The range of distortion resulting from the historic imagery. This value is less for digital imagery and is more closely associated with the resolution (pixel size) of the image.
Ec
Current imagery
The San Juan County 2008 orthorectified aerial images and LiDAR (see below) were used to digitize the current condition of the selected shoreline proxy. The 2008 imagery is both highly accurate and high resolution. Additional details can be found at mjharden.com. Error value = 2x the pixel size (pixel size of 0.5 ft, 1 ft maximum error).
El
LIDAR LiDAR was used to guide the delineation of the bluff crest. The 2009 LIDAR data’s positional accuracy was estimated by measuring 2x the pixel size (pixel size of 3 ft, 6ft maximum error).
Ed1
Digitizing error (1)
This study used only georeferenced aerial photos and LiDAR to determine the location of digitized shoreline proxy (features), so an error value associated with pixel size as the determinant of placement and location of digitized lines is appropriate. Error values associated with pixel size of current imagery is already accounted for so a weighted average of historic air photos pixel size was averaged to obtain the digitizer error value.
Ed2
Digitizing error (2)
To avoid introducing additional digitizing error only one analyst digitized the shoreline feature (most commonly bluff or bank crest). Digitizing error was measured by the original analyst by digitizing a bluff crest twice with considerable time between the two interpretation efforts, and then measuring the range of error between the two features locations. The time lapse between digitizing was designed to reduce to the ability of the digitizer to “remember” what they had digitized in the past. The difference in the position of the bluff crest ranged from 1.2 to 11.7 ft.
Er
Rectification error
The error has been quantified in ArcGIS during the rectification process, as the root mean square (RMS) measures the misfit between points on the image being rectified to the orthorectified base map used. The reported RMS was used in error analysis by Fletcher et al. (2003). For the purposes of this study, the average RMS values for each rectified aerial photograph used to digitize shoreline proxy features were used to represent the rectification error value
The results of the error analysis are presented in Table 13. Historic image distortion, digitizing error, and rectification error were the greatest sources of error.
The average (background) change rates of each shoreform type was extrapolated across shoreforms in San Juan County. To account for the potential error associated with the extrapolation and the range of change rates for each shoretype, the standard deviation (Table 14) was added to the cumulative change rate error. The cumulative error margin (standard deviation + total change rate error) are the final error measures that were used to create the error polygons to aid in the interpretation of results (Table 15).
The minimum and maximum cumulative error were calculated and mapped as polygons to provide a spatial reference for how the error would actually occur on the ground to aid in the interpretation of mapping results. Snapshots of the error buffers are shown in Figures 16 and 17 and full size maps are included in the back of the project map folio.
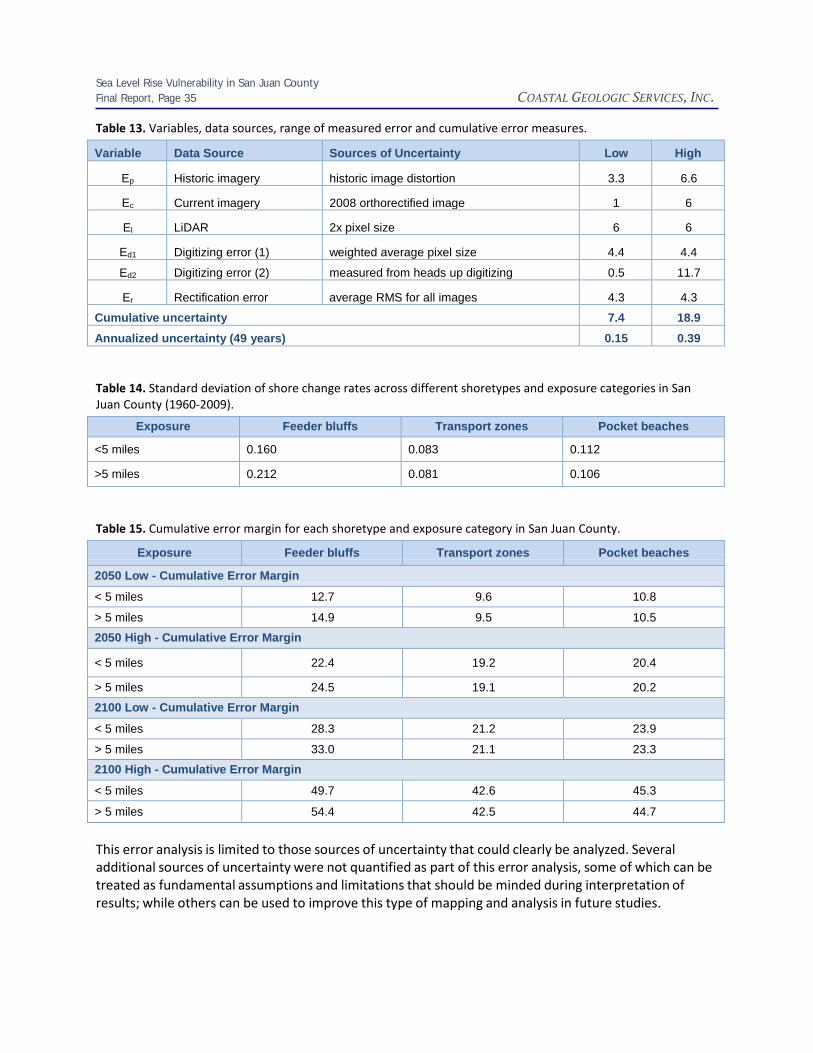
Sea Level Rise Vulnerability in San Juan County Final Report, Page 35 COASTAL GEOLOGIC SERVICES, INC.
Table 13. Variables, data sources, range of measured error and cumulative error measures.
Variable Data Source Sources of Uncertainty Low High
Ep
Historic imagery
historic image distortion
3.3
6.6
Ec
Current imagery
2008 orthorectified image
1
6
El
LiDAR
2x pixel size
6
6
Ed1
Digitizing error (1)
weighted average pixel size
4.4
4.4
Ed2 Digitizing error (2) measured from heads up digitizing 0.5 11.7
Er
Rectification error
average RMS for all images
4.3
4.3
Cumulative uncertainty 7.4 18.9
Annualized uncertainty (49 years) 0.15 0.39
Table 14. Standard deviation of shore change rates across different shoretypes and exposure categories in San Juan County (1960‐2009).
Exposure Feeder bluffs Transport zones Pocket beaches
<5 miles 0.160 0.083 0.112
>5 miles 0.212 0.081 0.106
Table 15. Cumulative error margin for each shoretype and exposure category in San Juan County.
Exposure Feeder bluffs Transport zones Pocket beaches
2050 Low - Cumulative Error Margin
< 5 miles 12.7 9.6 10.8
> 5 miles 14.9 9.5 10.5
2050 High - Cumulative Error Margin
< 5 miles
22.4
19.2
20.4
> 5 miles 24.5 19.1 20.2
2100 Low - Cumulative Error Margin
< 5 miles 28.3 21.2 23.9
> 5 miles 33.0 21.1 23.3
2100 High - Cumulative Error Margin
< 5 miles 49.7 42.6 45.3
> 5 miles 54.4 42.5 44.7
This error analysis is limited to those sources of uncertainty that could clearly be analyzed. Several additional sources of uncertainty were not quantified as part of this error analysis, some of which can be treated as fundamental assumptions and limitations that should be minded during interpretation of results; while others can be used to improve this type of mapping and analysis in future studies.

Sea Level Rise Vulnerability in San Juan County Final Report, Page 36 COASTAL GEOLOGIC SERVICES, INC.
Figure 16. Example of buffered error margins to erosion vulnerability for the moderate SLR scenario in 2050 for Fisherman’s Bay, Lopez Island, as found in project GIS geodatabase to facilitate communicating uncertainty in outreach efforts.

Sea Level Rise Vulnerability in San Juan County Final Report, Page 37 COASTAL GEOLOGIC SERVICES, INC.
Figure 17. Example of buffered error margins to erosion vulnerability for the high SLR scenario in 2100 for Fisherman’s Bay, Lopez Island, as found in project GIS geodatabase to facilitate communicating uncertainty in outreach efforts.
Sea Level Rise Vulnerability in San Juan County Final Report, Page 38 COASTAL GEOLOGIC SERVICES, INC.
5.0 Conclusions
One of the important challenges for sea level rise researchers is to frame assessment results within a context understandable and useful to local decision‐makers. If this goal is accomplished, it is more likely that short‐term measures that enhance the adaptive capacity of coastal areas to respond to SLR can be implemented at the local level (Neumann et al. 2000).
The results of this assessment provide a foundation for which additional refinement and assessments should be conducted. Russell and Griggs (2013) recently published a guidance document for how to develop a thorough SLR vulnerability assessment and adaptation plan. Adaptation planning at the local level can limit the damage caused by climate change and can reduce the long‐term costs of responding to the climate‐related impacts that are expected to grow in number and intensity over the coming decades.
Assessing the adaptive capacity of vulnerable areas, identifying particularly vulnerable infrastructure for relocation, such as low‐lying sewage treatment plants, hazardous waste facilities, coastal power plants, large hotels and other major infrastructure are critical elements that should be addressed in an adaptation plan (Russell and Griggs 2013). Adaptive actions could then be prioritized by developing a risk assessment that evaluates the probabilities, magnitudes and consequences of events driving the change. A risk assessment should include the following elements (Russell and Griggs 2013):
• actual flood threats or hazards of concern (bluff erosion, beach loss, flooding), • economic importance and value of public facilities, • value and importance of private development sectors, both commercial and residential, • importance of municipal emergency services, • magnitude of impacts of future hazardous events, • timing and frequency of hazardous events, and • certainty of projected impacts to the degree that they can be expected.
Based on the cumulative results of these additional analyses a specific plan of action or adaptation plan could then be developed. Typically, the most important and threatened planning areas are addressed first, such as facilities and developments that are sited at the lowest elevations or closest to the crest of an eroding bluff. Greater detail on each of the elements that should ideally be included in an adaptation plan is described in Russell and Griggs (2013).
The intended utility of this study was to take the first few steps towards understanding the vulnerability and response of different shoreform types and areas of San Juan County to SLR and climate change. Previous assessments of this nature in the Salish Sea have addressed only areas vulnerable to coastal flooding and have not attempted to address or identify areas potentially vulnerable to coastal erosion. By assessing historic (background) change rates across geomorphic shoretypes, and applying an acceleration based on the rate of sea level rise, bluff/bank recession projections were applied for each scenario and planning horizon. The range of projections can be used to prioritize structures and infrastructure with more or less immediate threat. This approach provides coastal managers with a tool that can be applied at multiple scales within San Juan County to inform the development of new policies that specifically address SLR and climate change as well as existing policies and regulations such as setback requirements.

Sea Level Rise Vulnerability in San Juan County Final Report, Page 39 COASTAL GEOLOGIC SERVICES, INC.
References
Ashton, A., M. Walkden, M. Dickson. 2011. Equilibrium responses of cliffed coasts to changes in the rate of sea level rise.
Marine Geology. Vol. 284. 217‐229.
Brunsden, D. 2001. A critical assessment of the sensitivity concept in geomorphology. Catena. Vol 42, No. 2., pp 99‐123 (25).
Bruun. P. 1962. Sea level rise as a cause of shore erosion. Proceedings of the ASCE, Journal of the Waterways and Harbors Division 88, 117‐130.
Cereghino, P., J. Toft, C. Simenstad, E. Iverson, S. Campbell, C. Behrens, J. Burke, and B. Craig. 2012. Strategies for Nearshore
Protection and Restoration in Puget Sound. Prepared in Support of the Puget Sound Nearshore Ecosystem Restoration Project. Technical Report No. 2012‐01.Published by Washington Department of Fish and Wildlife, Olympia, Washington, and the U.S. Army Corps of Engineers, Seattle, Washington.
Chleborad, A. R. Baum, J. Godt. 2006. Rainfall thresholds for forecasting landslides in the Seattle, Washington, Area‐Exceedance and probability. U.S. Geological Survey Open‐File Report 2006‐1064.
Clancy, M. I. Logan, J. Lowe, J. Johannessen, A. MacLennan, F. B. Van Cleve, J. Dillon, J. Dillon, B. Lyons, R. Carman, P. Cereghino, B. Barnard, C. Tanner, D. Myers, R. Clark, J. White, C. Simenstad, M. Gilmer and N. Chin. 2009. Management Measures for Protecting the Puget Sound Nearshore. Puget Sound Nearshore Ecosystem Restoration Project Report No. 2009‐01. Published by Washington Department of Fish and Wildlife, Olympia, Washington.
Cooper, J. and O. Pilkey. 2007. Rejoinder to: Cowell, P.J. and B.G. Thom. 2006. Reply to: Pilkey, O.H. and A.G. Cooper. 2006. Discussion of Cowell et al. 2006. Management of Uncertainty in Predicting Climate Change Impacts on Beaches. Journal of Coastal Research, 22 (1), 232‐245; Journal of Coastal Research, 22 (6), 1577‐1579; Journal of Coastal Research, 22 (6), 1580‐1584.
Crowell, M., S. P. Leatherman, M. K. Buckley. 1991. Historical shoreline change: Error Analysis and Mapping Accuracy. Journal of
Coastal Research, 7 (3), 839‐852. Ft. Lauderdale (Florida). ISSN 0749‐0208.
Davidson‐Arnott, R.G.D. 2005. Conceptual model of the effects of sea level rise on sandy coasts. Journal of Coastal Research. Vol 21. No. 6. Pp. 1166‐1172.
Dean, R.G. 1990. Beach response to sea level change. In Le Me‐Haute., B. and Hanes, D. M. (eds) Ocean Engineering Science,
Vol. 9. The Sea. New York: Wiley, pp. 869‐887.
Defeo, O., McLachlan, A., Schoeman, D.S., Schlacher, T.A., Dugan, J., Jones, A., Lastra, M., and Scapini, F. 2009. Threats to sandy beach ecosystems – A review: Estuarine, Coastal, and Shelf Science, v. 81, p. 1‐12.
Digital Shoreline Analysis System (DSAS), Thieler, E.R., Himmelstoss, E.A., Zichichi, J.L., and Ergul, Ayhan. 2013. Digital Shoreline Analysis System (DSAS) version 4.0—An ArcGIS extension for calculating shoreline change: U.S. Geological Survey Open‐ File Report 2008‐1278. Available online at http://pubs.usgs.gov/of/2008/1278/.
Esteves, L.S., J.J. Williams, A. Nock, and G. Lymbery. 2009. Quantifying shoreline changes along the Sefton coast (U.K.) and the implications for research‐informed coastal management. Journal of Coastal Research, SE 56, ICS2009 (Proceedings), 602‐ 606.
Fletcher, C.; J. Rooney, M. Barbee, S.C. Lim, and B. Richmond. 2003. Mapping shoreline change using digital
orthophotogrammetry on Maui, Hawaii. Journal of Coastal Research, SI(38), 106‐124. West Palm Beach (Florida), ISSN 0749‐0208.
Fresh, K., C. Simenstad, J. Brennan, M. Dethier, G. Gelfenbaum, F. Goetz, M. Logsdon, D. Myers, T. Mumford, J. Newton, H.
Shipman, and C. Tanner. 2004. Guidance for protection and restoration of the nearshore ecosystems of Puget Sound. Puget Sound Nearshore Partnership Report No. 2004‐02. Published by Washington SeaGrant Program, University of Washington, Seattle, Washington. Available at pugetsoundnearshore.org.
Gerstel, W.J., M.J. Brunengo, W.S. Lingley Jr., R.L. Logan, H.S. Shipman and T.J. Walsh. 1997. Puget Sound bluffs: the where, why, and when of landslides following the holiday 1996/97 storms. Washington Geology. March 1997, 25(1):17‐31.
Sea Level Rise Vulnerability in San Juan County Final Report, Page 40 COASTAL GEOLOGIC SERVICES, INC.
Glick, P. 2007. Sea‐Level Rise and Coastal Habitats of the Pacific Northwest: Application of a Model. A Presentation for the 2009
Puget Sound Georgia Basin Ecosystem Conference, Seattle, WA. Prepared by Patty Glick, Senior Global Warming Specialist, National Wildlife Federation.
Gorokhovich, Y., and A. Leiserowiz. 2012. Historical and future coastal changes in Northwest Alaska. Journal of Coastal Research,
28(1A), 174‐186. West Palm Beach (Florida), ISSN 0749‐0208.
Grilliot, M.J. 2009. Rising seas and sandy beach transgressions: A study in Northern Puget Sound, WA. Western Washington University thesis. 114 p.
Hammar‐Klose and E.R. Thieler. 2001. Coastal Vulnerability to Sea Level Rise: A Preliminary Database for the US Atlantic, Pacific
and Gulf of Mexico Coasts. US Geological Survey Digital Data Services DDS‐68, 1 CD‐ROM. US Geologic Survey Open‐File Report 00‐178. http://pubs.usgs.gov/of/2000/of00‐178/index.html
Hapke, C. J., D. Reid. 2007. The National assessment of shoreline change: Part 4, Historical coastal cliff retreat along the California coast: U.S. Geologic Survey Open‐File Report 2007‐1133. http://pubs.usgs.gov/of/2007/1133
(The) Heinz Center. 2000. Evaluation of Erosion Hazards. A collaborative research project of the H. John Heinz III Cetner for
Science, Economics and the Environment. Available online at http://www.heinzcenter.org.
Huppert, D.D., A. Moore, and K. Dyson. 2009. Impacts of climate on the coasts of Washington State. School of Marine Affairs College of Ocean and Fishery Sciences, University of Washington, Seattle, WA, 98195.
Johannessen, J.W. and A.J. MacLennan. 2007. Beaches and Bluffs of Puget Sound. Puget Sound Nearshore Partnership Report
No. 2007‐04. Published by Seattle District, U.S. Army Corps of Engineers, Seattle, Washington.
Johnson, Z. P. 2000. A Sea Level Rise Response Strategy for the State of Maryland. Maryland Department of Natural Resources Coastal Zone Management Division. 58p.
Laval, P.B. 2009. Quadratic Regression Applet. Retrieved Mar 19, 2013, from
http://science.kennesaw.edu/~plaval/applets/QRegression.html
Leatherman, S.P. 1990. Modeling shore response to sea‐level rise on sedimentary coasts. Progress in Physical Geography. 14: 447.
Lymbery, G., P. Wisse, and M. Newton. 2007. Report of coastal erosion predictions for Formby Point, Formby, Merseyside.
Sefton Council. 33p.
MacLennan, A., J. Johannessen, and S. Williams. 2010. Current Geomorphic Shoretype (Feeder Bluff) Mapping of San Juan County, WA – Phase 2: Including Orcas, Clark, Obstruction, Blakely, Decatur, Center, Turn, Brown, Shaw, Pearl, Henry, Stuart, Johns and Waldron Island. Prepared for the San Juan County Marine Resource Committee and the Northwest Straits Commission. 53p.
MacLennan, A. and S. Williams, 2012. Resilient and At Risk Priority Nearshore Habitats of San Juan County. Prepared for Friends of the San Juans.
Moore, L.J. 2000. Shoreline Mapping Techniques. Journal of Coastal Research. Vole 16 (1), p. 111‐124.
Morton, R.A.; T. Miller, and L. Moore. 2004. National assessment of shoreline change: Part 1: Historical shoreline changes and associated coastal land loss along the U.S. Gulf of Mexico: U.S. Geological Survey Open‐file Report 2004‐1043.
Mote, P., A. Peterson, S. Reeder, H. Shipman, L. Whitely Binder. 2008. Sea Level Rise in the Coastal Waters of Washington State. University of Washington Climate Impacts Group and the Department of Ecology.
National Academy of Sciences, 2012. Sea Level Rise for the Coasts of California, Oregon and Washington: Past, Present and Future. http://www.nap.edu/catalog.php?record_id=13389
National Research Council (NRC). 1992. Restoration of Aquatic Ecosystems. National Research Council. National Academy Press,
Washington D.C.

Sea Level Rise Vulnerability in San Juan County Final Report, Page 41 COASTAL GEOLOGIC SERVICES, INC.
Nicholls, R.J., 1998. Assessing erosion of sandy beaches due to sea level rise. Ed. J.G. Maund and M. Eddleston. Geohazards in
Engineering Geology (Geologic Society). 15. p 71‐76.
Neumann, J. E., G. Yohe, R. Nicholls, M. Manion. 2000. Sea level rise and global climate change: a review of impacts to U.S. coasts. Prepared for the Pew Center on Global Climate Change. Available online at: http://www.c2es.org/publications/sea‐ level‐rise‐global‐climate‐change‐review‐impacts‐us‐coasts
Pardaens, A.K., J.M. Gregory, J.A. Lowe, 2010. A model study of factors influencing projections of sea level over the twenty‐first century, Climate Dynamics, 36, 2015‐2033.
Peterson, A. W., 2007. Anticipating Sea Level Rise Response in Puget Sound. University of Washington thesis. 86p.
Pethick, J. 2001. Coastal management and sea level rise. Catena. 42, p. 307‐322.
Pethick, J. S. and S. Crooks. 2010. Development of a costal vulnerability index: a geomorphological perspective. Environmental Conservation, 27 (4), 359‐367. Foundation for Environmental Conservation.
Pew Center on Global Climate Change, 2009. Key Scientific Developments Since the IPCC Fourth Assessment Report, Science
Brief 2. June 2009. Available online: http://www.c2es.org/docUploads/Key‐Scientific‐Developments‐Since‐IPCC‐4th‐ Assessment.pdf
Revell, D.L., R. Batallio, B. Spear, P. Ruggiero, and J. Vanderver. 2011. A methodology for predicting future coastal hazards due to sea level rise on the California Coast. Climate Change. Vol. 109 (Suppl 1): S251‐S276.
Russell, N. and G. Griggs. 2012. Adapting to Sea Level Rise: A Guide for California’s Coastal Communities. Prepared for the California Energy Commission Public Interest Environmental Research Program. University of Santa Cruz, California.
Ruggerio, P., P. Komar and J. Allen. 2010. Increasing wave heights and extreme‐value projections: the wave climate of the U.S.
Pacific Northwest, Coastal Engineering, 57, 539‐552.
Ruggiero, P.; G. M. Kaminsky, and G. Gelfenbaum. 2003. Linking proxy‐based and datum based shorelines on a high‐energy coastline: implications for shoreline change analysis. Journal of Coastal Research, SI(38), 57‐82. West Palm Beach (Florida), ISSN 0749‐0208.
Ruggerio, P. and J.H. List. 2009. Shoreline Position and Change Rate Accuracy. Journal of Coastal Research. Vol 25, No. 5. P. 1069‐1081.
Russell, N. and G.B. Griggs. 2013. California sea level rise vulnerability and adaptation guidance document: A summary report.
Shore and Beach, Vol. 81. No. 1. pp 23‐29.
Scientific Committee on Ocean Research (SCOR ) Working Group 89. 1991. Reports of meetings: the response of beaches to sea‐ level changes: a review of predictive models. Journal of Coastal Research 7, no. 3 (1991): 895‐921.
Schwartz, M. L. 1967. The Bruun Theory of Sea Level Rise As A Cause of Shoreline Erosion. The Journal of Geology. Vol 75, 76‐
92.
Shipman. H. 2009. The response of the Salish Sea to Rising sea level – a geomorphic perspective. Puget Sound Georgia Basin Conference 2009. Vancouver, BC.
Shipman, H. 2008. A Geomorphic Classification of Puget Sound Nearshore Landforms. Puget Sound Nearshore Partnership
Report No. 2008‐01. Published by the US Army Corps of Engineers, Seattle, Washington.
Shipman, H. 2004. Coastal bluffs and sea cliffs on Puget Sound, Washington. In Formation, Evolution, and Stability of Coastal Cliffs‐Status and Trends. Edited by M. A. Hampton.
Simenstad, C., M. Logsdon, K. Fresh, H. Shipman, M. Dethier, and J. Newton. 2006. Conceptual Model for Assessing Restoration
of Puget Sound Nearshore Ecosystems. Puget Sound Nearshore Partnership Report No. 2006‐03. Published by Washington Sea Grant Program, University of Washington, Seattle, Washington. Available at http://pugetsound.org.
Sea Level Rise Vulnerability in San Juan County Final Report, Page 42 COASTAL GEOLOGIC SERVICES, INC.
Spargo, E.A, K.W. Hess, and S. White. 2006. VDatum for the San Juan Islands and the Strait of Juan de Fuca with Updates for
Puget Sound: Tidal Datum Modeling and Population of the Grids. Technical Report NOS CS 25, National Oceanic and Atmospheric Association, Washington DC.
Stive, M.J.F. 2004. How important is global warming for coastal erosion? Climate Change, 64, 27‐39.
Tubbs, D.W. 1974.Causes, Mechanisms and Prediction of Landsliding in Seattle. Unpublished dissertation, University of Washington, November 1975.
Van Cleve, F.B., C. Simenstad, F. Goetz, and T. Mumford. 2004. Application of “ Best Available Science” in ecosystem
restoration: lessons learned for large‐scale restoration efforts in the U.S. Puget Sound Nearshore Partnership Report No. 2004‐01. Published by Washington Sea Grant Program, University of Washington, Seattle, Washington. http://pugetsoundnearshore.org.
Walkden, M. and M. Dickson. 2006. The response of soft rock shore profiles to increased sea‐level rise. Tyndall Centre for Climate Change Research. Tyndall Centre Working Paper No. 105. http://www.tyndall.ac.uk/sites/default/files/wp105.pdf
Walkden, M.J. and J.W. Hall. 2011. A Mesoscale Predictive Model of the Evolution and Management of a Soft Rock Coast.
Journal of Coastal Research. Vol 27. No. 3. 529‐543.
Walkden, M.J. and J.W. Hall. 2005. A predictive Mesoscale model of the erosion and profile development of soft rock shores. Coastal Engineering, 52, 535‐563.
Washington State Department of Natural Resources (WDNR). 2001. Washington State Shorezone Inventory. Nearshore Habitat
Program, Olympia, Washington.
Watershed Sciences. 2009. LiDAR Remote Sensing Data Collection: San Juan Island, WA. Prepared for Puget Sound Regional Council, 30 p.
Whitman, T., S. Hawkins, J. Slocumb, A. MacLennan, P. Schlenger, and J. Small. 2012. Strategic Salmon Recovery Planning in San
Juan County, Washington – The Putting It All Together (PIAT) Project GIS Geodatabase. Shoretypes layer. Prepared by Friends of the San Juan for the San Juan County Lead Entity for Salmon Recovery and the Washington State Salmon Recovery Funding Board.
West Coast Environmental Law. 2012. Preparing for Climate Change: An Implementation Guide for Local Governments in British Columbia. Available online: http://www.retooling.ca/_Library/docs/WCEL_climate_change_FINAL.pdf
Zhang, K., B.C. Douglas, S.P. Leatherman. 2004. Global warming and coastal erosion. Climate Change. 64, 41‐58 p.
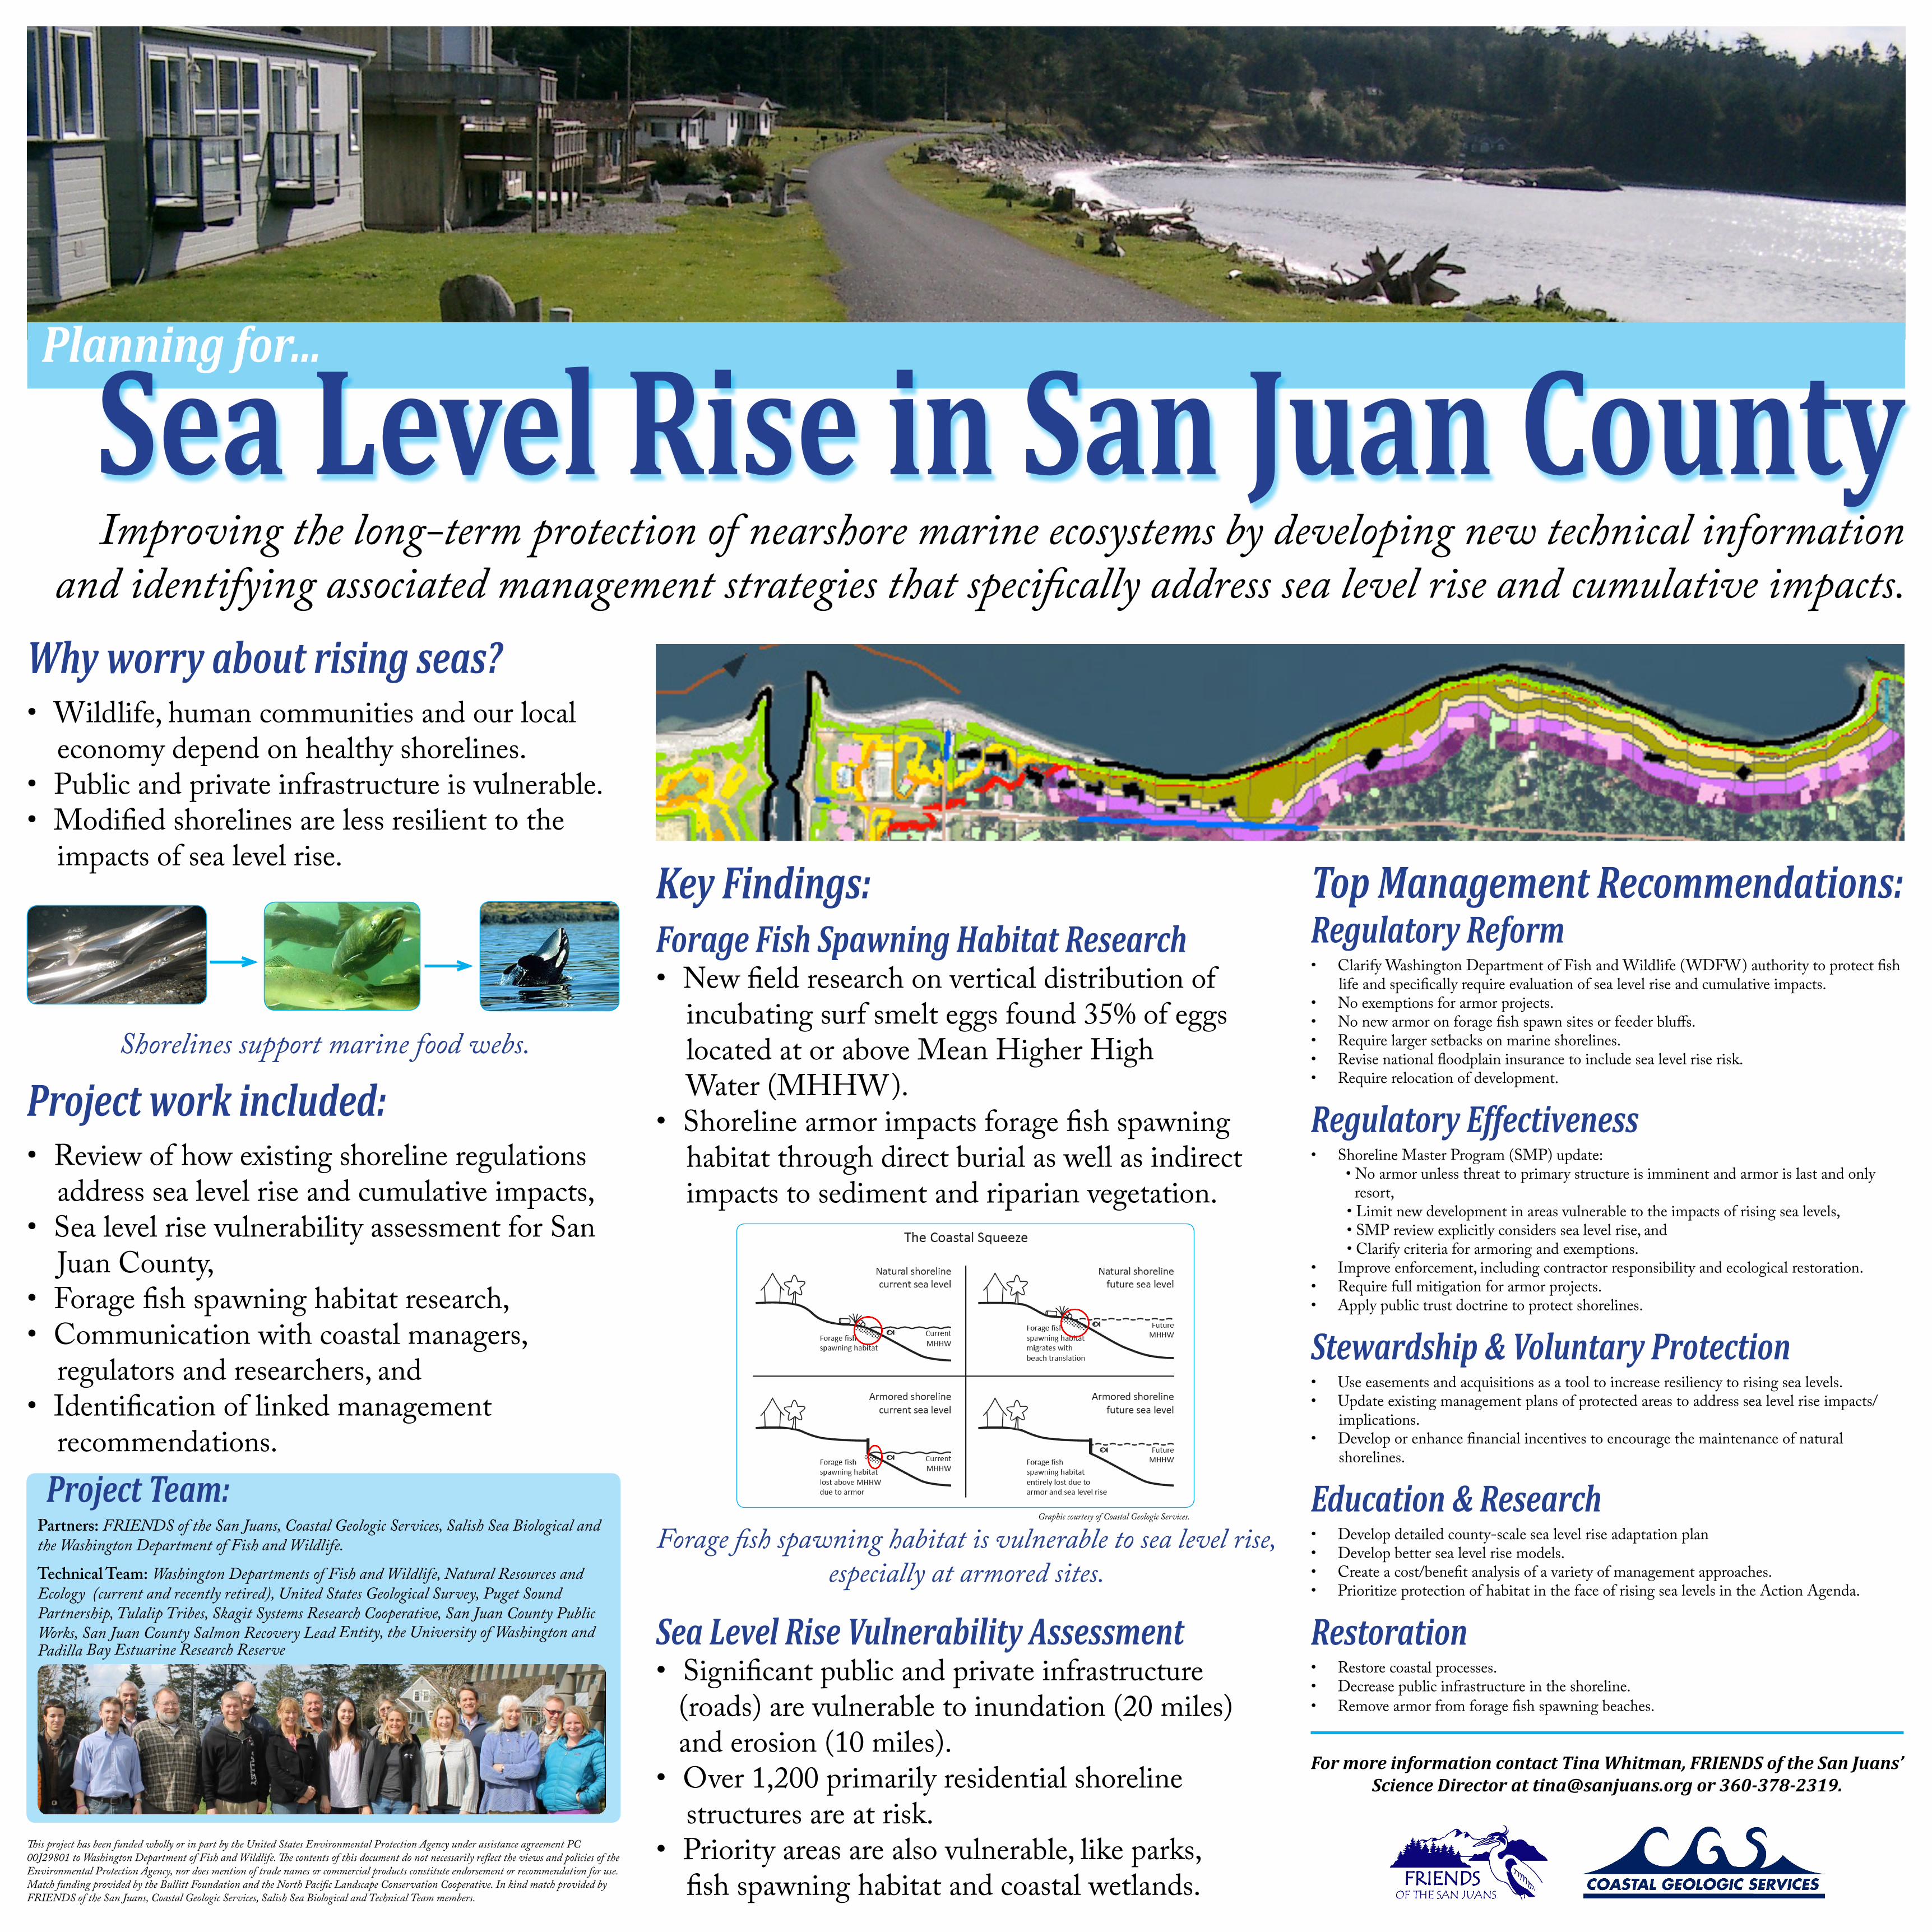
Sea Level Rise in San Juan CountyPlanning for...
Improving the long-term protection of nearshore marine ecosystems by developing new technical information and identifying associated management strategies that specifically address sea level rise and cumulative impacts.
Why worry about rising seas?• Wildlife,humancommunitiesandourlocaleconomydependonhealthyshorelines.• Publicandprivateinfrastructureisvulnerable.• Modifiedshorelinesarelessresilienttotheimpactsofsealevelrise.
Shorelines support marine food webs.
Project work included:• Reviewofhowexistingshorelineregulationsaddresssealevelriseandcumulativeimpacts,• SealevelrisevulnerabilityassessmentforSanJuanCounty,• Foragefishspawninghabitatresearch,• Communicationwithcoastalmanagers,regulatorsandresearchers,and• Identificationoflinkedmanagementrecommendations.
This project has been funded wholly or in part by the United States Environmental Protection Agency under assistance agreement PC 00J29801 to Washington Department of Fish and Wildlife. The contents of this document do not necessarily reflect the views and policies of the Environmental Protection Agency, nor does mention of trade names or commercial products constitute endorsement or recommendation for use. Match funding provided by the Bullitt Foundation and the North Pacific Landscape Conservation Cooperative. In kind match provided by FRIENDS of the San Juans, Coastal Geologic Services, Salish Sea Biological and Technical Team members.
Key Findings:Forage Fish Spawning Habitat Research• Newfieldresearchonverticaldistributionofincubatingsurfsmelteggsfound35%ofeggslocatedatoraboveMeanHigherHighWater(MHHW).• Shorelinearmorimpactsforagefishspawninghabitatthroughdirectburialaswellasindirectimpactstosedimentandriparianvegetation.
Forage fish spawning habitat is vulnerable to sea level rise, especially at armored sites.
Sea Level Rise Vulnerability Assessment• Significantpublicandprivateinfrastructure(roads)arevulnerabletoinundation(20miles)anderosion(10miles).• Over1,200primarilyresidentialshorelinestructuresareatrisk.• Priorityareasarealsovulnerable,likeparks,fishspawninghabitatandcoastalwetlands.
Project Team:Partners: FRIENDS of the San Juans, Coastal Geologic Services, Salish Sea Biological and the Washington Department of Fish and Wildlife.
Technical Team:Washington Departments of Fish and Wildlife, Natural Resources and Ecology (current and recently retired), United States Geological Survey, Puget Sound Partnership, Tulalip Tribes, Skagit Systems Research Cooperative, San Juan County Public Works, San Juan County Salmon Recovery Lead Entity, the University of Washington and Padilla Bay Estuarine Research Reserve
Top Management Recommendations:Regulatory Reform• ClarifyWashingtonDepartmentofFishandWildlife(WDFW)authoritytoprotectfishlifeandspecificallyrequireevaluationofsealevelriseandcumulativeimpacts.• Noexemptionsforarmorprojects.• Nonewarmoronforagefishspawnsitesorfeederbluffs.• Requirelargersetbacksonmarineshorelines.• Revisenationalfloodplaininsurancetoincludesealevelriserisk.• Requirerelocationofdevelopment.
Regulatory Effectiveness • ShorelineMasterProgram(SMP)update: •Noarmorunlessthreattoprimarystructureisimminentandarmorislastandonlyresort,•Limitnewdevelopmentinareasvulnerabletotheimpactsofrisingsealevels,•SMPreviewexplicitlyconsiderssealevelrise,and•Clarifycriteriaforarmoringandexemptions.• Improveenforcement,includingcontractorresponsibilityandecologicalrestoration.• Requirefullmitigationforarmorprojects.• Applypublictrustdoctrinetoprotectshorelines.
Stewardship & Voluntary Protection• Useeasementsandacquisitionsasatooltoincreaseresiliencytorisingsealevels.• Updateexistingmanagementplansofprotectedareastoaddresssealevelriseimpacts/implications.• Developorenhancefinancialincentivestoencouragethemaintenanceofnaturalshorelines.
Education & Research• Developdetailedcounty-scalesealevelriseadaptationplan• Developbettersealevelrisemodels.• Createacost/benefitanalysisofavarietyofmanagementapproaches.• PrioritizeprotectionofhabitatinthefaceofrisingsealevelsintheActionAgenda.
Restoration• Restorecoastalprocesses.• Decreasepublicinfrastructureintheshoreline.• Removearmorfromforagefishspawningbeaches.
For more information contact Tina Whitman, FRIENDS of the San Juans’ Science Director at [email protected] or 360-378-2319.
Graphic courtesy of Coastal Geologic Services.
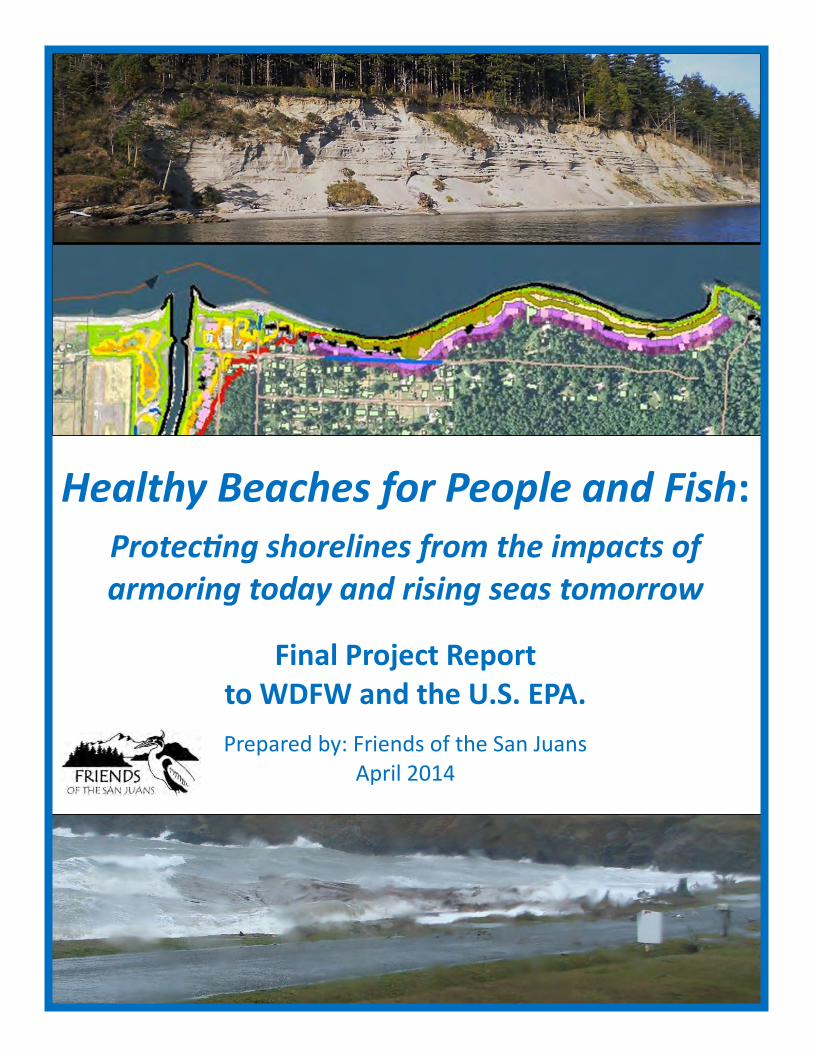
Healthy Beaches for People and Fish: Protecting shorelines from the impacts of armoring today and rising seas tomorrow
Final Project Report to WDFW and the U.S. EPA.
Prepared by: Friends of the San Juans April 2014
Healthy Beaches for People and Fish
1
The goal of the Healthy Beaches for People and Fish: Protecting shorelines from the impacts of armoring today and rising seas tomorrow project is to improve the long-term protection of nearshore marine ecosystems by developing new technical tools and identifying management strategies that specifically address sea level rise and the cumulative impacts of shoreline armoring.
The Healthy Beaches for People and Fish project was completed in 2014 by Friends of the San Juans in partnership with Coastal Geologic Services, Salish Sea Biological and the Washington Department of Fish and Wildlife. The technical advisory group that guided the project approach and work consisted of representatives from the University of Washington, United States Geological Survey, Puget Sound Partnership, Skagit River Systems Cooperative, Samish Indian Nation, San Juan County Public Works, San Juan County Salmon Recovery Lead Entity, The Tulalip Tribes, Padilla Bay National Estuarine Research Reserve and the Washington State Departments of Ecology, Natural Resources and Fish and Wildlife.
The project contained four distinct research areas that informed management recommendations:
• A legal review of existing local, state and federal shoreline regulations and their ability to address sea level rise and cumulative impacts;
• Sea level rise vulnerability assessment for San Juan County;
• Forage fish spawning habitat research; and
• Surveys of coastal managers, regulators and researchers.
Reports and data products associated with this project can be found online at www.sanjuans.org/NearshoreStudies.htm and include:
Friends of the San Juans. 2014. Healthy Beaches for People and Fish: Protecting shorelines from the impacts of armoring today and rising seas tomorrow. Final Report to WDFW and the U.S. EPA. Friday Harbor, Washington.
Loring, K. 2013. Addressing Sea Level Rise and Cumulative Ecological Impacts in San Juan County Washington Through Improved Implementation and Effective Amendment of Local, State, and Federal Laws. Friends of the San Juans. Friday Harbor, Washington.
MacLennan, A. and J. Waggoner. 2013. Sea Level Rise Vulnerability Assessment for San Juan County, Washington. Prepared by Coastal Geologic Services for Friends of the San Juans.
Whitman, T. and D. Penttila. 2014. Tidal elevation of surf smelt spawn habitat study for San Juan County Washington. Friends of the San Juans, Salish Sea Biological and Washington Department of Fish and Wildlife.
Whitman, T. and S. Hawkins. 2013. The impacts of shoreline armoring on beach spawning forage fish habitat in San Juan County, Washington. Friends of the San Juans. Friday Harbor, Washington.
This project has been funded in part by the United States Environmental Protection Agency under assistance agreement PC 00J29801 to Washington Department of Fish and Wildlife. The contents of this document do not necessarily reflect the views and policies of the Environmental Protection Agency, nor does mention of trade names or commercial products constitute endorsement or recommendation for use. Match funding for the project was provided by the Bullitt Foundation and the North Pacific Landscape Conservation Cooperative. In kind match provided by Friends of the San Juans, Coastal Geologic Services, Salish Sea Biological and technical advisory group participants.
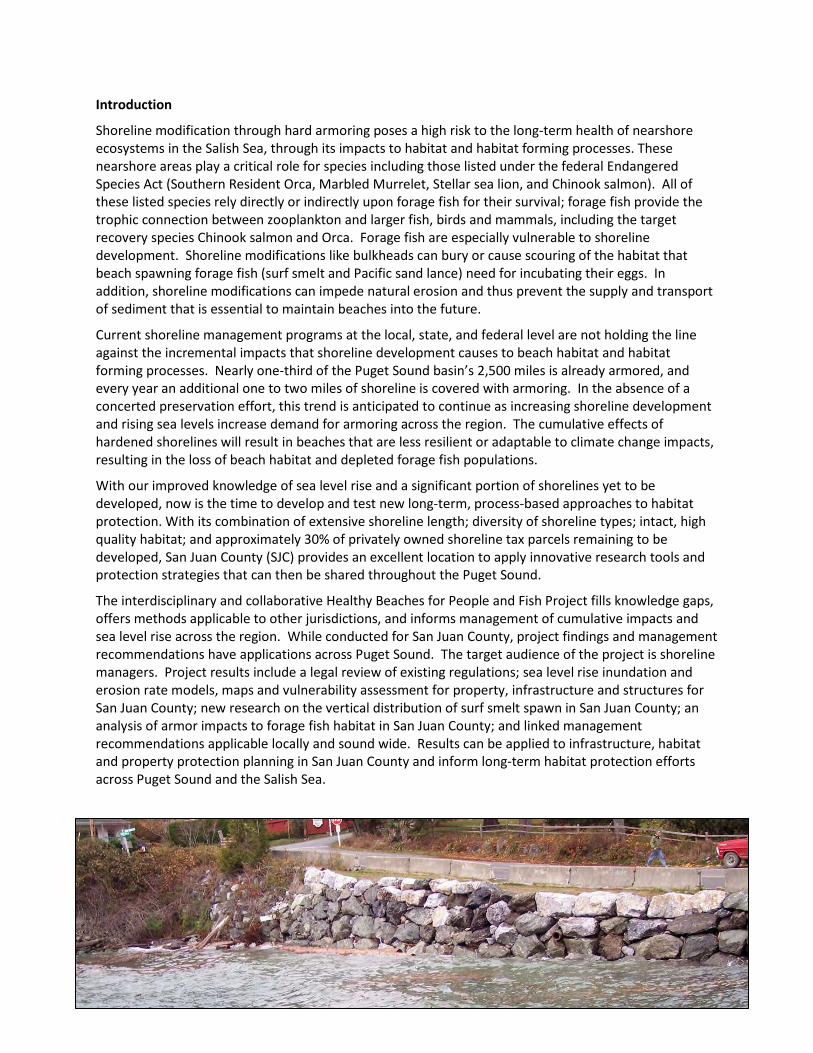
Introduction
Shoreline modification through hard armoring poses a high risk to the long-term health of nearshore ecosystems in the Salish Sea, through its impacts to habitat and habitat forming processes. These nearshore areas play a critical role for species including those listed under the federal Endangered Species Act (Southern Resident Orca, Marbled Murrelet, Stellar sea lion, and Chinook salmon). All of these listed species rely directly or indirectly upon forage fish for their survival; forage fish provide the trophic connection between zooplankton and larger fish, birds and mammals, including the target recovery species Chinook salmon and Orca. Forage fish are especially vulnerable to shoreline development. Shoreline modifications like bulkheads can bury or cause scouring of the habitat that beach spawning forage fish (surf smelt and Pacific sand lance) need for incubating their eggs. In addition, shoreline modifications can impede natural erosion and thus prevent the supply and transport of sediment that is essential to maintain beaches into the future.
Current shoreline management programs at the local, state, and federal level are not holding the line against the incremental impacts that shoreline development causes to beach habitat and habitat forming processes. Nearly one-third of the Puget Sound basin’s 2,500 miles is already armored, and every year an additional one to two miles of shoreline is covered with armoring. In the absence of a concerted preservation effort, this trend is anticipated to continue as increasing shoreline development and rising sea levels increase demand for armoring across the region. The cumulative effects of hardened shorelines will result in beaches that are less resilient or adaptable to climate change impacts, resulting in the loss of beach habitat and depleted forage fish populations.
With our improved knowledge of sea level rise and a significant portion of shorelines yet to be developed, now is the time to develop and test new long-term, process-based approaches to habitat protection. With its combination of extensive shoreline length; diversity of shoreline types; intact, high quality habitat; and approximately 30% of privately owned shoreline tax parcels remaining to be developed, San Juan County (SJC) provides an excellent location to apply innovative research tools and protection strategies that can then be shared throughout the Puget Sound.
The interdisciplinary and collaborative Healthy Beaches for People and Fish Project fills knowledge gaps, offers methods applicable to other jurisdictions, and informs management of cumulative impacts and sea level rise across the region. While conducted for San Juan County, project findings and management recommendations have applications across Puget Sound. The target audience of the project is shoreline managers. Project results include a legal review of existing regulations; sea level rise inundation and erosion rate models, maps and vulnerability assessment for property, infrastructure and structures for San Juan County; new research on the vertical distribution of surf smelt spawn in San Juan County; an analysis of armor impacts to forage fish habitat in San Juan County; and linked management recommendations applicable locally and sound wide. Results can be applied to infrastructure, habitat and property protection planning in San Juan County and inform long-term habitat protection efforts across Puget Sound and the Salish Sea.

Background
The cumulative impacts of developing rising shorelines constitute a regional problem that may need to be addressed at the local, state and federal levels. Unless habitat protection efforts are significantly improved, the cumulative impacts of shoreline alterations and rising sea levels will impede the long-term success of Puget Sound marine ecosystem recovery efforts.
Several entities have highlighted the threats posed by the cumulative effects of shoreline development and climate change in the Salish Sea. The Marine Resources Committee’s Marine Stewardship Area Plan and the San Juan Islands Accountability Oversight Group’s Action Agenda (San Juan County and Puget Sound Partnership) identified cumulative impacts and climate change as two of the top three threats to the San Juans’ marine ecosystems. To address these threats, both plans recommend more technical information on likely impacts and specific areas of vulnerability, as well as improving implementation of and compliance with existing regulations. In 2008, the San Juan Initiative, a two-year ecosystem based management process that included both agency and community members, also highlighted the need to make significant improvements to nearshore habitat protection programs. In addition, the Puget Sound Partnership’s Biennial Science Work Plan emphasizes the need to connect new science with management priorities (especially on the topic of shoreline armoring) as well as the importance of protecting and conserving intact nearshore marine ecosystems.
Despite widespread recognition of the ineffectiveness of current habitat protection programs, a significant portion of the resources allocated to marine ecosystem recovery in the Puget Sound remain focused on habitat restoration. For example, review of shoreline permits in San Juan County from 1972-2010 found that the inclusion of protective language in both the Critical Areas and Shoreline Master Program sections of code in the late 1990’s made no difference in either the rate or number of permits for new docks over eelgrass or new armoring at known forage fish spawning beaches. In addition, the Washington State Department of Fish and Wildlife recently conducted an internal review of its shoreline permit process under the Hydraulic Code. Results found that even in cases where protection provisions were included in permit authorizations, and compliance with provisions by developers was high, projects still failed to meet no net loss objectives for saltwater habitats of special concern.
Restoration efforts will not achieve recovery goals until existing protection programs are successful. For example, the recovery plan for Puget Sound Chinook salmon is based on the assumption that current protection efforts are functioning, and that the restoration actions emphasized in the plan will result in net gains to habitat. Long-term protection of existing intact shorelines, through improved effectiveness of existing regulations, regulatory reform and voluntary conservation programs, is the most cost-efficient and ecologically-effective approach to improving marine health in the region.
The goal of this project is to achieve long-term protection of nearshore ecosystems by creating new technical tools and adaptive management strategies to specifically address cumulative impacts and sea level rise within existing regulatory frameworks. Project results will be applied to improved management of infrastructure, permit and plan review and salmon recovery efforts in San Juan County, with transferability to all coastal communities in Puget Sound. Application of results to improved regulatory protection in San Juan County and beyond will lead to improved ecosystem resiliency in the face of climate change impacts.
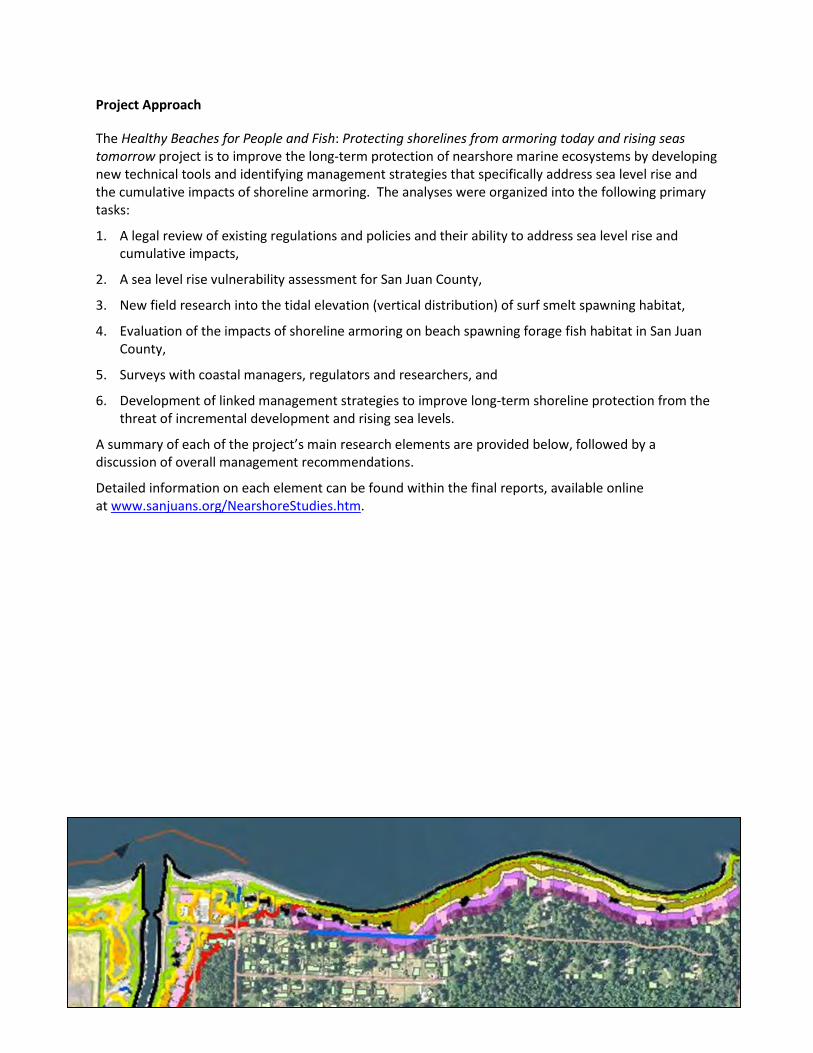
Project Approach
The Healthy Beaches for People and Fish: Protecting shorelines from armoring today and rising seas tomorrow project is to improve the long-term protection of nearshore marine ecosystems by developing new technical tools and identifying management strategies that specifically address sea level rise and the cumulative impacts of shoreline armoring. The analyses were organized into the following primary tasks:
1. A legal review of existing regulations and policies and their ability to address sea level rise and cumulative impacts,
2. A sea level rise vulnerability assessment for San Juan County,
3. New field research into the tidal elevation (vertical distribution) of surf smelt spawning habitat,
4. Evaluation of the impacts of shoreline armoring on beach spawning forage fish habitat in San Juan County,
5. Surveys with coastal managers, regulators and researchers, and
6. Development of linked management strategies to improve long-term shoreline protection from the threat of incremental development and rising sea levels.
A summary of each of the project’s main research elements are provided below, followed by a discussion of overall management recommendations.
Detailed information on each element can be found within the final reports, available online at www.sanjuans.org/NearshoreStudies.htm.

Legal Review
The regulatory review element of the Healthy Beaches for People and Fish Project explored existing federal, state, and local laws and regulations and other legal doctrines that authorize or compel the inclusion of sea level rise and cumulative impacts analyses into planning and permitting processes. The regulatory review concludes with recommendations for improved implementation of the existing Washington Shoreline Management Act, enforcement of the state’s fiduciary responsibility to protect public trust interest in nearshore areas and the federal government’s duty to protect tribal fishing rights, and non-legal approaches like conservation easements and revised taxation schemes that reward shoreline property owners for retaining natural shorelines. For a summary of the laws and non-legal options explored in the regulatory review, see Table 1. Regulatory Review Scope.
Table 1. Regulatory Review Scope
Federal Law State & Local Law Other Legal Authority Non-legal Options
Clean Water Act (1972) Aquatic Lands Law (1984)- DNR
Public Trust Doctrine- state has trustee duty to protect public resources
Conservation easements
Coastal Zone Mgmt. Act (1972)
Growth Mgmt. Act (1990) and Critical Areas Ordinances
Rolling Easements Tax incentives for retaining natural shorelines
Endangered Species Act (1973)
Hydraulic Code (1943)- WDFW
Tribal Treaty Rights Funding/programs to relocate public infrastructure
National Environmental Policy Act (1970)
State Environmental policy Act (1971)
Funding/programs to purchase at risk private property
National Flood Insurance Act (1968)
Shoreline Management Act (1971)
Key Findings of the regulatory review:
• Few federal, state, or local laws or regulations expressly address the need to perform sea level rise analyses.
• Despite the lack of specific language addressing sea level rise, existing laws do offer sufficient authority and mandates to protect our state’s public resources from the cumulative impacts of armoring as sea levels rise toward upland development.
• Those laws also offer the authority for local jurisdictions and non-profit organizations to design financial incentives to protect natural shorelines through taxation programs and conservation easements.
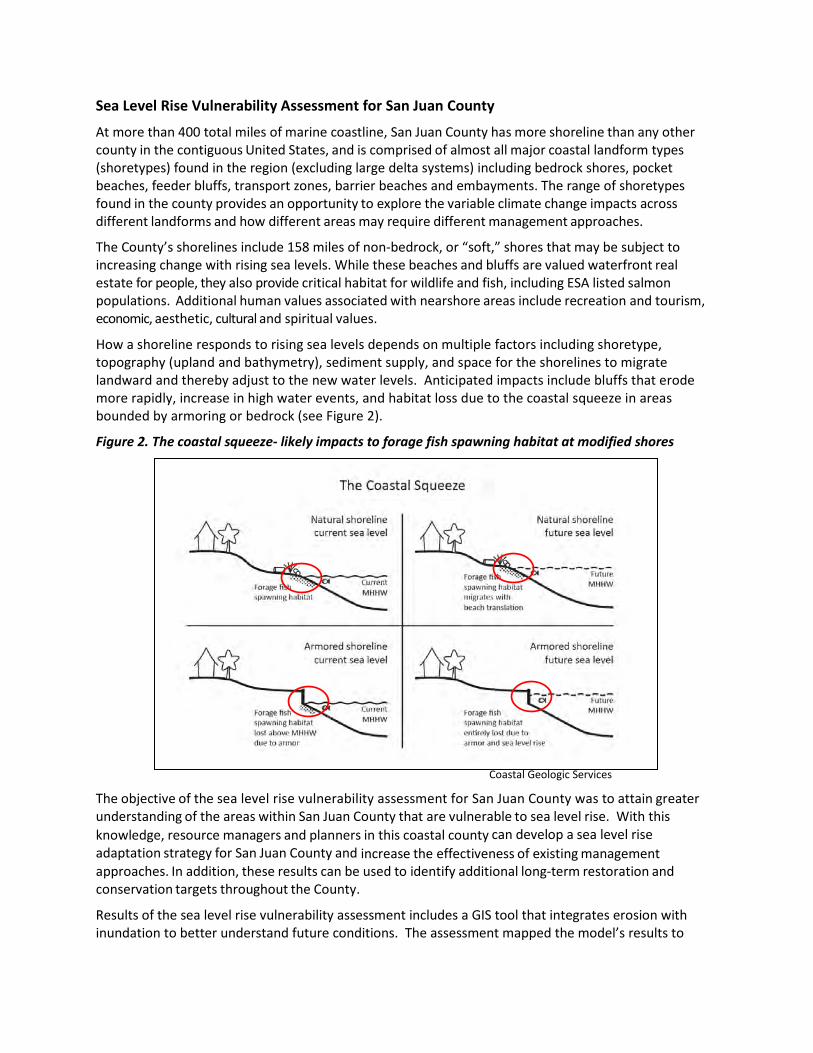
Sea Level Rise Vulnerability Assessment for San Juan County
At more than 400 total miles of marine coastline, San Juan County has more shoreline than any other county in the contiguous United States, and is comprised of almost all major coastal landform types (shoretypes) found in the region (excluding large delta systems) including bedrock shores, pocket beaches, feeder bluffs, transport zones, barrier beaches and embayments. The range of shoretypes found in the county provides an opportunity to explore the variable climate change impacts across different landforms and how different areas may require different management approaches.
The County’s shorelines include 158 miles of non-bedrock, or “soft,” shores that may be subject to increasing change with rising sea levels. While these beaches and bluffs are valued waterfront real estate for people, they also provide critical habitat for wildlife and fish, including ESA listed salmon populations. Additional human values associated with nearshore areas include recreation and tourism, economic, aesthetic, cultural and spiritual values.
How a shoreline responds to rising sea levels depends on multiple factors including shoretype, topography (upland and bathymetry), sediment supply, and space for the shorelines to migrate landward and thereby adjust to the new water levels. Anticipated impacts include bluffs that erode more rapidly, increase in high water events, and habitat loss due to the coastal squeeze in areas bounded by armoring or bedrock (see Figure 2).
Figure 2. The coastal squeeze- likely impacts to forage fish spawning habitat at modified shores
Coastal Geologic Services
The objective of the sea level rise vulnerability assessment for San Juan County was to attain greater understanding of the areas within San Juan County that are vulnerable to sea level rise. With this knowledge, resource managers and planners in this coastal county can develop a sea level rise adaptation strategy for San Juan County and increase the effectiveness of existing management approaches. In addition, these results can be used to identify additional long-term restoration and conservation targets throughout the County.
Results of the sea level rise vulnerability assessment includes a GIS tool that integrates erosion with inundation to better understand future conditions. The assessment mapped the model’s results to
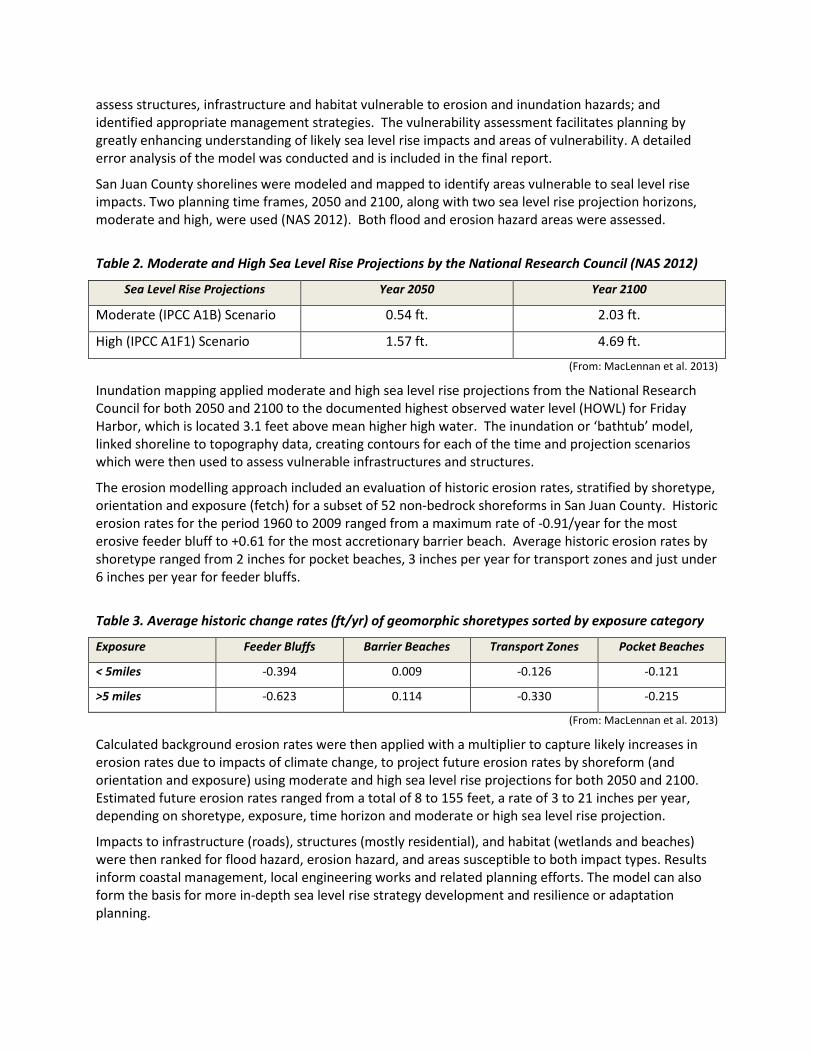
assess structures, infrastructure and habitat vulnerable to erosion and inundation hazards; and identified appropriate management strategies. The vulnerability assessment facilitates planning by greatly enhancing understanding of likely sea level rise impacts and areas of vulnerability. A detailed error analysis of the model was conducted and is included in the final report.
San Juan County shorelines were modeled and mapped to identify areas vulnerable to seal level rise impacts. Two planning time frames, 2050 and 2100, along with two sea level rise projection horizons, moderate and high, were used (NAS 2012). Both flood and erosion hazard areas were assessed.
Table 2. Moderate and High Sea Level Rise Projections by the National Research Council (NAS 2012)
Sea Level Rise Projections Year 2050 Year 2100
Moderate (IPCC A1B) Scenario 0.54 ft. 2.03 ft.
High (IPCC A1F1) Scenario 1.57 ft. 4.69 ft.
(From: MacLennan et al. 2013)
Inundation mapping applied moderate and high sea level rise projections from the National Research Council for both 2050 and 2100 to the documented highest observed water level (HOWL) for Friday Harbor, which is located 3.1 feet above mean higher high water. The inundation or ‘bathtub’ model, linked shoreline to topography data, creating contours for each of the time and projection scenarios which were then used to assess vulnerable infrastructures and structures.
The erosion modelling approach included an evaluation of historic erosion rates, stratified by shoretype, orientation and exposure (fetch) for a subset of 52 non-bedrock shoreforms in San Juan County. Historic erosion rates for the period 1960 to 2009 ranged from a maximum rate of -0.91/year for the most erosive feeder bluff to +0.61 for the most accretionary barrier beach. Average historic erosion rates by shoretype ranged from 2 inches for pocket beaches, 3 inches per year for transport zones and just under 6 inches per year for feeder bluffs.
Table 3. Average historic change rates (ft/yr) of geomorphic shoretypes sorted by exposure category
Exposure Feeder Bluffs Barrier Beaches Transport Zones Pocket Beaches
< 5miles -0.394 0.009 -0.126 -0.121
>5 miles -0.623 0.114 -0.330 -0.215
(From: MacLennan et al. 2013)
Calculated background erosion rates were then applied with a multiplier to capture likely increases in erosion rates due to impacts of climate change, to project future erosion rates by shoreform (and orientation and exposure) using moderate and high sea level rise projections for both 2050 and 2100. Estimated future erosion rates ranged from a total of 8 to 155 feet, a rate of 3 to 21 inches per year, depending on shoretype, exposure, time horizon and moderate or high sea level rise projection.
Impacts to infrastructure (roads), structures (mostly residential), and habitat (wetlands and beaches) were then ranked for flood hazard, erosion hazard, and areas susceptible to both impact types. Results inform coastal management, local engineering works and related planning efforts. The model can also form the basis for more in-depth sea level rise strategy development and resilience or adaptation planning.

Key Findings of the Sea Level Rise Vulnerability Assessment:
• There is significant risk to public and private roads from sea level rise inundation (20 miles) and erosion (10 miles) hazards; see Figure 3 below for a map of vulnerable roads in the county.
• There is significant risk to primarily residential shoreline structures from sea level rise erosion and/or flood hazards (over 1,200 structures).
• Priority habitats and places are also vulnerable to sea level rise, including parks, forage fish spawning beaches and coastal wetlands.
Figure 3. San Juan County roads vulnerable to sea level impacts (erosion and inundation combined)

Forage Fish Spawning Habitat Research
Forage fish play a key role in marine food webs, with a small number of species providing the trophic connection between zooplankton and larger fishes, squids, seabirds and marine mammals, including ESA listed species such as Chinook salmon and the marbled murrelet. Beach spawning forage fish, such as surf smelt (Hypomesus pretiosus) and Pacific sand lance (Ammodytes hexapterus), are threatened by land use activities along shorelines, where development is also concentrated.
Forage fish spawning areas in San Juan County (SJC) and throughout Puget Sound are especially vulnerable to the impacts of shoreline armoring. Sea level rise is expected to exacerbate the impacts of shoreline armoring on forage fish spawning habitat. In addition, sea level rise and other implications of climate change such as increased storminess are anticipated to result in the increased demand for new shoreline armoring, which will further compound forage fish spawning habitat loss and degrade the nearshore sediment sources or feeder bluffs that sustain nearshore habitats.
The Healthy Beaches for People and Fish Project completed two assessments of forage fish spawning habitat: 1) new field research on the vertical distribution of incubating surf smelt eggs, and 2) an ARC GIS based analysis of forage fish spawning habitat, shoreline development patterns and shoreline armoring. Both forage fish spawning habitat research elements improve understanding and evaluation of the likely cumulative impacts of armor and vulnerability to rising sea levels.
Tidal Elevation of Surf Smelt Spawn in San Juan County Study
The surf smelt, Hypomesus pretiosus, is an important “forage fish” link in the local marine food webs of the Puget Sound/Salish Sea basin. It is an obligate upper intertidal spawner on mixed sand-gravel beaches, and is presently estimated to use about 10% of the total shoreline of the Puget Sound basin for spawning. Conservation of this marine forage fish’s critical spawning habitat has been used as a defining tool for the conservation of intact, natural shorelines in Washington State for many years. State regulations like the Hydraulic Code Rules expressly identify the need to protect surf smelt, along with similar language pertaining to companion shoreline-spawning forage fish species, the Pacific sand lance (Ammodytes) and the Pacific herring (Clupea).
Surf smelt spawning habitat was not documented within San Juan County by any state resource agency until 1989, although local residents likely knew of its spawning activity many years prior to that time. Subsequent surf smelt spawning habitat surveys by WDFW (1990s) and Friends of the San Juans (2002-2004) mapped approximately 10 miles of surf smelt spawning habitat within San Juan County, across 76 individual geomorphic shoreform units. A map of the known distribution of surf smelt spawning sites in San Juan County can be found at Figure 4. While year-round data do not exist for most sites, those sites that were surveyed extensively, Blind Bay, Shaw Island (WDFW) and Westcott Bay, San Juan Island (FSJ), verify virtually year-round spawning activity.
Most assessment of surf smelt spawning habitat in Puget Sound has been limited to a presence/absence mapping function; these surveys document site use and linear shoreline extent of spawning habitat distribution. The goal of this tidal elevation of surf smelt spawn study was to improve understanding of the vertical egg distribution of incubating surf smelt eggs across multiple regions, sites and seasons. Surf smelt eggs were sampled across the beach profile at previously documented, known spawning sites.
An improved understanding of the vertical extent of intertidal habitat utilized by surf smelt has direct application to the management of forage fish habitat, including project and plan level development review; better quantification of cumulative effects and likely impacts of rising sea levels; and restoration and protection project design and effectiveness monitoring.

Surf smelt spawning has been documented for 72 unique shoreforms in San Juan County. Field surveys were conducted at a total of 39 previously documented spawning locations across 50 dates between September 2012 and September 2013. Incubating eggs were discovered on just 11 of those field dates, with just 9 dates and 15 sites (20% of total known smelt sites) yielding egg densities high enough to support collection of vertical egg distribution data transects.
Key findings of the tidal elevation of surf smelt spawn study:
• Surf smelt eggs can be found at variable tidal elevations across a beach face, reflecting differences in substrate conditions as well as the timing of spawn events in relation to water levels at the time; eggs were observed in samples from elevations ranging from as low as 3.7 feet to as high as 9.2 feet MLLW.
• The majority of eggs occurred in the upper intertidal zone; over 80% occurred in the upper third of the beach, at or above 6.2 feet.
• Over 30% of the eggs occurred at or above M.H.H.W.
• Extensive field reconnaissance surveys of known spawning sites in San Juan County for the purposes of this research also resulted in the unanticipated finding that smelt spawning activity at known “year-round” sites within San Juan County appears depressed in both time and space, most notably throughout the winter months.

Figure 4. Known Forage Fish Spawning Sites in San Juan County
*This map does not include seven spawning beaches that were documented in 2013/2014.
The Impacts of Shoreline Armoring on Forage Fish Spawning Habitat in San Juan County
Friends of the San Juans led an ARC GIS assessment of the specific impacts of shoreline armoring on the upper intertidal sand and gravel beach habitats required by two key forage fish in the Puget Sound region, surf smelt and Pacific sand lance. The objective of this research was to improve understanding of cumulative effects and inform habitat protection and restoration efforts. The approach completed an ARC GIS analysis of the spatial relationships between shoreline armoring, documented forage fish spawning habitat and development patterns in San Juan County, focusing on known impacts to habitat including direct burial, sediment supply and transport, riparian vegetation and sea level rise.
Key findings of the spatial analysis of armor impacts to forage fish spawn habitat include:
• Residential bulkheads and public shoreline roads are the primary source of shoreline armoring in San Juan County.
• Of the 10 miles of documented beach-spawning forage fish habitat mapped in San Juan County, 15% is already impacted by armoring.
• Direct burial of a portion of the upper extent of the spawning habitat zone occurs in over 90% of documented spawn sites; coincident with shoreline armoring in San Juan County, 11 acres of habitat are currently buried (13%).
• Armored spawning beaches at feeder bluffs, pocket beaches and rocky shores had significantly less overhanging marine riparian vegetation present than unarmored spawn sites.
• Coastal sediment supply processes that form and maintain spawning beaches in drift cells with documented forage fish have been impacted, through armored feeder bluffs that limit sediment supply to the system and armoring located below mean sea level, which prevents sediment transport alongshore.
• Rising sea levels at armored spawning sites will limit landward translation of beach habitat, resulting in an additional loss of three acres of documented spawn habitat.
• The majority of shoreline parcels in San Juan County are primarily held in private ownership for residential use.
• One-third of the private, developable shoreline properties are not yet developed with a residence, providing an opportunity to reduce future demand for armoring through expanded buffers and/or setbacks.
• There is a strong relationship between building setback distance and the presence of shoreline armoring (75% of developed parcels with armor have structures located within 100 feet while just 6% of armored shores occur on parcels with the primary structure located within 200 feet of the shoreline).
• Inclusion of forage fish spawning habitat protection policies and language in San Juan County’s Critical Areas Ordinance and Shoreline Master Program in the late 1990s did not result in a reduction in either the number or rate of shoreline armoring permits.
Relevant permit trends (pre/post CAO & SMP updates in late 1990s) include:
– exemption rates for new bulkheads are essentially unchanged;
– substantial development permits for new bulkheads have increased slightly;
– exemptions rates for repair/replacement of bulkheads have doubled; and
– code violations rates associated with armoring have doubled.
Communication with Coastal Managers, Regulators, Researchers, and Conservationists
Input from shoreline scientists, managers, planners, policy makers, regulators and non-governmental organizations on the management strategies component of the Healthy Beaches for People and Fish Project was collected through a variety of methods including one-on-one stakeholder interviews, shoreline manager and planner conference sessions, interaction with the project’s technical advisory group and focus group meetings with shoreline science and policy experts.
Stakeholder Interviews
A graduate student from UW’s Evans School of Public Affairs examined public policy approaches to address the interrelated issues of sea level rise and the cumulative effects of shoreline armoring by conducting one-on-one interviews with 28 local and regional managers, regulators, planners, elected officials and scientists. Stakeholders represent the following areas: state (12), local (11), regional, including federal (3) and tribal (3) agencies; their professions can be categorized as: scientist/engineer (12), elected official (1), policy manager (10) and permitter/regulator (6).
Interviews were conducted one-on-one, either in person, by phone, or via internet conference. The interviews focused on ways to amend or improve the effectiveness of existing environmental laws and regulations, including ways to improve the permitting process for shoreline development within the county. They also examined new approaches that the county could introduce to better adapt to sea level rise. Common interviewee recommendations include: new or expanded education programs and setback requirements, better interagency collaboration, and revisions to the county Shoreline Management Program and the state Hydraulic code.
Key findings from the stakeholder interviews included:
• All participants felt that too little was being done to address the impacts of sea level rise and cumulative effects.
• Most participants completed their shoreline management work without an established sea level rise policy (or if one existed it set broad policies that had not yet been translated to impact day to day actions).
• Participants noted that multiple approaches, including regulatory (HPA, SMP) and voluntary (incentives and education) action, would be essential to improving long-term shoreline management.
Interview participants provided many specific recommendations that informed overall project management recommendations, including recommendations to bolster jurisdictions’ perceived ability to “just say no” to requests for new armor. Additional regulatory strategies included improving the effectiveness of existing rules through increased and consistent enforcement and implementation. Participants almost uniformly identified major flaws in the Hydraulic Code’s ability to protect local resources, as well as opportunities to strengthen Shoreline Master Programs, especially in the area of expanded setbacks and restrictions on armoring. The lack of a federal role in shoreline armor review and permitting was also identified as a limitation to current protection frameworks; solutions included expanded U.S. Army Corps of Engineers jurisdiction as well as revisions to the National Floodplain Insurance Act. Non-regulatory recommendations highlighted the need for additional technical data, creative taxation and tax incentives, and improved awareness, especially among elected officials and vulnerable shoreline property owners.


Shoreline Manager and Planner Conference Sessions
The project included presentations at multiple conferences, including the San Juan County Marine Managers Workshop (2013), the Washington Chapter of the American Planning Association’s Annual Conference (2013), the Salish Sea Conference (2014), the emerging science workshop of the Salish Sea Shoreline Forum (2014) and the Climate Change: the Rules are Changing Continuing Legal Education Course (2014). The marine managers workshop is an annual conference hosted by the San Juan County Marine Resources Committee and the Northwest Straits Foundation that brings together planners and managers with jurisdiction over the marine shorelands and waters of the county, as well as some cross-archipelago staff and elected representatives of the Islands Trust, the local planning and governing organization for the Gulf island of British Columbia, Canada. Participants at the Washington Chapter of the American Planning Association’s annual conference included county and city planners from across Puget Sound, as well as representatives of Washington Sea Grant, University of Washington and state resource agencies.
Key findings from the conference session surveys with planners and managers included:
Governmental role:
• Only federal agencies have formal policies related to sea level rise, and even these are broad polices without detailed implementation frameworks.
• Sea level rise is not explicitly addressed in any participating local jurisdiction’s plans or policies (cities, counties).
• Some efforts at raising awareness and education are in place but are not well coordinated.
Opportunities:
• Develop and implement adaptation strategies/plans (funds and technical support needed). • Relocate public infrastructure at risk, especially roads. • Increase education, especially with decision makers and affected shoreline property owners.
Barriers:
• Current legal, social and economic frameworks seen as having a response that actually promotes armoring (protect at all costs).
• Lack of urgency to problem. • Lack of political will (and associated legal and financial pressure).

Focus Group Work Sessions
Project team members also presented results and held interactive meetings with key stakeholders that included San Juan County land use professionals (Public Works, Development and Planning, Parks, Land Bank, GIS), Tribes (Samish Indian Nation), and regional nongovernmental organizations active in shoreline protection (FutureWise, EarthJustice, Sierra Club, Whidbey Environmental Action Network and SoundAction). Meetings raised awareness of major research elements and new data and technical tools, and held in-depth discussions of key findings and management recommendations.
Technical Advisory Group
The multidisciplinary technical team for this project participated in a review of the project’s research elements as well as in the development of management recommendations. Following completion of technical project elements, the group convened for a two-day workshop to review research results and develop management recommendations. Management strategies were based on outcomes of the project’s technical elements and manager surveys as well as the professional expertise, experience and perspective of the diverse advisory group membership. Management discussions focused primarily on regulatory effectiveness and the reduction of shoreline armoring, but also included non-regulatory approaches including research, education, voluntary stewardship and restoration.

Management Recommendations
Management recommendations were derived from key findings of the technical elements of the project (regulatory review, sea level rise vulnerability assessment, forage fish spawning habitat analysis, and interviews and surveys conducted with managers, and shoreline research and policy experts); and by members of the technical advisory group and work sessions with county, tribal and non-governmental stakeholders. Management strategies are organized into regulatory and non-regulatory categories including:
1. Regulatory – Effectiveness – Reform
2. Non-regulatory – Stewardship (voluntary protection) – Research and Education – Restoration
In general, participants in management and policy discussions agreed that insufficient attention has been paid to protecting intact habitat and processes and that greater efforts have instead focused on developing shorelines and attempts to restore them. Most of the project participants identified regulatory management recommendations (both reform and effectiveness) as a higher priority than non-regulatory approaches. Of the non-regulatory recommendations, habitat restoration actions received the highest rankings, followed by stewardship (voluntary protection), research, education and lastly, habitat enhancement. While the focus of recommended management strategies was regulatory, there was also broad recognition that a full suite of protection strategies, voluntary and compulsory, will be required if efforts to reverse the incremental loss of shoreline function are to be successful.
Regulatory Management Recommendations
The project organized regulatory management recommendations into two categories - regulatory effectiveness and regulatory reform - to clarify which actions can be taken within existing legal frameworks (effectiveness) and which actions may require changes to the underlying laws or policies themselves (reform).
Regulatory Effectiveness
Top regulatory effectiveness management recommendations focused heavily on actions related to the Shoreline Master Program and the topic of shoreline armoring. The Shoreline Master Program was seen as having the largest potential impact, in the short term, on improved long-term protection of marine shorelines.
Specific strategies for the San Juan County’s Shoreline Master Program Update included:
• Only allow armoring when threat to primary structure is imminent and only as a last resort;
• Limit new development in areas vulnerable to the impacts of rising sea levels by requiring larger buffers and setbacks;
• Ensure that sea level rise is explicitly addressed at the plan and project level;
• Require (and monitor and adaptively manage) full mitigation for all armoring projects;
• Clarify the criteria for armoring exemptions;
• Require Department of Ecology review for all shoreline armoring permits (repair, replace or new);
• Require a conditional use permit for all new shoreline armoring permits at the County level (eliminate the exemption option at the county level) ;
• Better utilize state agency technical expertise in permit decisions (and engage this assistance early in the process); and
• Improve technical accuracy of Ordinary High Water Mark delineation (use Dept. Ecology expertise).
Strategies to improve regulatory effectiveness in long-term shoreline habitat protection also covered other areas of local, state and federal law including:
• Improve enforcement, including contractor responsibility and ecological restoration;
• Apply the public trust doctrine to protect marine shorelines and enforce state’s fiduciary responsibility to protect the public trust;
• Improve coordination among local jurisdictions and agencies, including tribal and federal as well as state agencies; and
• Explore more formal tribal role in permitting (hydraulic project approval and shoreline master program).
Regulatory Reform
Top regulatory reform management recommendations focused heavily on two areas of Washington State law: the Hydraulic Code and the Shoreline Management Act. Project participants broadly agreed that the Hydraulic Code had not been implemented effectively to protect habitat, and that the Shoreline Management Act offered opportunities to achieve that goal. The following sections identify regulatory reform recommendations that came out of project discussions.
Hydraulic Code Reform:
• Clarify Washington Department of Fish and Wildlife (WDFW) authority to protect fish life by denying permits for development that would harm fish;
• Clarify WDFW authority to evaluate sea level rise and cumulative impacts when reviewing applications for shoreline development; and
• Merge state and local marine shoreline permit review processes so that counties and Ecology incorporate WDFW biological expertise into their review of permit applications under Shoreline Master Programs, removing WDFW regulatory review of marine projects.
Note: There was not consensus regarding this recommendation and members of the technical advisory group from the Washington Department of Fish and Wildlife were among those who did not support a recommendation to deemphasize WDFW regulatory oversight of marine shorelines in favor of local regulatory oversight.
Shoreline Management Act reform:
• Require a shoreline permit for all armor projects;
• Prevent new armor on forage fish spawn sites or feeder bluffs;
• Require setbacks on marine shorelines large enough to limit requests for armoring for new development; and
• Require a full exploration of all alternatives to new armoring, including relocation of development where feasible.
Additional regulatory reform strategies:
• Revise national floodplain insurance to incorporate the increased risk of damage as sea levels rise;
• Require that real estate disclosures identify any risks associated with sea level rise;
• Update zoning to prevent new development in vulnerable areas; and
• Apply rolling easements to prevent fortification on public lands.
Non-Regulatory Management Recommendations
The Healthy Beaches for People and Fish Project also identified and developed non-regulatory management strategies to improve long-term protection of healthy marine shorelines from cumulative impacts in the face of rising sea levels. Voluntary strategies are organized into stewardship, research and education, and restoration categories.
Stewardship
The project participants identified easements and acquisitions as top actions but also identified the need for expanded stewardship incentive programs.
Stewardship management recommendations:
• Targeted easements and acquisitions of shoreline property to protect intact habitat;
• Expanded stewardship incentive programs, including financial incentives;
• Provide funds for managed retreat (relocation of structures, etc.); and
• Consider buyouts of vulnerable properties to reduce further demand for armoring.
Research and Education
Research and education strategies focused on the development of additional technical support tools to facilitate sea level rise adaptation, primarily at the county scale. Research efforts were ranked higher than education and outreach efforts.
Research and education management recommendations:
• Develop a detailed county-scale sea level rise adaptation plan;
• Perform a cost/benefit analysis of a variety of management approaches;
• Prioritize protection of habitat in the face of rising sea levels in the Puget Sound Action Agenda;
• Conduct outreach to communicate information about sea level rise to the community;
• Conduct outreach to communicate information about sea level rise to managers, hearing examiners, shoreline hearings board members and elected officials; and
• Improve sea level rise communication materials.
“Do NOT depend on altruism to protect critical habitats of any kind, anywhere at any time, but rather on solid regulations, steadfastly enforced” – Technical Team Participant
Restoration
Habitat improvement management strategies focused on restoration of key habitats and processes, and identified public infrastructure such as roads as a primary objective.
Specific restoration management recommendations included:
• Restore coastal processes to improve resiliency;
• Decrease public infrastructure in the shoreline; and
• Remove armor from forage fish spawning beaches and feeder bluffs.
Conclusions
In 2005, Washington’s leadership ambitiously set out to protect and restore Puget Sound by 2020. The state and country have spent significant sums of money toward that goal and have achieved some success through planning and restoration projects. Yet the Puget Sound Partnership’s State of the Sound report concluded in 2012 that only two (2) of the twenty-one (21) “vital sign” indicators it evaluated had showed progress toward the targets established for 2020 – shellfish bed health and estuarine restoration. All of the others, including water quality of beaches, number of whales, total number of Chinook salmon, and area of eelgrass, reflected a worsened status, mixed progress, or incomplete results.
Entities charged with protecting ecologically-healthy, naturally-functioning marine shorelines have authorized these cumulative impacts under federal, state, and local laws, and have not ensured the consideration of sea level rise in planning and permitting processes. As sea levels rise toward increased shoreline development, nearshore ecosystems will continue to suffer in the absence of effective adaptation strategies and improved ecological protection.
However, federal, state, and local laws offer sufficient authority to protect our state’s public resources from the cumulative impacts of shoreline development as sea levels rise. Agencies might start to stem the tide of incremental damage by altering their approaches to increase inter-agency coordination and intra-agency reviews and by shifting cultures that typically prove more responsive to human applicants than natural habitat. In addition, overlapping regulatory authorities need to be applied consistently by permit reviewers. Those laws also offer the authority for local jurisdictions and non-profit organizations to design financial incentives to protect natural shorelines through taxation programs and conservation easements. Changes in those laws could also more expressly direct the protection of healthy shoreline ecosystems and processes.
Additional research would assist in the implementation and improvement of existing regulatory protections. Future areas of research that could support shoreline preservation efforts include continued study of the direct impacts between shoreline armoring and nearshore ecosystems and a comparison of the economic costs for attempting to defend against sea level rise and those associated with adapting to it. Long-term protection of intact beaches and coastal processes will depend on public support and political will and expanded education and social marketing campaigns will be needed to generate support for systemic changes to shoreline protection.
“Non-regulatory strategies will be the key- it’s the only way to get compliance with regulations- it has to be voluntary” – Technical Team Participant
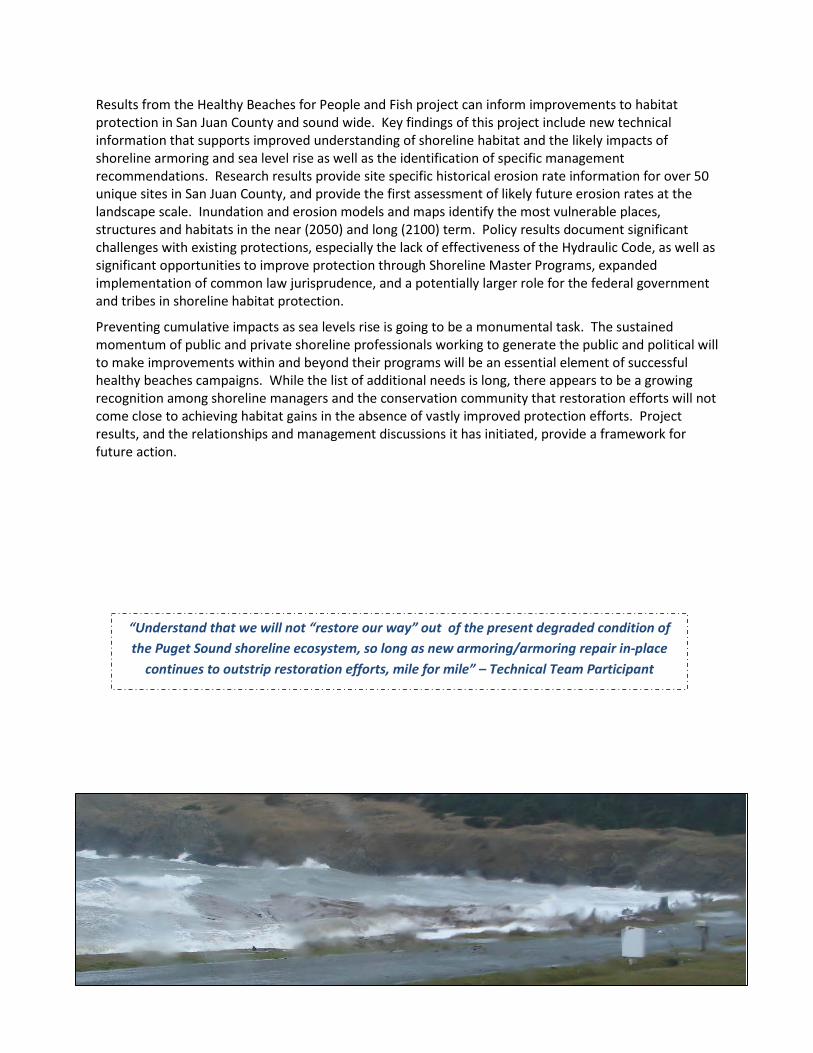
Results from the Healthy Beaches for People and Fish project can inform improvements to habitat protection in San Juan County and sound wide. Key findings of this project include new technical information that supports improved understanding of shoreline habitat and the likely impacts of shoreline armoring and sea level rise as well as the identification of specific management recommendations. Research results provide site specific historical erosion rate information for over 50 unique sites in San Juan County, and provide the first assessment of likely future erosion rates at the landscape scale. Inundation and erosion models and maps identify the most vulnerable places, structures and habitats in the near (2050) and long (2100) term. Policy results document significant challenges with existing protections, especially the lack of effectiveness of the Hydraulic Code, as well as significant opportunities to improve protection through Shoreline Master Programs, expanded implementation of common law jurisprudence, and a potentially larger role for the federal government and tribes in shoreline habitat protection.
Preventing cumulative impacts as sea levels rise is going to be a monumental task. The sustained momentum of public and private shoreline professionals working to generate the public and political will to make improvements within and beyond their programs will be an essential element of successful healthy beaches campaigns. While the list of additional needs is long, there appears to be a growing recognition among shoreline managers and the conservation community that restoration efforts will not come close to achieving habitat gains in the absence of vastly improved protection efforts. Project results, and the relationships and management discussions it has initiated, provide a framework for future action.
“Understand that we will not “restore our way” out of the present degraded condition of the Puget Sound shoreline ecosystem, so long as new armoring/armoring repair in-place
continues to outstrip restoration efforts, mile for mile” – Technical Team Participant


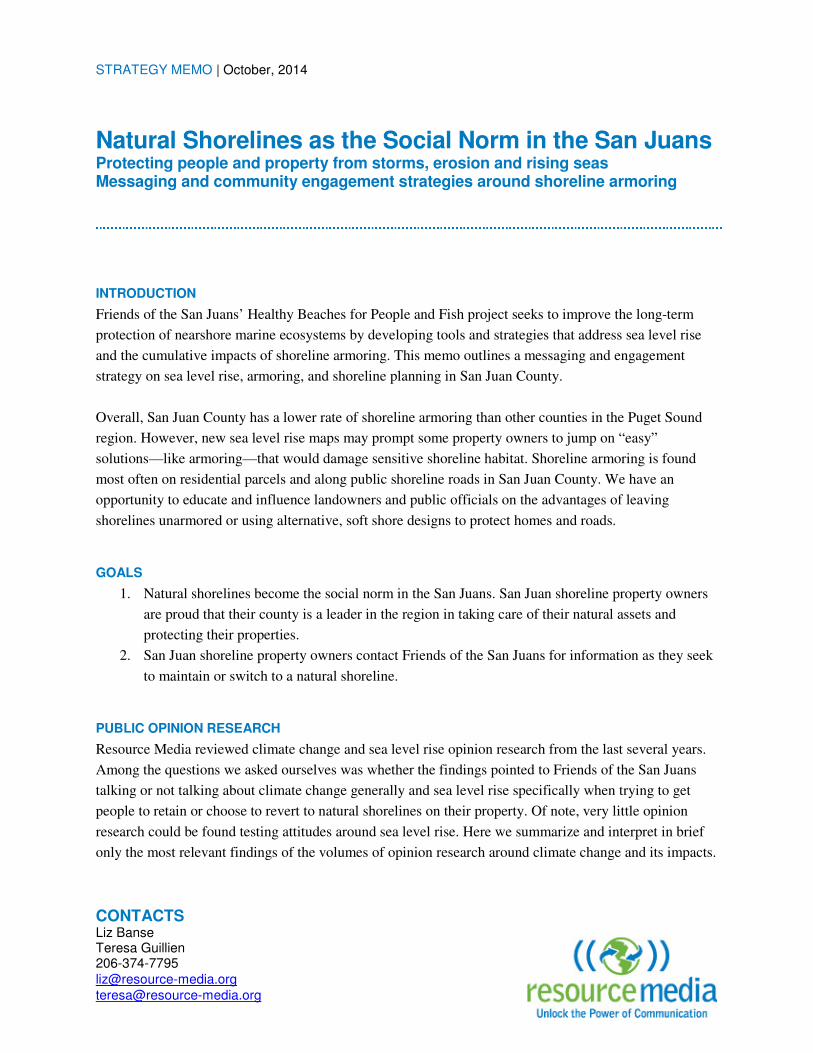
CONTACTS Liz Banse Teresa Guillien 206-374-7795
STRATEGY MEMO | October, 2014
Natural Shorelines as the Social Norm in the San Juans Protecting people and property from storms, erosion and rising seas Messaging and community engagement strategies around shoreline armoring
INTRODUCTION
Friends of the San Juans’ Healthy Beaches for People and Fish project seeks to improve the long-term
protection of nearshore marine ecosystems by developing tools and strategies that address sea level rise
and the cumulative impacts of shoreline armoring. This memo outlines a messaging and engagement
strategy on sea level rise, armoring, and shoreline planning in San Juan County.
Overall, San Juan County has a lower rate of shoreline armoring than other counties in the Puget Sound
region. However, new sea level rise maps may prompt some property owners to jump on “easy”
solutions—like armoring—that would damage sensitive shoreline habitat. Shoreline armoring is found
most often on residential parcels and along public shoreline roads in San Juan County. We have an
opportunity to educate and influence landowners and public officials on the advantages of leaving
shorelines unarmored or using alternative, soft shore designs to protect homes and roads.
GOALS
1. Natural shorelines become the social norm in the San Juans. San Juan shoreline property owners
are proud that their county is a leader in the region in taking care of their natural assets and
protecting their properties.
2. San Juan shoreline property owners contact Friends of the San Juans for information as they seek
to maintain or switch to a natural shoreline.
PUBLIC OPINION RESEARCH
Resource Media reviewed climate change and sea level rise opinion research from the last several years.
Among the questions we asked ourselves was whether the findings pointed to Friends of the San Juans
talking or not talking about climate change generally and sea level rise specifically when trying to get
people to retain or choose to revert to natural shorelines on their property. Of note, very little opinion
research could be found testing attitudes around sea level rise. Here we summarize and interpret in brief
only the most relevant findings of the volumes of opinion research around climate change and its impacts.

STRATEGY MEMO
Prepared for Friends of the San Juans October, 2014
2
What we found is that there are several significant barriers to overcome when asking people to change
their behaviors based on the threat of climate change. People persist in believing that climate change (and
sea level rise) is something that will occur “way off in the future” and are often reluctant to make major
changes now. Vaguely defined benefits or dangers don’t appear to sway audiences, and a sole focus on
the science of climate change can turn off some people.
Storms, however, are one aspect of climate change that people see as immediate, not futuristic. Research
shows that Americans are beginning to associate natural disasters such as Hurricane Sandy with climate
change. People increasingly attribute their belief in global warming to their own experience with weather,
including stronger storms and flooding. However, the recent Shore Friendly social marketing and other
research indicates that homeowners tend to be conservative about disaster preparedness until after they
actually experience a storm. This ties in to Friends of the San Juans’ plans to use significant storm and
erosion events as an educational and intervention opportunity.
Polling shows that most Puget Sound residents are not aware of the threats to the Sound’s waters and
shorelines. People believe that the Puget Sound is in good health and view pollution from industrial
activities as the primary threat to the health of the Sound. In recent surveys conducted as part of the Social
Marketing Strategy to Reduce Puget Sound Shoreline Armoring project, residents shared their strong,
emotional attachment to the waters where they live and indicated that they want to do the right thing.
However, landowners with unarmored property said that they were most concerned about current and
future erosion and want to be sure that they are protected. Landowners in focus groups indicated that they
would be open to alternative options if they know that their property would be protected. They also
indicated they would be inclined to try alternatives if there were tax breaks or financial options for soft
shore protection options.
STRATEGIC CONTEXT AND TARGET AUDIENCE
It’s important to understand some demographics that set San Juan County apart from other parts of the
Puget Sound. First of all, San Juan County is in possession of the most shoreline of any county in the
region. Parcels tend to have more shoreline than average, and San Juan County has the lowest rate of
armoring of any of the counties. Researchers note that there is a correlation: longer shoreline parcels are
less likely to be armored throughout the Puget Sound. San Juan County shoreline parcels tend to be of
higher value than in other parts of Puget Sound, with 68% valuing over $700,000.
The percentage of shoreline parcels owned by individuals residing outside of the county is much higher in
San Juan County (63%) than in the rest of the Puget Sound (39%) as is the number of parcels held in legal
structures. In San Juan County, 38% of shoreline parcels are owned in trusts, living estates, or other legal
entities, compared to 20% in other parts of the Sound.

STRATEGY MEMO
Prepared for Friends of the San Juans October, 2014
3
Most shoreline property owners in San Juan County are seniors—63% of them are over 60. Shoreline
parcel owners tend to be educated and vote at a higher rate than the statewide average.
AUDIENCES
Recent research conducted by the Social Marketing Strategy to Reduce Puget Sound Shoreline Armoring
project shows us that shoreline property owners should be our primary audience, but that key influencers
are consulted when property owners consider whether to armor or not. Therefore, we suggest targeting the
following audiences:
Primary audiences
• Shoreline property owners in vulnerable neighborhoods
• Tribal leaders
• County officials and land use planners
Secondary audiences
• Realtors
• Outreach staff and volunteers from community and conservation groups
• Contractors/professionals that install shoreline armoring
ELEMENTS OF A STRONG MESSAGE
A message is a statement intended to influence the opinion or action of a target audience. A message is
the basic building block of strategic communication. Developing a compelling message is critical to any
successful campaign. To be effective, a message must use common language and speak to the common
concerns held by the audience. Effective messages are factual, but contain more than facts alone.
Successful messages follow a simple formula: Values + Threat + Solution + Call to Action
Core values are common, deeply held feelings that are the bedrock of one’s opinion. They are broadly
shared and beyond question. A threat is the problem that puts those values at rick. The threat must be
credible to the audience. The solution must be simple and common sense. A call to action is what we
want people to do in response to the threat.
RECOMMENDED MESSAGES TO TEST
We recommend testing a few different messages with communications materials to be determined;
options include randomized mailers or phone calls. Second best would be a small set of focus groups
made up of shoreline property owners, including resident owner and second-home owners.

STRATEGY MEMO
Prepared for Friends of the San Juans October, 2014
4
In the three message options below, you will notice that we do not mention sea level rise. It is too far in
the future for people who aren’t already “true believers” to act on now (as with most aspects of climate
change). Instead we focus on the impacts of sea level rise that homeowners are acting on today – erosion
(from storms). This is a threat they are already responding to. As well, in the wording of these messages
we are trying to tap into people’s desire to fit in. We know from election/voter outreach that citizens are
more motivated to vote through a desire to fit in (others are doing it) than out of their civic duty and self-
interest.
These three messages are different versions of a message tapping into a broad social norm and people’s
desire to fit in, not to “do the right thing.” We could also test this against a message that talks specifically
about the targeted audience’s neighbors (a more localized social norm). A third variance could be a
message that speaks straight to property values and benefits, leaving out the community and fish and
wildlife benefits. We could use a “control group” message that speaks more to the science and directly
names climate, sea level rise, and future scenarios.
Worried about storms and erosion? Soft shore protection and other natural approaches protect
properties from storms and reduce the impact of waves. X % of San Juan shore-front
homeowners boast natural shorelines. These approaches retain the natural beauty of San Juan
shorelines and support the health and survival of our resident salmon, seals, and orcas.
Keep the San Juans special…and lose the bulkhead. Installing bulkheads and other types of
shoreline armoring to protect from storms and erosion may do more harm more than good. Soft
shore protection and other natural options protect the homes of X% of San Juan shoreline
property owners, retain the natural beauty of the San Juans, and help our resident salmon and
orcas survive.
Planning to install a bulkhead to protect against storms and erosion? Think twice! Soft shore
protection and restoration techniques can protect properties and help mitigate the impact of
storms and waves. Join X% of San Juan shore-front property owners who are taking the shore-
friendly approach to protecting their homes and land. These new shoreline options allow you to
retain the natural beauty of your shore—and help salmon, seals and orcas survive!
IMAGERY RECOMMENDATIONS
Visual communications can be a powerful tool to help property owners to popularize natural shorelines
and show them to be the social norm. We recommend visuals that show:
• People enjoying natural shorelines. For example, a couple walking along a natural shoreline in
front of their home.
• Images that reflect multiple generations enjoying shorelines. These images evoke the idea of
protecting shorelines for future generations to enjoy. Because San Juan County shoreline property
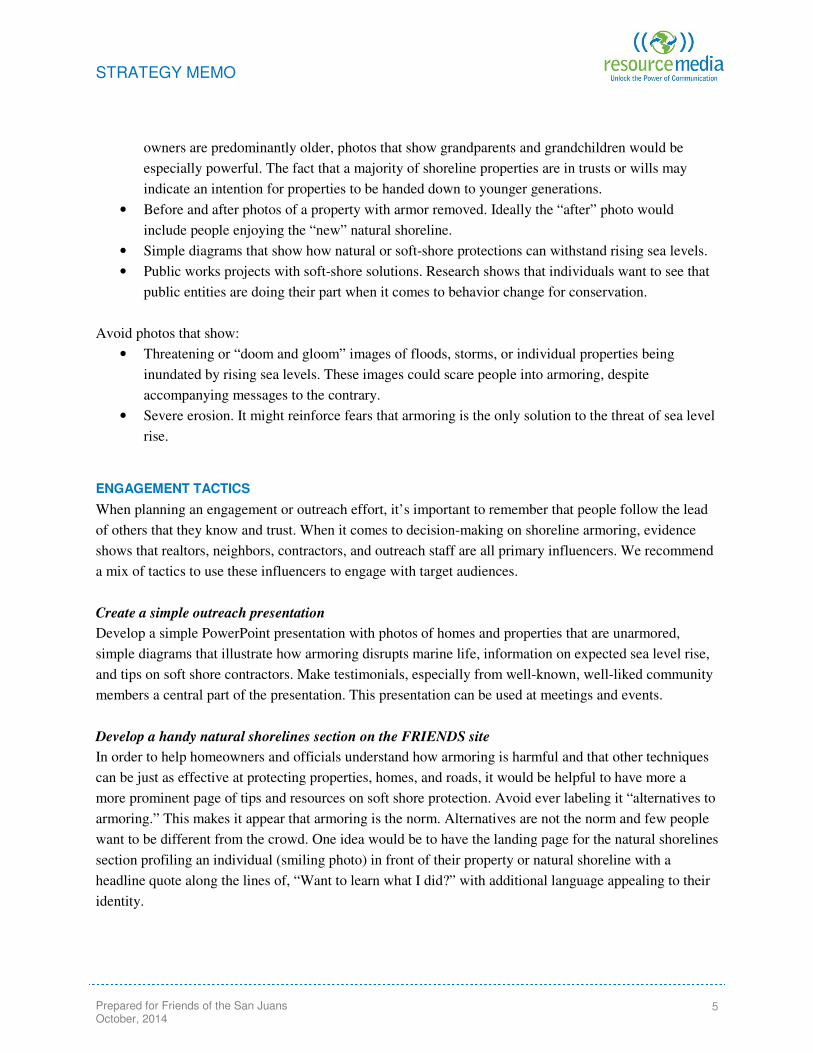
STRATEGY MEMO
Prepared for Friends of the San Juans October, 2014
5
owners are predominantly older, photos that show grandparents and grandchildren would be
especially powerful. The fact that a majority of shoreline properties are in trusts or wills may
indicate an intention for properties to be handed down to younger generations.
• Before and after photos of a property with armor removed. Ideally the “after” photo would
include people enjoying the “new” natural shoreline.
• Simple diagrams that show how natural or soft-shore protections can withstand rising sea levels.
• Public works projects with soft-shore solutions. Research shows that individuals want to see that
public entities are doing their part when it comes to behavior change for conservation.
Avoid photos that show:
• Threatening or “doom and gloom” images of floods, storms, or individual properties being
inundated by rising sea levels. These images could scare people into armoring, despite
accompanying messages to the contrary.
• Severe erosion. It might reinforce fears that armoring is the only solution to the threat of sea level
rise.
ENGAGEMENT TACTICS
When planning an engagement or outreach effort, it’s important to remember that people follow the lead
of others that they know and trust. When it comes to decision-making on shoreline armoring, evidence
shows that realtors, neighbors, contractors, and outreach staff are all primary influencers. We recommend
a mix of tactics to use these influencers to engage with target audiences.
Create a simple outreach presentation
Develop a simple PowerPoint presentation with photos of homes and properties that are unarmored,
simple diagrams that illustrate how armoring disrupts marine life, information on expected sea level rise,
and tips on soft shore contractors. Make testimonials, especially from well-known, well-liked community
members a central part of the presentation. This presentation can be used at meetings and events.
Develop a handy natural shorelines section on the FRIENDS site
In order to help homeowners and officials understand how armoring is harmful and that other techniques
can be just as effective at protecting properties, homes, and roads, it would be helpful to have more a
more prominent page of tips and resources on soft shore protection. Avoid ever labeling it “alternatives to
armoring.” This makes it appear that armoring is the norm. Alternatives are not the norm and few people
want to be different from the crowd. One idea would be to have the landing page for the natural shorelines
section profiling an individual (smiling photo) in front of their property or natural shoreline with a
headline quote along the lines of, “Want to learn what I did?” with additional language appealing to their
identity.

STRATEGY MEMO
Prepared for Friends of the San Juans October, 2014
6
Host home tours
Sponsor a soft shore protection home tour that allows new residents and realtors to visit properties where
low-impact techniques have been used to protect against erosion. These tours would allow neighbors and
homeowners to learn from each other and see for themselves how soft shore options can be effective and
attractive. Give all attendees a how-to sheet if they want to explore their options and take the next steps to
being Shore Friendly.
Plan realtor happy hours
Host a happy hour “open house” or property tours for realtors on how new homeowners can plan for sea
level rise. You can use the presentation that shows photos of high-end residences with attractive natural
shorelines, explain how homeowners can plan for sea level rise, and provide resources such as contractor
recommendations, incentive programs, and permitting advice. Can this be a part of an accreditation
program? Who is the best host and messenger for the realtor audience?
Develop and mail new homeowner packets
The purchase of a shoreline property often includes a key decision point for armoring. Develop a packet
or brochure that provides new homeowners with information on armoring, soft shore protection, sea level
rise, and tips and resources. These can be mailed directly to homeowners and distributed through realtors.
Our new messaging could be tested through these mailers.
Cultivate partnership with preferred contractors
By developing informal partnerships with contractors that do soft shore protection, you can refer residents
to them, and also potentially get information or photos about properties that are using these natural
techniques. Can you build up this cadre of trusted contractors through property tours and education?
Send mailings to non-resident property owners
Mailings and email or print newsletters would be a way to engage with the many non-resident property
owners in the San Juans. You could send regular information and targeted mailers that would include
information on alternatives to armoring and case studies of property owners who have used these
techniques to protect and enhance their homes. Our new messaging could be tested through these mailers.
Host informational social gatherings for non-resident property owners
People love to get to know their neighbors. Research the geo-clusters of second homeowners living
outside of the San Juans. Host a social gathering in the fall, winter or springtime for property owners in
Seattle and in other cities that also have high property ownership. Have a FOSJ supporter who lives in
that city host the gathering for their “San Juan neighbors” also living in that city.

STRATEGY MEMO
Prepared for Friends of the San Juans October, 2014
7
More testing of engagement strategies!
We know from voter mobilization research that in-person voter contact produces the highest rates of voter
turnout. Friends of the San Juans could use the early stages of this long-term effort to change social norms
and return more of the shoreline to its natural state for testing different engagement strategies as well as
different messaging. For example, could you have one neighborhood receive information about an
upcoming open house or property tour via an in-person canvasser with a script? In another, could you
have a neighbor (presumably an FOSJ volunteer) talking to neighbors and inviting them? And in a third
neighborhood, could you just do a mailing with information on the open house or property tour. When
people come, get their address and query them as to what got them there. Adopt these new, more effective
strategies for future outreach.