sea drive magazine
TRANSCRIPT

S P E C I A L R E P O R T
THE NEW OFFSHORE DESTINATION FOR YOU AND FOR YOUR DATA
OIL RIGSONCE SYMBOL’S OF ENVIRONMENTAL DISASTER. . .NOW ICONS FOR A GREENER FUTURE
REWIRED
*RYAN*
SEA:\ DRIVE


A FIRST LOOK INTO NEVER BEFORE SEEN DATA CENTERS RESPONSIBLE FOR THE CLOUD
ATLANTA DATA CENTERDouglas County, Georgia

THE WATERPROOF DATA SERVER
Brought to you by WP LTD.MAKING THE FUTURE A REALITY
www.firewire.compicture originally from Sony Advertisement
Disclaimer: this magazine has no affiliation with Sony

FEATURES 26.01REWIRED
THE HISTORY OF OIL RIGS
THE HISTORY OF DATA CENTERS
RECIPES: DOUBLE CHOCOLATE STOUT CAKE
WEARABLE FURNITURE DESIGN:SOLAR POWERED TABLE
Oil Rig
Data Center
CONTENTS 26.01REWIRED
1 PrefaceWhat are my personal reasons for wanting to explore this topic
2 IntroductionSome of the key project issues and challenges
3 Future ProductsOther motivating ideas
4 PrecedentsMy furniture entry for the Vellum furniture design competition
5 Climate AnalysisDemographics
6 Design ConsiderationsSolar, wind, tidal, waste management, and systems management
CONTENTS
CONTENTS7 Program
What are my personal reasons for wanting to explore this topic
8 BibliographySources cited

http://theinspirationroom.com/daily/print/2013/6/apple_ipad_mini_surfer.jpgDisclaimer: This magazine has no affiliation with Apple.

REWIRED
Ryan Grady [email protected] IN CHIEF
SPECIAL THANKS TO:
Sandy Stannard Jim Haberman Matt Grady Lori GradyWINTER 2014
SEA:\ DRIVE. Copyright © 2013 by Ryan Grady. All rights reserved. Printed in the United States of America. No part of this book my be used
or reproduced in any manner whatsoever without written permission except in the case of brief quotation embodied in critical articles
and reviews. For information address REG Publishers, 667 Stanford Drive, San Luis Obispo CA 93405.
REG books may be purchased for educational, business or sales promotional use. For information please write: Special Markets
Department, REG Publishers, 667 Stanford Drive, San Luis Obispo, CA 93405.
Designed by Ryan Grady
Library of Congress Cataloging-in-Publication Data has been applied for.
ISBN 000-0-01-100100-0
13 14 15 16 OV/RRD 10 9 8 7 6 5

SEA:\ DRIVE. THE MOVIE.COMING SPRING 2014
TO PREVIEW TRAILER< SCAN QR CODE BELOW

Data Centers will be in high demand in the future...A memoir from the editor.
Today’s generation grows up wanting, smaller, faster, lighter, and better computers, cell phones, and electronic gadgets in general. And when one does buy a phone or a computer, it is already obsolete within two years. It still functions like it originally did but within a time span of two years it already seems old, slow, and big and bulky. A company will release a new cell phone claiming it is the “thinnest cell phone ever” or perhaps the “best and brightest screen you have ever seen,” but within three months there is already a new challenger who has taken the title.
I am certainly guilty of wanting the next greatest technological gadget as soon as it comes out, even though I know it will be outdated the moment I buy it, as were the versions before them. The difference now is the product cycle is much shorter. Products don’t last like they used to, they are designed to be obsolete in a
PREFACE
much shorter time span inspired by an era of mass consumerism. I think there is a big opportunity to change this mind-set. Today we are seeing a reemergence of quality products that are meant to last a lifetime. People value quality products that they only have to buy once, not to mention they are more sustainable and better for the environment.
I remember when VCR players were used to watch movies. Next came DVD players, then Blue Ray players, and now, as long is there is an Internet connection, an online streaming service can be used, such as Netflix. The Internet is revolutionizing physical media in a digital way. It makes it possible for products to be smaller, faster, lighter, and yet more powerful. Products are just portals or different ways of connecting to the Internet. I would argue that a phone, an ipad, and a computer will all essentially serve the same purpose in the future. They
will just be different methods that are used to connect to the Internet. The Internet will help with the creation and longevity of quality products. Design is focused on the physical aspect of the product but also the digital software the product will use is just as important. Instead of having to frequently replace the physical hardware of the product, software updates will keep the product on the cutting edge more so than ever before.These are two reasons why I am personally interested in this project. First, the idea of the opportunity for the reemergence of sustainable, quality design. And second, the power of the Internet to make all the devices that access it just portals of connection. Currently, these two aspects are very under whelming, yet they hold great potential for future design to redefine their meanings and revive their importance once again.
RYAN GRADY WINTER 2014 ISSUE

the ISSUE INTRODUCTIONPeople are generating data at a fast rate, and all that data needs physical space to be stored. This allows for an opportunity in data center design. Data centers have been designed to blend in with their surroundings and not stand out. They now have a chance to become more iconic and give people a glimpse into the physical aspect of the digital world. In the past data centers have consumed large amounts of energy from nonrenewable resources. There is an opportunity to reinvent data center design using renewable energy.
Along with the problem of the never ending need for more data storage space is the decommissioning of offshore oil rigs. The decommissioning means that operators of the oil rigs now have a big cost to deal with. What if they didn’t have to remove the oil rig and incur large costs? What if the oil rig could be reused? What if the oil rig could become part of a new business infrastructure. In essence the oil rig would be rezoned for the use of a data center.
By combining an offshore data center with an aquarium and a hotel this project becomes more feasible. The increasing demand for data centers gives this project a viable need for something that may happen in the future, and if done well could lead to repeatable and reusable oil rig data center design.
Everyone in the world is or can be interconnected through the digital realm if they choose to be (whether or not they realize it). And as more people begin to rely on the Internet, people have come to expect richer, more fulfilling content delivered more quickly.
In response, large companies have begun popularizing the notion of the cloud. The cloud is a way that these large companies can deliver more and more data at ever-faster speeds. Companies are able to do the heavy lifting and the data crunching on their massive servers. This content is then pushed to your device. Essentially this makes whatever screen or device you look at just another window into the digital world. Google has a cloud. So does Apple, Facebook, Amazon and many others. If that information is available somewhere, people want it instantly. And that is exactly what the cloud is able to provide. Consequently, data, especially in the digital form, is here to stay. As people start generating more and more data, they will need a place to store it all. Storage of this digital data will require increasing amounts of physical space.

MAKE THE TRIP TO YOUR OIL RIG EASIER
http
://ric
hlaz
zara
.wor
dpre
ss.co
m/2
008/
08/14
/lazz
ara-
yach
ts-a
d-ca
mpa
ign/

IB
M
IBM Cloud hosts 30% more top websites than anyone in the world.
As more things become digital, data centers have an opportunity to be reinvented with a more public, interactive building typology. Although
there are benefits to having a secure, hidden data center; there are also advantages to making them stand out and showing people that they
don’t have to be hidden. Just as like with a bank, even though a bank has money and people know banks have money, they don’t typically walk
in and steal the money. Although that’s not to say it hasn’t happened frequently in the past (banks being robbed), however security is definitely a
concern that needs to be taken into account.
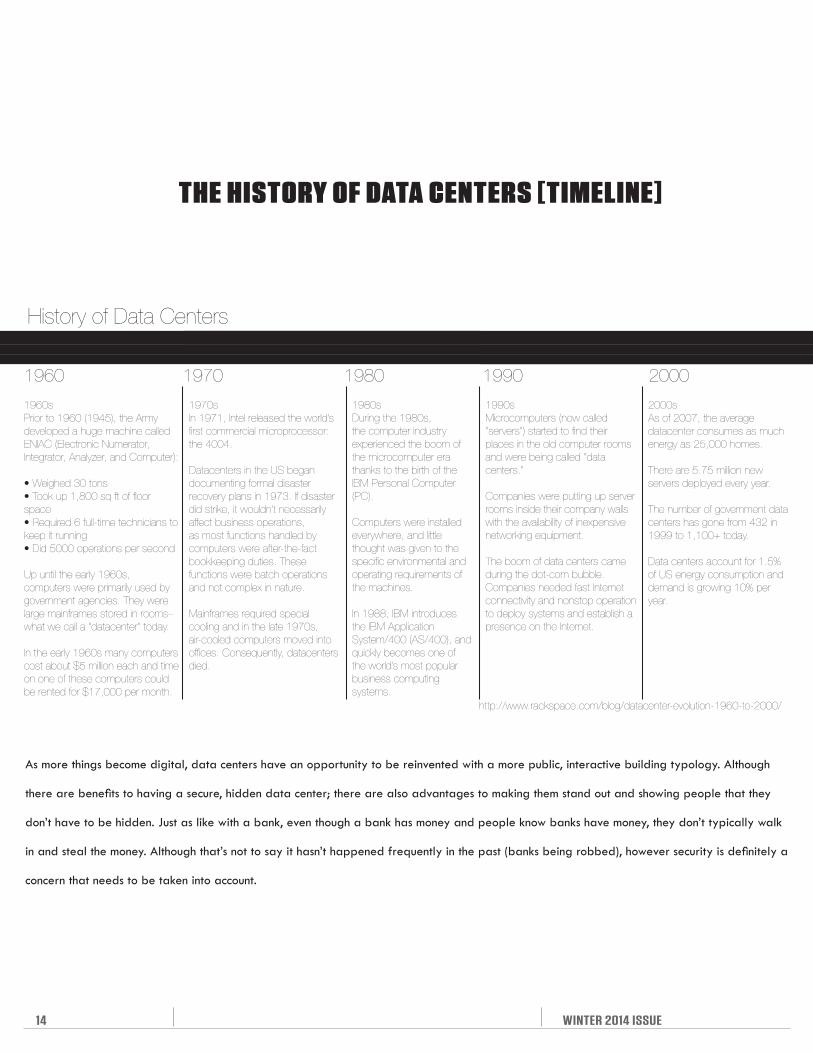
1960 1970 1980 1990 2000
History of Data Centers
1960sPrior to 1960 (1945), the Army developed a huge machine called ENIAC (Electronic Numerator, Integrator, Analyzer, and Computer):
• Weighed 30 tons• Took up 1,800 sq ft of floor space• Required 6 full-time technicians to keep it running• Did 5000 operations per second
Up until the early 1960s, computers were primarily used by government agencies. They were large mainframes stored in rooms– what we call a “datacenter” today.
In the early 1960s many computers cost about $5 million each and time on one of these computers could be rented for $17,000 per month.
1970sIn 1971, Intel released the world’s first commercial microprocessor: the 4004.
Datacenters in the US began documenting formal disaster recovery plans in 1973. If disaster did strike, it wouldn’t necessarily affect business operations, as most functions handled by computers were after-the-fact bookkeeping duties. These functions were batch operations and not complex in nature.
Mainframes required special cooling and in the late 1970s, air-cooled computers moved into offices. Consequently, datacenters died.
1980sDuring the 1980s, the computer industry experienced the boom of the microcomputer era thanks to the birth of the IBM Personal Computer (PC).
Computers were installed everywhere, and little thought was given to the specific environmental and operating requirements of the machines.
In 1988, IBM introduces the IBM Application System/400 (AS/400), and quickly becomes one of the world’s most popular business computing systems.
1990sMicrocomputers (now called “servers”) started to find their places in the old computer rooms and were being called “data centers.”
Companies were putting up server rooms inside their company walls with the availability of inexpensive networking equipment.
The boom of data centers came during the dot-com bubble. Companies needed fast Internet connectivity and nonstop operation to deploy systems and establish a presence on the Internet.
2000sAs of 2007, the average datacenter consumes as much energy as 25,000 homes.
There are 5.75 million new servers deployed every year.
The number of government data centers has gone from 432 in 1999 to 1,100+ today.
Data centers account for 1.5% of US energy consumption and demand is growing 10% per year.
http://www.rackspace.com/blog/datacenter-evolution-1960-to-2000/
THE HISTORY OF DATA CENTERS [TIMELINE]
14 WINTER 2014 ISSUE

Oil Rig Data Center Offshore Data Destination
PROJECT ISSUESWHY IS DATA SPACE AN ISSUE?
As of 2007, the average data center consumes as much energy as 25,000 homes.There are 5.75million new servers deployed every year.
The number of government data centers has gone from 432 in 1999 to 1,100+ todayDatacenters account for 1.5% of US energy consuption and demand is growing 10% per yearFacebook launched the open commute project providing specifications to their Prineville, Oregon data center that uses 38% less energy to do the same work as their other facilities, while costing 24% less.
As the growth of online data centers grows exponentially, there is opportunity and a need to run more efficient data centers.
STATISTICS
http://www.rackspace.com/blog/datacenter-evolution-1960-to-2000/
“30%of responding companies will run out of capacity in at least one of their sites this calendar year.”
“32% of responding companies said their data center budgets will rise more than 10% in 2012.”http://www.datacenterdynamics.com/focus/archive/2012/07/survey-it-will-be-integral-meet-rising-data-center-demand
15

VVELLUM 2013
“MORE POWER TO YOU”
The Vellum Furniture competition provided me with an outlet to experiment with green design and see if, in fact it was a feasible method to power an offshore data center with renewable energy. In order to test this hypothesis, I would design and build a solar powered table that could be used to power a laptop and other devices. Assuming a table could power a laptop, a cell phone, and charge batteries, and then potentially that power output could be drastically scaled up. And thus, I hoped this experiment would show that green energy would be a viable source to eventually power a building with the high energy demands of a data center.
16 BY RYAN GRADY WINTER 2014 ISSUE

1 1 0 W S o l a r P a n e l
S t r a p s f o r c a r r y i n g
F o l d s f l a t f o r e a s y c a r r y i n g o r s t a c k i n g
3 O u t l e t s a v a i l a b l e
A FEASIBILITY EXPERIMENT IN THE FORM OF A FOLD-ABLE SOLAR PANEL TABLE.
SOLAR TABLE MAKES OFFICE MOBILEThe table is made with a 110W solar panel and a 20 amp 12 volt high capacity li-on battery. There are three wall outlets as well as backpack straps for carrying the table. There is also a watt meter which provides real time information about how much power the table is currently generating and using. The market retail value is $500 available now from http://www.morepowertoyou.com.

THE MAKING OF
The build time was to source the parts and construct the table was two weeks. Besides the solar panel, the hardware and materials were simple bolts, screws, and washers from a local hardware store.
THE SOLAR TABLE
18 WINTER 2014 ISSUE
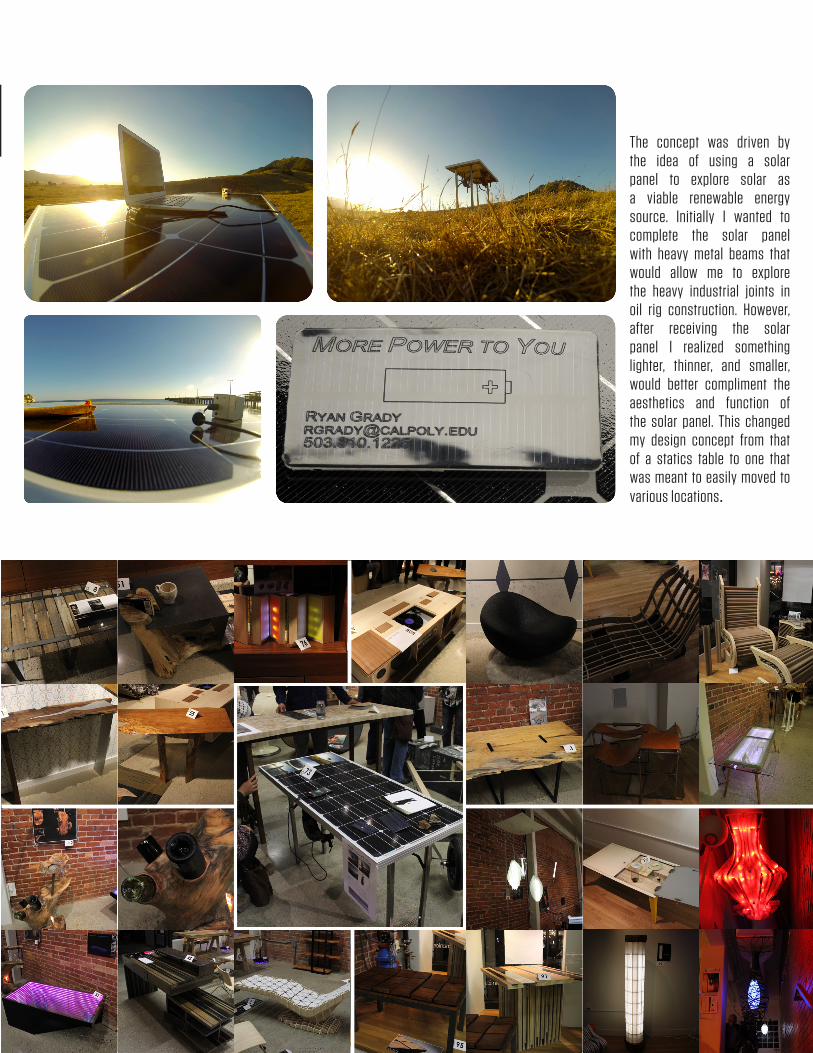
The concept was driven by the idea of using a solar panel to explore solar as a viable renewable energy source. Initially I wanted to complete the solar panel with heavy metal beams that would allow me to explore the heavy industrial joints in oil rig construction. However, after receiving the solar panel I realized something lighter, thinner, and smaller, would better compliment the aesthetics and function of the solar panel. This changed my design concept from that of a statics table to one that was meant to easily moved to various locations.
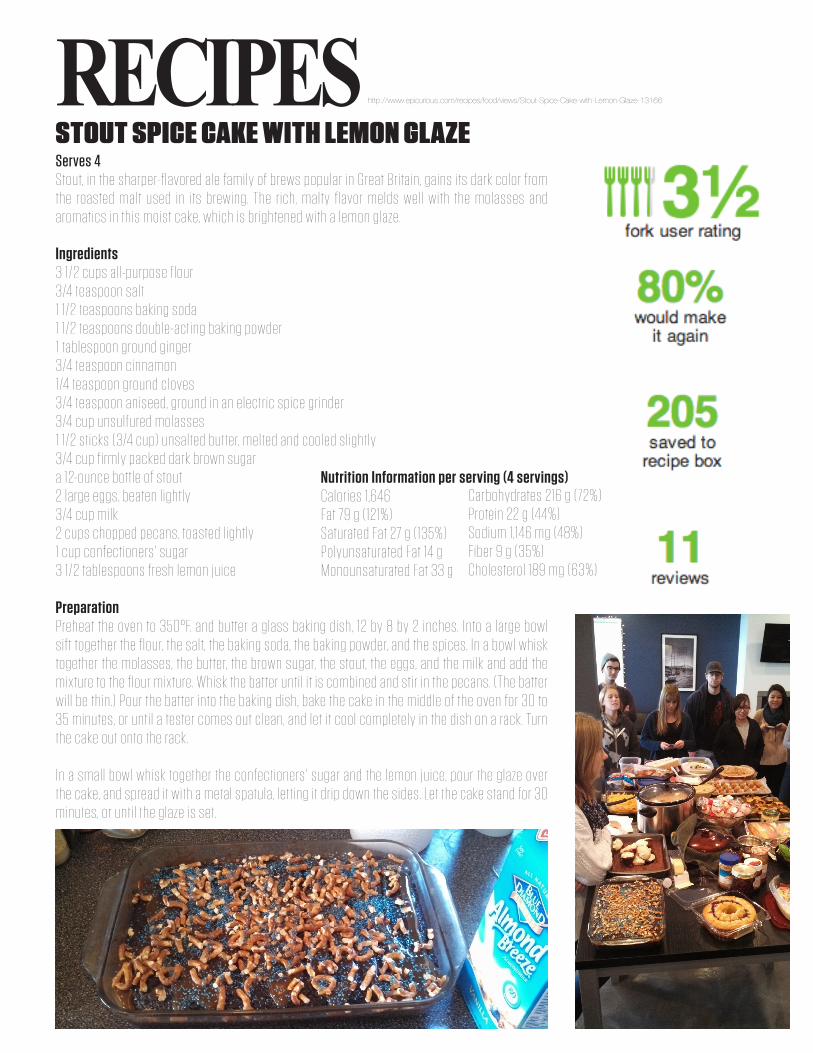
RECIPESSTOUT SPICE CAKE WITH LEMON GLAZEServes 4Stout, in the sharper-flavored ale family of brews popular in Great Britain, gains its dark color from the roasted malt used in its brewing. The rich, malty flavor melds well with the molasses and aromatics in this moist cake, which is brightened with a lemon glaze.
Ingredients3 1/2 cups all-purpose flour3/4 teaspoon salt1 1/2 teaspoons baking soda1 1/2 teaspoons double-acting baking powder1 tablespoon ground ginger3/4 teaspoon cinnamon1/4 teaspoon ground cloves3/4 teaspoon aniseed, ground in an electric spice grinder3/4 cup unsulfured molasses1 1/2 sticks (3/4 cup) unsalted butter, melted and cooled slightly3/4 cup firmly packed dark brown sugara 12-ounce bottle of stout2 large eggs, beaten lightly3/4 cup milk2 cups chopped pecans, toasted lightly1 cup confectioners' sugar3 1/2 tablespoons fresh lemon juice
PreparationPreheat the oven to 350°F. and butter a glass baking dish, 12 by 8 by 2 inches. Into a large bowl sift together the flour, the salt, the baking soda, the baking powder, and the spices. In a bowl whisk together the molasses, the butter, the brown sugar, the stout, the eggs, and the milk and add the mixture to the flour mixture. Whisk the batter until it is combined and stir in the pecans. (The batter will be thin.) Pour the batter into the baking dish, bake the cake in the middle of the oven for 30 to 35 minutes, or until a tester comes out clean, and let it cool completely in the dish on a rack. Turn the cake out onto the rack.
In a small bowl whisk together the confectioners' sugar and the lemon juice, pour the glaze over the cake, and spread it with a metal spatula, letting it drip down the sides. Let the cake stand for 30 minutes, or until the glaze is set.
Nutrition Information per serving (4 servings)Calories 1,646 Fat 79 g (121%) Saturated Fat 27 g (135%) Polyunsaturated Fat 14 g Monounsaturated Fat 33 g
Carbohydrates 216 g (72%) Protein 22 g (44%) Sodium 1,146 mg (48%) Fiber 9 g (35%) Cholesterol 189 mg (63%)
http://www.epicurious.com/recipes/food/views/Stout-Spice-Cake-with-Lemon-Glaze-13166


THE FUTURE OF DATA CENTER SECURITY HAS ARRIVED.
FROM JUNIPER NETWORKS, A LEADER IN I.T. SECURITY. PLAY THE GAME. DEPLOY THE SOLUTION. SAVE THE FUTURE
DECEPTIONFORCE.ORG

http://www.independent.com/news/2013/sep/19/wind-power-gains-momentum/
Picture by Paul Wellman
WIND POWER GAINS MOMENTUMIn an article titled “Wind Power Gains Momentum” the feasibility of wind turbines located in the Santa Barbara Channel is discussed. John Reed, an engineer from UCSB, plans to have “103 6-megawatt turbines harvesting wind in the Santa Barbara Channel…” One major milestone Reed will have to overcome to turn his vision into a reality is to the tune of needed funding of $3.7 billion. So before this project can happen, some definite fund raising is in order.
Albeit funding, it is difficult to hide the fact that the Santa Barbara Channel is a perfect location along the coast of California for harnessing wind energy. In and around the Channel Islands wind is constantly blowing at or above the threshold of 15mph, thus making the location usable for wind energy generation. So far there are not really any guidelines or templates to follow for offshore wind development on the West Coast of the US, or even specifically the channel. However, a team of graduate students from USCB, with no relation to Reed, will analyze the feasibility of such a project in the Channel.
The team of students has three goals. The first goal is to do a stakeholder analysis. The second goal is to do a GIS spatial analysis and then determine the path for obtaining permits. And lastly, determine the boundaries of marine protected areas, fishing areas, shipping lines, and the jurisdiction of the nearby Vandenberg Air Force Base. This will determine what space can be used for the turbines.The lure of “stronger and more consistent wind offshore” comes with some substantial barriers. Such as: “where to run transmission lines, [what about] migratory bird patterns, fishing interests, the
JOHN REED ENVISIONS 103 FLOATING OFFSHORE TURBINES IN THE SANTA BARBARA CHANNEL.
WINTER 2014 ISSUE BY RYAN GRADY 23
military presence, [and the fact that] the continental shelf on the Central Coast drops off so sharply and the water depth increases so quickly that it would be impractical to anchor turbines in the ocean floor. Any potential turbines would need to float.”
In 2009, a study was published by the National Renewable Energy Laboratory that assessed the development of offshore wind energy resources for the United States. The conclusion for California was that 52.8 to 64.9 GW of energy could be generated with floating turbines. However, according to Megan Birney, “A more practical estimate for the area is about 10 percent of the county’s usage….” In the end, the feasibility of this project will depend on if the local residents of Santa Barbara want it to happen.
*A note from the editor: One of the barriers of this project could turn out to be a major benefit in regards to my proposal. A perfect location to run the transmission lines would be the offshore oil rig. The power generated by the offshore wind farm would support the function of a data center and then the oil rig could be used as an offshore hub from where the power is sent back to the shore to use the left over energy for the neighboring towns of Goleta, and Santa Barbara.
24 BY RYAN GRADY WINTER 2014 ISSUE
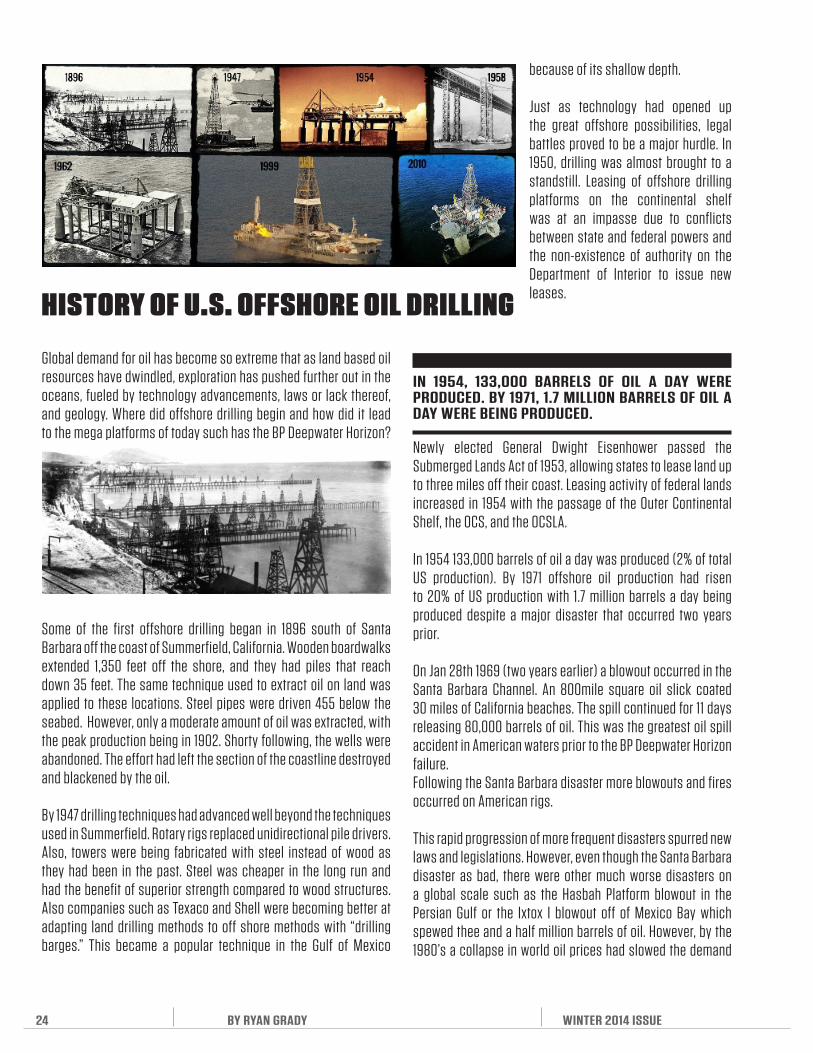
Global demand for oil has become so extreme that as land based oil resources have dwindled, exploration has pushed further out in the oceans, fueled by technology advancements, laws or lack thereof, and geology. Where did offshore drilling begin and how did it lead to the mega platforms of today such has the BP Deepwater Horizon?
HISTORY OF U.S. OFFSHORE OIL DRILLING
IN 1954, 133,000 BARRELS OF OIL A DAY WERE PRODUCED. BY 1971, 1.7 MILLION BARRELS OF OIL A DAY WERE BEING PRODUCED.
Some of the first offshore drilling began in 1896 south of Santa Barbara off the coast of Summerfield, California. Wooden boardwalks extended 1,350 feet off the shore, and they had piles that reach down 35 feet. The same technique used to extract oil on land was applied to these locations. Steel pipes were driven 455 below the seabed. However, only a moderate amount of oil was extracted, with the peak production being in 1902. Shorty following, the wells were abandoned. The effort had left the section of the coastline destroyed and blackened by the oil.
By 1947 drilling techniques had advanced well beyond the techniques used in Summerfield. Rotary rigs replaced unidirectional pile drivers. Also, towers were being fabricated with steel instead of wood as they had been in the past. Steel was cheaper in the long run and had the benefit of superior strength compared to wood structures. Also companies such as Texaco and Shell were becoming better at adapting land drilling methods to off shore methods with “drilling barges.” This became a popular technique in the Gulf of Mexico
because of its shallow depth.
Just as technology had opened up the great offshore possibilities, legal battles proved to be a major hurdle. In 1950, drilling was almost brought to a standstill. Leasing of offshore drilling platforms on the continental shelf was at an impasse due to conflicts between state and federal powers and the non-existence of authority on the Department of Interior to issue new leases.
Newly elected General Dwight Eisenhower passed the Submerged Lands Act of 1953, allowing states to lease land up to three miles off their coast. Leasing activity of federal lands increased in 1954 with the passage of the Outer Continental Shelf, the OCS, and the OCSLA.
In 1954 133,000 barrels of oil a day was produced (2% of total US production). By 1971 offshore oil production had risen to 20% of US production with 1.7 million barrels a day being produced despite a major disaster that occurred two years prior.
On Jan 28th 1969 (two years earlier) a blowout occurred in the Santa Barbara Channel. An 800mile square oil slick coated 30 miles of California beaches. The spill continued for 11 days releasing 80,000 barrels of oil. This was the greatest oil spill accident in American waters prior to the BP Deepwater Horizon failure.Following the Santa Barbara disaster more blowouts and fires occurred on American rigs.
This rapid progression of more frequent disasters spurred new laws and legislations. However, even though the Santa Barbara disaster as bad, there were other much worse disasters on a global scale such as the Hasbah Platform blowout in the Persian Gulf or the Ixtox I blowout off of Mexico Bay which spewed thee and a half million barrels of oil. However, by the 1980’s a collapse in world oil prices had slowed the demand

WINTER 2014 ISSUE BY RYAN GRADY 25
$6 BILLION TO $18 BILLION PER YEAR YIELDED TO THE FEDERAL GOVERNMENT FROM THE GULF OF MEXICO PLATFORM LEASES.
for onshore and offshore drilling sites.
Thanks to seismologic and other technological developments in the drilling industry a shift occurred that allowed oil exploration further into deeper water. Shell and other companies had discovered a large abundance of oil in the Gulf of Mexico in the 1980s. The new technological advances fueled the expansion of drilling in this location. From 1985 to 1997, the offshore success rate increased from 36% to 51%. Starting in 1991 to 2002 oil production consecutively increased peaking at 2 million barrels per day. The shift from shallow water to deep water occurred rapidly. Similar to the emergence of civilian nuclear power including the construction of a 600mile pipeline though Alaskan frost, the deep-water era was exploring uncharted terrain. The Outer Continental Shelf Deep Water Royalty Relief Act of 1995 also spurred growth in the industry.
This huge boom in offshore drilling, specifically in the Gulf of Mexico, yielded $6 billion to $18 billion per year to the federal government. Prior to the BP Deepwater disaster experts projected an increased demand for oil and thus increased demand for deep offshore drilling.
On a global scale the Gulf of Mexico has played its part. There has also been a lot of oil exploration and development near Brazil and West Africa. Prior to the BP disaster, little thought was given to the containment of a blowout in deep-water because it was considered unlikely, however that thought is now being revaluated.
*A note from the editor: As oil becomes more difficult to extract, companies are pushed to deeper and deeper waters as onshore and offshore operations become less effective. In its wake of expansion, a lot of offshore oil platforms will be left behind and need to be decommissioned., often a very expensive proposition.
Source: Officer, Of the Watch. "A Brief History of US Offshore Oil Drilling." Officer of the Watch. N.p., 2 Sept. 2013. Web. 20 Mar. 2014.
http://www.oilspillcommission.gov/sites/default/files/documents/A%20Brief%20History%20of%20Offshore%20Drilling%20Working%20Paper%208%2023%2010.pdf
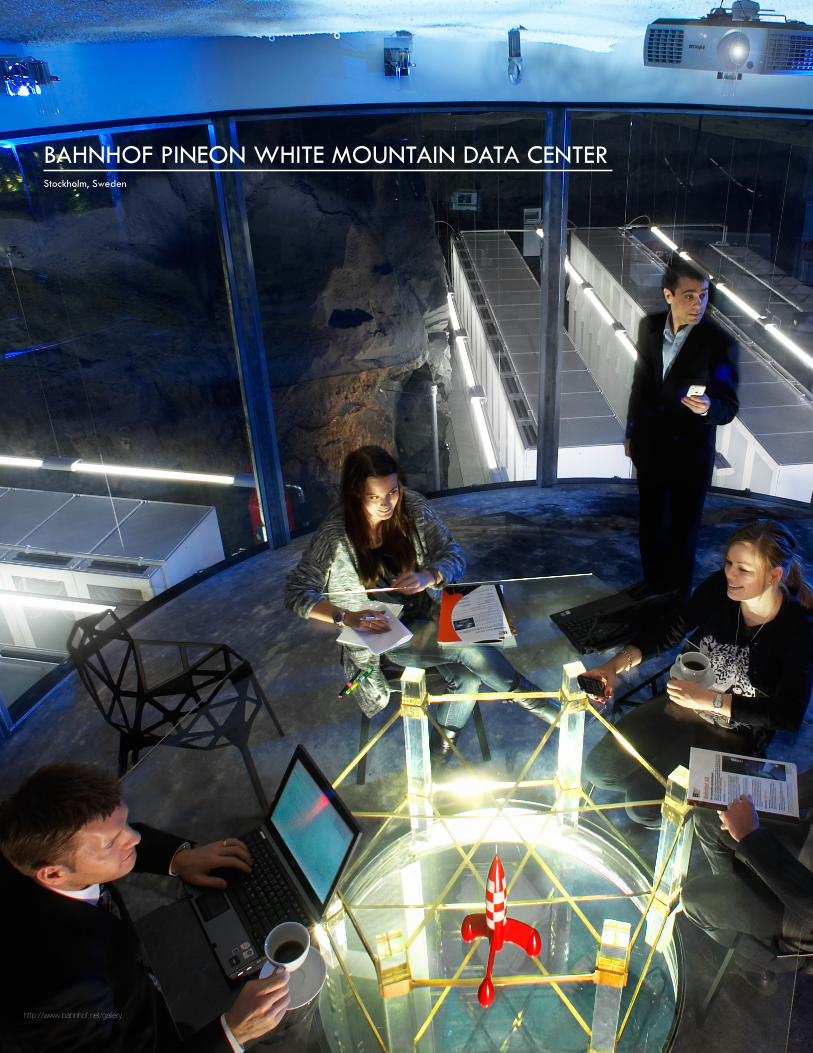
BAHNHOF PINEON WHITE MOUNTAIN DATA CENTERStockholm, Sweden
http://www.bahnhof.net/gallery

Bahnhof Pineon White Mountain Data Center located in Stockholm, Sweden, was design by architect Albert France-
Lanord. This facility is close to Sweden’s finance and business area. Not only does the facility incorporate dry ice
and neon lights, but it also includes a bar and nightclub. The center supports 240 rack cabinets. Also, the excess heat
generated by the facility is used to heat neighboring residential and commercial premises.
http://www.bahnhof.net/gallery http://www.bahnhof.net/gallery
Bahnof: The EssentialsLocation: Stockholm, SwedenOnline: September 2008Notable Features: Artificial daylight, greenhouses, waterfalls, 687 saltwater fish tank, and two maybach diesel submarine engines used for standby power.Time to design and build: 20 monthsSize: 10,764sq ft. with 5,382 sq ft. of hosting space and 2,153 sq ft for back of house systems. The remaining 2,500ish sq ft is for office and personal areas.It-Usabale capacity: 800kWCabinet Locations: 140Power Density: 5.7kW average per cabinet, no specific maximumInfrastructure Delivery: Cooling, structured cabling and electrical are delivered below a 3.3 foot deep raised floor.Structural Loading: 403 lb per sq ft.Fire Suppression System: Novec 1230
Advice to future projects: “I think you should give the human factor a great thought. Computer centers should be built for humans and for their clients. Most often you focus on the technological aspects but you forget about the humans who are going to work there. Also, giving this design you add an experience fro the client. That is very often forgotten in these type of projects. Bring a human touch to the computer center, that’s my advice.
Plans for any future Data Center build outs?“We are working on a concept with modular Data Centers. The idea sprang from the fact that if you build in a mountain you realize that the mountain is very hard to expand in space. Once the space is finished you have to do something else. So, I would like to build Data Centers in modules where you can have module after module after module when you need more space.”
“Many of our customers, it’s included in our offering, they can bring their own clients and can have presentation (at the site). It’s a great facility to have a presentation if you have some kind of new website or project to present.
WINTER 2014 ISSUE 27

BAHNHOF THULE DATA CENTERStockholm, Sweden
http://www.bahnhof.net/gallery

WINTER 2014 ISSUE 29
Bahnhof Thule Data Center located in Stockholm, Sweden, was design by architect
Albert France- Lanord. This facility is close to Sweden’s finance and business area.
Not only does the facility incorporate dry ice and neon lights, but it also includes a bar
and nightclub. The center supports 240 rack cabinets. Also, the excess heat generated by
the facility is used to heat neighboring residential and commercial premises.

Citigroup’s Citi Data Center is located in Frankfurt, Germany. The facility is made unique with a
vertical green wall used for fresh air colling through reverse osmosis. This helps to reduce energy by
40%. The Data Centre was designed by the engineering firm Arup. And it was the first Data Centre to be
certified LEED Platinum. The facility has 72% of its roof covered by vegetation which are maintained with
recycled rainwater.
http://genesismorocco.blogspot.ru/ http://genesismorocco.blogspot.ru/
CitiLocation: Frankfurt, GermanyOnline: May 2008Notable Features: Green roof and green wall features. Reverse osmosis water treatment for cooling. Harvested rainwater used for irrigation. Rotary UPS. First Data Center certified LEED-Platinum.Time to design and build: 20 monthsSize: 228,000 sq ft total, with 100,000sq ft of hosting space.Power: 14.4MW from two separate feeds.Infrastructure Delivery: Structured cabling is provided overhead. Power and cooling are delivered under a 31.5 inch raised floor.Structural Loading: 250lb per sq ft.Fire Suppression System: Pre-action sprinklers
“…Data Center designers often seek a happy medium between high availability and green optimization. That’s because the two qualities are traditionally at odds with one another in Data Center design: higher availability means extra layers of standby infrastructure, which in turn mean more material used and more electrical conversion losses.”
LEED comprises of sustainable sites, water efficiency, energy and atmosphere, materials and resources, indoor environmental quality, and innovation and design.
30 WINTER 2014 ISSUE http://genesismorocco.blogspot.ru/

CITI DATA CENTERFrankfurt, Germanyhttp://genesismorocco.blogspot.ru/
http://genesismorocco.blogspot.ru/

MAUNSELL FORTSUnited Kingdom
http://en.wikipedia.org/wiki/File:Redsandsforts.jpg

These small interconnected and fortified towers were built during World War
Two to defend the UK. In the 1950’s the forts were decommissioned and used
for other purposes. One fort is in conservation. One is owned by the Principality
of Sealand. And the others are occasionally used for tours. In the 1960’s the forts
were used to broadcast a pirate radio station.
WINTER 2014 ISSUE 33

PRINCIPALITY OF SEALANDMicronation off the coast of the United Kingdom
The Principality of Sealand is a leftover fort from the Maunsell
Sea Forts built for World War Two. It has been called the
world’s smallest country and the worlds smallest nation. However,
Sealand has yet to be officially recognized by any sovereign state.
In 2000, the company HavenCo set up a data center on Sealand.
However, in 2008 the operation fell through and ceased operating.
http://www.sealandgov.org/
34 WINTER 2014 ISSUE
http://www.sealandgov.org/

Micronation off the coast of the United Kingdom


http://blogs.scientificamerican.com/assignment-impossible/2013/05/06/a-modest-proposal-google-glass-meets-tech-support/

Data Centers will be in high demand in the future...From the Editor
SEA:\ DRIVE PROPOSAL RYAN GRADY WINTER 2014 ISSUE
SEA:\ Drive proposes to meet the demand for future data storage by reusing a decommissioned oil rig as a cloud storage data center and demystifying the data center with the addition of an aquarium and overnight accommodations.
WHYOIL RIGS?
STRUCTURALLY SOUND.BUILT TO WITHSTAND NATURAL
STORMS INCLUDING HURRICANES
TAKE ADVANTAGE OF OCEAN FOR NATURAL COOLING
LOCATED 3 MILES OFFSHORE IN FEDERAL WATERS.
INTERNATIONAL LOCATION COMING SOON.
NSA
IDEAL LOCATION TO TAKE ADVANTANGE OF GREEN ENERGY RESOURCES SUCH AS OFFSHORE
WIND HARVESTING.
One, often overlooked, issue I see for the future is the expansion of digital data. Following the growth of digital data is the growth of the physical infrastructure required to power the digital data. This digital and physical growth has led me to ask a series of questions projecting into the future as well as make a series of assumptions. Based on current trends of technological advancement, digital data is here to stay and the demand will only increase going into the future. As we know this digital growth equals physical growth. With the physical growth of digital infrastructure, there is an opportunity
An oilrig has the unique advantage of an abundance of water that can be used for cooling and other program such as entertainment. Also oilrigs are inherently strong and sturdy as they were originally designed to withstand hurricanes, storms, and constantly changing tides.
to design smartly in order to negate harmful side effects on the environment, which cold otherwise be left unchecked and in turn be detrimental to the environment. Therein also lies another opportunity to introduce a human aspect to something that is essentially an autonomous machine and otherwise doesn’t need human assistance. In a way, it is a reversal of a long-standing trend to make actions easier by automating them with machines. This is a way to break down that impersonal aspect and give people a chance to be uniquely responsible for their own actions in a way that gives them back what has been slowly taken away from them.
And so what am I really asking? I want to know how can the never-ending demand for digital data be designed for in a way that
potentially mitigates an unforeseen energy crisis and becomes a way for people to interact on a more personal level with something (digital data) that has enveloped every aspect of their daily lives, and yet at the same time kept them removed from the infrastructure responsible for cataloguing their daily lives (their personal data as stored in the cloud).
One possible solution that I have been in pursuit of is the idea of accommodating the physical space required for digital expansion with current physical space slated to be decommissioned. What is that physical space slated to be decommissioned? That space is offshore oil platforms, once used to extract oil from offshore costal waters. These coastal offshore oil platforms have outlived their original intended purpose as the increased demand for oil has pushed oil extraction locations to deep-water extraction operations. Deep water operations, although more risky, are worth that risk for some to benefit from the increased oil production.
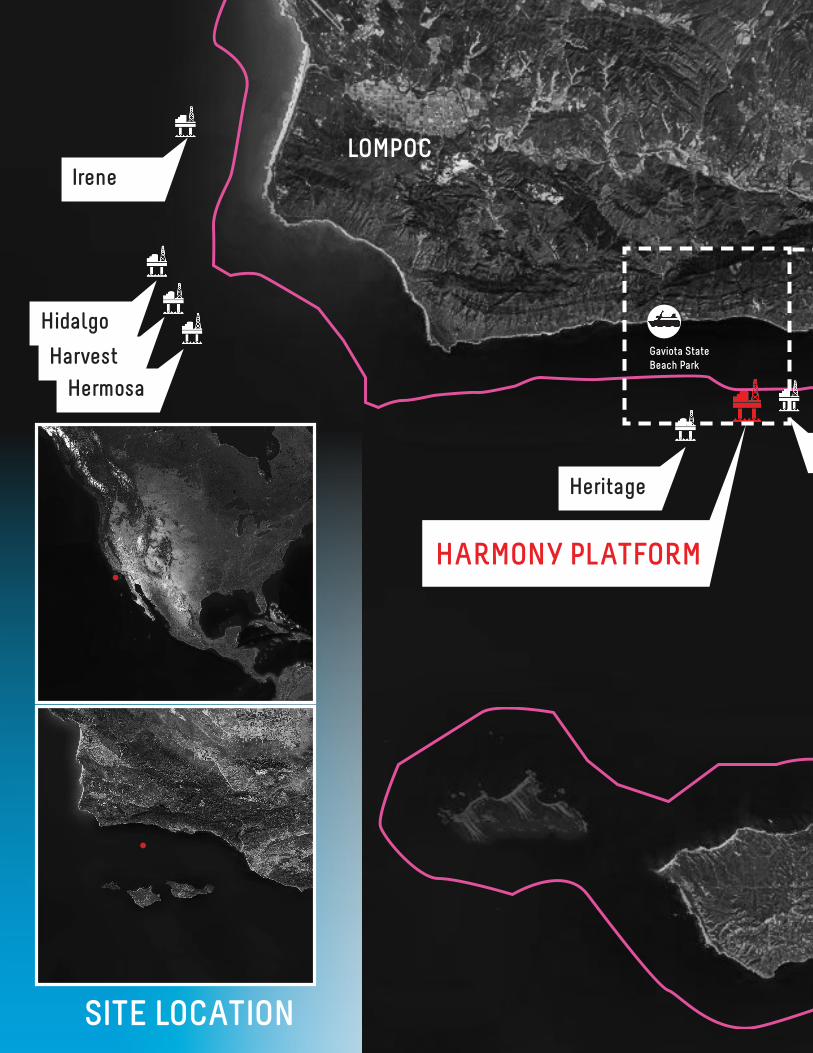
Specifically, I am focusing on the series of offshore oil platforms located off the coast of Goleta and Santa Barbara in central California. These oil platforms are scheduled for decommissioning in the year 2025. Decommissioning is a costly and difficult proposition that can be avoided if the platforms are instead reused to meet the physical demand required by increased digital data.
HARMONY PLATFORM

HISTORY OF PHYSICAL DATA STORAGE: THE LIBRARY?(How has this physical shifted translated into a digital world)
As defined by dictionary.com, data is individual facts, statistics, or items of information. How data is represented can be a variety of different ways. Data can be information that is written down in a book, or spoken verbally. It could even be considered information that is passed down from generation to generation, be it through song, or verbal communication. With the dawn of computers, data has gone from being represented by a physical medium to something that can be represented with a series of 1’s and 0’s and then strung together for a computer to interpret and then translate for its end user; you. Computers have allowed for a much greater amount of data to be stored and interpreted, while at the same time the physical space a computer occupies has consistently decreased. However, with the dawn of computers has come the explosion of the Internet, allowing computers to take part in global network of communication. And a more recent invention of the Internet has been cloud storage: or using the global network for digital storage. The Internet is seemingly everywhere all the time, yet at the same time it is nowhere in a physical sense, unless one realizes that there are indeed physical components responsible for powering the Internet. This physical infrastructure responsible for the Internet has grown in size and proportion as the Internet has spread further to more remote places of the globe. And, similarly as the Internet has spread, the increased demand for cloud storage has
grown. And so we see a similar parallel between the growth of physical data as well as digital data. Just as libraries, once the supreme temples of physical data, have scaled bigger and bigger to accommodate the increase in physical records; Digital Storage Centers (or data centers) have similarly scaled larger to accommodate the growing demand for more and more digital data. However, a library can only grow so big before it becomes impractical. Digital Data, on the other hand, can grow indefinitely with the only limitation being how much and how quickly we, or our computers, can interpret that data.
We are entering a particular era in our lifetime where we are seeing this emergence of Big Data. This concept of Big Data can be in one of two states, either data in motion or data at rest. Data in-motion consists of analyzing real time currently in progress data monitoring. For example, while driving a car sensors are available to record the motion of the car as well as its relation to other cars or obstacles. This data can be analyzed to determine the best course of action for the car based on the current circumstances all without the assistance of a person. Data at rest refers to the analyzing of data after it has already been collected and stored. The data can be analyzed for patterns or algorithms that explain past actions or can be used to predict future actions.
WINTER 2014 ISSUE BY RYAN GRADY 39
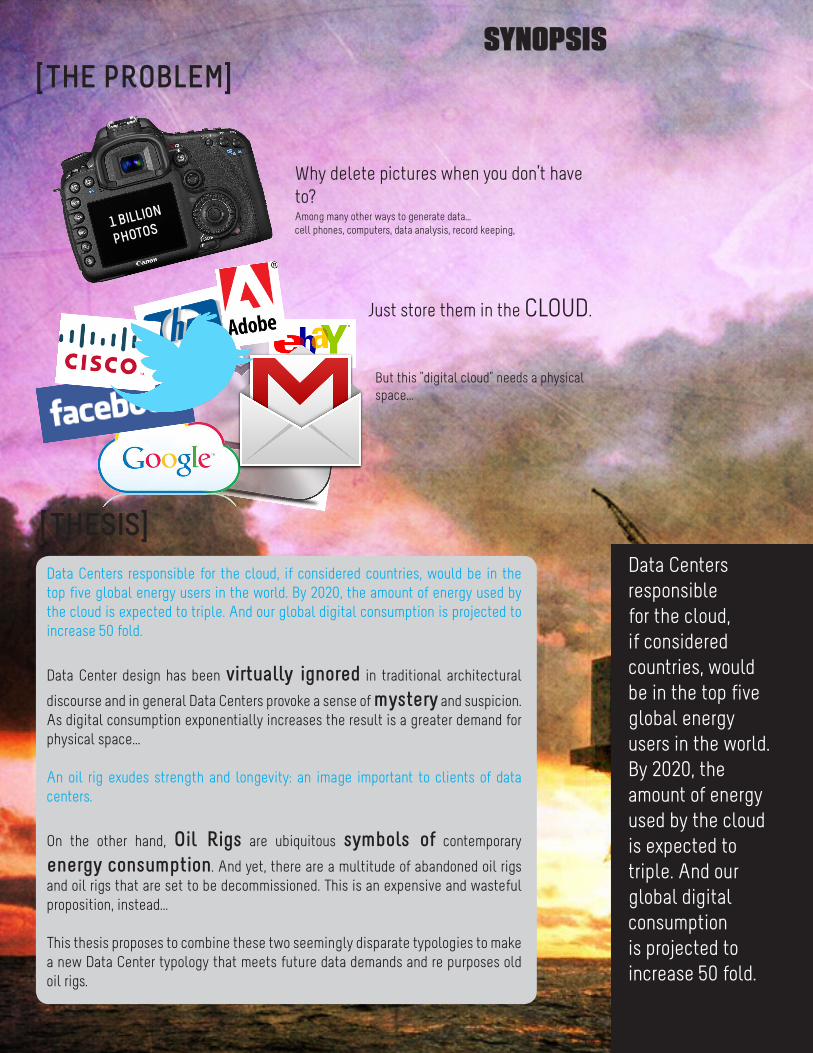
Data Centers responsible for the cloud, if considered countries, would be in the top five global energy users in the world. By 2020, the amount of energy used by the cloud is expected to triple. And our global digital consumption is projected to increase 50 fold.
[THE PROBLEM]
Why delete pictures when you don’t have to?Among many other ways to generate data...cell phones, computers, data analysis, record keeping,
Just store them in the CLOUD.
But this "digital cloud" needs a physical space...
1 BILLION
PHOTOS
[THESIS]
Data Centers responsible for the cloud, if considered countries, would be in the top five global energy users in the world. By 2020, the amount of energy used by the cloud is expected to triple. And our global digital consumption is projected to increase 50 fold.
Data Center design has been virtually ignored in traditional architectural
discourse and in general Data Centers provoke a sense of mystery and suspicion. As digital consumption exponentially increases the result is a greater demand for physical space...
An oil rig exudes strength and longevity: an image important to clients of data centers.
On the other hand, Oil Rigs are ubiquitous symbols of contemporary
energy consumption. And yet, there are a multitude of abandoned oil rigs and oil rigs that are set to be decommissioned. This is an expensive and wasteful proposition, instead...
This thesis proposes to combine these two seemingly disparate typologies to make a new Data Center typology that meets future data demands and re purposes old oil rigs.
SYNOPSIS

Data Center design has been virtually ignored in traditional architectural discourse.
So, what can the Data Center become?
And on larger scale how can humans interact more meaningfully with their essential infrastructures?
[KEY QUESTIONS]
COST TO DECOMMISSIONHARMONY PLATFORM
$129,842,000.00expensive $$$$$
COST TO REUSE FREE INFRASTRUCTURE
SUSTAINABLE
HARMONY PLATFORM
OFFSHORE OIL RIG LOCATIONSIrene
Hidalgo
Harvest
Hermosa
Hillhouse
C, B, A
Habitat
HeritageHolly
Hondo
HoganHouchinHenry
Gaviota StateBeach Park
SITE LOCATION
LOMPOC

HARMONY PLATFORM
OFFSHORE OIL RIG LOCATIONSIrene
Hidalgo
Harvest
Hermosa
Hillhouse
C, B, A
Habitat
HeritageHolly
Hondo
HoganHouchinHenry
Gaviota StateBeach Park
SANTA BARBARA
VENTURA
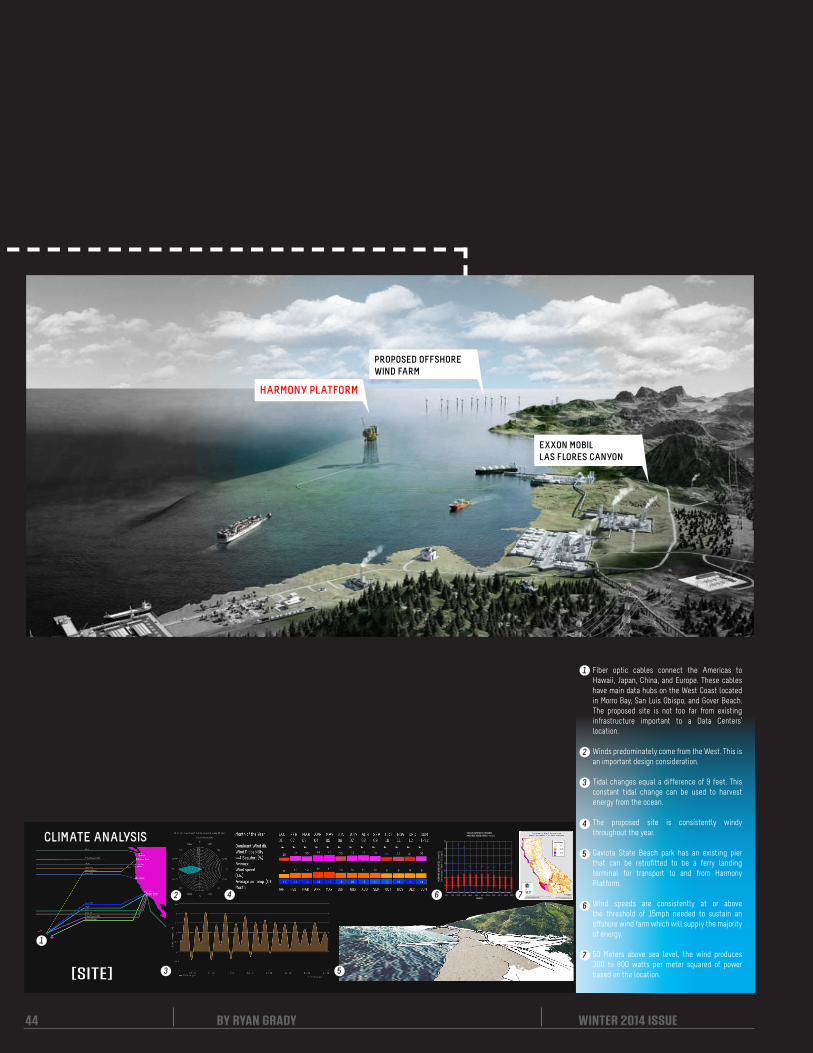
HARMONY PLATFORM
EXXON MOBILLAS FLORES CANYON
PROPOSED OFFSHORE WIND FARM
CLIMATE ANALYSIS
JAN FEB MAR APR MAY JUN JUL AUG SEP OCT NOV DEC
MONTH
SANTA BARBARA CHANNELAVERAGE WIND SPEED - knots
AV
ERA
GE W
IND
SPE
ED -
(KN
OTS
)[c
onve
rsio
n 1
knot
= 1
.15
mph
]
70
60
50
40
30
20
10
62
Figure 4.16. California Energy Commission map of wind power potential at 50 meters height (source: AWS Truewind (2006)).
1
2
3 5
4 6 7
1
2
3
4
5
6
7
Fiber optic cables connect the Americas to Hawaii, Japan, China, and Europe. These cables have main data hubs on the West Coast located in Morro Bay, San Luis Obispo, and Gover Beach. The proposed site is not too far from existing infrastructure important to a Data Centers’ location.
Winds predominately come from the West. This is an important design consideration.
Tidal changes equal a difference of 9 feet. This constant tidal change can be used to harvest energy from the ocean.
The proposed site is consistently windy throughout the year.
Gaviota State Beach park has an existing pier that can be retrofitted to be a ferry landing terminal for transport to and from Harmony Platform.
Wind speeds are consistently at or above the threshold of 15mph needed to sustain an offshore wind farm which will supply the majority of energy.
50 Meters above sea level, the wind produces 300 to 800 watts per meter squared of power based on the location.[SITE]
44 BY RYAN GRADY WINTER 2014 ISSUE

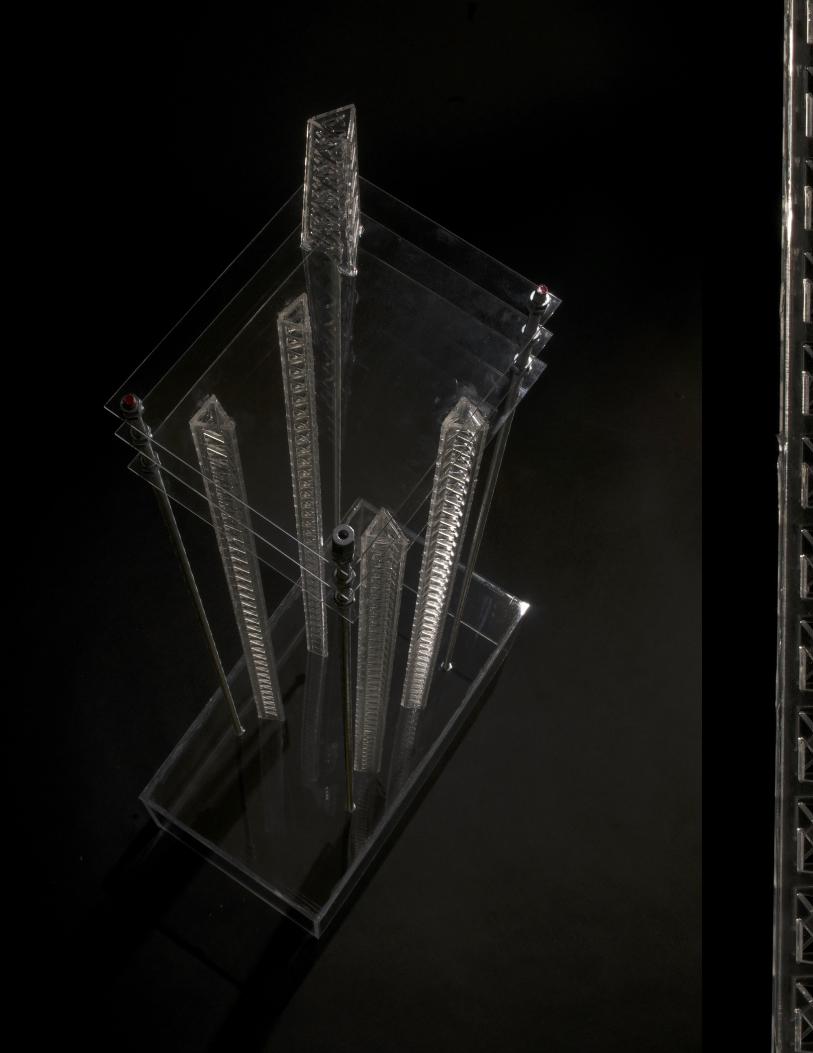
Above. The deck is comprised of three modular decks.
Right. Harmony Offshore Oil Platform is comprised of three modular decks that rest on a 69,000 ton steel jacket that originally came in two pieces and was welded together on site.
[STRUCTURAL DIAGRAM]


Dimensions: 3 modular decks, 180 feet by 145 feet


base case along with variations.
VASARI INFORMATION RYAN GRADY WINTER 2014 ISSUE
1
Energy Analysis Report
base caserig Analysis (1)Analyzed at 2/18/2014 9:10:58 PM
Energy Analysis Result
Building Performance Factors
Energy Use Intensity
Life Cycle Energy Use/Cost
Renewable Energy Potential
2
Energy Analysis Report
Annual Carbon Emissions
Annual Energy Use/Cost
Energy Use: Fuel
Energy Use: Electricity
3
Energy Analysis Report
Potential Energy Savings
Monthly Heating Load
4
Energy Analysis Report
Monthly Cooling Load
Monthly Fuel Consumption
Monthly Electricity Consumption
4
Energy Analysis Report
Monthly Cooling Load
Monthly Fuel Consumption
Monthly Electricity Consumption
4
Energy Analysis Report
Monthly Cooling Load
Monthly Fuel Consumption
Monthly Electricity Consumption
50 BY RYAN GRADY WINTER 2014 ISSUE
This base example Vasari study shows that if the oil rig has an exterior window ratio of 20%, the losses are almost equal to the savings.

3
Energy Analysis Report
Potential Energy Savings
Monthly Heating Load
4
Energy Analysis Report
Monthly Cooling Load
Monthly Fuel Consumption
Monthly Electricity Consumption
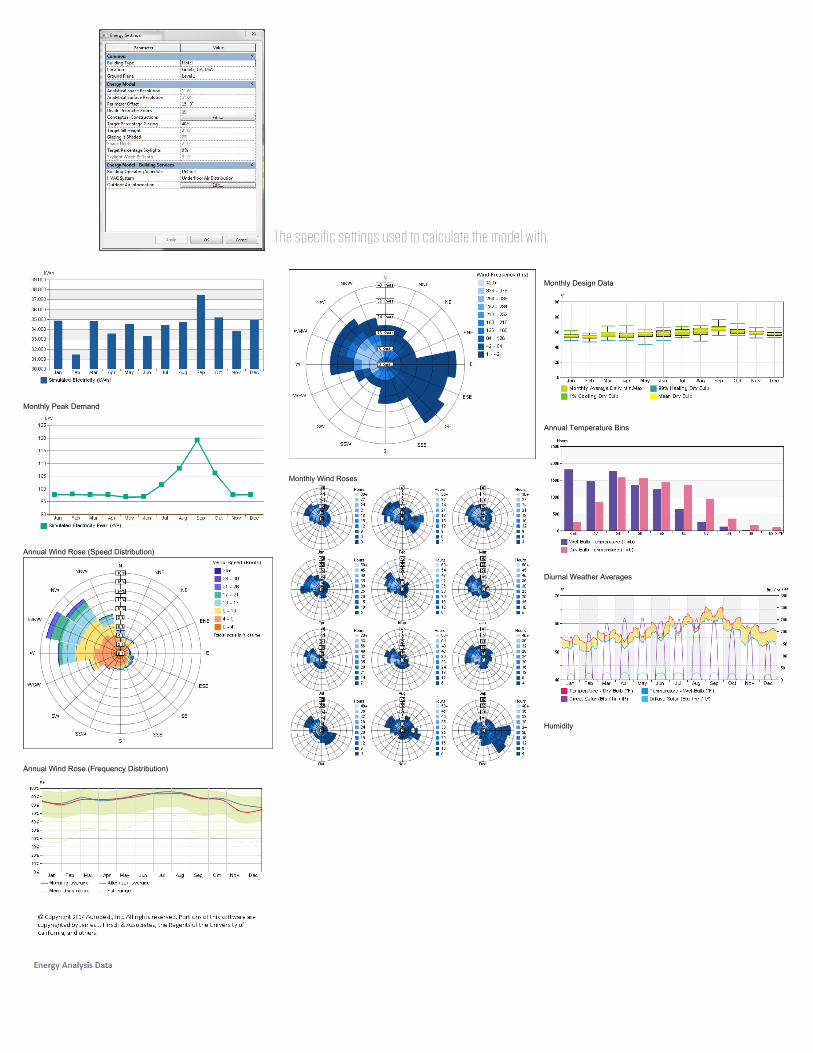
5
Energy Analysis Report
Monthly Peak Demand
Annual Wind Rose (Speed Distribution)
Annual Wind Rose (Frequency Distribution)
6
Energy Analysis Report
Monthly Wind Roses
7
Energy Analysis Report
Monthly Design Data
Annual Temperature Bins
Diurnal Weather Averages
Humidity
8
Energy Analysis Report
EXT. WINDOW RATIO 20% RYAN GRADY WINTER 2014 ISSUE
1
Energy Analysis Report
RIG 3 floorsrig AnalysisAnalyzed at 2/18/2014 7:58:15 PM
Energy Analysis Result
Building Performance Factors
Energy Use Intensity
Life Cycle Energy Use/Cost
Renewable Energy Potential
2
Energy Analysis Report
Annual Carbon Emissions
Annual Energy Use/Cost
Energy Use: Fuel
Energy Use: Electricity
3
Energy Analysis Report
Potential Energy Savings
Monthly Heating Load
4
Energy Analysis Report
Monthly Cooling Load
Monthly Fuel Consumption
Monthly Electricity Consumption
4
Energy Analysis Report
Monthly Cooling Load
Monthly Fuel Consumption
Monthly Electricity Consumption
4
Energy Analysis Report
Monthly Cooling Load
Monthly Fuel Consumption
Monthly Electricity Consumption
52 BY RYAN GRADY WINTER 2014 ISSUE
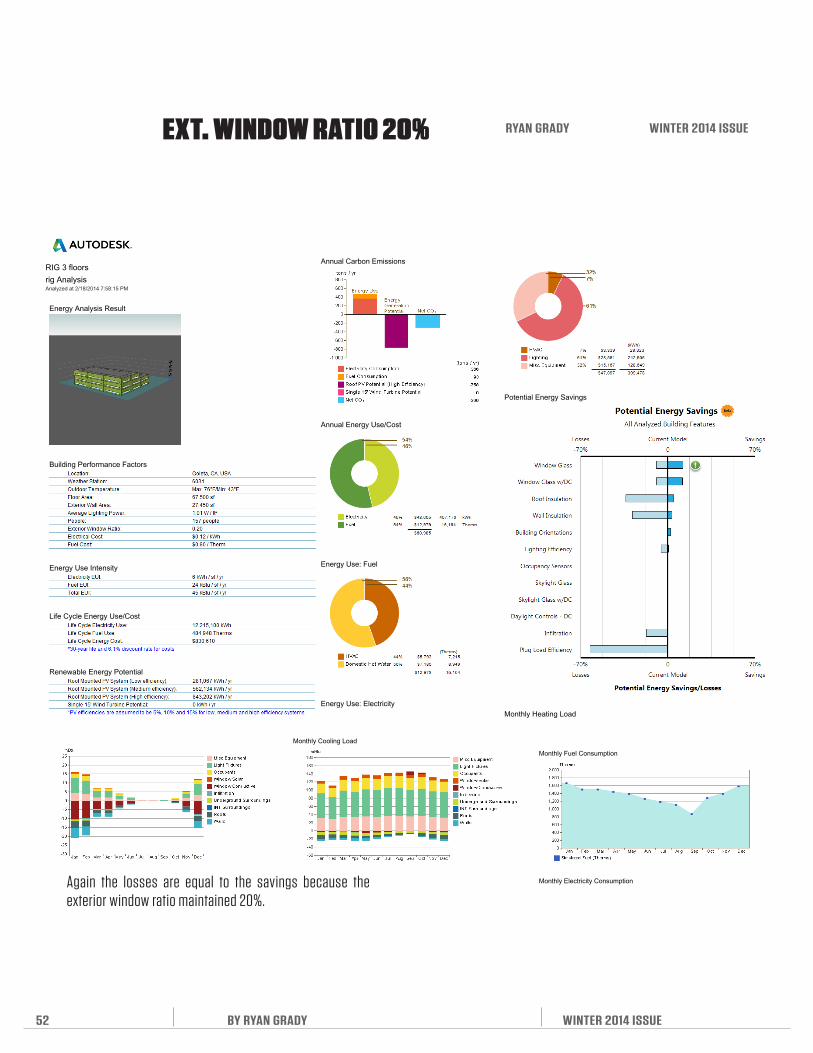
Again the losses are equal to the savings because the exterior window ratio maintained 20%.

5
Energy Analysis Report
Monthly Peak Demand
Annual Wind Rose (Speed Distribution)
Annual Wind Rose (Frequency Distribution)
6
Energy Analysis Report
Monthly Wind Roses
7
Energy Analysis Report
Monthly Design Data
Annual Temperature Bins
Diurnal Weather Averages
Humidity
8
Energy Analysis Report
3
Energy Analysis Report
Potential Energy Savings
Monthly Heating Load
4
Energy Analysis Report
Monthly Cooling Load
Monthly Fuel Consumption
Monthly Electricity Consumption
The specific settings used to calculate the model with.
5
Energy Analysis Report
Monthly Peak Demand
Annual Wind Rose (Speed Distribution)
Annual Wind Rose (Frequency Distribution)1
Energy Analysis Report
RIG 3 floors 40rig AnalysisAnalyzed at 2/18/2014 8:10:55 PM
Energy Analysis Result
Building Performance Factors
Energy Use Intensity
Life Cycle Energy Use/Cost
Renewable Energy Potential
2
Energy Analysis Report
Annual Carbon Emissions
Annual Energy Use/Cost
Energy Use: Fuel
Energy Use: Electricity
3
Energy Analysis Report
Potential Energy Savings
Monthly Heating Load
4
Energy Analysis Report
Monthly Cooling Load
Monthly Fuel Consumption
Monthly Electricity Consumption
4
Energy Analysis Report
Monthly Cooling Load
Monthly Fuel Consumption
Monthly Electricity Consumption
4
Energy Analysis Report
Monthly Cooling Load
Monthly Fuel Consumption
Monthly Electricity Consumption
EXT. WINDOW RATIO 40% RYAN GRADY WINTER 2014 ISSUE
54 BY RYAN GRADY WINTER 2014 ISSUE
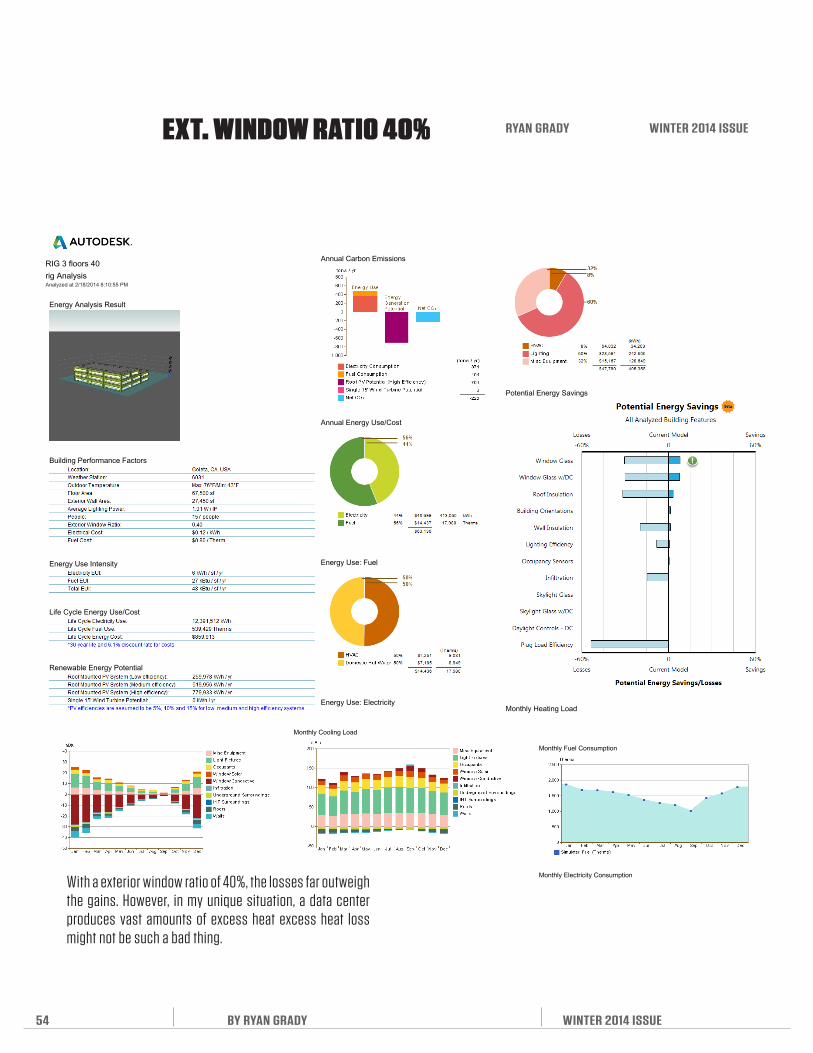
With a exterior window ratio of 40%, the losses far outweigh the gains. However, in my unique situation, a data center produces vast amounts of excess heat excess heat loss might not be such a bad thing.
5
Energy Analysis Report
Monthly Peak Demand
Annual Wind Rose (Speed Distribution)
Annual Wind Rose (Frequency Distribution)
6
Energy Analysis Report
Monthly Wind Roses
7
Energy Analysis Report
Monthly Design Data
Annual Temperature Bins
Diurnal Weather Averages
Humidity
8
Energy Analysis Report
3
Energy Analysis Report
Potential Energy Savings
Monthly Heating Load
4
Energy Analysis Report
Monthly Cooling Load
Monthly Fuel Consumption
Monthly Electricity Consumption
The specific settings used to calculate the model with.

1
Energy Analysis Report
rig 60 twentyfour7 and shadingrig AnalysisAnalyzed at 2/18/2014 8:34:04 PM
Energy Analysis Result
Building Performance Factors
Energy Use Intensity
Life Cycle Energy Use/Cost
Renewable Energy Potential
2
Energy Analysis Report
Annual Carbon Emissions
Annual Energy Use/Cost
Energy Use: Fuel
Energy Use: Electricity
3
Energy Analysis Report
Potential Energy Savings
Monthly Heating Load
4
Energy Analysis Report
Monthly Cooling Load
Monthly Fuel Consumption
Monthly Electricity Consumption
4
Energy Analysis Report
Monthly Cooling Load
Monthly Fuel Consumption
Monthly Electricity Consumption
4
Energy Analysis Report
Monthly Cooling Load
Monthly Fuel Consumption
Monthly Electricity Consumption
56 BY RYAN GRADY WINTER 2014 ISSUE
EXT. WINDOW RATIO 60% RYAN GRADY WINTER 2014 ISSUE
Again, the losses far outweigh the savings with an exterior window ratio of 60%. Now if only I can find a way to reuse the excess heat from the data center instead of just passing it back to the environment right away.

3
Energy Analysis Report
Potential Energy Savings
Monthly Heating Load
5
Energy Analysis Report
Monthly Peak Demand
Annual Wind Rose (Speed Distribution)
Annual Wind Rose (Frequency Distribution)
6
Energy Analysis Report
Monthly Wind Roses
7
Energy Analysis Report
Monthly Design Data
Annual Temperature Bins
Diurnal Weather Averages
Humidity
8
Energy Analysis Report
4
Energy Analysis Report
Monthly Cooling Load
Monthly Fuel Consumption
Monthly Electricity Consumption
The specific settings used to calculate the model with.

PROPOSED SITE RYAN GRADY WINTER 2014 ISSUE

LAND2AIR1
LAND2AIR1
STAIRS/ ELEVATORTO MAIN LOBBY
GONDOLA ARRIVAL/DEPARTURE
GONDOLA ARRIVAL/DEPARTURE
INTERIOR CONFERENCE ROOM RENDERING
A section investigating the use of the excess heat generated by the data center to heat an internal Spa/Pool. The Pool benefits the users as well as helps regulate the temperature of the data servers.
MID-LEVEL SECTION (SPA)
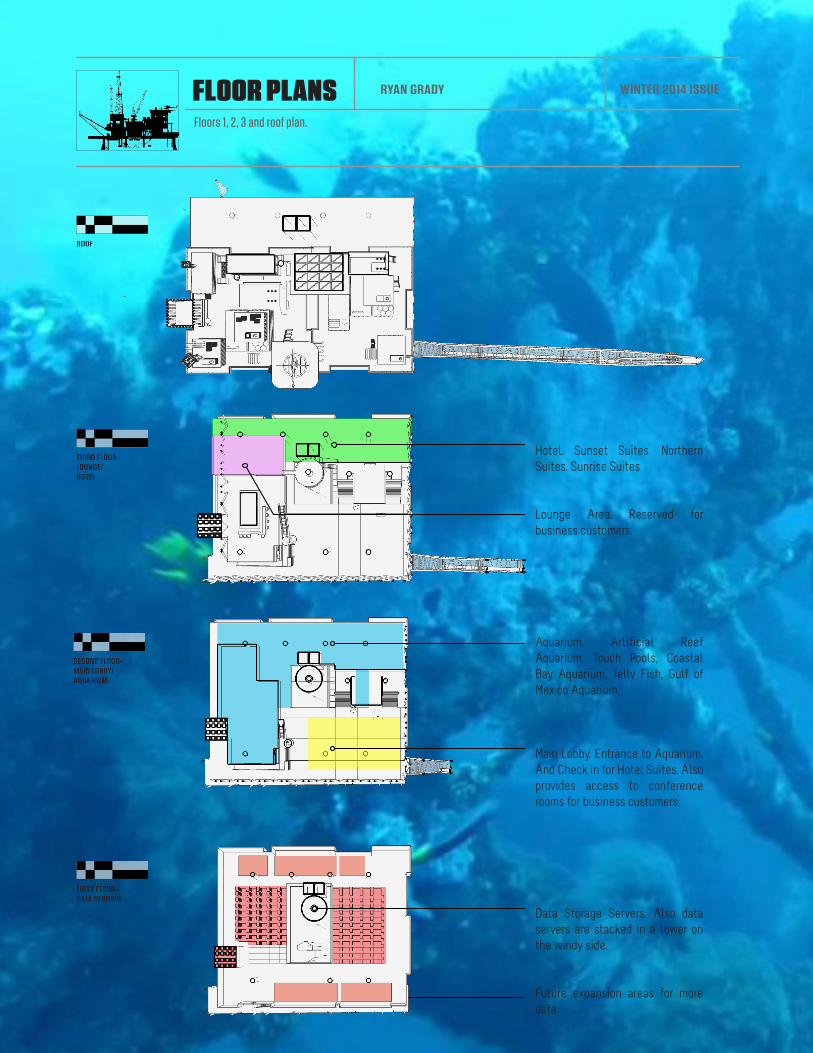
Hotel. Sunset Suites. Northern Suites. Sunrise Suites
Lounge Area. Reserved for business customers.
Aquarium. Artificial Reef Aquarium, Touch Pools, Coastal Bay Aquarium, Jelly Fish, Gulf of Mexico Aquarium.
Main Lobby. Entrance to Aquarium. And Check in for Hotel Suites. Also provides access to conference rooms for business customers.
Data Storage Servers. Also data servers are stacked in a tower on the windy side.
Future expansion areas for more data.
Floors 1, 2, 3 and roof plan.
FLOOR PLANS RYAN GRADY WINTER 2014 ISSUE

[SITE PLAN]
[SECTION 02]
[SECTION 01]


1 An immersive view showing the bar, lounge, mega tank, aquarium entrance, the hotel suites entrance, and the data storage.2 Shows one of the entrances to the Aquarium. The entrance is a dark glowing tunnel with moving walkways. People will experience what it feels like to be a small piece of data.3 One of a few various conference rooms reserved for business customers.4 There are floor panels removed in certain areas of the data center to allow for views down through to the ocean.5 In special places there are floor panels removed to open up views all the way through from the top to the bottom of the oil rig.
3

1
2
5
4

EXPERIENCE THE ELEMENTSWITHIN THE DATA AQUARIUM
TRANSFORMATION FROM REMOVED TO EXPERIENTIAL
66 BY RYAN GRADY WINTER 2014 ISSUE
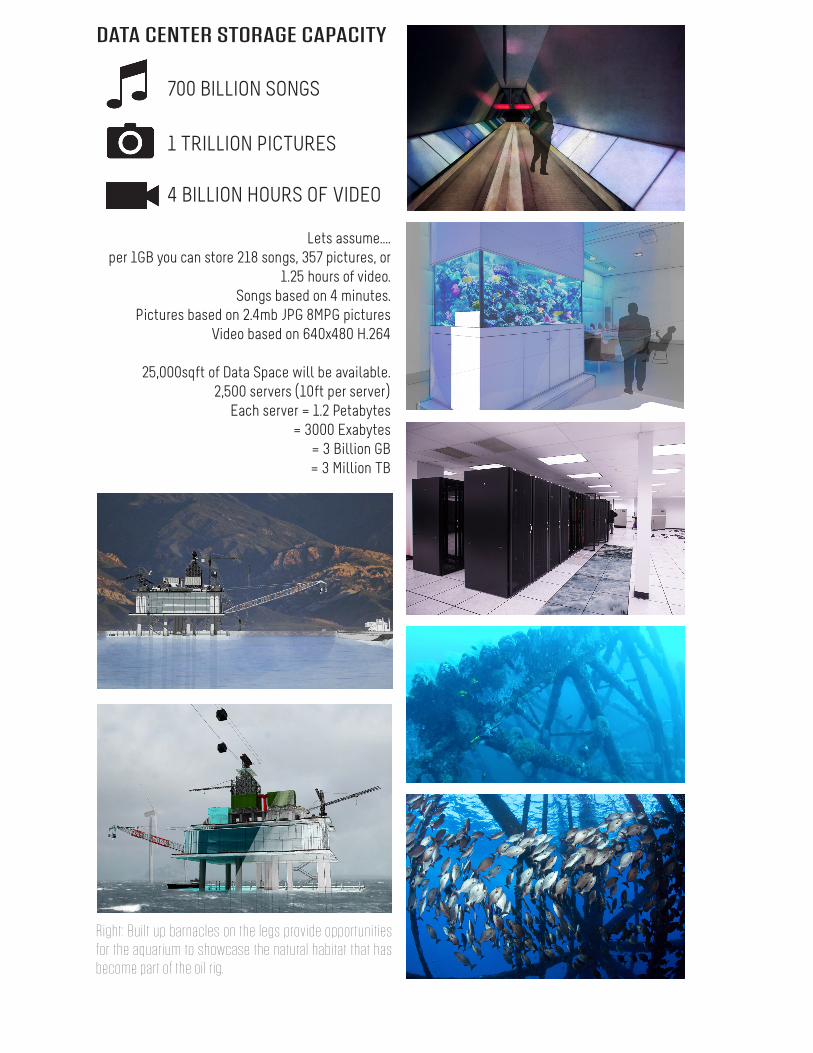
DATA CENTER STORAGE CAPACITY
Lets assume....per 1GB you can store 218 songs, 357 pictures, or
1.25 hours of video.Songs based on 4 minutes.
Pictures based on 2.4mb JPG 8MPG picturesVideo based on 640x480 H.264
25,000sqft of Data Space will be available.2,500 servers (10ft per server)
Each server = 1.2 Petabytes= 3000 Exabytes
= 3 Billion GB= 3 Million TB
700 BILLION SONGS
1 TRILLION PICTURES
4 BILLION HOURS OF VIDEO
Right: Built up barnacles on the legs provide opportunities for the aquarium to showcase the natural habitat that has become part of the oil rig.
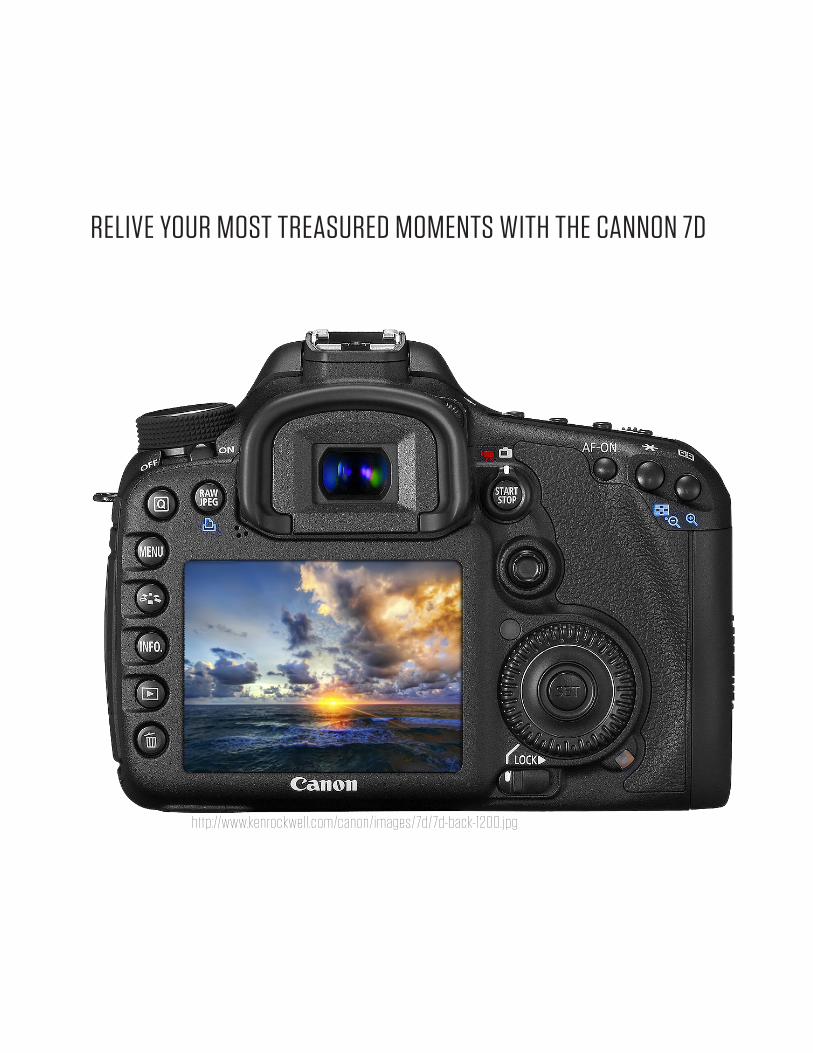
http://www.kenrockwell.com/canon/images/7d/7d-back-1200.jpg
RELIVE YOUR MOST TREASURED MOMENTS WITH THE CANNON 7D

http://i1.wp.com/www.thenerdmag.com/wp-content/uploads/onedrive-cloud-storage.jpg

Alger, Douglas. Grow a Greener Data Center. Indianapolis, IN: Cisco Press, 2010. Print.
Barnas, Raphael. “UniqueVisionStudio: Prison Platform.” UniqueVisionStudio: Prison Platform. UniqueVisionStudio.com, 8 Apr. 2013. Web. 27 Sept. 2013
“CLOG.” CLOG. Clog-Online.com, 1 Dec. 2011. Web. 27 Sept. 2013. <http://www.clog-online.com/news/announcing-clog-data-space/>.
“Directory:Ocean Wave Energy.” - PESWiki. N.p., n.d. Web. 13 Dec. 2013. <http://peswiki.com/index.php/Directory:Ocean_Wave_Energy>.
“Douglas County, Georgia Data Centers Google.” Douglas County, Georgia Data Centers Google. N.p., n.d. Web. 12 Dec. 2013. <http://www.google.com/about/datacenters/inside/locations/douglas-county/index.html>.
Fastman, Brandon. “Wind Power Gains Momentum.” Wind Power Gains Momentum The Santa Barbara Independent. Independant.com, 19 Sept. 2013. Web. 13 Dec. 2013. <http://www.independent.com/news/2013/sep/19/wind-power-gains-momentum/>.
“[INFOGRAPHIC] Data Center Evolution: 1960 to 2000.” Rackspace Hosting. N.p., n.d. Web. 13 Dec. 2013. <http://www.rackspace.com/blog/datacenter-evolution-1960-to-2000/>.
“Insolation.” Insolation. N.p., n.d. Web. 13 Dec. 2013. <http://www.geog.ucsb.edu/ideas/Insolation.html>.
“Maunsell Forts.” Wikipedia. Wikimedia Foundation, 30 Nov. 2013. Web. 12 Dec. 2013. <http://en.wikipedia.org/wiki/Maunsell_Forts>.
Metz, Cade. “Welcome to Prineville, Oregon: Population 800 Million.” Wired. Wired.com, 1 Dec. 2011. Web. 27 Sept. 2013. <http://www.wired.com/wiredenterprise/2011/12/facebook-data-center/all/>.
“New Ocean Platform Prison : Pacific Design Contest.” New Ocean Platform Prison. E-Architect.com, 12 Mar. 2013. Web. 27 Sept. 2013.
N.p., n.d. Web. 12 Dec. 2013. <http://www.thebigsmallboy.com/2013/05/oh-yeah-mabul-island-semporna-sabah.html>.
RIGZONE - How Does Decommissioning Work?.” RIGZONE - Your Gateway to the Oil & Gas Industry. N.p., n.d. Web. 27 Sept. 2013. <http://www.rigzone.com/training/insight.asp?i_id=354>.
WORKS CITED
BIBLIOGRAPHY

“Trailing Trekker’s Travels.” Trailing Trekkers Travels. N.p., n.d. Web. 12 Dec. 2013. <http://trailingtrekker.wordpress.com/>.
Quirk, Vanessa. “Data Centers: Anti-Monuments of the Digital Age.” ArchDaily. ArchDaily.com, 5 July 2012. Web. 27 Sept. 2013.
Vanessa. “The Real-Life Waterworld Project | Messy Nessy Chic Messy Nessy Chic.”Messy Nessy Chic. N.p., 26 July 2013. Web. 27 Sept. 2013.
Wilson, Kristie. “First 100% Sustainable Island in the Caribbean | Inhabitat - Sustainable Design Innovation, Eco Architecture, Green Building.” Inhabitat Sustainable Design Innovation Eco Architecture Green Building First 100 Sustainable Island in the Caribbean Comments. Inhabitat.com, 3 Feb. 2009. Web. 27 Sept. 2013.
*Note: Images have links to sources listed on the image. Refer to image for source.
INTRODUCING THE
DJI PHANTOM 2EASILY CAPTURE AND REMEMBER YOUR OFFSHORE EXPERIENCE
http://quadcopters.co.uk/ekmps/shops/quadcopters/resources/Design/dji-phantom-2-uk-stock.jpg