sdd-spps project working papers series: long-term...
TRANSCRIPT

Long-term Care of Older Persons in Japan
SDD-SPPS PROJECT WORKING PAPERS SERIES:
LONG-TERM CARE FOR OLDER PERSONS IN ASIA AND THE PACIFIC
BANGKOK, 2015

PROJECT WORKING PAPERS SERIES: LONG-TERM CARE FOR OLDER PERSONS IN ASIA AND THE PACIFIC
2
PROJECT WORKING PAPERS SERIES: LONG-TERM CARE FOR OLDER PERSONS IN ASIA AND THE PACIFIC
Acknowledgements
This paper was drafted by Reiko Hayashi, National Institute of Population and Social Security Research in Tokyo, with comments from Srinivas Tata, Therese Bjork, and Vanessa Steinmay-er, all with ESCAP. Karen Emmons managed the language editing.
This working paper was prepared under a research project on the rights of older persons, funded by the Government of China. This research project aims to document schemes as well as the emerging needs for the long-term care of older persons.
This document has been issued without formal editing.
Disclaimer
The designations employed and the presentation of the material in this publication do not imply the expression of any opinion whatsoever on the part of the Secretariat of the United Nations concerning the legal status of any country, territory, city or area, or of its authorities, or concerning the delimitation of its frontiers or boundaries. The opinions, figures and estimates set forth in this publication are the responsibility of the authors, and should not necessarily be considered as reflecting the views or carrying the endorsement of the United Nations.

LONG-TERM CARE FOR OLDER PERSONS IN JAPAN
3
LONG-TERM CARE FOR OLDER PERSONS IN JAPAN
Table of contents
Acknowledgements 2List of Figures 4List of Tables 5
1 Introduction 71.1 Changing population structure and ageing 71.2 Evolution of health and mortality 101.3 Living arrangements of older persons 13
2 Evolution of the older person care system in Japan 152.1 Family system and minimum public older person care system
in the first half of the twentieth century 152.2 The Act on Social Welfare for the Elderly 162.3 Free medical care for older persons 172.4 Health and Medical Services Act for the Aged 19
3 Long-term care insurance 213.1 Background 213.2 Implementation of the LTCI and its recipients 213.3 Financing of the LTCI 233.4 The structure of service, its fee and expenditure 24
4 Health and welfare frameworks for older person care 284.1 Composition of elderly care in the different systems 284.2 Health insurance and the late-stage medical care system for older persons 284.3 Public assistance for poverty alleviation 294.4 Disability protection measures 294.5 Care cycle and the integrated community care system 304.6 Fiscal sustainability: Long-term trend of care expenditure for older persons 32
5 Actors in the long-term care system 345.1 Family 345.2 Care personnel 375.3 Non-government organizations and civil society 415.4 Government and decentralization 445.5 Private sector 44
6 Conclusions 47
References 49

PROJECT WORKING PAPERS SERIES: LONG-TERM CARE FOR OLDER PERSONS IN ASIA AND THE PACIFIC
4
PROJECT WORKING PAPERS SERIES: LONG-TERM CARE FOR OLDER PERSONS IN ASIA AND THE PACIFIC
List of Figures
Figure 1. Population, by broad age group and ageing rate, 1920–2060 7
Figure 2. Population of 2010 and population aged 65, 75 and older 8
Figure 3. Male and female population aged 65 or older, 2000–2015 9
Figure 4. Ageing rate jumps from 7 per cent to 14 per cent, 1850–2050 10
Figure 5. Evolution of life expectancy and ageing rate 11
Figure 6. Healthy life expectancy and unhealthy years, 2001–2013 12
Figure 7. Life expectancy and healthy (not bed-ridden) life expectancy 12
Figure 8. Living arrangement for persons aged 65 or older, 2010 14
Figure 9. Number of older persons receiving rice under the Relief Regulations, 1870–1940 15
Figure 10. Number of patients per 100,000 population, by age group 18
Figure 11. The location of death in Japan, 1951–2013 18
Figure 12. Financing of elderly medical expenses before and after the elderly health system 19
Figure 13. Number of persons certified for long-term care, by care or support level, 2000–2015 22
Figure 14. Proportion of care recipients, April 2015 22
Figure 15. Evolution of the proportion of care recipients, by age group 23
Figure 16. LTCI finance of municipality, financial year 2012 budget base (in trillion yen) 24
Figure 17. LTCI expenditure, by type of service, 2014 (in trillion yen) 27
Figure 18. Integrated community care system 30
Figure 19. Origin and destination of those who left the long-term care facility, September 2013 31
Figure 20. Medical, welfare and long-term care expenditure per older person, 1977–2011 33

LONG-TERM CARE FOR OLDER PERSONS IN JAPAN
5
Figure 21. Framework of debate on family cash allowance introduction to long-term care insurance 34
Figure 22. Main caregiver, by relation to the person cared for, 2013 (per cent) 35
Figure 23. The co-residing caregiver, by sex, 2013 (per cent) 35
Figure 24. The co-residing caregiver, by age group and by sex, 2013 (per cent) 36
Figure 25. Number of parents needing care, by age of married women, 2013 (per cent) 37
Figure 26. Projected personnel demand for health and long-term care, 2025 38
Figure 27. Projected demand-supply gap of long-term care workers in 2025 39
Figure 28. Proportion of facilities by bodies that established them and by type of facility, 2013 (per cent) 41
Figure 29. The change of the proportion of service operators of in-home long-term care support, by establishment (per cent) 45
Figure 30. The admission capacities of long-term care facility, by type 46
List of Tables
Table 1. Proportion of population living independently, 60 years or older (per cent) 13
Table 2. Population living in a facility, by age group, 1970–2010 14
Table 3. Seven sets of services and basic service fees in the LTCI scheme 25
Table 4. Number of entries under the Economic Partnership Agreements with Indonesia, Philippines and Viet Nam 40
Table 5. Distribution of service operators by establishment body, by type of service, 2013 (per cent) 43
Annex Table. Facilities for the long-term care in Japan 50

PROJECT WORKING PAPERS SERIES: LONG-TERM CARE FOR OLDER PERSONS IN ASIA AND THE PACIFIC
6

LONG-TERM CARE FOR OLDER PERSONS IN JAPAN
7
LONG-TERM CARE FOR OLDER PERSONS IN JAPAN
1 Introduction
1.1 Changing population structure and ageing
Japan is the most aged society in the world. As of 2014, the proportion of the ageing rate, defined here as the proportion of persons aged 65 or older among the total population, was as high as 26 per cent.1 More than one in four persons in Japan is 65 years old or older. The population of older persons is projected to increase further, reaching 40 per cent around 2060. According to the most recent census (2010), the total population is some 128 million people, the highest number recorded in the census history. Since 2010, however, the popula-tion has declined and is projected to continue decreasing.
The population group of persons aged 0–19 years began decreasing as of 1960, while the num-ber of persons aged 20–64 years only started to decline in 2005. Among the older persons, the “younger-old”—aged 65–74 years—increased and will continue to increase steadily. The most notable increase, however, is the number of “older-old”—aged 75 years or older (see figure 1). The number of younger-old has been increasing but will begin to decrease in 2020, whereas the older-old will keep expanding until 2055.
FIGURE 1. POPULATION, BY BROAD AGE GROUP AND AGEING RATE, 1920–2060
26 30 34 36 38 38 37 36 34 35 36 35 32 29 26 24 23 22 20 18 17 16 15 14 13 12 11
27 31
35 39
41 46 51 56 63 68 71 74 76 79 79 78 75
71 68 66 63
59 54 50 46 44 41
2
2 3
3 3
3 4
4 5
6 7 8 9 11 13 14
15 17
17 15
14 15
16 16
14 12
11 1
1 1
1 1
1 2
2 2
3 4
5 6 7 9 12 14 16 19
22 23
22 22
23 24
24 23
0%
5%
10%
15%
20%
25%
30%
35%
40%
45%
0
20
40
60
80
100
120
140
1920
1930
1940
1947
1950
1955
1960
1965
1970
1975
1980
1985
1990
1995
2000
2005
2010
2015
2020
2025
2030
2035
2040
2045
2050
2055
2060
Agei
ng ra
te
Popu
lati
on in
mil
lion
YearAged 0-19 20-64 65-74 75+ Ageing rate
93
Total population= 128 million
87
Projection
56
Source: Statistics Bureau, ”1920 to 2010 by Population Census (Tokyo, , Ministry of Internal Affairs and Communications, 2010). National Institute of Population and Social Security Research, “2015 to 2060 by Population Projections for Japan”, (Tokyo, 2012)..
1 The term “ageing rate” is often used in Japan, where the older population is defined as persons aged 65 years or older, based on the World Health Organization definition. This criterion has been used since 1963, when the Act on Social Wel-fare for the Elderly was adopted.

PROJECT WORKING PAPERS SERIES: LONG-TERM CARE FOR OLDER PERSONS IN ASIA AND THE PACIFIC
8
In addition to the proportion of older persons, it is important to count the number of older persons because it affects the care provision and infrastructure. The number of older per-sons is affected by the population structure, especially by the baby boomers born shortly after the Second World War. In 2010, the population pyramid (see figure 2) had a distinctive age structure, with two peak ages, at 37 and 61, corresponding to baby boomers and junior baby boomers (the children of baby boomers). There is a sharp increase when those baby boomers and junior baby boomers aged, which explains the acceleration of the number of older persons up to 2020 and 2040. Looking at the number of older-old persons, there is a predicted sharp increase around 2025. Considering that older-old persons are more in need of health services and long-term care than younger-old persons, preparations should begin now to meet those needs. In contrast to the ever increasing ageing rate, the number of older persons will stagnate after the baby boomer’s effect.
FIGURE 2. POPULATION OF 2010 AND POPULATION AGED 65, 75 AND OLDER
0
5
10
15
20
25
30
35
40
45
0
500
1,000
1,500
2,000
2,500
Popu
lati
on 6
5+, 7
5+ in
1,0
00
Population 65+, 75+: Year
Popu
lati
on o
f 201
0 in
1,0
00
Population of 2010: Age (year of bi�h)
Population of 2010 by age Population +65 Population +75
Note: The census of 2010 was conducted on 1 October 2010. The year of birth shown here is the representative (three quarters ) of the population of each age.Source: Statistics Bureau, “Population census and population estimate” (Tokyo, Ministry of Internal Affairs and Commu-nications;. data for 2015: National Institute of Population and Social Security Research, “Population projections for Japan, medium-fertility and medium-mortality assumption” (Tokyo, 2012).
Another distinctive characteristic is the feminization of the older population. With women living longer than men, there are more women than men in the old age, especially in the

LONG-TERM CARE FOR OLDER PERSONS IN JAPAN
9
older-old segment. In 2015, there were 9.9 million older-old women, 3.7 million more than older-old men (see figure 3).
FIGURE 3. MALE AND FEMALE POPULATION AGED 65 OR OLDER, 2000–2015
6.0 6.2 6.3 6.4 6.4 6.6 6.8 6.9 7.1 7.2 7.2 7.1 7.4 7.7 8.1 8.2
3.2 3.4 3.6 3.9 4.1 4.3 4.5 4.8 5.0 5.2 5.4 5.6 5.8 6.0 6.1 6.2 7.0 7.1 7.3 7.4 7.4 7.5 7.7 7.8 7.9 8.1 8.1 8.0 8.2 8.6 9.0 9.1 5.8 6.1 6.4 6.7 7.0 7.3 7.6 7.9 8.2 8.5 8.8 9.1
9.4 9.6
9.8 9.9
0
5
10
15
20
25
30
35
2000 2001 2002 2003 2004 2005 2006 2007 2008 2009 2010 2011 2012 2013 2014 2015
Popu
lati
on in
mill
ion
Male 65 -74 Male 75+ Female 65-74 Female 75+
Source: Statistics Bureau, “Population estimates” (Tokyo, Ministry of Internal Affairs and Communications).
The ageing of Japan’s population occurred quickly. In 1970, the ageing rate exceeded 7 per cent, the threshold which used to be considered as the onset of population ageing. It took only 26 years before the ageing rate reached 14 per cent, the threshold of an aged population. Considering that it took France 115 years or the United States 69 years for their ageing rates to go from 7 per cent to 14 per cent, Japan’s case is one of the quickest in the world (see figure 4). However, the emerging countries such as the Republic of Korea and Thailand will have an even shorter period for this transition.

PROJECT WORKING PAPERS SERIES: LONG-TERM CARE FOR OLDER PERSONS IN ASIA AND THE PACIFIC
10
FIGURE 4. AGEING RATE JUMPS FROM 7 PER CENT TO 14 PER CENT, 1850–2050
2000
2000
2017
2011
2002
2008
2002
2000
1998
2004
1970
1966
1930
1947
1941
1944
1944
1938
1890
1865
18
19
19
21
22
24
24
26
27
33
26
45
45
45
53
65
69
73
85
115
2018
2019
2036
2032
2024
2032
2026
2026
2025
2037
1996
2011
1975
1992
1994
2009
2013
2011
1975
1980
1850 1900 1950 2000 2050
Republic of Korea
Singapore
Colombia
Brazil
Thailand
Tunisia
Sri Lanka
China
Chile
Azerbaijan
Japan
Poland
United Kingdom
Spain
Hungary
Canada
United States
Australia
Sweden
France
Year
By p
roje
ctio
n
Note: The number of the left of the bar designates the year when the ageing rate attained 7 per cent; the number on the right of the bar designates the year when the ageing rate attained 14 per cent. The number in the middle of the bar designates the years required for the ageing rate to change from 7 per cent to 14 per cent.Source: Keven Kinsella and Wan He, (2009). An Aging World: 2008 (Washington, D.C., US Census Bureau, 2009).
1.2 Evolution of health and mortality
Decline of infant mortality and maternal mortality began around 1920; following the con-tainment of tuberculosis in the 1950s, chronic diseases, such as cerebrovascular diseases, malignant neoplasms and heart diseases, emerged as the three major causes of death in Japan. This epidemiological transition, from infectious diseases to chronic diseases, corre-sponds with the trend in life expectancy and the ageing rate (see figure 5). An almost vertical increase of life expectancy around 1950 is attributed to the elimination of tuberculosis. Since the epidemiologic transition, the increase is more stable. The ageing rate was almost stagnant before the transition but very sharp after the transition.

LONG-TERM CARE FOR OLDER PERSONS IN JAPAN
11
FIGURE 5. EVOLUTION OF LIFE EXPECTANCY AND AGEING RATE
0
5
10
15
20
25
30
35
40
40
45
50
55
60
65
70
75
80
85
90
1870 1880 1890 1900 1910 1920 1930 1940 1950 1960 1970 1980 1990 2000 2010 2020
Agei
ng ra
te (
per c
ent)
Life
exp
ecta
ncy
(yea
rs)
YearLife expectancy Ageing rate
Source: Life expectancy up to 1935: Statistics and Information Department, “Life table” (Tokyo, Ministry of Health, Labour and Welfare); from 1947: National Institute of Population and Social Security Research, “Japanese mortality database” (Tokyo); Statistics Bureau, “Aging rate” (Tokyo, Ministry of Internal Affairs and Communications).
As for the healthy life expectancy, due to the different definition of health and methods used, there are several different sets of data. According to the Global Burden of Disease Study, the healthy life expectancy in Japan is the longest in the world (of 187 countries) in both 1990 and 2010 (Salomon 2012). It was 67.7 years for men and 72.3 years for women in 1990, which increased to 70.6 years for men and to 75.5 years for women in 2010.
The Japanese official statistics define healthy life expectancy as “health without activity lim-itation caused by a health condition” and this figure has been increasing along with time since 2001. The increase of life expectancy is, on average, 0.2 for women and 0.1 years for men per year during this period. Women live longer, but they also have more unhealthy years than men. In 2013, women lived 12.4 unhealthy years, whereas men lived 9 years (see figure 6). However, as women live longer, the healthy life expectancy of women stood at 74.2 years in 2013 - longer than that of men’s, which stood at 71.2years.

PROJECT WORKING PAPERS SERIES: LONG-TERM CARE FOR OLDER PERSONS IN ASIA AND THE PACIFIC
12
FIGURE 6. HEALTHY LIFE EXPECTANCY AND UNHEALTHY YEARS, 2001–2013
71.19
70.42
70.33
69.47
69.40
74.21
73.62
73.36
72.69
72.65
9.02
9.13
8.86
9.17
8.67
12.40
12.68
12.63
12.90
12.28
0 10 20 30 40 50 60 70 80 90 100
2013
2010
2007
2004
2001
2013
2010
2007
2004
2001
Mal
eFe
mal
e
Unhealthy years
(84.93)
(85.59)
(85.99)
(86.30)
(86.61)
(Life expectancy)
Healthy life expectancy (years)
(78.07)
(78.64)
(79.19)
(79.55)
(80.21)
Source: Ministry of Health, Labour and Welfare, Health Japan 21 (the second term) progress of each objective. Available from , www.mhlw.go.jp/file/05-Shingikai-10601000-Daijinkanboukouseikagakuka-Kouseikagakuka/sinntyoku.pdf.
Another data on healthy life expectancy use bed-ridden rate, which is available for longer time span since 1970s. The healthy, non-bed-ridden life expectancy increased almost in par-allel with life expectancy (see figure 7).
FIGURE 7. LIFE EXPECTANCY AND HEALTHY (NOT BED-RIDDEN) LIFE EXPECTANCY
70
72
74
76
78
80
82
84
86
88
1975 1980 1985 1990 1995 2000 2005 2010 2015
Life
exp
ecta
ncy
(yea
rs)
Year
Male life expectancy
Male healthylife expectancy
Female life expectancy
Female healthylife expectancy
Note: The healthy life expectancy is adjusted by population in the facility, assuming that all persons are bed-ridden.Source: Reiko Hayashi, “Examination of bed-ridden rate and the evolution of healthy life expectancy: The trend in Japan since 1970s”. Research Report 57 (2015), pp. 43–59. Bed-ridden rate for 1978, 1981 and 1984: Comprehensive Survey of Welfare Administration, “Comprehensive Survey of Living Conditions, Statistics (Tokyo, Information Department, Ministry of Health, Labour and Welfare).

LONG-TERM CARE FOR OLDER PERSONS IN JAPAN
13
1.3 Living arrangements of older persons
In 2010, almost half of the older persons in Japan lived independently of their children—alone or with a spouse. This rate is much lower than in Germany, the United Kingdom, France or the United States. This is probably caused by the cultural norm that family takes care of older persons. This proportion is around the same level as what is found in Italy and larger than in developing countries, such as China, India or Thailand (see table 1).
TABLE 1. PROPORTION OF POPULATION LIVING INDEPENDENTLY, 60 YEARS OR OLDER (PER CENT)
Male Female Year
Germany 91.5 88.7 2005 or later
United Kingdom 84.1 82.5 2005 or later
France 82.0 83.5 2005 or later
United States 76.8 73.8 2005 or later
Italy 57.1 61.6 2004 or earlier
Japan 51.5 46.9 2010
China 39.7 34.1 2005 or later
Thailand 21.3 16.8 2004 or earlier
India 17.3 15.8 2005 or later
Source: Japan: Population Census 2010; all other countries: United Nations Department of Economic and Social Affairs, Population Ageing and Development 2012 (New York, 2012).
Along with the population ageing, there has been a dramatic change in the living arrangement of older persons in Japan. In 1970, as much as 80 per cent of persons aged 65 years or older lived with their children, family members or other kin. Older persons living alone accounted for only 6 per cent, and those with a spouse amounted to 12 per cent. That proportion began reversing over time; now, more older persons live alone or only with their spouse (see figure 8). The cultural norm of Japanese society that the eldest son lives with his parents, while older persons are taken care of by the daughter-in-law, is becoming less and less prevalent.
Older persons who lived in a facility amounted to 2 per cent in 1970; that figure tripled to 6 per cent in 2010, when 4.1 per cent lived in a long-term care facility and 1.5 per cent in a hos-pital.2 Although the overall proportion is small, the speed of increase was rapid. Considering the sharp increase in the total number of older persons, the number of older persons living in a facility increased eightfold, from 200,000 in 1970 to 1.67 million in 2010. If observed by the five-year age group, the proportion of older persons who were in a facility has been decreasing since 1980 for the younger-old (65–69 years), since 1990 for persons aged 70–74 years and since 2000 for persons aged 75–84 years. Only the oldest-old (aged 85 or older)
2 In Japan, the place of residence is defined as the place where someone resides in for more than three months.

PROJECT WORKING PAPERS SERIES: LONG-TERM CARE FOR OLDER PERSONS IN ASIA AND THE PACIFIC
14
among the facility population showed a monotonic increase up to 2010 (see table 2). There are potentially two reasons for that: The first optimistic reason is that younger-old have not needed to stay in a facility in recent years because they are healthier than before. The other, pessimistic, reason is that there is not enough capacity in facilities and only the very disabled oldest-old can be accepted.
FIGURE 8. LIVING ARRANGEMENT FOR PERSONS AGED 65 OR OLDER, 2010
At home alone At home with spouse At home with children/family /other In facility
5% 7% 8% 10% 11% 12% 14% 15% 16%12% 15% 18% 21% 24% 28% 31% 33% 34%
80% 75% 70% 66% 61% 56% 51% 47% 44%
3% 3% 4% 4% 4% 4% 5% 5% 6%
0%
20%
40%
60%
80%
100%
1970 1975 1980 1985 1990 1995 2000 2005 2010
Source: Statistics Bureau, “Population census”, compiled by the National Institute of Population and Social Security
Research in “Population statistics”, (Tokyo, 2011)
TABLE 2. POPULATION LIVING IN A FACILITY, BY AGE GROUP, 1970–2010
People living in a facility
1970 1980 1990 2000 2010
Age group 65–69 71 245 73 167 83 228 106 279 114 600
70–74 57 055 93 545 103 263 129 007 146 923
75–79 40 080 97 390 144 170 171 290 232 494
80–84 23 005 72 312 152 488 214 216 349 052
85+ 11 225 44 459 156 957 403 199 824 792
65+ 202 610 380 873 640 106 1 023 991 1 667 861
Percentage of age group living in a facility
Age group 65–69 1.9% 1.8% 1.6% 1.5% 1.4%
70–74 2.2% 3.1% 2.7% 2.2% 2.1%
75–79 2.7% 4.8% 4.8% 4.1% 3.9%
80–84 3.2% 6.6% 8.3% 8.2% 8.0%
85+ 3.5% 8.4% 14.0% 18.0% 21.7%
65+ 2.8% 3.6% 4.3% 4.6% 5.7%
Note: The percentage is the proportion of people in the facility among the total population of each age group.Source: Statistics Bureau, “Population census” (1970 to 2010) compiled by author.

LONG-TERM CARE FOR OLDER PERSONS IN JAPAN
15
LONG-TERM CARE FOR OLDER PERSONS IN JAPAN
2 Evolution of the older person care system in Japan
2.1 Family system and minimum public older person care system in the first half of the twentieth century
The cultural norm that the eldest son succeeds the family (i.e., in Japan) and his wife take care of his parents was institutionalized by the Civil Code of 1898. The public welfare system stepped in to take care of older persons without any family who became poor and/or frail. The first public welfare legislation that covered older persons was promul-gated in 1872 as the Relief Regulations, which entitled very poor or sick single persons aged 70 years or older to a specified portion of rice, which was the equivalent of 325 litres yearly. Until 1940, recipients of this aid numbered in the thousands, with fluctuations according to different circumstances (see figure 9).
FIGURE 9. NUMBER OF OLDER PERSONS RECEIVING RICE UNDER THE RELIEF REGULATIONS, 1870–1940
0
1,000
2,000
3,000
4,000
5,000
6,000
7,000
1870 1880 1890 1900 1910 1920 1930 1940
Num
ber
of e
lder
ly r
elie
ved
(per
son)
Year
Source: Cabinet Bureau of Statistics, Statistical Yearbook of the Empire of Japan in Historical statistics of Japan, (Statistics Bureau and Japan Statistical Association, 1988).

PROJECT WORKING PAPERS SERIES: LONG-TERM CARE FOR OLDER PERSONS IN ASIA AND THE PACIFIC
16
In 1929, the Relief Law was adopted, covering frail persons aged 65 or older who became physically weak and were unable to live on their own due to poverty. At that time, municipal governments and social work organizations began setting up aid facilities, including older person homes, upon approval of the prefecture governor.
After the end of the Second World War, with a strong instruction from the Supreme Com-mander for the Allied Powers (General Head Quarter : GHQ), the Public Assistance Act was enacted in 1946, which was revised soon after in 1950 following the promulgation of the new Constitution. At that time, the existing elderly homes were renamed as Elderly Facilities and a government subsidy to them was initiated. In 1954, there were 424 facilities housing 23,021 older persons (Health and Welfare Statistics Association, 1955). In addition to the protection of poor older persons at home, the facility-based welfare system for older persons emerged.
2.2 The Act on Social Welfare for the Elderly
After the Diet approved the National Health Insurance Act in 1958 and the National Pension Act in 1959, Japan achieved universal coverage on health and pensions in 1961. The univer-sal coverage stimulated public support for the welfare of older persons, both in social welfare and health perspectives, which led to enactment of the Act on Social Welfare for the Elderly in 1963.
The Act on Social Welfare for the Elderly was considered the first of its kind in the world. In 1962, the ruling Liberal Democratic Party included the proposed legislation in its manifesto and won the elections. As a result, the Act came into effect already in August 1963.
Prior to that law, several prototype measures were created by local governments. In 1956, Nagano Prefecture began a programme in which a “family helper” was dispatched to elderly households. Kuji city, among others, began offering cash support to older-old persons in need. Some municipalities and non-profit organizations opened fee-based homes for older persons. The Ministry of Health and Welfare began supporting these measures in 1962.
The new law of 1963 established the basic philosophy that older persons should be guar-anteed a healthy and secure life because they had contributed to the development of the country. The Act stipulated such measures for older persons as health check-ups and access to a home helper. The Elderly Facilities administered under the Public Assistance Act were, again, renamed as Care Facility for the Elderly (Yougo). Additionally, the Intensive Care Home for the Elderly (Tokuyou) was created for older persons who need medical care (see annex table 1). During this period, awareness population ageing increased; particularly, the large number of bed-ridden older persons had to be addressed.
In 1968, the Japan National Council of Social Welfare survey found 191,352 bed-ridden older persons (78,404 men and 112,948 women), representing a prevalence of 5.2 per cent. A strong sense of responsibility for the care of bed-ridden older persons was strongly felt, which led to development of the Tokuyou facility. While the Yougo accommodated persons who were

LONG-TERM CARE FOR OLDER PERSONS IN JAPAN
17
impoverished, the Tokuyou offered more long-term care and reflected a change in philosophy to offer assistance based on disability rather than poverty. Construction was rapid and the number of Tokuyou increased seventeenfold, from 27 in 1965 to 451 in 1974.
2.3 Free medical care for older persons
Even though health insurance coverage became universal in 1961, it was only in terms of the number of persons. The scheme involved co-payment. Older persons still paid from 30 per cent to 50 per cent of medical care costs, which substantially limited many from receiv-ing appropriate care. This situation was a product of the multiple health insurance system in which older persons covered by the National Health Insurance scheme upon retirement or becoming the dependant to an employee (typically a working son covered by employee health insurance) and thus required to make a higher co-payment. This disparity caused pub-lic remorse and a better scheme for older persons was demanded.
The prefectural provision of reimbursement for out-of-pocket payments was integrated in 1973 into the national system and called the Elderly Medical Fee Payment System, which was stipulated in the Act for Partial Revision of the Act for the Social Welfare for the Elderly. In this set-up, persons aged 70 or older who did not have taxable income or whose guardian’s income was less than 2.5 million yen per year were exempted from the co-payment require-ment, which was instead covered by the national, prefectural and municipal subsidies, at two thirds, one sixth and one sixth, respectively. In the same year, the High-cost Medical Expenses Payment System was put in place. These systems enhanced access to care, taking the country to real universal coverage of health insurance.
The number of older patients in hospitals increased sharply during the 1970s (see figure 10). Hospitals became a place where not-so-sick older persons would check in to meet friends for social purposes. There was even a joke that older persons in the hospital greeted each other by saying, “How are you doing today?” To which, the reply came, “I am very fine and healthy, thank you”. There was no economic obligation for older persons to need care when checking into hospital.

PROJECT WORKING PAPERS SERIES: LONG-TERM CARE FOR OLDER PERSONS IN ASIA AND THE PACIFIC
18
FIGURE 10. NUMBER OF PATIENTS PER 100,000 POPULATION, BY AGE GROUP
0
5,000
10,000
15,000
20,000
25,000
1940 1950 1960 1970 1980 1990 2000 2010 2020
Num
ber
of p
atie
nt p
er 1
00,0
00 p
opul
atio
n
Year
Age 0
1 -4
5-14
15 -24
25 -34
35 -44
45-54
55-64
65-74
75+
Note: Number of patients is the sum of out-patients and in-patients during one day of the survey.Source: Ministry of Health, Labour and Welfare, “Patient survey” (Tokyo, 2012).
The expansion of provision of care also gave rise to the “elderly hospital” where many elderly patients stayed bed-ridden who needed care but not necessarily costly medical treatment. The care for older persons became heavily hospitalized in the final phase of their lives. In 1976, the number of deaths at hospital exceeded the number of deaths at home for the first time in Japanese history (see figure 11).
FIGURE 11. THE LOCATION OF DEATH IN JAPAN, 1951–2013
0%
10%
20%
30%
40%
50%
60%
70%
80%
90%
1950 1960 1970 1980 1990 2000 2010
Hospital Facility Home Other
Source: Ministry of Health Labour and Welfare, “Vital statistics” (Tokyo, 2010).

LONG-TERM CARE FOR OLDER PERSONS IN JAPAN
19
2.4 Health and Medical Services Act for the Aged
The increasing number of older persons and soaring medical expenditure urged a radical re-structuring of the health finance system. A structural problem emerged at the same time. Based on the health insurance systems, most older persons entered the National Health Insurance upon their work retirement, switching from their employer-provided health insurance. Hence, a concentration of older persons developed in the National Health Insurance scheme.
The Commission on Long-term Planning of Social Security within the Ministry of Health and Welfare submitted a report in 1975 highlighting the need to introduce partial co-payment to raise awareness of the cost of health and the adjustment between different health insurance schemes. It was followed by many other decisions and reports of the minister, commissions and councils and, finally, the legislation of Health and Medical Services Act for the Aged came into effect in 1983. The Elderly Health System created by this Act introduced the co-payment of older persons and shared financing of medical expenses for older persons by the national, prefectural and municipal governments as well as insurers along with health education and prevention activities mandated to municipal governments (see figure 12).
FIGURE 12. FINANCING OF ELDERLY MEDICAL EXPENSES BEFORE AND AFTER THE ELDERLY HEALTH SYSTEM
Before
A�er
Employer-based health insurance
Owned by insurers Government
82%
National health insurance
Nationalhealth insurance
Employer-basedhealth insurance Employer-based
health insurance
Nationalhealth insurance
Nat
iona
l Gov
t
Loca
l Gov
t
Nat
iona
l Gov
t
Loca
l Gov
t
Owned by insurers Government
70%
By the numberof insured elderly
50%
Adjusted by the national averageof elderly
50%
30%
18%
Source: Health and Welfare Statistics Association, Journal of Health and Welfare Statistics (Tokyo, 1985).

PROJECT WORKING PAPERS SERIES: LONG-TERM CARE FOR OLDER PERSONS IN ASIA AND THE PACIFIC
20
A need for a facility with services in between the Elderly Hospital on the medical side and the Tokuyo on the welfare side became evident. The Health and Medical Services Act was revised in 1987 to include provision for the Elderly Health Facility (Rouken). The Rouken involved more medical staff than the Tokuyou but fewer than the Elderly Hospital. Patients were charged a monthly co-payment of around 60,000 yen. The management receive 252,240 yen (in 1992) per patient per month from a combination of the insurers’ contribution (one half ), national subsidy (one third) and municipal government subsidy (one sixth).
These three categories of facilities, namely Elderly Hospital, Rouken and Tokuyou have been the basic framework of older persons care facility in Japan even after the introduction of LTCI (for the different types of facilities for older persons, refer to annex table 1).

LONG-TERM CARE FOR OLDER PERSONS IN JAPAN
21
LONG-TERM CARE FOR OLDER PERSONS IN JAPAN
3 Long-term care insurance
3.1 Background
The Long-Term Care Insurance Act was promulgated in December 1997 and two years later (in 2000), the Long-Term Care Insurance (LTCI) scheme was introduced. LTCI integrated the previously separate health insurance schemes and public welfare system. The insurer of the LTCI is the municipality government.
Eligibility begins at age 40 years. LTCI premium is deducted from the salary in addition to the health insurance premium, or deducted from the pension. There are two tiers of coverage: the primary insured for people aged 65 years or older and the secondary insured for persons aged 40 to 64 years. The primary insured are eligible to receive care whenever they have a need, while the secondary insured are eligible for care only for certain diseases, such as dementia, cerebrovascular diseases and articular rheumatism.
Upon the request for care by an insured person, the certification of need is conducted through a computerized screening process, followed by a committee created within the municipality, which reviews the opinion letter of home doctor and other relevant documents. Once certi-fied, the eligible person can request the care-manager to elaborate his/her care plan, based on which he/she would receive appropriate and needed care.
The certified need is classified as support level 1 and 2, care level 1, 2, 3, 4 and 5, according to the severity of the condition. The important characteristic of the LTCI is that once certified, a person has a choice of services. According to the support or care level, a care plan is developed by a care manager to allocate appropriate services. The service options available are home care, short stay and long stay at a facility or group home, with needed equipment rented and purchased.
3.2 Implementation of the LTCI and its recipients
Since 2000 when the scheme was introduced, the number of certified persons in every sup-port and care level has increased, from 2.2 million persons to 6.1 million in 2015 (see figure 13).
Not surprisingly, care needs increase sharply according to the age. In 2015, only 3 per cent of the younger-old persons (aged 65–74) received long-term care, whereas 27 per cent of older-old (aged 75 or older) received it. Almost half of the women aged 85–89 and men aged 90–94 received long-term care (see figure 14). The increase of the population of older-old who need more care than younger-old persons is a strong reason for the increasing number of care recipients in the LTCI scheme.

PROJECT WORKING PAPERS SERIES: LONG-TERM CARE FOR OLDER PERSONS IN ASIA AND THE PACIFIC
22
FIGURE 13. NUMBER OF PERSONS CERTIFIED FOR LONG-TERM CARE, BY CARE OR SUPPORT LEVEL, 2000–2015
291 320 398 505 601 674
59 527 552 575 604 662 692 773 825 874
45
522 629 662 654 669 712 771 806 839
655
40 1
551 709 891
1,070 1,252 1,332 1,387 876 769 788 852 910 970
1,052 1,115 1,176
394 490
571 641
595 614
651 756 806 823 854 901
952 993
1,029 1,062
317 358
394
431 492
527 561 652 711 738 713
700 724
747 769
793
339 365
394
424 479
497 525 547 579 590 630
641 670
696 711
730
290
341
381
414
455 465
465 489 500 515 564
593
612 609
605 604
0
1,000
2,000
3,000
4,000
5,000
6,000
7,000
2000 2001 2002 2003 2004 2005 2006 2007 2008 2009 2010 2011 2012 2013 2014 2015
Pers
ons
in t
hous
annd
s Care5
Care4
Care3
Care2
Care1
Transitional
Suppo�2
Suppo�1
2582
3029
3484
38744108
4348 44084548
46904870
50765330
56435859
6077
2180
Note: From 2000 to 2005, the support level had only one level. The number of persons is for April of each year.
Source: Ministry of Health, Labour and Welfare, “Monthly report on the status of long-term care Insurance”, (Tokyo).
FIGURE 14. PROPORTION OF CARE RECIPIENTS, APRIL 2015
0%
10%
20%
30%
40%
50%
60%
70%
80%
90%
40 64 65 69 70 74 75 79 80 84 85 89 90 94 95 and over
AgeMale Female Both sexes
Source: Ministry of Health, Labour and Welfare, “Survey of long-term care benefit expenditures” (Tokyo, 2015).

LONG-TERM CARE FOR OLDER PERSONS IN JAPAN
23
The age-specific LTCI utilization has been stable. From the launch in 2000, the proportion increased up to 2004 then almost stagnated for all age groups except among persons aged 90 years or older (see figure 15). That first spurt up to 2004 might be attributed to the gradual expansion and recognition of the LTCI scheme. The increase of the proportion for the age group of 90 or older is primarily due to the increase of extremely old persons, such as cente-narians.
FIGURE 15. EVOLUTION OF THE PROPORTION OF CARE RECIPIENTS, BY AGE GROUP
0%
10%
20%
30%
40%
50%
60%
70%
2001 2002 2003 2004 2005 2006 2007 2008 2009 2010 2011 2012 2013 2014 2015
90 or over
85 89
80 84
75 79
70 74
65 69
40 64
Source: Ministry of Health, Labour and Welfare, “Survey of long-term care benefit expenditures” (Tokyo, 2015).
3.3 Financing of the LTCI
As already explained, LTCI is a social insurance system financed by national, prefectural and municipal governments’ subsidies, with premium paid by the insured and co-payment by users. The proportion of these three components is fixed: The co-payment is 10 per cent, which is paid by the care recipient to the care provider. Half of the remaining cost is financed by the premium and the other half by the subsidy, which is paid by the municipality (the LTCI operator) to the care provider. National, prefectural and municipal subsidy shares are 50 per cent, 25 per cent and 25 per cent for in-home services and 40 per cent, 35 per cent and 25 per cent for facility services, respectively.
In 2012, the largest share of the LTCI financing came from the premium paid by the sec-ondary insured users, which amounted to nearly 2.4 trillion yen (29 per cent). The premium paid by the primary insured users amounted 1.7 trillion yen (21 per cent), followed by the national governmental subsidy of nearly 1.5 trillion yen (18 per cent) (see figure 16).

PROJECT WORKING PAPERS SERIES: LONG-TERM CARE FOR OLDER PERSONS IN ASIA AND THE PACIFIC
24
FIGURE 16. LTCI FINANCE OF MUNICIPALITY, FINANCIAL YEAR 2012 BUDGET BASE (IN TRILLION YEN)
Premium of primary insured
21%
Premium of secondary
insured29%
National government adjustment
subsidy5%
Prefectural government
subsidy15%
Municipalgovernmentsubsidy12%
National governmentsubsidy18%
Source: Health, Labour and Welfare Statistics Association, Journal of Health and Welfare Statistics (Tokyo, 2012).
The primary insured (aged 65 or older) user’s premium is deducted from their pension payment and deducted from monthly salary in case of the secondary insured (aged 40–64) user, in addition to the health insurance premium. Both are means tested: The amount of premium depends on each user’s income level. The premium is set every three years by each municipal government, which is the insurer. Due to the imbalance of distribution of older persons between municipalities, 5 per cent of a national subsidy is used to fill the gap be-tween the municipalities. A Finance Stabilizing Funds was created at the prefecture level to cover unforeseeable expenditure caused by catastrophic care payments or unpaid premiums.
The increasing expenditure of LTCI inevitably increases the amount of premium. The na-tional average premium was 2,911 yen per month for the period of 2000–2002 and then increased to 3,293 yen (2003–2005), 4,090 yen (2006–2008), 4,160 yen (2009–2011) and 4,972 yen (2012–2014).
3.4 The structure of service, its fee and expenditure
The Government regulates the LTCI fee for services. Basic lists are elaborated by the Social Security Council Subcommittee for Long-Term Care Benefit Expense. There are seven sets,

LONG-TERM CARE FOR OLDER PERSONS IN JAPAN
25
each of which is defined in the form of a notification by the Ministry of Health, Labour and Welfare that determines the unit price of each service. Each unit price is then multiplied by 10 yen and a coefficient, according to the geographical region and type of service. Eight regions are classified according to the level of price in each location, which is based on the classification used to calculate civil servants salaries. For example, the 23 wards in Tokyo make up region 1, which has the highest coefficient, followed by region 2, which encompass-es 21 cities, such as Yokohama or Osaka.
There are four types of service, based on the proportion of labour cost. The higher labour cost services, such as home-visit long-term care or home-visit nursing, has the highest coefficient, at 70 per cent. This coefficient was introduced to increase the salary of care workers and improve their working conditions. The coefficient thus obtained by region and type of care ranges from 1 to 1.14, and one unit fee ranges from 10 yen to 11.40 yen.
Table 3 shows the services defined in the seven sets. The basic service fees are further mod-ified according to the length of service and other factors. The insurer pays 90 per cent of the fee to the service provider, and 10 per cent of the fee is paid directly by user to the service provider as the co-payment.
TABLE 3. SEVEN SETS OF SERVICES AND BASIC SERVICE FEES IN THE LTCI SCHEME
A In-home services
Home-visit services
1 Home-visit long-term care (home help service): 165–564 units, according to the time required
2 Home-visit bathing long-term care: 1,234 units
3 Home-visit nursing: 262–1,117 units according to the time required and type of service centre
4 Home-visit rehabilitation: 302 units
5 Guidance for management of in-home medical long-term care: 262 to 553 units, according to the category of health professional and number of service within a building
Commuting services
6 Outpatient day long-term care (day service): 364 to 1,511 units, according to the care level, the duration of service and the size of service centre
7 Outpatient rehabilitation: 316 to 1,299 units according to the care level, the duration of service and the size of service centre
Short-stay services
8 Short-term admission for daily life long-term care (short-stay): 579–921 units per day, according to the care level and the type of service centre
9 Short-term admission for recuperation: 673 to 1,399 per day, according to the care level, the type of room and the type of facility
Other services
10 Daily life long-term care admitted to a specified facility: 533–798, according to the care level, the type of room and type of facility
11 Rental service of equipment for long-term care
B In-home long-term care support
313–1,353 units per month per person, according to the care level and number of persons receiving care support

PROJECT WORKING PAPERS SERIES: LONG-TERM CARE FOR OLDER PERSONS IN ASIA AND THE PACIFIC
26
C Community-based services
1 Regular visiting or on-demand response long-term care: 5,658–29,399 units per month, according to care level and type of service
2 Home-visit at night for long-term care: 981 units per month, 368 units per regular visit and 560 or 754 units per visit by request, according to the type of service
3 Outpatient long-term care for a dementia patient: 270–1,414 units, according to the care level, time required and type of facility
4 Multifunctional long-term care in a small group home: 9,298 –26,849 units per month according to the care level
5 Communal daily long-term care for a dementia patient (group home): 747–880 units per day according to the care level and duration of utilization
6 Daily life long-term care for a person admitted to a community-based specified facility: 533–798 units per day, according to the care level and duration of utilization
7 Admission to a community-based facility for preventive daily long-term care of the older persons covered by public aid: 547–1,022 per day, according to the care level and the type of facility
8 Combined service: 11,119 –31,141 units per month, according to the care level
D Facility services
1 Facility covered by public aid providing long-term care to the elderly: 547–1,022 per day, according to the care level and type of facility
2 Long-term care health facility: 695–1,297 per day, according to the care level, type of facility, type of room and level of criteria
3 Sanatorium Medical Facility for older persons requiring long-term care: 641–1,251 per day, according to the care level and type of room
E Preventive long-term care services
Home-visit services
1 Home-visit service for preventive long-term care (home help service): 1,168–3 704 units per month, according to the care plan
2 Home-visit bathing service for preventive long-term care: 834 units
3 Home-visit nursing service for preventive long-term care: 262–1,117 units, according to the time required and type of service centre
4 Home-visit rehabilitation service for preventive long-term care: 302 units
5 Management and guidance for of in-home medical long-term care: 262–553 units, according to the category of health professional and number of service within a building
Commuting services
6 Outpatient preventive long-term care (day service): 1,647 units for support level 1 and 3,377 units for support level 2 per month
7 Outpatient rehabilitation for preventive long-term care: 1,812 units for support level 1 and 3,715 units for support level 2 per month
Short-stay services
8 Short-term admission for daily preventive long-term care (short-stay): 433–655 units per day, according to the support level and the type of service centre
9 Short-term admission for recuperation for preventive long-term care: 575–817 per day, according to the support level, the type of room and the type of facility
Other services
10 Daily preventive long-term care admitted to a specified facility: 476–790 units, according to the support level, the type of room and type of facility
11 Equipment rental for preventive long-term care
F Preventive long-term care support
414 units per month
G Community-based services for preventive long-term care
1 Preventive long-term care for a dementia outpatient: 251–952 units, according to the support level, time required and type of facility
2 Multifunctional long-term care in a small group home: 3,066–6,877 units per month, according to the support level and type
3 Communal daily long-term care for a dementia patient (group home): 743–783 units per day, according to the type of facility and the duration of utilization
Note: There are various additional fees.Source: Notifications of Ministry of Health, Labour and Welfare.

LONG-TERM CARE FOR OLDER PERSONS IN JAPAN
27
In 2014, the LTCI expenditure totalled 9.3 trillion yen; the biggest share was 4.1 trillion yen, or 44.1 per cent of total expenditure, for in-home services, followed by 3.2 trillion yen, or 34.3 per cent, for facility services. The three categories of preventive services cost 0.5 trillion yen, corresponding to 5.8 per cent of total expenditure (see figure 17).
FIGURE 17. LTCI EXPENDITURE, BY TYPE OF SERVICE, 2014 (IN TRILLION YEN)
Community-based services for preventive
long-term care, 0.010
In-home services, 4.106
Facility services, 3.192
In-home long-term care suppo� , 0.402
Preventive long-term
care services, 0.476
Preventive long-term
care suppo�, 0.055
Community-based services, 1.063
Source: Ministry of Health, Labour and Welfare, “Survey of long-term care benefit expenditures” (Tokyo, 2015).

PROJECT WORKING PAPERS SERIES: LONG-TERM CARE FOR OLDER PERSONS IN ASIA AND THE PACIFIC
28
PROJECT WORKING PAPERS SERIES: LONG-TERM CARE FOR OLDER PERSONS IN ASIA AND THE PACIFIC
4 Health and welfare frameworks for older person care
4.1 Composition of elderly care in the different systems
Even though the LTCI assures the provision of long term care, it is not a single sys-tem to assure the care for the older persons. As we have seen in the previous section, firstly, the welfare system intervened to take care of older persons who were not taken care of by the family and who did not have adequate financial means. Then the health care system emerged and universal health coverage was subsequently achieved. The introduction of the LTCI in 2000 was a solution to reorganize the intertwined complex system of welfare and health systems that provided care of older persons. The change in systems was also in line with changing needs of the population.
At present, in 2012, LTCI expenditure was 8.3 trillion yen, much smaller than the health care expenditure of 22.1 trillion yen, for persons aged 65 years or older. The welfare system still finances older person facilities, such as Yougo or the Moderate-fee Home for the Elderly. The public assistance programme currently covers 832,511 persons, or 2.7 per cent of the older person population, with free medical care as well as cash assistance.3 It also covers the disability programme, which has 3 million older person users (Ministry of Health, Labour and Welfare, 2014).
The complexity of these systems reflects the multidimensional nature of older person care. Each system has its origin and a role in the social security system. Before reforms are under-taken, it is important to study the system in detail to identify areas for improvement and better harmonizing of the different components.
4.2 Health insurance and the late-stage medical care system for older persons
When the LTCI was launched in 2000, some components that had been financed by the health insurance were transferred to the LTCI. For example, the Elderly Health Facility that was covered by the health budget was renamed as Long-term Care Health Facility (but still referred to as Rouken) and financed through the LTCI. The Elderly Hospital, operating since the 1970s, was heavily criticized for its geriatric beds because they were wasting medical resources and making profit only for the hospital owners. Thus, the long-term care beds in the Elderly Hospital were partly transferred to be financed through the LTCI and a smaller reimbursement was granted.
3 Ministry of Health, Labour and Welfare, “National Survey on Public Assistance Recipients” (Tokyo, 2014).

LONG-TERM CARE FOR OLDER PERSONS IN JAPAN
29
In 2008, the Elderly Health System was replaced by the Late-stage Medical Care System for the Elderly by the Act on Assurance of Medical Care for Elderly People. All persons aged 75 or older and persons aged 65–74 who have been certified disabled moved into the system op-erated by the Association of Medical Care Services for Older Senior Citizens, created in every prefecture with all the municipalities as the composing member. The system is financed by 10 per cent co-payment and the half of remaining by national and local governments and the other half by the insurance premium.
4.3 Public assistance for poverty alleviation
The poverty rate of older persons is increasing in Japan. Nearly 3 per cent of the older pop-ulation receives public assistance as a poverty alleviation measure, financed entirely by tax. The public assistance is based on the Public Assistance Act of 1950 but has roots in previous regulations, as mentioned earlier. The public assistance covers basic needs of life, including daily expenses, housing, education, training, medical and long-term care, births and funerals. Most items are paid in cash, but health and long-term care is provided in kind and recipients receive totally free care.
Public assistance is financed to three quarter by national subsidy and to one quarter by prefectural and municipal subsidies. The operation of public assistance is mandated to the Welfare Office, the public office institutionalized by the Act on Social Welfare. There are 1,249 such offices throughout Japan (2012). The case workers assigned to the Welfare Office exam-ine applications in close collaboration with Welfare Volunteers and work to help recipients establish independence so that they would no longer need public assistance.
The average amount of cash payment for all items combined is 141,327 yen per person per month. The proportion of the population of all ages receiving public assistance was 1.6 per cent in 2011, increasing since the late 1990s. This proportion is greater for older persons, and the ageing population is one reason for the increasing number of recipients of public assistance.
The public assistance is the last safety net to protect those in need and thus assures the uni-versality of long-term care in Japan.
4.4 Disability protection measures
At the time LTCI was introduced, there was discussion on whether disability protection measures and disability pension should be integrated into the scheme. Strong opposition from associations of the persons with disabilities, fearing that the welfare measures for persons with disabilities would be restricted and reduced, precluded the inclusion. In principle, old age disability should be covered by the LTCI scheme, but some older persons prefer to receive the disability benefit. As of 2011, 49.3 per cent of physical disability certificate holders were aged 70 years or older. 4
4 Survey on Difficulties in Life (2011) Ministry of Health, Labour and Welfare.

PROJECT WORKING PAPERS SERIES: LONG-TERM CARE FOR OLDER PERSONS IN ASIA AND THE PACIFIC
30
The integration of disability protection measures with health and long-term care insurance is an issue to be reconsidered in the future.
4.5 Care cycle and the integrated community care system
Although the LTCI, health insurance, public assistance and disability protection are separate systems, there should be good coordination among them, given the limited resources. Thus, the integrated community care system was introduced by an amendment to the Long-Term Care Insurance Act and put in place in April 2012. Through this system, older person care is centred at home and health care and long-term care are coordinated by the Integrated Com-munity Care Centre (see figure 18).
FIGURE 18. INTEGRATED COMMUNITY CARE SYSTEM
Source: Ministry of Health, Labour and Welfare.
To receive the appropriate care, older persons move between different types of care facilities (see the annex table for the different types of facilities). There are different routes and dura-tion between home care and the different types of facility. At the Tokuyou, older persons who are dependent but do not require acute medical care are admitted and can stay as long as they need care, without any limitation on the duration. Most patients come from their home or the Rouken and stay, on average, 1,405 days. In 2013, 73 per cent of the patients died there, while 22 per cent moved to a medical facility (hospital) (see figure 19).

LONG-TERM CARE FOR OLDER PERSONS IN JAPAN
31
At the Rouken, the aim is to accommodate older persons recovering from acute illness. The duration of stay is recommended for up to three months; the average stay is 311 days. Of those who checked into the Rouken in 2013, 39 per cent came from a medical facility and 23 per cent from home. 41 per cent of patients moved to a medical facility, while 32 per cent returned home.
At the Sanatorium Medical Facility, older persons who need chronic medical care are admit-ted for up to three months. As of 2013, more than half (55 per cent) of the patients came from another medical facility and stayed an average of 483 days; 41 per cent of them died in the facility and 31 per cent moved to another medical facility (Ministry of Health, Labour and Welfare, 2014).
FIGURE 19. ORIGIN AND DESTINATION OF THOSE WHO LEFT THE LONG-TERM CARE FACILITY, SEPTEMBER 2013
Origin %
› Tokuyou ›
Destination %
Family 28.9 Family 1.8
Tokuyou 2.8 Tokuyou 1.0
Other welfare facility 4.6 Other welfare facility 0.4
Rouken 16.6 Rouken 0.5
Medical facility 12.1 Medical facility 21.6
Other 3.0 Death 72.7
Unknown 32.1 Other 0.9
Unknown 0.9
Total 100.0 Total 100.0
Average days of residence: 1 405.1 days
Origin %
› Rouken ›
Destination %
Family 22.9 Family 31.7
Tokuyou 0.5 Tokuyou 9.3
Other welfare facility 0.5 Other welfare facility 2.4
Rouken 2.7 Rouken 3.6
Medical facility 39.0 Medical facility 40.6
Other 0.8 Death 8.7
Unknown 33.6 Other 2.2
Unknown 1.5
Total 100.0 Total 100.0
Average days of residence: 311.3 days

PROJECT WORKING PAPERS SERIES: LONG-TERM CARE FOR OLDER PERSONS IN ASIA AND THE PACIFIC
32
Origin %
› Sanatorium ›
Destination %
Family 6.5 Family 9.3
Tokuyou 0.8 Tokuyou 5.9
Other welfare facility 0.8 Other welfare facility 1.3
Rouken 3.4 Rouken 8.3
Medical facility 55.4 Medical facility 31.1
Other 0.8 Death 41.4
Unknown 32.2 Other 1.8
Unknown 1.0
Total 100.0 Total 100.0
Average days of residence: 482.7 days
Source: Ministry of Health, Labour and Welfare, “Survey of long-term care benefit expenditures” (Tokyo, 2015).
Older persons who want to stay in the facility until the end of their life prefer to be admitted to the Tokuyou because there is no limitation on the length of stay and the co-payment is considered inexpensive. There is a long waiting list to be admitted to Tokuyou. At the same time, the Government plans to shut down the Sanatorium in March 2018 because it is too expensive to keep operating. The planned replacement facility is the New Rouken, or Long-term Medical Care Facility where older persons will receive care that is more medical than what is now available at the Rouken (though it will be less medical than at the Sanatorium). It will require a higher co-payment than what the Tokuyou charges, but patients can stay until the end of their life. The planned transition, however, is not moving ahead smoothly because the owners of the Sanatorium oppose the New Rouken due to less profit for them.
Older people move between facilities and their home not only because institutional care is costly but because they should primarily stay in their home. The integrated community care system should coordinate these moves between different facilities and the home.
4.6 Fiscal sustainability: Long-term trend of care expenditure for older persons
Care expenditure for older persons has been increasing and part of the reason is of course the ageing population as older persons consume more care resources. In addition, the per capi-ta elderly care expenditure is also increasing. In 1977, for instance, the combined medical, welfare and long-term care expenditure totalled 238,000 yen per older person. It jumped to 807,000 yen per older person in 2012, more than a threefold increase (see figure 20).
The LTCI was introduced to suppress the increase of medical costs, and indeed, the per capita medical costs stabilized from then until 2008. With regards to costs, the introduction of the LTCI can be considered as successful.

LONG-TERM CARE FOR OLDER PERSONS IN JAPAN
33
However, the total expenditure of older person care, including health care, welfare and long-term care, increased from 637,000 yen in 1999 to 695,000 yen in 2000, then 810,000 yen in 2012. The rise is attributed to the nationwide expansion of long term care services. Con-sidering that the so-called baby-boomers will be turning 75 years starting around 2020, the per capita expenditure containment is an urgent task for both the medical and the long-term care system.
FIGURE 20. MEDICAL, WELFARE AND LONG-TERM CARE EXPENDITURE PER OLDER PERSON, 1977–2011
219 25
2 283
310 335
360
374
394
422
444
465
471
489
500
510
525
532
541
541
558
558
558
572
542
544
515
518
520
518
513
513
517
526
537
546
544
145 178
195
208
221
224
219
224
227
238 24
9 25
6 26
3
19 21
22 24
26 28
28 29
29 34
32
33 36
39
42
46
48
52
60 61
64
67
65
8 8 8 8 6 3 2 2 2 2
3 3 3
0
100
200
300
400
500
600
700
800
900
1977 1979 1981 1983 1985 1987 1989 1991 1993 1995 1997 1999 2001 2003 2005 2007 2009 2011
Thou
sand
yen
per
per
son
aged
65
and
over
YearMedical expenditure Long -term care expenditure Welfare expenditure
Note: To obtain the identical time series from 1977, the medical care expenditure is that of medical treatment (exclud-ing dental treatment, food and living care during admission, pharmacy dispensing medical expenditure, judo therapist and acupuncturist treatment), which ranges from 90 per cent in 1977 to 72.1 per cent in 2011 of total medical care expenditure. Welfare expenditure after the 2000 is mostly included in the long-term care expenditure, but there are no data for the welfare expenditure not included in the long-term care expenditure. Long-term care expenditure is that of the primary insured (aged 65 years or older).Source: Medical expenditure: Ministry of Health, Labour and Welfare, “Estimates of national medical care expenditure” (Tokyo 1996, 1998, 2010, 2013); long-term care expenditure: Ministry of Health, Labour and Welfare, Report on Long-term Care Insurance Services (Tokyo 2000-2012); welfare expenditure: National Institute of Population and Social Security Research, “Financial statistics of social security” (Tokyo 2014).

PROJECT WORKING PAPERS SERIES: LONG-TERM CARE FOR OLDER PERSONS IN ASIA AND THE PACIFIC
34
PROJECT WORKING PAPERS SERIES: LONG-TERM CARE FOR OLDER PERSONS IN ASIA AND THE PACIFIC
5 Actors in the long-term care system
5.1 Family
The role of the family in long-term care became part of the debate over devel-opment of LTCI. The debated point revolved around the issue of a family cash allowance, whether to pay cash to family carers through the LTCI. Ishibashi (2001) summarized the debate as involving four positions (see figure 21): There were people who opposed the family cash allowance. Part of them thought that the care for older parents should be a duty of the children, who should not be paid (A in figure 21). Another group opposed the family cash allowance because it would oblige women at home to care for the older persons and that older person care should be socialized (B in figure 21). Those who supported the family cash payment were also divided. The conservative opinion (C in figure 21) insisted that family cash payment should be made to promote the family value, whereas the progressive opinion (D in figure 21) insisted the care work should be properly valued and paid. The opinion B and C had strong opinion leaders and in the end, based on the principle of the socialization of care, the family cash allowance was not included.
FIGURE 21. FRAMEWORK OF DEBATE ON FAMILY CASH ALLOWANCE INTRODUCTION TO LONG-TERM CARE INSURANCE
Positive for family cash allowance
Negative for family cash allowance
Elderly care by family Socialization of elderly care
Money should be paid to promote the traditional family value (C)
It is normal to care for family so no need to get paid (A)
Cash payment will force women to continue the care (B)
Care work should be recognized and paid (D)
Source: Adapted from Kiyoshi Ishibashi, “Insurance for elderly care and the family: The purification of affection”. Departmental Bulletin Paper, vol. 8, 2001, pp. 115–131 (Research Institute of Bukkyo University, in Japanese).
After 15 years in operation, the responsibility as well as obligation of the family has not dis-appeared, nor has the LTCI destroyed the family value. At least, the LTCI has transformed the way family is involved in the care of older persons, although this change has occurred along with other societal transformations.

LONG-TERM CARE FOR OLDER PERSONS IN JAPAN
35
According to the 2013 Comprehensive Survey of Living Conditions, among the older persons who were at home and certified LTCI recipients, 71 per cent were receiving care from their family. Among them, nearly 62 per cent were living with a family member and just under 10 per cent were living separately. Of the 62 per cent family care giver, 26 per cent was a spouse and 33 per cent was a child (see figure 22). Nearly 15 per cent were receiving care from a service provider, up from 9 per cent in 2001. The nearly 6 percentage point increase is attributed to the LTCI expansion and changes in the living arrangement of older persons (Ministry of Health, Labour and Welfare, 2014).
FIGURE 22. MAIN CAREGIVER, BY RELATION TO THE PERSON CARED FOR, 2013 (PER CENT)
Spouse26.2
Child21.8
Parent0.5
Other family1.8
Living together
Familyliving separately9.6
Unknown13.0
Other1.0
Serviceprovider14.8
Child'sspouse11.2
Source: Ministry of Health, Labour and Welfare, “Comprehensive Survey of Living Conditions” (Tokyo, 2014).
Of the family members looking after an older person, 31 per cent were men and nearly 69 per cent were women. Although women remain the majority, this proportion has slowly but steadily been decreasing since 2001 (see figure 23).
FIGURE 23. THE CO-RESIDING CAREGIVER, BY SEX, 2013 (PER CENT)
31.3
30.6
28.1
25.1
23.6
68.7
69.4
71.9
74.9
76.4
0% 10% 20% 30% 40% 50% 60% 70% 80% 90% 100%
2013
2010
2007
2004
2001
Male Female
Source: Ministry of Health, Labour and Welfare, “Comprehensive Survey of Living Conditions” (Tokyo, 2014).

PROJECT WORKING PAPERS SERIES: LONG-TERM CARE FOR OLDER PERSONS IN ASIA AND THE PACIFIC
36
An ageing of caregivers is occurring, with the phenomenon of “the elderly caring for the elder-ly”. In 2013, 69 per cent of the male caregivers and 69 per cent of the female caregivers were aged 60 or older. The proportion of caregivers aged 80 or older was not negligible, at 19 per cent for men and 10 per cent for women. Most probably were taking care of their spouse. The proportion of the older caregiver has been increasing since 2001 (see figure 24). Older persons understand the ageing better than the young people, so they might be fit as caregivers; some apparently enjoy caring for their parent after retirement. However, older persons caring for other older persons worry about their health and many other difficulties.
FIGURE 24. THE CO-RESIDING CAREGIVER, BY AGE GROUP AND BY SEX, 2013 (PER CENT)
2.0
3.2
2.8
4.0
3.8
2.0
2.8
2.5
3.5
4.3
7.6
9.5
6.1
9.6
11.4
8.1
7.8
10.0
13.2
13.1
21.4
22.5
25.4
23.5
19.9
21.4
28.4
31.6
30.0
32.3
27.7
24.7
24.9
25.1
23.7
32.5
31.3
24.3
28.2
26.7
22.6
19.7
22.8
24.7
27.1
25.8
21
23.1
18.0
19.6
18.7
20.5
18.1
13.1
13.6
10.2
8.7
8.4
6.9
3.9
0% 10% 20% 30% 40% 50% 60% 70% 80% 90% 100%
2013
2010
2007
2004
2001
2013
2010
2007
2004
2001
Mal
eFe
mal
e
less than 40 40 - 49 50 - 59 60 - 69 70 - 79 80 and over
Source: Ministry of Health, Labour and Welfare, “Comprehensive Survey of Living Conditions” (Tokyo, 2014).
From the viewpoint of younger generations, care for older persons, especially the care for one’s parents, is becoming more of a necessity because parents are living much longer and because there are fewer siblings. A married woman, for instance, has the greatest likelihood of needing to care for four people when she is in her 50s: her parents and her husband’s parents. In 2013 National Survey on Family, half of the married women respondents aged 50–59 were taking care of at least one parent, 16 per cent were caring for two parents, 4 per cent were caring for three parents and 0.7 per cent were caring for all four parents (see figure 25). After this age group, the proportion taking care of the parents decreases, but by then she needs to care for her husband, who most likely is older.

LONG-TERM CARE FOR OLDER PERSONS IN JAPAN
37
FIGURE 25. NUMBER OF PARENTS NEEDING CARE, BY AGE OF MARRIED WOMEN, 2013 (PER CENT)
87.6
85.2
66.2
48.3
70.7
96.2
10.6
10.8
24.1
30.9
22.9
3.4
1.3
3.4
7.8
16.1
5.4
1.4
4.1
0% 10% 20% 30% 40% 50% 60% 70% 80% 90% 100%
Less than 30
30-39
40-49
50-59
60-69
70 and over
0 1 2 3 4 parents to take care
Source: National Institute of Population and Social Security Research, “The fifth National Survey on Family in Japan” (Tokyo, 2014).,.
Not surprisingly, many people, particularly women, quit their job to care for older family members at home. In the 2013 National Survey on Family, 40 per cent of married women quit their job when they started taking care of an older parent. In 2000, 38,000 people quit their job to provide long-term care and in 2013 that incidence had increased to 93,000 peo-ple, according to the findings from the Survey on Employment Trends (Ministry of Health, Labour and Welfare, 2014).
According to the 2013 National Survey on Family, those married women who continued working even after starting to provide long-term care said that day service and day-care pro-vided through the LTCI were most conducive for them to continue working. Interestingly, these women also point out that the second most helpful condition was understanding from her husband and other family members. Not feeling isolated was an important factor to the family caregiver.
5.2 Care personnel
Thanks to the LTCI, the number of personnel engaged in long-term care has increased dra-matically. There were 6 million long-term care personnel in 2000, which increased more than threefold, to nearly 1.7 million in 2012.5 Together with health personnel, the demand for the long-term care personnel will continue to grow. According to government projections made in 2011, the 4.62 million personnel for health and long-term care at that time needs to increase to 5.33 million in 2015 and 7.22 million in 2025. Most needed will be nurses and care workers (see figure 26).
5 Material 1 of the Sub-committee for Long-Term Care Benefit Expense of Social Security Council attached to the Ministry of Health, Labour and Welfare, held on the 3rd September 2014. Available from www.mhlw.go.jp/file/05-Shin-gikai-12601000-Seisakutoukatsukan-Sanjikanshitsu_Shakaihoshoutantou/0000056770.pdf

PROJECT WORKING PAPERS SERIES: LONG-TERM CARE FOR OLDER PERSONS IN ASIA AND THE PACIFIC
38
FIGURE 26. PROJECTED PERSONNEL DEMAND FOR HEALTH AND LONG-TERM CARE, 2025
0.29 0.31 0.33
1.41 1.59 2.00
1.40 1.69
2.38 0.85
0.93
1.23
0.66
0.81
1.28
0
1
2
3
4
5
6
7
8
2011 2015 2025
in m
illio
n
Year
Other(Care)
Other(Medical)
Careworker
Nurse
Doctor
4.62
5.22
7.22
Source: Pattern 1, reform scenario, 10th Meeting on the Intensive Consultation on the Social Security, 2 June 2011, Cabinet Secretariat, Government of Japan.
Corresponding to the increasing demand, every aspect of human resources development has been studied and measures were implemented. Concerning nurses, the Seventh Prospect of Demand and Supply of the Nurse Workforce was elaborated by the Ministry of Health, Labour and Welfare in 2010. According to the Prospect, the demand for nurses is larger than the supply in every scenario, at least until 2025, and there is a constant need for securing the nurse workforce through training , retention and re-employment.
The curriculum of basic education was reviewed and the regulation of the school for nursing was modified accordingly. For the retention of nurses in the workforce, the Prospect recom-mends better and flexible time management, creation of in-house nursery for the children of the nurses, quality training, working conditions improvement and other measures. For the re-employment, because there are many qualified nurses who are not active in their profes-sion, the Prospect proposes the creation of national and regional “nurse banks” in cooperation with the public employment security office.
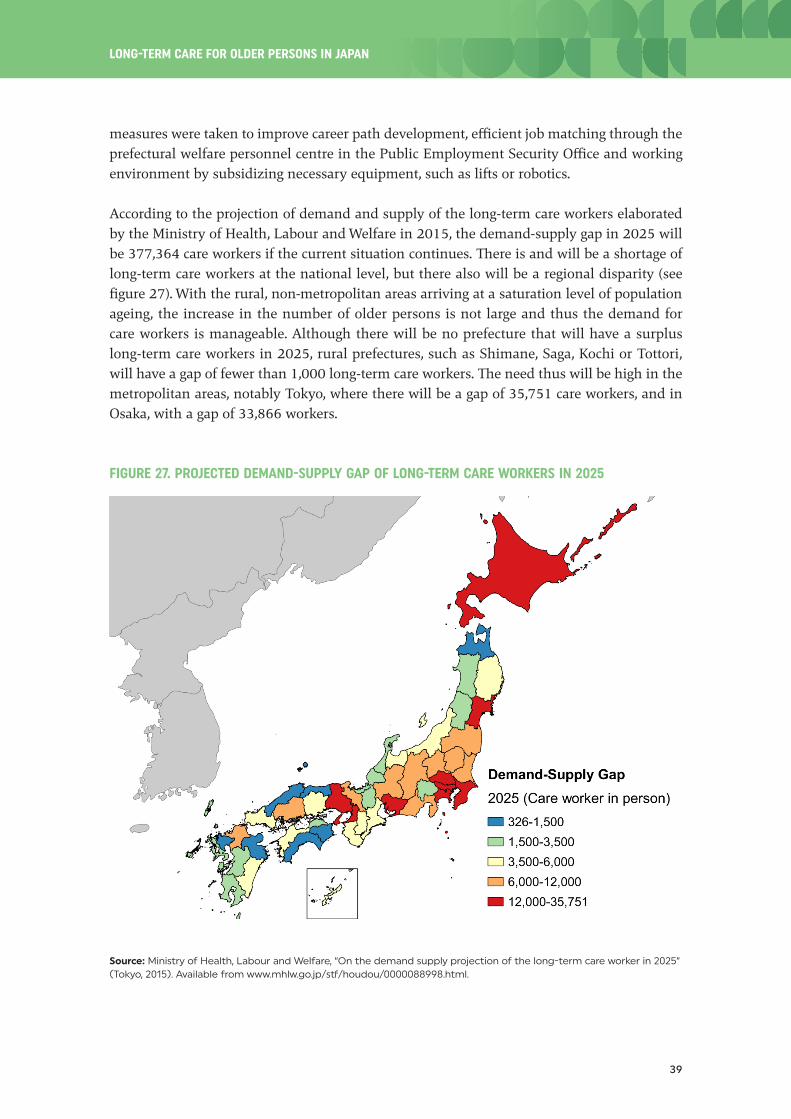
Although the number of long-term care workers is continuously increasing, there is still a chronic shortage of personnel in this sector. To combat the shortage, the newly elected Gov-ernment raised the LTCI service fee by 3 per cent in 2009 as part of working condition im-provements and a subsidy of 400 billion yen was added to increase salaries of care workers, by around 15,000 yen per month. In fact, contrary to the general perception, the salary of the long-term care worker was not low, at least compared with other job categories (Yamada and others, 2009) and due to another political shift, the subsidy was stopped. In 2012, however, an additional fee for care workers was introduced into the LTCI system. In addition, other
LONG-TERM CARE FOR OLDER PERSONS IN JAPAN
39
measures were taken to improve career path development, efficient job matching through the prefectural welfare personnel centre in the Public Employment Security Office and working environment by subsidizing necessary equipment, such as lifts or robotics.
According to the projection of demand and supply of the long-term care workers elaborated by the Ministry of Health, Labour and Welfare in 2015, the demand-supply gap in 2025 will be 377,364 care workers if the current situation continues. There is and will be a shortage of long-term care workers at the national level, but there also will be a regional disparity (see figure 27). With the rural, non-metropolitan areas arriving at a saturation level of population ageing, the increase in the number of older persons is not large and thus the demand for care workers is manageable. Although there will be no prefecture that will have a surplus long-term care workers in 2025, rural prefectures, such as Shimane, Saga, Kochi or Tottori, will have a gap of fewer than 1,000 long-term care workers. The need thus will be high in the metropolitan areas, notably Tokyo, where there will be a gap of 35,751 care workers, and in Osaka, with a gap of 33,866 workers.
FIGURE 27. PROJECTED DEMAND-SUPPLY GAP OF LONG-TERM CARE WORKERS IN 2025
Source: Ministry of Health, Labour and Welfare, “On the demand supply projection of the long-term care worker in 2025” (Tokyo, 2015). Available from www.mhlw.go.jp/stf/houdou/0000088998.html.

PROJECT WORKING PAPERS SERIES: LONG-TERM CARE FOR OLDER PERSONS IN ASIA AND THE PACIFIC
40
To address imbalances in the supply of care workers, some also proposed internal migration of older persons, instead migration of care workers (Japan Policy Council, 2015). The Govern-ment is considering development of a Japanese version of CCRC (Continuing Care Retirement Communities) to promote “Active Ageing”6 and the out-migration of older persons from the Tokyo area.
The importing of foreign care workers has been an issue of debate but so far has not offered a sufficient solution for the shortage of care workers. Within the framework of economic partnership agreements (EPA) with Indonesia, the Philippines and Viet Nam, nurse and care worker candidates were invited to Japan to obtain Japanese professional certification. The EPA procedure is not intended to fill the shortage of labour but to build up international cooperation and networking. Thus, the number of entries has remained small, at 2,377 can-didates for the period of 2008–2014 (see table 4), almost insignificant in terms of the total demand for care workers.
TABLE 4. NUMBER OF ENTRIES UNDER THE ECONOMIC PARTNERSHIP AGREEMENTS WITH INDONESIA, PHILIPPINES AND VIET NAM
Indonesia, Philippines and Viet Nam
Year Nurse candidate Care-worker Total
2008 104 104 208
2009 266 406 672
2010 85 159 244
2011 117 119 236
2012 57 145 202
2013 112 195 307
2014 98 410 508
Total 839 933 2 377
Source: Ministry of Health, Labour and Welfare.
Even when the foreign care-worker candidates pass the exam, they do not gain residence status in Japan. The law to modify the Immigration Control and Refugee Recognition Act to include the status of residence of certified care worker was under Diet deliberations as of August 2015; if it goes through, it will have significant impact. Since 2005, the Japanese certified nurses with residence status and who enrol in university or a specialized school of nursing and pass the national exam are entitled to stay in Japan and work. In 2010, only 75 foreign nurses had achieved all requirements and were working in Japan (Nimonjiya, 2010).
6 Used in the Madrid International Plan of Action on Ageing, active ageing refers to job opportunities for older persons who are fit and want to work, providing lifelong learning opportunities, promoting civil society engagement by older persons and providing facilities for the physical movement of older persons.
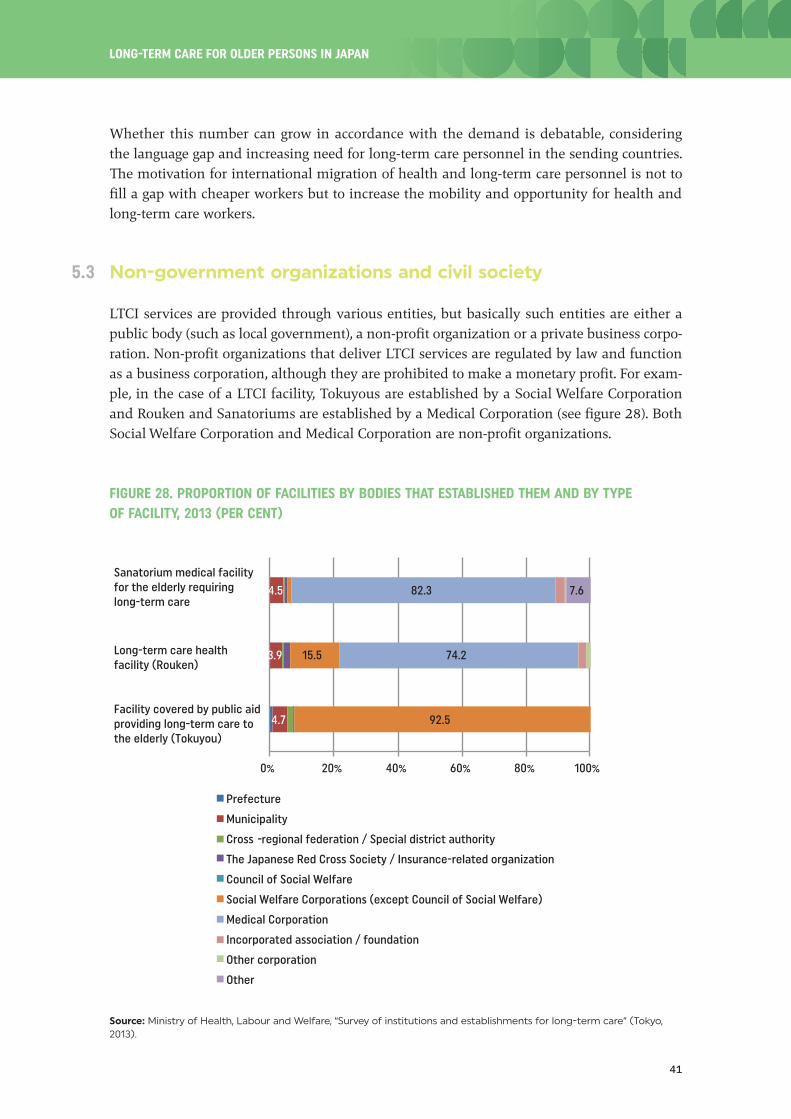
LONG-TERM CARE FOR OLDER PERSONS IN JAPAN
41
Whether this number can grow in accordance with the demand is debatable, considering the language gap and increasing need for long-term care personnel in the sending countries. The motivation for international migration of health and long-term care personnel is not to fill a gap with cheaper workers but to increase the mobility and opportunity for health and long-term care workers.
5.3 Non-government organizations and civil society
LTCI services are provided through various entities, but basically such entities are either a public body (such as local government), a non-profit organization or a private business corpo-ration. Non-profit organizations that deliver LTCI services are regulated by law and function as a business corporation, although they are prohibited to make a monetary profit. For exam-ple, in the case of a LTCI facility, Tokuyous are established by a Social Welfare Corporation and Rouken and Sanatoriums are established by a Medical Corporation (see figure 28). Both Social Welfare Corporation and Medical Corporation are non-profit organizations.
FIGURE 28. PROPORTION OF FACILITIES BY BODIES THAT ESTABLISHED THEM AND BY TYPE OF FACILITY, 2013 (PER CENT)
4.7
3.9
4.5
92.5
15.5 74.2
82.3 7.6
0% 20% 40% 60% 80% 100%
Prefecture
Municipality
Cross -regional federation / Special district authority
The Japanese Red Cross Society / Insurance-related organization
Council of Social Welfare
Social Welfare Corporations (except Council of Social Welfare)
Medical Corporation
Incorporated association / foundation
Other corporation
Other
Sanatorium medical facility for the elderly requiring long-term care
Long-term care health facility (Rouken)
Facility covered by public aid providing long-term care to the elderly (Tokuyou)
Source: Ministry of Health, Labour and Welfare, “Survey of institutions and establishments for long-term care” (Tokyo, 2013).

PROJECT WORKING PAPERS SERIES: LONG-TERM CARE FOR OLDER PERSONS IN ASIA AND THE PACIFIC
42
The Social Welfare Corporation is defined by the Social Welfare Act and its legal framework was created in 1952. Before that, social welfare was delivered through private organizations based on donations. After the Second World War, the GHQ (Supreme Commander for the Al-lied Powers, primarily American occupied forces in Japan) and national advisory organizations recommended that charity-based social work organizations should be more independent to strengthen their public mission. Since then, the number of the Social Welfare Corporations throughout the country has increased, to 19,636 in 2013. The form and organization of these corporations has not changed since 1952, and the introduction of the LTCI, which drastically re-organized the existing older person care facilities, urged reform of the Social Welfare Cor-porations.
The Medical Corporation is the organizational form for a non-profit organization defined by the Medical Care Act, with its legal framework having been created in 1950. There were 49,889 Medical Corporations in 2013; two-thirds of all hospital beds are owned by a Medical Corporation (see figure 28). Most Rouken and Sanatoriums are also run by a Medical Corpora-tion. Similar to the Social Welfare Corporation, Medical Corporations’ legal organization and regulations are now under scrutiny. Although these two corporations have non-profit status, they are allowed to accumulate internal reserves, which can be interpreted as profit. Accord-ing to a survey conducted in 2013, the Tokuyou has, on average, an estimated 300 million yen per facility in reserves.7 The balance of accounts of the Social Welfare Corporation was reported to be largely surplus,8 which suggests high profitability of the facility-based welfare activities. Because the Social Welfare Corporations and Medical Corporations are exempted from tax, information disclosure and regulatory reform should be strengthened further for the better allocation of resources.
The non-profit organization (NPO) was relatively recently legalized through the Act on Pro-motion of Specified Non-profit Activities of 1998. In 2009, there were 2,975 NPOs specializing in long-term care (Hongo, 2011). The share of NPOs as service operators was 5.3 per cent for the home help service, 4.6 per cent for the day service, 8.1 per cent for the combined com-munity-based service (see table 5). The services that are operated by NPOs are also operated by for-profit corporations. The merit of the NPO is that their interest is not entirely oriented to income-generation but also to the social contribution based on voluntarism in offering assistance not included in the LTCI services, such as walking together or room arrangements.
A survey conducted among all long-term care NPOs in Japan in 2011 found that more than half (59 per cent) were willing to create new and needed services and 72 per cent were offer-ing services not covered by the LTCI (Hongo, 2011). The expected role of NPO is to fill the gap in formalized services and need, based on collaboration with a municipality and volunteers in a community.
7 Material 3 of the Sub-committee for Long-Term Care Benefit Expense of Social Security Council attached to the Ministry of Health, Labour and Welfare, 21 May 2013. Available from www.mhlw.go.jp/stf/shingi/2r98520000032jrz-at-t/2r98520000032k1y.pdf
8 Material 1-2 of the 21st Regulatory Reform Council, 27 November 2013. Available from www8.cao.go.jp/kisei-kaikaku/kaigi/meeting/2013/committee2/131127/item1-2.pdf

LONG-TERM CARE FOR OLDER PERSONS IN JAPAN
43
TABLE 5. DISTRIBUTION OF SERVICE OPERATORS BY ESTABLISHMENT BODY, BY TYPE OF SERVICE, 2013 (PER CENT)
Loca
l go
vern
men
t
JRC
Soci
al w
elfa
re
corp
orat
ion
Med
ical
co
rpor
atio
n
Inco
rpor
ated
as
soci
atio
ns
Coop
erat
ive
asso
ciat
ions
For-
prof
it
corp
orat
ion
Non-
prof
it
orga
niza
tion
Othe
r
In-home services
Home-visit service
Home-visit long-term care (home help service) 0.4 … 20.0 6.1 1.2 2.7 64.0 5.3 0.4
Home-visit bathing long-term care 0.5 … 37.3 1.9 0.8 0.5 58.3 0.6 0.0
Home-visit nursing 2.9 2.5 8.0 34.7 11.3 3.1 35.3 1.8 0.4
Commuting service
Outpatient day long-term care (day service) 0.8 … 29.0 6.6 0.7 1.6 56.3 4.6 0.4
Outpatient rehabilitation 3.1 1.4 9.3 76.5 2.9 … 0.0 … 6.8
Other service
Short-term admission for daily life long-term care (short-stay)
2.8 … 81.7 3.8 0.1 0.4 10.6 0.5 0.1
Short-term admission for recuperation 4.1 1.7 11.6 76.9 2.9 … - … 2.8
Daily life long-term care admitted to a specified facility
1.0 … 24.1 4.9 0.6 0.3 67.9 0.5 0.7
Rental service of equipment for long-term care 0.1 … 2.4 1.3 0.3 1.9 93.0 0.6 0.4
Sale of specified equipment for long-term care 0.0 … 1.5 0.9 0.2 1.8 94.6 0.6 0.3
Community-based service
Regular visiting/on-demand response long-term care
- … 28.1 14.9 2.6 2.2 49.6 2.6 -
Home-visit at night for long-term care 0.7 … 28.1 12.9 2.9 0.7 51.8 2.9 -
Outpatient long-term care for a dementia patient
0.5 … 46.7 12.1 1.0 1.5 31.7 6.3 0.2
Multifunctional long-term care in a small group home
0.1 … 31.2 13.1 0.8 1.7 45.8 7.0 0.4
Communal daily long-term care for a dementia patient (group home)
0.1 … 23.8 17.3 0.4 0.5 53.1 4.7 0.2
Daily life long-term care for a person admitted to a community-based specified facility
- … 31.1 13.9 0.8 0.4 51.3 2.5 -
Combined service - … 9.7 32.3 4.8 1.6 43.5 8.1 -
Community-based facility covered by public aid providing long-term care to the elderly
8.8 - 91.2 … … … … … …
Integrated community care support centre 29.0 … 51.9 12.4 3.6 0.9 1.6 0.5 0.1
In-home long-term care support centre 1.0 … 25.9 16.5 2.6 2.6 47.3 3.4 0.5
Note: 1) JRC: The Japanese Red Cross Society and insurance-related organization; 2) incorporated associations and foundations; 3) cooperative association; and 4) non-profit organizations.Source: Ministry of Health, Labour and Welfare, “Survey of institutions and establishments for long-term care” (Tokyo, 2013).

PROJECT WORKING PAPERS SERIES: LONG-TERM CARE FOR OLDER PERSONS IN ASIA AND THE PACIFIC
44
There are other types of civil society organizations involved in the delivery of long-term care, such as the Council of Social Welfare, the Japanese Red Cross Society, cooperative associations, incorporated associations and foundations (see figure 28 and table 5). Each has its unique history and their experiences with social welfare, connection with communities and links with other fields are expected to enrich the long-term care system.
5.4 Government and decentralization
The insurer of the LTCI is the municipal government. The Japanese administrative division is two-tiered, with 47 prefectures and 1,718 municipalities as of April 2014. Decentralization and mergers are the general trend since the inception of the modern administrative division system in 1889, and the most recent municipality mergers took place from 1999 to 2006, when the number of municipalities was reduced from 3,232 to 1,821. The population de-cline has been a persistent trend at the municipality level; the population of small and rural municipalities can be as low as a few thousands and are further decreasing. To keep up the population size needed to carry out basic services, the merging of municipalities has been a necessity. The LTCI has been primary reason to accelerate the mergers to sustain service provision and thus maintain the affordable level of the insurance premium. However, con-tinuing pressure on the financing of the LTCI due to the population ageing and declining has left some municipalities with a large deficit.
The operator of the late-stage medical care system for older persons is the cross-municipality federation (all municipalities within a prefecture form a federation). Likewise, a counter-de-centralization effort to give control of operations from the municipal government to the prefectural administration has been discussed for the National Health Insurance scheme, and there might be a need to consider a similar shift for the LTCI.
The larger the municipality becomes the larger the area the municipality needs to cover. There are municipalities that cover more than 1,000 sq km, and the burden of supervision is inten-sifying. In sparsely inhabited areas, which will be increasingly sparse due to the population decline, providing emergency, acute and long-term care is another challenge.
5.5 Private sector
Although medical care is strictly limited to public hospitals or the non-profit Medical Corpo-ration, long-term care under the LTCI can be delivered by both public and private providers. The private sector is active in such service provision as home visits, group homes for persons with dementia or renting equipment. The proportion of for-profit private corporations among all service providers has increased in recent years (see figure 29).

LONG-TERM CARE FOR OLDER PERSONS IN JAPAN
45
FIGURE 29. THE CHANGE OF THE PROPORTION OF SERVICE OPERATORS OF IN-HOME LONG-TERM CARE SUPPORT, BY ESTABLISHMENT (PER CENT)
1
1
1
1
2
25.9
26.7
29.4
29.8
29.9
16.5
17.0
18.6
19.0
19.4
3
3
3
3
3
3
3
3
3
3
47.3
45.6
40.6
39.4
38.7
3
4
4
4
4
0% 20% 40% 60% 80% 100%
2013
2012
2011
2010
2009
Local government
Social Welfare Corporations
Medical Corporation
Incorporated association / foundation
Cooperation association
For-profit corporation
Non-profit organization
Other
Source: Ministry of Health, Labour and Welfare, “Survey of institutions and establishments for long-term care” (Tokyo, 2013).
The Government is promoting public-private partnerships to expand the number of long-term care facilities. In addition to the traditional long-term care facilities operated by non-profit entities, such as the Tokuyou or Rouken, the fee-based homes, the group homes for elderly with dementia as well as the Elderly Housing with Care Service (Sakouju9) operated by the private companies are now increasing in number (see figure 30). In the fee-based home for older persons, both housing and care provision are operated by a single operator and a rather high residential fee is required to be admitted.
When patients become very ill and require acute, medical service from a hospital, the fee-based home for older persons can no longer accommodate them and they must leave, without any refund of the residential fee. If a private operator goes bankrupt, the residential fee is not refunded either. During the time of the global economic crisis of around 2008, a number of fee-based homes for older persons went bankrupt. A more secure business model, backed by legal protection, was needed, which is why the Sakouju emerged in 2011. The Sakouju offers a contract similar to an apartment rental, with a separate contract for service provision; hence, there is no need to pay a costly admittance fee. The service provision is arranged through the LTCI, according to the need certification system. Users are not obliged to move out when they become seriously ill, and it is easier to move from one place to another than in a regular apartment. The number of Sakouju has increased dramatically, from 994 units in November 2011 to 182,865 units in July 2015.10
9 Japanese colloquial abbreviation.
10 Federation of Housing & Community Center Website, www.satsuki-jutaku.jp/system.html.

PROJECT WORKING PAPERS SERIES: LONG-TERM CARE FOR OLDER PERSONS IN ASIA AND THE PACIFIC
46
FIGURE 30. THE ADMISSION CAPACITIES OF LONG-TERM CARE FACILITY, BY TYPE
0
100
200
300
400
500
600
2000 2001 2002 2003 2004 2005 2006 2007 2008 2009 2010 2011 2012
Adm
issi
on c
apac
ity
in 1
,000
per
sons
Facility covered by public aid Long-term care health facility (Rouken)
Fee-based home for elderly Group home for the elderly with dementia
Moderate-fee home for the elderly Sanatorium medical facility for
Care facility for the elderly Elderly housing with care service (Sakouju)
the elderly requiring long-term care
providing long-term care to the elderly (Tokuyou)
Source: Ministry of Health, Labour and Welfare, Material 2 submitted to the Council on Social Security, 48th subcommit-tee of long term care insurance (Tokyo, 18 September 2013).,
Under the universal health coverage policy, the introduction of the private sector in the field of medical care was largely restricted in Japan. One of the reasons for the LTCI was to incorporate the private sector into the health and long-term care system. Even though the introduction of the LTCI created additional jobs (Fukao 2011) and though the social welfare and long-term care sector held the highest value-added rate among all industries in 2012 (Statistics Bureau, 2014), the LTCI’s contribution to economic growth remains a question. The LTCI’s dependency on governmental subsidy undoubtedly has increased the Government’s budget deficit. However, the LTCI’s contribution to job creation should be evaluated positively.
LONG-TERM CARE FOR OLDER PERSONS IN JAPAN
47
LONG-TERM CARE FOR OLDER PERSONS IN JAPAN
6 Conclusions
The ageing of Japan’s population has been the fastest in the world, and it will continue until it reaches its saturation point, around 2060. Both life expectancy and healthy life expectancy are increasing, but so too is need for care. People are living longer while having some form of health problem or care need. As in the Chinese and Japanese proverb, “One disease in good health” (Ichibyo sokusai), or even “Multiple diseases in good health” will be the norm of society. Having one or several diseases will make people realize the need to promote healthy lifestyles.
In conjunction with the ageing of the population, the older persons welfare and care system was developed and transformed. Social welfare of older person care started at the beginning of the twentieth century. When care demand and supply expanded, the introduction of the LTCI in the twenty-first century set a new basis for a reorganization of the system. Thus far, the demand for long-term care continues to increase, as does expenditure.
Public-private partnership has become an important aspect of the LTCI scheme but it remains partial. Re-organizing the services so far carried in not-so-transparent fashion is necessary and important. These reforms concern the Yougo, long-term medical care bed, semi-public non-profit Social Security Corporation, the disability protection measures for older persons and so forth. For the provision of long-term care services, further innovation will be needed, such as information technology, including the “MyNumber” personal identification system and the expanded use of robotics.
The integrated community care system locates the home of older persons at the centre of the care cycle. But the role of the hospital for acute conditions will not change, and mobility will be an important issue. Also, the definition of “home” is being stretched to include older person housing with care service and group homes for older persons.
Family care will never lose its importance; the majority of primary caregivers are family members, living together or not. The main caregivers are women, but the proportion of male caregivers is increasing. The caregivers are becoming older, who tend to quit their job to care for an older person. There is a need to support family caregivers of older persons within the framework of family policies.
One of the notable impacts of the LTCI scheme on the national economy has been the cre-ation of employment, although the demand is scarcely satisfied by the supply, and the gap continues to widen. In addition to improving the education of care personnel and enhancing their work conditions, the use of foreign care workers could be an option. However, some of the potential countries of origin of care workers are ageing themselves and may face similar shortages in a near future.

PROJECT WORKING PAPERS SERIES: LONG-TERM CARE FOR OLDER PERSONS IN ASIA AND THE PACIFIC
48
The LTCI introduction in Japan rationalized and integrated the social welfare and health system, which had been developed and operated separately. The LTCI had succeeded in so-cializing older person care to a certain degree. For countries facing a similar rapid ageing of its population, the case of Japan suggests there is good reason to carefully review the existing need and properly institutionalize the provision of long-term care.
With the increasing cost of the LTCI scheme along with the increasing number of older per-sons, there is a constant need to reform and seek efficiency in the provision of care. The collection of the LTCI premium and co-payment system should be improved using the newly created national ID number or other innovations in administration. Until 2025 when the number of older-old persons will increase, there will be a need to expand the care workforce and infrastructure, such as facilities and housing.
In the 15 years since the LTCI was introduced, care provision has diversified and improved; obsolete schemes have been replaced and, most importantly, people are living longer in good health. For Japan, the LTCI was a necessity, but there is a continuous need to reform the scheme for the health and welfare for all.

LONG-TERM CARE FOR OLDER PERSONS IN JAPAN
49
LONG-TERM CARE FOR OLDER PERSONS IN JAPAN
References
Fukao, Kyoji, and Kwon Hyeog Ug (2011). Sources of future economic growth in Japan: An empirical analysis based on mi-cro-data. RIETI Discussion Paper Series, 11-J-045, in Japanese with English abstract. Available from www.rieti.go.jp/jp/publica-tions/dp/11j045.pdf.
Hayashi, Reiko (2015). Examination of bed-ridden rate and the evolution of healthy life expectancy: The trend in Japan since 1970s. Research Report 57, pp. 43-59. Project on Demographic research on longevity extension, population ageing, and their effects on the social security and socioeconomic structures in Japan, National Institute of Population and Social Security Research, in Japanese.
Hongo, H. and others (2011). The situation of long-term care NPO and challenges for the service development beyond scheme. Bulletin of Faculty of Integrated Human Studies and Social Sciences, Fukuoka Prefectural University, vol. 19, No. 2, pp. 1-18, in Japanese. Available from www.fukuoka-pu.ac.jp/kiyou/kiyo19_2/1902_hongo.pdf.
Ishibashi, Kiyoshi (2001). Insurance for elderly care and the family: The purification of affection. Departmental Bulletin Paper, vol. 8, pp. 115–131 (Research Institute of Bukkyo University, in Japanese). Available from http://archives.bukkyo-u.ac.jp/rp-contents/SK/0008/SK00080L115.pdf.
Japan Policy Council (2015). Tokyo area ageing crisis avoidance strategy. Available from www.policycouncil.jp/.
Kawagoe, Masahiro, and Ken Miura (2008). Elderly housing and care policy in Japan. The Review of Comparative Social Security Research (Kaigai Shakai Hosho Kenkyu), Autumn, 2008 No.164, in Japanese. Available from www.ipss.go.jp/syoushika/bunken/data/pdf/18879302.pdf.
Kinsella, Kevin, and Wan He (2009). An Aging World: 2008, U.S. Census Bureau, International Population Reports, P95/09-1.
Kousei, Mondai Kenkyukai (1988). Kouseshou 50 nen shi (50 years history of Ministry of Health and Welfare). Tokyo, Chuohoki Publishing, 1988, in Japanese.
Ministry of Health, Labour and Welfare, “Comprehensive Survey of Living Conditions” (Tokyo, multiple years).
Nimonjiya, Osamu (2010) Tozasareta Kiseikanwa Presentation made at Healthcare Solution symposium, Aoyama Gakuin University, in Japanese. Available from www.ahp-net.org/data/HCS_sympo_05.pdf.
Salomon, Joshua A., and others (2012). Healthy life expectancy for 187 countries, 1990—2010: A systematic analysis for the Global Burden Disease Study 2010. The Lancet, vol. 380, No. 9859, pp. 2144–2162.
Shirase, Yumika (2014). Welfare for the elderly. Social Security in Japan 2014, National Institute of Population and Social Secu-rity Research. Available from www.ipss.go.jp/s-info/e/ssj2014/.
Statistics Bureau, Ministry of Internal Affairs and Communications (2014). Inter-industry comparison using the economic census and management indicator. Statistics Topics, No. 73, in Japanese, www.stat.go.jp/data/e-census/topics/topi73/pdf/topics73.pdf.
Yamada, Atsuhiro, and Kayoko Ishii (2009). Determinants of wages and intentions of quitting for long-term care workers: an inter-industry analysis. The Quarterly of Social Security Research (Kikan Shakai Hosho Kenkyu), vol. 45, No. 3, in Japanese. Available from www.ipss.go.jp/syoushika/bunken/data/pdf/19176303.pdf.
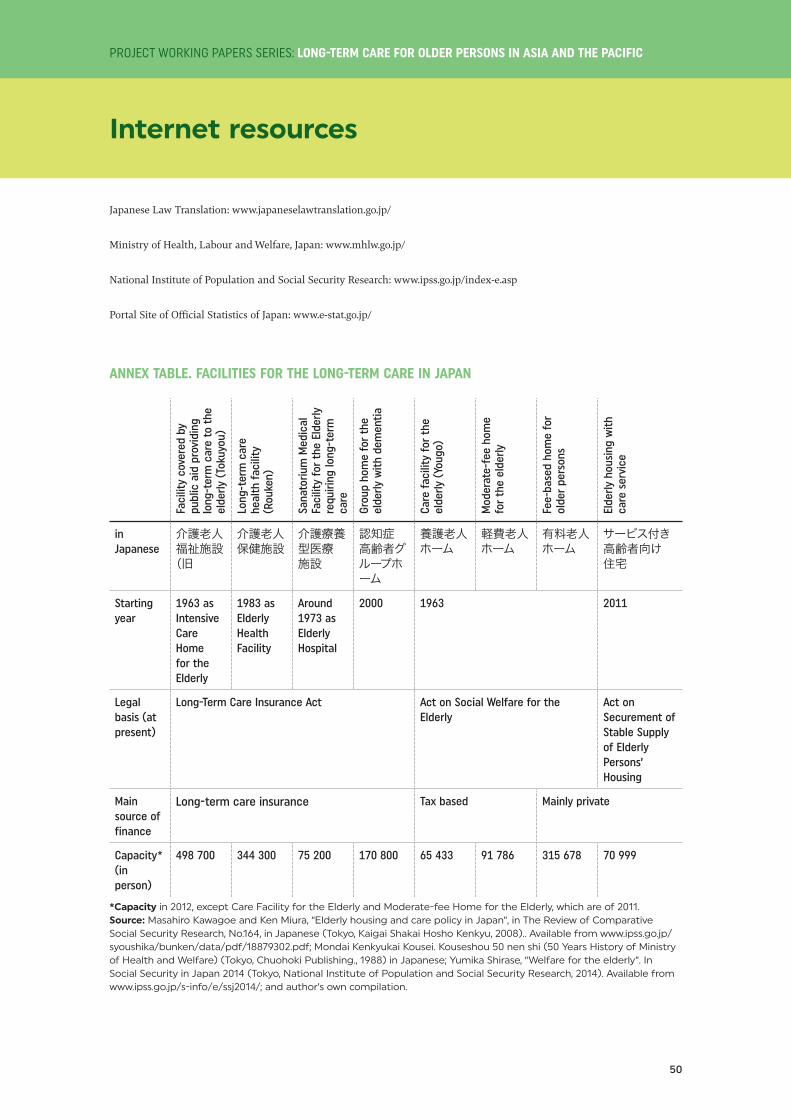
PROJECT WORKING PAPERS SERIES: LONG-TERM CARE FOR OLDER PERSONS IN ASIA AND THE PACIFIC
50
PROJECT WORKING PAPERS SERIES: LONG-TERM CARE FOR OLDER PERSONS IN ASIA AND THE PACIFIC
Internet resources
Japanese Law Translation: www.japaneselawtranslation.go.jp/
Ministry of Health, Labour and Welfare, Japan: www.mhlw.go.jp/
National Institute of Population and Social Security Research: www.ipss.go.jp/index-e.asp
Portal Site of Official Statistics of Japan: www.e-stat.go.jp/
ANNEX TABLE. FACILITIES FOR THE LONG-TERM CARE IN JAPAN
Faci
lity
cove
red
by
publ
ic a
id p
rovi
ding
lo
ng-t
erm
car
e to
the
el
derly
(To
kuyo
u)
Long
-ter
m c
are
heal
th f
acili
ty
(Rou
ken)
Sana
toriu
m M
edic
al
Faci
lity
for
the
Elde
rly
requ
iring
long
-ter
m
care
Grou
p ho
me
for
the
elde
rly w
ith d
emen
tia
Care
fac
ility
for
the
el
derly
(Yo
ugo)
Mod
erat
e-fe
e ho
me
for
the
elde
rly
Fee-
base
d ho
me
for
olde
r pe
rson
s
Elde
rly h
ousi
ng w
ith
care
ser
vice
in Japanese
介護老人福祉施設(旧
介護老人保健施設
介護療養型医療施設
認知症高齢者グループホーム
養護老人ホーム
軽費老人ホーム
有料老人ホーム
サービス付き高齢者向け住宅
Starting year
1963 as Intensive Care Home for the Elderly
1983 as Elderly Health Facility
Around 1973 as Elderly Hospital
2000 1963 2011
Legal basis (at present)
Long-Term Care Insurance Act Act on Social Welfare for the Elderly
Act on Securement of Stable Supply of Elderly Persons’ Housing
Main source of finance
Long-term care insurance Tax based Mainly private
Capacity* (in person)
498 700 344 300 75 200 170 800 65 433 91 786 315 678 70 999
*Capacity in 2012, except Care Facility for the Elderly and Moderate-fee Home for the Elderly, which are of 2011.Source: Masahiro Kawagoe and Ken Miura, “Elderly housing and care policy in Japan”, in The Review of Comparative Social Security Research, No.164, in Japanese (Tokyo, Kaigai Shakai Hosho Kenkyu, 2008).. Available from www.ipss.go.jp/syoushika/bunken/data/pdf/18879302.pdf; Mondai Kenkyukai Kousei. Kouseshou 50 nen shi (50 Years History of Ministry of Health and Welfare) (Tokyo, Chuohoki Publishing., 1988) in Japanese; Yumika Shirase, “Welfare for the elderly”. In Social Security in Japan 2014 (Tokyo, National Institute of Population and Social Security Research, 2014). Available from www.ipss.go.jp/s-info/e/ssj2014/; and author’s own compilation.

